
Submitted:
03 June 2024
Posted:
04 June 2024
You are already at the latest version
Abstract
Objective. To test the hypothesis that a session of unilateral tSMS over the dominant primary motor cortex (M1) in healthy subjects produces a transient decrease in manual dexterity. Methods. A triple-blinded randomized control trial was conducted in 40 healthy participants who were allocated to real- or sham-tSMS group. Each participant underwent one session of tSMS and were assessed before, immediately after, 15 minutes, and 40 minutes after stimulation. Outcome measures were Finger Tapping Test (FTT), 5-seconds FTT, nine Hole Peg Test, and the hand grip assessment. Results: Significant differences were found between groups 15 minutes after stimulation in favor of the tSMS group in the FTT (2.2 ± 0.99; CI= .18-4.22; d= .84p=.034), and 5-second FTT (4.2 ± 1.98; CI= .199-8.2, d= .68; p=.04). In the intragroup analysis, a significantly lower number of taps 15 minutes after stimulation was observed in sham group (3.3 ± 1.01; CI= .47-6.13; d= .42; p=.015), but not in the real stimulation group. Conclusion: A unilateral session of tSMS in the M1 of the dominant hemisphere of healthy individuals does not reduce manual dexterity or grip strength. This technique could have benefits on the motor performance of the arm contralateral to the stimulated motor cortex
Keywords:
Manual Dexterity
; Motor Cortex
; Non-Invasive Brain Stimulation (NIBS)
; Transcranial Static Magnetic Field Stimulation (tSMS)
1. Introduction
Transcranial static magnetic field stimulation (tSMS) is a novel brain stimulation technique that has been shown to be safe and effective in modifying biological parameters when applied to the cerebral cortex. Its application decreases cortical excitability, regardless of the polarity of the magnetic field, reducing the amplitude of motor evoked potentials (MEP), which are maintained for at least 30 minutes after 30-minute applications [1,2]. Despite having demonstrated neurophysiological effects in previous studies, the effects of tSMS application on manual dexterity and force production have not yet been clearly established [3]. There are two previous studies in this regard, which applied a single session of bihemispheric tSMS in healthy subjects for 30 minutes on both M1; Nakagawa et al. [4] observed an alteration in the performance of bimanual ballistic movements, and Pineda Pardo et al. [5] observed a decrease in motor response time to a stimulus.
Different non-invasive brain stimulation (NIBS) techniques have been proposed for the treatment of movement disorders in neurological pathology, such as repetitive transcranial magnetic stimulation (rTMS), or transcranial direct current stimulation (tDCS), especially in stroke [6]. These NIBS have demonstrated effectiveness in various models of approach, stimulating the affected cerebral hemisphere after stroke, or inhibiting the healthy hemisphere, according to the interhemispheric inhibition model [7,8]. This model is based on unilateral inhibition of the healthy hemisphere, which would reduce the interhemispheric inhibition exerted on the affected hemisphere and allow an indirect increase in the cortical activity of the affected hemisphere.
According to this model, Shibata et al. [9], and Takamatsu et al. [10], applied tSMS in a single magnet model on the motor cortex of a single hemisphere. In these studies, tSMS produces a decrease in the amplitude of MEPs in the cortex located under the area of the magnet and increases the MEPs of the cortex contralateral to the stimulated one. These authors also observed a decrease in the inhibition exerted by the stimulated hemisphere on the non-stimulated hemisphere [10].
In line with the findings of these recent studies tSMS is presented as a potentially useful tool in the management of interhemispheric inhibition whereby reducing the excitability of the healthy cerebral hemisphere would produce an increase in the activity of the injured cerebral hemisphere [9,10,11,12]. The present study aims to evaluate changes in manual dexterity and force production after unilateral application of a tSMS session over the dominant primary motor cortex (M1). It is hypothesized that the application of tSMS will momentarily decrease the parameters of manual dexterity and strength in the upper limb contralateral to the stimulated cortex, without changes in the strength and dexterity of the unstimulated hemibody.
2. Methods
2.1. Study Design
The study was conducted with a triple-blind, parallel, placebo-controlled design to ensure that neither the subjects nor the investigators were aware of the stimulation condition. The study was conducted in accordance with the 64ª Declaration of Helsinki (revised version 2013, Fortaleza, Brazil) and approved by the local ethics committee (Rey Juan Carlos University; 2403202113221). The study was registered on ClinicalTrials.gov (NCT05260190). No substantial changes in methods were made after the start of the trial. Screening started in September 2021 and the last patient exit occurred in June 2022. The study was conducted in accordance with the CONSORT statement for randomized clinical trials.
2.2. Participants
Written informed consent was obtained before all procedures. Participants were recruited from the Rey Juan Carlos University (Madrid, Spain). Inclusion criteria were as follows: (i) age between 18 and 60 years; (ii) absence of cognitive impairment (Mini-Mental State Examination score ≥ 25) (iii) adequate comprehension of verbal and written information, sufficient to complete the tests. Exclusion criteria were as follows: (i) presence of metallic implants (e.g., neurostimulator, pacemaker, cochlear implant, or metallic elements in the head or around the eyes); (ii) diagnosis of epilepsy or being under treatment with antiepileptic drugs; (iii) diagnosis of unstable cardiovascular disease; (iv) diagnosis of any disease or condition that may interfere with this study; (v) use of drugs that may influence with neuromuscular function in the last two weeks (narcotic analgesics or muscle relaxants).
2.3. Interventions
All experimental procedures were conducted at the Motion Analysis, Biomechanics, Ergonomics, and Control Laboratory (LAMBECOM) at Rey Juan Carlos University, Spain. Participants made one visit to the laboratory. Participants made one visit to the laboratory. Each session lasted 90 min. After clinical data collection, the 30 minutes tSMS intervention was administered in a comfortable seated position in a fixed chair. During the protocol, participants were to avoid using their hands for manual tasks, leaving them relaxed on the armrest of the chair. Each participant was included in one of two groups: real stimulation group (tSMS group), or the sham stimulation group (sham group). In both groups, the real magnet or the sham magnet were placed over the M1 of the dominant cerebral hemisphere.
tSMS group: The material used in the stimulation was a MAGxx1.1 helmet (Neurek Spain, Toledo), with a neodymium (NdFeB) magnet (60 mm diameter and 30 mm height) with a nickel (Ni-Cu-Ni) coating (MAG60r+; Neurek Spain, Toledo) (Figure 1).
Sham group: The material used was a sham stimulation helmet with the same characteristics as the real stimulation helmet, with a metal without electromagnetic properties. The weight, shape and colour made it indistinguishable from the real helmet.
2.4. Outcome Measures
Outcome measures were assessed before stimulation (T0), at the end of stimulation (T1), 15 minutes after stimulation (T2), and 40 minutes after intervention (T3) by an investigator blinded to the treatment received. The investigator who assessed the outcomes was blinded to the participant assignment. The Finger Tapping Test (FTT) was performed for assessment of manual motor skills. This test has been used for many years in the neuropsychological assessment of brain damage, being an indicator of cortical activity [13], as well as being used in NIBS studies as a measure of manual dexterity [14]. The Tapping Pro version 1.0.8.1 mobile application was used to perform this test, as it provided, in addition to the number of taps per unit of time, graphs that allowed obtaining the explosive velocity (number of taps in the first 5 seconds). Regarding the FTT, the following parameters were analyzed: 10-second test, as the standardized FTT test, and the 5-second test, following the protocol of Gorin et al. [15], to assess if the time of motor response to a stimulus, in this case auditory ("start") is modified by the stimulation, according to the study of Pineda Pardo et al.
The nine-hole peg (9HPT) test was used to assess finger dexterity; this tool has been used in the assessment of motor activity in a multitude of pathologies, with adequate to excellent inter-rater reliability (r = 0.68 to 0.99) and excellent inter-rater reliability (r = 0.75 to 0.99) in healthy adults [16]. Grip strength was evaluated with a hand-held dynamometer (Jamar Plus+; Sammons Preston, Rolyon, Bolingbrook, IL). Greater hand grip strength corresponds with greater activation in M1, premotor area (PMA), and supplementary motor area (SMA) in the dominant hemisphere, and of the SMA in the nondominant hemisphere, and may provide information about the functionality of the human brain [17].
Specific clinical testing procedures were applied to reduce procedural and interviewer test bias (Table 1).
2.5. Sample Size
The sample size was estimated with G-Power 3.1 software using the following parameters: mean effect size of 0.25, alpha error of 0.05, statistical power of 0.95, 2 groups and 4 measures. Based on these data and expecting a loss rate of 10%, a sample size of 40 participants was estimated for the study. We did not find previous studies with similar characteristics that calculated the sample size or indicated the effect size for the variables chosen, so a small effect size (0.25) was chosen [18].
2.6. Randomization and Blinding
A randomization sequence was entered blindly into sequentially numbered opaque envelopes, which were subsequently sealed and kept in a locked drawer. After enrolment of a patient, an envelope was opened according to the numbered sequence by an investigator not involved in the treatment, which prepared the devices to maintain the blinding of the therapist. All participants underwent one tSMS sessions (real or sham). Neither the investigator performing the intervention, nor the participant knew which intervention corresponded to each group. The data were analyzed by another researcher who was not involved in the assignment and intervention.
We assessed for eligibility 44 healthy subjects, finally, 40 healthy subjects were enrolled; 20 were allocated to real tSMS group (6 males, 14 females; 19 right-hand dominant, 1 left-hand dominant) and 20 to sham-tSMS group (10 males, 10 females; 20 right-hand dominant). The flow diagram of the study according to the CONSORT2010 guidelines is reported in Figure 2.
2.7. Statistical Analysis
The statistical analysis was performed using the SPSS statistical software system (SPSS Inc., Chicago, IL; version 25.0). The Shapiro-Wilk test was used to screen all data for normality of distribution. The demographic and baseline clinical data were compared between the two groups to identify any possible difference. Unpaired t-test for parametric data were used, and a p value < .05 was considered statistically significant. A repeated-measures analysis of variance (ANOVA) analysis (within-group factor: TIME (T0, T1, T2, and T3); between-group factor: TREATMENT (real or sham)) was conducted to detect main effects for treatment and time. The effect size was calculated using the Cohen’s d. An effect size of d = .2 was considered small, .5 medium, and .8 large (Cohen, 2013).
3. Results
3.1. Baseline Characteristics
3.2. Exploratory Efficacy
The intragroup results for the dominant side are shown in Table 3 and for the non-dominant side in Table 4. The intergroup results for the dominant side are shown in Table 5 and for the non-dominant side in Table 6.
3.2.1. Finger Tapping Test
When comparing the number of taps in 10 seconds, on the dominant side no significant intragroup differences were found with respect to time x stimulation except at T0 vs T1 in the sham group, in which a significant reduction in the number of taps was observed (3.3 ± 1.01; CI= .47-6.13; d= .42; p=.015. When comparing between groups, significant differences were found in favor of the experimental group at T2 (4.2 ± 1.98; CI= .199-8.2, d= .68; p=.04) (Figure 3a). No significant differences were found on the non-dominant side either intra- or inter-group (Figure 3b).
When comparing the number of taps in 5 seconds, on the dominant side, no significant intra-group differences were found with respect to time x stimulation. When comparing between groups, significant differences were found in favor of the experimental group at T1 (2.2 ± 0.99; CI= .18-4.22; d= .84p=.034) (Figure 3c). No significant differences were found on the non-dominant side either intra- or inter-group (Figure 3d).
3.2.2. Nine Hole Peg Test
When execution speed was compared in the 9HPT, no significant differences were found in either hemibody, either intra- or inter-group.
3.2.3. Hand Grip Strength
When the hand grip strength was compared, no significant differences were found in either hemibody, either intra- or inter-group.
4. Discussion
The results of the present study showed that, immediately after unilateral application of tSMS on the dominant M1 of healthy subjects, manual dexterity is reduced in several of the outcome measures assessed, with no differences between groups. However, 15 minutes after stimulation, the real stimulation group had higher tapping values compared to the sham group. Therefore, the results of the study do not conform to the hypothesis of the study.
The study design was produced according to the hypothesis that the unilateral application of tSMS on the M1 of the dominant hemisphere of healthy people would momentarily decrease the manual dexterity of the dominant hemisphere and could increase the manual dexterity of the non-dominant hemisphere. This fact corresponds to the neurophysiological findings of the studies by Shibata et al. [9] and Takamatsu et al., [10] changes in MEP amplitude can assess changes in the state of excitability in the cortico-spinal system [19]. In both studies, tSMS produced a decrease in MEP amplitude of the dominant motor cortex over which the magnet was placed, and a increase in MEP amplitude of the non-dominant motor cortex over which the magnet was not placed. In 2023, Shimomura et al. [9] cross-applied 10 sessions of 20 minutes of tSMS over the contralateral M1 combined with rehabilitation in 20 stroke patients, compared to the application of sham tSMS plus rehabilitation. These authors observed that tSMS applied on the contralesional M1 combined with rehabilitation significantly improved manual dexterity. These authors did observe interhemispheric inhibition theory, in line with the hypothesis of the present study.
The results of this study show that despite the proven reduction in MEP amplitude, motor function following unilateral dominant M1 stimulation does not reduce hand function to a greater extent than sham stimulation. The cortical inhibition observed as a decrease in MEP may not be related to a decrease in motor function for several reasons: MEPs assessed by transcranial magnetic stimulation assess presynaptic and postsynaptic inputs from corticospinal neurons, which may not be the same as those activated by voluntary motor commands, making it difficult to establish a direct relationship between both [20]; changes in MEP amplitude may be caused by physiological processes external to M1, but which produce a change in its activity, such as decision making and other cognitive processes transmitted to M1, so that MEP not only reflect the excitability of the control elements of the motor pathway, but also relate to upstream processes that are not necessarily related to movement production [21]; MEP may be quantitative physiological markers of change but may have no causal relevance to actual motor behavior [20].
The significant improvement observed in the results 15 minutes after stimulation could be related to the fact that the changes produced by tSMS are not only at the MEP level, but that tSMS produces an increase in alpha power [1,2,21], and could decrease glutamatergic excitatory processes (driving the decrease in MEP amplitude), as well as decrease phasic GABAergic inhibitory processes (driving the decrease in short intracortical inhibition intervals (SICI) and increase in short intracortical facilitation intervals (SICF). The tSMS is the only NIBS that produces these effects, which could be related to the possibility that, despite its inhibitory character, it does not produce alterations in motor learning [2]. In fact, there is evidence that the synaptic plasticity produced in motor learning depends on long-term potentiation and/or long-term depression changes, processes mediated by glutamatergic synapses (Nojima et al., 2015). In this sense, NIBS have been used to try to recreate these phenomena, and tSMS can interfere in these processes by inhibitory modulation of glutamatergic and GABAergic synapses [2]. Learning processes require a bidirectional modification of synaptic weights, in which both synaptic potentiation and synaptic input depression processes are necessary [23,24], so that the inhibitory character of tSMS could increase LTP and thus consolidate further learning, which could be in line with the results of the present study.
The significant difference observed between groups at T2 (significant increase in FTT 15 minutes after stimulation in favor of the tSMS group compared to the sham group) should be taken with caution, since both groups tended to increase the number of taps at T2 (Figure 3), and no significant differences were observed between groups in the rest of the tests. A possible explanation for the improvement in tapping performance could be shown in the studies of Lacroix et al. [25] and Nojima et al. [26]. Lacroix et al. [25] found that tSMS appears to worsen online learning, when tSMS is applied to the contralateral hemisphere to the test execution hand, and Nojima et al. [26] found that tSMS over M1 but not over the dorsolateral prefrontal cortex, enhanced offline learning, suggesting that the modulation of the M1 using tSMS can enhance offline motor learning in an implicit task. These findings are in line with our work, as the decrease in baseline hand function assessed immediately post-stimulation could be related to the decrease in online motor learning found by Lacroix et al., [25] and the significant gains in hand function over sham stimulation would be related to the improvement in motor learning found by Nojima et al. [26] at 40 min post-stimulation, no significant differences were observed between groups, which coincides with the duration of post-stimulation tSMS effects after 30 min stimulations, which can last 30 min, diluting after this time [2]. The increase in motor response after unilateral application of tSMS on M1 for 30 minutes may be due to two factors: 1) increased cortical inhibition of M1 as part of the physiological learning process could be facilitated by tSMS due to enhancement of GABAergic inhibitory action due to somatic inhibitory synapses on M1 pyramidal neurons, formed by parvalbumin inhibitory neurons, which rise during motor learning, and determine whether or not a dendritic spine is generated; 2) paradoxical effect of the homeostatic plasticity: the inhibition of M1 during the online application of tSMS could worsen online motor learning according to the results of the immediate-post measurement of this study and to the study by Lacroix et al., [25] which would lead to a homeostatic enhancement of M1 induced during the following offline learning process, which is consistent with the study by Nojima et al. [26] and with the significant improvement in function at 15 minutes post-stimulation found in this study.
The findings different from those found by Shimomura et al. [27] may be due to the fact that in the present study a single session was applied, it was performed in healthy subjects, and it was applied without combining it with other types of therapy. The differences shown justify the need for a greater number of studies to evaluate the clinical applicability of tSMS in patients with stroke. Future studies analyzing the clinical applicability of tSMS in this regard are recommended.
Limitations
The present study had several limitations: 1) no exercise, sleep, fatigue, or caffeine consumption scales were considered for the baseline comparison of the groups; 2) the size of the mobile used to perform the FTT was standard and could be echo or narrow depending on the subject’s hand; 3) no test trial was allowed for the FTT; 4) the recruitment was performed by non-probabilistic sampling of consecutive cases; 5) age was not considered as a factor that could affect the results because the distribution between groups did not show significant differences, even so, the wide age range could affect the results, since young people could present greater skill in the use of smartphone apps.
5. Conclusions
Unilateral application of tSMS over M1 of the dominant hemisphere in a single session does not reduce manual dexterity or grip strength in healthy subjects. This application could have benefits in the motor performance of the contralateral hemibody to the stimulated motor cortex.
Author Contributions
All authors provided significant contributions to this manuscript; VNL and MdV planned and performed the study; VNL, MdV, SJ, MCT, AO and FMR planned the protocol; DFC and MCT were responsible for blinding and randomization; VNL and FM performed data analysis; VNL, MCT, and FM wrote the first manuscript draft; AO and FMR supervised the study; all authors discussed the results and commented on the manuscript.
Funding
This research received no external funding.
Institutional Review Board Statement
The study was conducted in accordance with the Declaration of Helsinki and approved by the Ethics Committee of the Universidad Rey Juan Carlos (protocol code 2403202113221).
Informed Consent Statement
Informed consent was obtained from all subjects involved in the study.
Conflicts of Interest
A.O. is one of the cofounders of the company Neurek SL, which is a spinoff of the Foundation of the Hospital Nacional de Paraplejicos. Moreover, he is one of the inventors listed on the following patents: P201030610, PCT/ES2016/000100 and PCT/ES2011/070290 (patent abandoned). The authors declare no other competing financial interests.
References
- Oliviero, A.; Mordillo-Mateos, L.; Arias, P.; Panyavin, I.; Foffani, G.; Aguilar, J. Transcranial static magnetic field stimulation of the human motor cortex. J. Physiol. 2011, 589, 4949–4958. [Google Scholar] [CrossRef] [PubMed]
- Dileone, M.; Mordillo-Mateos, L.; Oliviero, A.; Foffani, G. Long-lasting effects of transcranial static magnetic field stimulation on motor cortex excitability. Brain Stimul. 2018, 11, 676–688. [Google Scholar] [CrossRef] [PubMed]
- Nojima, I.; Oliviero, A.; Mima, T. Transcranial static magnetic stimulation —From bench to bedside and beyond—. Neurosci. Res. 2019, 156, 250–255. [Google Scholar] [CrossRef]
- Nakagawa, K.; Sasaki, A.; Nakazawa, K. Accuracy in Pinch Force Control Can Be Altered by Static Magnetic Field Stimulation Over the Primary Motor Cortex. Neuromodulation: Technol. Neural Interface 2019, 22, 871–876. [Google Scholar] [CrossRef] [PubMed]
- Pineda-Pardo, J.A.; Obeso, I.; Guida, P.; Dileone, M.; Strange, B.A.; Obeso, J.A.; Oliviero, A.; Foffani, G. Static magnetic field stimulation of the supplementary motor area modulates resting-state activity and motor behavior. Commun. Biol. 2019, 2, 1–13. [Google Scholar] [CrossRef] [PubMed]
- Kemps, H.; Gervois, P.; Brône, B.; Lemmens, R.; Bronckaers, A. Non-invasive brain stimulation as therapeutic approach for ischemic stroke: Insights into the (sub)cellular mechanisms. Pharmacol. Ther. 2022, 235, 108160. [Google Scholar] [CrossRef]
- Boddington, L.; Reynolds, J. Targeting interhemispheric inhibition with neuromodulation to enhance stroke rehabilitation. Brain Stimul. 2017, 10, 214–222. [Google Scholar] [CrossRef]
- Fisicaro, F.; Lanza, G.; Grasso, A.A.; Pennisi, G.; Bella, R.; Paulus, W.; Pennisi, M. Repetitive transcranial magnetic stimulation in stroke rehabilitation: review of the current evidence and pitfalls. Ther. Adv. Neurol. Disord. 2019, 12, 175628641987831. [Google Scholar] [CrossRef] [PubMed]
- Shibata, S.; Watanabe, T.; Yukawa, Y.; Minakuchi, M.; Shimomura, R.; Mima, T. Effect of transcranial static magnetic stimulation on intracortical excitability in the contralateral primary motor cortex. Neurosci. Lett. 2020, 723, 134871. [Google Scholar] [CrossRef]
- Takamatsu, Y.; Koganemaru, S.; Watanabe, T.; Shibata, S.; Yukawa, Y.; Minakuchi, M.; Shimomura, R.; Mima, T. Transcranial static magnetic stimulation over the motor cortex can facilitate the contralateral cortical excitability in human. Sci. Rep. 2021, 11, 5370. [Google Scholar] [CrossRef] [PubMed]
- Xu, J.; Branscheidt, M.; Schambra, H.; Steiner, L.; Widmer, M.; Diedrichsen, J.; Goldsmith, J.; Lindquist, M.; Kitago, T.; Luft, A.R.; et al. Rethinking interhemispheric imbalance as a target for stroke neurorehabilitation. Ann. Neurol. 2019, 85, 502–513. [Google Scholar] [CrossRef] [PubMed]
- Nowak, D.A.; Grefkes, C.; Ameli, M.; Fink, G.R. Interhemispheric Competition After Stroke: Brain Stimulation to Enhance Recovery of Function of the Affected Hand. Neurorehabilit. Neural Repair 2009, 23, 641–656. [Google Scholar] [CrossRef] [PubMed]
- Axelrod, B.N.; Meyers, J.E.; Davis, J.J. Finger Tapping Test Performance as a Measure of Performance Validity. Clin. Neuropsychol. 2014, 28, 876–888. [Google Scholar] [CrossRef] [PubMed]
- Jo, N.-G.; Kim, G.-W.; Won, Y.H.; Park, S.-H.; Seo, J.-H.; Ko, M.-H. Timing-Dependent Effects of Transcranial Direct Current Stimulation on Hand Motor Function in Healthy Individuals: A Randomized Controlled Study. Brain Sci. 2021, 11, 1325. [Google Scholar] [CrossRef] [PubMed]
- Gorin, S.; Wakeford, C.; Zhang, G.; Sukamtoh, E.; Matteliano, C.J.; Finch, A.E. Beneficial effects of an investigational wristband containing Synsepalum dulcificum (miracle fruit) seed oil on the performance of hand and finger motor skills in healthy subjects: A randomized controlled preliminary study. Phytotherapy Res. 2018, 32, 321–332. [Google Scholar] [CrossRef] [PubMed]
- Grice, K.O.; Vogel, K.A.; Le, V.; Mitchell, A.; Muniz, S.; Vollmer, M.A. Adult Norms for a Commercially Available Nine Hole Peg Test for Finger Dexterity. Am. J. Occup. Ther. 2003, 57, 570–573. [Google Scholar] [CrossRef] [PubMed]
- Ismail, S.S.; Mohamad, M.; Syazarina, S.O.; Nafisah, W.Y. Hand grips strength effect on motor function in human brain using fMRI: A pilot study. J. Phys. Conf. Ser. 2014, 546, 012001. [Google Scholar] [CrossRef]
- Cohen, J. Statistical power analysis for the behavioral sciences, 2nd ed.; Routledge: New York, NY, USA, 2013. [Google Scholar]
- Sykes, M.; Matheson, N.A.; Brownjohn, P.W.; Tang, A.D.; Rodger, J.; Shemmell, J.B.H.; Reynolds, J.N.J. Differences in Motor Evoked Potentials Induced in Rats by Transcranial Magnetic Stimulation under Two Separate Anesthetics: Implications for Plasticity Studies. Front. Neural Circuits 2016, 10, 80. [Google Scholar] [CrossRef] [PubMed]
- Bestmann, S.; Krakauer, J.W. The uses and interpretations of the motor-evoked potential for understanding behaviour. Exp. Brain Res. 2015, 233, 679–689. [Google Scholar] [CrossRef] [PubMed]
- Poole, B.J.; Mather, M.; Livesey, E.J.; Harris, I.M.; Harris, J.A. Motor-evoked potentials reveal functional differences between dominant and non-dominant motor cortices during response preparation. Cortex 2018, 103, 1–12. [Google Scholar] [CrossRef] [PubMed]
- Froc, D.J.; Chapman, C.A.; Trepel, C.; Racine, R.J. Long-Term Depression and Depotentiation in the Sensorimotor Cortex of the Freely Moving Rat. J. Neurosci. 2000, 20, 438–445. [Google Scholar] [CrossRef] [PubMed]
- Collingridge, G.L.; Isaac, J.T.R.; Wang, Y.T. Receptor trafficking and synaptic plasticity. Nat. Rev. Neurosci. 2004, 5, 952–962. [Google Scholar] [CrossRef] [PubMed]
- Cooke, S.F.; Bliss, T.V.P. Plasticity in the human central nervous system. Brain 2006, 129, 1659–1673. [Google Scholar] [CrossRef]
- Lacroix, A.; Proulx-Bégin, L.; Hamel, R.; De Beaumont, L.; Bernier, P.-M.; Lepage, J.-F. Static magnetic stimulation of the primary motor cortex impairs online but not offline motor sequence learning. Sci. Rep. 2019, 9, 1–8. [Google Scholar] [CrossRef] [PubMed]
- Nojima, I.; Watanabe, T.; Gyoda, T.; Sugata, H.; Ikeda, T.; Mima, T. Transcranial static magnetic stimulation over the primary motor cortex alters sequential implicit motor learning. Neurosci. Lett. 2018, 696, 33–37. [Google Scholar] [CrossRef] [PubMed]
- Shimomura, R.; Shibata, S.; Koganemaru, S.; Minakuchi, M.; Ichimura, S.; Mima, T. Transcranial static magnetic field stimulation (tSMS) can induce functional recovery in patients with subacute stroke. Brain Stimul. 2023. [Google Scholar] [CrossRef]
Figure 1.
MAGxx1.1 helmet, with Neodymium magnet.
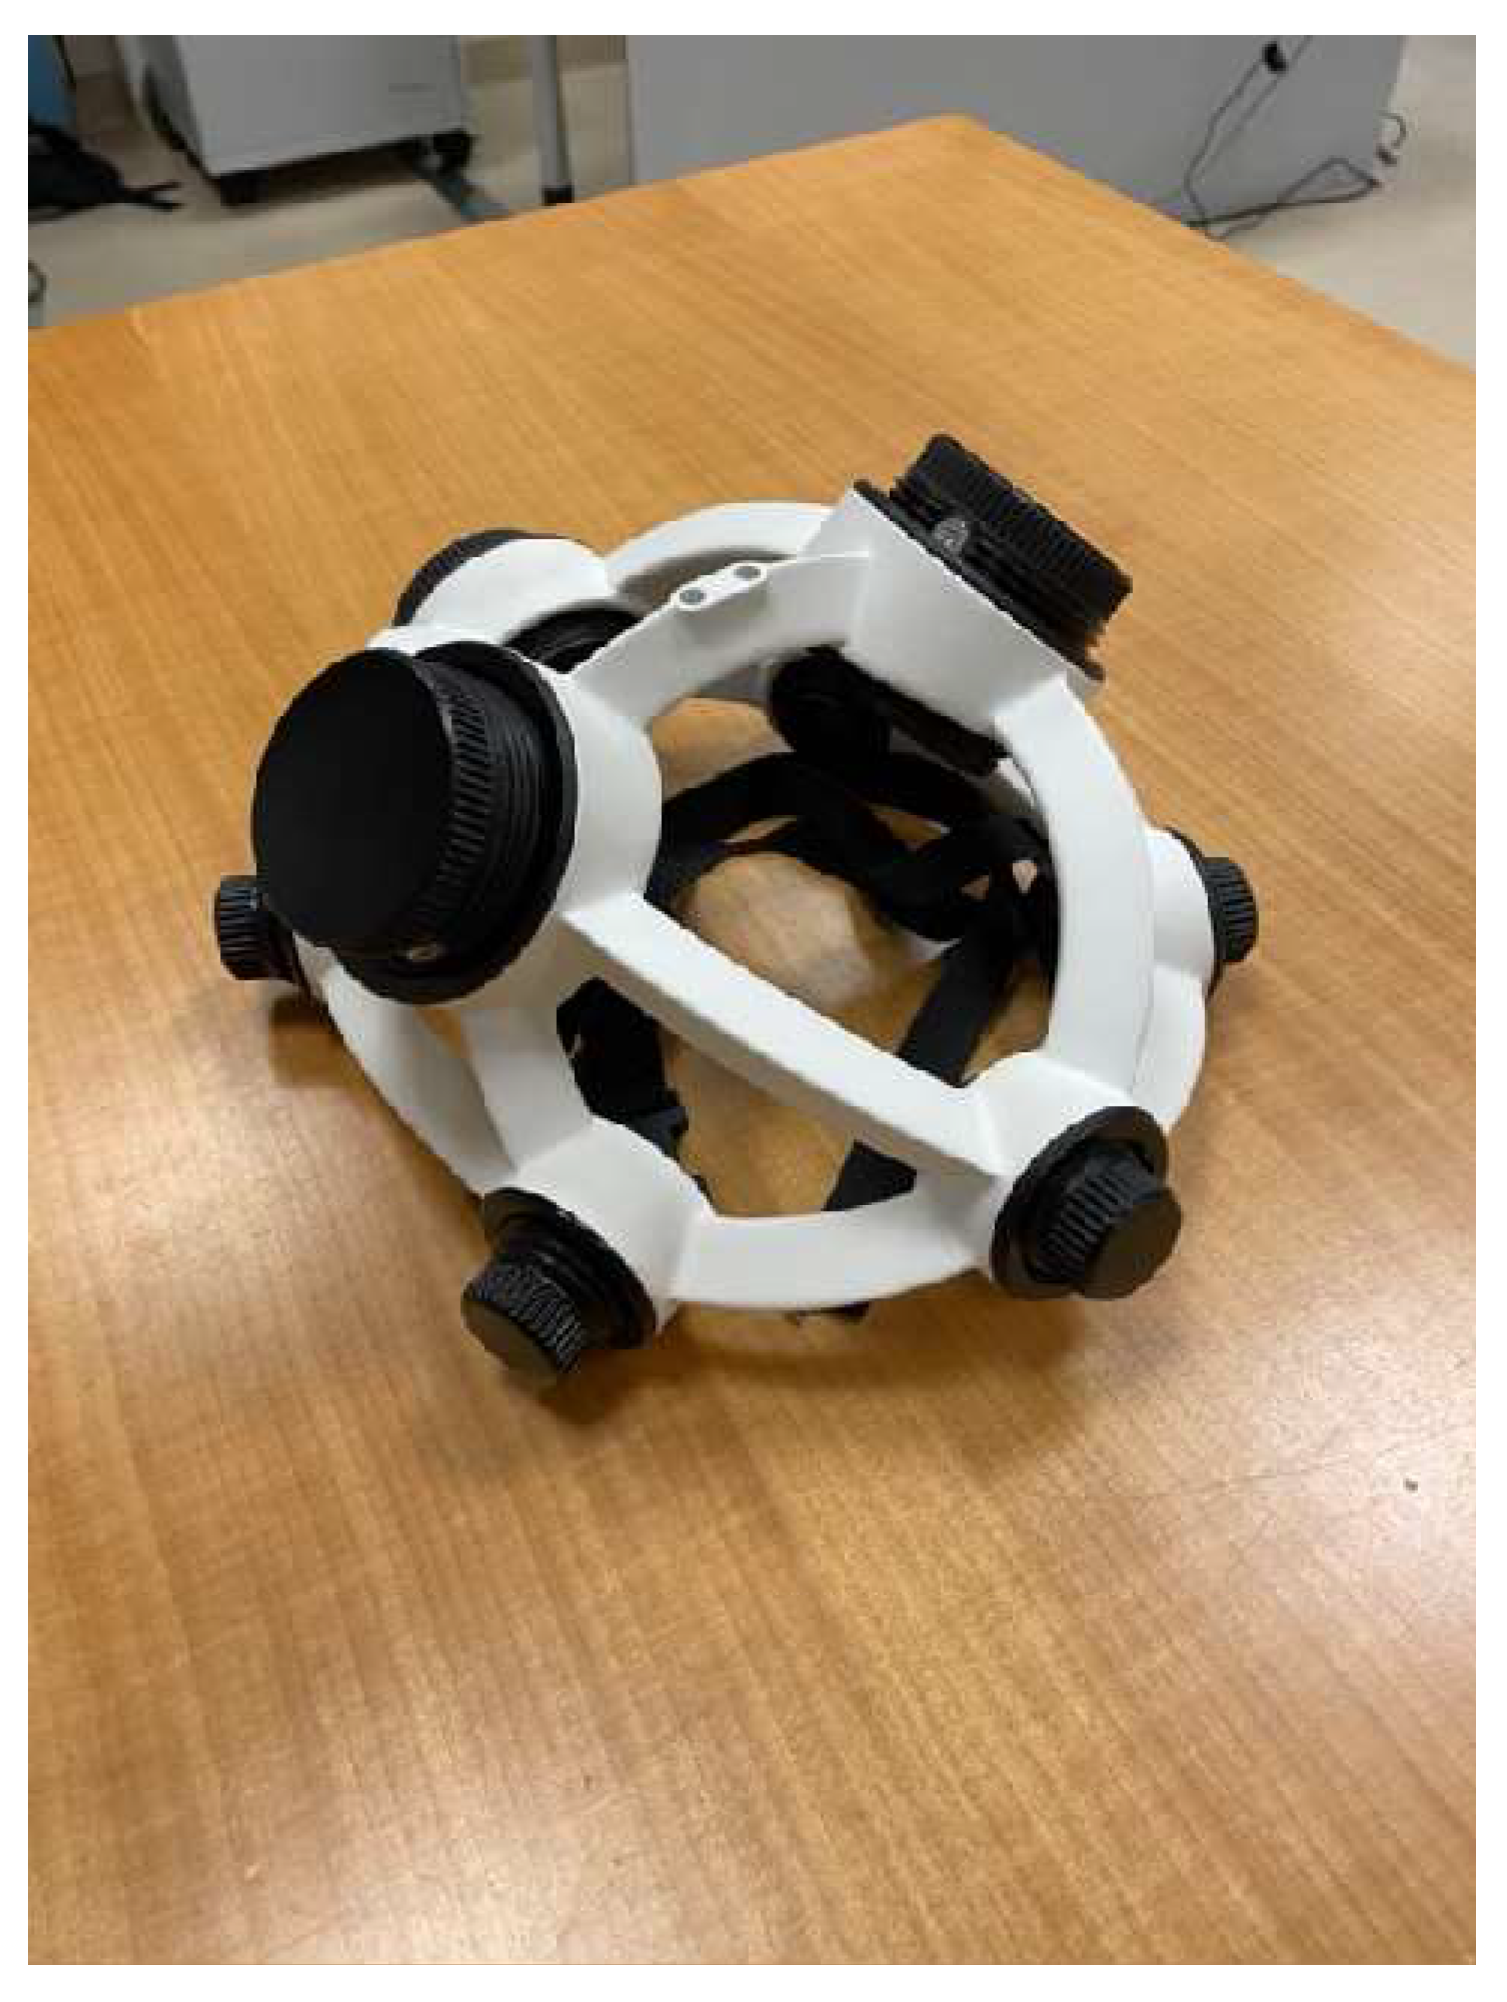
Figure 2.
Flow diagram of the study according to the CONSORT2010 guidelines.
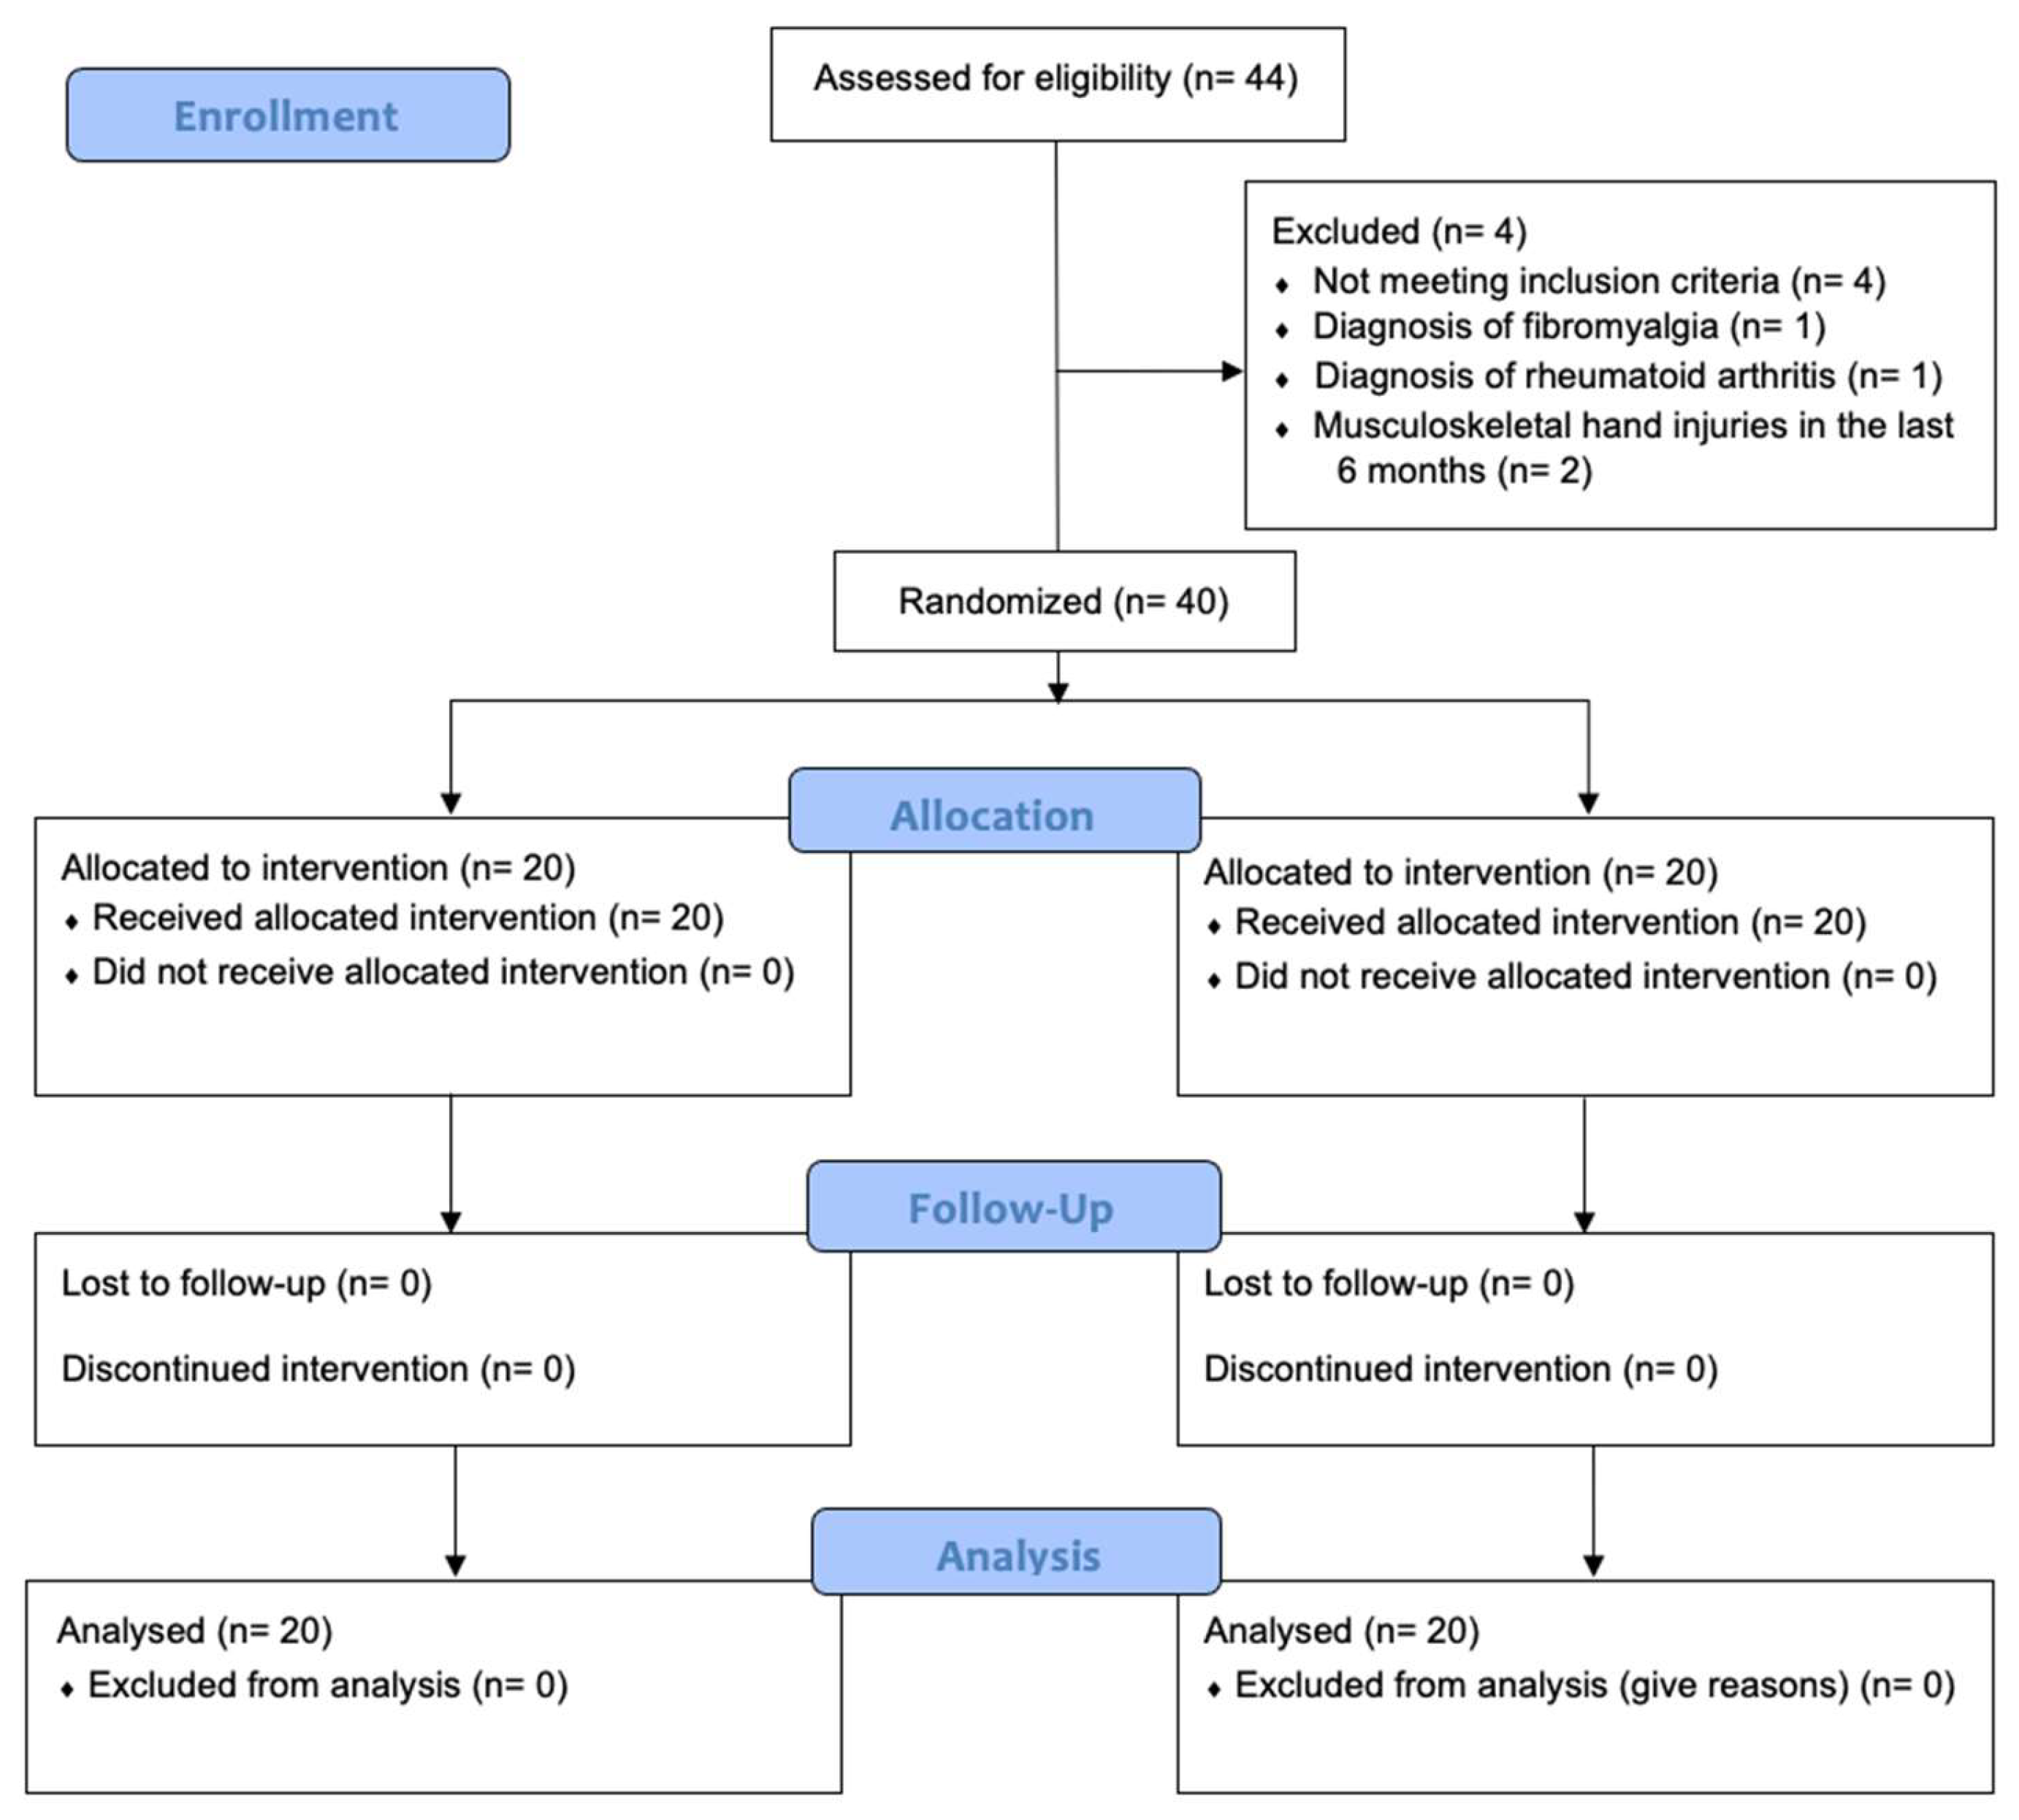
Figure 3.
Finger Tapping Test scores. Scores for the Finger Tapping Test (FTT) in both groups. Data are shown in mean and standard deviation, the error bars are the standard error of the mean. y-axis= number of strokes in the FTT. X-axis= assessment time. T0= baseline assessment T1= immediately after stimulation; T2= 15 minutes after stimulation; T3= 40 minutes after stimulation. a) 10 seconds FTT, dominant hand; b) 10 seconds FTT, non-dominant hand; c) 5 seconds FTT, dominant hand; d) 5 seconds FTT, non-dominant hand.
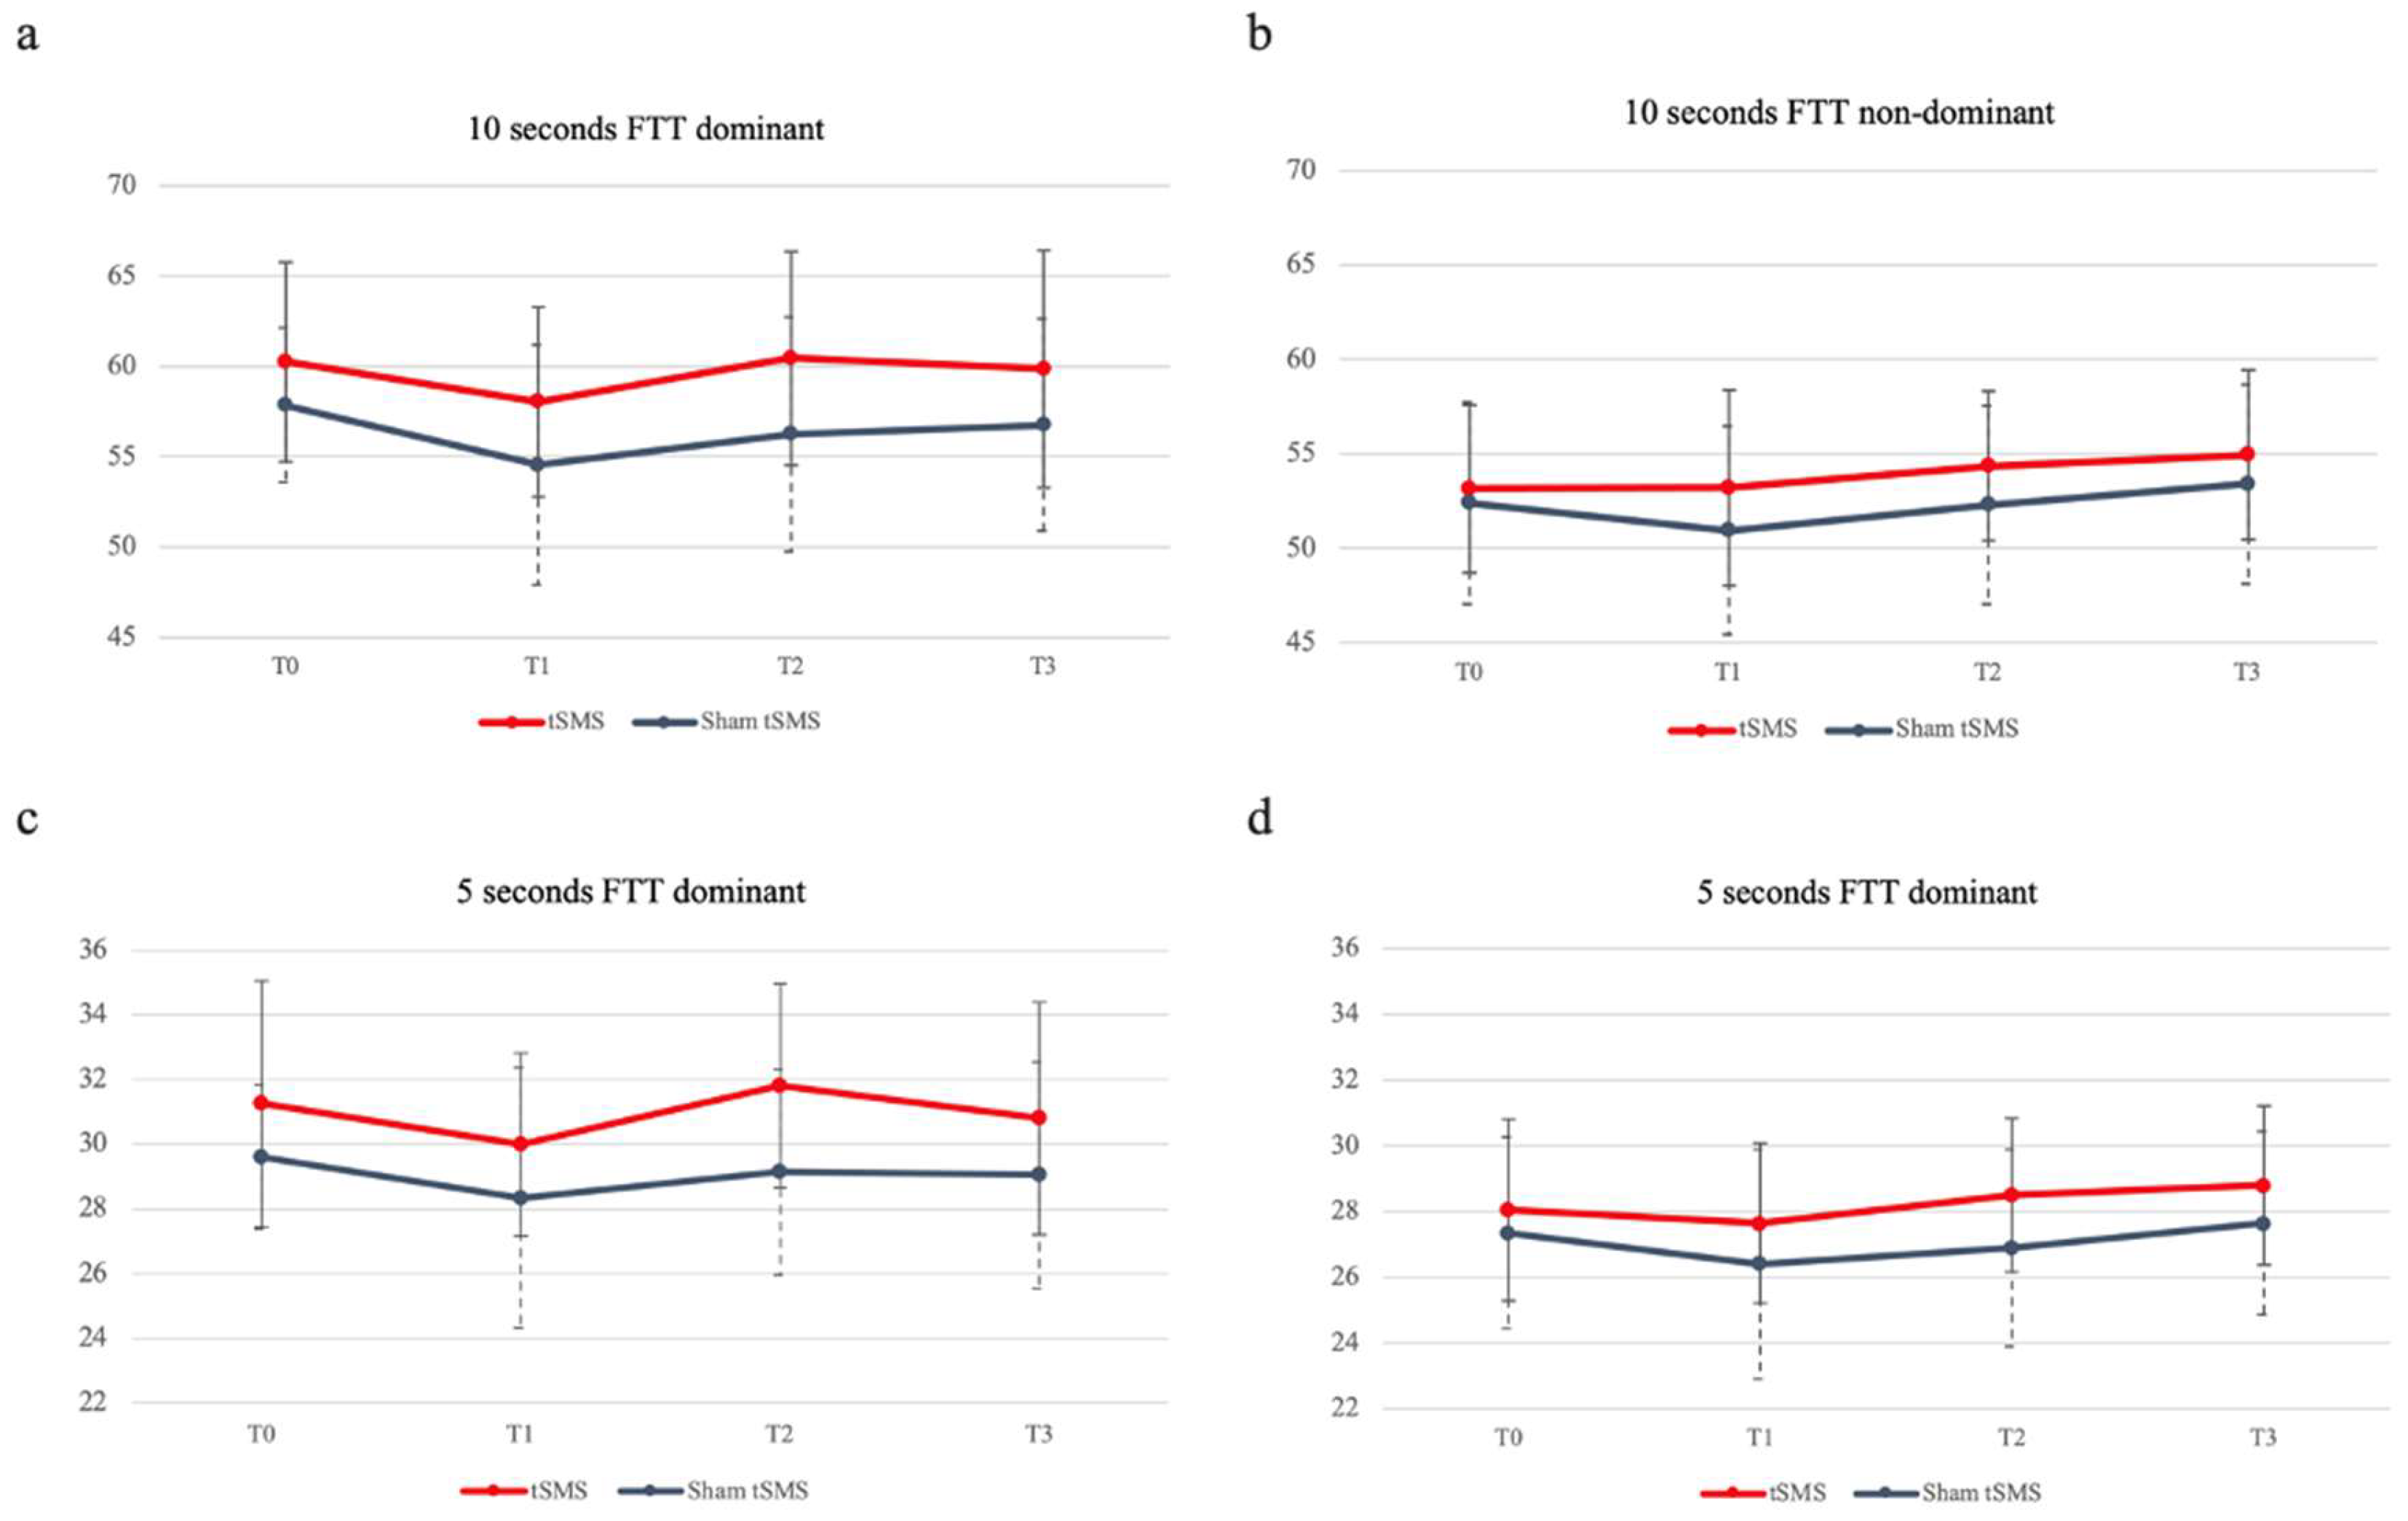

Table 1.
Clinical procedures for motor skills assessments.
| 1- All tests were conducted in a quiet, enclosed room to reduce the effects of visual and auditory interference. |
| 2- The subjects were tested in the same room, with the same conditions, the same chair, and the same table. |
| 3- The subjects were instructed to perform the test in the same specific posture for each test. |
| 4 - The tests were performed in the same order and with the same time interval. |
| 5 - Subjects were not allowed to wear jewelry, watches, or other accessories on the upper extremities. |
| 6 - All subjects were assigned and evaluated by the same investigator. |
| 7 - All subjects were instructed by the same evaluator. The evaluator provided the same verbal instructions in the same tone of voice during each test to reduce training effects. |
| 8 - All subjects were allowed to perform a pretest, except for the finger tapping test. |
| 9 - Subjects were required to complete each individual test without rest. |
Table 2.
Baseline characteristics.
| Variable | tSMS (n = 20) | Sham tSMS (n = 20) | p-value |
|---|---|---|---|
| Age (years), mean (SD) | 27,1 ± 7,85 | 25,05 ± 8,18 | .424 |
| Gender, n male (%) | 6 (30%) | 10 (50%) | .206 |
| Height (cm), mean (SD) | 167,65 ± 7,55 | 168,9 ± 10,25 | .663 |
| Weight (kg), mean (SD) | 64,82 ± 7,15 | 65,76 ± 12,98 | .776 |
| Hand of dominance, n right (%) | 19 (95%) | 20 (100%) | .33 |
| 10s FTT dominant hand (taps in 10 seconds), mean (SD) | 60,25 ± 5,54 | 57,85 ± 4,27 | .133 |
| 10s FTT non dominant hand (taps in 10 seconds), mean (SD) | 53,15 ± 4,45 | 52.40 ± 5,34 | .632 |
| 5s FTT dominant hand (taps in first 5 seconds), mean (SD) | 31,25 ± 3,08 | 29,6 ± 2,21 | .059 |
| 5s FTT non dominant hand (taps in first 5 seconds), mean (SD) | 28,05 ± 2,76 | 27,35 ± 2,91 | .44 |
| Nine Hole Peg Test dominant hand | 17,51 ± 1,85 | 17,74 ± 1,74 | .691 |
| Nine Hole Peg Test non dominant hand | 18,84 ± 2,12 | 19,6 ± 2,11 | .26 |
| Hand Grip Strength dominant hand | 33,93 ± 8,67 | 32,73 ± 11,04 | .706 |
| Hand Grip Strength non dominant hand | 29,8 ± 8,27 | 29,57 ± 11,31 | .941 |
| Mean ± standard deviation of demographic characteristics and clinical features are reported. Differences assessed by independent student t-test. Cm: centimeters; KG: Kilograms; FTT: Finger Tapping Test; tSMS: transcranial static magnetic stimulation. *Significant at p<0.05. | |||
Table 3.
Intragroup dependent variables (means ± SD) of the 2 groups (tSMS, Sham tSMS) over time for the dominant side.
Table 3.
Intragroup dependent variables (means ± SD) of the 2 groups (tSMS, Sham tSMS) over time for the dominant side.
| Outcome variable | Mean (SD) | T0 vs. T1 | T0 vs. T2 | T0 vs. T3 | |||||||||||||
|---|---|---|---|---|---|---|---|---|---|---|---|---|---|---|---|---|---|
| T0 | T1 | T2 | T3 | DM | 95%CI | d | p | DM | 95%IC | d | p | DM | 95%CI | d | p | ||
| Finger Tapping Test | |||||||||||||||||
| 10s | tSMS | 60.25 ± 5.54 | 58.05 ± 5.24 | 60.45 ± 5.9 | 59.85 ± 6.58 | 2.2 ± 1.01 | -.63; 5.03 | .29 | .219 | -.2 ± 1.15 | -3.39; 2.99 | .02 | 1 | .4 ± 1.25 | -3.11; 3.91 | .05 | 1 |
| Sham | 57.85 ± 4.27 | 54.55 ± 6.64 | 56.25 ± 6.5 | 56.75 ± 5.87 | 3.3 ± 1.01 | .47; 6.13 | .42 | .015* | 1.6 ± 1.15 | -1.59; 4,79 | .2 | 1 | 1.1 ± 1.26 | -2.41; 4.61 | .15 | 1 | |
| 5s | tSMS | 31.25 ± 3.8 | 30 ± 2.83 | 31.8 ± 3.15 | 30.8 ± 3.59 | 1.25 ± .52 | -.2; 2.7 | .26 | .131 | -.1 ± -55 | -1.63; 1.43 | .12 | 1 | .45 ± .58 | -1.17; 2.07 | .08 | 1 |
| Sham | 29.6 ± 2.21 | 28.35 ± 4.02 | 29.15 ± 3.17 | 29.05 ± 3.5 | 1.25 ± .52 | -.2; 2.7 | .27 | .131 | .45 ± .5 | -1.08; 1.98 | .12 | 1 | .55 ± .58 | -1.07; 2.17 | .13 | 1 | |
| Nine Hole Peg Test | |||||||||||||||||
| 9HPT | tSMS | 17.51 ± 1.85 | 17.35 ± 2.23 | 16.52 ± 1.99 | 16.57 ± 2.67 | .162 ± .43 | -1.04; 1.36 | .06 | 1 | .99 ± .38 | -.08; 2.06 | .36 | .085 | .933 ± .52 | -.5; 2.37 | .29 | .466 |
| Sham | 17.74 ± 1.74 | 17.54 ± 1.48 | 17.19 ± 1.68 | 17.39 ± 2.25 | .19 ± .43 | -1; 1.39 | .09 | 1 | .54 ± .39 | -.53; 1.61 | .23 | .994 | .35 ± .52 | -1.08; 1.78 | .12 | 1 | |
| Hand Grip Strength | |||||||||||||||||
| HGS | tSMS | 33.93 ± 8.67 | 32.63 ± 7.87 | 33.3 ± 8.48 | 32.53 ± 7.2 | 1.3 ± .71 | -.69; 3.28 | .11 | .466 | .63 ± .76 | -1.49; 2.74 | .05 | 1 | 1.39 ± .89 | -1.09; 3.87 | .01 | .76 |
| Sham | 32.73 ± 11.05 | 32.07 ± 11.58 | 32.73 ± 10.92 | 32.87 ± 10.51 | .67 ± .71 | -1.32; 2.66 | .04 | 1 | .001 ± .76 | -2.12; 2.12 | 0 | 1 | -.13 ± .89 | -2.61; 2.35 | 0 | 1 | |
| Statistical test used: repeated-measures ANOVA. Significance: *p<0.05. d: Cohen’s d; DM: difference of means; HGS: Hand Grip Strength; S: seconds; SD: Standard deviation; tSMS: transcranial static magnetic stimulation; T0: basal; T1: immediately after stimulation; T2: 15 minutes after stimulation; T3: 40 minutes after stimulation; vs: versus; 9HPT: Nine Hole Peg Test. | |||||||||||||||||
Table 4.
Intragroup dependent variables (means ± SD) of the 2 groups (tSMS, Sham tSMS) over time for the non-dominant side.
Table 4.
Intragroup dependent variables (means ± SD) of the 2 groups (tSMS, Sham tSMS) over time for the non-dominant side.
| Outcome variable | Mean (SD) | T0 vs. T1 | T0 vs. T2 | T0 vs. T3 | |||||||||||||
|---|---|---|---|---|---|---|---|---|---|---|---|---|---|---|---|---|---|
| T0 | T1 | T2 | T3 | DM | 95%CI | d | p | DM | 95%IC | d | p | DM | 95%CI | d | p | ||
| Finger Tapping Test | |||||||||||||||||
| 10s | tSMS | 53.15 ± 4.45 | 53.2 ± 5.18 | 54.35 ± 3.96 | 54.95 ± 4.48 | -.05 ± .81 | -2.3; 2.2 | 0 | 1 | -1.2 ± .99 | -3.97; 1,57 | .2 | 1 | -1.8 ± .9 | -4.33; .73 | .28 | .329 |
| Sham | 52.4 ± 5.34 | 50.95 ± 5.49 | 52.3 ± 5.25 | 53.4 ± 5.27 | 1.45 ± .81 | -.8; 3.7 | .19 | .484 | .1 ± .1 | -2.67; 2.87 | .01 | 1 | -1. ± .91 | -3.53; 1.53 | .13 | 1 | |
| 5s | tSMS | 28.05 ± 2.76 | 27.65 ± 2.43 | 28.5 ± 2.33 | 28.8 ± 2.42 | .4 ± .53 | -1.1; 1.89 | .11 | 1 | -.45 ± .64 | -2.22; 1.32 | .13 | 1 | -.75 ± .55 | -2.29; .79 | .2 | 1 |
| Sham | 27.35 ± 2.91 | 26.4 ± 3.49 | 26.9 ± 3 | 27.65 ± 2.78 | .95 ± .535 | -.54; 2.44 | .21 | .504 | .45 ± .64 | -1.32; 2.22 | .11 | 1 | -.3 ± .55 | -1.84; 1.24 | .07 | 1 | |
| Nine Hole Peg Test | |||||||||||||||||
| 9HPT | tSMS | 18.84 ± 2.12 | 19.35 ± 2.23 | 18.77 ±2.64 | 17.97 ± 2.74 | -.51 ± .39 | -1.6 ± .58 | .17 | 1 | .06 ± .4 | -1.05; 1.18 | .02 | 1 | .87 ± .37 | -.16; 1.9 | .25 | .144 |
| Sham | 19.61 ± 2.11 | 20.14 ± 2.6 | 19.75 ± 2.57 | 18.79 ± 2.08 | -.53 ± .39 | -1.62; .55 | .16 | 1 | -.15 ± .4 | -1.26; .97 | .04 | 1 | .81 ± .37 | -.22; 1.84 | .28 | .204 | |
| Hand Grip Strength | |||||||||||||||||
| HGS | tSMS | 29.8 ± 8.27 | 29.77 ± 7.27 | 29.97 ± 6.83 | 29.57 ± 6.04 | .032 ± .7 | -1.92; 1.98 | 0 | 1 | -.17 ± .75 | -2.26; 1.92 | .02 | 1 | .32 ± .95 | -2.4; 2.87 | .02 | 1 |
| Sham | 29.57 ± 11.3 | 29.57 ± 10.36 | 29.77 ± 10.2 | 30.2 ±10.68 | .002 ± .7 | -1.95; 1.95 | 0 | 1 | -.2 ± .75 | -2.29; 1.89 | .01 | 1 | -.63 ± .95 | -3.27; 2 | .04 | 1 | |
| Statistical test used: repeated-measures ANOVA. Significance: *p<0.05. d: Cohen’s d; DM: difference of means; HGS: Hand Grip Strength; S: seconds; SD: Standard deviation; tSMS: transcranial static magnetic stimulation; T0: basal; T1: immediately after stimulation; T2: 15 minutes after stimulation; T3: 40 minutes after stimulation; vs: versus; 9HPT: Nine Hole Peg Test. | |||||||||||||||||
Table 5.
Intergroup dependent variables (means ± SD) of the 2 groups (tSMS, Sham tSMS) over time for the dominant side.
Table 5.
Intergroup dependent variables (means ± SD) of the 2 groups (tSMS, Sham tSMS) over time for the dominant side.
| Outcome variable | tSMS | Sham tSMS | DM | 95%CI | d | p |
|---|---|---|---|---|---|---|
| Finger Tapping Test | ||||||
| T0 – 10 seconds, mean (SD) | 60.25 ± 5.54 | 57.85 ± 4.27 | 2.4 ± 1.57 | -.767; 5.57 | .49 | .133 |
| T1 – 10 seconds, mean (SD) | 58.05 ± 5.24 | 54.55 ± 6.64 | 3.5 ± 1.89 | -.327; 7.33 | .58 | .072 |
| T2 – 10 seconds, mean (SD) | 60.45 ± 5.9 | 56.25 ± 6.5 | 4.2 ± 1.98 | .199; 8.2 | .68 | .04* |
| T3 – 10 seconds, mean (SD) | 59.85 ±6.58 | 56.75 ± 5.87 | 3.1 ± 1.97 | -.89; 7.09 | .5 | .124 |
| T0 – 5 seconds, mean (SD) | 31.25 ± 3.8 | 29.6 ± 2.21 | 1.65 ± .85 | -.064; 3.36 | .53 | .59 |
| T1 – 5 seconds, mean (SD) | 30 ± 2.83 | 28.35 ± 4.02 | 1.65 ± 1.1 | -.57; 3.87 | .47 | .141 |
| T2 – 5 seconds, mean (SD) | 31.8 ± 3.15 | 29.15 ± 3.17 | 2.2 ± 0.99 | .18; 4.22 | .84 | .034* |
| T3 – 5 seconds, mean (SD) | 30.8 ± 3.59 | 29.05 ± 3.5 | 1.75 ± 1.12 | -.52; 4.02 | .48 | .127 |
| Nine Hole Peg Test | ||||||
| T0 – 9HPT, mean (SD) | 17.51 ± 1.85 | 17.74 ± 1.74 | -.23 ± .57 | -1.38; .92 | .13 | .691 |
| T1 – 9HPT, mean (SD) | 17.35 ± 2.23 | 17.54 ± 1.48 | -.19 ± .6 | -1.41; 1.02 | .1 | .744 |
| T2 – 9HPT, mean (SD) | 16.52 ± 1.99 | 17.19 ± 1.68 | -.67 ± .58 | -1.85; .51 | .36 | .256 |
| T3 – 9HPT, mean (SD) | 16.57 ± 2.67 | 17.39 ± 2.25 | -.81 ± .78 | -2.39; .77 | .33 | .306 |
| Hand Grip Strength | ||||||
| T0 – HGS, mean (SD) | 33.93 ± 8.67 | 32.73 ± 11.05 | 1.19 ± 3.14 | -5.16; 7.55 | .12 | .706 |
| T1 – HGS, mean (SD) | 32.63 ± 7.87 | 32.07 ± 11.58 | 0.56 ± 3.13 | -5.78; 6.9 | .06 | .858 |
| T2 – HGS, mean (SD) | 33.3 ± 8.48 | 32.73 ± 10.92 | 0.57 ± 3.09 | -5.69; 6.83 | .06 | .856 |
| T3 – HGS, mean (SD) | 32.53 ± 7.2 | 32.87 ± 10.51 | -0.33 ± 2.85 | -6.1; 5.44 | .04 | .908 |
| Statistical test used: repeated-measures ANOVA. Significance: *p<0.05. d: Cohen’s d; DM: difference of means; HGS: Hand Grip Strength; SD: Standard deviation; tSMS: transcranial static magnetic stimulation; T0: basal; T1: immediately after stimulation; T2: 15 minutes after stimulation; T3: 40 minutes after stimulation; 9HPT: Nine Hole Peg Test. | ||||||
Table 6.
Intergroup dependent variables (means ± SD) of the 2 groups (tSMS, Sham tSMS) over time for the non-dominant side.
Table 6.
Intergroup dependent variables (means ± SD) of the 2 groups (tSMS, Sham tSMS) over time for the non-dominant side.
| Outcome variable | tSMS | Sham tSMS | DM | 95%CI | d | p |
|---|---|---|---|---|---|---|
| Finger Tapping Test | ||||||
| T0 – 10 seconds, mean (SD) | 53.15 ± 4.45 | 52.4 ± 5.34 | .75 ± 1.55 | -2.35; 3.85 | .15 | .632 |
| T1 – 10 seconds, mean (SD) | 53.2 ± 5.18 | 50.95 ± 5.49 | 2.25 ± 1.69 | -1.17; 5.67 | .42 | .19 |
| T2 – 10 seconds, mean (SD) | 54.35 ± 3.96 | 52.3 ± 5.25 | 2.05 ± 1.47 | .93; 5.03 | .44 | .172 |
| T3 – 10 seconds, mean (SD) | 54.95 ± 4.48 | 53.4 ± 5.27 | 1.55 ± 1.55 | -1.58; 4.68 | .32 | .322 |
| T0 – 5 seconds, mean (SD) | 28.05 ± 2.76 | 27.35 ± 2.91 | .7 ± .9 | -1.11; 2.52 | .25 | .44 |
| T1 – 5 seconds, mean (SD) | 27.65 ± 2.43 | 26.4 ± 3.49 | 1.25 ± .95 | -.67; 3.17 | .42 | .196 |
| T2 – 5 seconds, mean (SD) | 28.5 ± 2.33 | 26.9 ± 3 | 1.6 ± .85 | -.122; 3.32 | .6 | .068 |
| T3 – 5 seconds, mean (SD) | 28.8 ± 2.42 | 27.65 ± 2.78 | 1.15 ± .82 | -.52; 2.82 | .44 | .171 |
| Nine Hole Peg Test | ||||||
| T0 – 9HPT, mean (SD) | 18.84 ± 2.12 | 19.61 ± 2.11 | -.76 ± .67 | -2.12; .59 | .36 | .260 |
| T1 – 9HPT, mean (SD) | 19.35 ± 2.23 | 20.14 ± 2.6 | -.79 ± .77 | .2.34; .76 | .33 | .310 |
| T2 – 9HPT, mean (SD) | 18.77 ± 2.64 | 19.75 ± 2.57 | -.97 ± .82 | -2.64; .69 | .38 | .245 |
| T3 – 9HPT, mean (SD) | 17.97 ± 2.74 | 18.79 ± 2.08 | -.82 ± .77 | -2.38; .735 | .34 | .292 |
| Hand Grip Strength | ||||||
| T0 – HGS, mean (SD) | 29.8 ± 8.27 | 29.57 ± 11.3 | .23 ± 3.13 | -6.11; 6.57 | .02 | .941 |
| T1 – HGS, mean (SD) | 29.77 ± 7.27 | 29.57 ± 10.36 | .2 ± 2.83 | -5.53; 5.93 | .02 | .944 |
| T2 – HGS, mean (SD) | 29.97 ± 6.83 | 29.77 ± 10.21 | .2 ± 2.75 | -5.36; 5.76 | .02 | .942 |
| T3 – HGS, mean (SD) | 29.57 ± 6.04 | 30.2 ± 10.68 | -.63 ± 2.74 | -6.19; 4.92 | .07 | .819 |
| Statistical test used: repeated-measures ANOVA. Significance: *p<0.05. d: Cohen’s d; DM: difference of means; HGS: Hand Grip Strength; SD: Standard deviation; tSMS: transcranial static magnetic stimulation; T0: basal; T1: immediately after stimulation; T2: 15 minutes after stimulation; T3: 40 minutes after stimulation; 9HPT: Nine Hole Peg Test. | ||||||
Disclaimer/Publisher’s Note: The statements, opinions and data contained in all publications are solely those of the individual author(s) and contributor(s) and not of MDPI and/or the editor(s). MDPI and/or the editor(s) disclaim responsibility for any injury to people or property resulting from any ideas, methods, instructions or products referred to in the content. |
© 2024 by the authors. Licensee MDPI, Basel, Switzerland. This article is an open access article distributed under the terms and conditions of the Creative Commons Attribution (CC BY) license (http://creativecommons.org/licenses/by/4.0/).
Copyright: This open access article is published under a Creative Commons CC BY 4.0 license, which permit the free download, distribution, and reuse, provided that the author and preprint are cited in any reuse.


