1. Introduction
How can you make money in the market? Don’t consult the thousands of books, articles, blogs, and YouTube videos on the subject -- they won’t help! At least not the small investor, to whom they are in Greek. What little knowledge they glean can be dangerous. And don’t try to get rich quick. “The stock market is a device to transfer money from the impatient to the patient.” – Warren Buffett. In fact, the average investor does poorly, and has been for decades.
The financial market can be at once enchanting and treacherous, like the open ocean. You can admire the lovely fishes, until the predators arrive. It is in fact populated by two types of species: professional institutional investors and traders, plus professional investment advisors, whose time frames are typically short (e.g., a year or less), and average small investors, whose time frames are (or ought to be) long, stretching to decades. The professional traders understand market volatility, and generally use algorithmic trading to deal with it. That subject has a long and rich history and encompasses a wide array of automated trading practices and purposes, including sophisticated techniques as high-frequency trading (HFT, done in microseconds), market making, arbitrage, trend-following, and mean-reversion approaches. And for the money management side, they have both managed accounts as well as machine-driven trading. The investor Jim Simons is a poster boy of an HFT trader who has made billions, but by methods that are highly abstruse and virtually impossible to replicate. By contrast, the small investor has little knowledge of the market, finds volatility frightening, and has few tools at her disposal to make sound investment decisions.
Institutional investors make over 90% of stock trades today Pan (2022). Algorithmic trading itself now accounts for an estimated 80% of all stock trades, and 92% of foreign exchange (Forex) trades Shadmehry (2021), and no doubt rising. In the large, algorithmic trading is also controversial, in that if too much of the volume of trading becomes algorithmic, and a market event occurs that triggers a lot of sell signals simultaneously, it can rapidly tank the entire market before any human can intervene. So algorithmic trading has been blamed in part for the famous market crash of October 19, 1987, as well as partly for the Financial Crisis of 2008. Yet it is all the rage among professionals. But can it help the small investor? In the business of making money, this question seems infrequently asked.
A quick overview of algorithmic trading is given in Seth (2022), while the books E. Chen (2009), Halls-Moore (2010) give more background, and programming tools. HFT and other algo trading is the domain of professional investment houses, dealing in stochastic calculus models, Black-Scholes formula or deep learning, and where split-second timing is money. In contrast, simple rule-based market timing, generating just a few trade signals a year to buy or sell, is our main interest, as it may apply to the small investor. Note that while sophisticated trading strategies generally involve learning parameters in a model (or even training a full neural network) and requiring a learning phase before a live testing phase, simpler rule-based models require no training. In any case, if buy or sell decisions can be systematized, it can take away any human (read emotional) input and turned into computer code. Moreover, the execution of those trading decisions can itself be automated using computers. Detailed research by the Investment Company Institute Richards (2014) shows that for individual investors, planning for retirement was cited by 95% of those surveyed, and 72% cited it as the primary goal. The next highest cited primary goal (saving for emergencies) was only 6%. Thus, investors do mainly invest for the long-term. They are especially weary of downturns. But it seems that their investment habits don’t often reflect that, and tend to be influenced by emotions, especially fear and greed (so much so, that their movements have turned into contra-indicators for the pros). To help them, we focus here on the automation of trading decisions. And in the realm of algorithmic trading approaches fit for individuals, those related to market timing are among the most controversial, or even downright derided as a fool’s errand. When a small investor does try to time the market, it may be based on emotion rather than any tested method, with disappointing results.
On the other side stands a small cadre of legendary investors who have truly understood the fundamental rhythms of the market and capitalized on it. Investors such as Benjamin Graham, John Bogle, John Templeton, Peter Lynch, or more recently, Bill Ackman. But no investor has done this more decisively or for as long as Warren Buffett (often called the greatest investor of all time), earning nearly a 20% annual return since 1965! They are like streamlined sharks that glide effortlessly through the waters. Somehow, he and his ilk can size up the value of a company: its business model, its cash flows now and in the future, even its management, and decide when the right time is to invest in it, and when to sell. This is very painstaking work, and while there are by now many software tools that attempt to replicate this type of analysis, no one has managed to create a tool that does quite what Buffett does.
As mentioned, the typical small investor has little idea of the market, its history, and its rhythms, especially its occasional but wild gyrations. Buy and sell decisions are more likely to be based on emotion than any analysis, buying when the market is rising and selling when it is falling (contrary to wisdom). Major market downturns, which may be as deep as 50% or even 80%, are absolutely frightening for the small investor, many of whom stand to lose their life savings in them. But seasoned investors like Buffett see them for what they truly are: the very best opportunities to buy great companies at a steep discount. This really is at the heart of making money in the market. As Buffett himself has explained, buying (shares of) a company is like shopping; and a downturn is just a sale, the best time to stock up. In short, it is manna from heaven! Eventually, when share prices get frothy, well above their intrinsic value, that’s the time to sell. It is just common sense, yet somehow uncommon in the market.
But these words of wisdom are of little help to the small investor, ill-equipped to understand intrinsic value, whose modest savings may be suddenly cut in half, or worse, facing desperate choices between college tuition, mortgage, rent, or even food. Will they lose everything? Unlike the pros, they lack staying power, just at the critical time. Too many small investors have experienced catastrophic losses in the market at such times. And like sharks in the open waters, the markets can be merciless. This prospect terrifies small investors. No use telling them that high rewards entail risk (though we re-evaluate this). That is why study after study shows that in aggregate the average small investor only gets a 5% return or less, far below the market. For more background on the fate of the small investor, see Topiwala and Dai (2022).
How can we help the hapless small investor succeed, against such steep odds? Rather than develop yet another tool to help the small investor value companies and collect analyst ratings, we take a totally different approach. First, we invest only in a market index; this already assures we can get the market return. But the market also has deep drawdowns, which are unbearable for the small investor (though a bonanza for Buffett). So, we also decide when to be in or out of the market (or even inverse), according to a suite of algorithms, which we call FastHedge. But in contrast to nearly all work in algorithmic trading, which focuses on high-speed trading (unavailable to the small investor), we work on simple algorithms which trade at most once a day, and only a few times per year. Somehow, we can still get good returns, AND reduce drawdowns versus the market; see Topiwala and Dai (2022), Topiwala-2 (2023), Topiwala-3 (2023). No hard analysis of companies needed. We do this without Black-Scholes, stochastic calculus, Modern Portfolio Theory, or any heavy formalism. Finally, a tool a small investor can use.
The rest of this paper is organized as follows.
Section 2 covers some essentials about investing and market timing, including some history, and performance analysis tools.
Section 3 covers some background on great investors, their methods and accomplishments, including of course Warren Buffett. Finally, section 4 covers a direct analysis of the performance of Berkeshire Hathaway’s BRK-A fund, versus our
FastHedge method, over the 44-year period 1980 – 2024 (3/17/1980 – 3/4/2024). In that period, BRK-A achieved a stunning 18.98% annual return, roughly at twice the market rate (and far more compounded). But we find a way for the common man and woman to keep pace with Buffett. Explicit trades and detailed performance graphs are provided for our method.
Section 5 provides some additional results, covering a 50-year period. Finally, section 6 offers our conclusions, on algorithmic trading, the future outlook, and what can work for the small investor.
2. Investment and Market Timing Essentials
In this section, we rapidly review the core tools we need for our analysis, as well as some necessary contextual information. These concepts were developed in the context of individual investing; please see our previous papers for more details and background.
2.1. Investment Basics
There is only one rule in investment: buy low and sell high. However, there are a number of ways to try to achieve this, and two distinct styles have emerged. Fundamental analysis aims to understand companies from an operational and cash flow point of view, computes a present value of future cash flows to arrive at a fair (intrinsic) price, and makes buy or sell decisions based on the difference between the computed and actual price. In contrast, technical analysis generally studies the price history of its shares and the market to derive signals for when to buy or sell a stock ChartSchool (2022).
Both of these methods are successfully used in the market, contrary to the well-known but questionable Efficient Market Hypothesis. Yet fundamental analysis involves stock selection, which is less applicable in our context. We will work with technical analysis. We also note that there is a third method we can compare these with, in which an investor can simply buy and hold a security or index (buy-and-hold, hereafter referred to as BnH).
2.2. Market Timing Background
Market timing is an approach to trading based on determining when to buy or sell a stock; this can be done by algorithm, or by other methods. In a sense, all approaches to trading can be viewed as timing. We remark that much of the published academic literature has been strongly skeptical of market timing as even a possibility (Damodaram; Graham and Harvey 1994; Henriksson and Merton 1981; Merton 1981; Sharpe 1975). We show otherwise.
However, it is widely practiced in the real world with success, see Chen and Liang (2007), cited earlier. And in concert, in three previous papers Topiwala and Dai (2022), Topiwala-2 (2023), Topiwala-3 (2023), we developed a simple and effective timing method, based on so-called moving averages, which is suitable for both professionals and small investors aiming to grow wealth over long periods of time (decades). We achieved powerful results in trading US-based market indices, well-known stocks, and US sector funds.
2.3. Market History
It is important to understand the conditions in which market timing systems such as those we propose can be successful.
Markets have long-term trends, which are generally up.
They have periods of downturns as well, which can be protracted.
They also have some rapid plunges (e.g., Black Monday).
They may even have some self-similarity properties at different scales (a point we mention, but do not explore).
We mainly utilize item (1), while (2) is just a special case, (3) is a feature that we have to deal with, and (4) is a sidelight we ignore, but which may be amenable to multiscale analysis Topiwala (1998).
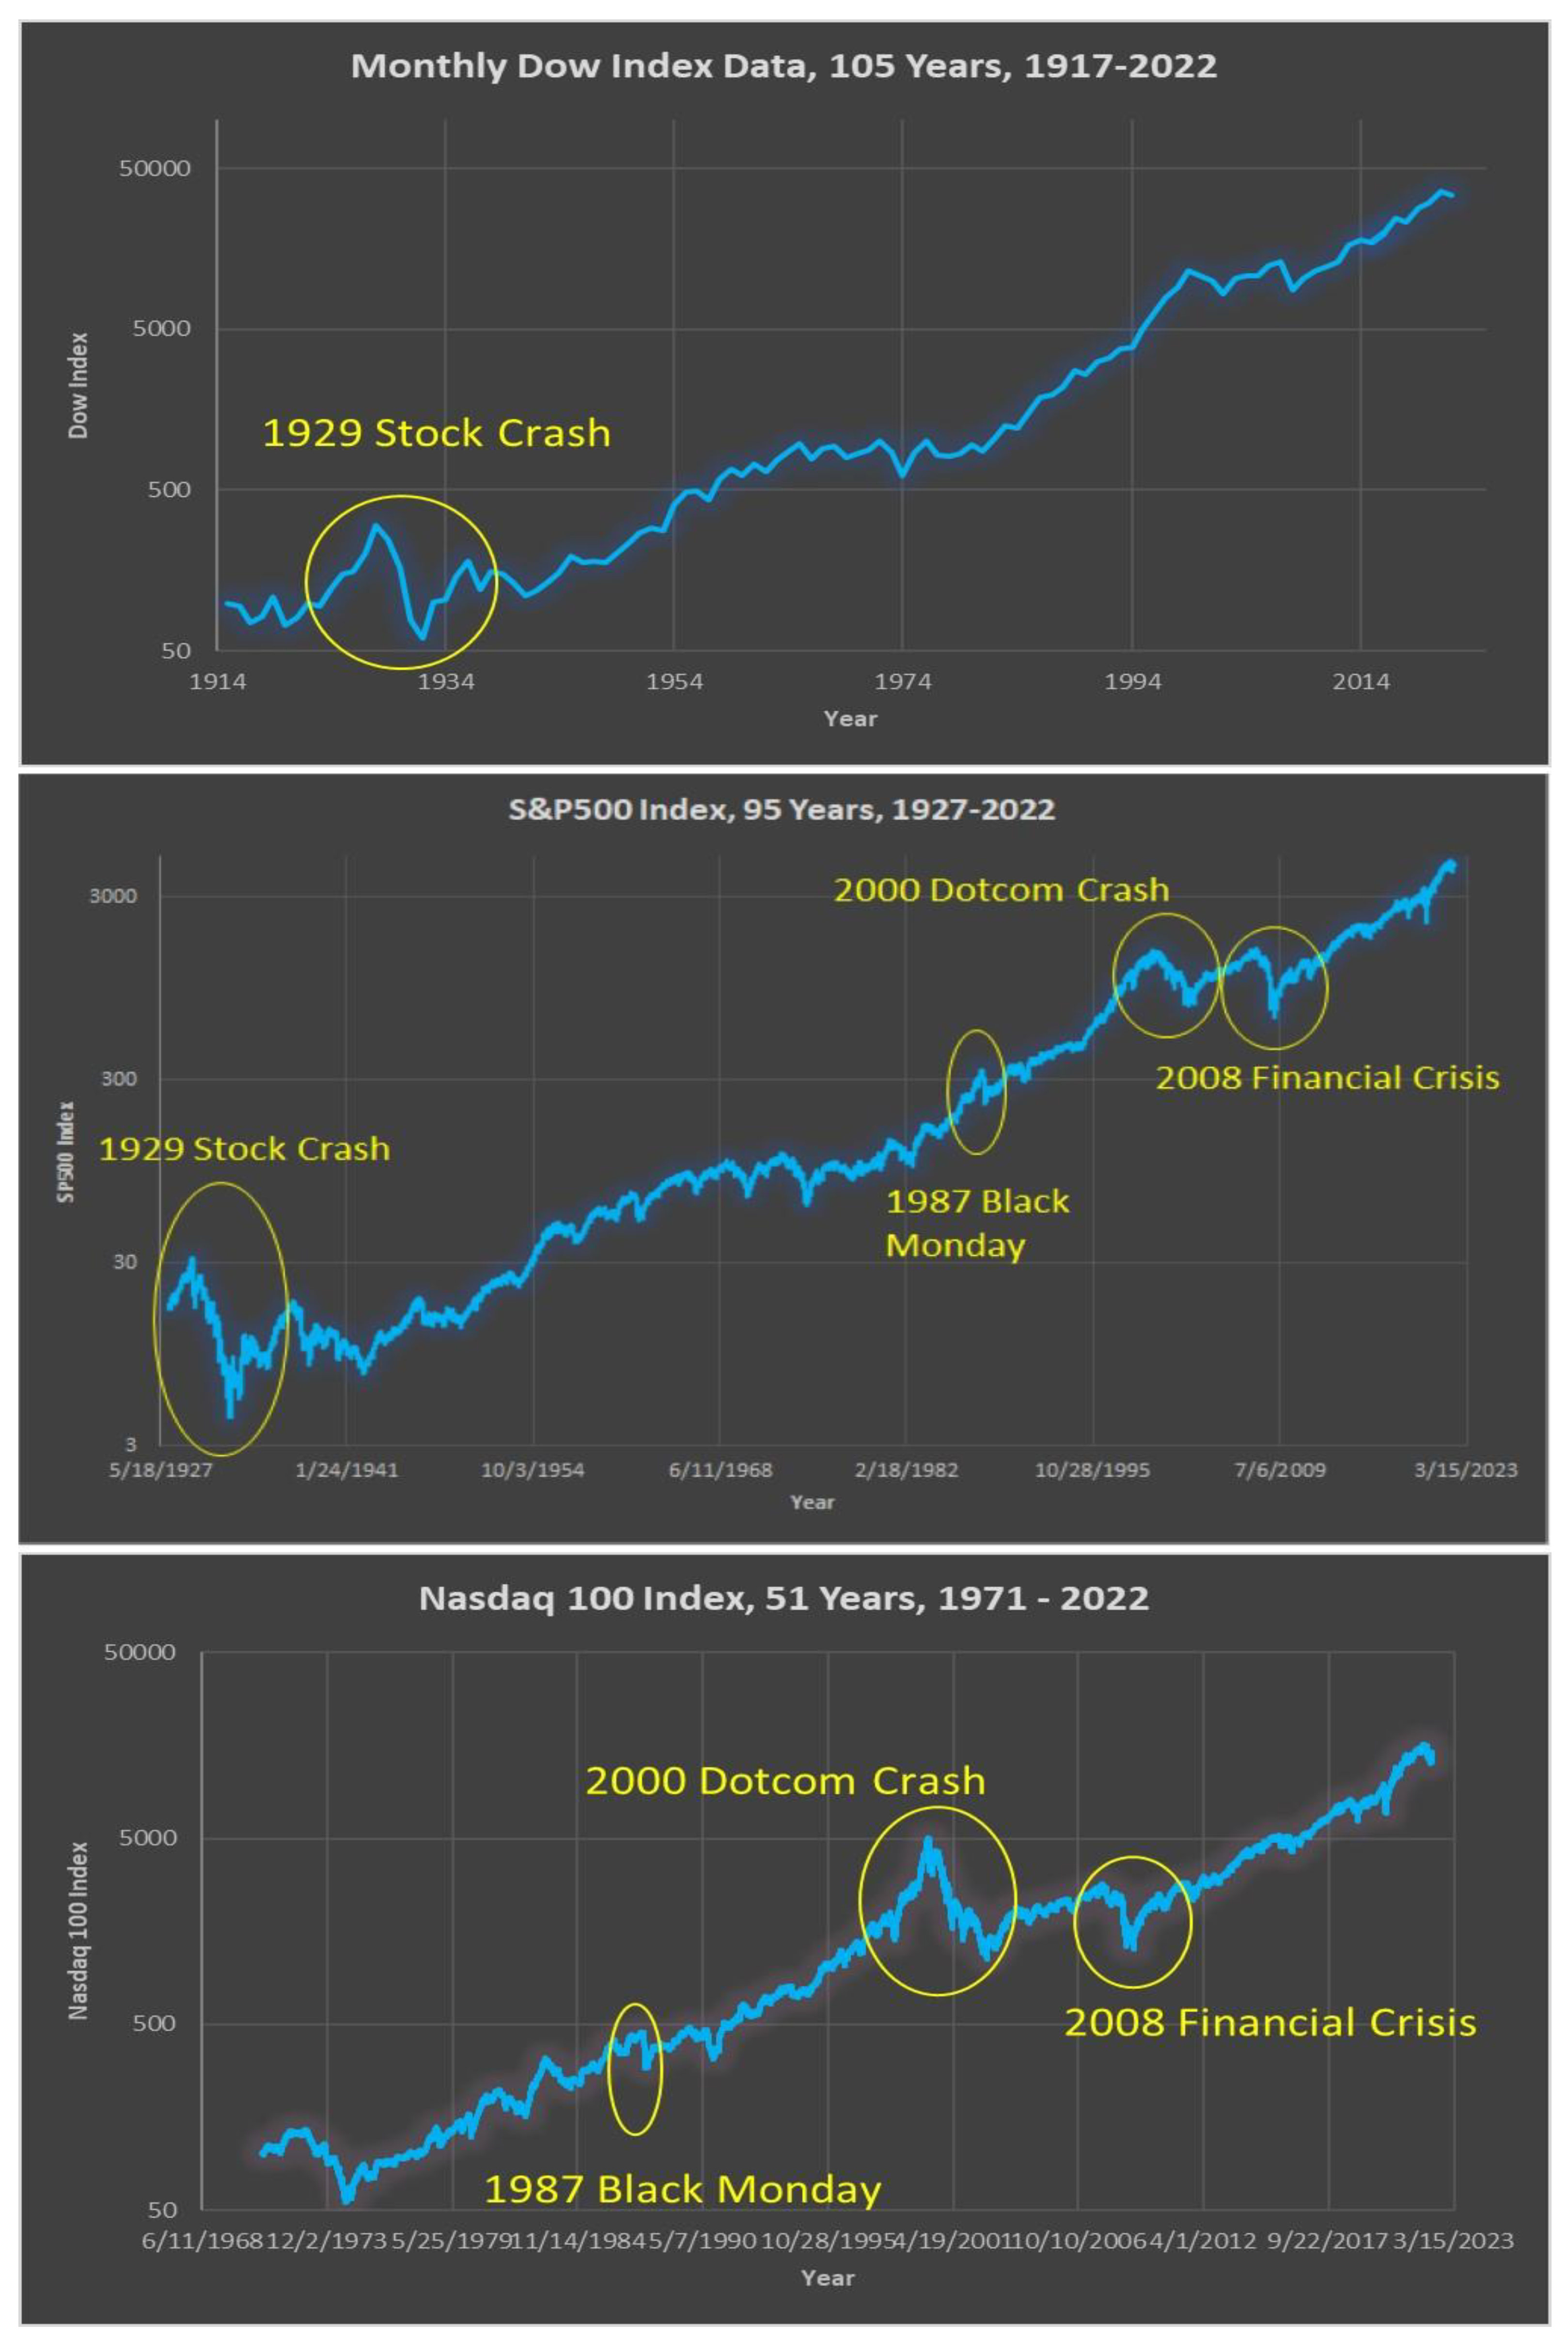
As noted in our previous papers (see
Figure 1), the three main US-based market indices, DOW, SPX, and IXIC, have had a remarkable history of growth (the first two for about 100 years, the last about 50 years). Each also suffered several devastating Black Swan events with deep drawdowns, up to 89% for the 1929 Market Crash. The growth of the economy and of stock prices are of course the fundamental force behind all investment. At the same time, surviving Black Swan events, and controlling deep drawdowns, is a key consideration.
Will these remarkable growth trends continue going forward, and at a similar pace? The future is unknown, and it may not be similar to the past. There are numerous analyses that suggest that future growth will be slower than in the past; we cite a comprehensive 2023 study by the World Bank WorldBank (2023). We will comment on this important point later. For now, we will limit to backtesting on market history.
2.4. Simulation Setup
To make progress, in the context of individual investors, we formulate a concrete simulation setup and goal for our investment studies.
Simulation setup: Start with $1K, allow leverage, model interest rate as 3%, and track the performance of a timing algorithm vs. an underlying variable (buy-and-hold) for a period of time (e.g., decades, for example, 20–40 years).
Goal of market timing: To meet or exceed an investment’s buy-and-hold performance, while limiting its maximum drawdowns (e.g., to <50%, or even <40%) over the investment time period. Most investors, especially small ones, are highly sensitive to deep drawdowns.
2.5. Market Performance Metrics
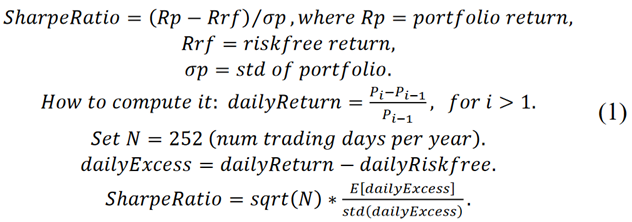
The first and most obvious indicator of performance is simply to graph the growth of an investment over time, as well as to compare several of them. However, if two investments, say A and B, have similar growth but one is more volatile than the other, an investor would naturally prefer the less volatile one. The Sharpe ratio, developed by the 1990 Nobel Prize-winning economist William F. Sharp (Sharpe 1994), is the excess return of an investment (over a risk-free one), divided by the volatility of the investment, measured as the standard deviation of the excess return, when measured in increments of time (for example, daily returns). In practice, the Sharpe ratio is computed using the expected value of the excess daily return of the asset, divided by the standard deviation of the daily return. Furthermore, it is common practice to treat the risk-free rate as zero. In live application, we find that the Sharpe Ratio is often inaccurate for investment comparisons. So we have developed a finer metric, called PARC, discussion below.
One known problem with using the standard deviation to capture volatility in the Sharpe ratio is that it penalizes the upside as much as the downside variability, which is contrary to investment objectives (a defect fixed by the so-called Sortino ratio). For completeness, we also mention another useful measure, the Treynor ratio (Treynor and Mazuy 1966), whose numerator is the same as for the Sharpe ratio, but the denominator is the beta of the portfolio (defined as the ratio of a covariance to a variance Cov(Rp, Rrf )/Var(Rp)). A number of papers and blogs discuss the use of both the Sharpe and Treynor ratios (plus scaled versions), for example, to measure the hedge fund performance (van Dyck 2014). For now, we stay focused on the well-known Sharpe ratio as a comparator.
Note that an initial investment of
I0 dollars, with an annual rate of return r over a period of
M years would give:
In addition to gains over time, an investment also has drawdowns (relative losses) from time to time, and we are especially sensitive to the maximum percentage drawdown, MaxD, over an investment period. Thus, two important measures for an investment are the annual return (AnnR), and the maximum drawdown (MaxD). Using this, we introduce the ARM Ratio = ARMR = AnnR/MaxD. It has elsewhere been called the RoMaD (Chen 2020).
Since investors (especially small) are vitally concerned with keeping MaxD low, we define
Co-MaxD as (1 − MaxD), and define a second, more powerful measure: the Product of Annualized Return and Co-MaxD,
PARC = AnnR * (1 −
MaxD); see Topiwala-2 (2023). We have shown in previous papers that our measures ARMR and PARC are superior to capturing the value of investments better than Sharpe, with PARC being the best (we use a parametric model).
Investment objective: In our view, the objective of sound long-term investment is to simultaneously maximize the annualized return (AR) and minimize the maximum drawdown (MaxD) over the period of investment; that is, to maximize the ARM ratio (ARMR), or better, to maximize the PARC measure. For convenience, we can set the parameter a=1 as baseline, though a=1/2 or 2 are also useful. For both Sharpe and PARC, higher is better. But we will see that PARC is far more sensitive to high drawdowns than is the well-known Sharpe Ratio. We suggest that it is thus more suited to the needs of the small investor than is Sharpe. We will demonstrate.
2.6. Rule-Based Trading Using Moving Averages
One simple market timing approach is in fact well known in the industry and involves the use of the so-called weighted moving average, WMA(N), the weighted average price of a stock or index over the past N trading days. Starting from a given day, labeled Day 0, count backwards up to N − 1 days and average the price on those days, with weights .

More precisely, the exponential moving average (EMA) is an infinite sum going back, where λ= 1 − (2/(N + 1)). We will mainly use the SMA for our elementary analysis. Now, a very simple and well-known indicator based on the SMA is as follows. Let S and L be two positive integers, S < L, and consider SMA(S) and SMA(L) . For example, one can set S = 50 and L = 200 and consider the 50-day and 200-day simple moving averages. Our indicator is the difference.
Algorithm 1: Ind = SMA(50) − SMA(200). If Ind > 0 be in, else be out.
Algorithmic trading in general is covered in hundreds of sources, for example the books Chen (2009), Donadio (2020). This specific algorithm has been well-known for decades, and is mentioned for example in Investopedia (2021) and Fidelity (2023). In fact, the Fidelity post Fidelity (2023) of June, 2023, even declared that we were in a new bull market, based on such an analysis. While this is just one prototype trading algorithm based on moving averages, our tests show this particular one only has a modest performance in actual trading. While using two time periods is standard in algorithmic trading, this is not a limitation; three are used in Qinsti (2023), while Vecv (2023) employs up to six time periods (3, 8, 20, 50, 100, and 200 days) to read the market trend at multiple scales. Based on this core concept, we have developed an elaborate system, building a suite of 25 individual trading algorithms, each using a decision logic based on conditional statements with inequalities utilizing up to four moving average periods, each an elaboration of Alg. 1. These can be further refined based on a variety of discrete parameters (such as the specific moving average periods, etc.), to create a suite of over 1000 individual trading algorithms. which we call FastHedge. In previous papers, we were able to obtain a stunning 20% annual return, far exceeding the market, with a maximum drawdown of 40%, well below market drawdowns, over a period of 40 years (ending in 2023). For 50-year simulations ending in 2023, see section 5. We will use these same methods in our simulations here.
3. Great Investors and Great Returns
There have been many great investors (and investments) in history. We will mention only a few for illustration. The majority of these investors used a strategy called value investing, of which Warren Buffett is perhaps the greatest practitioner. Like rock stars, they glitter in the financial world. Investopedia (2024) has compiled a short list, suitable for our purposes. In this section, we also review some of the top performing mutual funds, ETFs, and stocks. We will discover that while some investors/investments can get amazing returns for a period of time, say up to 10 years, few investors or investments can sustain that for decades, stretching to a typical lifetime of investment, on the order of 40 years. But it will be our task to set up a systematic yet simple way to do just that.
3.1. Average Investor
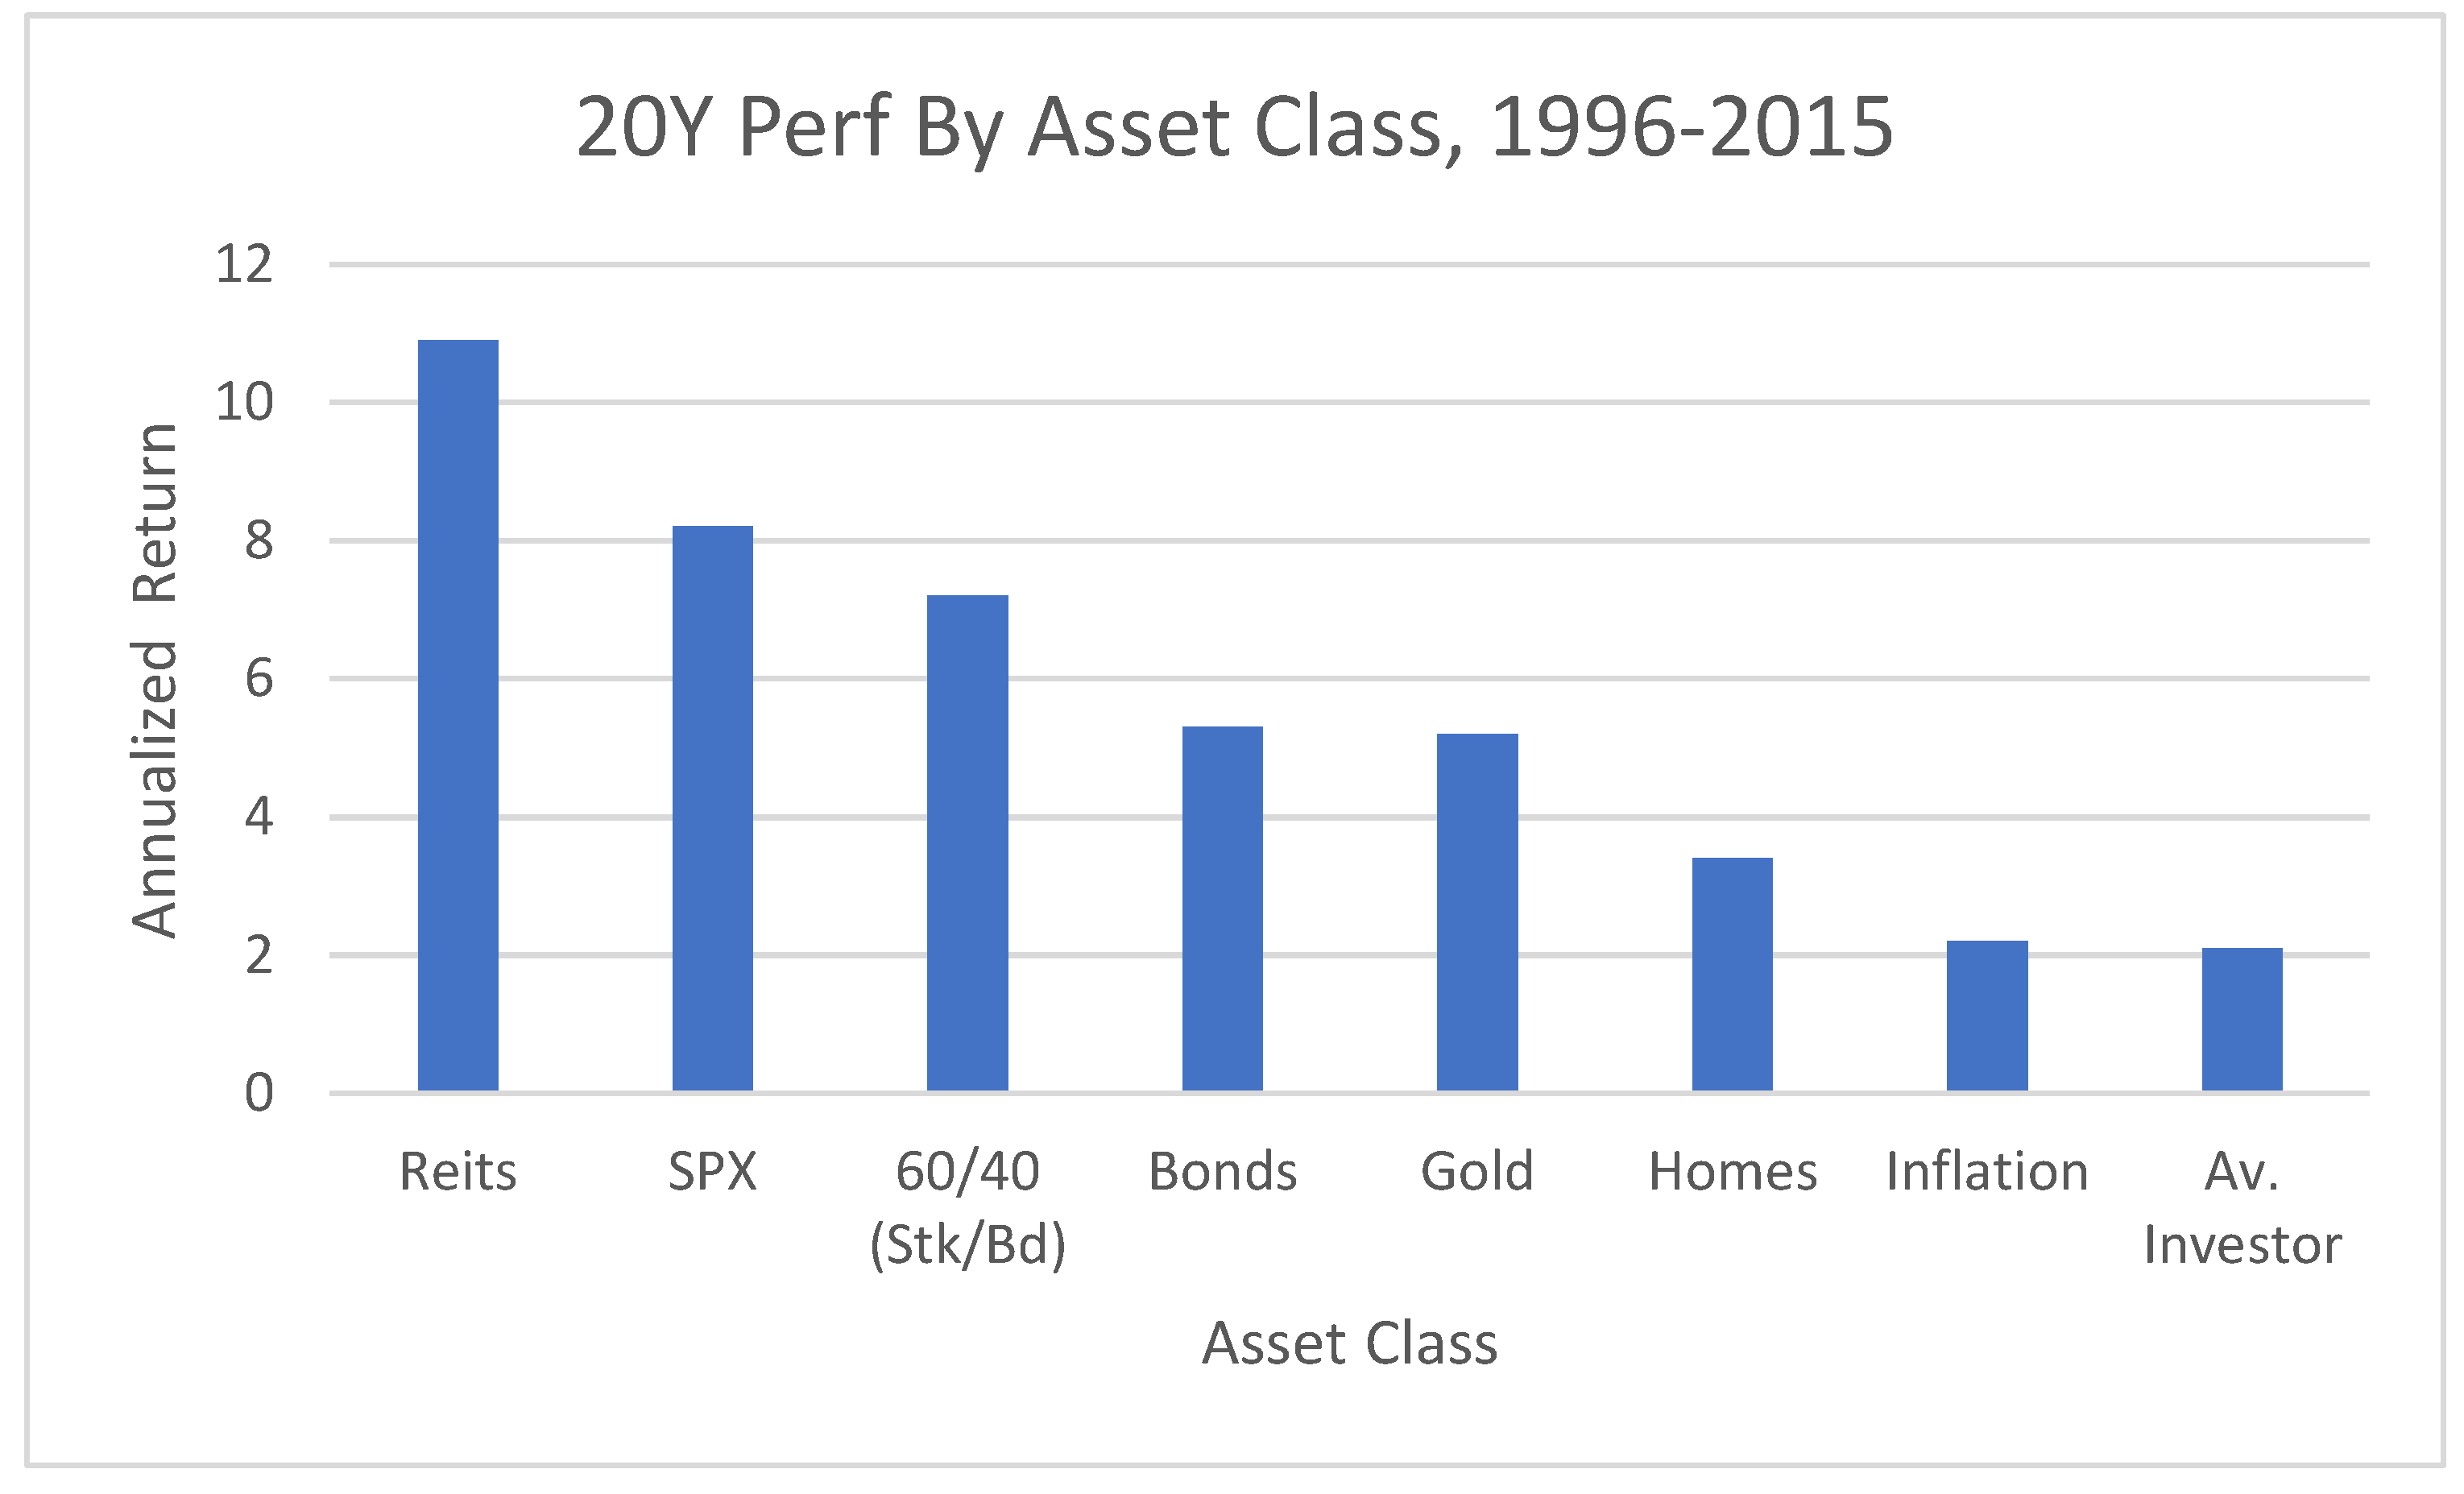
Before we discuss great investors, we put this in perspective by reviewing the plight of the average investor. Several recent studies have pegged their return as 5% or less; Topiwala and Dai (2022). For the 20-year period 1996-2015, it was even worse, just 2.1%, even below inflation.
Figure 2.
20-Year performance by asset class, 1996-2015. In this period, the average investor lost money to inflation. Source: Crews Bank and Trust.
Figure 2.
20-Year performance by asset class, 1996-2015. In this period, the average investor lost money to inflation. Source: Crews Bank and Trust.
3.2. Benjamin Graham
He authored the now famous book, The Interpretation of Financial Statements, in 1937 Investopedia-2 (2021), which laid the foundations of value investing. His work inspired many, including Buffett.
3.3. John Templeton
Where other investors saw a failed company, John Templeton saw an opportunity, to buy on the cheap and turn it around (called contrarian investing). He started the Templeton Growth Fund in 1954, which averaged 15% annual return for 38 years. He was very well traveled, and became a powerful international investor, especially in emerging markets.
3.4. John Bogle
Bogle founded the Vanguard family of funds in 1975, eventually making it into one of the largest fund families. Based on a challenge by economist Paul Samuelson in 1974, Bogle created the world’s first index fund, tracking the S&P500 index, with an eye to help the small investor get market returns at a low cost. He is known as the father of indexing (Investopedia).
3.5. Peter Lynch
Lynch ran the now famous Fidelity Magellan fund for 13 years (1977-1990), earning a sensational average return of 29%. He is also known for his charming book, One Up On Wall Street, 1989. At the same time, the fund itself grew from $20M to $14B under his stewardship. “The key to making money in stocks is not to get scared out of them.” He would hold stocks till he got up to 10X his investment back (what he called a “10 bagger”). Remarkably, he “retired” at age 46 (the age his father died).
3.6. George Soros
Soros had an unusual style of investing, using heavy leveraging and placing bets on the direction of the market. Since 1973, he ran what became the Quantum Fund, a “hedge” fund, whose estimated annual return over nearly 3 decades is 31%.
3.7. Warren Buffett
Often called the “Oracle of Omaha,” and founder of investment company Berkeshire Hathaway, Buffett has a disarming way of speaking (and acting), yet since 1965, he has managed to compile an annual return of nearly 20%, using and refining ideas on value investing initiated by Graham. In short, he would buy strong companies that had competitive advantages (which he called “moats”) that would allow them to prevail, and hold on to them for years. He never worried about downturns, which for him were not dangers but opportunities. What is truly striking is his humility and candidness. He is the billionaire for the common man and woman.
3.8. Some Top Performing Mutual Funds
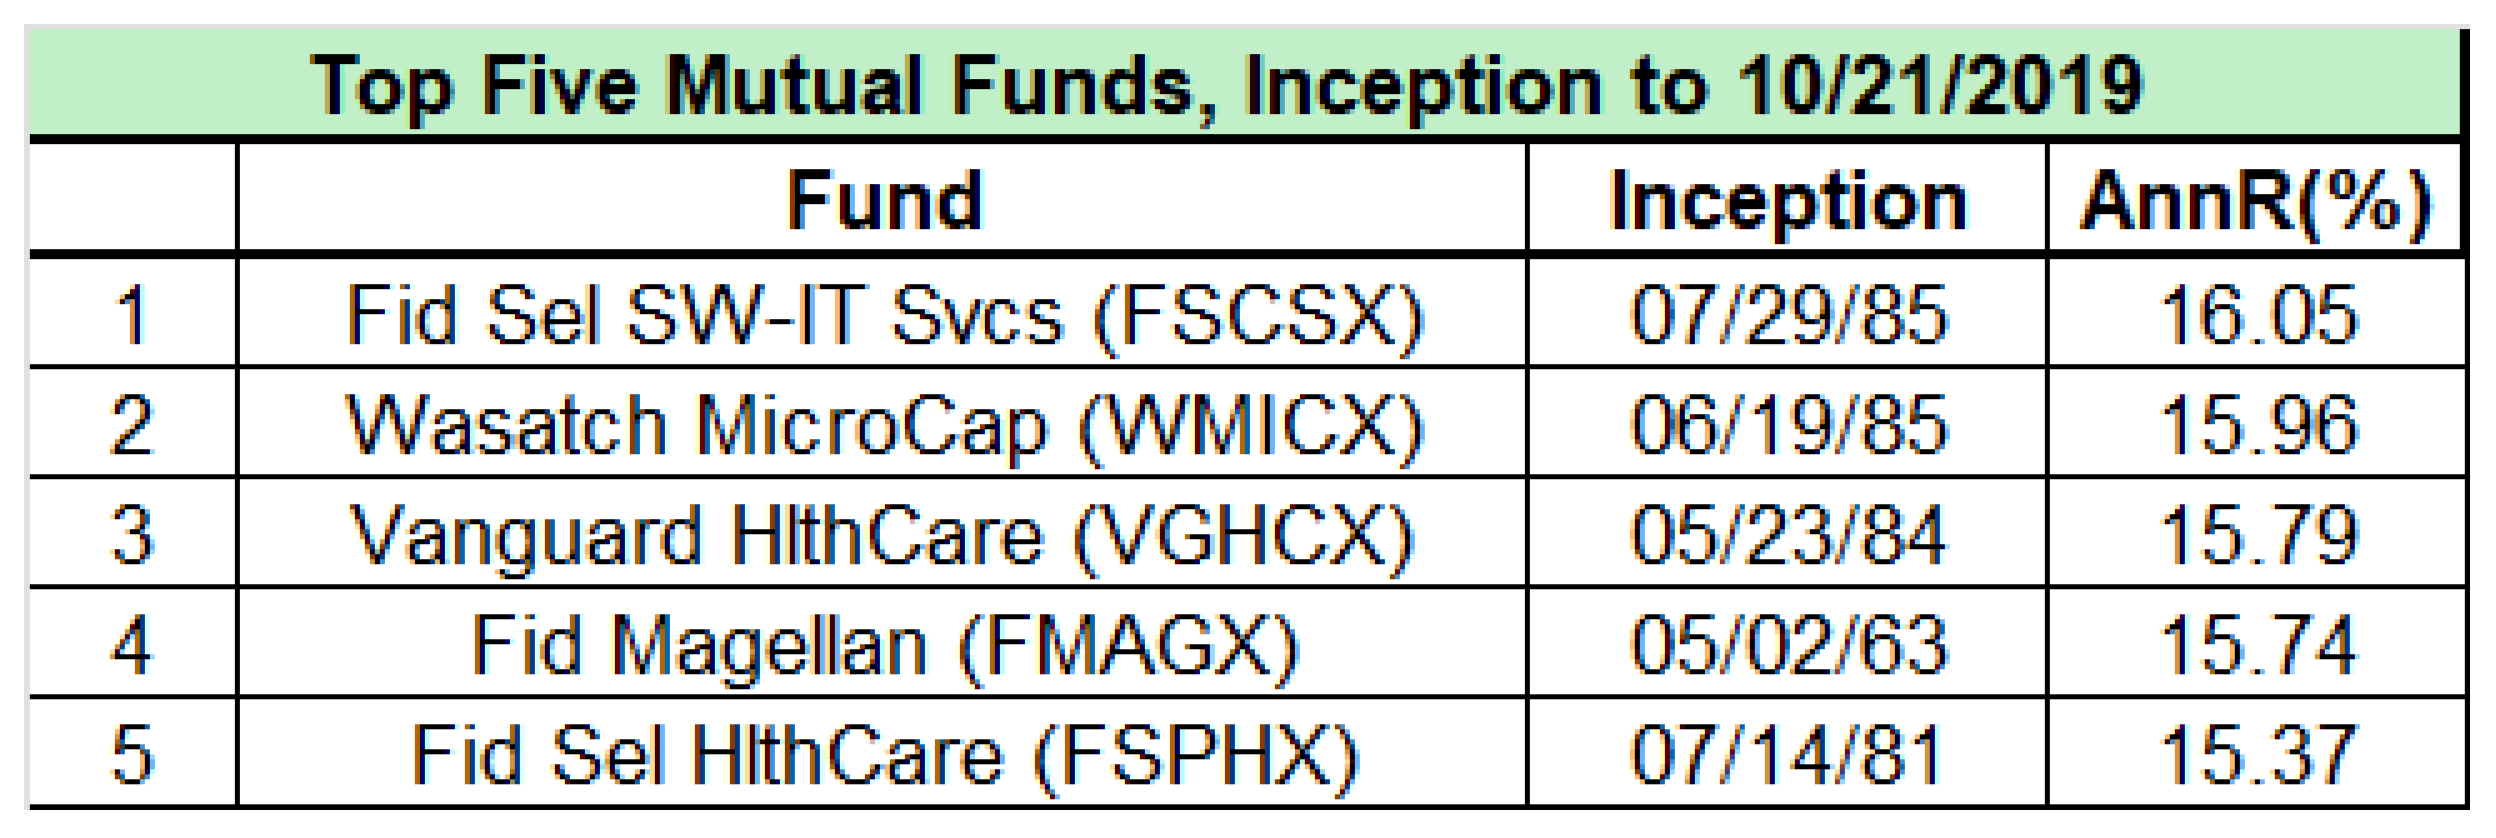
We have already seen that under Peter Lynch, the Fidelity Magellan Fund achieved a stunning 29% annual return during his 13-year tenure. But if you look over many decades, while still a top performer, its return comes to just under 16%. Here we list just the top five performing mutual funds, as compiled by Kiplinger, based on performance from inception to October 21, 2019 (Kiplinger 2019). All of these handily beat the market over decades, a true accomplishment. The top performer, Fidelity Select SW-IT Services fund, FSCSX, has fully 25% of its assets in just one company: Microsoft. That will turn out to be fortuitous.
Figure 3.
Top 5 performing funds, from inception to 10/21/2019. Interestingly, the top performer, FSCSX, has fully 25% of its assets in a single company, Microsoft. Source: Kiplinger (2019).
Figure 3.
Top 5 performing funds, from inception to 10/21/2019. Interestingly, the top performer, FSCSX, has fully 25% of its assets in a single company, Microsoft. Source: Kiplinger (2019).
3.9. Top 10 Best performing ETFs over last 10 Years, ended 3/1/2024
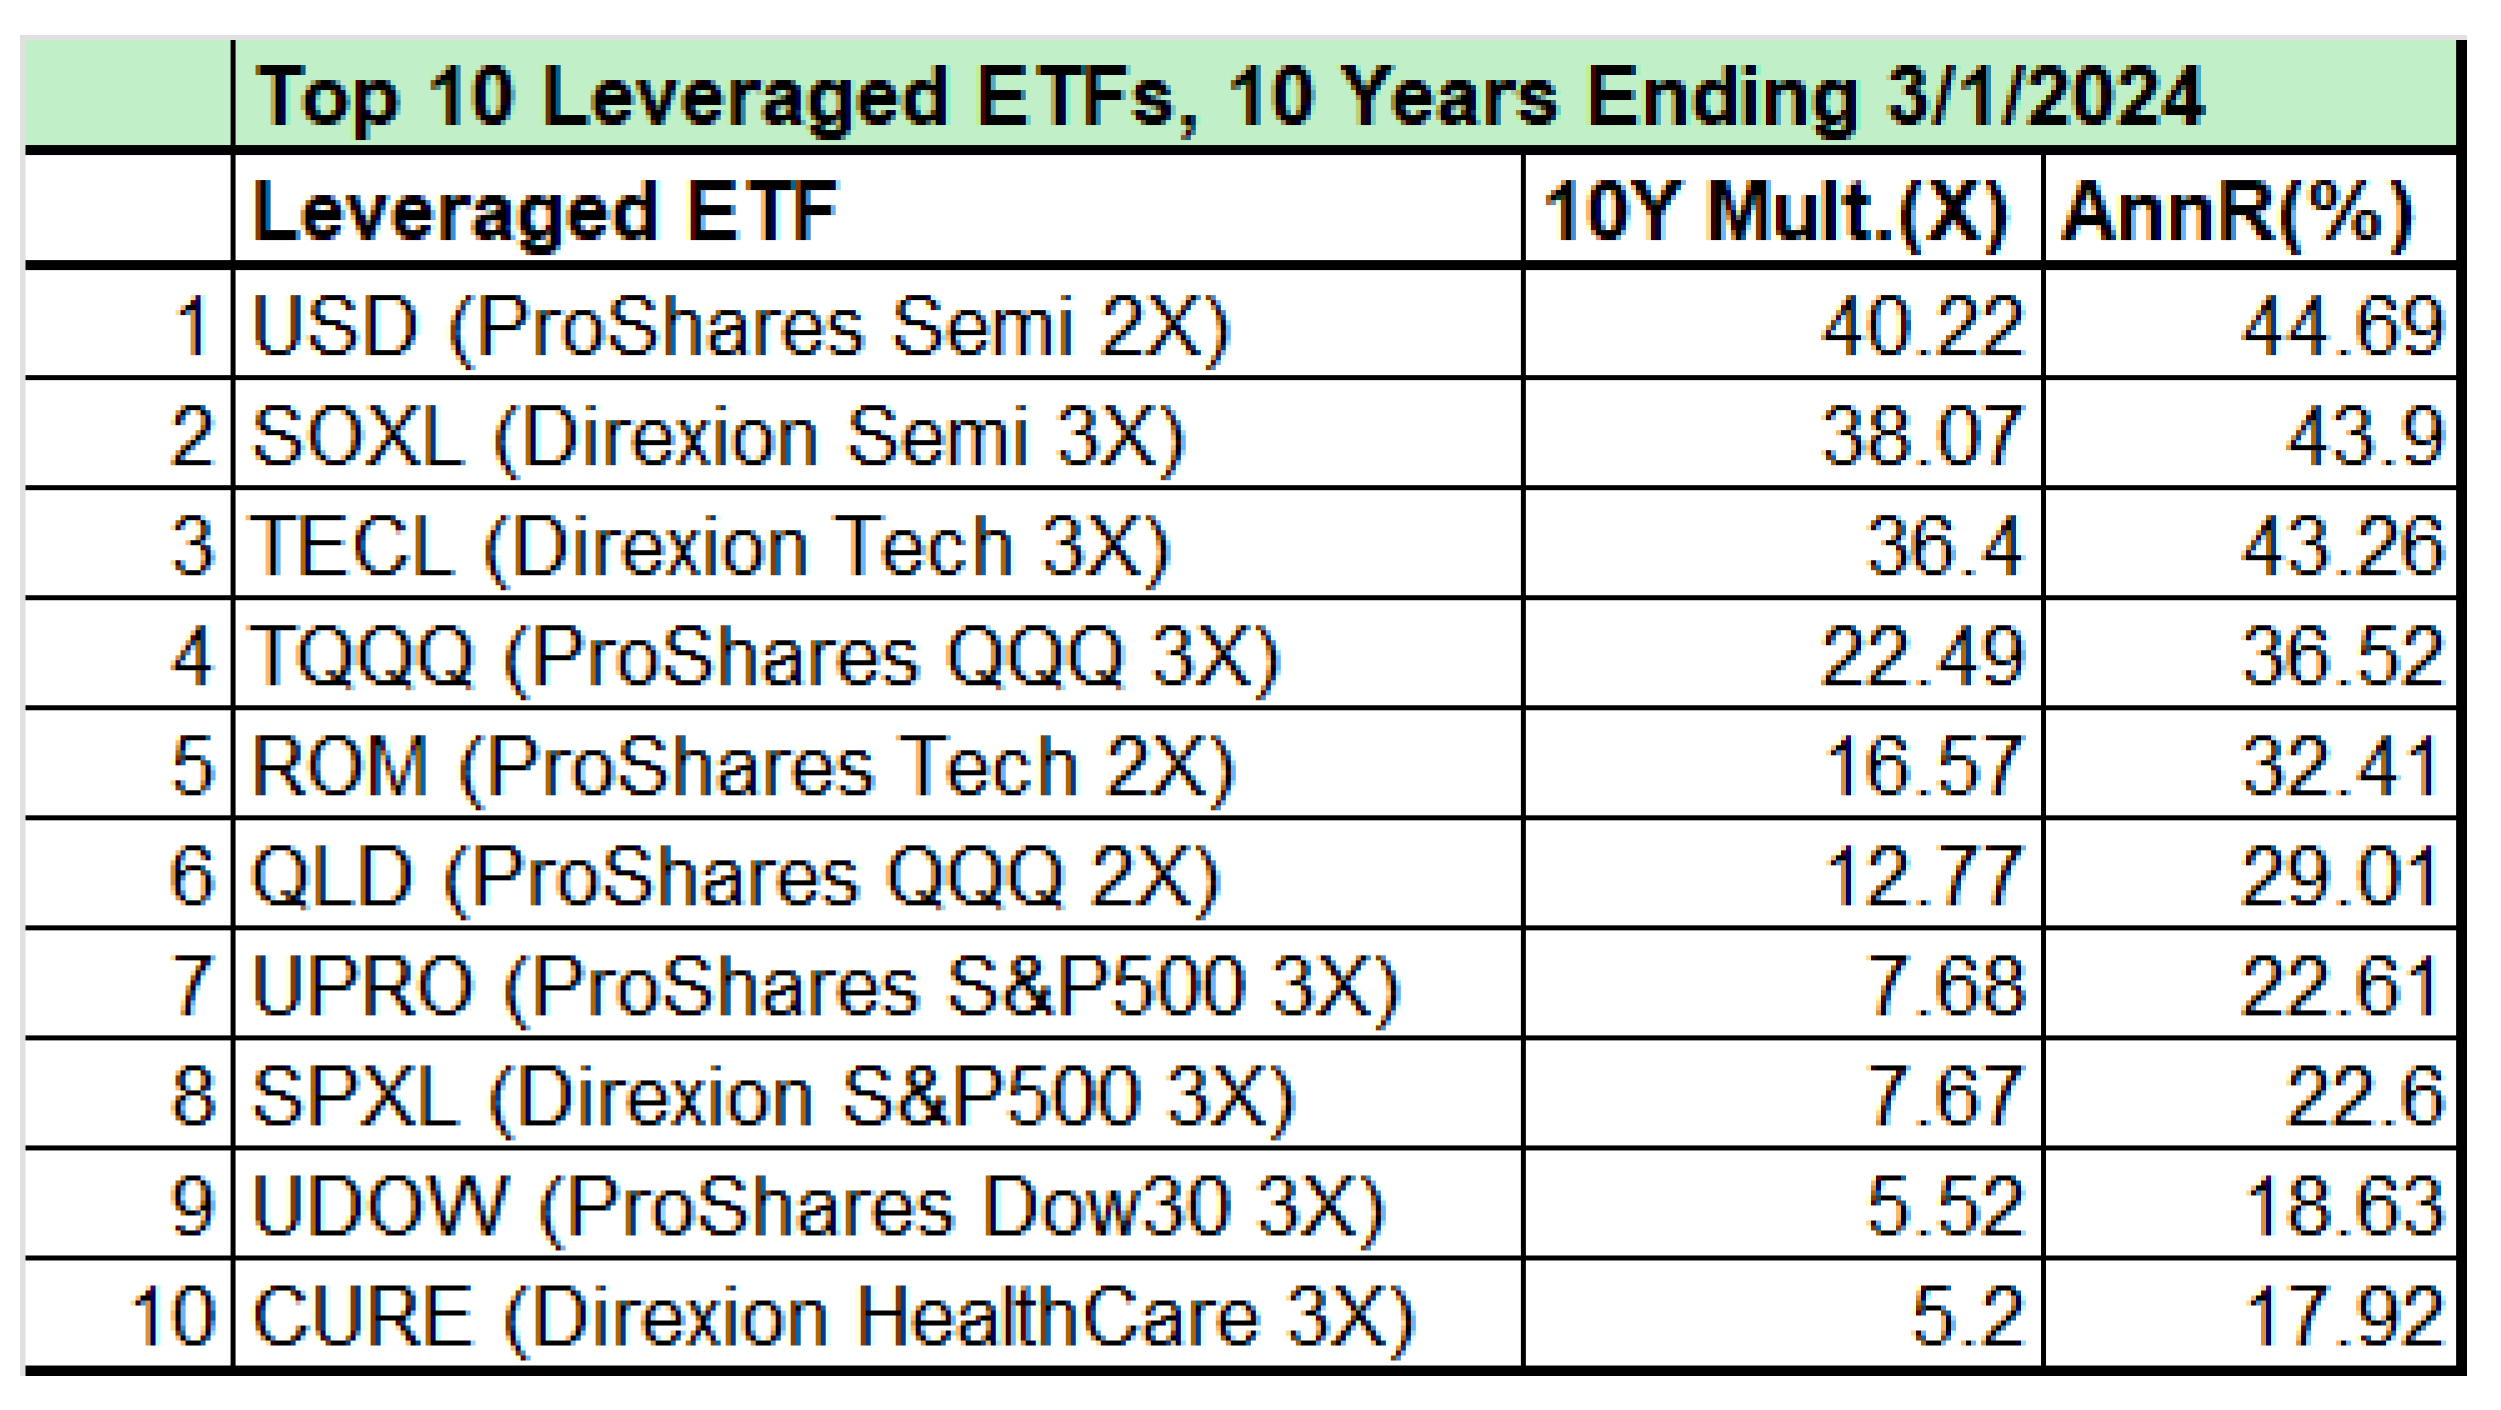
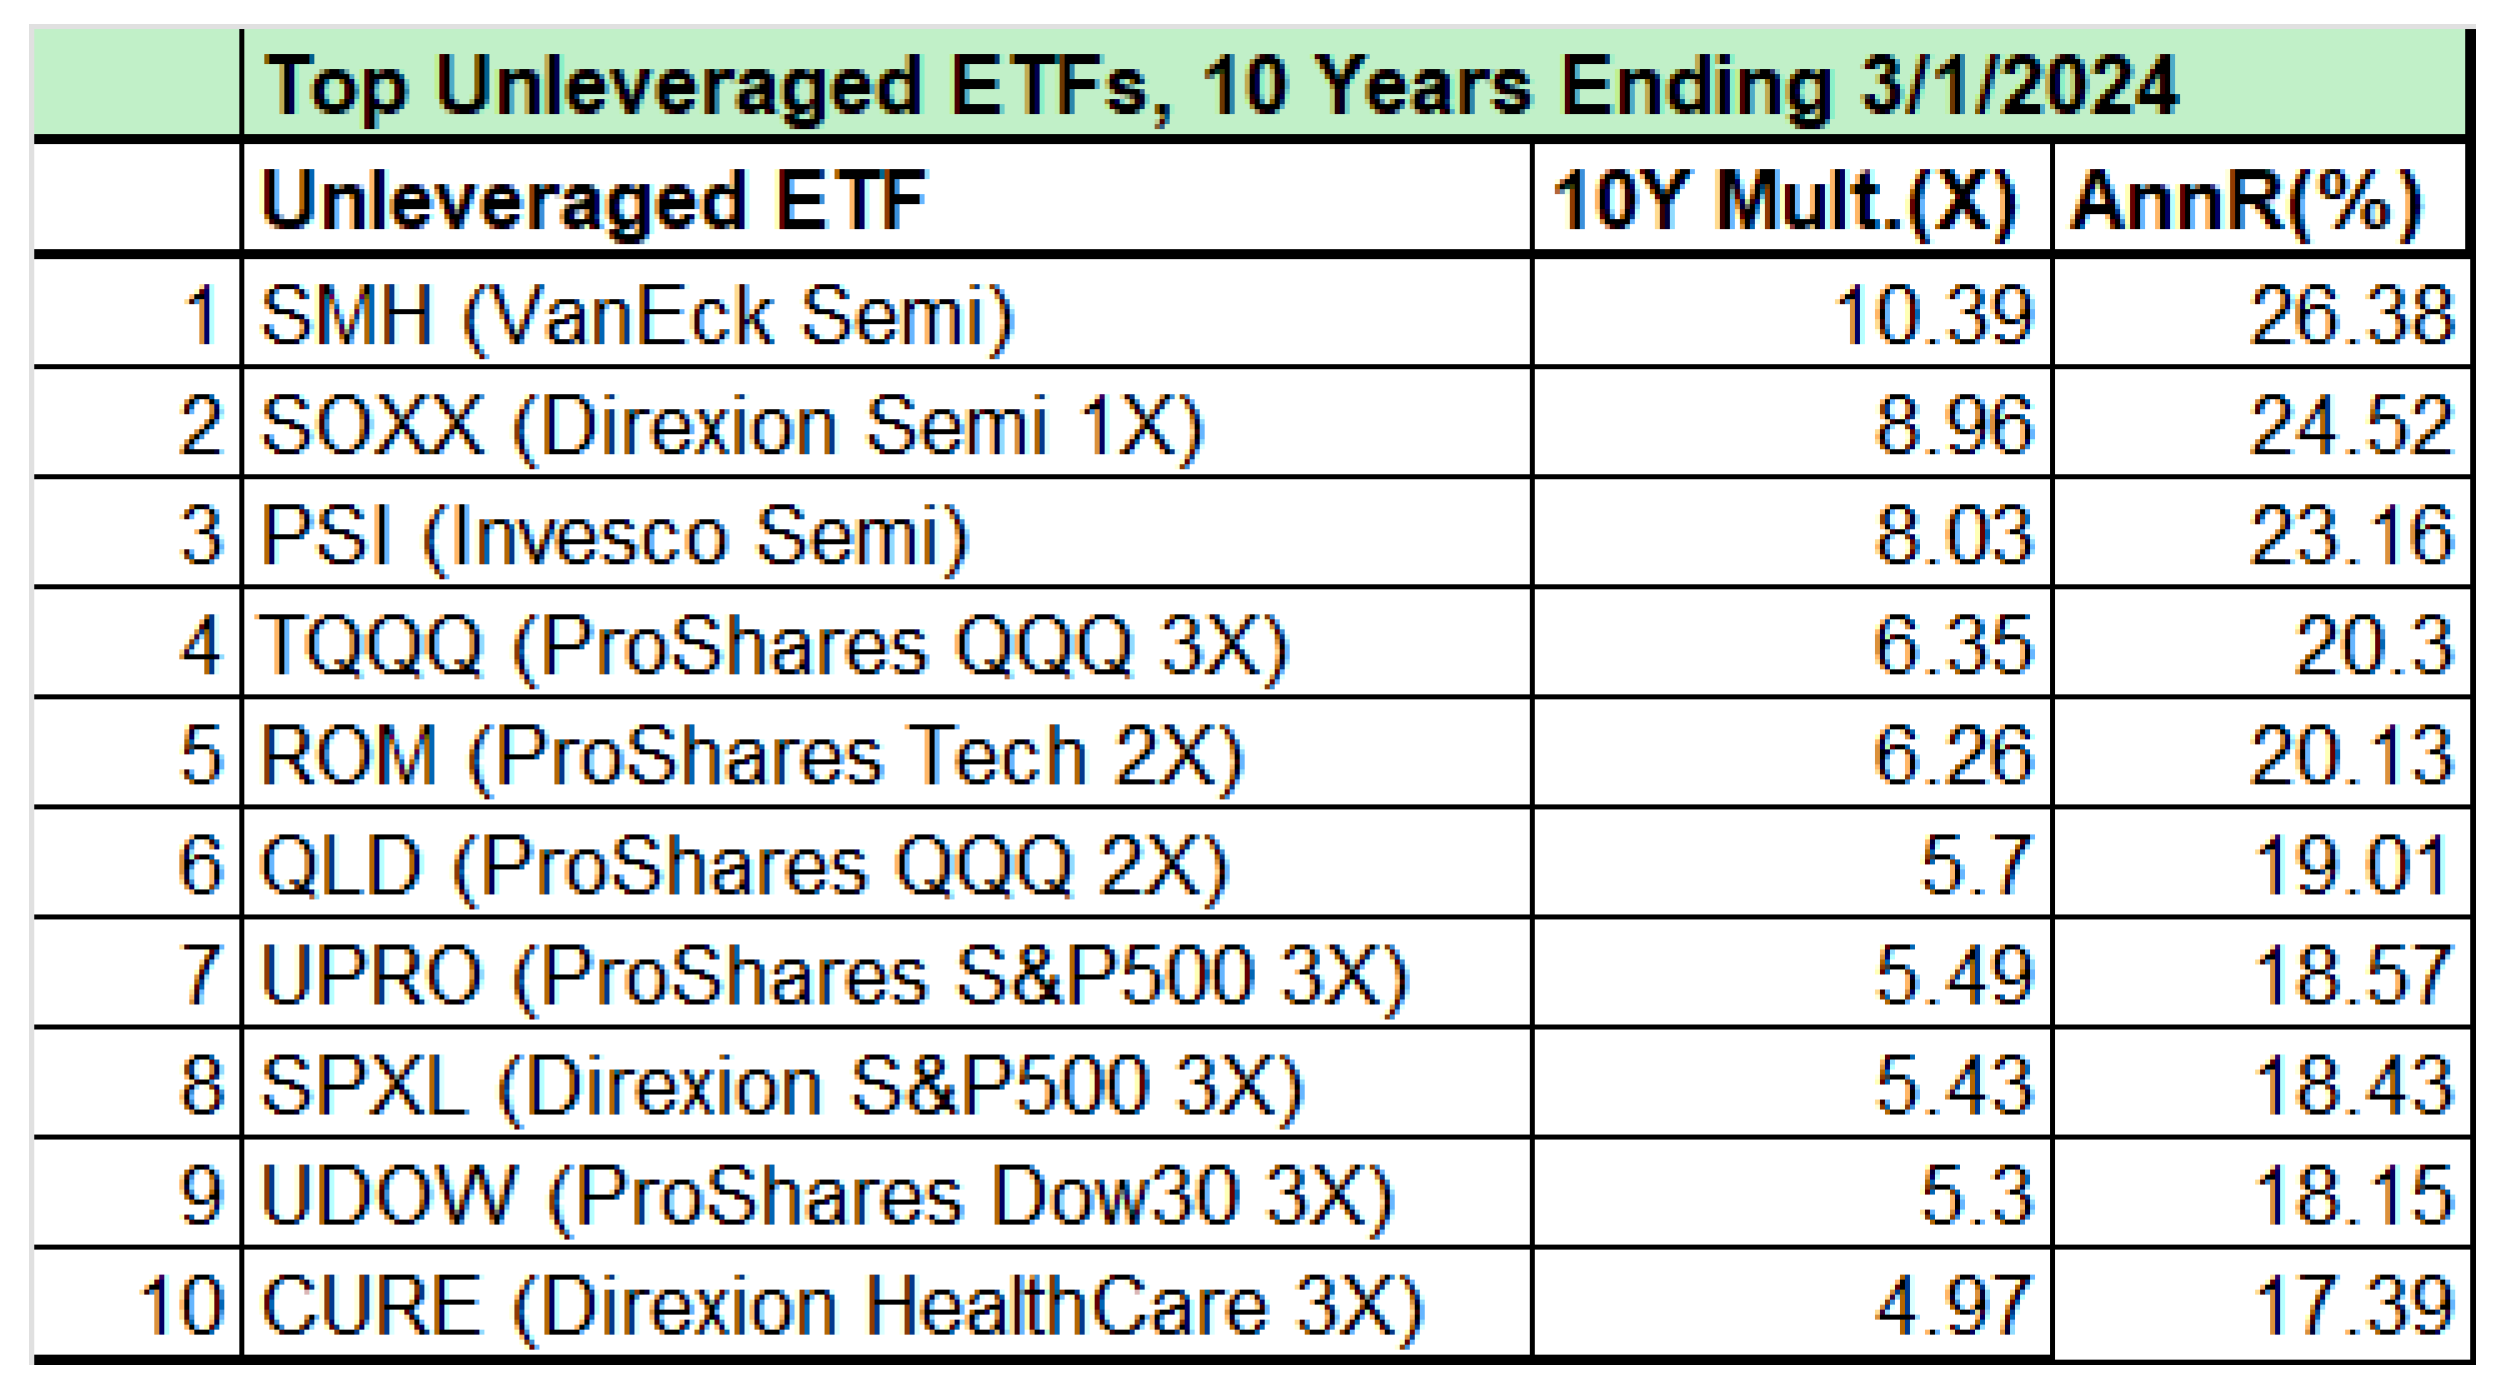
ETFs began in 1990 in Canada, and in 1993 in the US. Many of the top performing ETFs today have not been around long. We review below the top ETFs over the past 10 years. We present the top 10 leveraged ETFs, as well as the top 10 unleveraged ETFs of the last 10 years. These have astonishing returns, but with frightening drawdowns that few investors can stomach for long. Many of these top ETFs do not have 20-year histories yet (e.g., TQQQ was founded in 2010). Meanwhile, the benchmark index SPX achieved an average annual return of 10.7%.
Figure 4.
The Top 10 leveraged ETFs of the past 10 years, ending 3/1/2024. Source: ETFVest (2024).
Figure 4.
The Top 10 leveraged ETFs of the past 10 years, ending 3/1/2024. Source: ETFVest (2024).
Figure 5.
The top 10 unleveraged ETFs of the past 10 years, ended 3/1/2024. Source: ETFVest (2024).
Figure 5.
The top 10 unleveraged ETFs of the past 10 years, ended 3/1/2024. Source: ETFVest (2024).
Note that stellar annual returns for the past 10 years may not be indicative of longer-term performance, say 40 years, or even their full histories. Also, these high-flyers come with sky high volatility and deep drawdowns, which would be intolerable to most small investors; see
Figure 7 and
Figure 8 for some revealing full-history results.
3.10. Top Performing Stocks Over the Past 40 Years
While many top performing ETFs have not been around that long, many stocks have. The table below presents the top ten stocks by their 40-year performance, though not all have been around that long, e.g., NVDA was founded in 1993 only. Even MSFT, which was founded in 1975, only became public in 1986. Thus, for consistency, all stocks are measured from their public inception to 3/4/2024. Just the names are suggested by Statmuse, but all calculations are the author’s. The breathtaking growth (along with sky high volatility) of the top large cap stocks (those above $50B in valuation), shows that if one could find a way to select some of these gems (out of thousands) early on, and survive the scary drawdowns, one could get stellar returns. Indeed, AAPL has been Buffett’s single largest holding (as MSFT is for the fund FSCSX). That is what the best investors are doing, mostly by careful value investing. Curiously, while NVDA has the top AnnR in the group, HD is the unexpected long-term standout.
As mentioned, the small investor is not prepared to follow this approach successfully. But we find another way. Note that we have studied some of these stocks previously, in Topiwala-2 (2023). But to swim with sharks and compete with the best investors, this review does give us a target to aim for: a 20%+ annual return, over decades. With that, we can beat Buffett at his own game. Our analysis also hints that perhaps 20-30% AnnR may be a kind of limit of possible long-term performance. We are not aware of any investor achieving higher returns over extended periods such as 40 years or more. Jim Simons earned a net 39.1% annual return for the 30-year period 1988-2018, Zuckerman (2019); but his methods are entirely out of scope for small investors, involving extreme high-frequency trading. Moreover, his fund’s trajectory, and drawdowns, are less accessible. Note that for a similar 30-year period, the single stock NVDA gained a 36.12% AnnR, a breathtaking performance; see
Figure 6. But you’d have to be clairvoyant in the extreme to have seen that in 1993! By contrast, our methods need no superpowers. In comparing performance metrics in
Figure 6, it is interesting to observe that the Sharpe Ratio and our PARC agree on the top two performers (MSFT, HD), but part company from there. For Sharpe, NVDA is rated #3, but far lower by PARC due to its nearly 90% drawdown that few investors if any can stomach! Our #3 is the much safer DHR, delivering nearly 20% AnnR for 40 years, and MaxD=65.32%. Careful comparison of the two metrics over many tests has revealed that the PARC measure is much more reliable, at least for the small (and loss-averse) investor.
Figure 6.
Top 10 Best Performing Large Cap Stocks of the Last 40 Years but measured from inception to 3/4/2024. Curiously, while MSFT, NVDA, and AAPL are likely suspects, HD is the unexpected star. Source for names (and order): Statmuse (2024), but all calculations are the author’s.
Figure 6.
Top 10 Best Performing Large Cap Stocks of the Last 40 Years but measured from inception to 3/4/2024. Curiously, while MSFT, NVDA, and AAPL are likely suspects, HD is the unexpected star. Source for names (and order): Statmuse (2024), but all calculations are the author’s.
4. Head-to-Head with Buffett’s BRK-A Fund, 1980-2024
We now carefully study Warren Buffett’s fund BRK-A against a set of 3 FastHedge models, and consider the 44-year period 1980-2024 (3/17/1980 – 3/4/2024, or 11084 trading days), the longest period for which BRK-A data is available. (Buffett’s own track record dates to 1965.) For convenient comparison, we also chart some of the leading funds and stocks we have mentioned: FSCSX, USD, SMH, and MSFT. Note that for simplicity, we used a single underlying FastHedge trading model (out of 25 core models), and varied only the level of leverage: we set Lev = 1, 2, 3, respectively for FH1, FH2, FH3 (where Lev=1 means no leverage). There are many ways to achieve leverage, especially using derivatives, but for the small investor, just mix QQQ with TQQQ as needed.
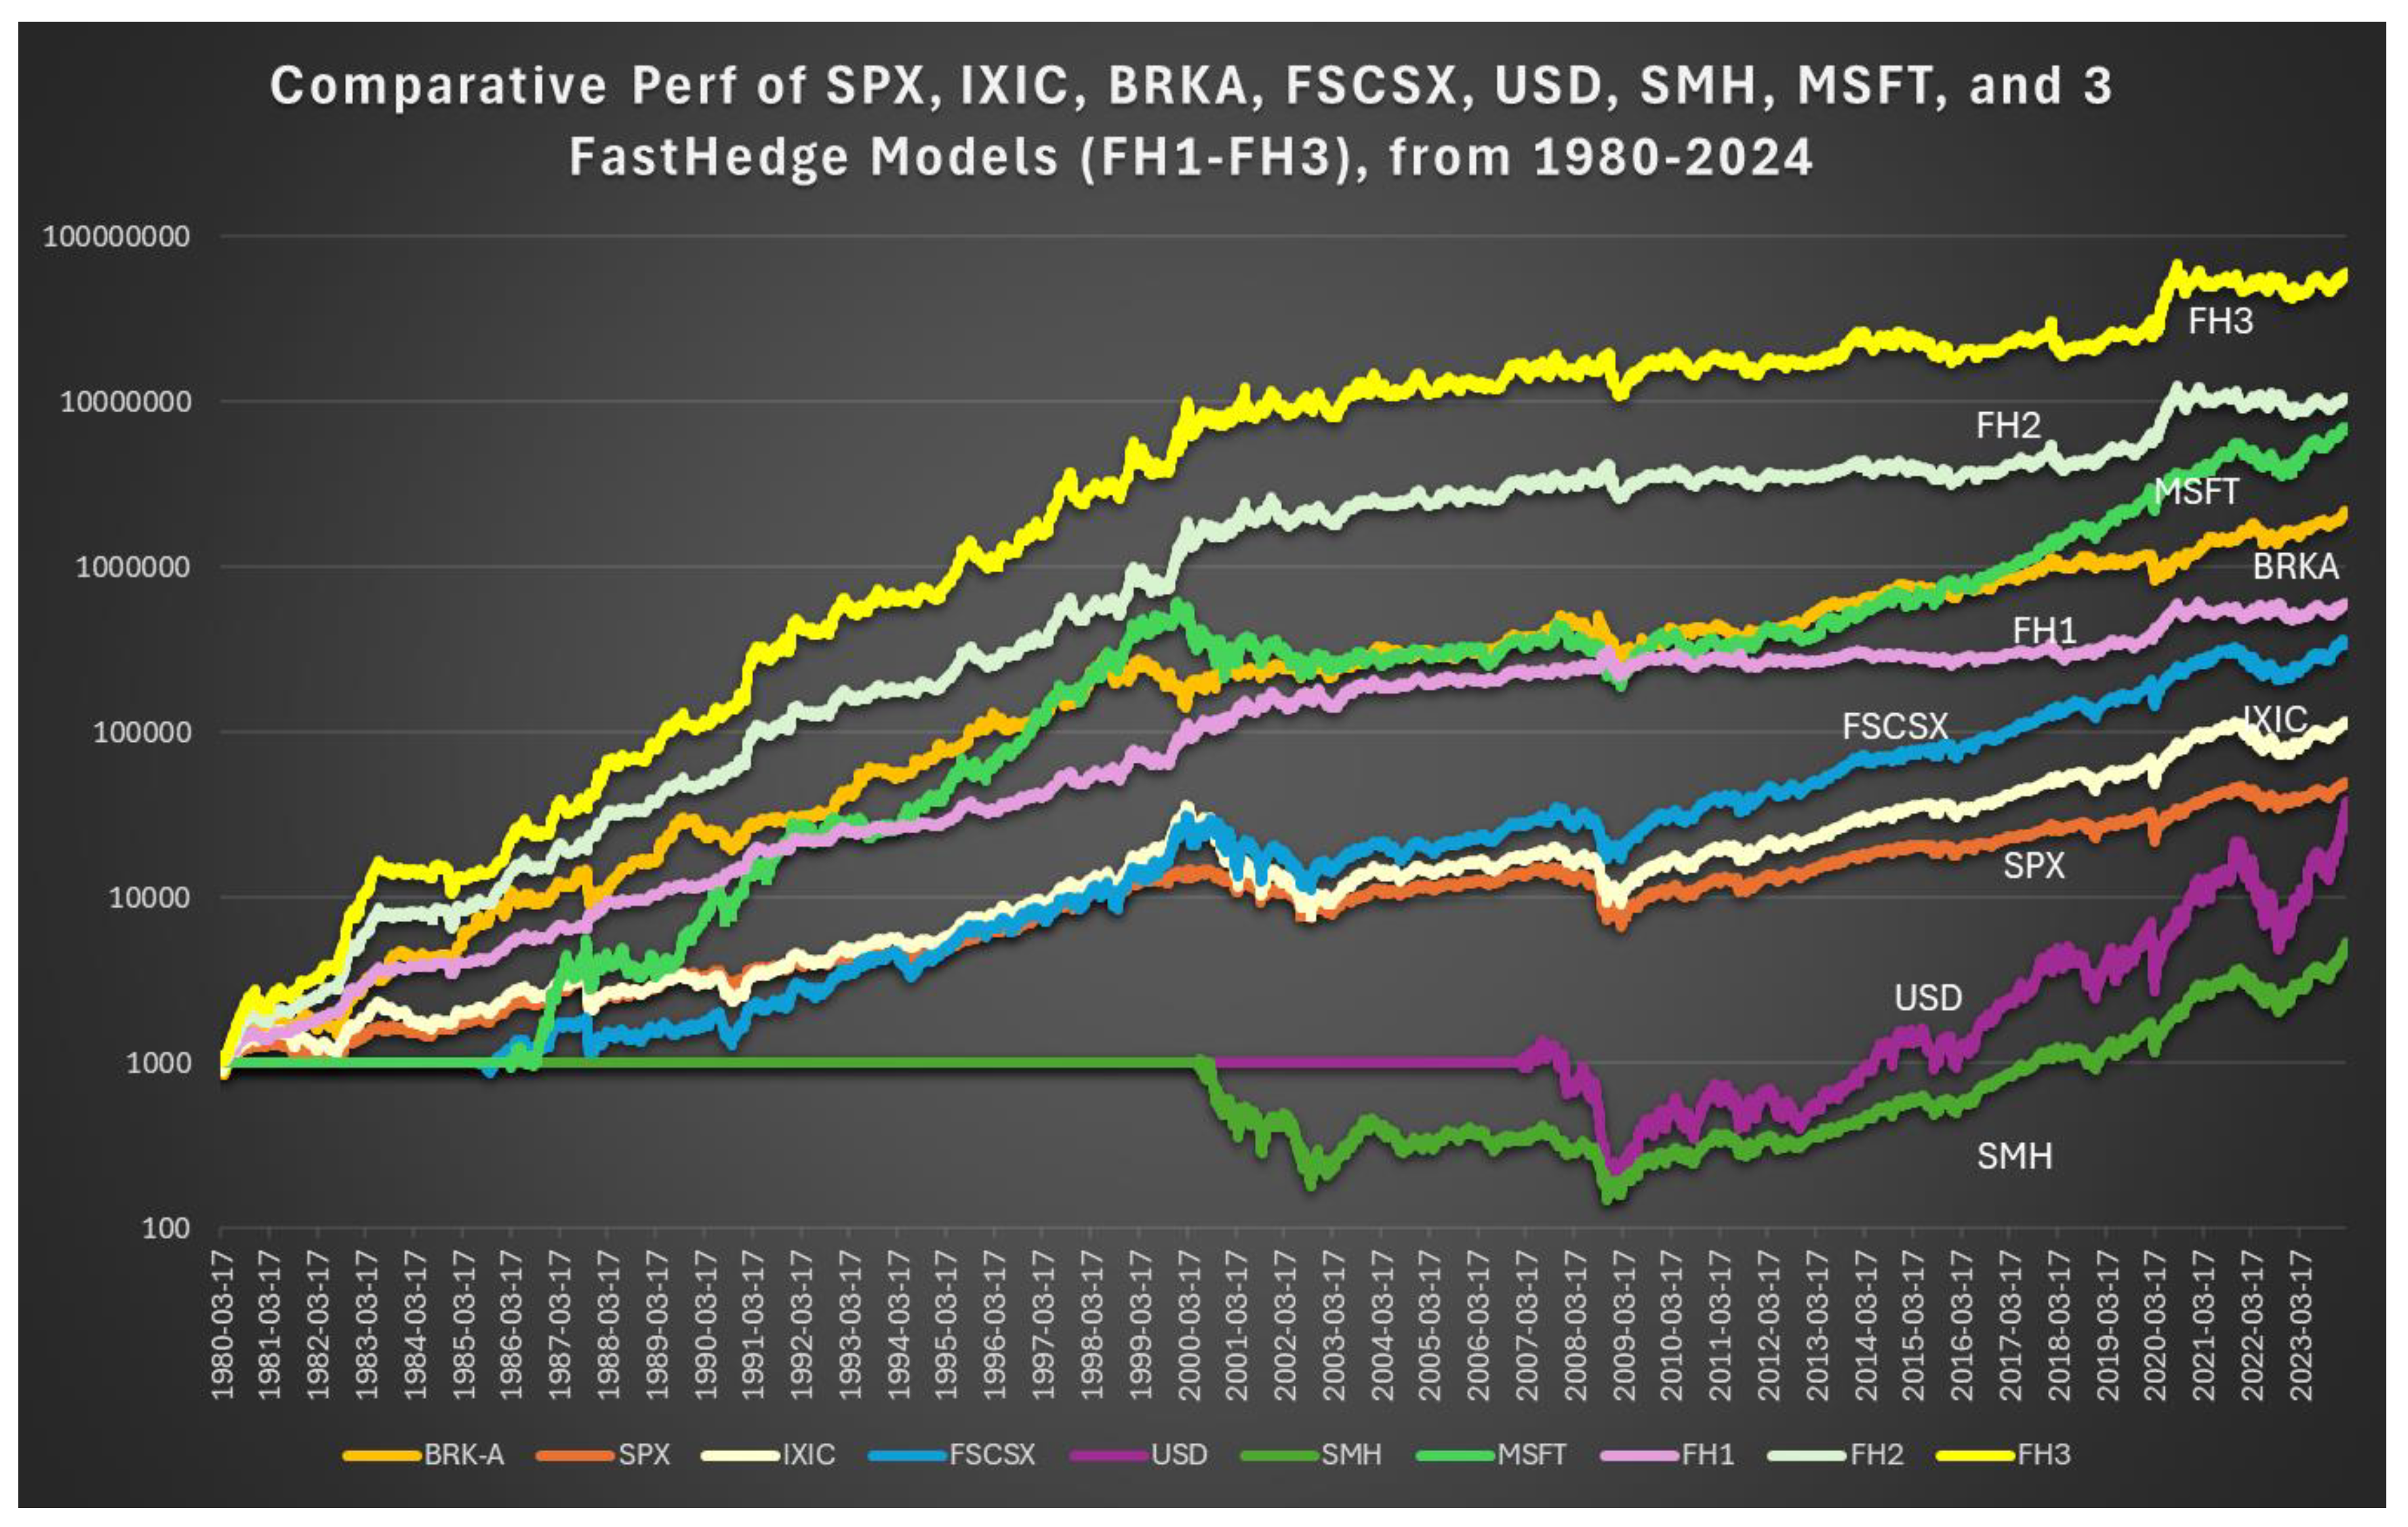
How do we do? Even the unlevered FH1 nearly keeps up with BRK-A, while FH2, FH3 soar well above (
Figure 7), yet with lower drawdowns (
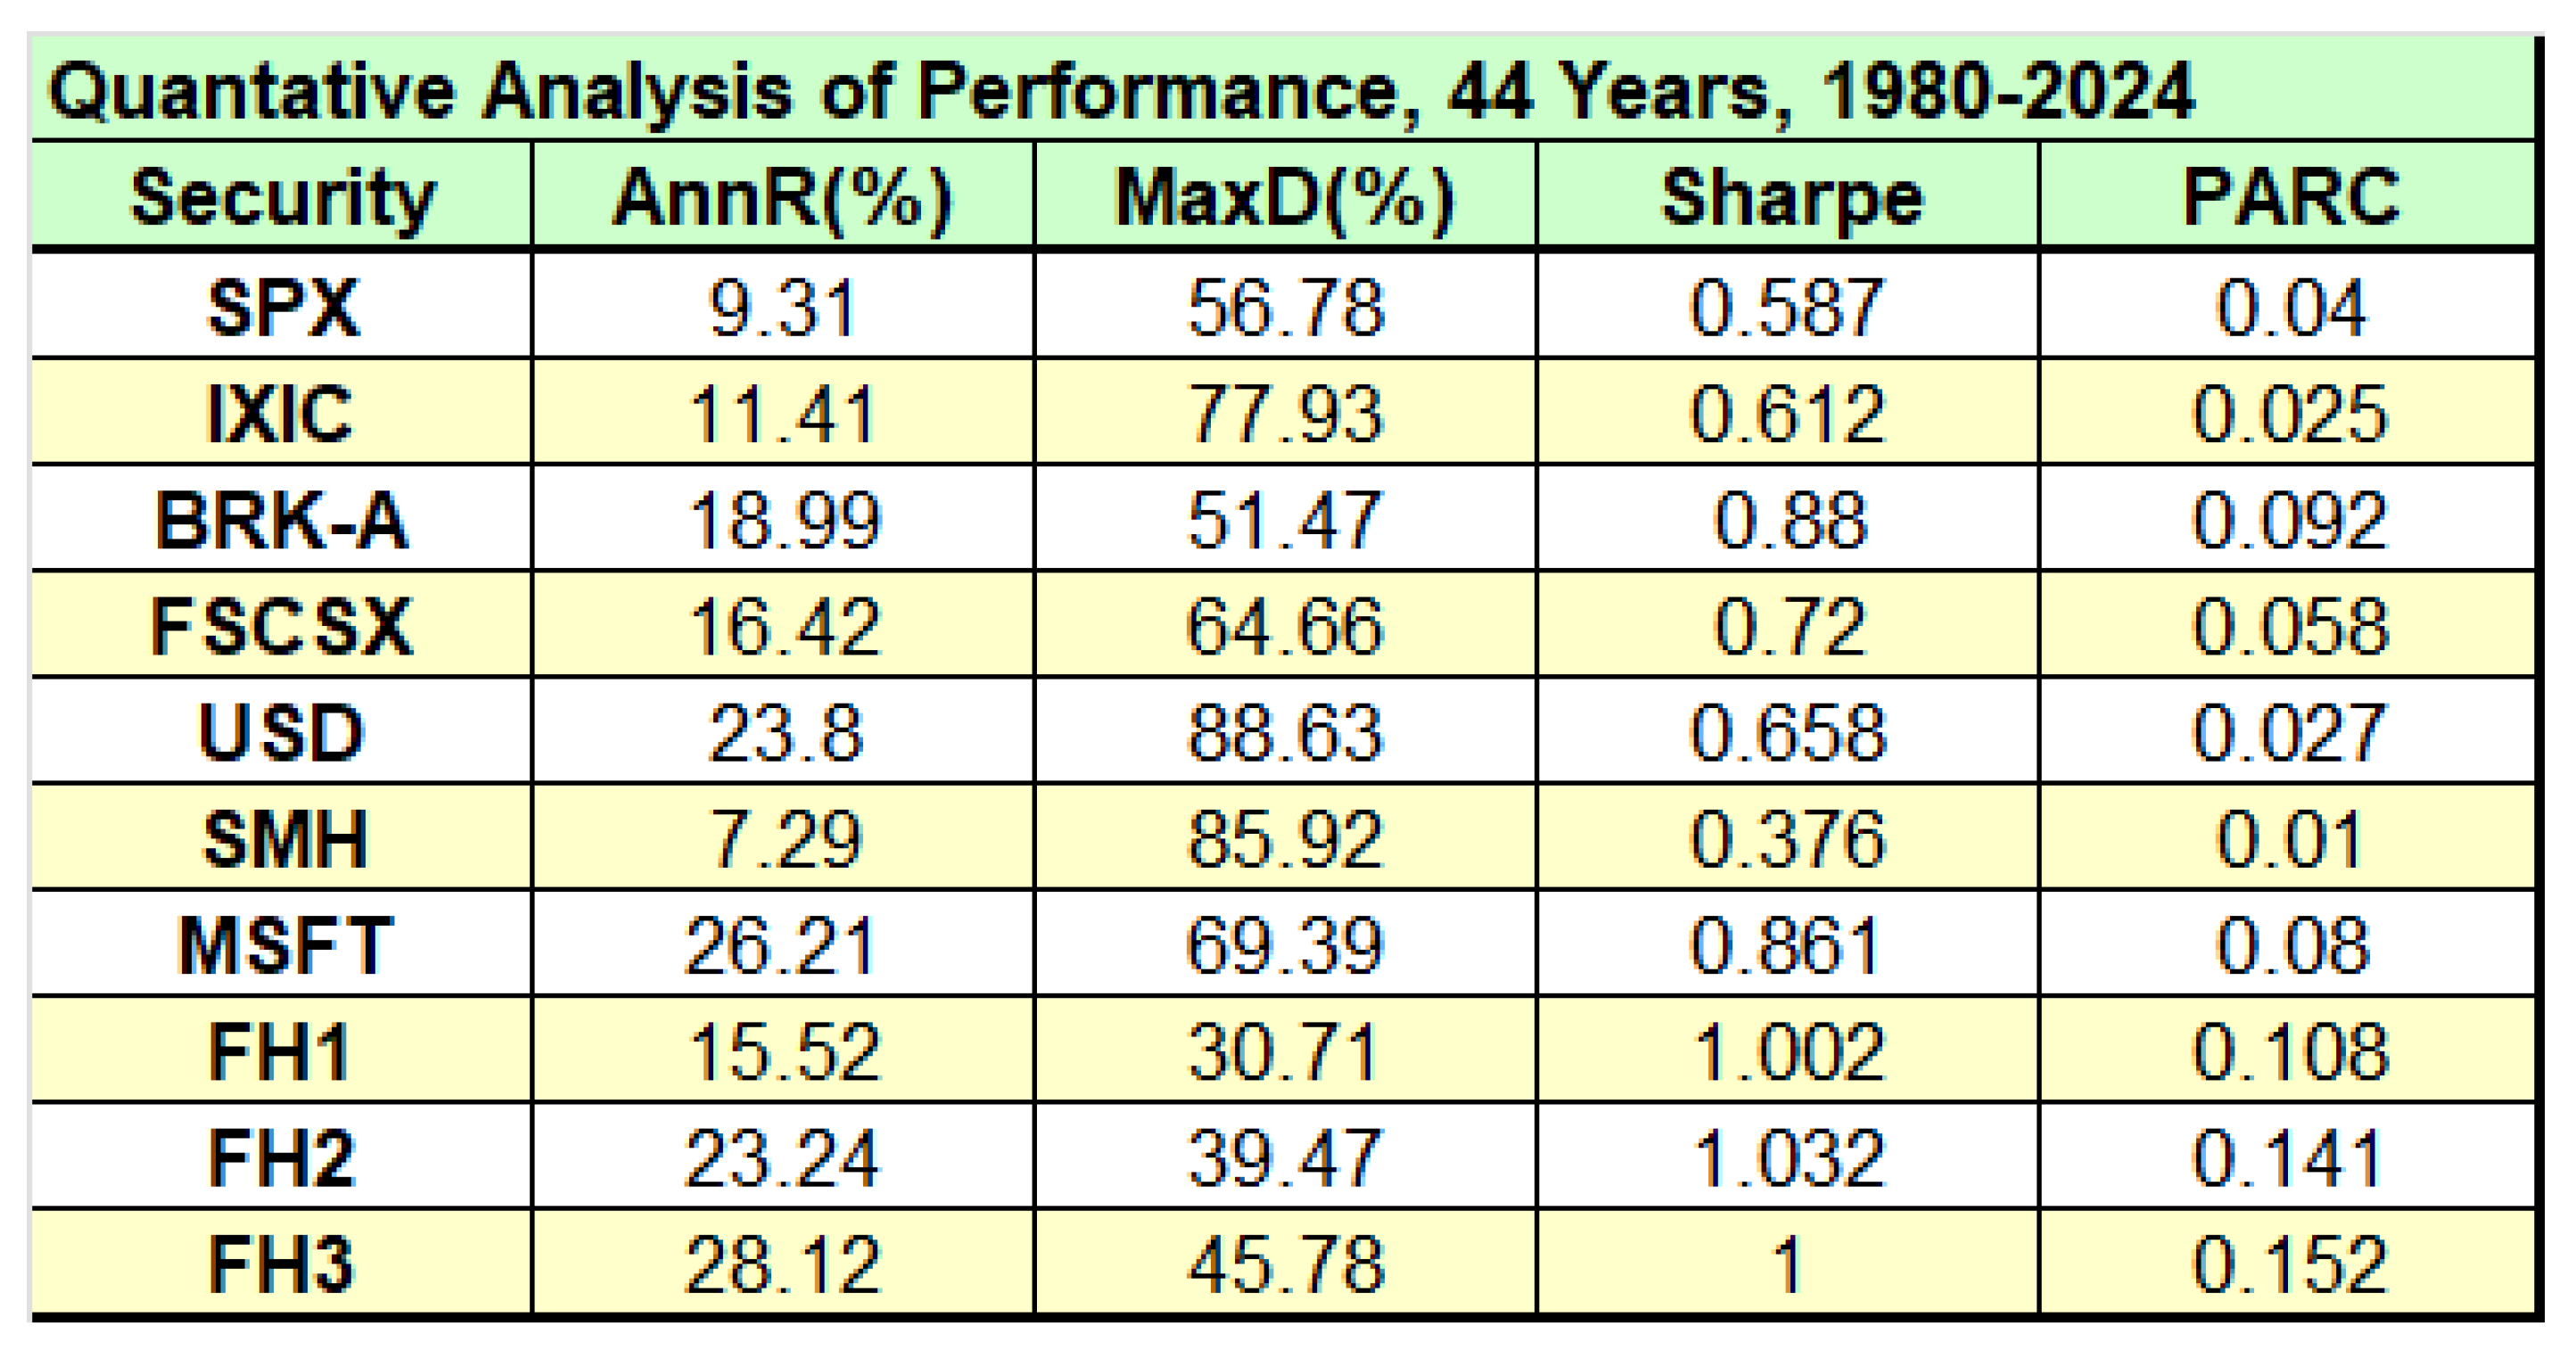
Figure 8)! In comparing Sharpe and PARC metrics, they both agree the FH models are best (though split hairs on the order), then BRK-A and MSFT, etc. But Sharp rates the IXIC index higher than SPX, even with its 77.93% MaxD! As expected, PARC penalizes that severely, and rates SPX higher. The reader may recall that this massive drawdown occurred during the 2000 Dotcom Crash, a time when fortunes large and small were severely tested, and many wiped out. Fortunately, looking at the graphs (and numbers) in
Figure 7,
Figure 8 and
Figure 9, the FH models all successfully navigate this and all other Black Swan events (and actually profit during Dotcom), while delivering excellent returns. The hapless SMH, so powerful in the last 10 years, was just launched at the worst possible time during the Dotcom bubble, took a terrible dive, and is ranked last by both Sharpe and PARC. Similarly, USD launched near the 2008 Financial crisis, took a deep dive, then finally rallied. Again, Sharpe rates it above SPX, even with its 88.63% MaxD, but not PARC. Slow and steady wins the race. Or, in the case of FH models, fast and steady.
Figure 7.
Comparative performance of SPX, IXIC, BRK-A, FSCSX, USD, SMH, MSFT, along with 3 FastHedge Models (FH1-FH3), over the 44-year period 1980-2024 (3/17/1980-3/4/2024). Growth of initial
$1K investment. Note that MSFT, FSCSX, SMH, and USD had increasingly later start, the last two with big drawdowns. FastHedge models greatly outperform, especially FH2, FH3, and do so with remarkable stability. These graphs are quantified in
Figure 8.
Figure 8.
Quantative analysis of the performance of the results in
Figure 7, 44-year period 1980-2024 (3/17/1980-3/4/2024). Just looking at AnnR and MaxD, we can see that BRK-A and the FH series are excellent long-term investments, while some others have high to frightening MaxD. For late-start securities FSCSX, USD, SMH, and MSFT, we used the actual dates since inception to compute the AnnR, so all metrics are correct, and comparable.
Figure 9.
The explicit trades of the FH models during the 11084 trading days of 1980-2024 (252/yr). Our model detects nearly all downturns, and goes short (blue=long values, red=short values), as superimposed on the IXIC index price history. These trades apply to all FH1-FH3.
Figure 9.
The explicit trades of the FH models during the 11084 trading days of 1980-2024 (252/yr). Our model detects nearly all downturns, and goes short (blue=long values, red=short values), as superimposed on the IXIC index price history. These trades apply to all FH1-FH3.
We note that our comparison to BRK-A is just for illustrative purposes and is in no way intended to take anything away from the masterful job Warren Buffett (and Charlie Munger) have done in running Berkeshire Hathaways, for many decades. But its best years came early. In many ways it is now a victim of its own success. As Buffett himself has written in his 2024 Letter to Shareholders: “Berkshire now occupies nearly 6% of the universe in which it operates… There remain only a handful of companies in this country capable of truly moving the needle at Berkshire, and they have been endlessly picked over by us and by others… we have no possibility of eye-popping performance.” Buffett (2024). The intrepid small investor actually has the advantage.
5. Additional Results For The 50-Year Period 1973-2023
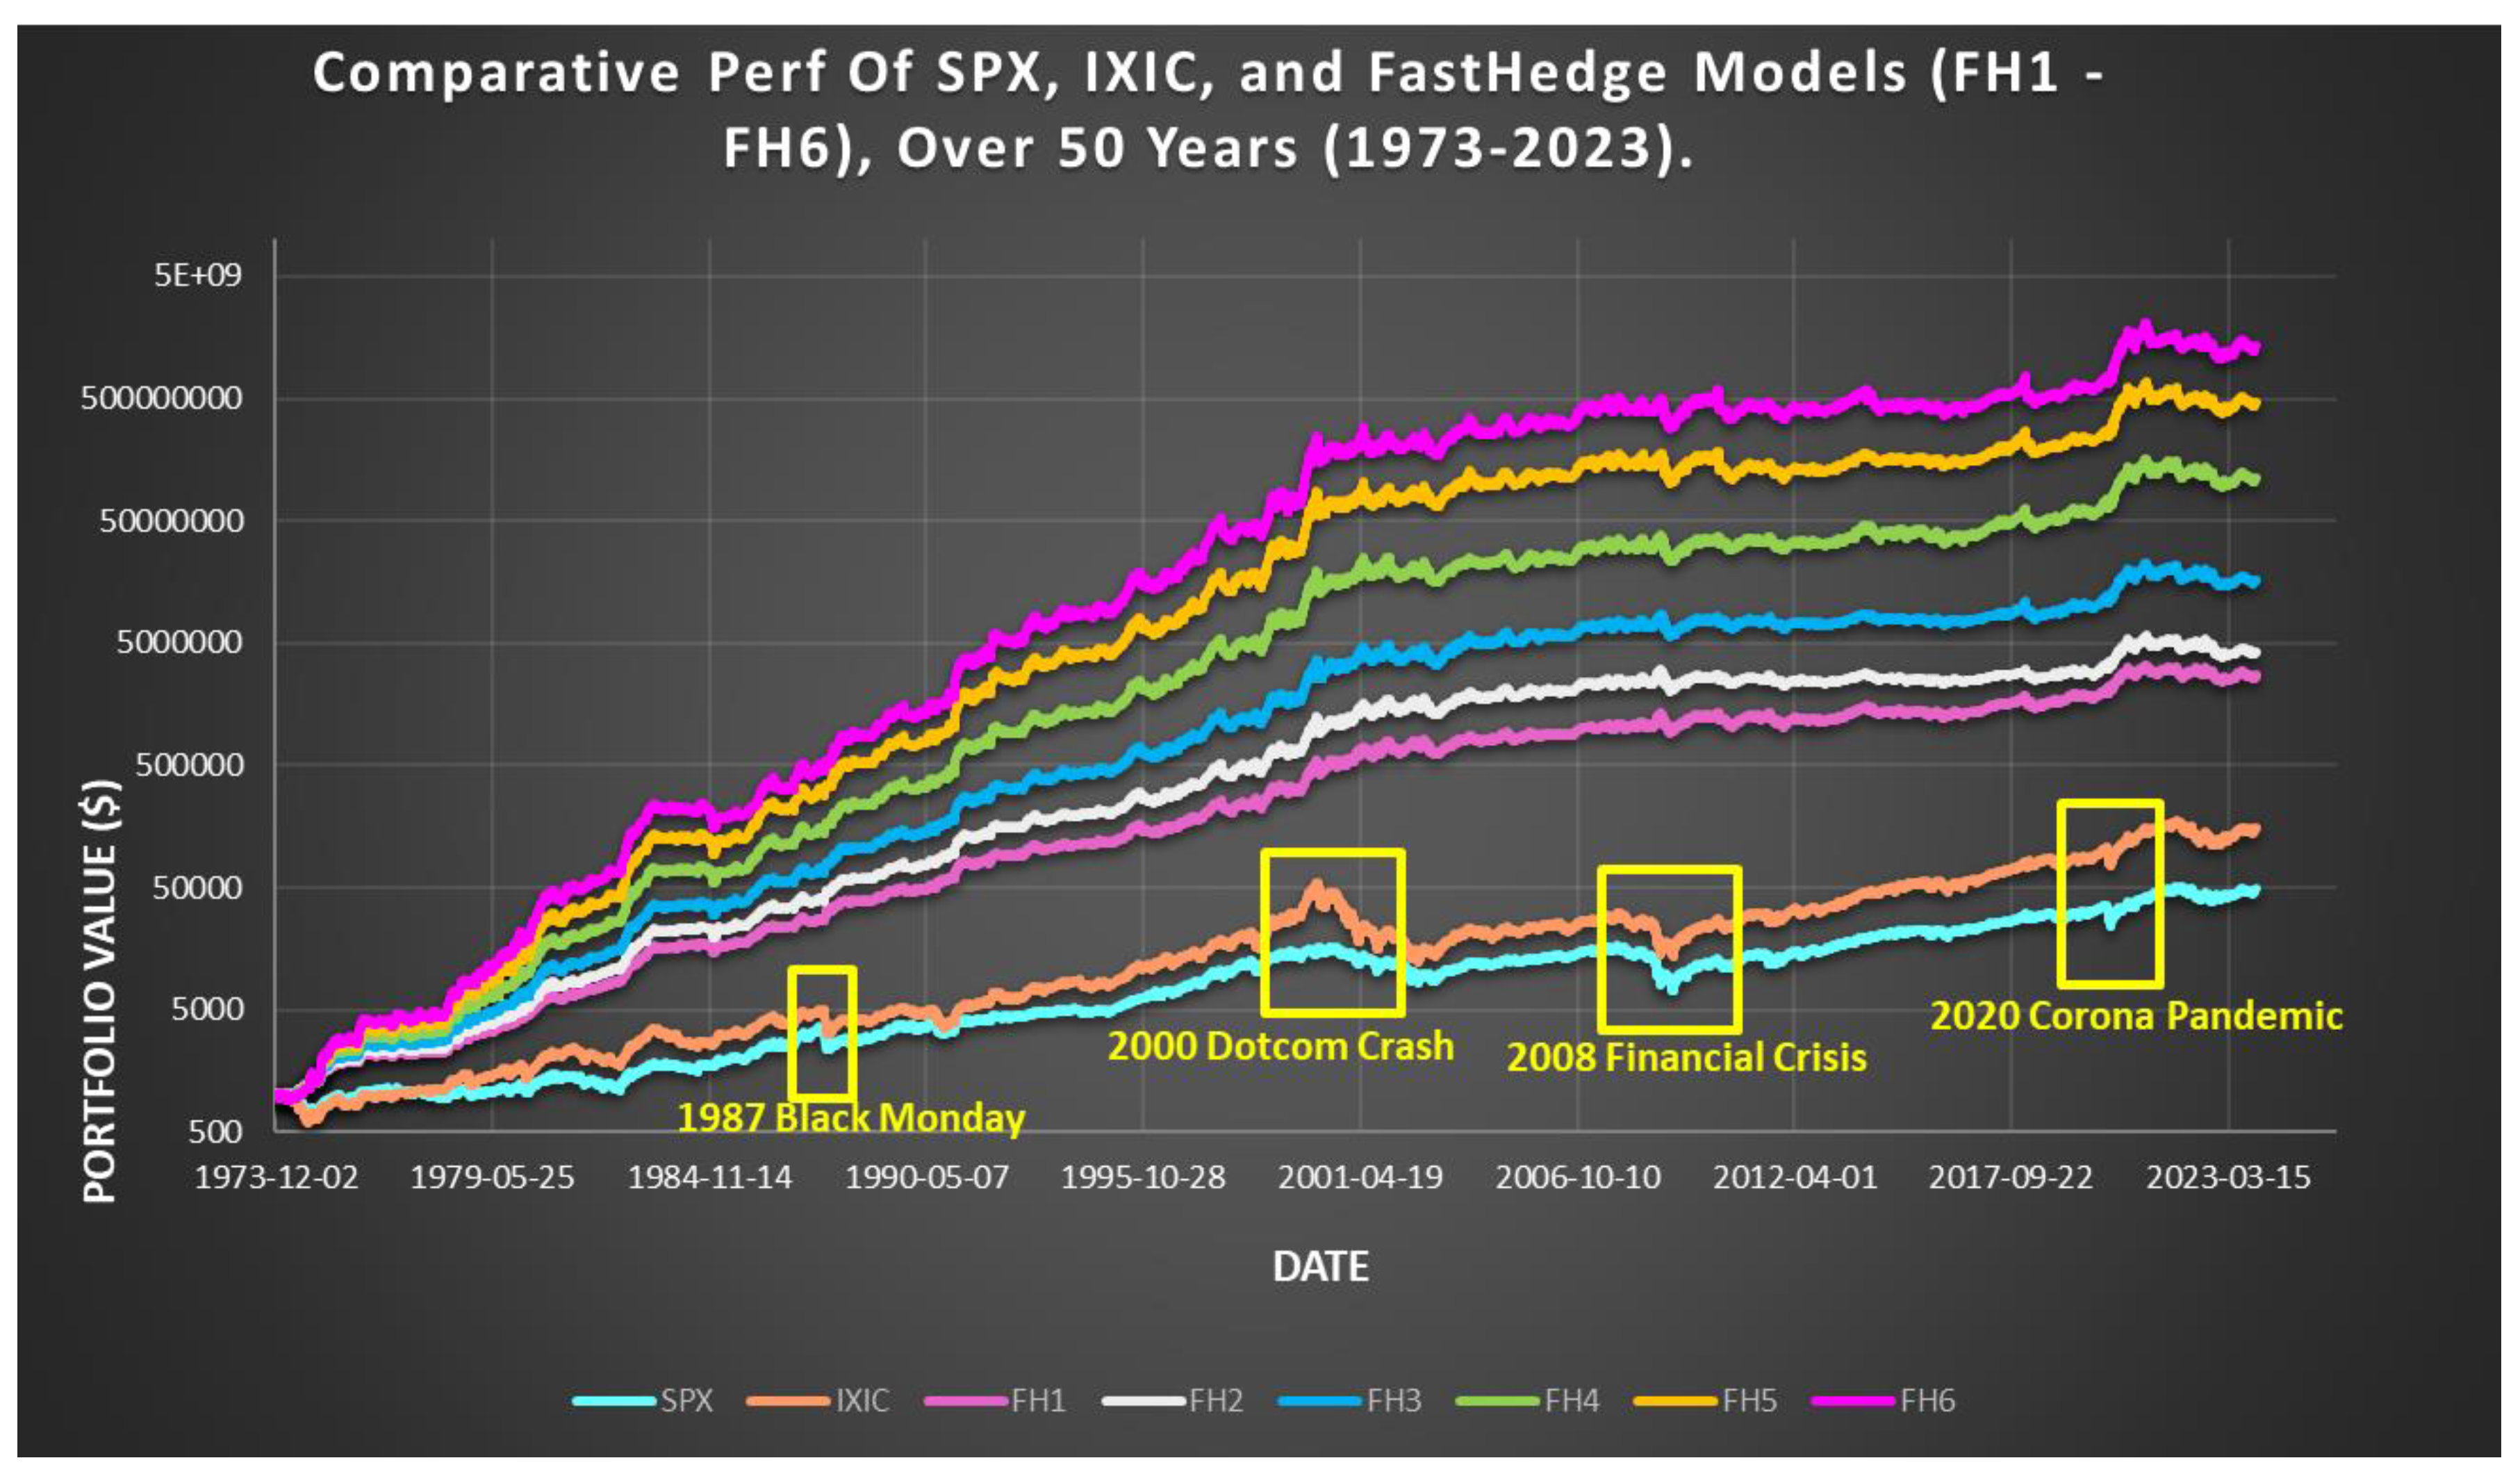
We now provide some results covering the longest period available for the Nasdaq index IXIC: 50 years. Specifically, we test on the 50-year period 1973-2023 (12/3/1973 – 12/1/2023). We compare Buy-and-Hold of the benchmark SPX and IXIC indices, as well as six models from the
FastHedge algorithm suite (FH1 – FH6), each with increasing performance as well as volatility. See
Figure 10,
Figure 11 and
Figure 12. For simplicity, we used a single underlying
FastHedge model (out of 25), and varied only the level of leverage. We set Lev=1, 1.2, 1.5, 2, 2.5, 3, respectively for models F1 – F6. (Thus, our F1-F3 here are not the same as in
Figure 7,
Figure 8 and
Figure 9. In fact, the base model is also different.) Again, leveraging is easy for the small investor: just mix QQQ with TQQQ as needed. Advanced users can use derivatives (options, futures, ..) for higher levels of leverage. We provide both graphical and tabular results and use our suite of metrics to quantify the performance. For simplicity, taxes, trade costs, and inflation are not fully accounted for (but affect all investments, so the comparisons remain valid; a 3% cost of money is assumed.). These results are very encouraging and can be interpreted directly when trading for example in retirement accounts (where taxes are deferred). They attest to the long-term stability of our models, even under leverage. Note that the
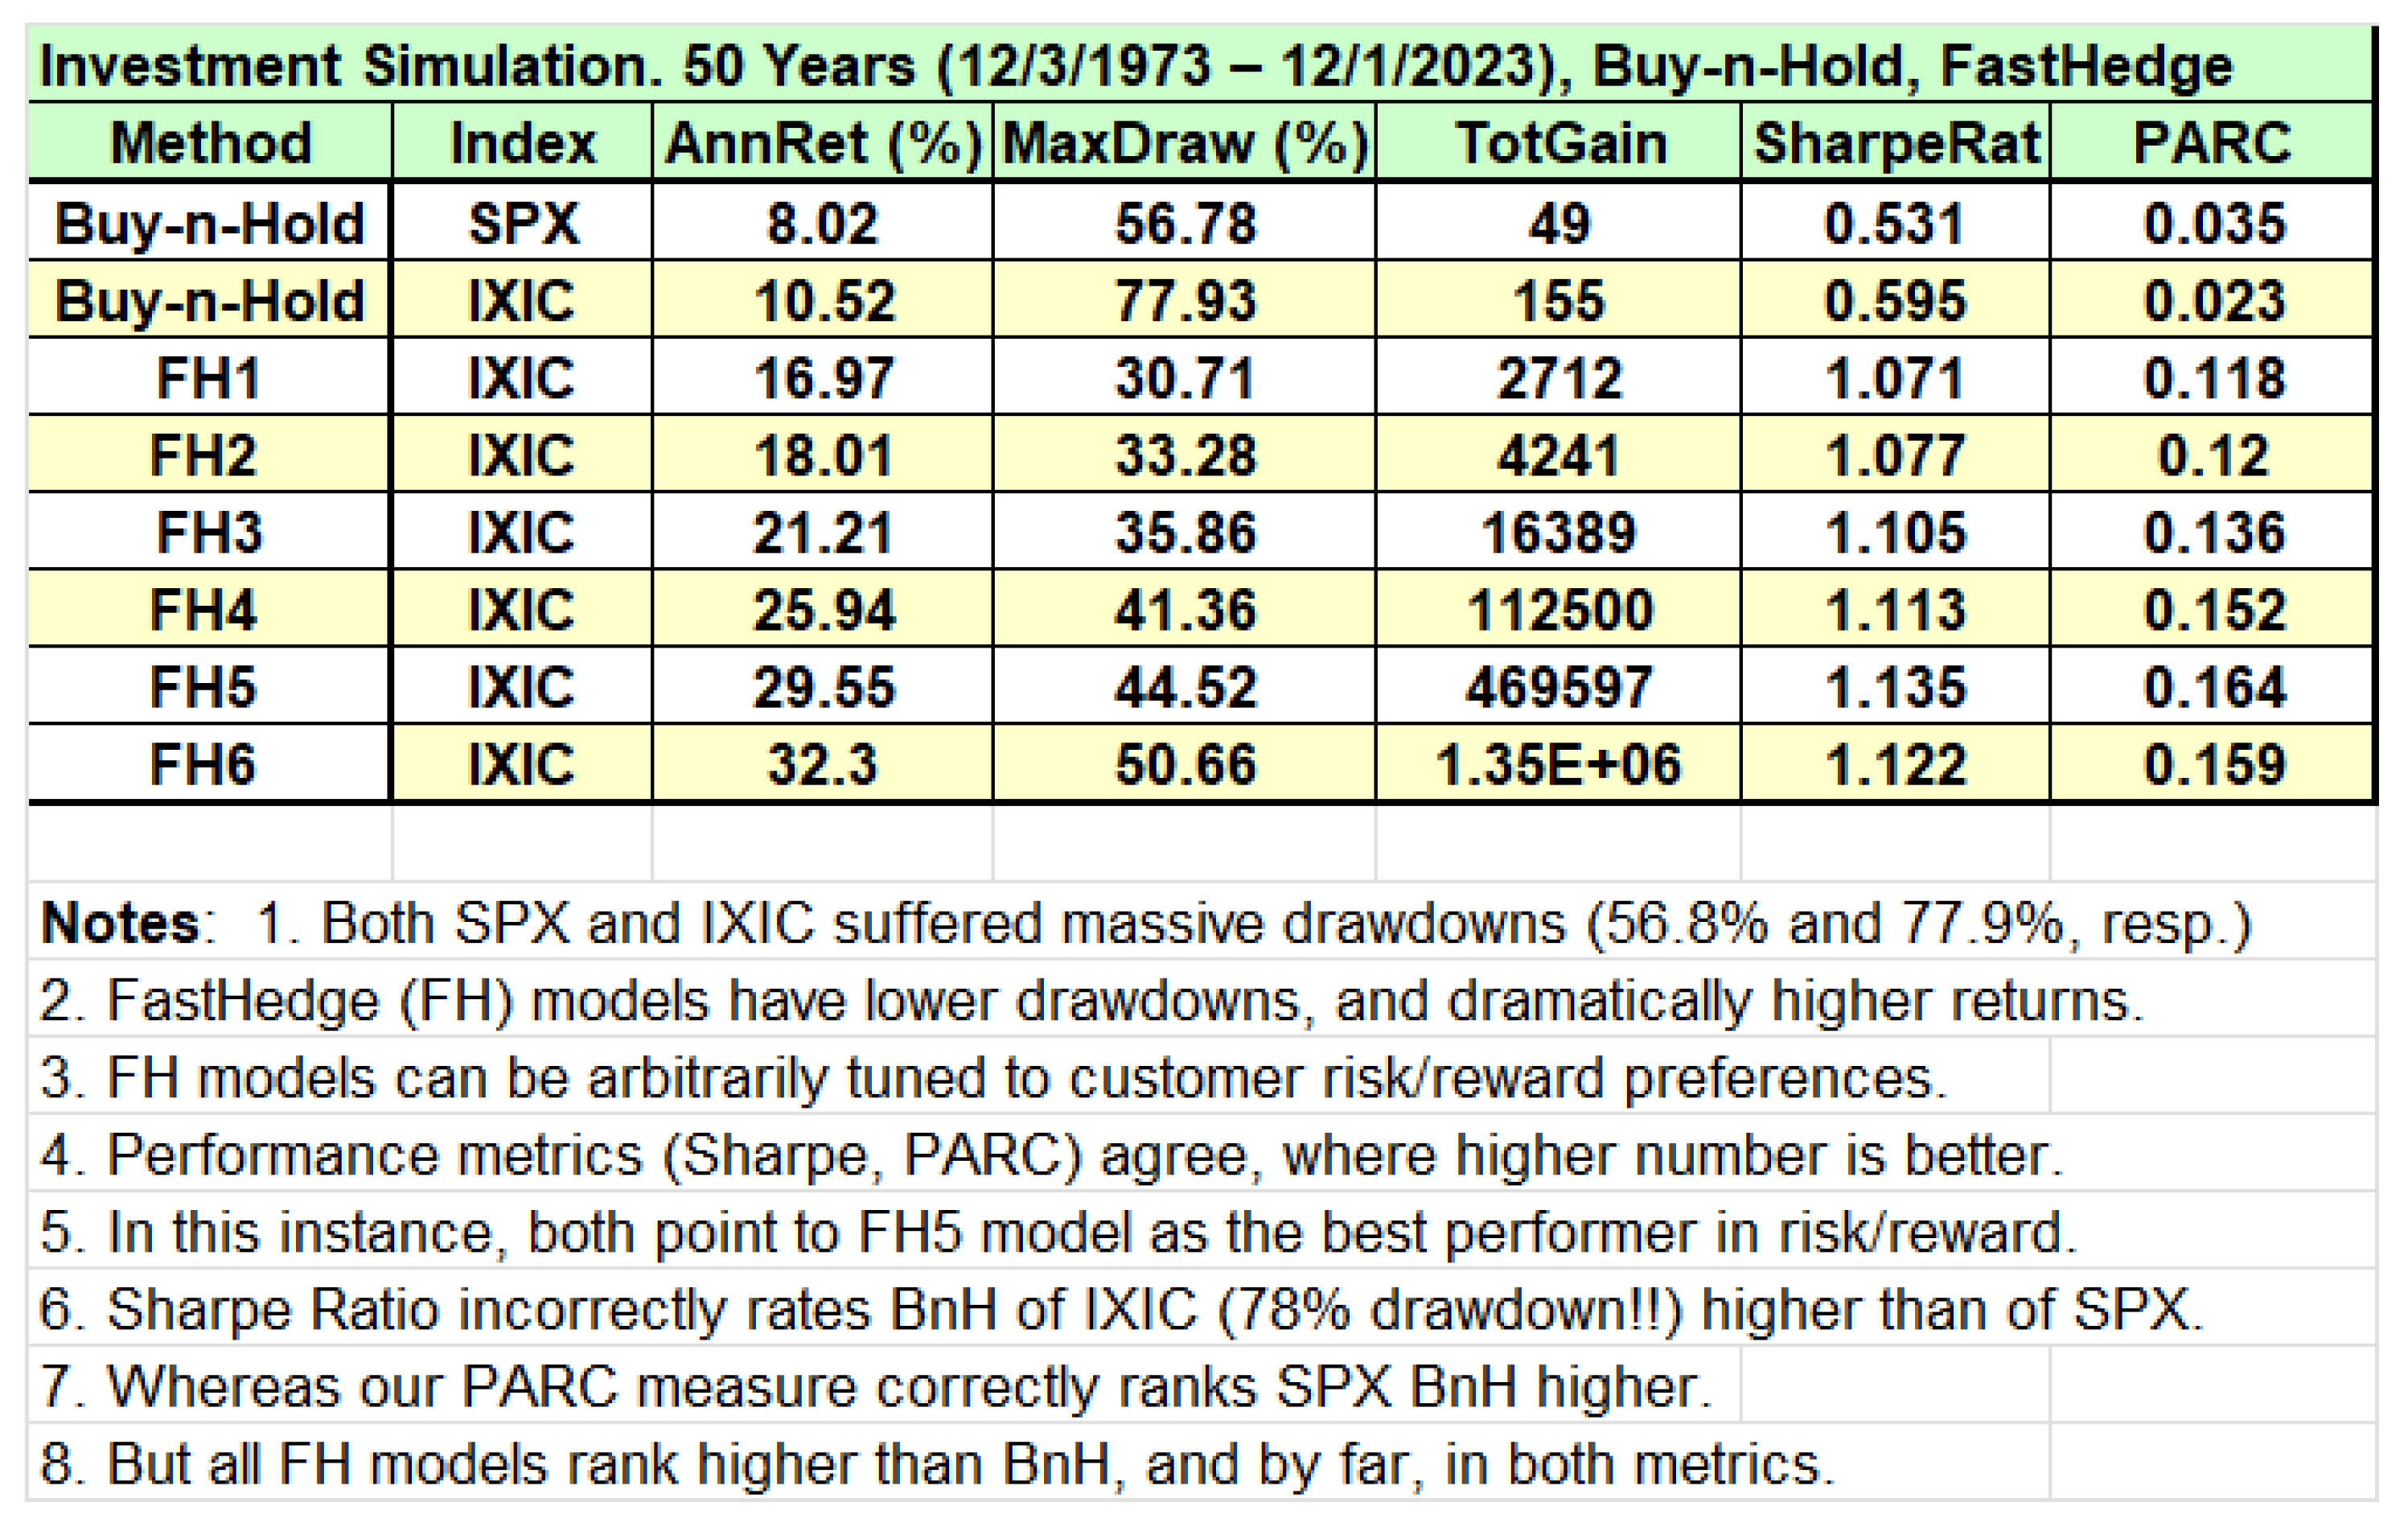
FastHedge models can achieve stellar annual returns for decades, and mostly bypass the major market downturns (Black Swans) as shown on the graph. In comparing our metrics, both Sharpe and PARC agree the FH models are best (and even agree on the order!). But as before, Sharpe ranks IXIC over SPX in Buy-and-Hold, which we cannot abide. Our results here corroborate results in previous papers, which show that overall, the PARC measure is more reliable, at least for the small investor. These results are also available at FastHedge (2024).
Figure 10.
Fifty-year comparison (12/3/1973-12/1/2023) of the major indices SPX and IXIC versus 6 models of the FastHedge (FH) suite of trading algorithms, in log-scale format, with $1K initial investment, showing the powerful, and stable growth that can be achieved by our models. FH Models come with flexible, selectable risk/reward profiles, mainly in setting leverage values (Lev=1… 3 here). Note that the named Black Swan events are effectively erased by FH models, a major victory for small investors. For simplicity, taxes, trading costs, and inflation are not considered (but affect all investments). (Source:FastHedge).
Figure 11.
Quantitative analysis of results of
Figure 10 in tabular form, with a variety of performance metrics computed.
FastHedge models greatly outperform Buy-and-Hold in major indices over the 50-year period in all metrics tabulated and can meet a variety of risk/reward profiles. All FH models have better performance and lower drawdowns than the major indices SPX and IXIC. Furthermore, our performance measure PARC is more accurate than the well-known Sharpe measure, whose ranking is sometimes unreliable; see the Notes. (Source:
FastHedge.).
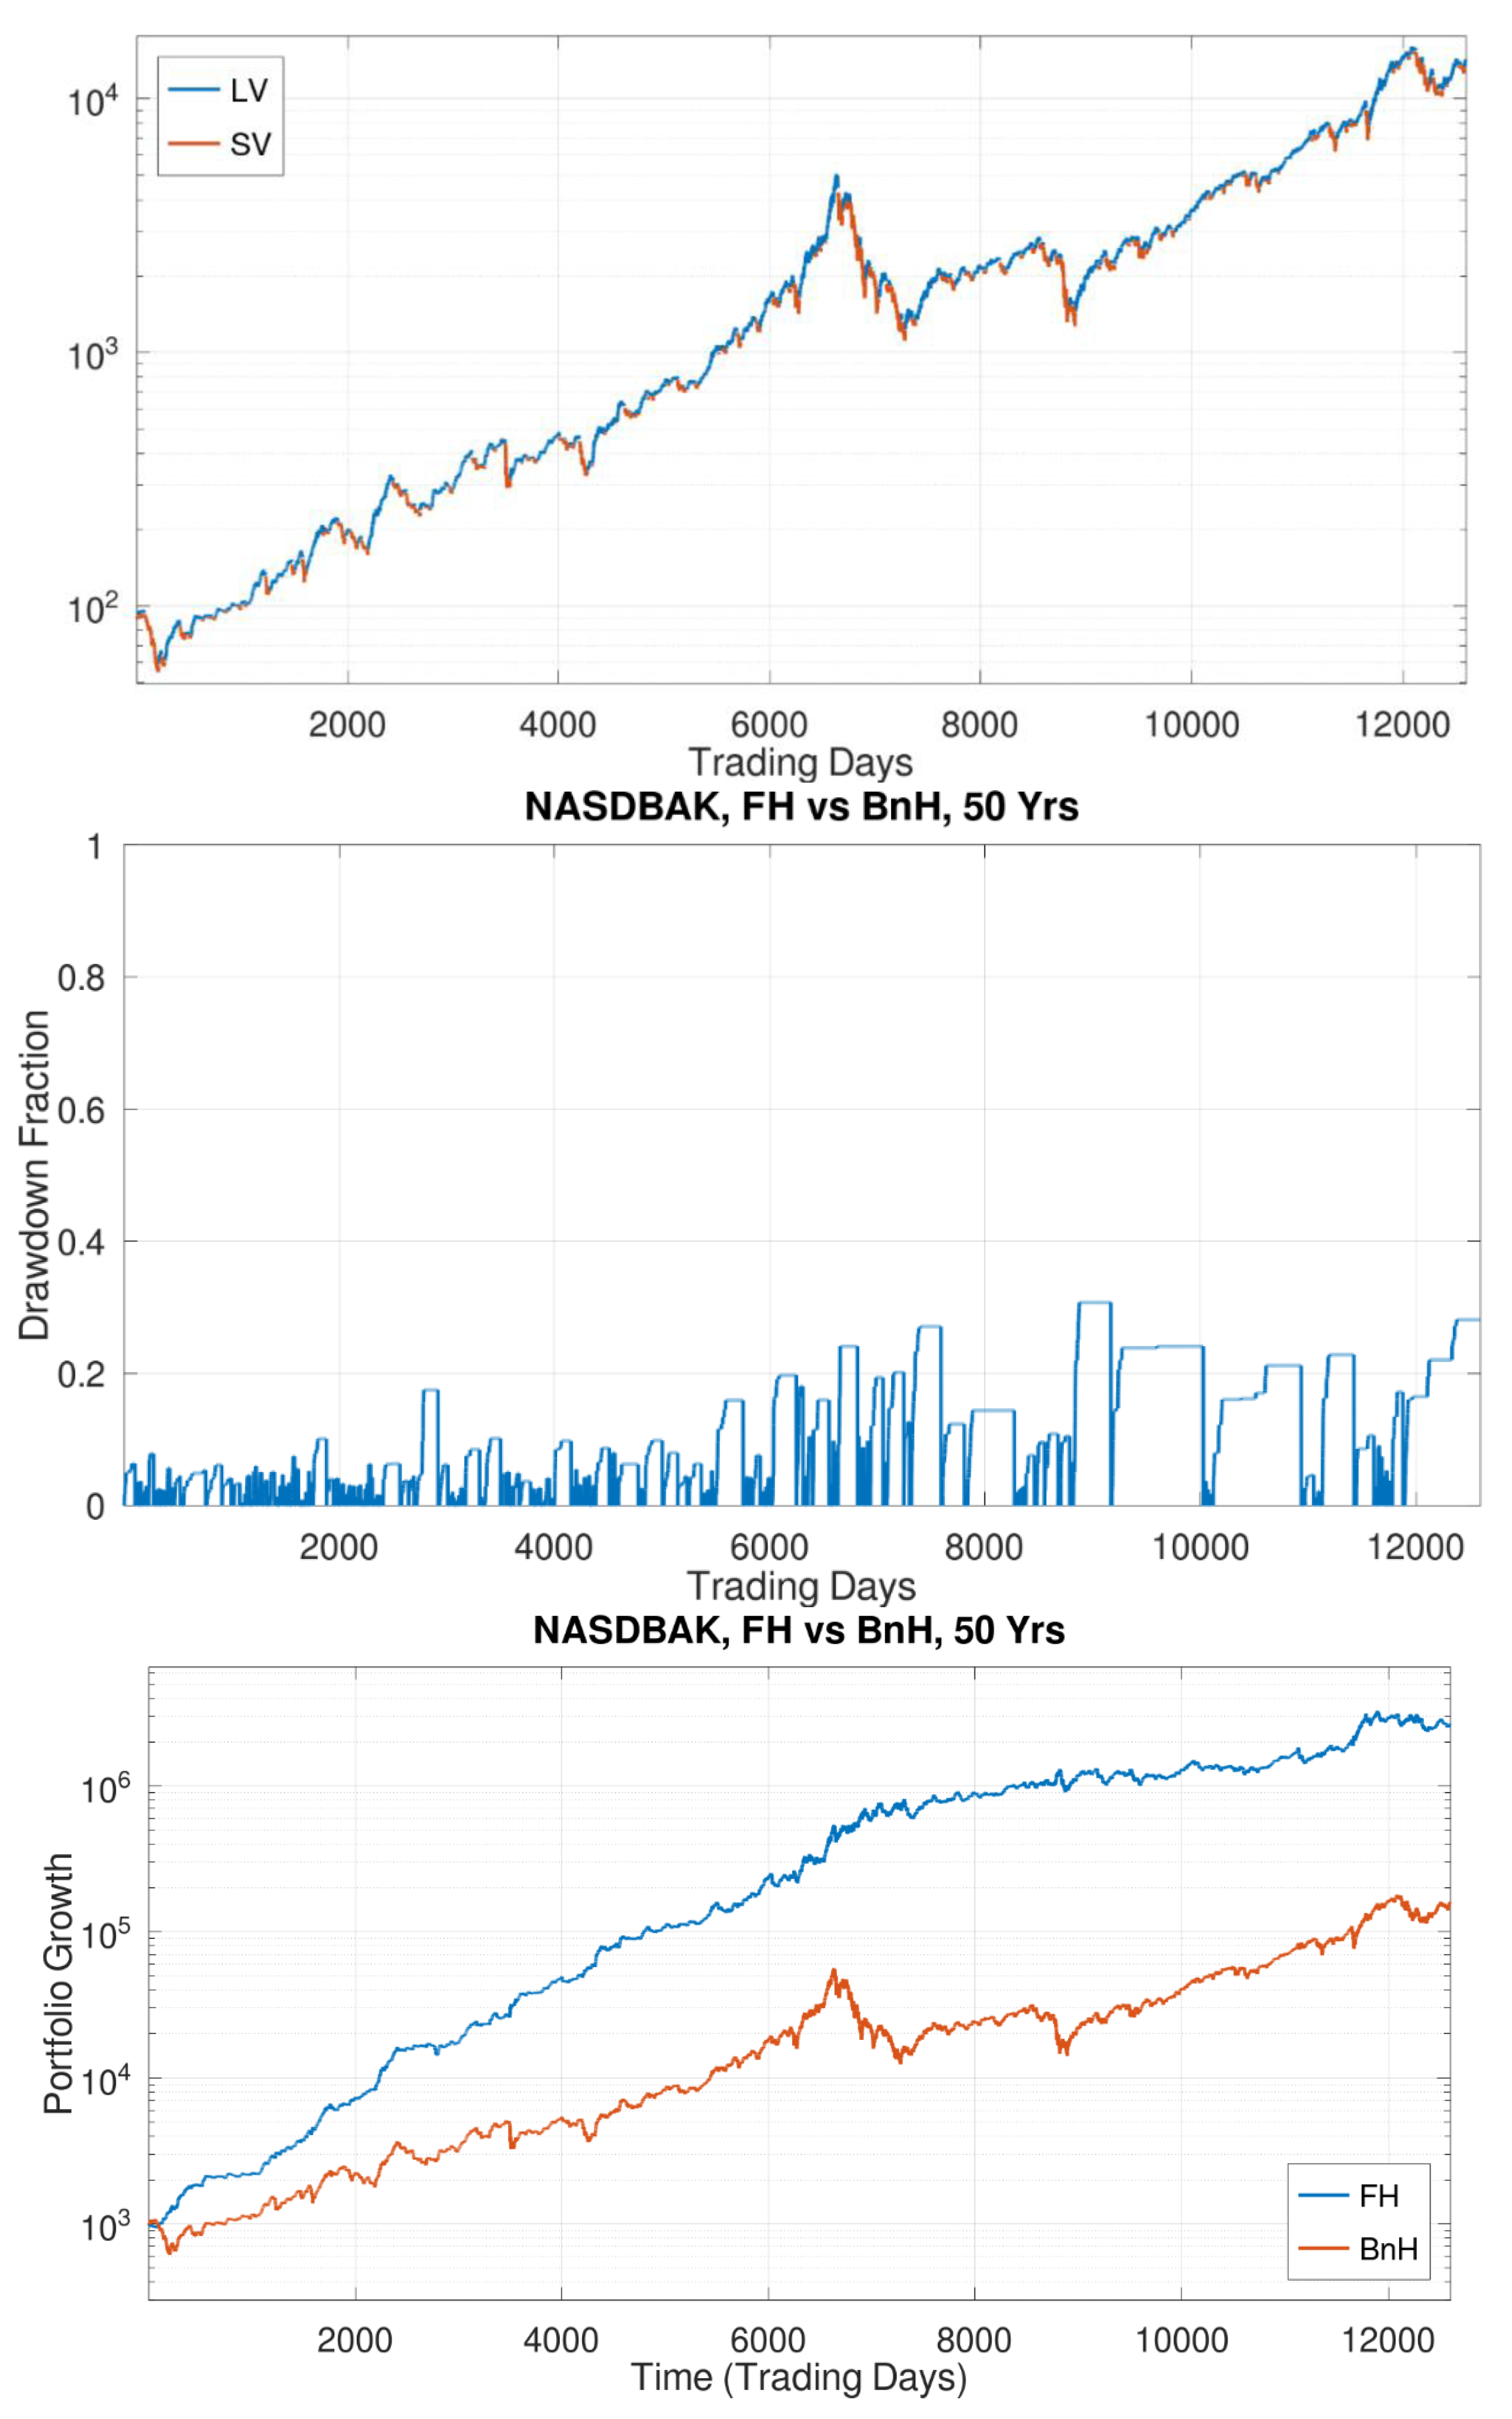
Figure 12.
(top) The explicit trades used in the 50-year simulation by all models FH1-FH3 (12600 trading days of 12/3/1973-12/1/2023). (middle) The well-controlled drawdowns of FH1 (here FH=FH1) under 31%. (bottom) Comparison of BnH of IXIC vs FH, showing graceful, stable growth for virtually all of Nasdaq history, with a single, unmodified trading model. (Here ‘Nasdbak’ just means we used a Nasdaq record truncated to 12/1/2023).
In short, our algorithmic approach is stable, reliable, performant, and executable by small investors, based on a trading signal. To our knowledge, there is little comparable published literature (although similar ideas are in wide use in the industry).
6. Conclusions
The millions of average small investors have in aggregate deeply underperformed the market for decades, a national loss in the trillions. This alone massively impacts the economy, and makes the imminent collapse of the current Social Security program much more consequential. In this paper, we used just the simplest ideas in market timing, and showed they could be effective over decades, which could assist small investors to get better returns. We went head-to-head with Berkeshire’s BRK-A fund over a 44-year period and came out favorably. We also discussed and compared two performance measures: the Sharpe Ratio, and our own PARC. We conclude that based on evidence provided, PARC is more effective and reliable in capturing what is important, especially for small investors, than the Nobel-prize winning Sharpe Ratio. We thus invite the broader community to test this easy-to-compute measure widely.
More broadly, we showed over the extensive time periods, up to 50 years, that algorithmic trading, specifically using market timing, can indeed be effective. Of course, any trading algorithm can be improved, or be defeated by a well-contrived time series designed to test its failure modes. All trading algorithms have decision boundaries, and markets that straddle those boundaries will dissipate performance. Real markets are likely to test any and every decision boundary over time. The challenge is to construct decision algorithms that are both simple and generic, so its failure modes constitute a vanishing subspace of the space of possible trajectories of real markets. Moreover, investing in multiple variables and trading them individually can help mitigate the effects of markets testing any one decision boundary.
Thus, our work supports the thesis that effective market timing is not only possible but relatively easy, and requiring only a reasonable number of trades per year. We therefore push back on the long-standing notion that market timing is impossible. And in the risk/reward equation, we also push back on where that equilibrium needs to be, achieving high rewards at reduced risk relative to the market indices, individual securities, or even seasoned investor portfolios.
The past 100 years have seen continued (though not consistent) growth, on a trajectory that seems remarkable. Will it continue, and at a similar pace? No one knows. We have so far avoided Monte Carlo simulations going forward, as they may be of limited predictive value. Common opinion, and a World Bank study, suggest the pace of growth may slow. But the human enterprise has been challenged many times across history, by major events such as wars, famines, and disease, yet we persisted. The future is untold. Despite many serious challenges on the horizon, we believe our inherent creativity may permit continued growth while reducing our negative impacts. As long as there is growth generally, our methods can help individuals, professionals, and even governments navigate financial markets to achieve strong results as well as constrain drawdowns.
Funding
This paper received no external funding.
Institutional Review Board Statement
Not applicable.
Informed Consent Statement
Not applicable.
Data Availability Statement
All data sources for figures other than our results are cited in the paper. Our own results and figures rely on index and stock data widely available from many sources, for example, historical data from finance.yahoo.com (accessed last on 6 March 2024).
Conflicts of Interest
The author declares no conflict of interest.
References
- Anspatch, Dana. 2021. Why Average Investors Earn Below Average Market Returns. The Balance Blog. Available online: https://www.thebalance.com/why-average-investors-earn-below-average-market-returns-2388519 (accessed on 30 April 2022).
- Buffett, Warren, 2024. Berkeshire Hathaway’s Annual Report, 2023. Linked online at: https://www.livemint.com/market/stock-market-news/buffett-credits-munger-as-architect-of-berkshire-warns-against-wall-street-noise-11708823818720.html (accessed on 3 March 2024).
- Burtless, Gary, et al. 2017. How Would Investing In Equities Have Affected The Social Security Trust Fund? https://crr.bc.edu/wpcontent/uploads/2016/07/wp_2016-6_rev.pdf (accessed on 30 May 2023).
- Butler, Steve. 2015. The New Dark Art of Timing the Stock Market. USA Today, February 11.
- Cassidy, B. 2023. ICYMI: Refusing to Reform Social Security Is a Plan - And A Bad One. National Review Op-Ed. https://www.cassidy.senate.gov/newsroom/press-releases/icymi-refusing-to-reform-social-security-is-a-plan_and-a-bad-one/) (accessed on 22 November 2023) ).
- ChartSchool. 2022. StockCharts.com. Available online: https://school.stockcharts.com/doku.php?id=chart_school&campaign=web& gclid=Cj0KCQiAnsqdBhCGARIsAAyjYjR76pMXP_-XEzBWsrFjtJHzq57aLHxojITGC5m0XxW3x0Xg3EkwdYYaAk4jEALw_wcB (accessed on 30 December 2022).
- Chaplain, Chris and Alice Wade. Memorandum, 10 August 2005. https://www.ssa.gov/oact/solvency/advisoryboard_20050810.pdf (accessed on 30 May 2023).
- Chen, Ernest P. 2009. Quantitative Trading: How to Build Your Own Algorithmic Trading Business. Hoboken: J. Wiley.
- Chen, James. 2020. Return over Maximum Drawdown (RoMaD). Available online: https://www.investopedia.com/terms/r/returnover-maximum-drawdown-romad.asp (accessed on 30 April 2022).
- Chen, Yong, and Bing Liang. 2007. Do Market Timing Hedge Funds Time the Market? Journal of Financial and Quantitative Analysis 42: 827–56.
- Chien, YiLi. 2014. Chasing Returns Has a High Cost for Investors. St. Louis Fed Blog. Available online: https://www.stlouisfed.org/onthe-economy/2014/april/chasing-returns-has-a-high-cost-for-investors (accessed on 30 April 2022).
- Coleman, Murray. 2022. SPIVA: 2021 Year-End Active vs. Passive Scorecard. Index Fund Advisors. March 28. Available online: https:// www.ifa.com/articles/despite-brief-reprieve-2018-spiva-report-reveals-active-funds-fail-dent-indexing-lead-works/ (accessed on 30 April 2022).
- Crews Bank and Trust, 2022. S&P500 vs. The Average Investor. Available online at: https://www.crews.bank/blog/sp-500-vs-average-investor (accessed 9 March 2024).
- Damodaram, Aswath. Dreaming the Impossible Dream? Market Timing. NYU Stern School of Business Document. Available online: https://pages.stern.nyu.edu/~adamodar/pdfiles/invphiloh/mkttiming.pdf (accessed on 30 April 2022).
- Diamond, Peter and John Geanokopolis. 2003. Social Security Investment in Equities. https://economics.mit.edu/sites/default/files/ 2022-09/SocialSecurityInvestmentinEquities.pdf (accessed on 30 May 2023).
- Donadio, Sebastien and S. Ghosh, 2020. Learn Algorithmic Trading. Packt. https://thederivativ.com/wp-content/uploads/2020 /09/Learn-Algorithmic-Trading.pdf) (accessed on 12 July 2023) ).
- Elton, Edwin J., Martin J. Gruber, Stephen J. Brown, and William N. Goetzmann. 2014. Modern Portfolio Theory and Investment Analysis. New York : John Wiley and Sons. Available online: https://dl.rasabourse.com/Books/Finance%20and%20Financial%20Markets/%5BEdwin_J._Elton%2C_Martin_J._Gruber%2C_Stephen_J._Brow_Modern%20Portfolio%20Theory%20and%20Investment% 28rasabourse.com%29.pdf (accessed on 1 January 2023).
- Estrada, Javier. 2008. Black Swans and Market Timing: How Not to Generate Alpha. Preprint. Available online: https://blog.iese.edu/ jestrada/files/2012/06/BlackSwans.pdf (accessed on 30 April 2022).
- ETFvest. 2024. https://etfvest.com/list/best-etfs-10-years (accessed 6 March 2024).
- FastHedge, 2024. Website: https://www.fast-hedge.com (accessed 6 March 2024.
- Fidelity. 2021. Fidelity Viewpoints. Why Work with a Financial Advisor. Fidelity Investments, November 1. Available online: https://www.fidelity.com/viewpoints/investing-ideas/financial-advisor-cost (accessed on 30 April 2022).
- Fidelity, 2023. https://www.fidelity.com/viewpoints/active-investor/moving-averages) (accessed on 12 July 2023).
- FRED. 2022. St. Louis Fed. Available online: https://fred.stlouisfed.org/series/FEDFUNDS (accessed on 30 April 2022).
- Goodkind, Nicole. 2022. Wall Street’s dirty secret: It’s terrible at forecasting stocks . CNN. Available online: https://www.cnn.com/2022/12/28/investing/premarket-stocks-trading/index.html?utm_source=optzlynewmarketribbon (accessed on 30 December 2022).
- Graham, John, and Campbell Harvey. 1994. Market timing ability and volatility implied in investment newsletters’ asset allocation recommendations. Journal of Financial Economics 42: 397–421.
- Halls-Moore, Michael. 2010. Successful Algorithmic Trading. Available online: https://raw.githubusercontent.com/englianhu/binary.cominterview-question/fcad2844d7f10c486f3601af9932f49973548e4b/reference/Successful%20Algorithmic%20Trading.pdf (accessed on 30 April 2022).
- Hammond, B. and M. Warshawsky, 1997. Investing Social Security Funds in Stocks. Benefits Quarterly. 13 (5): 52-65. (Accessed 20 January, 2024).
- Henriksson, Roy, and Robert Merton. 1981. On Market Timing and Investment Performance. II: Statistical Procedures for Evaluating Forecasting Skills. Working Paper, Sloane School of Management, MIT, Cambridge, MA, USA.
- Investment Company Institute. Available online: https://icifactbook.org/21_fb_ch3.html (accessed on 30 April 2022).
- Investment Company Institute. 2021. Investment Fact Book 2021. Washington, DC : Investment Company Institute. Available online: https://www.icifactbook.org/21-fb-ch7.html (accessed on 30 April 2022).
- Investment Company Institute. 2023. https://www.ici.org/statistical-report/ret_22_q4 (accessed on 30 May 2023).
- Investopedia, 2021. https://www.investopedia.com/ask/answers/122414/what-are-most-common-periods-used-creating-movingaverage-ma-lines.asp) (accessed on 12 July 2023).
- Investopedia-2, 2021. https://www.investopedia.com/articles/investing/030916/ben-grahams-advice-reading-financial-statements.asp (accessed on 6 March 2024).
- Investopedia. 2023. https://www.investopedia.com/articles/investing/061113/breaking-down-tsp-investment-funds.asp (accessed on 30 May 2023).
- Investopedia, 2024. https://www.investopedia.com/world-s-11-greatest-investors-4773356 (accessed 6 March 2024).
- Jansen, Stefan. 2020. Machine Learning for Algorithmic Trading. Birmingham: Packt Publishing.
- Kiplinger, 2019. https://www.kiplinger.com/slideshow/investing/t041-s001-the-25-best-mutual-funds-of-all-time/index.html (accessed 6 March 2024).
- Kose, M. and F. Ohnsorge (ed.), 2023. Falling Long-Term Growth Prospects. https://openknowledge.worldbank.org/server/api/core/ bitstreams/fe0880d1-ffbf-430f-bab4-d3dbdda7470e/content) (accessed on 22 November 2023) ).
- Li, Yuxi. 2018. Deep Reinforcement Learning: An Overview. Available online: https://arxiv.org/abs/1701.07274 (accessed on 30 April 2022). macrotrends. 2022. Macrotrends—The Premier Research Platform for Long Term Investors. Available online: https://www. macrotrends.net (accessed on 30 April 2022).
- Markowitz, Harry. 1952. Portfolio Selection. Journal of Finance 7: 77–91. Available online: https://www.jstor.org/stable/2975974 (accessed on 1 January 2023).
- Merton, Robert. 1981. On Market Timing and Investment Performance. I. An Equilibrium Theory of Value for Market Forecasts. Journal of Business 54: 363–406.
- Munnell, Alicia, et al. 2016. How would investing in equities have affected the Social Security trust fund? https://www.brookings. edu/research/how-would-investing-in-equities-have-affected-the-social-security-trust-fund/ (accessed on 30 May 2023).
- Munnell, Alicia H. and Michael Wicklein. 2023. Should Social Security Invest in Equities? Brief 23-14. Boston College. https://crr.bc.edu/should-social-security-invest-in-equities/) (accessed on 15 July 2023) ).
- Munnell, Alicia H. 2023. Should Social Security Invest in Equities? MarketWatch blog. Available at Boston College. https://crr.bc.edu/ should-social-security-invest-in-equities-2/) (accessed on 22 November 2023) ).
- Pan, Eddie. 2022. Five Stocks to Watch that Institutions Are Buying Right Now. Blog. Available online: https://www.yahoo.com/ video/5-stocks-watch-institutions-buying-213929921.html (accessed on 30 April 2022).
- Peleg, Yam. 2017. Trading Using Deep Learning. GPU Technology Conference. Available online: https://on-demand.gputechconf.com/gtc-il/2017/presentation/sil7121-yam-peleg-deep-learning-for-high-frequency-trading%20(2).pdf (accessed on 30 April 2022).
- Peters, Katelyn. 2021. Market Timing. Online Blog at Investopedia. Available online: https://www.investopedia.com/terms/m/ markettiming.asp (accessed on 30 April 2022).
- President Clinton. 1999. State of the Union Address, 19 Jan., 1999. https://www.ssa.gov/history/clntstmts2.html#1999state (accessed on 30 May 2023).
- Quant Insti, 2023. https://blog.quantinsti.com/moving-average-trading-strategies/) (accessed on 12 July 2023) ).
- Reischauer, Robert. 1999. Investing Social Security Reserves in Private Equities. https://www.brookings.edu/testimonies/investingsocial-security-reserves-in-private-securities/ (accessed on 30 May 2023).
- Rlspin. 2022. OpenAI.com. Available online: https://spinningup.openai.com/en/latest/index.html (accessed on 30 April 2022).
- Richards, Carl. 2014. Forget Market Timing, and Stick to a Balanced Fund. New York Times, January 27. Available online: https://www. nytimes.com/2014/01/28/your-money/forget-market-timing-and-stick-to-a-balanced-fund.html (accessed on 30 April 2022).
- Roberts, Lance. 2017. Opinion: Americans Are still Terrible at Investing, Study Shows again. MarketWatch Blog, October 21. Available online: https://www.marketwatch.com/story/americans-are-still-terrible-at-investing-annual-study-once-again-shows-2017 -10-19 (accessed on 30 April 2022).
- Ro, S. 2013. Chart of the Day: Proof That You Stink at Investing. Business Insider Blog. Available online: https://www.businessinsider. com/chart-proof-that-you-stink-at-investing-2013-3 (accessed on 30 April 2022).
- Seth, Shobith. 2022. Basics of Algorithmic Trading: Concepts and Examples. Investopedia Blog. Available online: https://www.investopedia. com/articles/active-trading/101014/basics-algorithmic-trading-concepts-and-examples.asp (accessed on 30 April 2022).
- Shadmehry, Cameron. 2021. How Profitable Is Algorithmic Trading in 2021. Available online: https://medium.com/automatedtrading/how-profitable-is-algorithmic-trading-in-2021-1b63489cd70a (accessed on 30 April 2022).
- Sharpe, William. 1975. Likely Gains from Market Timing. Financial Analysts Journal 31: 60–69.
- Sharpe, William. 1994. The Sharpe ratio. The Journal of Portfolio Management 21: 49–58.
- Shen, Pu. 2002. Market Timing Strategies That Worked. Working Paper 02-01, Federal Reserve Bank of Kansas City, Kansas City, MO, USA, May. Available online: https://www.personalfinancelab.com/wp-content/uploads/2013/03/RWP02-01.pdf (accessed on 30 April 2022).
- Smetters, K., 1997. Investing the Social Security Trust Funds in Equities: An Option Pricing Approach. (https://www.cbo.gov/sites/default/files/cbofiles/ftpdocs/31xx/doc3129/19971.pdf) (Accessed 19 January, 2024).
- Social Security Administration. 2023. Financial Data For the Social Security Trust Funds. Blog. https://www.ssa.gov/oact/progdata/ assets.html (accessed on 30 May 2023).
- Social Security Administration. 2023. Provisions Affecting Trust Fund Investment in Marketable Securities. https://www.ssa.gov/ oact/solvency/provisions/investequities.html (accessed on 30 May 2023).
- Statmuse, 2024. Online blog. https://www.statmuse.com/money/ask/best-performing-stocks-in-last-40-years-with-market-cap-above-50-billion (accessed 6 March 2024).
- Sullivan, Ryan, Allan Timmermann, and Halbert White. 1999. Data-snooping, technical trading rule performance, and the bootstrap. Journal of Finance 245: 1647–91.
- Tax Policy Center. 2023. https://www.taxpolicycenter.org/briefing-book/are-social-security-trust-funds-real.
- Theate, Thibaut, and Damien Ernst. 2002. An Application of Deep Reinforcement Learning to Algorithmic Trading. Available online: https://arxiv.org/abs/2004.06627 (accessed on 30 April 2022).
- Thrift Savings Plan. 2023. https://www.tsp.gov/investment-options/ (accessed on 30 May 2023).
- Topiwala, Pankaj. 1998. Wavelet Image and Video Compression. Cham : Springer. Available online: https://www.amazon.com/s?k=wavelet+image+and+video+compression&crid=349R6JQD7OVUE&sprefix=wavelet+image+and+video+compression% 2Caps%2C116&ref=nb_sb_noss (accessed on 30 December 2022).
- Topiwala, Pankaj, and Wei Dai. 2022. Surviving Black Swans: The Challenge of Market Timing Systems. Journal of Risk and Financial Management 5: 280. Available online: https://www.mdpi.com/1911-8074/15/7/280 (accessed on 30 December 2022).
- Topiwala, Pankaj. 2023. Surviving Black Swans II: Timing the 2020–2022 Roller Coaster. Journal of Risk and Financial Management 16: 106. Available online: https://www.mdpi.com/1911-8074/16/2/106 (accessed on 30 May 2023).
- Topiwala, Pankaj. 2023. Surviving Black Swans III: Timing US Sector Funds. Journal of Risk and Financial Management 16: 275. Available online: https://www.mdpi.com/1911-8074/16/5/275 (accessed on 30 May 2023).
- Treynor, Jack, and Kay Mazuy. 1966. Can Mutual Funds Outguess the Market? Harvard Business Review 44: 131–36.
- US Bureau of Economic Analysis. 2023. https://www.bea.gov/news/2023/gross-domestic-product-second-estimate-corporateprofits-preliminary-estimate-first (accessed on 30 May 2023).
- US Treasury Dept. 2023. https://fiscaldata.treasury.gov/americas-finance-guide/national-debt/ (accessed on 24 November 2023).
- US Treasury. 2023. https://home.treasury.gov/news/press-releases/jy1829) (accessed on 24 November 2023).
- van Dyk, Francois, Gary Van Vuuren, and Andre Heymans. 2014. Hedge Fund Performance Using Scaled Sharpe and Treynor Measures. International Journal of Economics and Business Research 13: 1261–300.
- Vanguard. 2019. Vanguard Research. Putting a Value on Our Value: Quantifying Vanguard Advisor’s Alpha. February. Available online: https://www.vanguard.com/pdf/ISGQVAA.pdf (accessed on 30 April 2022).
- VectorVest, Inc., 2023. https://www.vectorvest.com/e-reports/mastering-moving-averages/Mastering_Moving_Averages.pdf) (accessed on 12 July 2023) ).
- YCharts, 1. 2023. https://ycharts.com/indicators/sp_500_market_cap (accessed on 30 May 2023).
- YCharts, 2. 2023. https://ycharts.com/indicators/wilshire_5000_index_market_cap (accessed on 30 May 2023).
- Zakamulin, Valeriy. 2014. The Real-Life Performance of Market Timing with Moving Average and Time-Series Momentum Rules. Journal of Asset Management 15: 261–78.
- Zuckerman, G., 2019. The Man Who Solved The Market: How Jim Simons Launched The Quant Revolution. Available at Amazon: https://www.amazon.com/Man-Who-Solved-Market-Revolution/dp/073521798X.
|
Disclaimer/Publisher’s Note: The statements, opinions and data contained in all publications are solely those of the individual author(s) and contributor(s) and not of MDPI and/or the editor(s). MDPI and/or the editor(s) disclaim responsibility for any injury to people or property resulting from any ideas, methods, instructions or products referred to in the content. |
© 2024 by the authors. Licensee MDPI, Basel, Switzerland. This article is an open access article distributed under the terms and conditions of the Creative Commons Attribution (CC BY) license (http://creativecommons.org/licenses/by/4.0/).


