Submitted:
04 June 2024
Posted:
04 June 2024
You are already at the latest version
Abstract
Keywords:
1. Introduction
2. Materials and Methods
2.1. Molecular Dynamic Simulations.
2.2. Calphad Model
2.3. Chemicals
2.4. Instrumentation and Measurements
2.4.1. Oven
2.4.2. XANES
2.4.3. PXRD
2.4.4. EPMA
2.4.5. ICP-OES
2.4.6. CHNS
2.4.7. Micro-XRD, -XRF and XANES
2.5. Slag Analogue Preparation
3. Results and Discussion
3.1. Bulk Characteristics of the Solidified LiO-MnO-SiO-CaO
3.2. Temperature Dependent Mn Species Evolution from Thermodynamics
3.2.1. Microscopic Characteristics
3.3. Modelling of Mn Species Evolution and of Potential Melt Structures
3.3.1. Potential Local Melt Structures and Viscosity by MD Simulations
4. Conclusions
Supplementary Materials
Author Contributions
Funding
Data Availability Statement
Acknowledgments
Conflicts of Interest
References
- Mills, K.C. The Influence of Structure on the Physico-chemical Properties of Slags. ISIJ International 1993, 33, 148–155. [Google Scholar] [CrossRef]
- Mills, K.C.; Hayashi, M.; Wang, L.; Watanabe, T. Chapter 2.2 - The Structure and Properties of Silicate Slags. In Treatise on Process Metallurgy; Seetharaman, S., Ed.; Elsevier: Boston, 2014; pp. 149–286. [CrossRef]
- Elwert, T.; Strauss, K.; Schirmer, T.; Goldmann, D. Phase composition of high lithium slags from the recycling of lithium ion batteries. World Metall. -Erzmetall 2012, 65, 163–171. [Google Scholar]
- Acker, S.; Namyslo, J.C.; Rudolph, M.; Strube, F.; Fittschen, U.E.A.; Qiu, H.; Goldmann, D.; Schmidt, A. Polyether-tethered imidazole-2-thiones, imidazole-2-selenones and imidazolium salts as collectors for the flotation of lithium aluminate and spodumene. RSC Adv. 2023, 13, 6593–6605. [Google Scholar] [CrossRef] [PubMed]
- Wittkowski, A.; Schirmer, T.; Qiu, H.; Goldmann, D.; Fittschen, U.E.A. Speciation of Manganese in a Synthetic Recycling Slag Relevant for Lithium Recycling from Lithium-Ion Batteries. Metals 2021, 11, 188. [Google Scholar] [CrossRef]
- Schnickmann, A.; Hampel, S.; Schirmer, T.; Fittschen, U.E.A. Formation of Lithium-Manganates in a Complex Slag System Consisting of Li2O-MgO-Al2O3-SiO2-CaO-MnO—A First Survey. Metals 2023, 13. [Google Scholar] [CrossRef]
- Longo, R.C.; Kong, F.T.; KC, S.; Park, M.S.; Yoon, J.; Yeon, D.H.; Park, J.H.; Doo, S.G.; Cho, K. Phase stability of Li–Mn–O oxides as cathode materials for Li-ion batteries: insights from ab initio calculations. Phys. Chem. Chem. Phys. 2014, 16, 11233–11242. [Google Scholar] [CrossRef] [PubMed]
- Jahanshahi, S.; Sun, S.; Zhang, L. Effects of transition metals on physicochemical properties of slags. 2007, pp. 1–20.
- Nagata, K.; Sasabe, M. Permeability Coefficient of Oxygen in Molten Slags and Its Mechanisms. ISIJ International 2020. [Google Scholar] [CrossRef]
- Lukas, H.; Fries, S.G.; Sundman, B. Computational Thermodynamics: The Calphad Method; Cambridge University Press, 2007. [CrossRef]
- Li, H.; Qiu, H.; Schirmer, T.; Goldmann, D.; Fischlschweiger, M. Tailoring Lithium Aluminate Phases Based on Thermodynamics for an Increased Recycling Efficiency of Li-Ion Batteries. ACS ES&T Engineering 2022, 2, 1883–1895. [Google Scholar] [CrossRef]
- Li, H.; Ranneberg, M.; Fischlschweiger, M. High-Temperature Phase Behavior of Li2O-MnO with a Focus on the Liquid-to-Solid Transition. JOM 2023. [Google Scholar] [CrossRef]
- Bale, C.; Bélisle, E.; Chartrand, P.; Decterov, S.; Eriksson, G.; Gheribi, A.; Hack, K.; Jung, I.H.; Kang, Y.B.; Melançon, J.; Pelton, A.; Petersen, S.; Robelin, C.; Sangster, J.; Spencer, P.; Van Ende, M.A. FactSage thermochemical software and databases, 2010–2016. Calphad 2016, 54, 35–53. [Google Scholar] [CrossRef]
- Chakrabarty, S.; Li, H.; Fischlschweiger, M. Calphad-informed thermodynamic non-equilibrium simulation of non-isothermal solid-state reactions of magnesium aluminate spinel based on the thermodynamic extremal principle. Materialia 2023, 28, 101723. [Google Scholar] [CrossRef]
- Schirmer, T.; Qiu, H.; Li, H.; Goldmann, D.; Fischlschweiger, M. Li-Distribution in Compounds of the Li2O-MgO-Al2O3-SiO2-CaO System—A First Survey. Metals 2020, 10, 1633. [Google Scholar] [CrossRef]
- Sommerfeld, M.; Vonderstein, C.; Dertmann, C.; Klimko, J.; Oráč, D.; Miškufová, A.; Havlík, T.; Friedrich, B. A Combined Pyro- and Hydrometallurgical Approach to Recycle Pyrolyzed Lithium-Ion Battery Black Mass Part 1: Production of Lithium Concentrates in an Electric Arc Furnace. Metals 2020, 10, 1069. [Google Scholar] [CrossRef]
- Zhou, C.; Li, J.; Wang, S.; Zhao, J.; Ai, L.; Chen, Q.; Chen, Q.; Zhao, D. Development of Molecular Dynamics and Research Progress in the Study of Slag. Materials 2023, 16. [Google Scholar] [CrossRef] [PubMed]
- Kim, Y.; Park, H. Estimation of TiO2-FeO-Na2O slag viscosity through molecular dynamics simulations for an energy efficient ilmenite smelting process. Scientific Reports 2019, 9, 17338. [Google Scholar] [CrossRef] [PubMed]
- Ma, S.; Li, K.; Zhang, J.; Jiang, C.; Bi, Z.; Sun, M.; Wang, Z. Effect of MnO content on slag structure and properties under different basicity conditions: A molecular dynamics study. Journal of Molecular Liquids 2021, 336, 116304. [Google Scholar] [CrossRef]
- Liang, D.; Yan, Z.; Lv, X.; Zhang, J.; Bai, C. Transition of Blast Furnace Slag from Silicate-Based to Aluminate-Based: Structure Evolution by Molecular Dynamics Simulation and Raman Spectroscopy. Metallurgical and Materials Transactions B 2017, 48, 573–581. [Google Scholar] [CrossRef]
- Zhang, X.; Liu, C.; Jiang, M. Molecular Dynamics Simulations of Melt Structure Properties of CaO–Al2O3–Na2O Slag. Metallurgical and Materials Transactions B 2021, 52, 2604–2611. [Google Scholar] [CrossRef]
- Deng, L.; Zhang, X.; Zhang, M.; Jia, X. Effect of CaF2 on viscosity, structure and properties of CaO-Al2O3-MgO-SiO2 slag glass ceramics. Journal of Non-Crystalline Solids 2018, 500, 310–316. [Google Scholar] [CrossRef]
- Chen, Y.; Pan, W.; Jia, B.; Wang, Q.; Zhang, X.; Wang, Q.; He, S. Effects of the amphoteric behavior of Al2O3 on the structure and properties of CaO–SiO2–Al2O3 melts by molecular dynamics. Journal of Non-Crystalline Solids 2021, 552, 120435. [Google Scholar] [CrossRef]
- Hampel, S.; Alhafez, I.A.; Schirmer, T.; Merkert, N.; Wunderlich, S.; Schnickmann, A.; Li, H.; Fischlschweiger, M.; Fittschen, U.E.A. Engineering Compounds for the Recovery of Critical Elements from Slags: Melt Characteristics of Li 5 AlO 4 , LiAlO 2 , and LiAl 5 O 8. ACS Omega 2024. [Google Scholar] [CrossRef]
- Fittschen, U.E.; Hampel, S.; Schirmer, T.; Merkert, N. Multimodal spectroscopy and Molecular Dynamic simulations to understand redox-chemistry and compound formation in pyrometallurgical slags: example of manganese oxidation state with respect to lithium recycling. Applied Spectroscopy Reviews LAPS 2024. [Google Scholar] [CrossRef]
- Thompson, A.P.; Aktulga, H.M.; Berger, R.; Bolintineanu, D.S.; Brown, W.M.; Crozier, P.S.; in ’t Veld, P.J.; Kohlmeyer, A.; Moore, S.G.; Nguyen, T.D.; Shan, R.; Stevens, M.J.; Tranchida, J.; Trott, C.; Plimpton, S.J. LAMMPS - a flexible simulation tool for particle-based materials modeling at the atomic, meso, and continuum scales. Comp. Phys. Comm. 2022, 271, 108171. [Google Scholar] [CrossRef]
- Cormack, A.; Du, J. Molecular dynamics simulations of soda–lime–silicate glasses. Journal of Non-Crystalline Solids 2001, 293-295, 283–289, 8th Int. Conf. on Non-Crystalline Materials. [Google Scholar] [CrossRef]
- Sayle, T.X.T.; Ngoepe, P.E.; Sayle, D.C. Simulating Mechanical Deformation in Nanomaterials with Application for Energy Storage in Nanoporous Architectures. ACS Nano 2009, 3, 3308–3314. [Google Scholar] [CrossRef] [PubMed]
- Jain, A.; Ong, S.P.; Hautier, G.; Chen, W.; Richards, W.D.; Dacek, S.; Cholia, S.; Gunter, D.; Skinner, D.; Ceder, G.; Persson, K.A. Commentary: The Materials Project: A materials genome approach to accelerating materials innovation. APL Materials 2013, 1, 011002. [Google Scholar] [CrossRef]
- Stukowski, A. Visualization and analysis of atomistic simulation data with OVITO-the Open Visualization Tool. Modelling and Simulation in Materials Science and Engineering 2010, 18, 015012. [Google Scholar] [CrossRef]
- Pelton, A.D.; Degterov, S.A.; Eriksson, G.; Robelin, C.; Dessureault, Y. The modified quasichemical model I—Binary solutions. Metallurgical and Materials Transactions B 2000, 31, 651–659. [Google Scholar] [CrossRef]
- Pelton, A.D.; Chartrand, P. The modified quasi-chemical model: Part II. Multicomponent solutions. Metallurgical and Materials Transactions A 2001, 32, 1355–1360. [Google Scholar] [CrossRef]
- Pelton, A.D. A general “geometric” thermodynamic model for multicomponent solutions. Calphad 2001, 25, 319–328. [Google Scholar] [CrossRef]
- Seidler, G.T.; Mortensen, D.R.; Remesnik, A.J.; Pacold, J.I.; Ball, N.A.; Barry, N.; Styczinski, M.; Hoidn, O.R. A laboratory-based hard x-ray monochromator for high-resolution x-ray emission spectroscopy and x-ray absorption near edge structure measurements. Review of Scientific Instruments 2014, 85, 113906. [Google Scholar] [CrossRef] [PubMed]
- Jahrman, E.P.; Holden, W.M.; Ditter, A.S.; Mortensen, D.R.; Seidler, G.T.; Fister, T.T.; Kozimor, S.A.; Piper, L.F.J.; Rana, J.; Hyatt, N.C.; Stennett, M.C. An improved laboratory-based x-ray absorption fine structure and x-ray emission spectrometer for analytical applications in materials chemistry research. Review of Scientific Instruments 2019, 90, 024106. [Google Scholar] [CrossRef] [PubMed]
- Lutz, C.; Fittschen, U.E.A. Laboratory XANES to study vanadium species in vanadium redox flow batteries. Powder Diffraction 2020, pp. 1–5. [CrossRef]
- Ravel, B.; Newville, M. ATHENA, ARTEMIS, HEPHAESTUS: data analysis for X-ray absorption spectroscopy using IFEFFIT. J. Synchrotron Radiat. 2005, 12, 537–541. [Google Scholar] [CrossRef] [PubMed]
- Gates-Rector, S.; Blanton, T. The Powder Diffraction File: a quality materials characterization database. Powder Diffraction 2019, 34, 352–360. [Google Scholar] [CrossRef]
- Rodríguez-Carvajal, J. Recent advances in magnetic structure determination by neutron powder diffraction. Physica B: Condensed Matter 1993, 192, 55–69. [Google Scholar] [CrossRef]
- Jercinovic, M.J.; Williams, M.L.; Allaz, J.; Donovan, J.J. Trace analysis in EPMA. IOP Conference Series: Materials Science and Engineering 2012, 32, 012012. [Google Scholar] [CrossRef]
- Jokubauskas, P. HussariX. https://github.com/sem-geologist/HussariX, 2024. [Online; accessed 16.01.2024].
- Mosselmans, J.F.W.; Quinn, P.D.; Dent, A.J.; Cavill, S.A.; Moreno, S.D.; Peach, A.; Leicester, P.J.; Keylock, S.J.; Gregory, S.R.; Atkinson, K.D.; Rosell, J.R. I18–the microfocus spectroscopy beamline at the Diamond Light Source. Journal of Synchrotron Radiation 2009, 16, 818–824. [Google Scholar] [CrossRef] [PubMed]
- Basham, M.; Filik, J.; Wharmby, M.T.; Chang, P.C.Y.; El Kassaby, B.; Gerring, M.; Aishima, J.; Levik, K.; Pulford, B.C.A.; Sikharulidze, I.; Sneddon, D.; Webber, M.; Dhesi, S.S.; Maccherozzi, F.; Svensson, O.; Brockhauser, S.; Náray, G.; Ashton, A.W. Data Analysis WorkbeNch (DAWN). Journal of Synchrotron Radiation 2015, 22, 853–858. [Google Scholar] [CrossRef] [PubMed]
- Filik, J.; Ashton, A.W.; Chang, P.C.Y.; Chater, P.A.; Day, S.J.; Drakopoulos, M.; Gerring, M.W.; Hart, M.L.; Magdysyuk, O.V.; Michalik, S.; Smith, A.; Tang, C.C.; Terrill, N.J.; Wharmby, M.T.; Wilhelm, H. Processing two-dimensional X-ray diffraction and small-angle scattering data in DAWN 2. Journal of applied crystallography 2017, 50, 959–966. [Google Scholar] [CrossRef]
- Lerotic, M.; Mak, R.; Wirick, S.; Meirer, F.; Jacobsen, C. MANTiS: a program for the analysis of X-ray spectromicroscopy data. Journal of Synchrotron Radiation 2014, 21, 1206–1212. [Google Scholar] [CrossRef]
- Liu, Y.; Meirer, F.; Williams, P.A.; Wang, J.; Andrews, J.C.; Pianetta, P. TXM-Wizard: a program for advanced data collection and evaluation in full-field transmission X-ray microscopy. Journal of Synchrotron Radiation 2012, 19, 281–287. [Google Scholar] [CrossRef] [PubMed]
- Kieffer, J.; Karkoulis, D. PyFAI, a versatile library for azimuthal regrouping. Journal of Physics: Conference Series 2013, 425, 202012. [Google Scholar] [CrossRef]
- Kieffer, J.; Wright, J.P. PyFAI: a Python library for high performance azimuthal integration on GPU. Powder Diffraction 2013, 28, S339–S350. [Google Scholar] [CrossRef]
- Paulsen, J.M.; Dahn, J.R. Phase Diagram of Li-Mn-O Spinel in Air. Chemistry of Materials 1999, 11, 3065–3079. [Google Scholar] [CrossRef]
- Sasabe, M.; Asamura, A. Transport phenomenon of oxygen through molten slags. 2nd International Symposium on Metallurgical Slags and Fluxes, 1984 (2nd Int Symp Metall Slags Fluxes 1984) 1984, pp. 651–667.
- Schirmer, T. STOICHIOMETRIC CALCULATION OF LITHIUM-CONTAINING PHASES BASED ON SPATIALLY RESOLVED X-RAY ANALYSIS AND VIRTUAL COMPOUNDS. Advances in X-Ray Analysis 2022, 65, 45–56. [Google Scholar]
- Gaur, A.; Shrivastava, B.D. Speciation using X-ray absorption fine structure (XAFS). Review Journal of Chemistry 2015, 5, 361–398. [Google Scholar] [CrossRef]



| Interaction | A (eV) | (Å) | C (eV Å) | charge | |
|---|---|---|---|---|---|
| Li−Li | 270000.00 | 0.143 | 0.00 | 0.55 | |
| Li−Mn | 0.00 | 0.00 | 0.00 | ||
| Li−O | 30000.00 | 0.154 | 0.00 | ||
| Mn−Mn | 33883.92 | 0.156 | 16.00 | 1.65 | |
| Mn−O | 18645.84 | 0.195 | 22.00 | ||
| O−O | 11782.76 | 0.234 | 30.22 | -1.1 | |
| Interaction | A (eV) | (Å) | C (eV Å) | charge | |
| Ca−Ca | 10000.00 | 0.2300 | 0.00 | 1.2 | |
| Ca−Si | 0.00 | 0.00 | 0.00 | ||
| Ca−O | 131400.0 | 0.1875 | 60.00 | ||
| Si−Si | 0.00 | 0.00 | 0.00 | 2.4 | |
| Si−O | 18003.7572 | 0.2052 | 133.5381 | ||
| O−O | 1388.773 | 0.36232 | 175.0 | -1.2 |
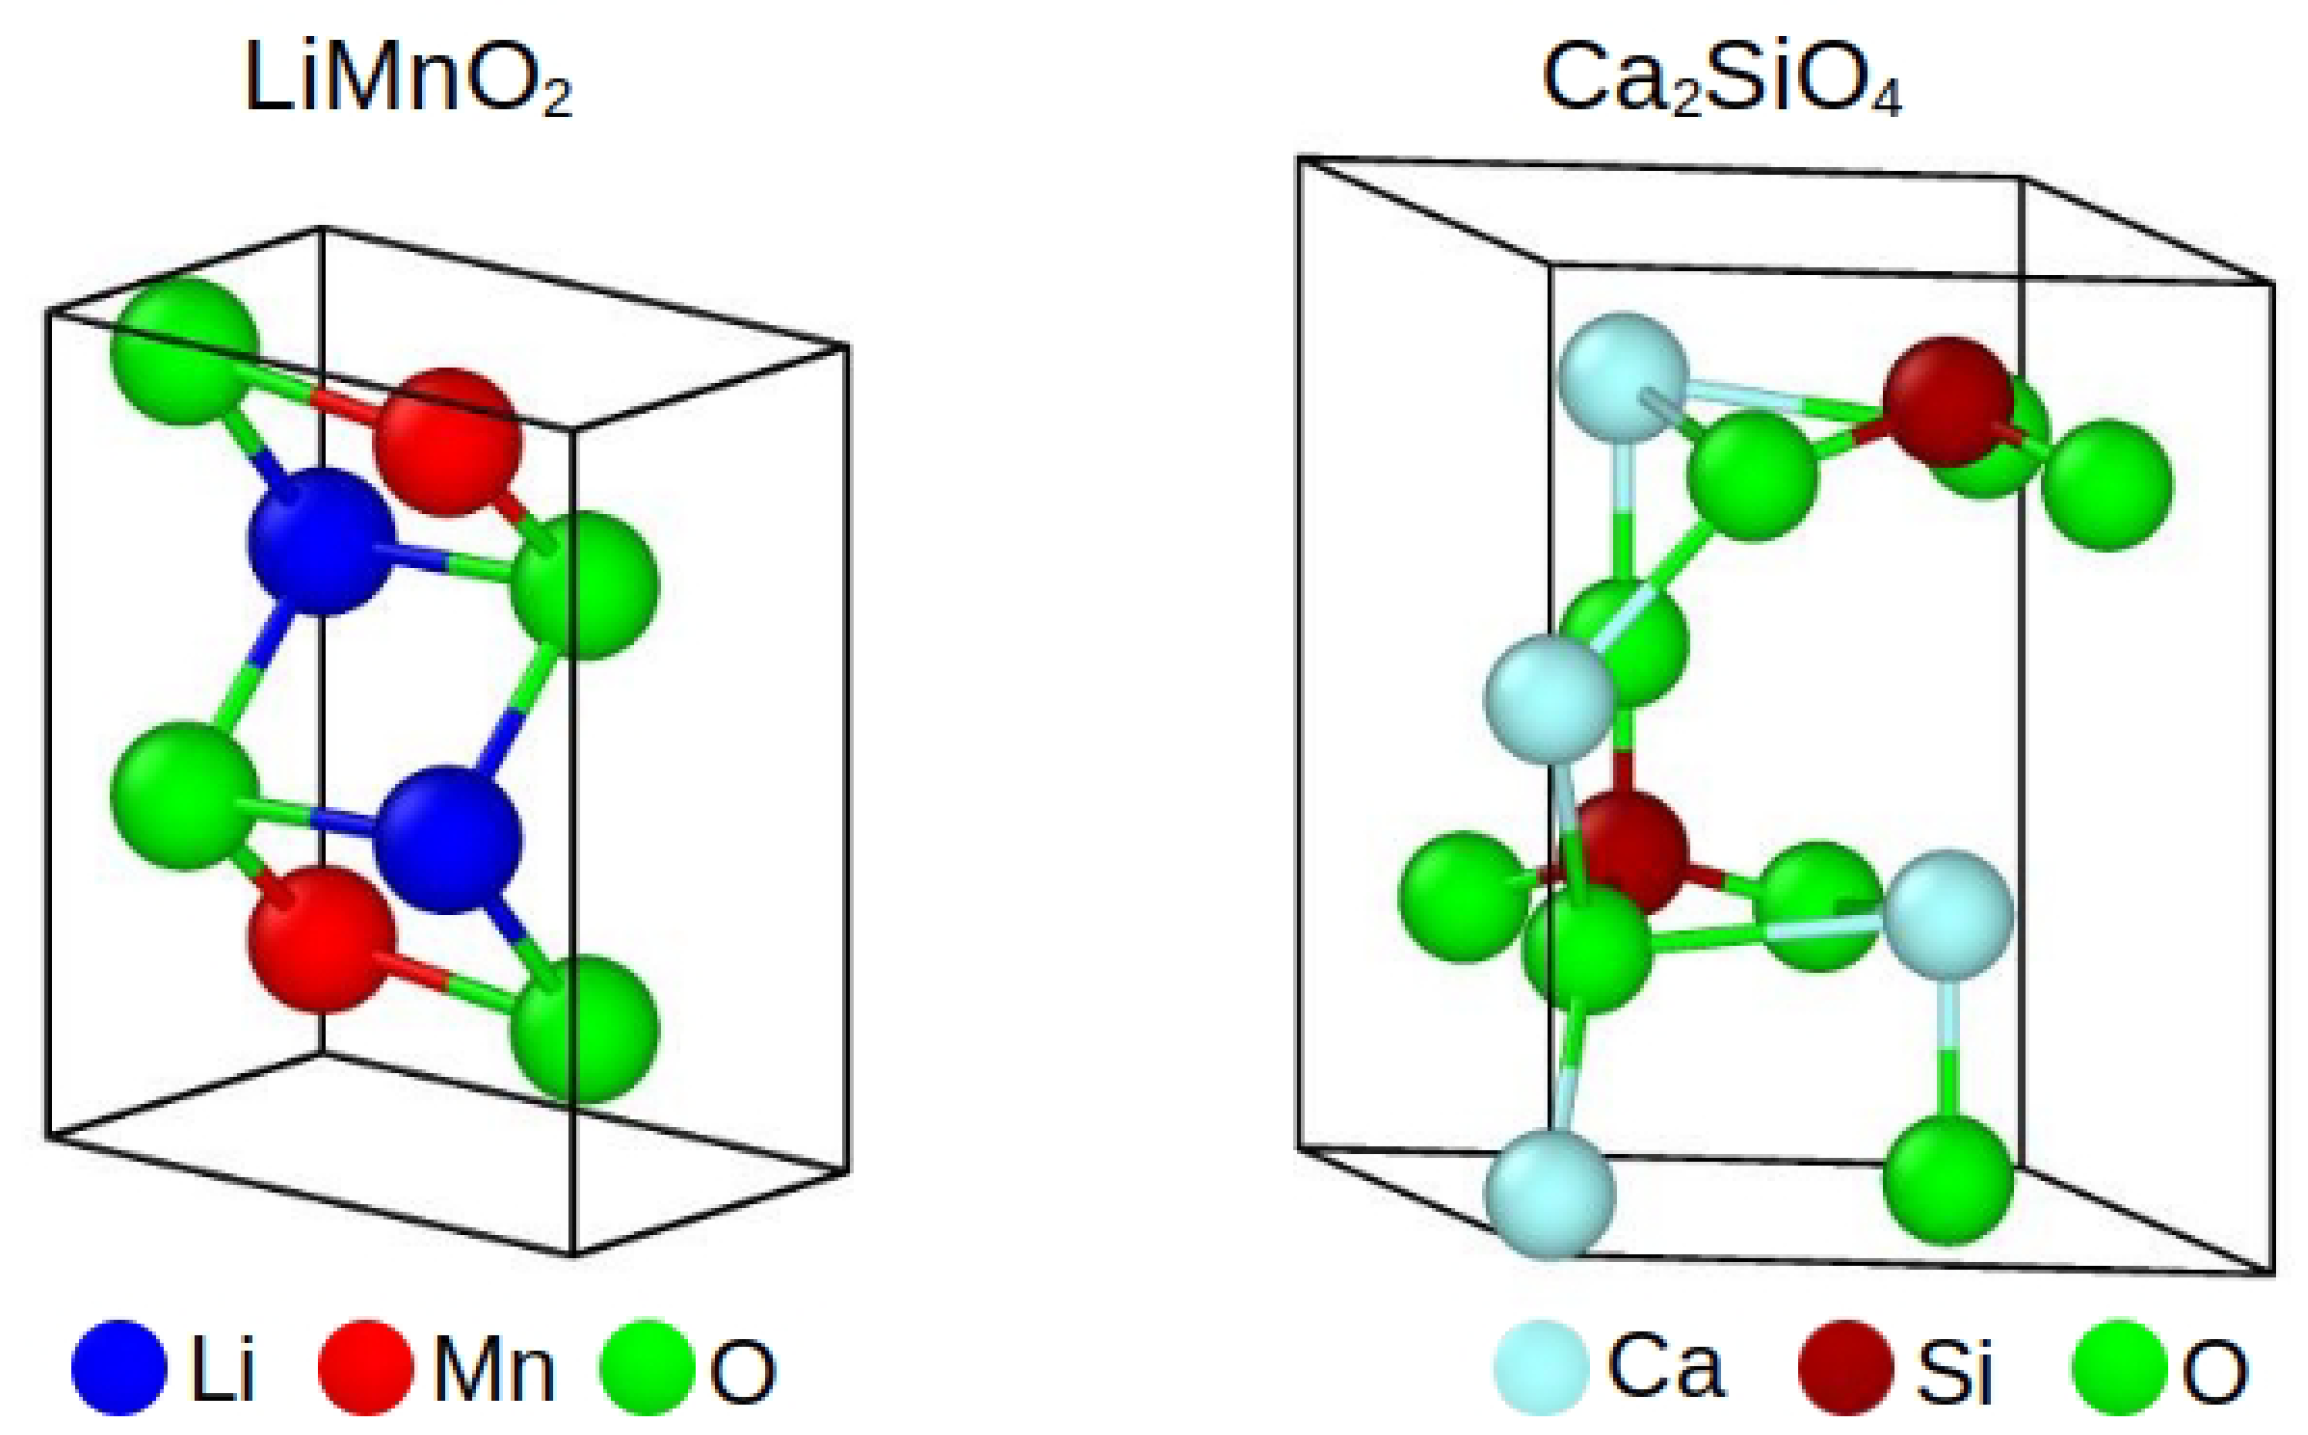
| Compound | Crystal System | Space Group | Volume (Å) | Number of Atoms |
|---|---|---|---|---|
| LiMnO | Orthorhombic | Pmmn | 151165 | 16416 |
| CaSiO | Hexagonal | P6mc | 202262 | 14112 |
| mass fraction / wt% | lithium | silicon | calcium | manganese |
|---|---|---|---|---|
| expected | 2.4 | 13.0 | 37.2 | 9.3 |
| precursor | 1.7 ± 0.1 | 8.9 ± 0.4 | 26.3 ± 0.7 | 6.6 ± 0.6 |
| final slag (run A) | 2.1 ± 0.1 | 12.3 ± 0.4 | 34.9 ± 0.7 | 9.7 ± 0.6 |
| final slag (run B) | 2.0 ± 0.1 | 12.7 ± 0.4 | 36.0 ± 0.7 | 9.3 ± 0.6 |
| molar fraction / mol% | lithium | silicon | calcium | manganese |
| expected | 18.0 | 24.4 | 48.7 | 9.0 |
| precursor | 18.0 ± 1.5 | 23.8 ± 1.5 | 49.2 ± 2.6 | 9.0 ± 0.9 |
| final slag (run A) | 17.0 ± 1.1 | 24.5 ± 1.2 | 48.6 ± 1.9 | 9.8 ± 0.7 |
| final slag (run B) | 16.2 ± 1.1 | 24.9 ± 1.2 | 49.6 ± 1.9 | 9.3 ± 0.7 |
| phase 1: (CaMn)(Si)O | phase 2: (LiMg)MnO | |||||
|---|---|---|---|---|---|---|
| mass fraction / wt% | CaSiO | MnSiO | total | LiMnO | MgMnO | total |
| Li | – | – | – | 6.83 | – | 6.83 |
| Mn(II) | – | 0.64 | 0.64 | – | – | – |
| Mn(III) | – | – | – | 54.03 | 4.13 | 58.16 |
| Si | 15.62 | 0.16 | 15.78 | – | – | – |
| Ca | 45.70 | – | 45.70 | – | – | – |
| Mg | – | – | – | – | 0.91 | 0.91 |
| O | 36.03 | 0.37 | 36.41 | 31.47 | 2.40 | 33.88 |
| sum | 97.35 | 1.17 | 98.52 | 92.33 | 7.45 | 99.78 |
Disclaimer/Publisher’s Note: The statements, opinions and data contained in all publications are solely those of the individual author(s) and contributor(s) and not of MDPI and/or the editor(s). MDPI and/or the editor(s) disclaim responsibility for any injury to people or property resulting from any ideas, methods, instructions or products referred to in the content. |
© 2024 by the authors. Licensee MDPI, Basel, Switzerland. This article is an open access article distributed under the terms and conditions of the Creative Commons Attribution (CC BY) license (http://creativecommons.org/licenses/by/4.0/).


