Submitted:
03 June 2024
Posted:
05 June 2024
You are already at the latest version
Abstract
Keywords:
1. Introduction
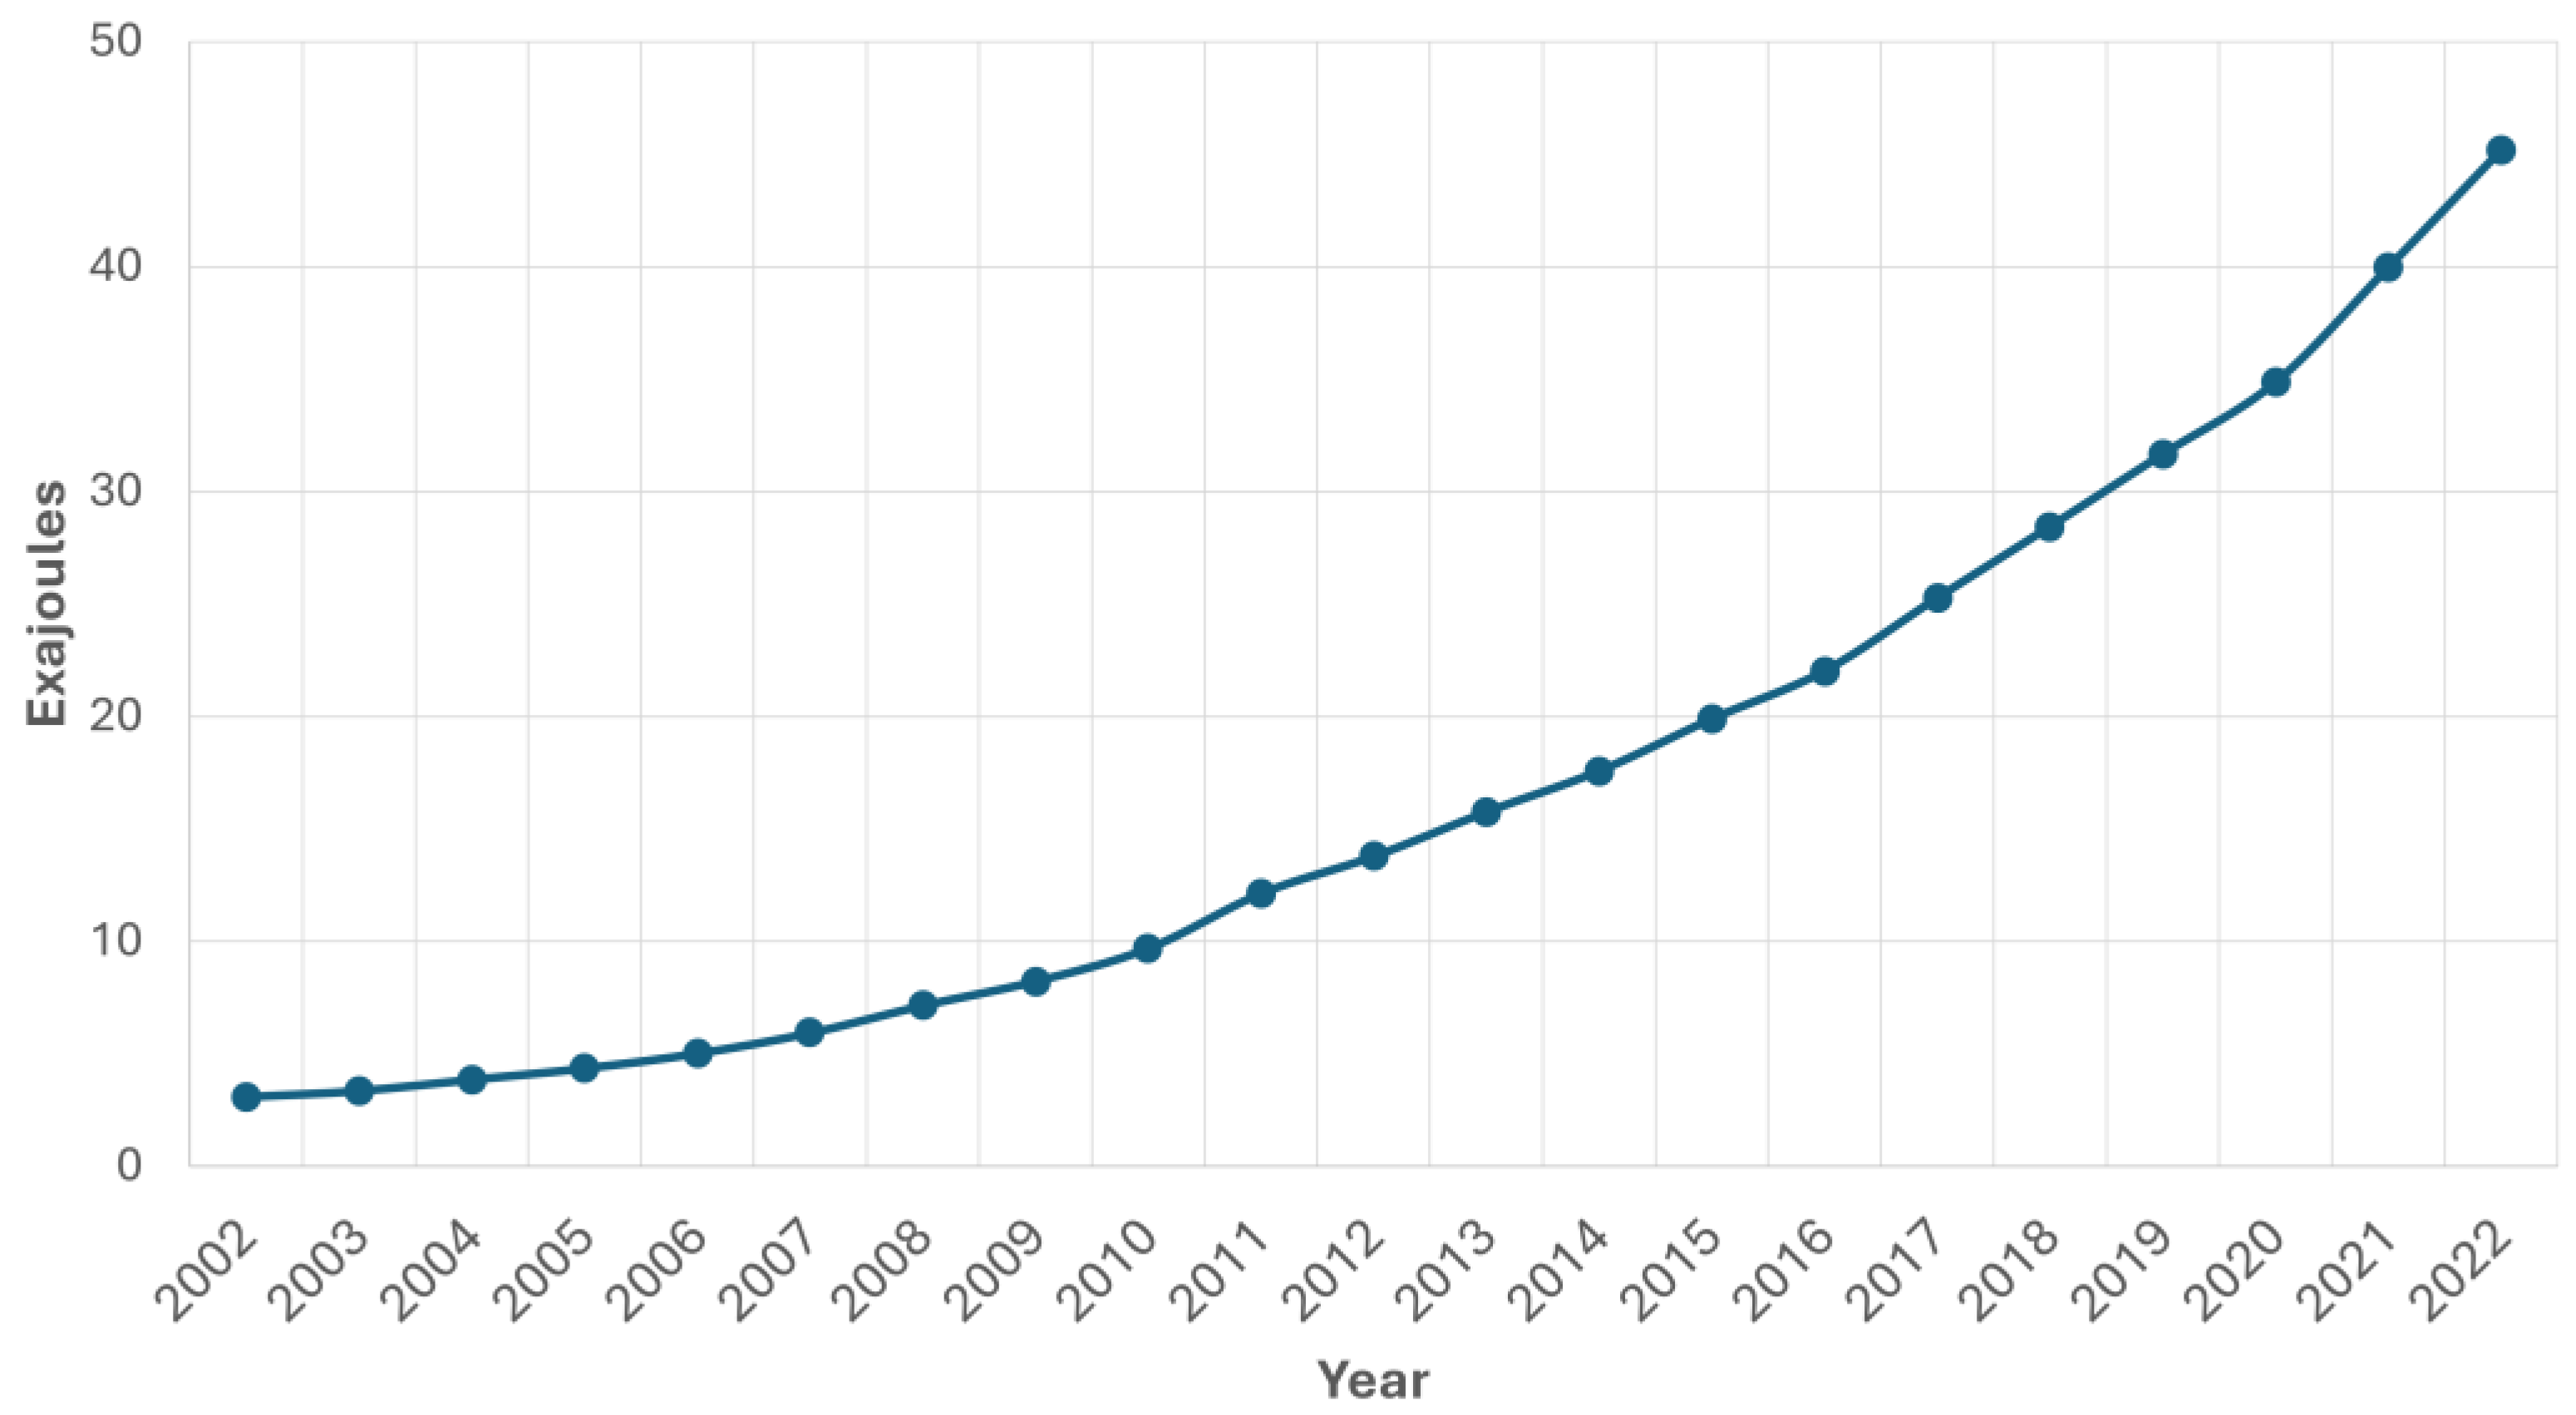
1.1. Current Energy Problems
- A disproportionate population growth, which demands higher and higher energy, especially in emerging areas.
- On the other hand, keeping rural population is essential to avoid overcrowding or mass tourism, which could negatively affect the environment.
- Linked with the above, the energy and raw material dependence (especially related to petroleum-based products), which could imply deep inequalities between countries.
- The economic growth of developing countries, where all the levels of production or exploitation (from households to industries) should be especially sustainable, in order to avoid past mistakes in developed countries.
- Related with the above, the typical environmental challenges are more relevant than ever, observing different problems such as desertification, climate change, air, soil and water pollution, etc. [4].
1.2. Biomass: Foundations and Conversion Processes
- Heat production: This is the simplest way to exploit biomass, especially in households. There are some specific industrial uses, as in boilers or ceramic furnaces, but public centers or neighborhoods could feed stoves for heating.
- Electricity production: Electricity can be produced through combustion or anaerobic digestion of some wastes to produce biogas, to be used in thermal power plants.
- Clean fuel production: As in the case of biodiesel through transesterification of vegetable oils or bioalcohols from sugars (to produce ethanol through fermentation).
1.3. Biomass Stove
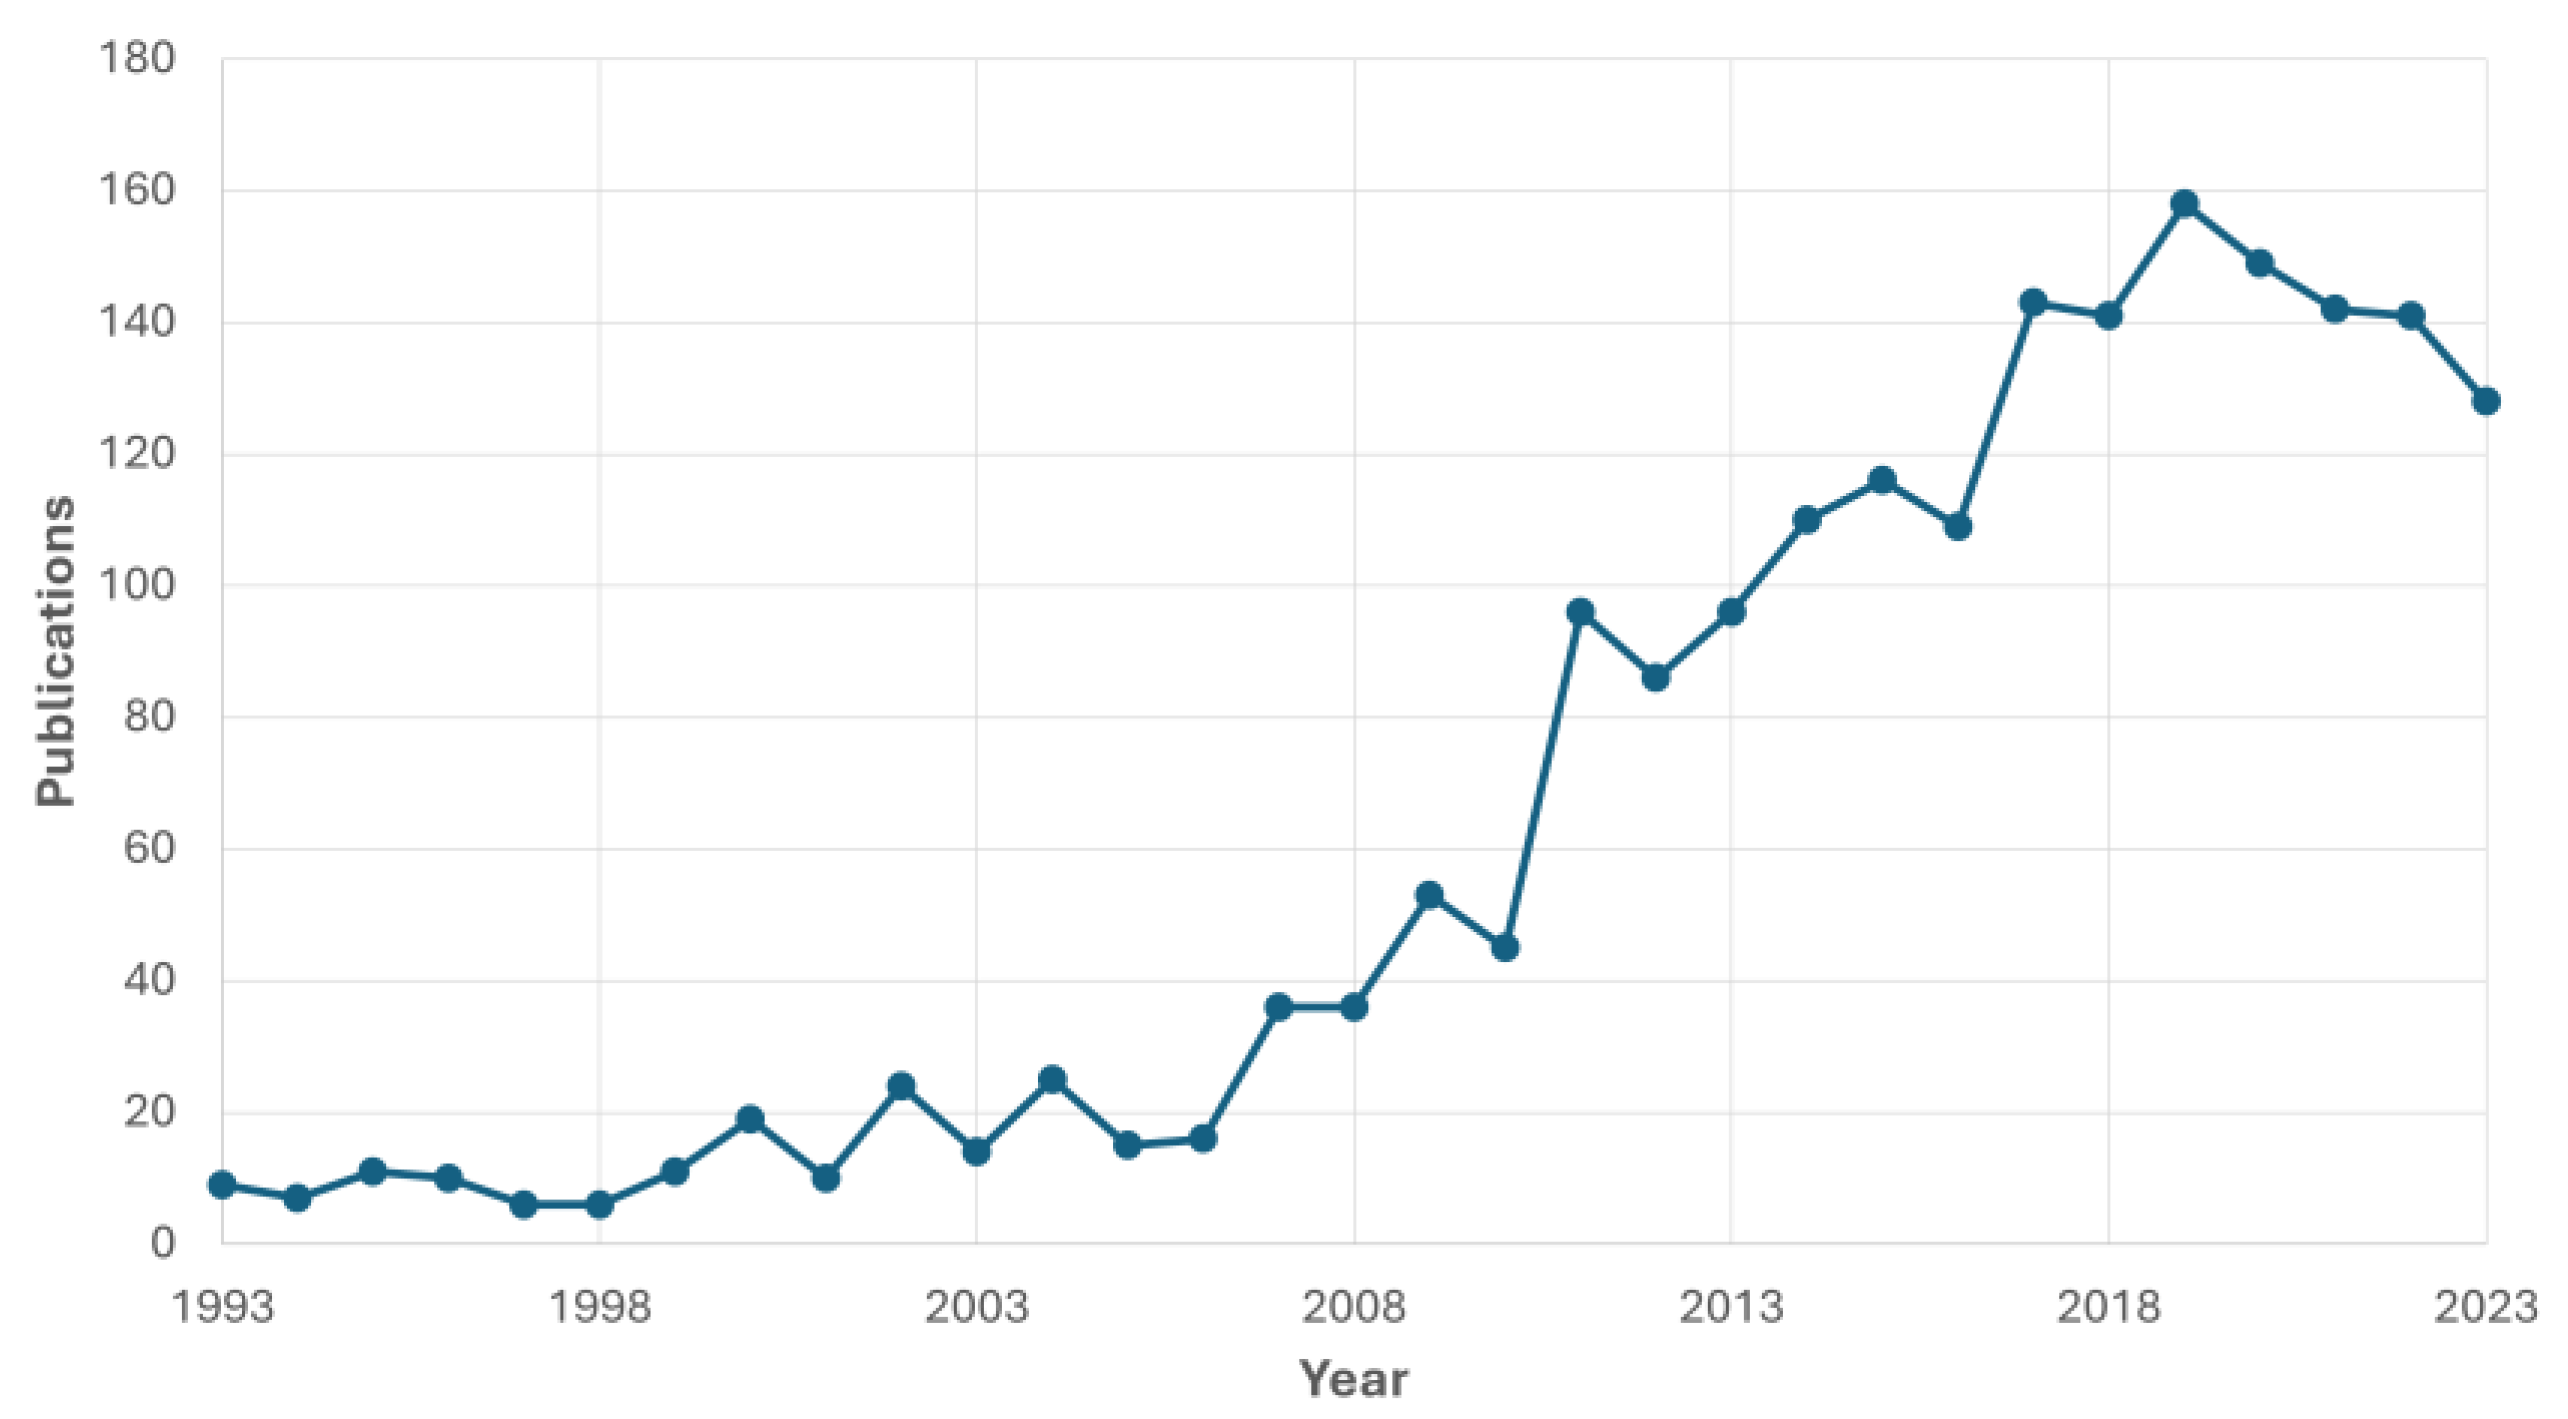
1.4. Scientific Interest
1.5. Aim and Scope
- Study of combustion of different biomass waste (holm oak, pear tree, poplar, and sugarcane bagasse) in a stove to assess the combustion performance and applications for thermal purposes.
- Carry out suitable modifications in the combustion system for heat generation, trying to achieve higher energy yields. For that purpose, the components of the stove were controlled manually, avoiding the automatic working regime.
2. Materials and Methods
2.1. Raw Material
2.2. Experimental Facility
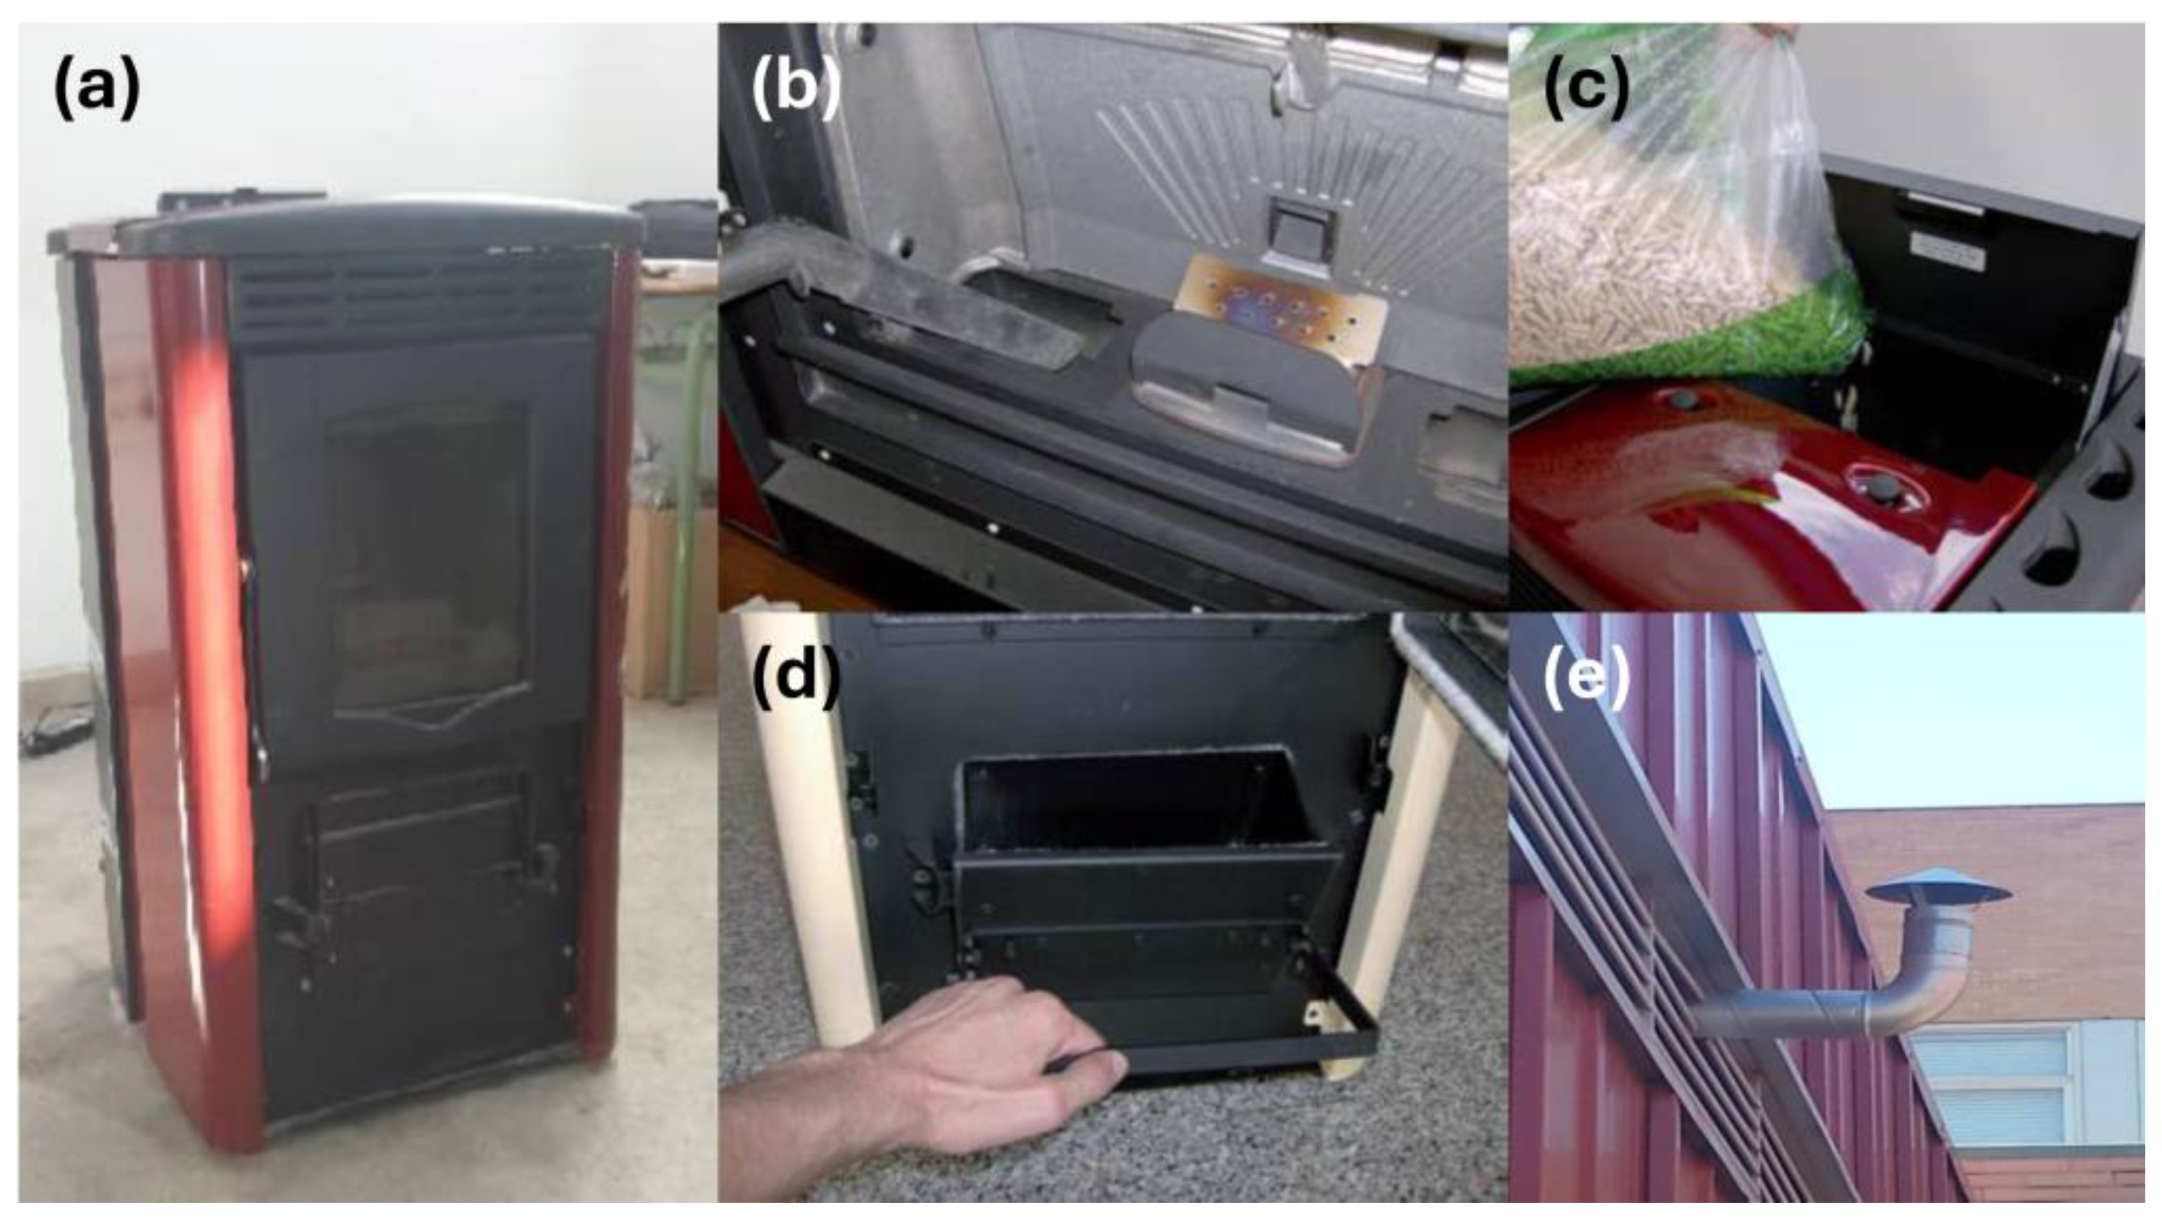
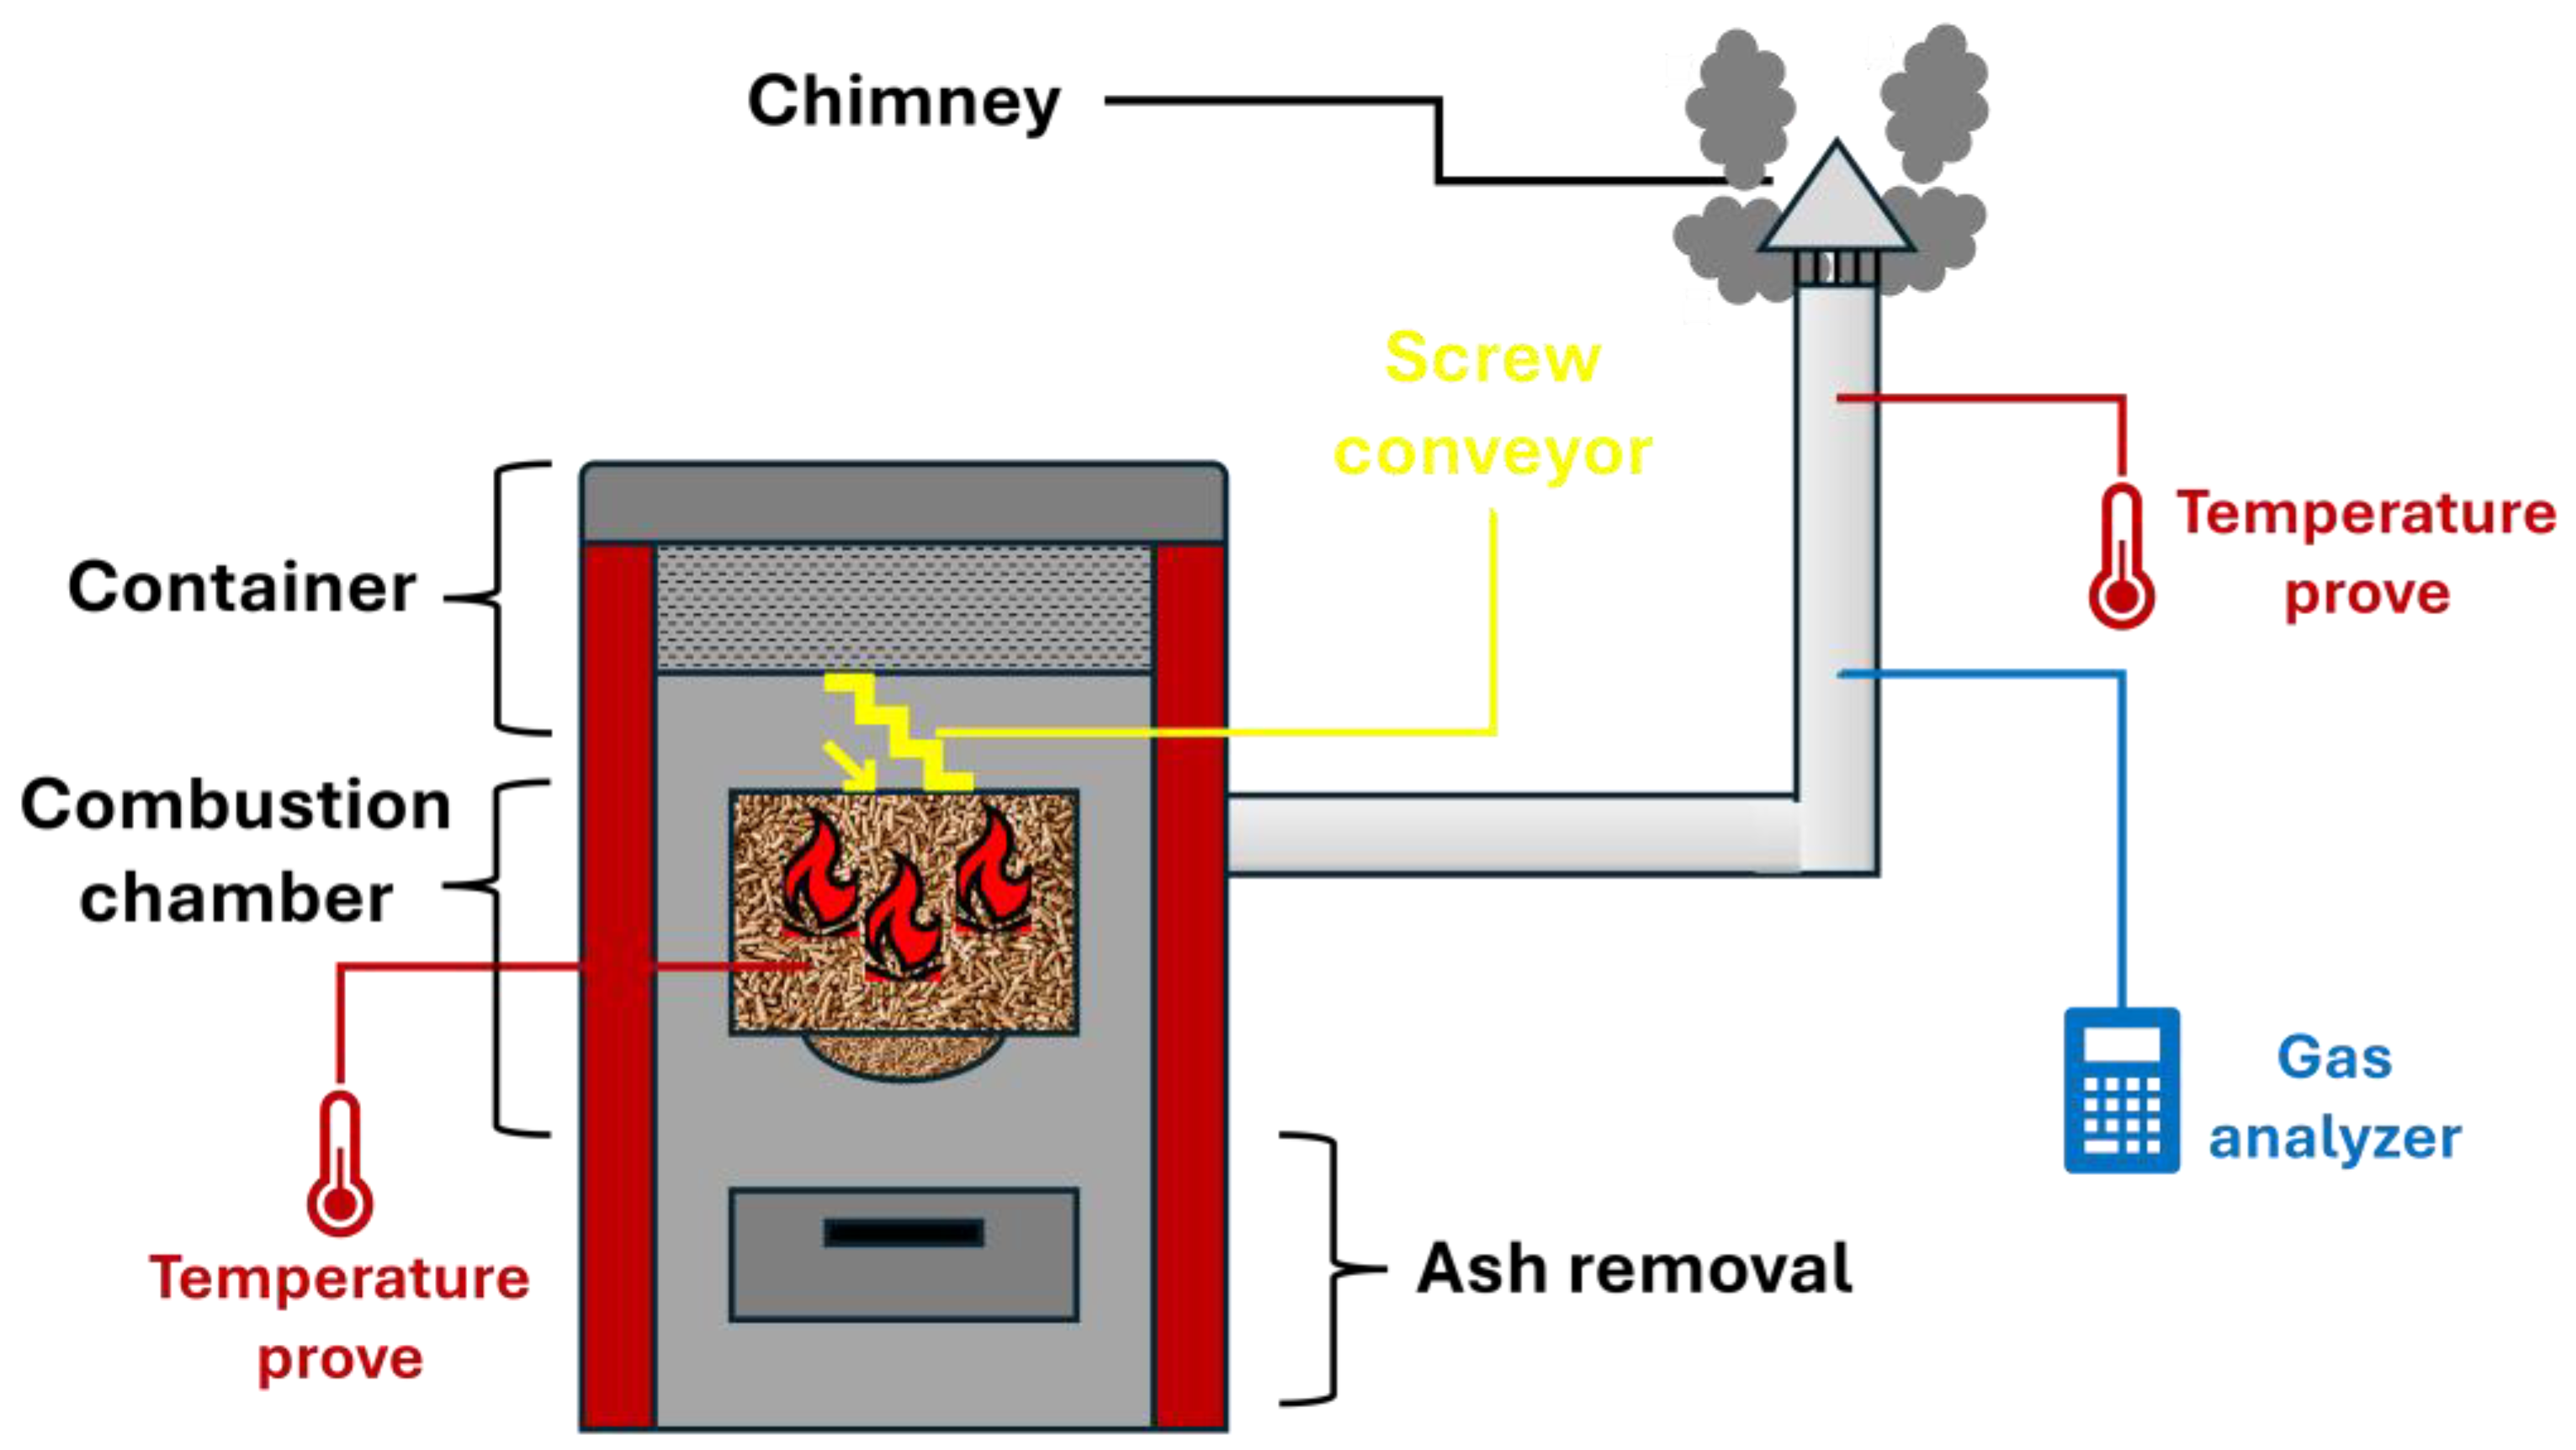
- Container. This is the place where pellets are stored before its combustion.
- Ash container. Once ash is generated during combustion, and accumulated in the ash container, with the subsequent removal (Figure 7d).
- Fuel feeding system. The system consists of a screw conveyor, which will be regulated by the use of the programmable logic controller (PLC).
- Control system. As previously mentioned, pellet supply to the combustion chamber will be controlled by the use of a PLC system, including temperature probes to control the whole process.
- Fan. The combustion chamber is equipped with a fan to provide air to the room. The power of this fan can be modified.
- Chimney (Figure 7e), for the removal of flue gas.
- Actuators: These are components that, on the contrary of sensors, can transform an electric input into a physical output (position, rotation, solenoid activation, etc.). Thus, a programmable logic controller (PLC) can manipulate the operation mode different components to adjust the optimum working regime of the equipment. In this case, the actuators are the screw conveyor and the fans.
- Sensors: These are devices that can detect physical (or chemical) inputs, called instrumentation variables, which are converted to electric signals. These variables can be temperature, light intensity, distance, acceleration, etc. These electric signals are sent to the PLC (motherboard), which interprets them and correct the working mode of actuators. In this case, the sensors are the temperature probes, oxygen probe (to measure flue gas) and the depressometer/manometer.
2.3. Working Regime, Operating Conditions and Modifications
- Stroboscope: it is used to measure the rpm at which the flue gas fan rotates. For this purpose, a stroboscope Lutron (DT 2269, Coopersburg, PA, United States), capable of measuring from 5 to 10500 rpm, was selected.
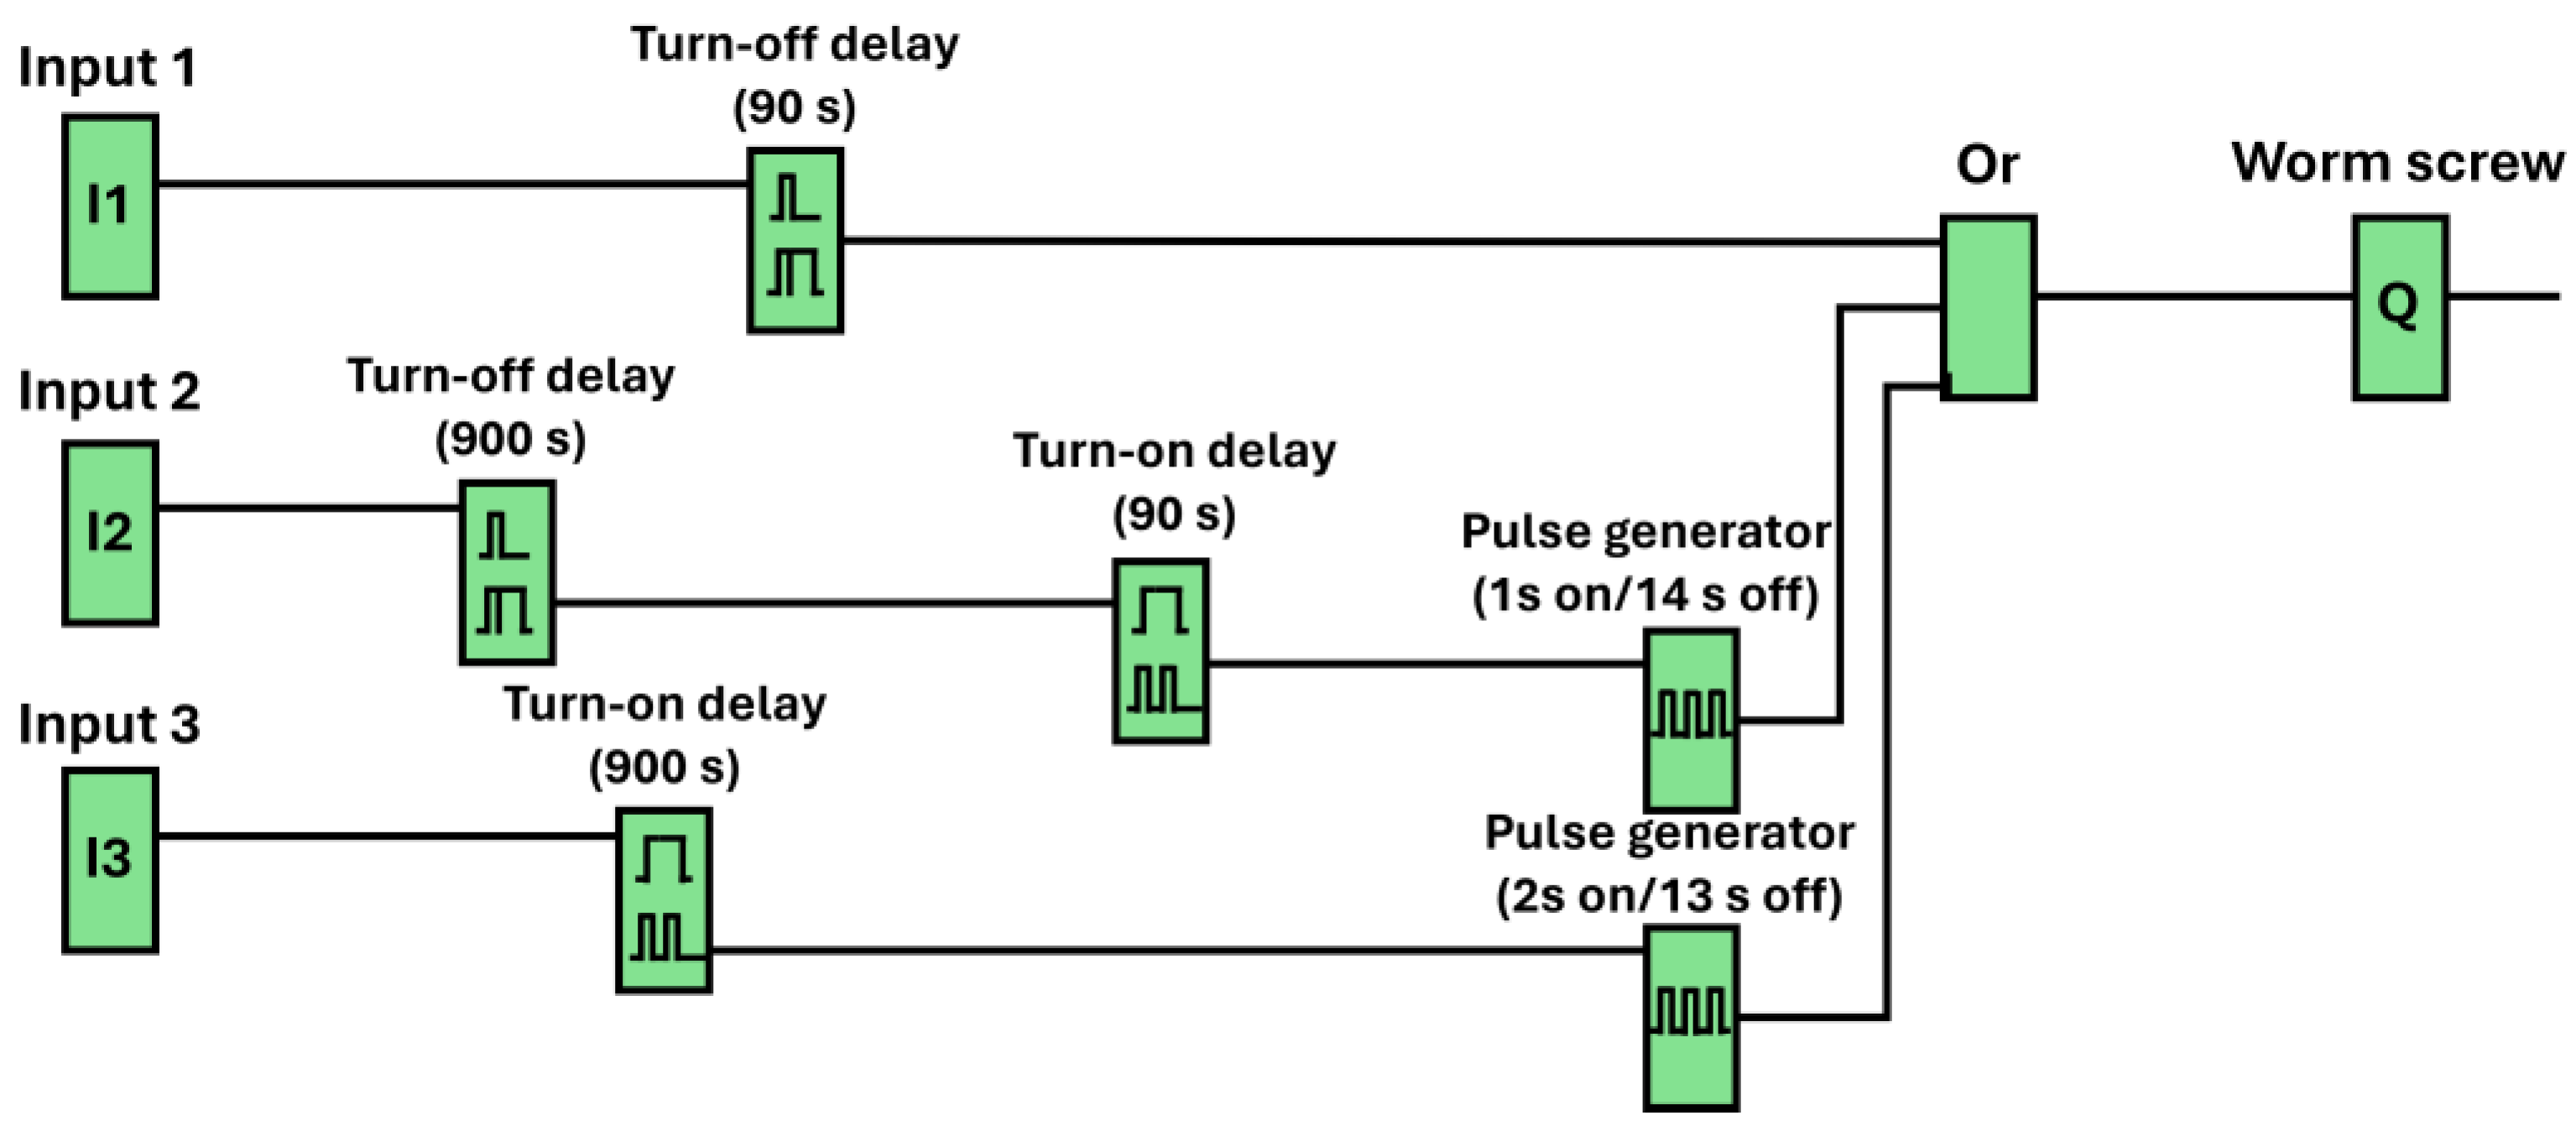
- Programable logic controller: Once the behavior of the main components of the stove, another PLC was installed, apart from the factory installed PLC, to alternatively control the screw conveyor (see the functioning scheme in Figure 9). Thus, the operating and stopping times will be changed compared to the automatic working regime of the stove.
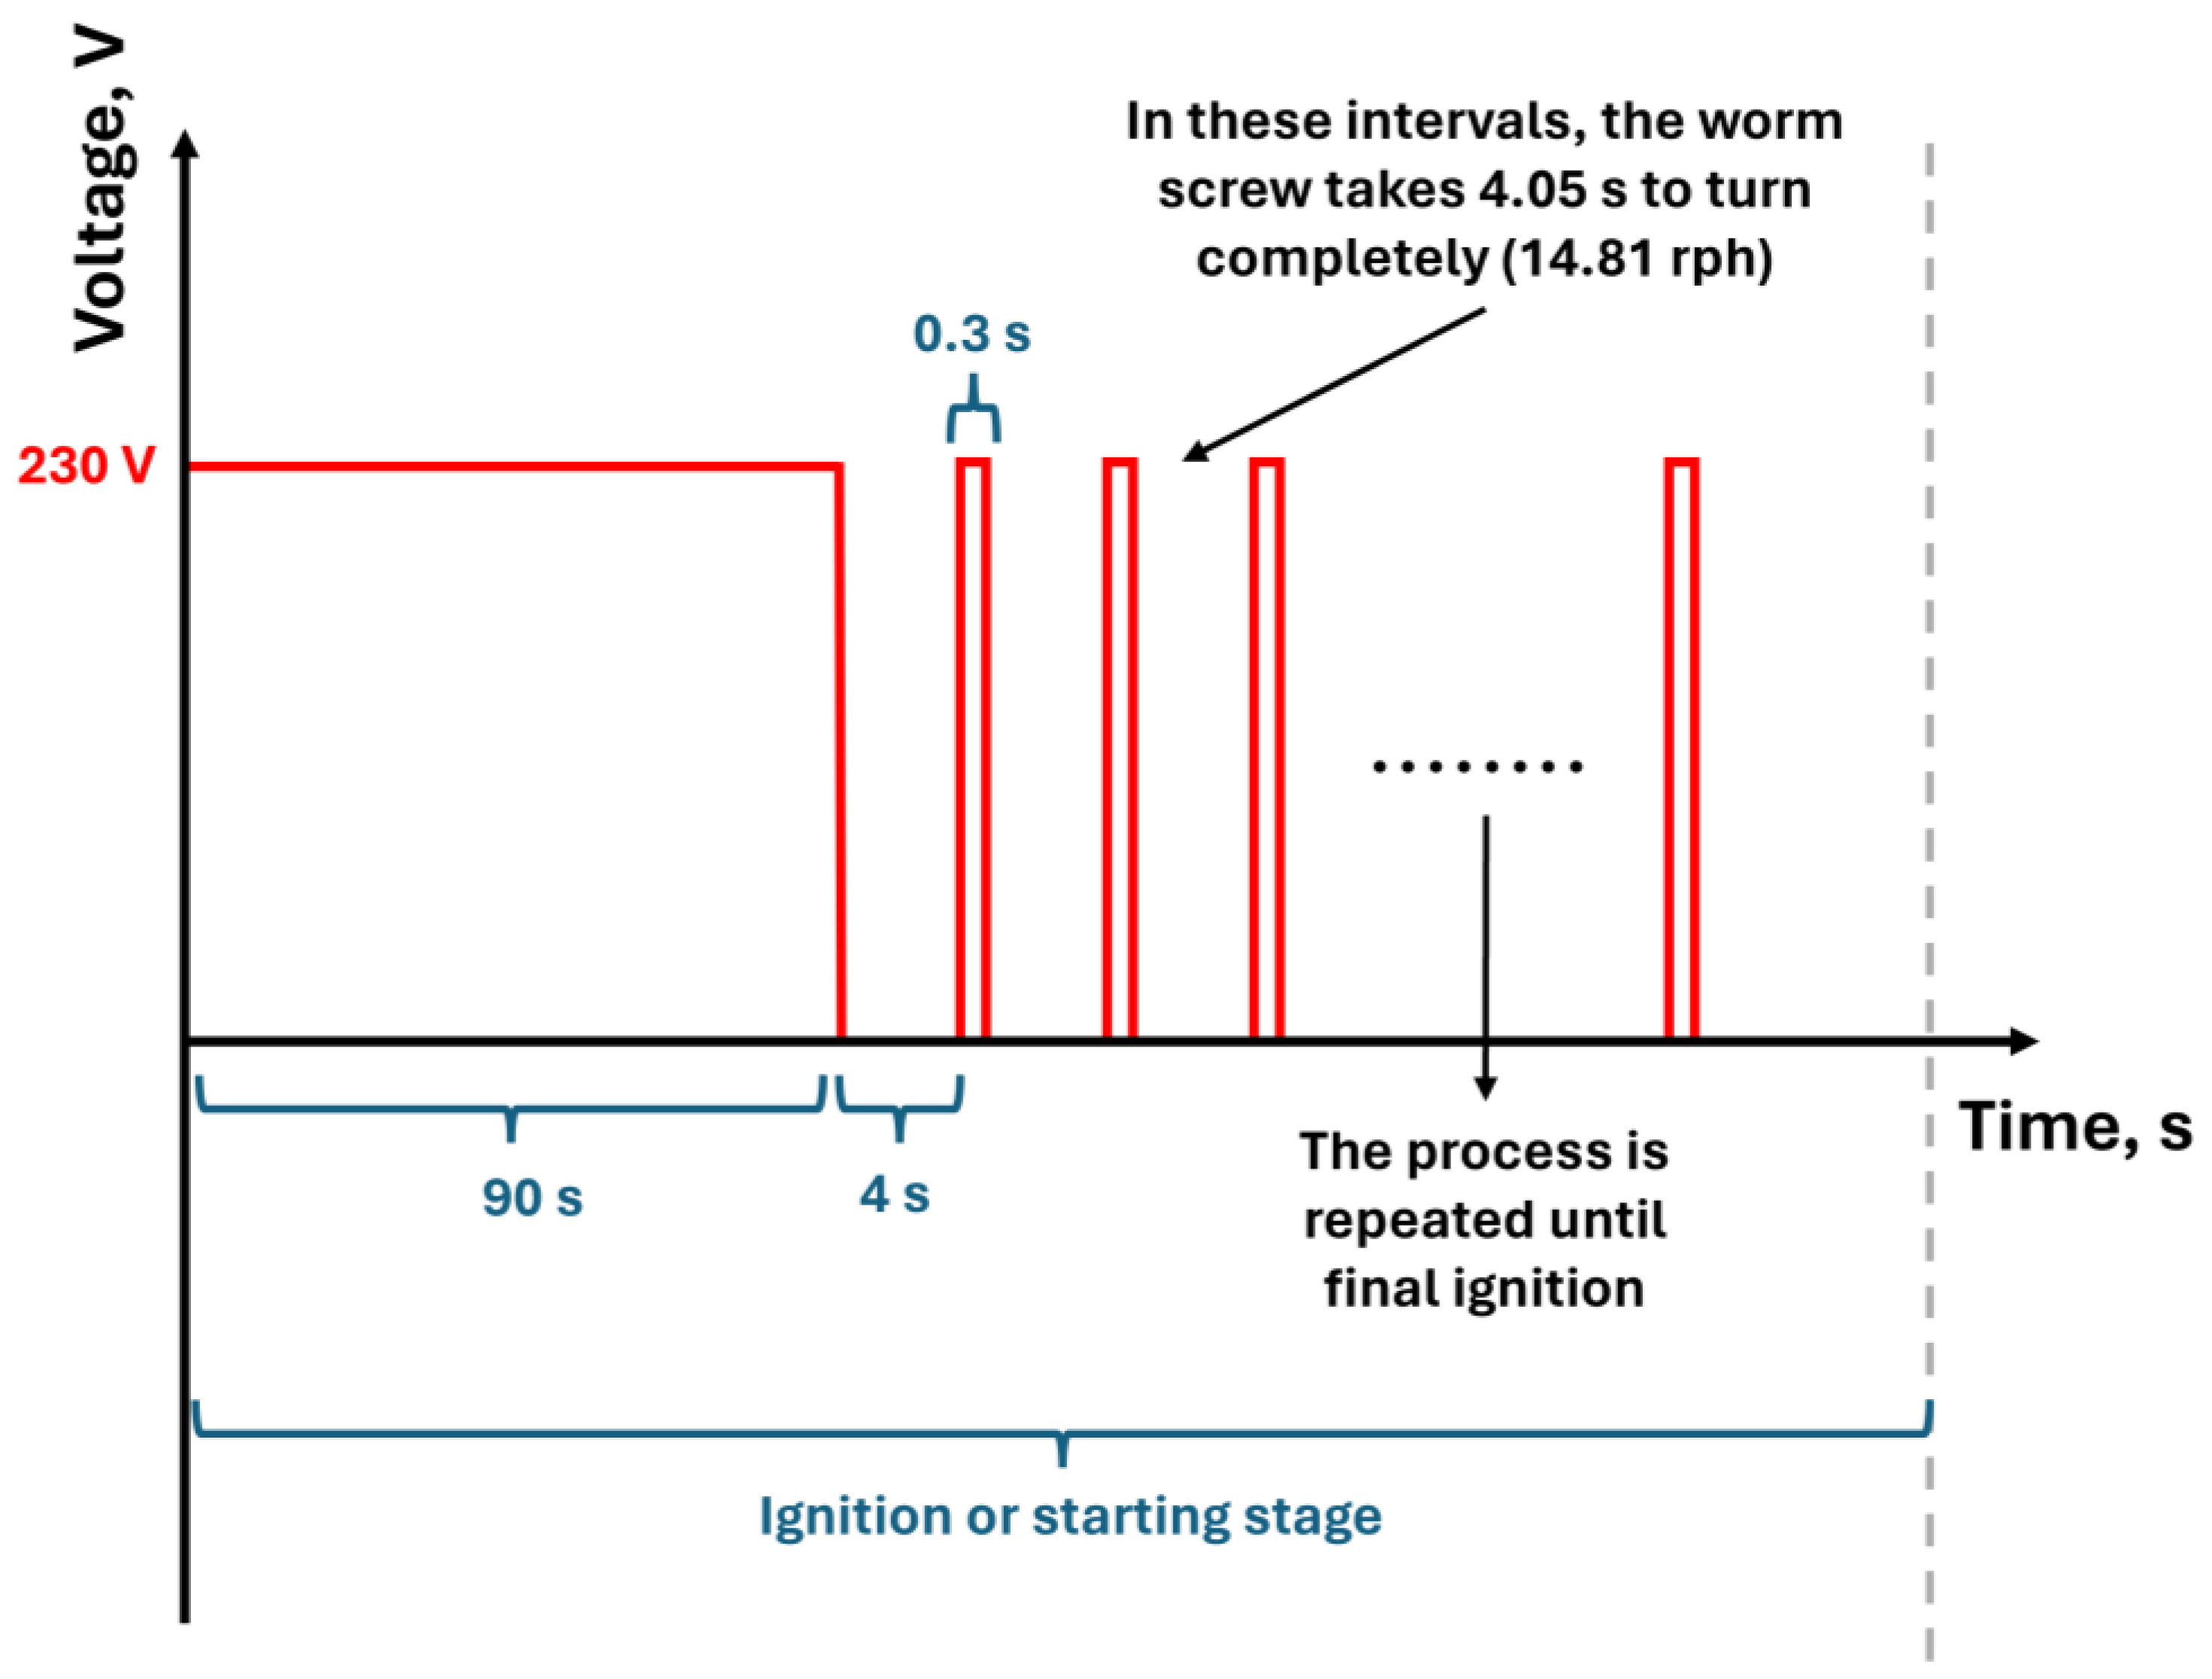
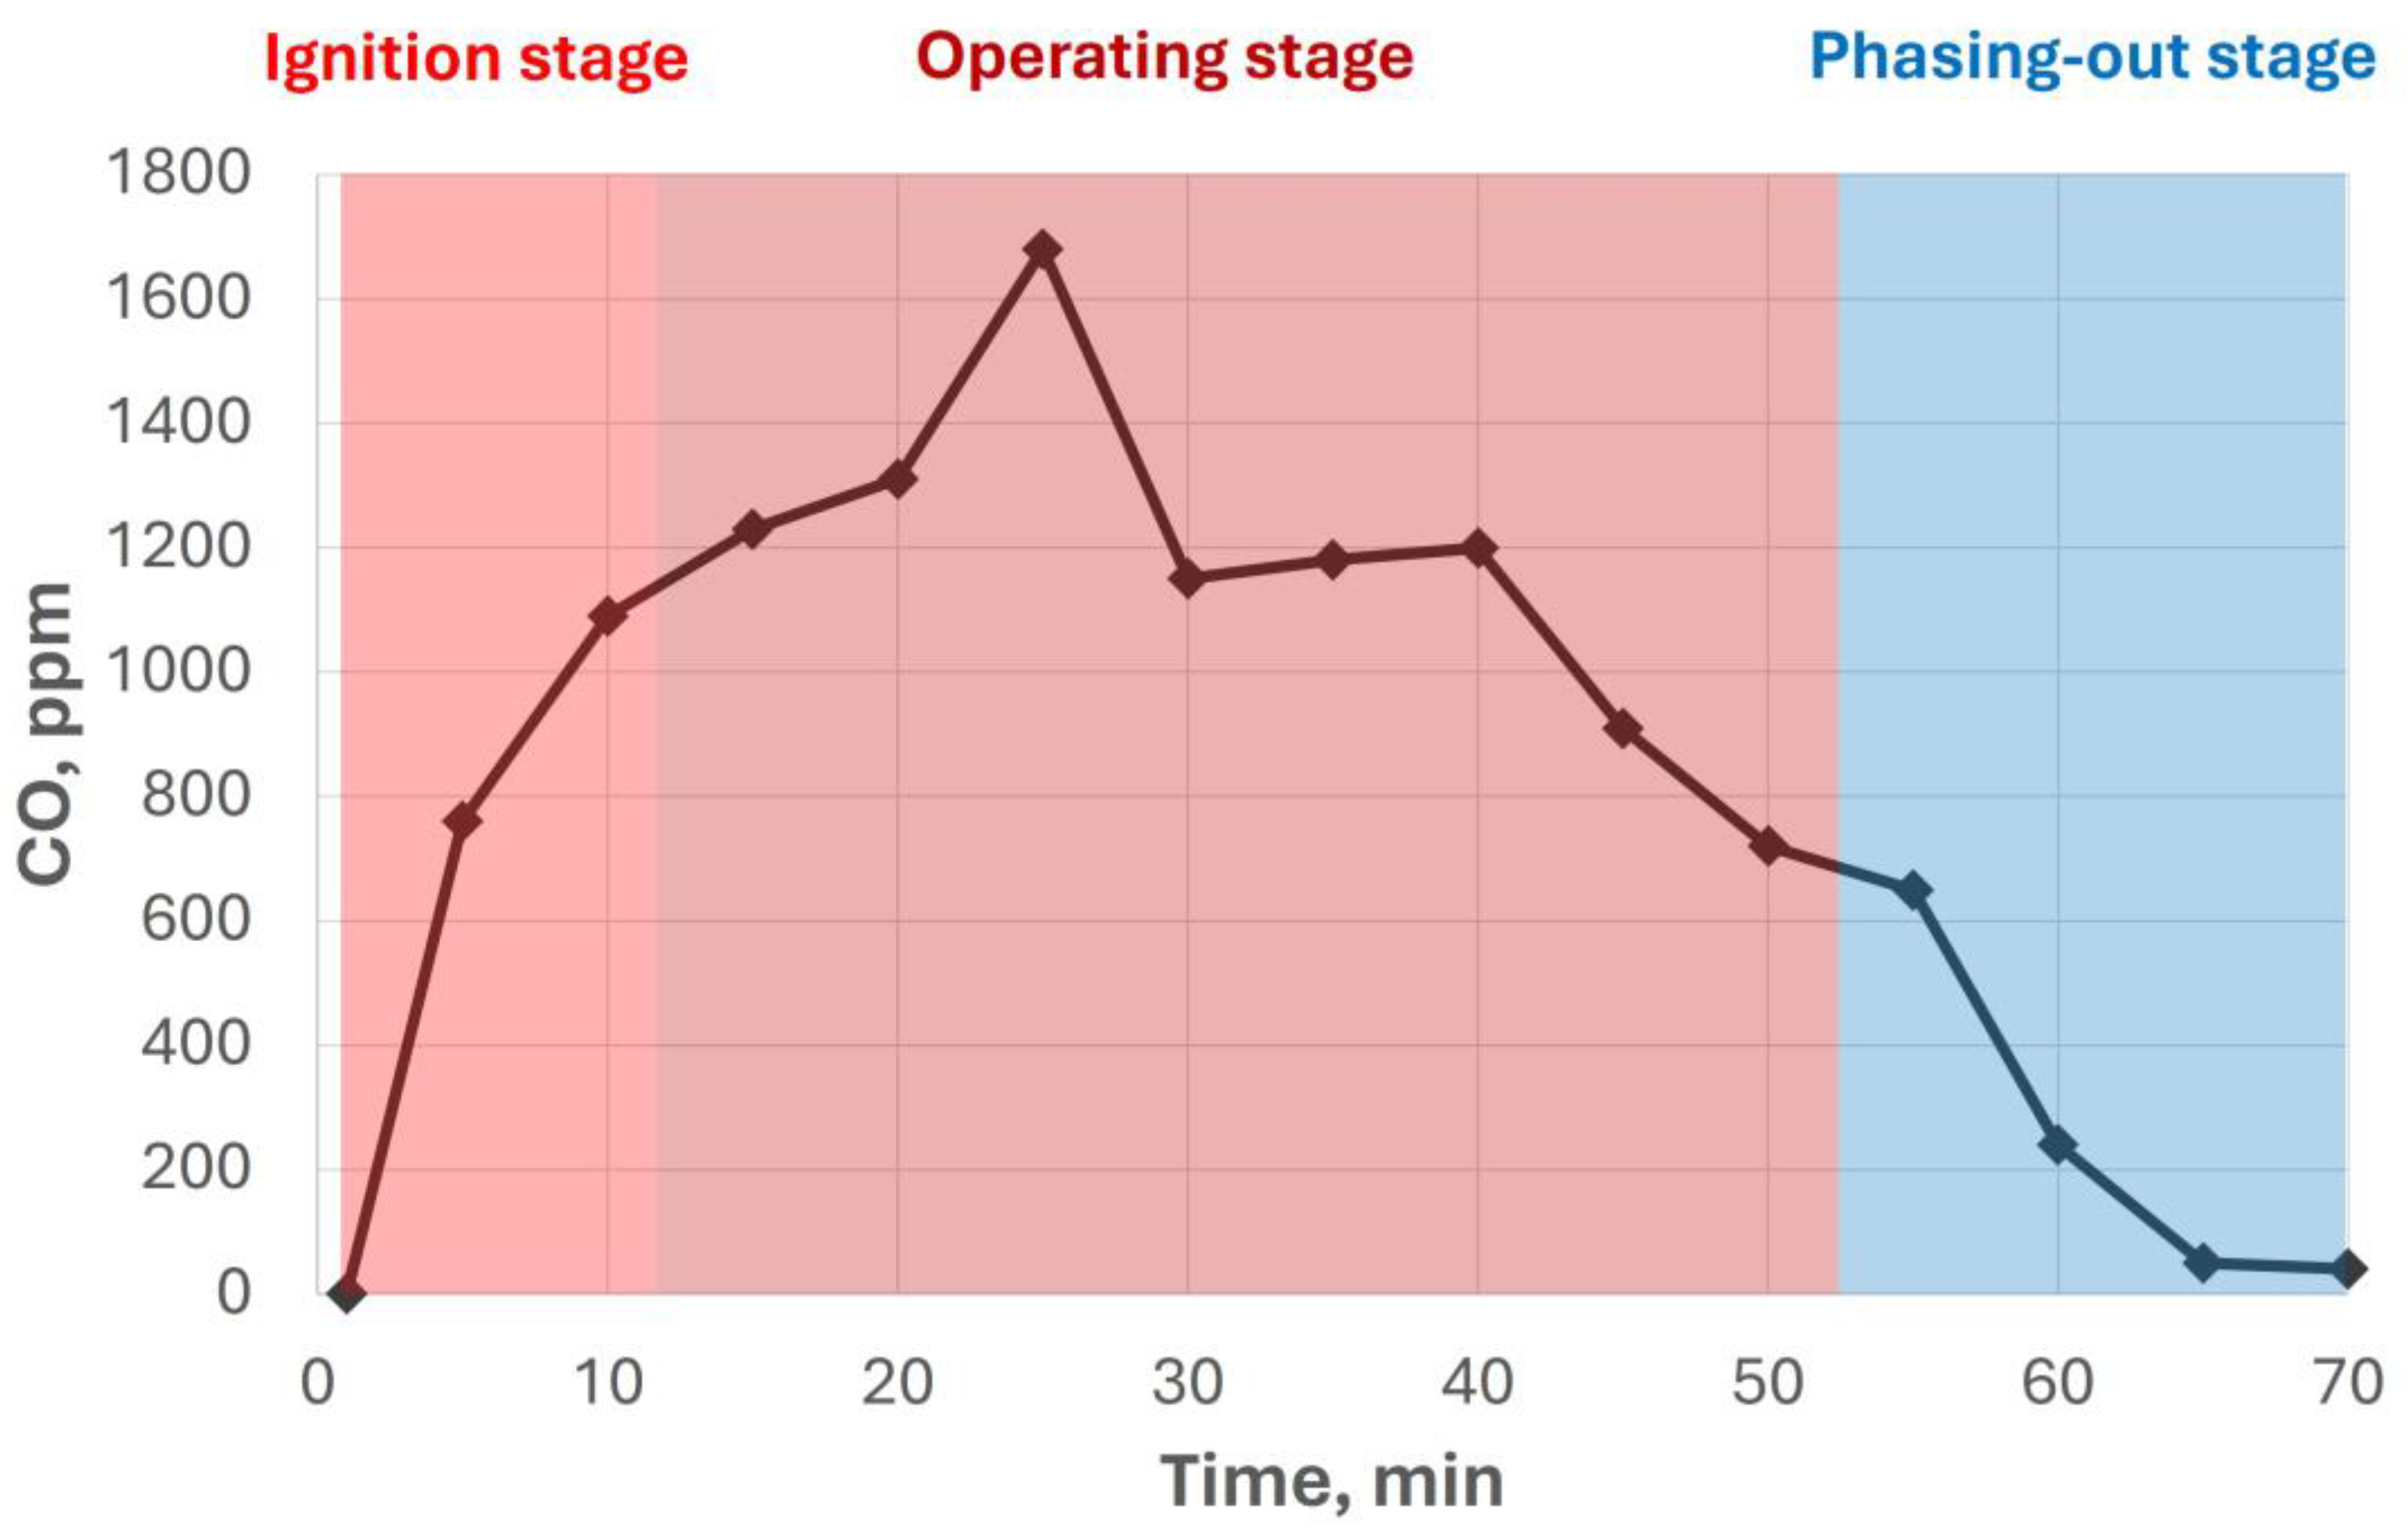
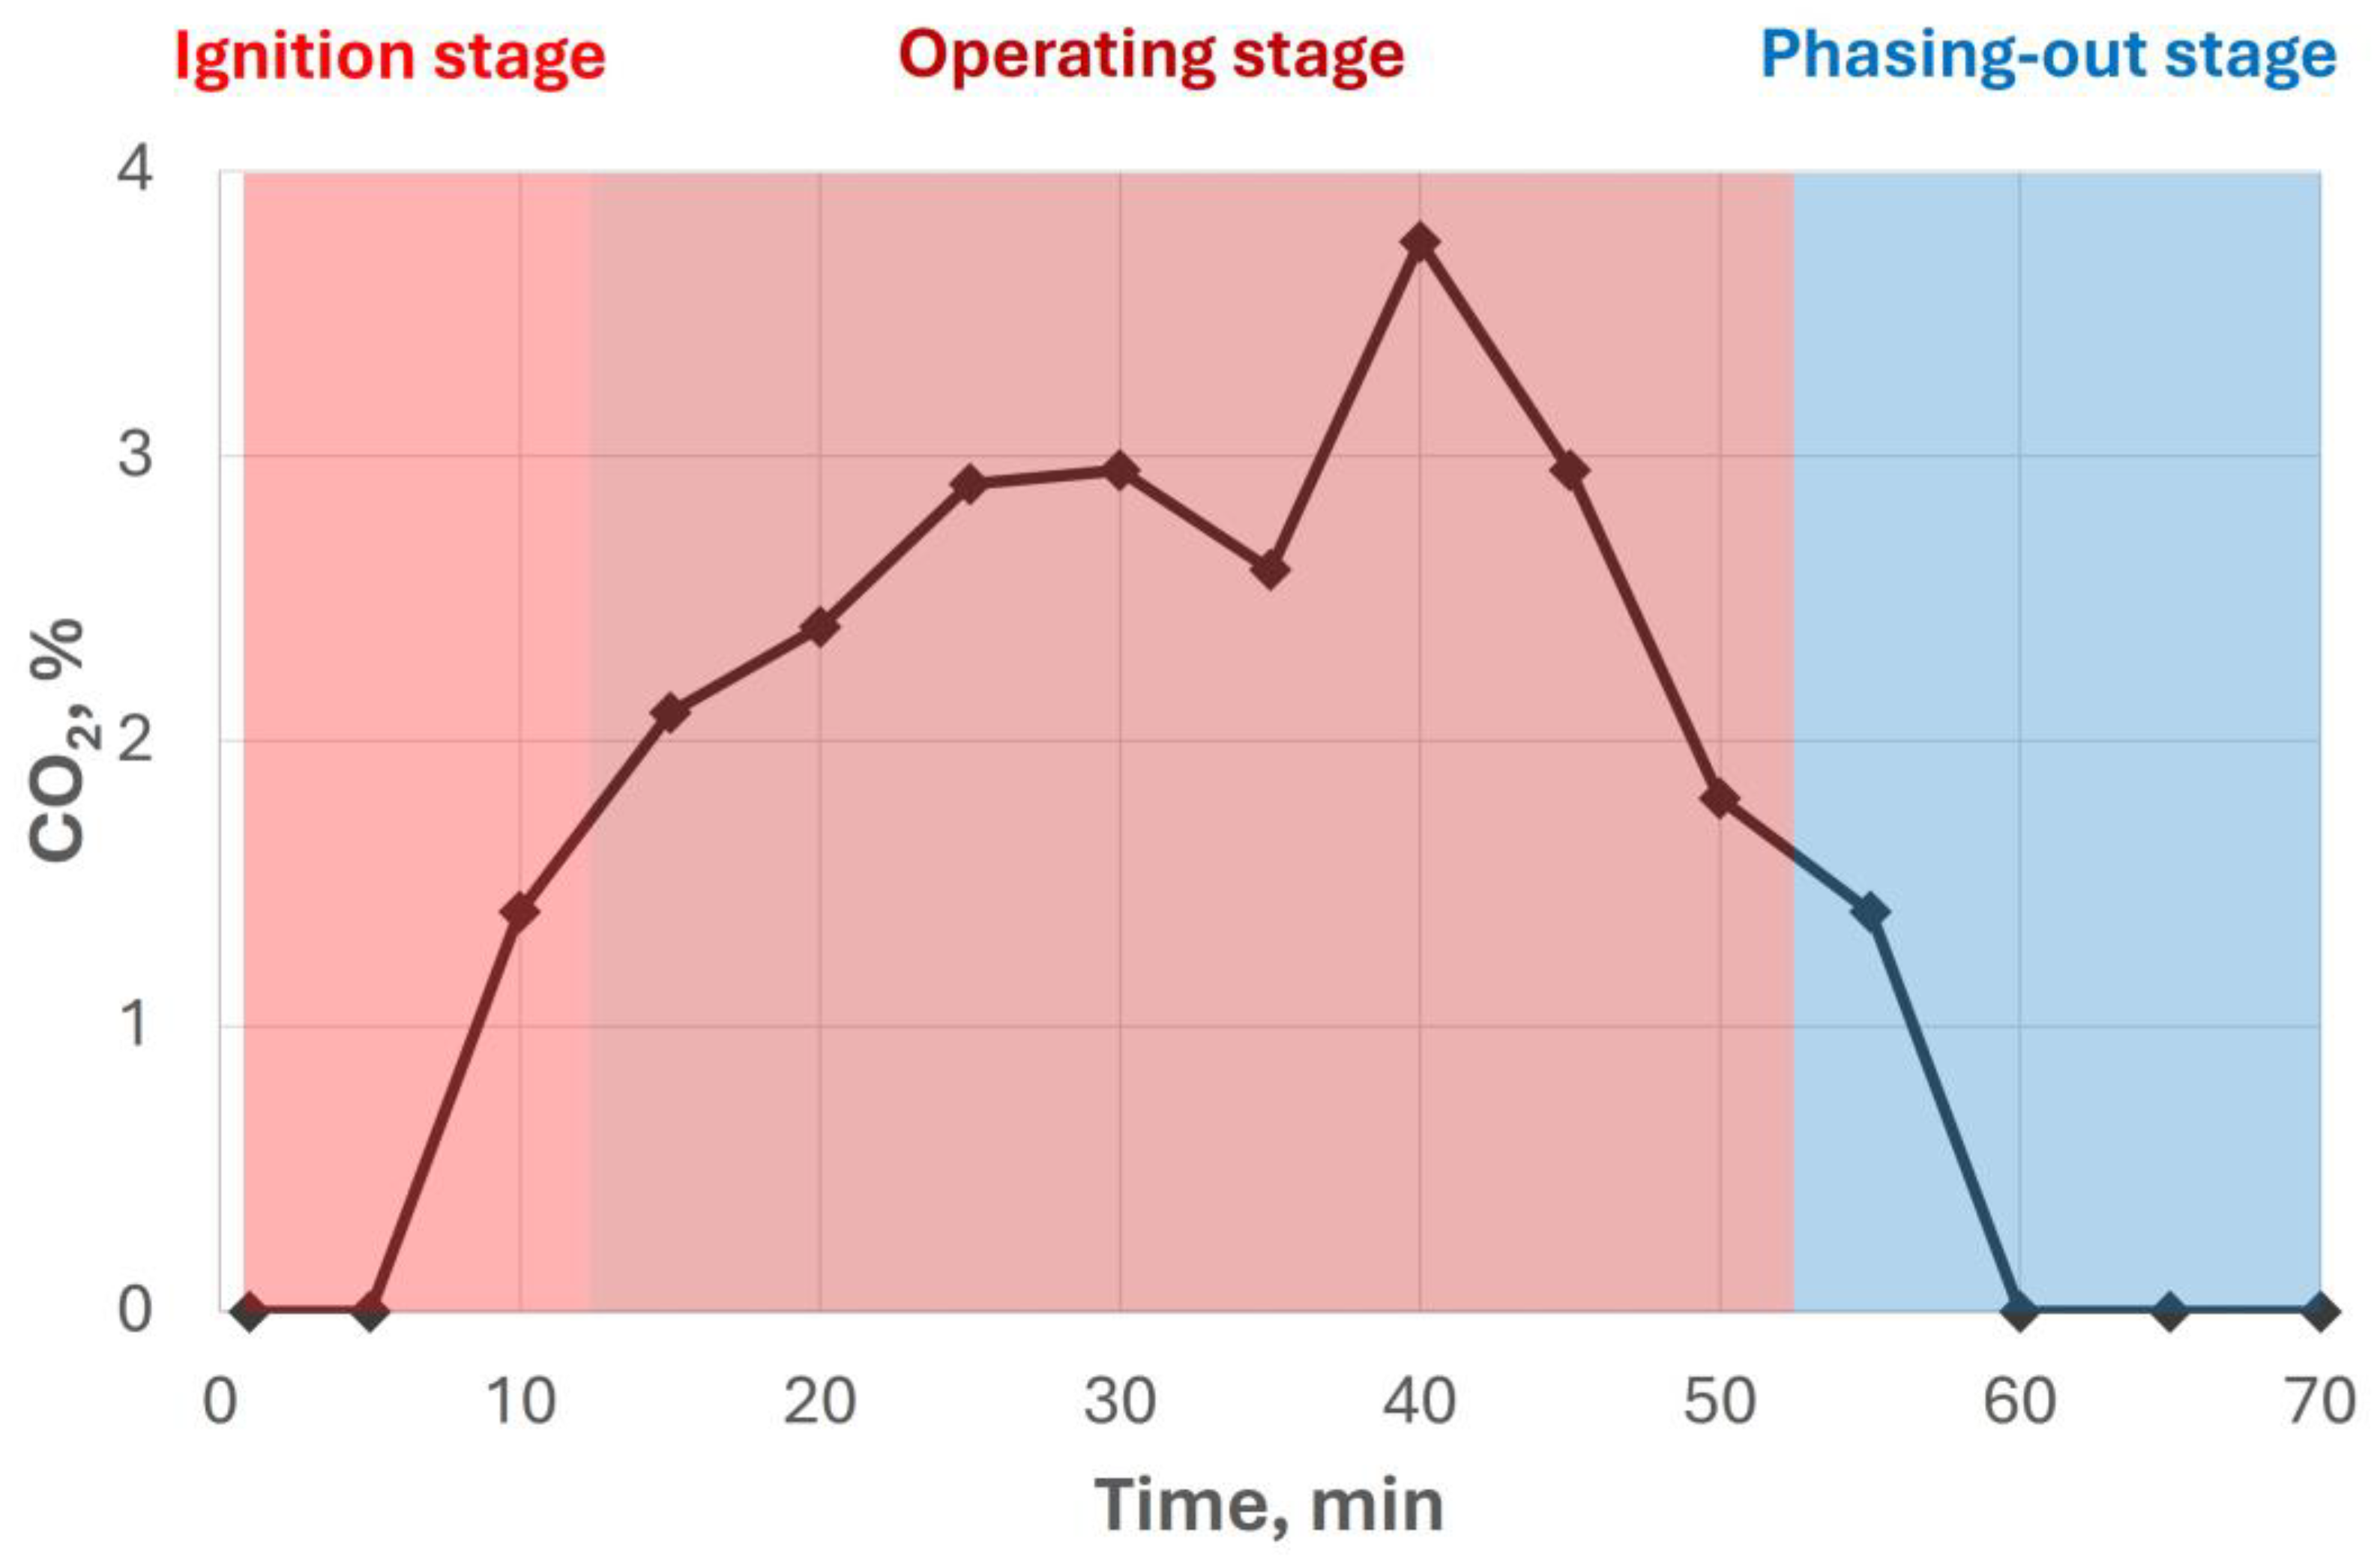
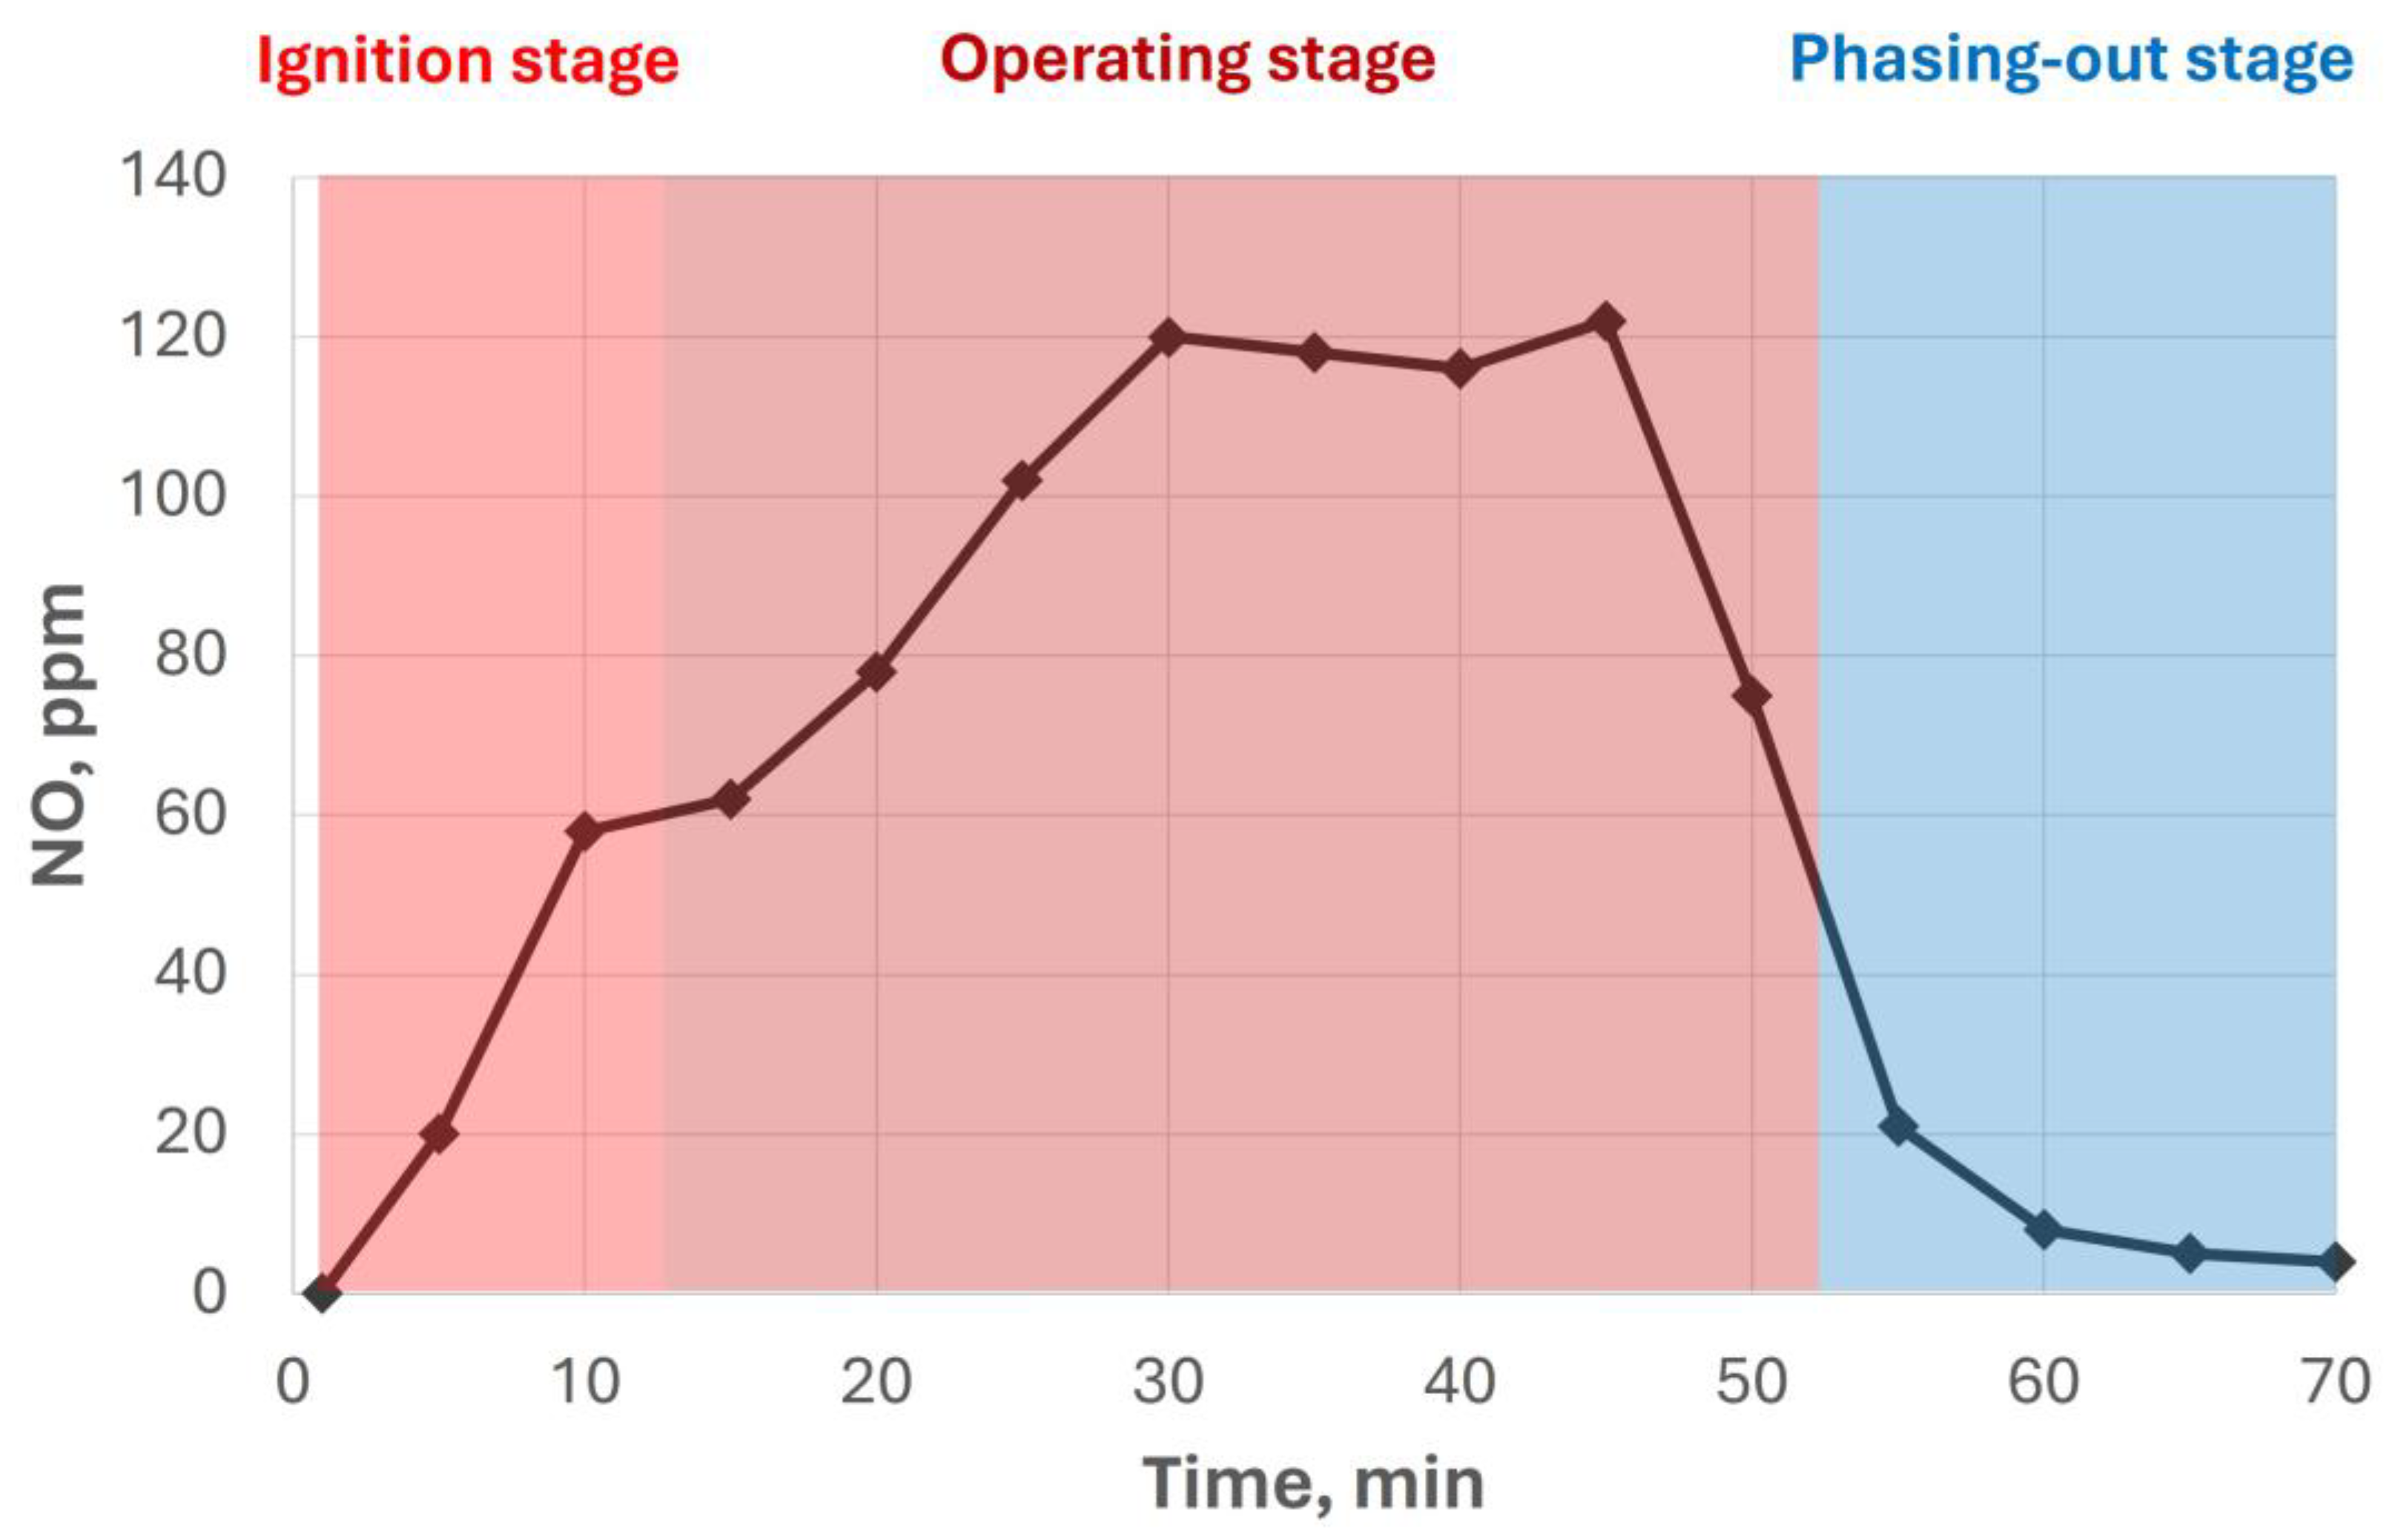
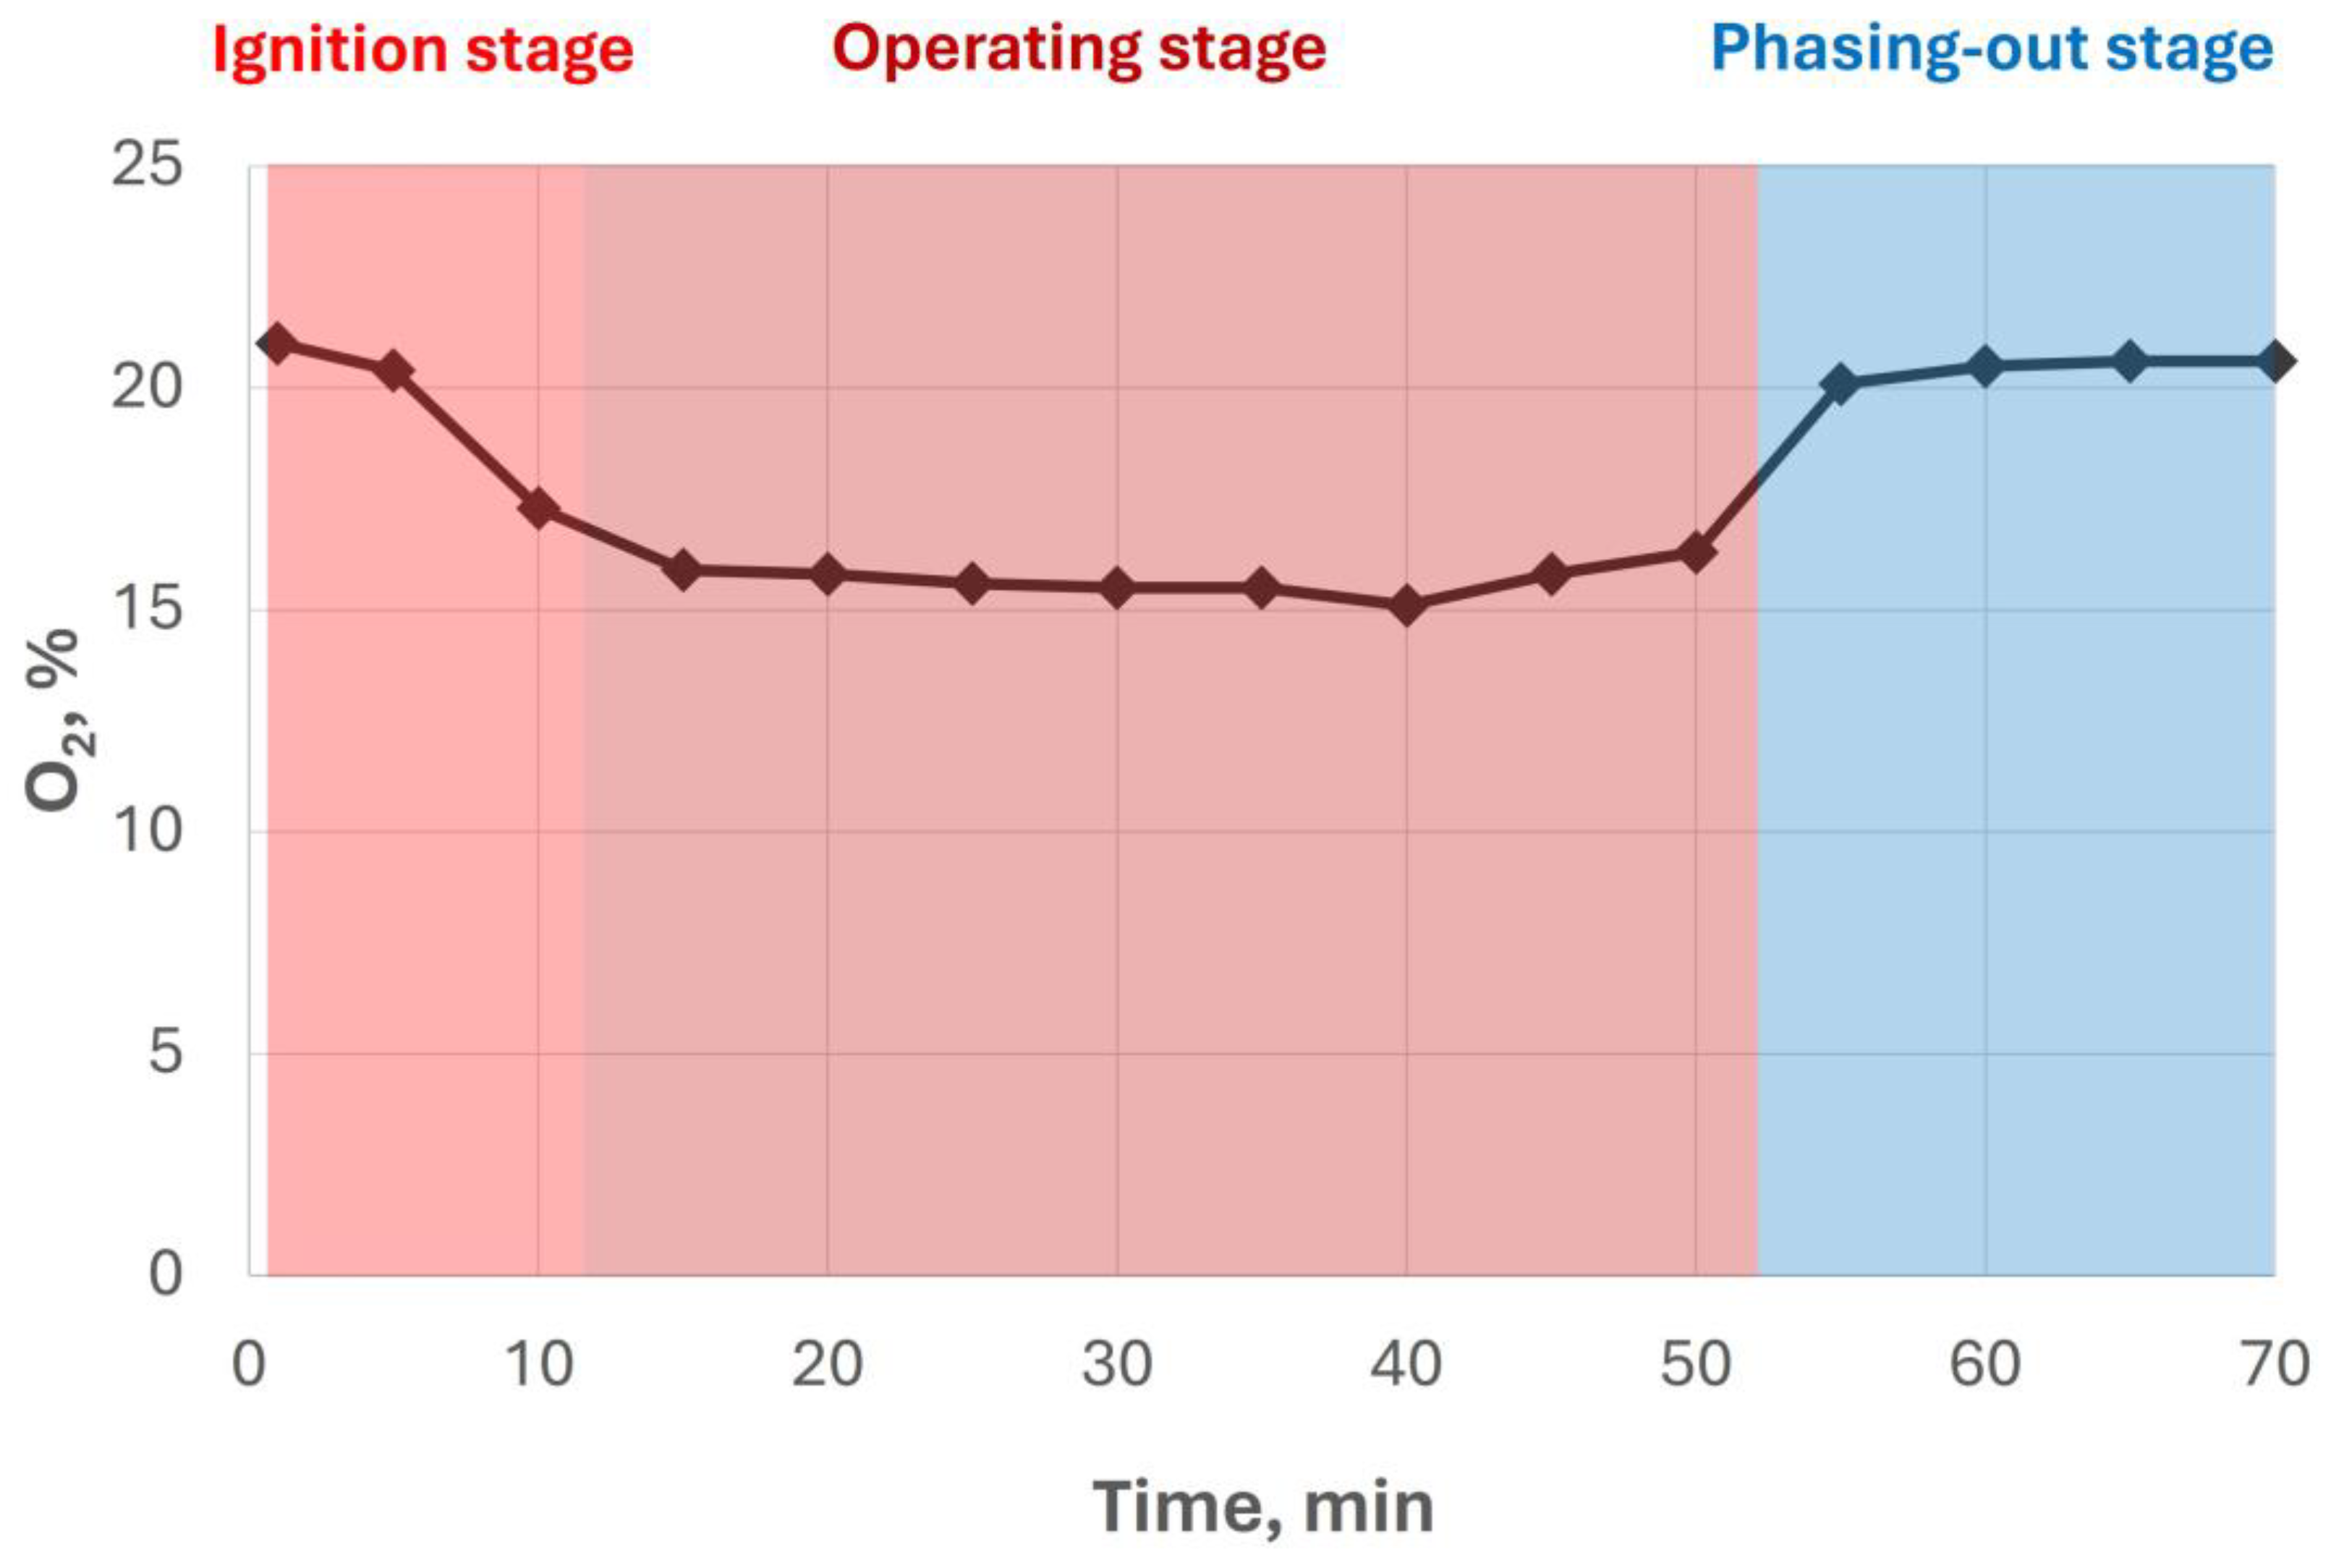
- Ignition stage: It usually takes 15 minutes, once the equipment is turned on, continuing with a countdown. At this point, the flue gas fan works at 1640 rpm (110 V and 0.09 A), whereas the screw conveyor works for 1.5 min (230 V and 0.23 A). Afterwards, it follows alternative working-stopping regimes for 13 minutes, with a rotation speed of 14.81 rph. Regarding the room fan, it will start working after 3.3 min, at 1640 rpm (230 V and 0.23 A). Finally, the ignition coil only works in this stage, at 230 V for 3.3 min.
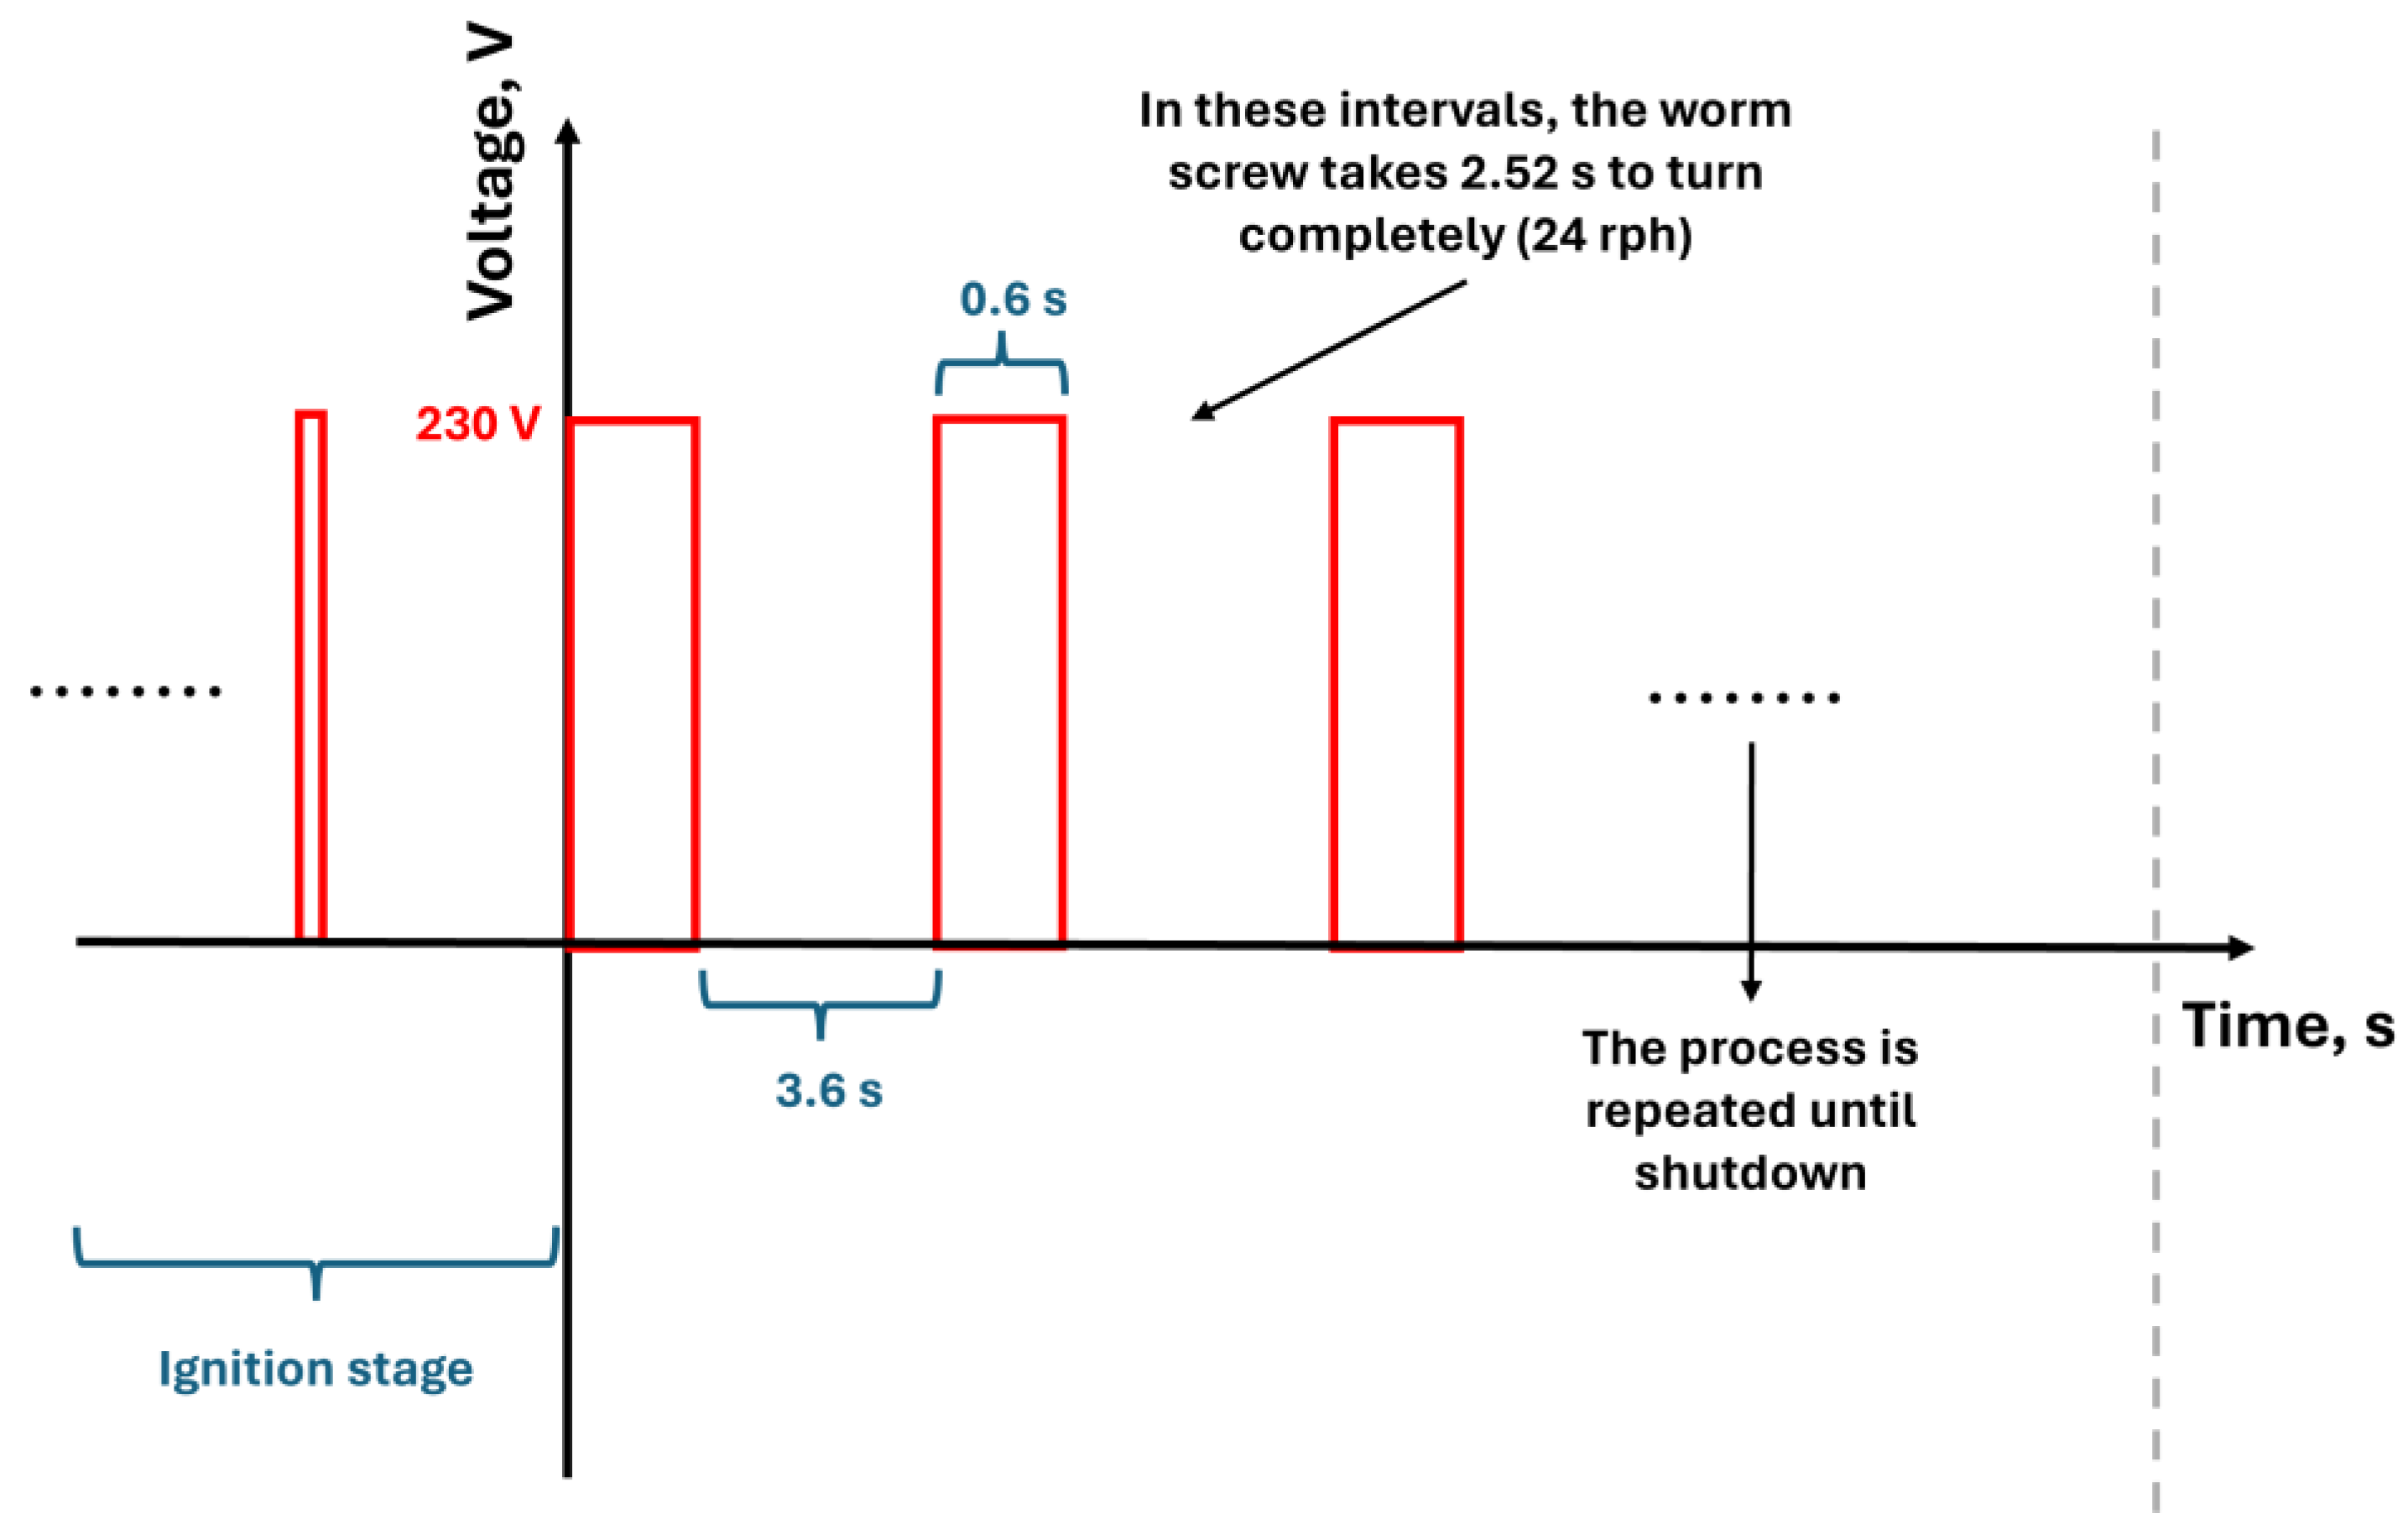
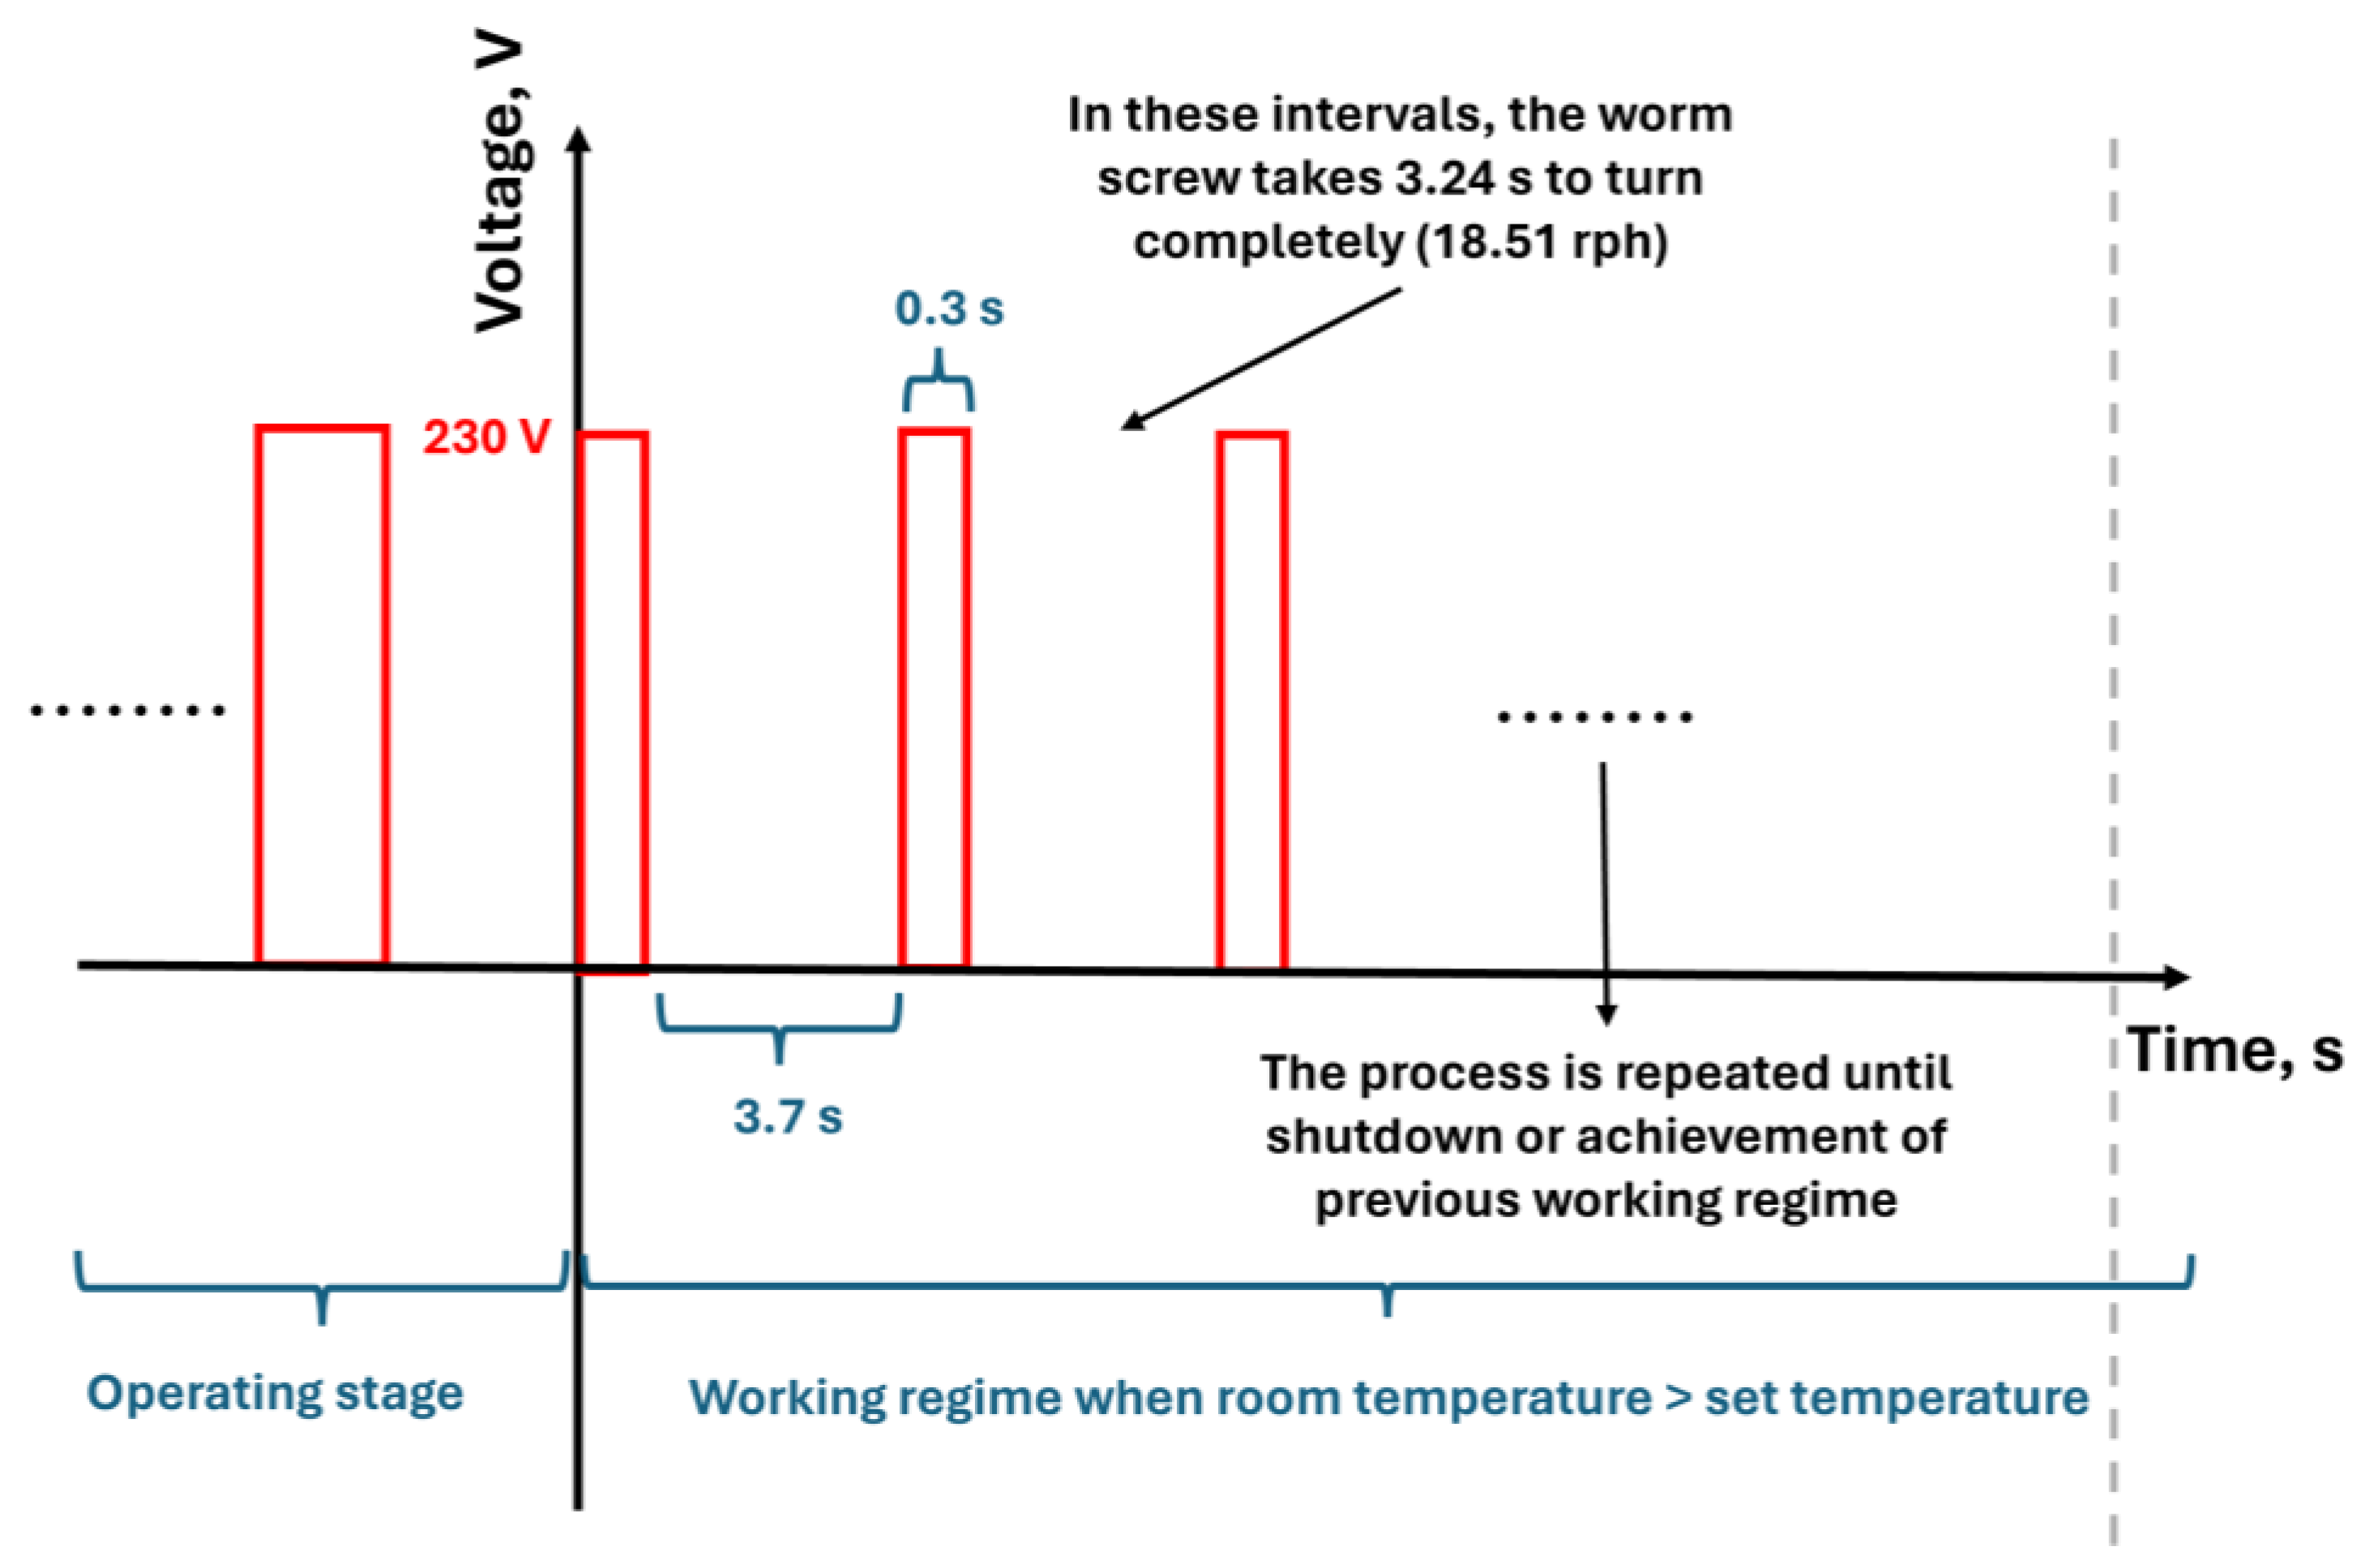
- Operating stage: It starts after the countdown, continuing until the equipment shutdown. The room fan, flue gas fan and temperature probes will work as in the previous case. However, the screw conveyor will work depending on the following conditions (according to the difference between the temperature set and room temperature), included in Table 1.
- Phasing-out stage: It is the period taking place after shutdown, finishing when all the components are stopped due to safety reasons. Thus, the flue gas fan will work at 110 V and 0.08 A for 54 min, at 1640 rpm until the final shutdown, depending on flue gas composition. The screw conveyor will completely stop working, and the room fan will work approximately for 23 min (230 V and 0.23 A).
2.4. Ostwald Diagram
3. Results and Discussion
3.1. Combustion Performance
3.2. Biomass Characterization
| Parameter | Holm oak | Pear tree | Poplar | Sugarcane bagasse |
|---|---|---|---|---|
| HHV, kJ·kg-1 | 15893 | 16443 | 17125 | 16216 |
| Ash, % | 3.17 | 2.41 | 2.17 | 3.87 |
| Moisture, % | 7.34 | 7.03 | 3.08 | 3.38 |
| Volatile matter, % | 74.23 | 76.24 | 81.64 | 77.11 |
| Fixed carbon, % | 15.26 | 14.32 | 15.26 | 15.63 |
| C, % | 47.3 | 47.1 | 47.4 | 45.9 |
| H, % | 5.77 | 5.95 | 5.99 | 5.91 |
| N, % | 0.46 | 0.36 | 0.44 | 0.41 |
| S, % | 0.031 | 0.045 | 0.048 | 0.171 |
| Bulk density, kg·m3 | 604.86 | 624.88 | 606.91 | 699.92 |
4. Conclusions
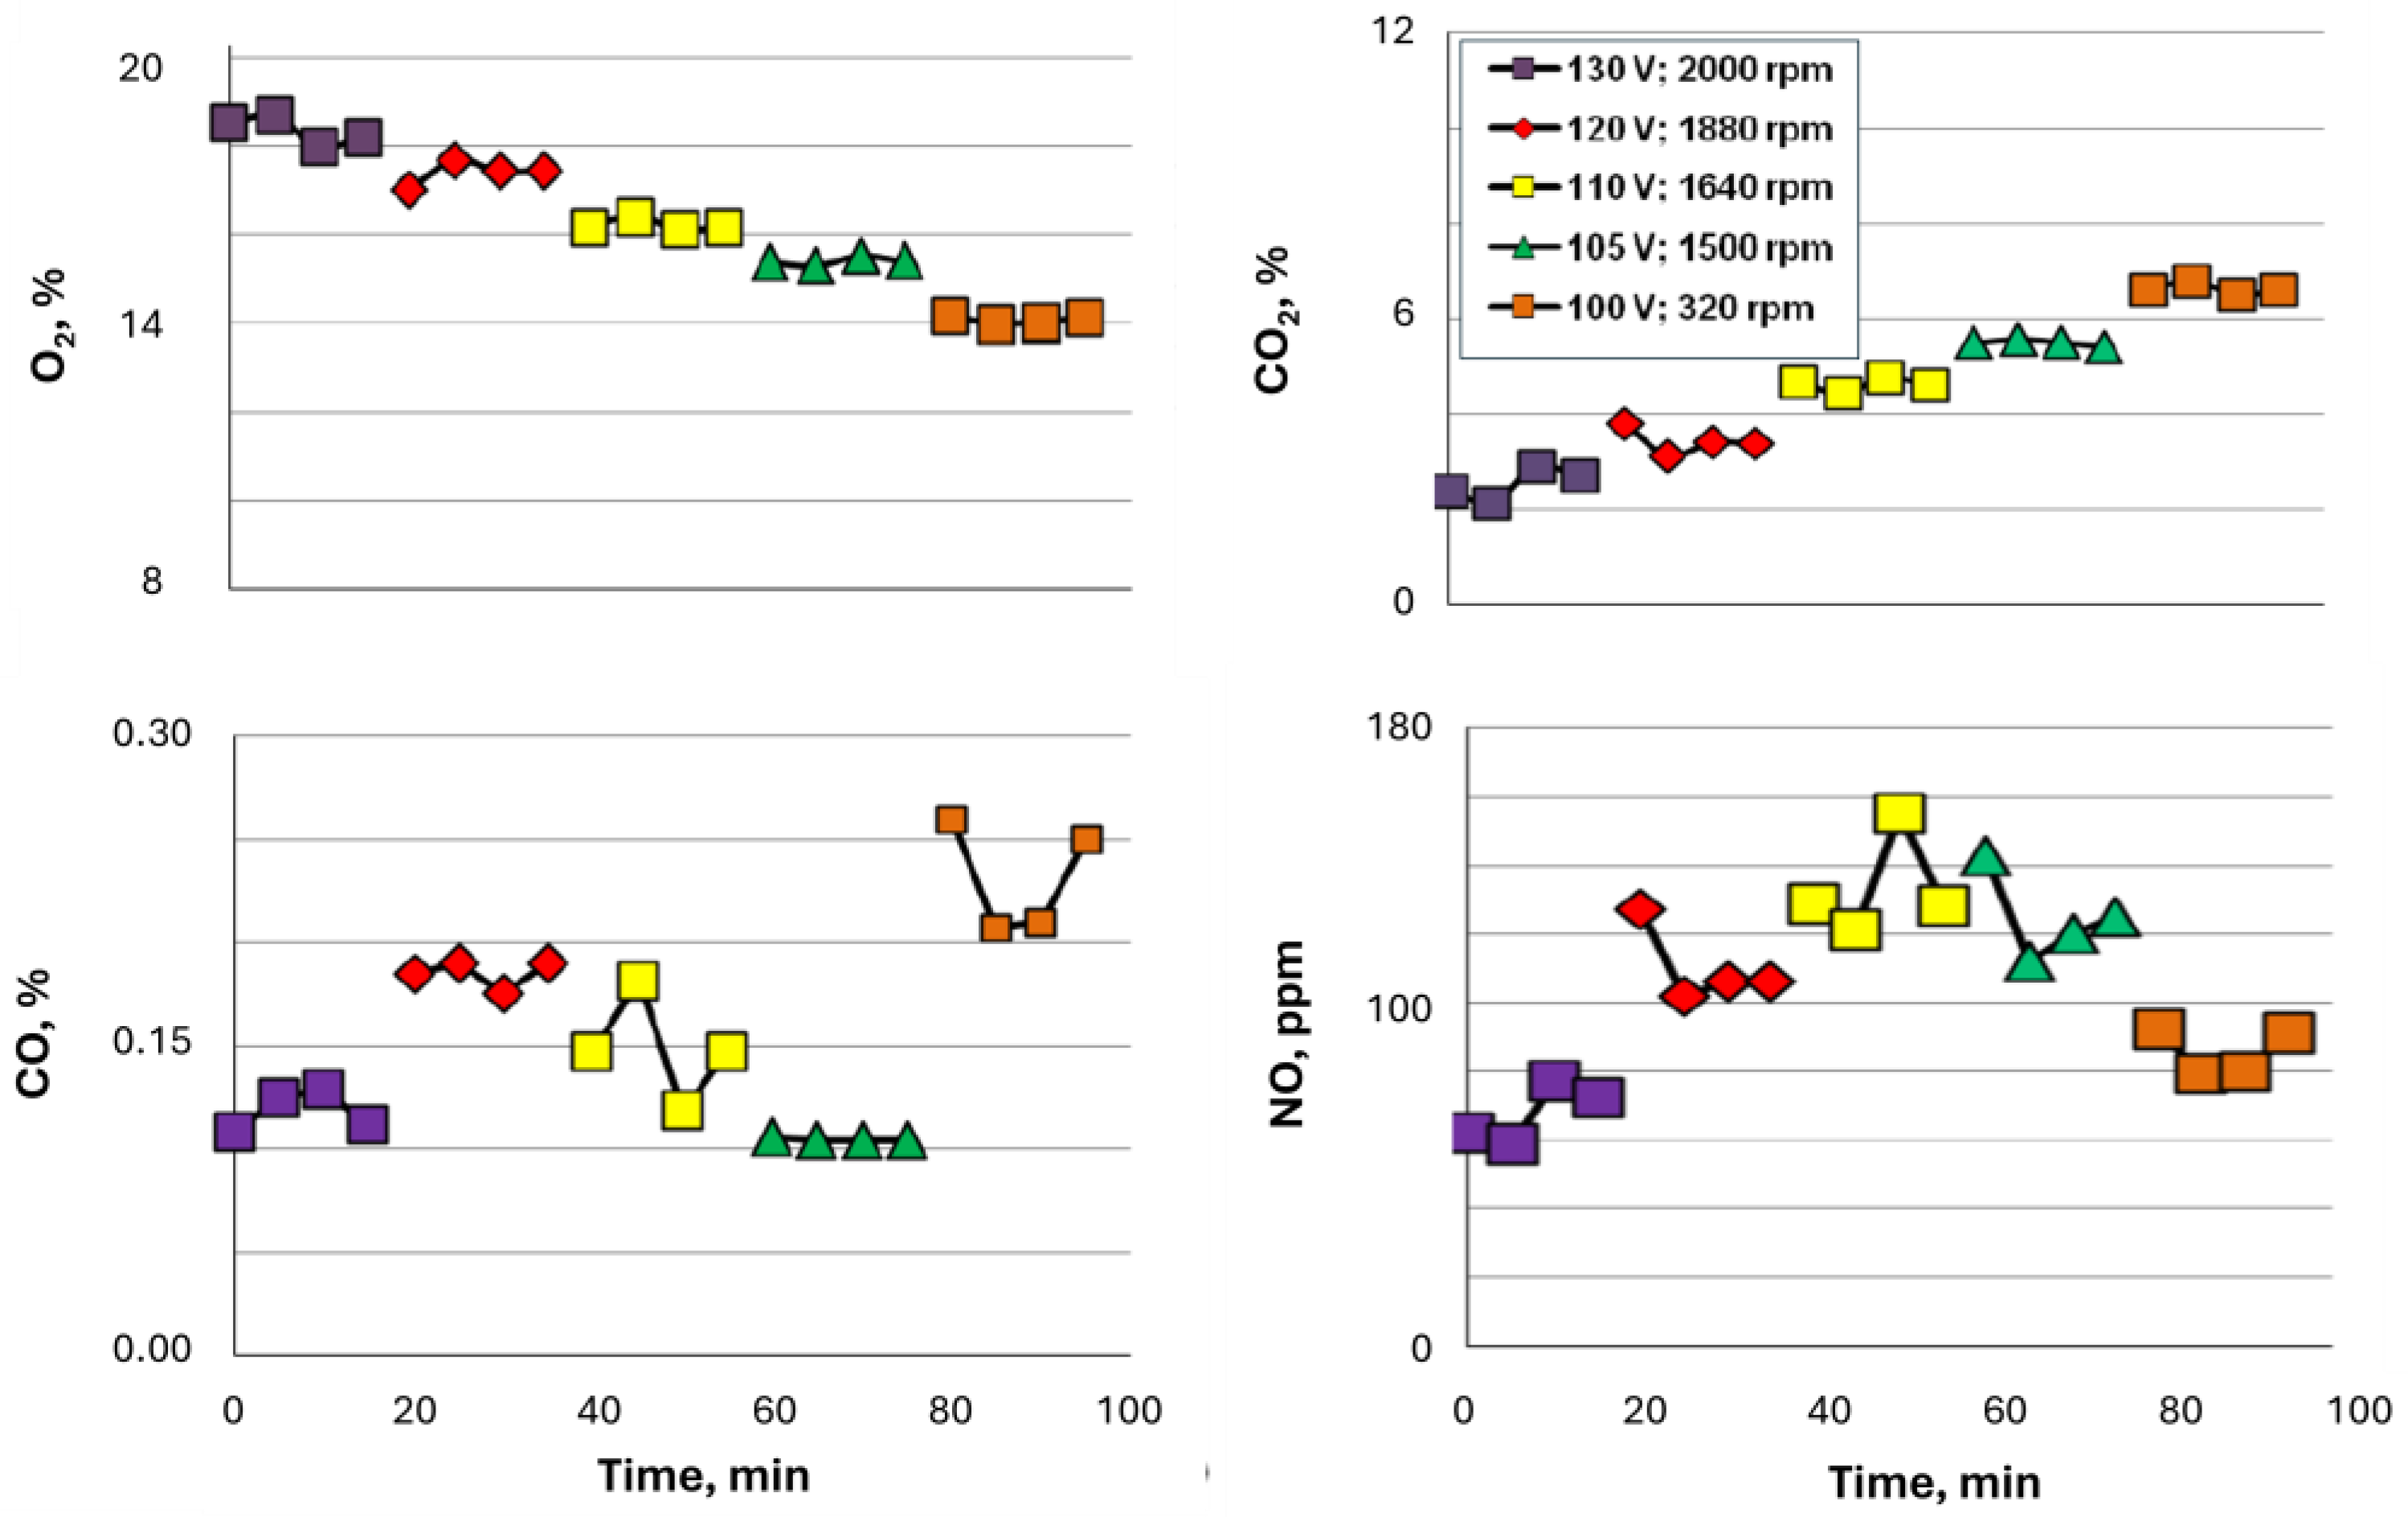
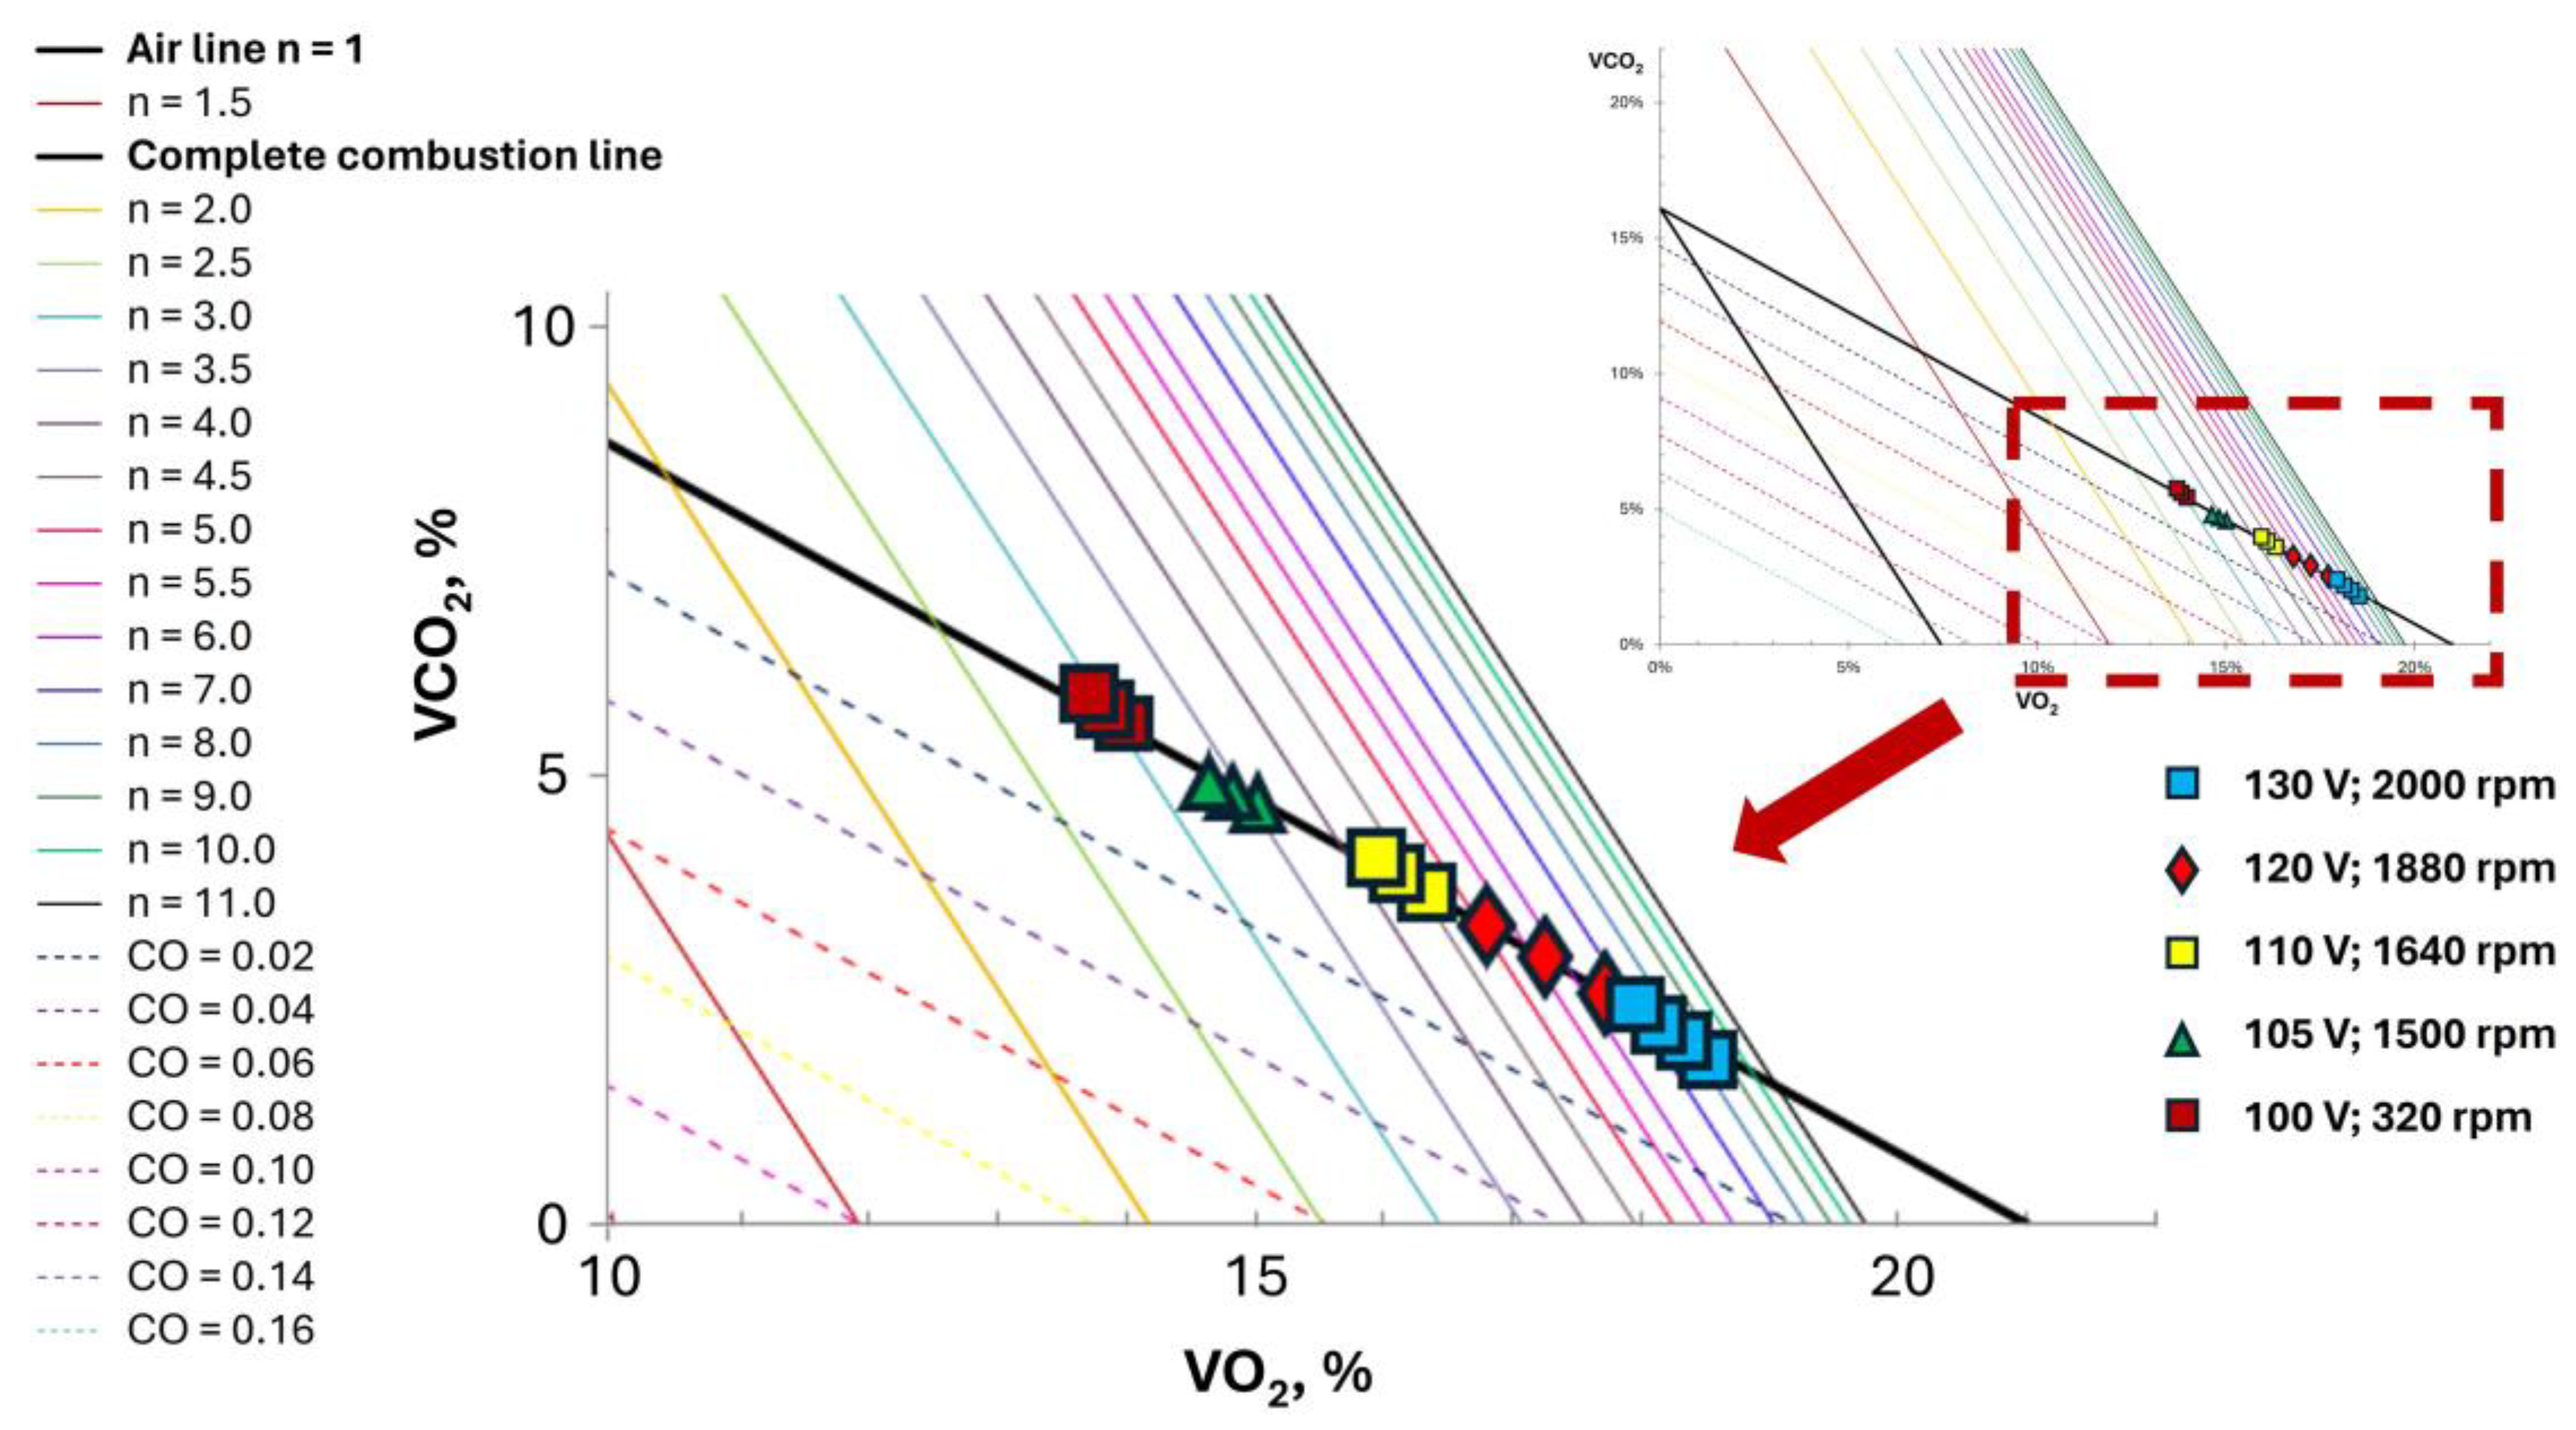
- The best combustion performance was achieved when the flue gas fan worked at 320 rpm, as it was the operating condition at which almost all the carbon contained in biomass was completely oxidized.
- CO2 emissions increased when the flue gas fan speed decreased. On the contrary, O2 percentage decreased in this case.
- NO content in combustion gas resulting after combustion of biomass waste was relatively low.
- CO percentage was considerably low in fumes once biomass was burned.
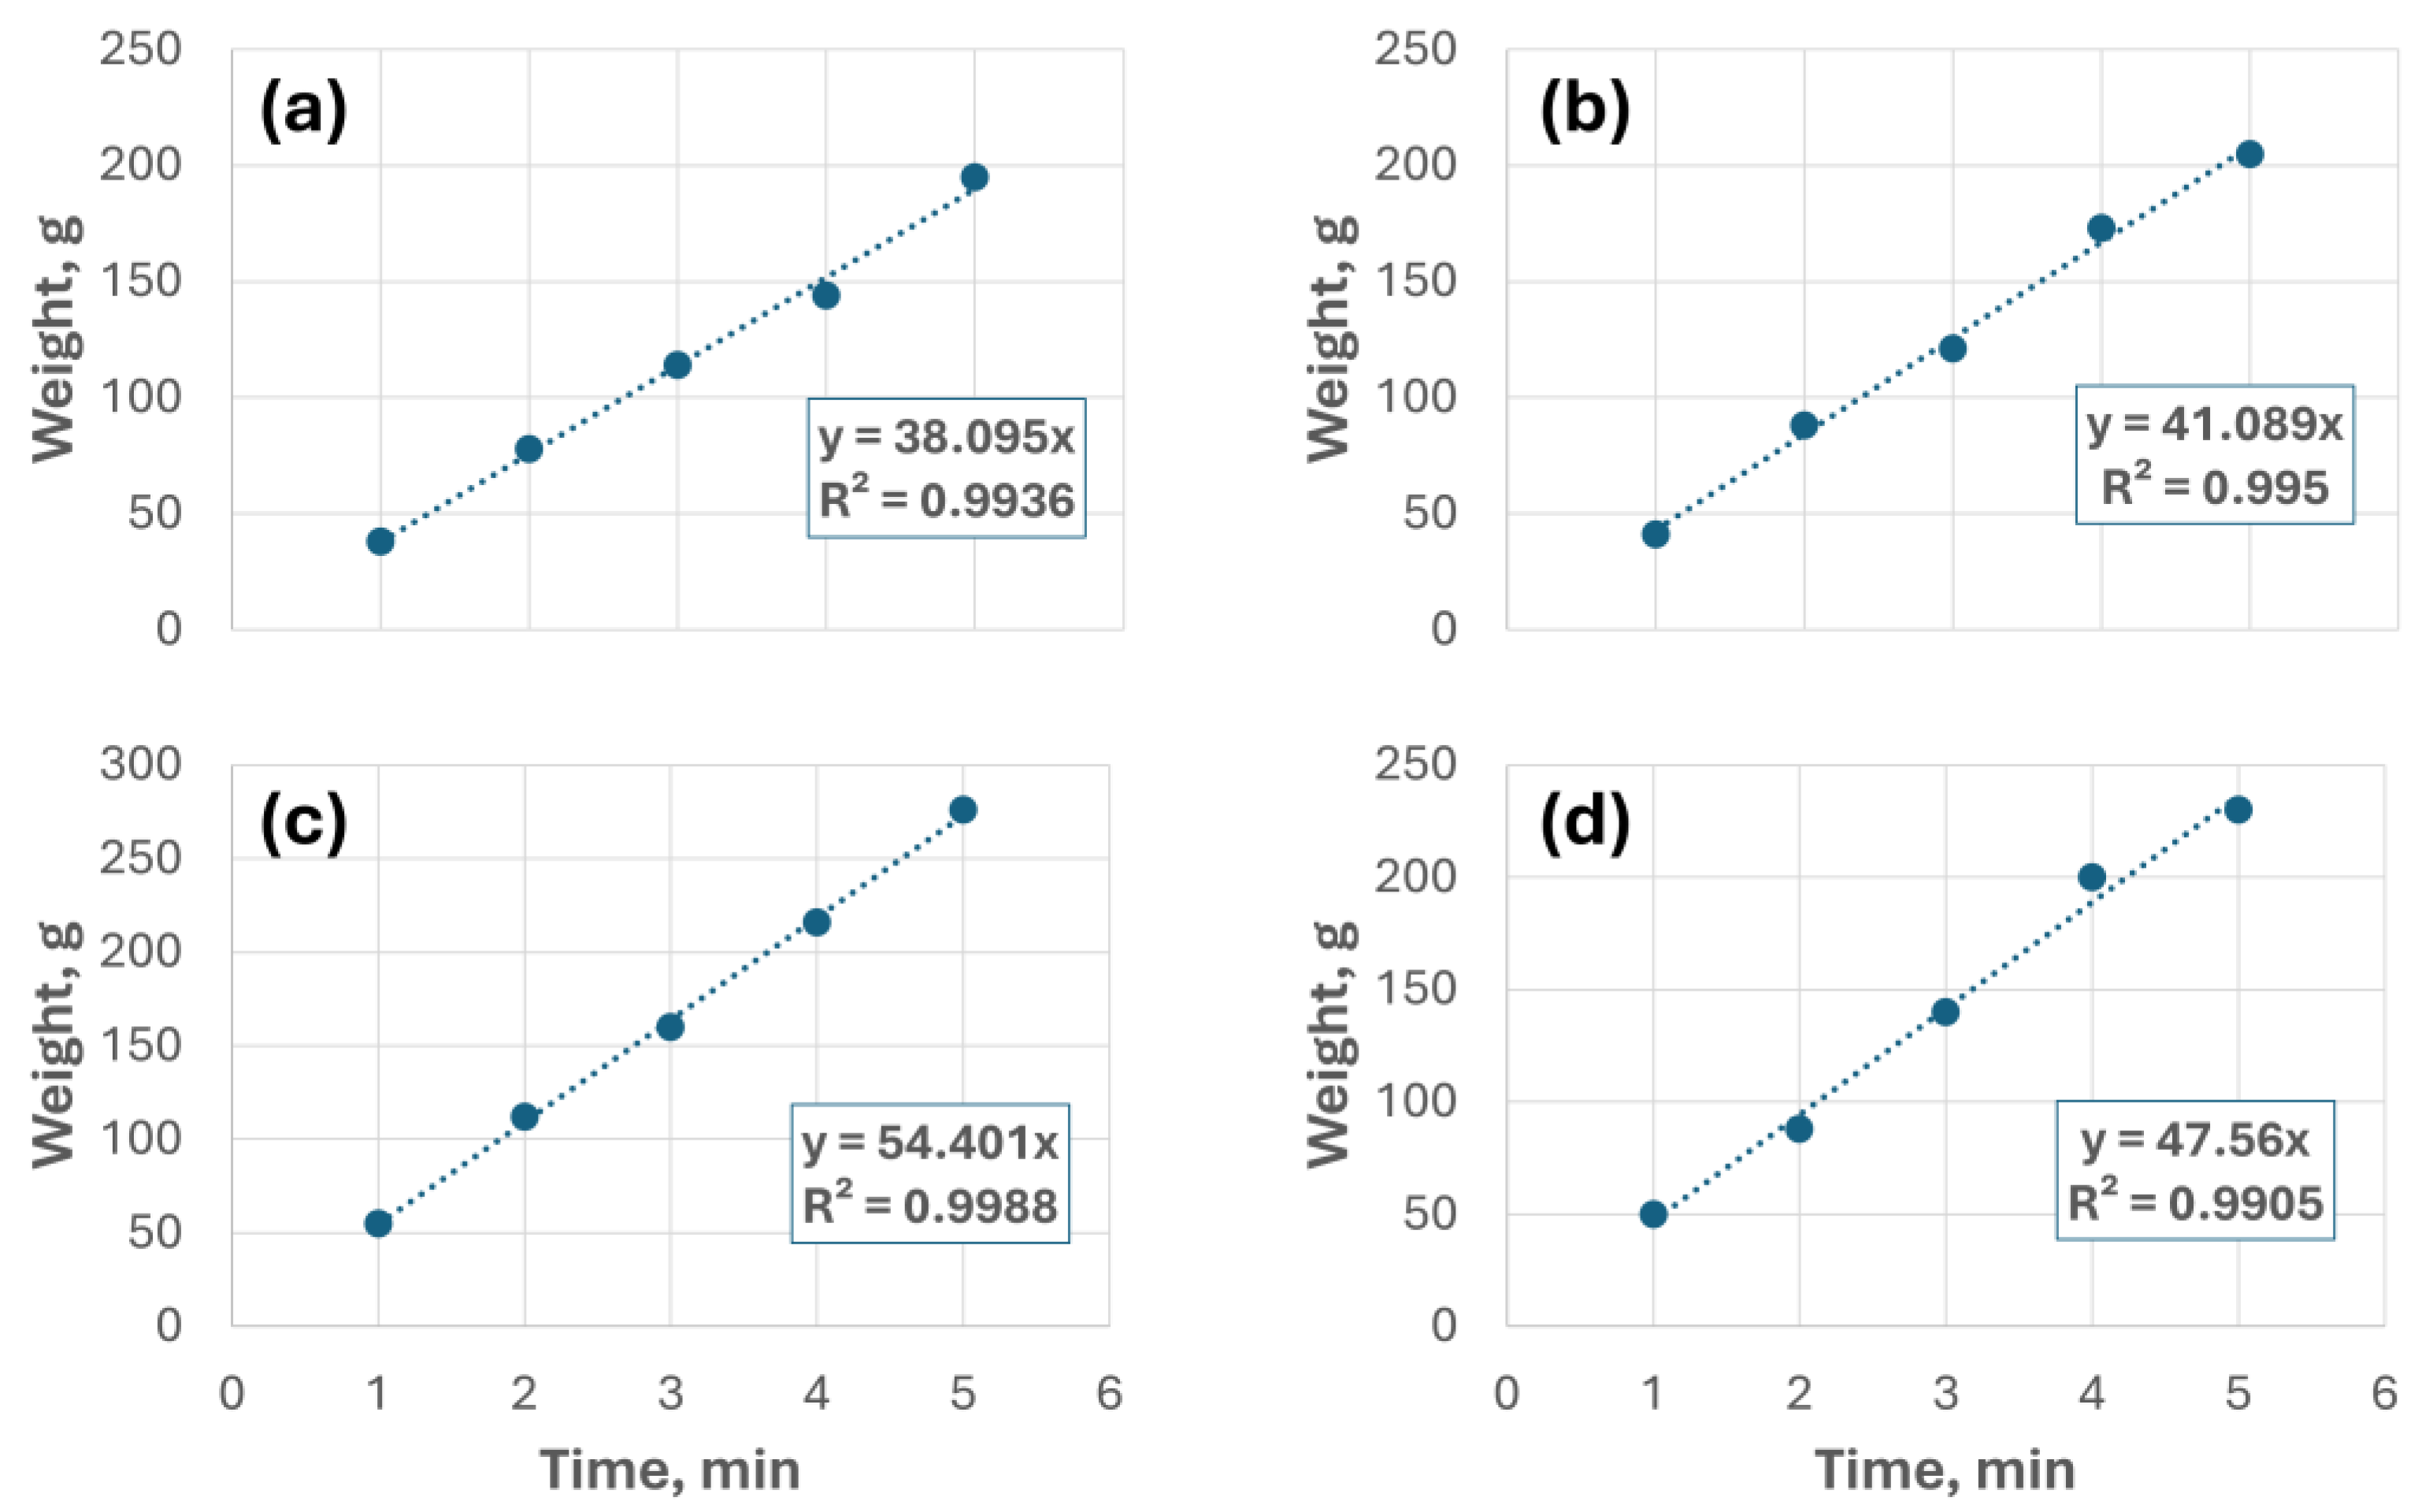
- Concerning poplar pellets, the highest power supplied by the stove was 8.77 kW with a flow of 0.037 kg·min-1. This was the highest power obtained in this experience for all the different raw materials.
- Regarding holm oak pellets, the highest power was 5.66 kW, with a flow of 0.0215 kg·min-1. In this case, it was the lowest value found in this work.
- Considering sugar cane bagasse, the highest power found was 6.23 kW, with 0.0269 kg·min-1.
- In the case of pear tree, the highest power was 6.32 kW, with a flow of 0.0232 0.0269 kg·min-1.
- The implementation of a speed controller in the motor of the flue gas fan to regulate the air inlet in the system and, subsequently, improve the combustion process.
- Possibility of automatic disposal of fuel in the hopper, before or after each experience, in order to change biomass without completely emptying the hopper.
- Possibility of changing the rotation direction of the worm screw to unblock this device, if required.
Author Contributions
Funding
Data Availability Statement
Acknowledgments
Conflicts of Interest
References
- Hao, F.; Liu, X.; Michaels, J.L. Social Capital, Carbon Dependency, and Public Response to Climate Change in 22 European Countries. Environ Sci Policy 2020, 114, 64–72. [Google Scholar] [CrossRef]
- Vakulchuk, R.; Overland, I.; Scholten, D. Renewable Energy and Geopolitics: A Review. Renewable and Sustainable Energy Reviews 2020, 122. [Google Scholar] [CrossRef]
- Palle, A. Bringing Geopolitics to Energy Transition Research. Energy Res Soc Sci 2021, 81. [Google Scholar] [CrossRef]
- Ji, X.; Long, X. A Review of the Ecological and Socioeconomic Effects of Biofuel and Energy Policy Recommendations. Renewable and Sustainable Energy Reviews 2016. [CrossRef]
- UN Sustainable Development Goals. 2019.
- Carfora, A.; Pansini, R.V.; Scandurra, G. Energy Dependence, Renewable Energy Generation and Import Demand: Are EU Countries Resilient? Renew Energy 2022, 195, 1262–1274. [Google Scholar] [CrossRef]
- Lewandowski, W.M.; Ryms, M.; Kosakowski, W. Thermal Biomass Conversion: A Review. Processes 2020, 8. [Google Scholar] [CrossRef]
- Karanja, A.; Gasparatos, A. Adoption of Improved Biomass Stoves in Kenya: A Transect-Based Approach in Kiambu and Muranga Counties. Environmental Research Letters 2020, 15. [Google Scholar] [CrossRef]
- Toscano, G.; Duca, D.; Amato, A.; Pizzi, A. Emission from Realistic Utilization of Wood Pellet Stove. Energy 2014, 68, 644–650. [Google Scholar] [CrossRef]
- Stanistreet, D.; Phillip, E.; Kumar, N.; Anderson de Cuevas, R.; Davis, M.; Langevin, J.; Jumbe, V.; Walsh, A.; Jewitt, S.; Clifford, M. Which Biomass Stove(S) Capable of Reducing Household Air Pollution Are Available to the Poorest Communities Globally? Int J Environ Res Public Health 2021, 18. [Google Scholar] [CrossRef] [PubMed]
- Shaisundaram, V.S.; Chandrasekaran, M.; Sujith, S.; Praveen Kumar, K.J.; Shanmugam, M. Design and Analysis of Novel Biomass Stove. In Proceedings of the Materials Today: Proceedings; Elsevier Ltd, 2020; Vol. 46, pp. 4054–4058.
- Harsono, S.S.; Tasliman; Fauzi, M.; Wibowo, R.K.K.; Supriyanto, E. Biomass Stove with Low Carbon Monoxide Emission Fueled by Solid Fuel Coffee-Husk Biopellet. Sustainability (Switzerland) 2022, 14. [CrossRef]
- Suresh, R.; Singh, V.K.; Malik, J.K.; Datta, A.; Pal, R.C. Evaluation of the Performance of Improved Biomass Cooking Stoves with Different Solid Biomass Fuel Types. Biomass Bioenergy 2016, 95, 27–34. [Google Scholar] [CrossRef]
- Betancourt Astete, R.; Gutiérrez-Cáceres, N.; Muñoz-Catalán, M.; Mora-Chandia, T. Direct Improvement in the Combustion Chamber and the Radiant Surface to Reduce the Emission of Particles in Biomass Cooking Stoves Used in Araucanía, Chile. Sustainability (Switzerland) 2021, 13. [Google Scholar] [CrossRef]
- González, J.F.; Álvarez Murillo, A.; Díaz García, D.; Nogales-Delgado, S. The Determination of Combustion for Different Pellets Based on Ostwald Diagrams in a Domestic Stove under Experimental Conditions. Applied Sciences 2023, 13, 12007. [Google Scholar] [CrossRef]
- Ciupek, B.; Urbaniak, R.; Kinalska, D.; Nadolny, Z. Flue Gas Recirculation System for Biomass Heating Boilers—Research and Technical Applications for Reductions in Nitrogen Oxides (NOx) Emissions. Energies (Basel) 2024, 17. [Google Scholar] [CrossRef]
- Scopus. Available online: https://www.scopus.com/home.uri (accessed on 29 May 2024).
- Karkania, V.; Fanara, E.; Zabaniotou, A. Review of Sustainable Biomass Pellets Production - A Study for Agricultural Residues Pellets’ Market in Greece. Renewable and Sustainable Energy Reviews 2012, 16, 1426–1436. [Google Scholar] [CrossRef]
- Deng, M.; Li, P.; Shan, M.; Yang, X. Optimizing Supply Airflow and Its Distribution between Primary and Secondary Air in a Forced-Draft Biomass Pellet Stove. Environ Res 2020, 184. [Google Scholar] [CrossRef] [PubMed]
- Rupasinghe, R.L.; Perera, P.; Bandara, R.; Amarasekera, H.; Vlosky, R. Insights into Properties of Biomass Energy Pellets Made from Mixtures of Woody and Non-Woody Biomass: A Meta-Analysis. Energies (Basel) 2024, 17. [Google Scholar] [CrossRef]

| Parameter | Tset ≥ Troom1 | Tset < Troom |
|---|---|---|
| Voltage, V | 230 | 230 |
| Amperage, A | 0.23 | 0.23 |
| Working/Stopping time, s | 0.6/3.6 | 0.3/3.7 |
| Rotational speed, rpm | 24 | 18.51 |
| Working regime | Time, min | Gas sample number |
|---|---|---|
| Ignition stage | 0 | 1 |
| 5 | 2 | |
| 10 | 3 | |
| Operating stage | 15 | 4 |
| 20 | 5 | |
| 25 | 6 | |
| 30 | 7 | |
| 35 | 8 | |
| 40 | 9 | |
| 45 | 10 | |
| 50 | 11 | |
| Phasing-out stage | 55 | 12 |
| 60 | 13 | |
| 65 | 14 | |
| 70 | 15 | |
| 75 | 16 | |
| 80 | 17 | |
| 85 | 18 | |
| 90 | 19 | |
| 95 | 20 |
| Voltage, V | Speed, rpm |
|---|---|
| 100 | 320 |
| 105 | 1500 |
| 110 | 1640 |
| 120 | 1880 |
| 130 | 2000 |
| Holm oak | Pear tree | Poplar | Sugarcane bagasse | |
|---|---|---|---|---|
| Power, kW | 1.43 | 1.60 | 2.22 | 1.83 |
| Holm oak | |||||||||||
| % | 0 | 5 | 10 | 15 | 20 | 25 | 30 | 35 | 40 | 45 | 50 |
| Power 1 | 1.43 | 1.54 | 1.80 | 2.00 | 2.06 | 2.12 | 2.19 | 2.67 | 2.86 | 3.08 | 3.34 |
| Power 2 | 1.75 | 1.80 | 1.89 | 2.12 | 2.19 | 2.43 | 2.67 | 2.86 | 3.08 | 3.34 | 3.60 |
| Power 3 | 2.00 | 2.05 | 2.11 | 2.36 | 2.43 | 2.50 | 2.86 | 3.34 | 3.71 | 3.85 | 4.01 |
| Power 4 | 2.25 | 2.50 | 2.67 | 2.78 | 2.86 | 3.34 | 3.58 | 3.71 | 4.01 | 4.45 | 4.77 |
| Power 5 | 2.50 | 2.67 | 3.25 | 3.43 | 3.53 | 4.01 | 4.45 | 4.62 | 4.81 | 5.46 | 5.66 |
| Pear tree | |||||||||||
| % | 0 | 5 | 10 | 15 | 20 | 25 | 30 | 35 | 40 | 45 | 50 |
| Power 1 | 1.60 | 1.72 | 2.01 | 2.24 | 2.30 | 2.37 | 2.45 | 2.98 | 3.19 | 3.44 | 3.73 |
| Power 2 | 1.96 | 2.01 | 2.12 | 2.37 | 2.45 | 2.71 | 2.98 | 3.19 | 3.44 | 3.73 | 4.03 |
| Power 3 | 2.24 | 2.29 | 2.35 | 2.63 | 2.71 | 2.80 | 3.19 | 3.73 | 4.14 | 4.30 | 4.47 |
| Power 4 | 2.52 | 2.80 | 2.98 | 3.11 | 3.19 | 3.73 | 3.99 | 4.14 | 4.47 | 4.97 | 5.32 |
| Power 5 | 2.80 | 2.98 | 3.63 | 3.83 | 3.95 | 4.47 | 4.97 | 5.16 | 5.37 | 6.10 | 6.32 |
| Poplar | |||||||||||
| % | 0 | 5 | 10 | 15 | 20 | 25 | 30 | 35 | 40 | 45 | 50 |
| Power 1 | 2.22 | 2.39 | 2.78 | 3.10 | 3.19 | 3.29 | 3.39 | 4.14 | 4.43 | 4.77 | 5.17 |
| Power 2 | 2.72 | 2.78 | 2.94 | 3.29 | 3.39 | 3.76 | 4.14 | 4.43 | 4.77 | 5.17 | 5.59 |
| Power 3 | 3.10 | 3.18 | 3.27 | 3.65 | 3.76 | 3.88 | 4.43 | 5.17 | 5.75 | 5.97 | 6.21 |
| Power 4 | 3.49 | 3.88 | 4.14 | 4.31 | 4.43 | 5.17 | 5.54 | 5.75 | 6.21 | 6.90 | 7.39 |
| Power 5 | 3.88 | 4.14 | 5.03 | 5.32 | 5.48 | 6.21 | 6.90 | 7.16 | 7.45 | 7.39 | 8.77 |
| Sugarcane bagasse | |||||||||||
| % | 0 | 5 | 10 | 15 | 20 | 25 | 30 | 35 | 40 | 45 | 50 |
| Power 1 | 1.58 | 1.70 | 1.98 | 2.21 | 2.27 | 2.34 | 2.41 | 2.94 | 3.15 | 3.39 | 3.68 |
| Power 2 | 1.93 | 1.98 | 2.09 | 2.34 | 2.41 | 2.67 | 2.94 | 3.15 | 3.39 | 3.68 | 3.97 |
| Power 3 | 2.21 | 2.26 | 2.32 | 2.59 | 2.67 | 2.76 | 3.15 | 3.68 | 4.08 | 4.24 | 4.41 |
| Power 4 | 2.48 | 2.76 | 2.94 | 3.06 | 3.15 | 3.68 | 3.94 | 4.08 | 4.41 | 4.90 | 5.25 |
| Power 5 | 2.76 | 2.94 | 3.58 | 3.78 | 3.89 | 4.41 | 4.90 | 5.09 | 5.29 | 6.01 | 6.23 |
Disclaimer/Publisher’s Note: The statements, opinions and data contained in all publications are solely those of the individual author(s) and contributor(s) and not of MDPI and/or the editor(s). MDPI and/or the editor(s) disclaim responsibility for any injury to people or property resulting from any ideas, methods, instructions or products referred to in the content. |
© 2024 by the authors. Licensee MDPI, Basel, Switzerland. This article is an open access article distributed under the terms and conditions of the Creative Commons Attribution (CC BY) license (http://creativecommons.org/licenses/by/4.0/).


