Submitted:
03 June 2024
Posted:
05 June 2024
You are already at the latest version
Abstract

Keywords:
1. Introduction
2. Materials and Methods
2.1. Experimental setup
2.2. Engine Test Conditions
2.3. NG Phased Injection Interpretative Model
3. Results
3.1. NG Phased Injection Optimization
3.2. Performance Comparison between Continuous and Phased NG Fueling
4. Discussion
4.1. Analysis of the Optimal Phased Injection Conditions
5. Conclusions
Author Contributions
Funding
Acknowledgments
Conflicts of Interest
Nomenclature
| ATDC | After topo dead center |
| BDC | Bottom dead center |
| BMEP | Brake mean effective pressure |
| BTDC | Before topo dead center |
| CAD | Crank angel degree |
| DF | Dual fuel |
| FD | Full diesel |
| GHG | Greenhouse gases |
| GWP | Global warming potential |
| IMEP | Indicated mean effective pressure |
| NG | Natural gas |
| SOI | Start of injection |
| TDC | Top dead center |
References
- Rochussen, J., Jaeger, N. S. B., Penner, H., Khan, A., & Kirchen, P. (2023). Development and demonstration of strategies for GHG and methane slip reduction from dual-fuel natural gas coastal vessels. Fuel, 349. [CrossRef]
- Sharafian, A., Blomerus, P., & Mérida, W. (2019). Natural gas as a ship fuel: Assessment of greenhouse gas and air pollutant reduction potential. Energy Policy, 131, 332–346. [CrossRef]
- Zhao, R., Xu, L., Su, X., Feng, S., Li, C., Tan, Q., & Wang, Z. (2020). A Numerical and Experimental Study of Marine Hydrogen-Natural Gas-Diesel Tri-Fuel Engines. Polish Maritime Research, 27(4), 80–90. [CrossRef]
- Zhang, Z., Lv, J., Li, W., Long, J., Wang, S., Tan, D., & Yin, Z. (2022). Performance and emission evaluation of a marine diesel engine fueled with natural gas ignited by biodiesel-diesel blended fuel. Energy, 256. [CrossRef]
- Dierickx, J., Dejaegere, Q., Peeters, J., Sileghem, L., & Verhelst, S. (n.d.). Performance and emissions of a high-speed marine dual-fuel 1 engine operating with methanol-water blends as a fuel.
- Xu, L., Xu, S., Bai, X. S., Repo, J. A., Hautala, S., & Hyvönen, J. (2023). Performance and emission characteristics of an ammonia/diesel dual-fuel marine engine. Renewable and Sustainable Energy Reviews, 185. [CrossRef]
- García Valladolid, P., Tunestål, P., Monsalve-Serrano, J., García, A., & Hyvönen, J. (2017). Impact of diesel pilot distribution on the ignition process of a dual fuel medium speed marine engine. Energy Conversion and Management, 149, 192–205. [CrossRef]
- Zhou, H., Zhao, H. W., Huang, Y. P., Wei, J. H., & Peng, Y. H. (2019). Effects of injection timing on combustion and emission performance of dual-fuel diesel engine under low to medium load conditions. Energies, 12(12). [CrossRef]
- Wang, H., Gan, H., & Theotokatos, G. (2020). Parametric investigation of pre-injection on the combustion, knocking and emissions behaviour of a large marine four-stroke dual-fuel engine. Fuel, 281. [CrossRef]
- Yousefi, A., Guo, H., Birouk, M., Liko, B., & Lafrance, S. (2021). Effect of post-injection strategy on greenhouse gas emissions of natural gas/diesel dual-fuel engine at high load conditions. Fuel, 290. [CrossRef]
- Liu, X., Wang, H., Zheng, Z., & Yao, M. (2021). Numerical investigation on the combustion and emission characteristics of a heavy-duty natural gas-diesel dual-fuel engine. Fuel, 300. [CrossRef]
- Boretti, A. (2020). Numerical analysis of high-pressure direct injection dual-fuel diesel-liquefied natural gas (LNG) engines. Processes, 8(3). [CrossRef]
- Lu, Z., Ma, M., Wang, T., Lu, T., Wang, H., Feng, Y., & Shi, L. (2023). Numerical research of the in-cylinder natural gas stratification in a natural gas-diesel dual-fuel marine engine. Fuel, 337. [CrossRef]
- Gleis, S., Frankl, S., Waligorski, D., Prager, Dr.-Ing. M., & Wachtmeister, Prof. Dr.-Ing. G. (2019, December 19). Investigation of the High-Pressure-Dual-Fuel (HPDF) combustion process of natural gas on a fully optically accessible research engine. [CrossRef]
- Lei, Y., Wu, Y., Qiu, T., Zhou, D., Lian, X., & Jin, W. (2022). Experimental Study of Dual-Fuel Diesel/Natural Gas High-Pressure Injection. ACS Omega. [CrossRef]
- Liu, H., Li, J., Wang, J., Wu, C., Liu, B., Dong, J., Liu, T., Ye, Y., Wang, H., & Yao, M. (2019). Effects of injection strategies on low-speed marine engines using the dual fuel of high-pressure direct-injection natural gas and diesel. Energy Science and Engineering, 7(5), 1994–2010. [CrossRef]
- Yang, B., & Zeng, K. (2018). Effects of natural gas injection timing and split pilot fuel injection strategy on the combustion performance and emissions in a dual-fuel engine fueled with diesel and natural gas. Energy Conversion and Management, 168, 162–169. [CrossRef]
- Ariani, B., Ariana, I. M., & Fathallah, M. A. (2019). Effect of natural gas injection timing on combustion performance & methane slip emission of diesel - NG dual fuel engine: An experimental study. AIP Conference Proceedings, 2187. [CrossRef]
- Felayati, F. M., Semin, Cahyono, B., & Bakar, R. A. (2019). Investigation of the effect of natural gas injection timing on dual-fuel engine emissions using split injection strategies. International Review of Mechanical Engineering, 13(11), 645–654. [CrossRef]
- Kurniawan, M. A., Yuvenda, D., & Sudarmanta, B. (2019). The Effects CNG Injection Timing on Engine Performance and Emissions of A Diesel Dual Fuel Engine. In IPTEK The Journal for Technology and Science (Vol. 30, Issue 2).
- You, J., Liu, Z., Wang, Z., Wang, D., & Xu, Y. (2020). Impact of natural gas injection strategies on combustion and emissions of a dual fuel natural gas engine ignited with diesel at low loads. Fuel, 260. [CrossRef]
- De Simio, L., Iannaccone, S., Pennino, V., & Marchitto, L. (2023, August 28). Experimental Analysis of a Single-Cylinder Large Bore Engine with External Supercharging in Diesel/CNG Dual-Fuel Mode. SAE Technical Papers. [CrossRef]
- Gülmez, Y., & Özmen, G. (2021). Effects of Exhaust Backpressure Increment on the Performance and Exhaust Emissions of a Single Cylinder Diesel Engine. Journal of Eta Maritime Science, 9(3), 177–191. [CrossRef]
- IPCC, 2021: Climate Change 2021: The Physical Science Basis. Contribution of Working Group I to the Sixth Assessment Report of the Intergovernmental Panel on Climate Change [Masson-Delmotte, V., P. Zhai, A. Pirani, S.L. Connors, C. Péan, S. Berger, N. Caud, Y. Chen, L. Goldfarb, M.I. Gomis, M. Huang, K. Leitzell, E. Lonnoy, J.B.R. Matthews, T.K. Maycock, T. Waterfield, O. Yelekçi, R. Yu, and B. Zhou (eds.). Cambridge University Press, Cambridge, United Kingdom and New York, NY, USA, 2391 pp. [CrossRef]



| Bore | 170 mm |
| Stroke | 185 mm |
| Single Cylinder Displacement | 4.2 dm3 |
| Max BMEP | 25.2 bar |
| Injection Pressure | 800−1600 |
| Compression ratio | 13.2 : 1 |
| Rated Power | 145 kW @ 1800 rpm |
| Exhaust Valve Opening | 80 CAD BBDC |
| Exhaust Valve Closure | 43 CAD ATDC |
| Inlet Valve Opening | 47 CAD BBDC |
| Inlet Valve Closure | 53 CAD BBDC |
| Property | Diesel fuel | Natural Gas |
|---|---|---|
| Density@15° C [kg/m3] | 834 | 0.83 |
| Lower heating value [MJ/kg] | 42.5 | 45.8 |
| Carbon intensity [gCO2/MJ] | 70.3 | 50.1 |
| Stoichiometric Air to Fuel Ratio | 14.5 | 15.8 |
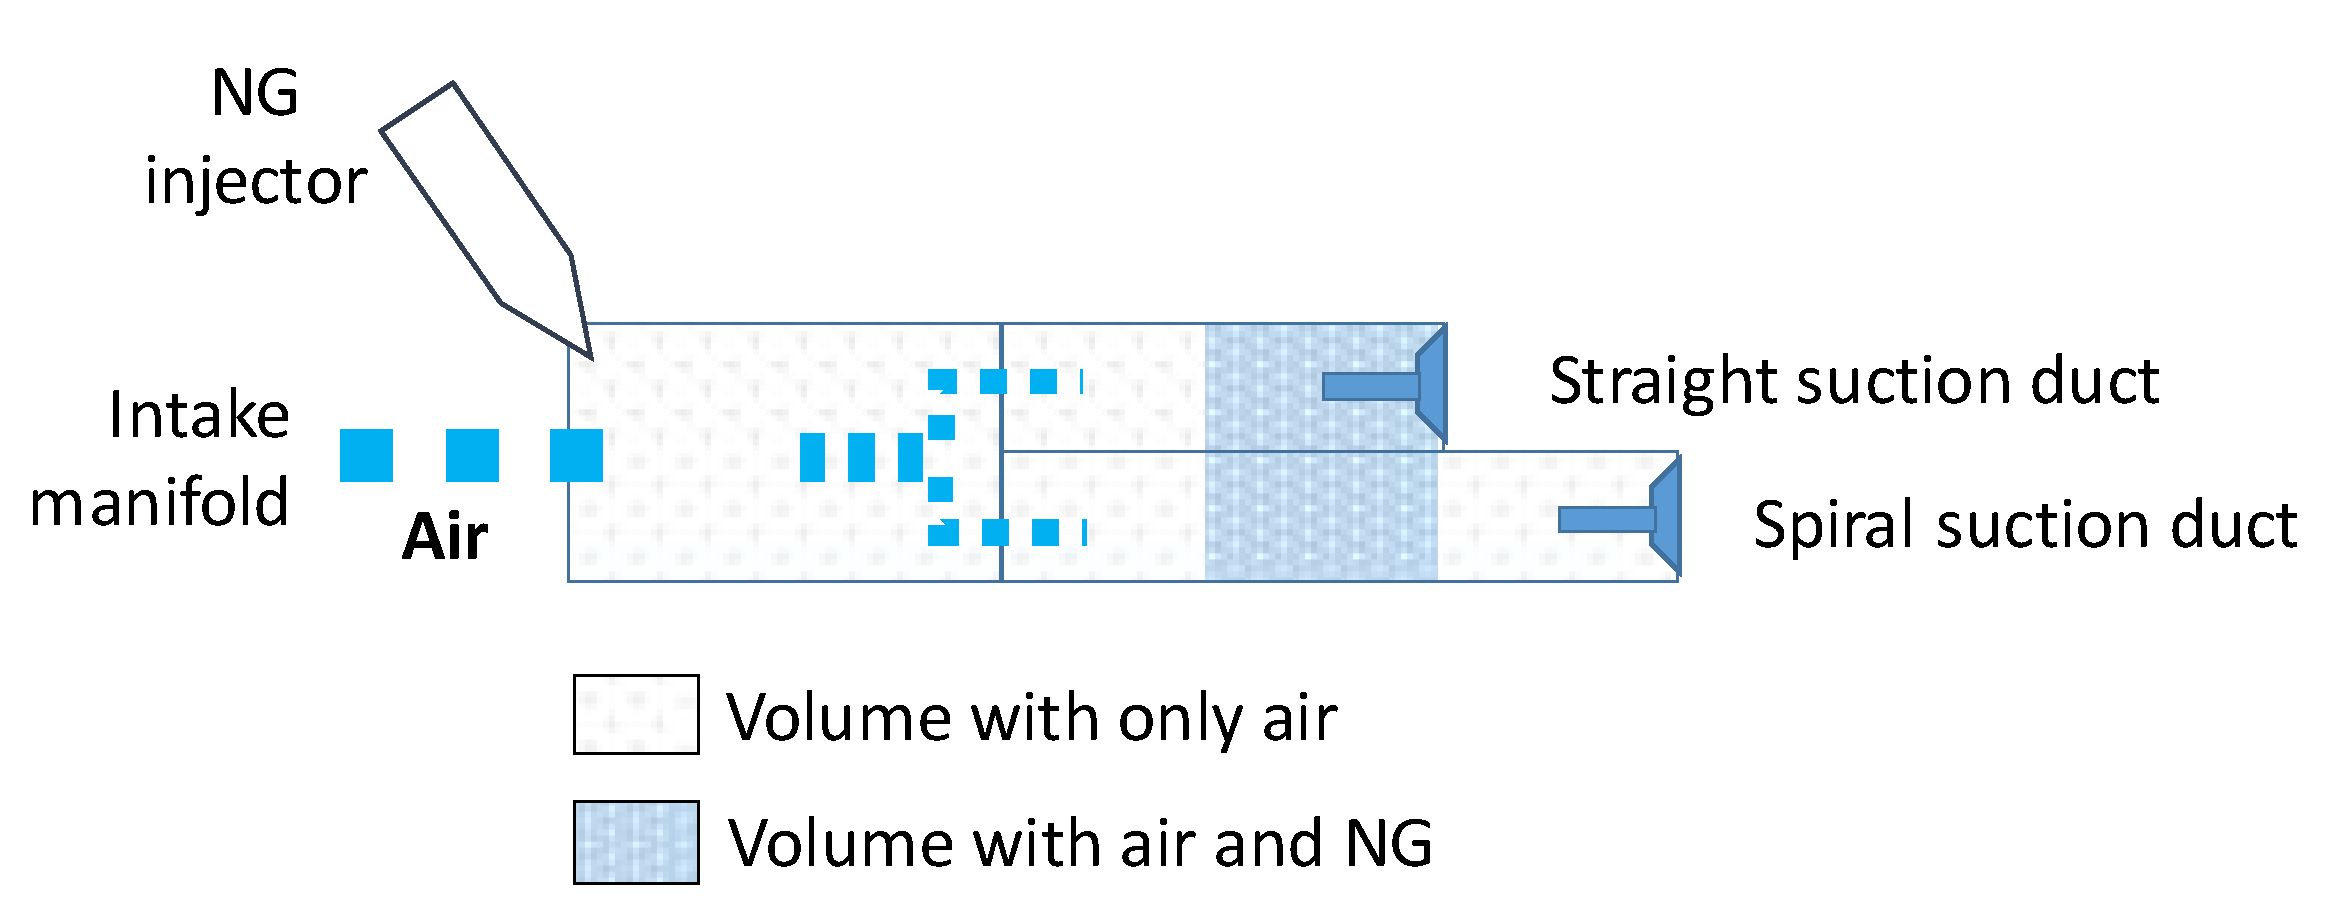
| Duct | D1 | D2 | D3 |
|---|---|---|---|
| Duct section area [cm2] | 78.53 | 38.48 | 38.48 |
| Duct legnt [cm] | 15.0 | 14.2 | 23.2 |
| Air speed [m/s] @ 270 kg/h and 1.8 kg/m3 | 21.2 | 21.7 | 21.7 |
| Time to pass through [ms] | 7.1 | 6.6 | 10.7 |
| Angular range @ 1500 rpm [CAD] | 64 | 59 | 96 |
| Engine fueling mode |
Data type |
Brake power | Power with BMEPcor |
THC with BMEPcor |
CO2 with BMEPcor |
Equivalent CO2 with BMEPcor |
|---|---|---|---|---|---|---|
| kW | kW | g/kWh | g/kWh | g/kWh | ||
| FD | Min | 46.5 | 40.0 | 0.4 | 744 | 744 |
| Max | 50.4 | 43.3 | 0.8 | 819 | 819 | |
| Best | 50.4 | 43.3 | 0.4 | 744 | 744 | |
| DF with continuous NG fueling | Min | 42.2 | 40.7 | 12.2 | 618 | 984 |
| Max | 44.8 | 43.2 | 16.5 | 707 | 1078 | |
| Best | 44.8 | 43.2 | 12.2 | 618 | 984 | |
| DF with phased NG fueling | Min | 43.0 | 41.8 | 4.6 | 583 | 773 |
| Max | 44.6 | 43.5 | 9.7 | 654 | 881 | |
| Best | 44.6 | 43.5 | 4.6 | 583 | 773 | |
| DF continuous vs. FD | -11% | 0% | 3034% | -17% | 32% | |
| DF phased vs. FD | -11% | 0% | 1079% | -22% | 4% | |
| DF ph. vs. DF con.. | 0% | 1% | -62% | -6% | -21% |
Disclaimer/Publisher’s Note: The statements, opinions and data contained in all publications are solely those of the individual author(s) and contributor(s) and not of MDPI and/or the editor(s). MDPI and/or the editor(s) disclaim responsibility for any injury to people or property resulting from any ideas, methods, instructions or products referred to in the content. |
© 2024 by the authors. Licensee MDPI, Basel, Switzerland. This article is an open access article distributed under the terms and conditions of the Creative Commons Attribution (CC BY) license (http://creativecommons.org/licenses/by/4.0/).


