1. Introduction
The availability of assets in the Electric Power System (EPS) depends on the quality and reliability of electrical equipment during its operation. Internally located faults, even small ones, can cause progressive deterioration of the equipment insulation and the consequent equipment withdraw, which results in asset repair costs, regulatory fines and other types of penalties imposed by the inspection agencies of the electricity sector [
1].
Among the various ways to monitor and diagnose the operational condition of insulation systems, the measurement of partial discharge (PD) activity stands out, being considered a well-established solution for the detection of possible defects in the insulation system of high voltage equipment [
2].
Partial discharges are, in general, consequences of local electrical stress on the equipment insulation, both internally and superficially. These short-circuits partially circuit the insulation between two conductors and are mostly accompanied by emissions of sound, light, heat, chemical reactions, and electromagnetic waves [
3]. Despite the low intensity of the discharges, due to the recurrent occurrence of the phenomenon on organic insulating materials, the continuous PD activity degrades the material in such a way that a partial discharge evolves into a complete disruption, resulting in equipment failure and consequent withdrawal from operation. Thus, as it is a phenomenon with gradual evolution, the verification of the occurrence and evolution of partial discharges becomes a robust tool in monitoring to diagnosis of the operating conditions of assets, helping and raising the level of reliability of electric power concessionaires.
There are several techniques for monitoring partial discharges [
4,
5,
6,
7,
8]. Among the techniques, the electrical method established by IEC 60270 [
3] and the radiometric method [
9,
10,
11] can be highlighted.
The electrical method is considered a reference method for the detection and classification of partial discharges. This method is calibratable and, therefore, reproducible with relative reliability, and is used in laboratory and insulating systems commissioning tests. However, the standard postulates the need for a direct electrical connection between the acquisition system and the equipment to be tested, making this method quite invasive and sensitive to noise, presenting practical limitations for the application in the continuous monitoring of the operational state of the equipment in substations. Because of this, the method is not widely practiced in the field, being generally restricted to laboratory tests.
Due to the limitations imposed by the electrical method and other alternative methods, researchers have developed a technique focused on the detection of electromagnetic waves in the UHF (
Ultra High Frequency) range for the detection of PD, called the radiometric method. The radiometric method consists of acquire electromagnetic waves from the current pulses of partial discharges using sensors (antennas) with a frequency range between 300 MHz and 3 GHz [
12,
13].
The great potential applicability of the radiometric method of partial discharge acquisition (RMPDA) consists in the ability to perform the complete diagnosis of electrical equipment regarding the quality of its insulation in an efficient, reliable, and non-invasive way, allowing to detect, classify and locate defects [
10,
11,
12,
13].
In addition, the use of UHF sensors or antennas is effective for real-time monitoring of various levels and types of partial discharges in equipment, as they are immune to external noises, such as corona discharges [
14].
However, for the application of monitoring via the RMPDA method, oscilloscopes with high bandwidths and sampling rates are necessary for better detailing of the partial discharge pulses and the consequent extraction of attributes for classification [
15].
The replacement of oscilloscopes with high bandwidths and sampling rate by cheaper and more robust acquisition systems prepared for field acquisition is possible with the addition of a signal conditioning system based on envelope sensing circuitry [
16]. Moreover, the signal-to-noise ratio tends to be improved, since could be used a low noise amplifier (LNA) to improve the sensitivity of the system.
The acquisition of envelopes or a UHF pulse does not provide significant information for the classification of PD sources. Thus, using a technique such as phase resolved partial discharges (PRPD) analysis can contextualize and simplify the classification of defect. It is based only on intensity and phase parameters of signals and histograms, especially if the acquisition of signals involves a reduced sampling method, such as envelope detectors [
17,
18].
With the evolution of signal processing techniques, artificial intelligence and digital signal filtering techniques have been increasingly applied for monitoring and diagnosis in electric systems [
19]. Artificial neural networks, support vector machines, and decision trees have been used as techniques for diagnosing equipment failures [
20]. In addition, due to the large amount of data acquired and patterns generated, it is not feasible to perform the classification visually [
21].
The detection of PD with commercial antennas and the demonstration of the differences in the envelope depending on the distance between the antenna and the PD source are presented by [
22] and [
16]. Moreover, [
22,
23] differentiated between sources of partial discharges using envelope information from the various sources. [
22] [
23].
In the literature, the classic use of PRPD patterns is mostly used to verify the severity of PD, regarding the amplitude and evolution of discharge levels [
24]. PRPD patterns with commercial UHF antenna and PD classifications using the extraction of attributes from the envelopes of these pulses were performed by [
25]. Although, they did not perform the classification with the PRPD standards.
Therefore, it is essential to study the feasibility of PRPD graphs from the RMPDA with envelope detection, as well as studies to verify the feasibility of classifying the different patterns detected. Thus, it is proposed, in this work, the use of printed monopole antenna (PMA) as UHF sensor with sampling rate reduction technique as envelope detection through signal conditioning for the detection of patterns that can assist in the classification of partial discharges.
2. Experimental Setup
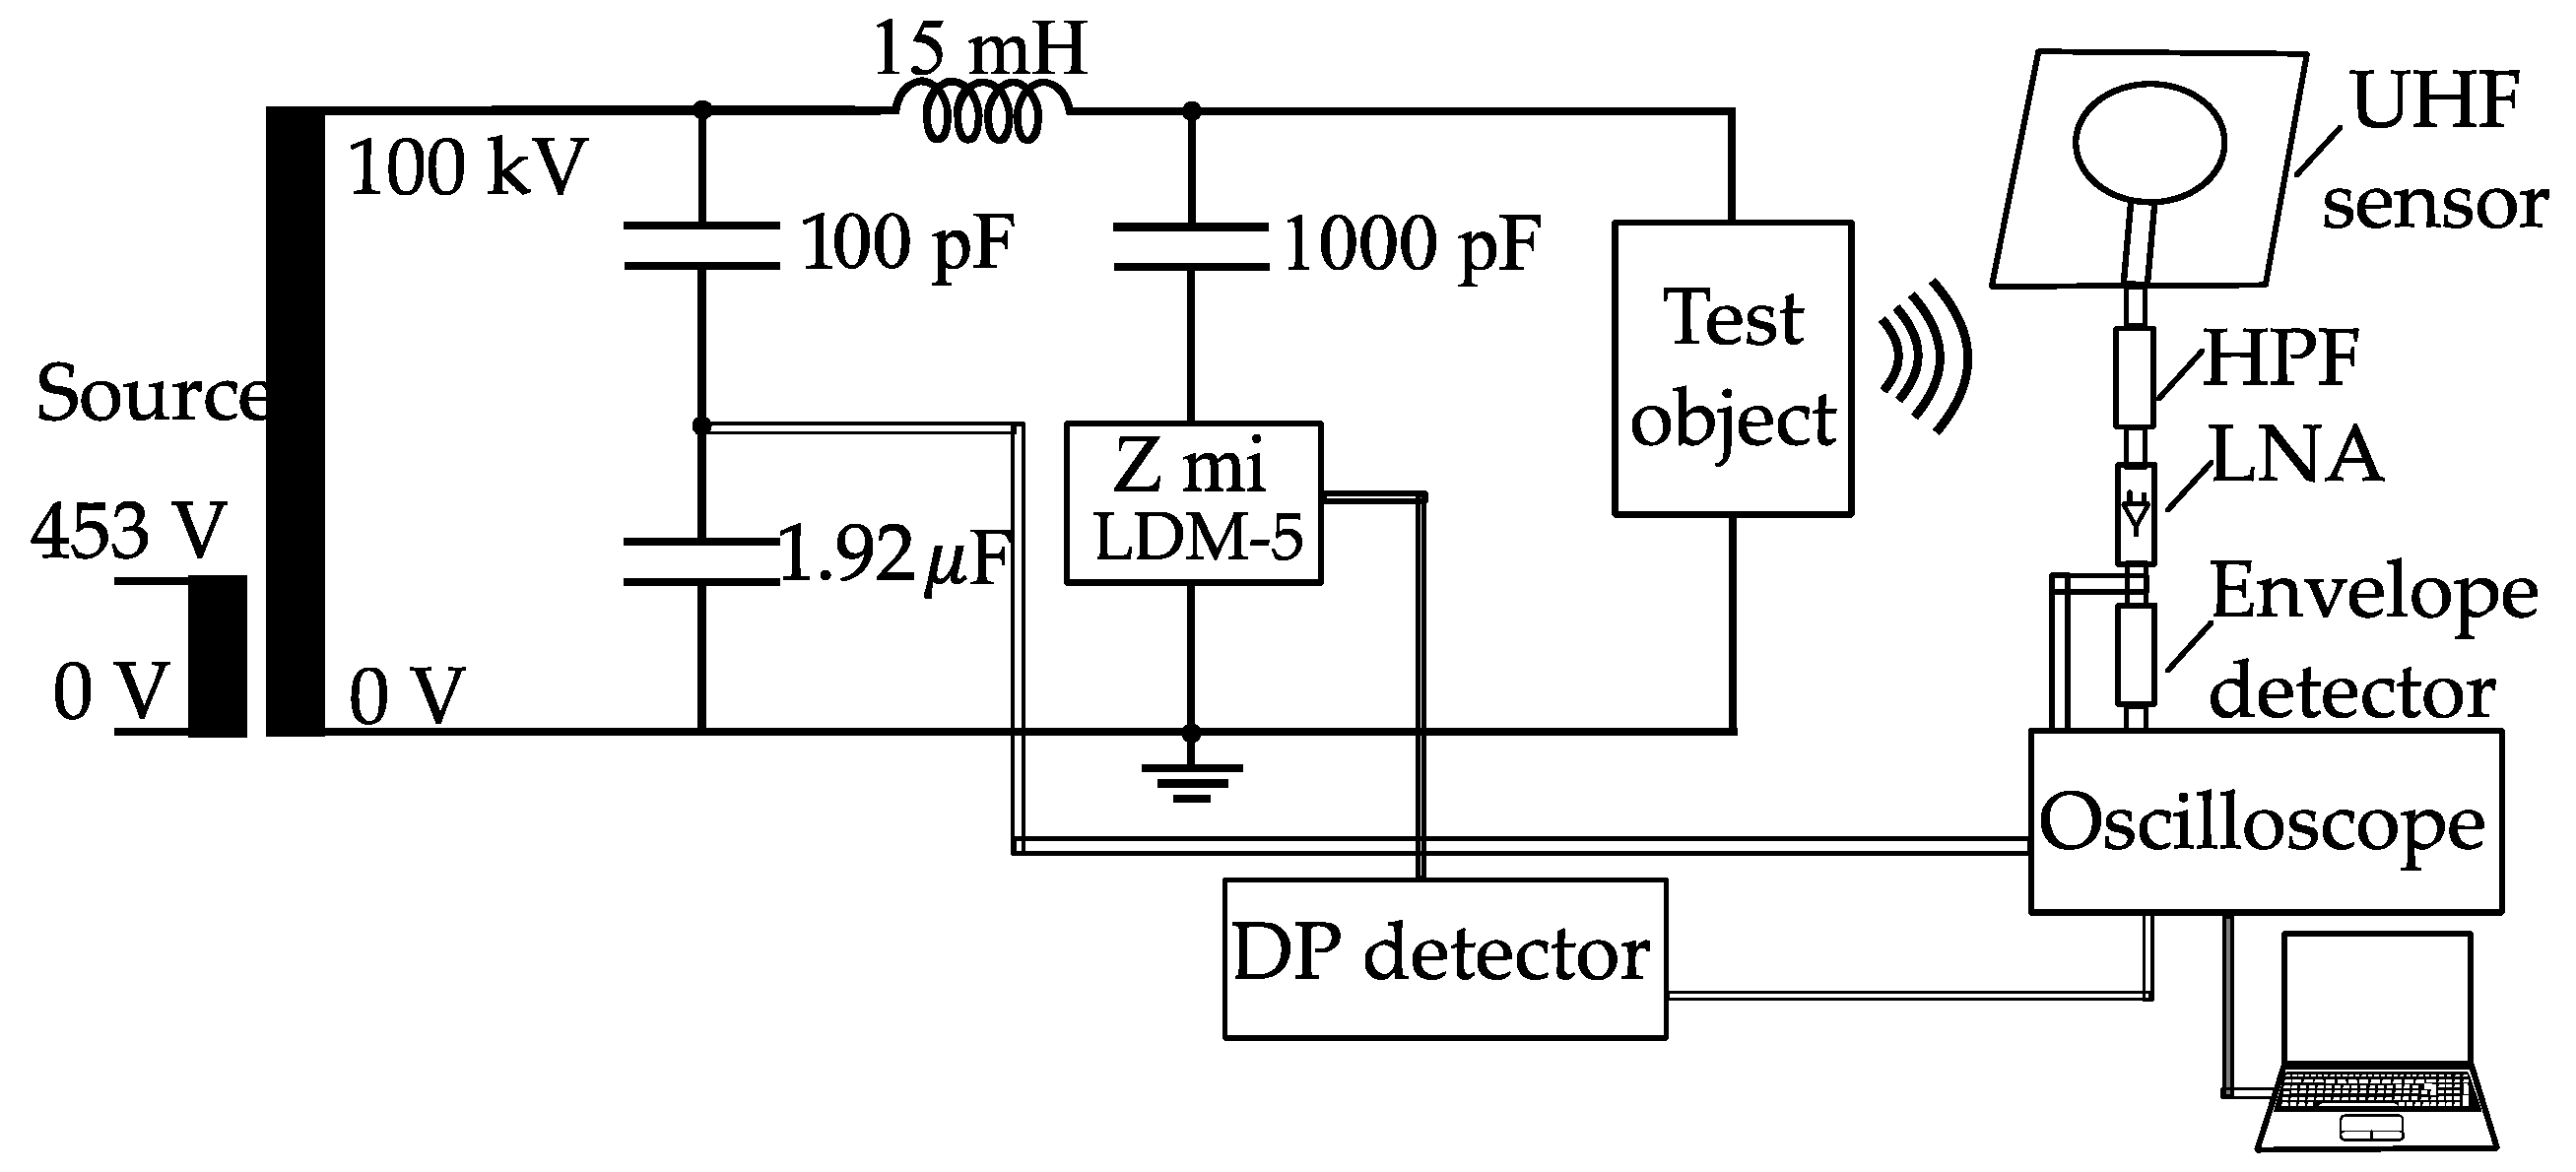
For comparative purposes, the circuit defined by IEC 60270 [
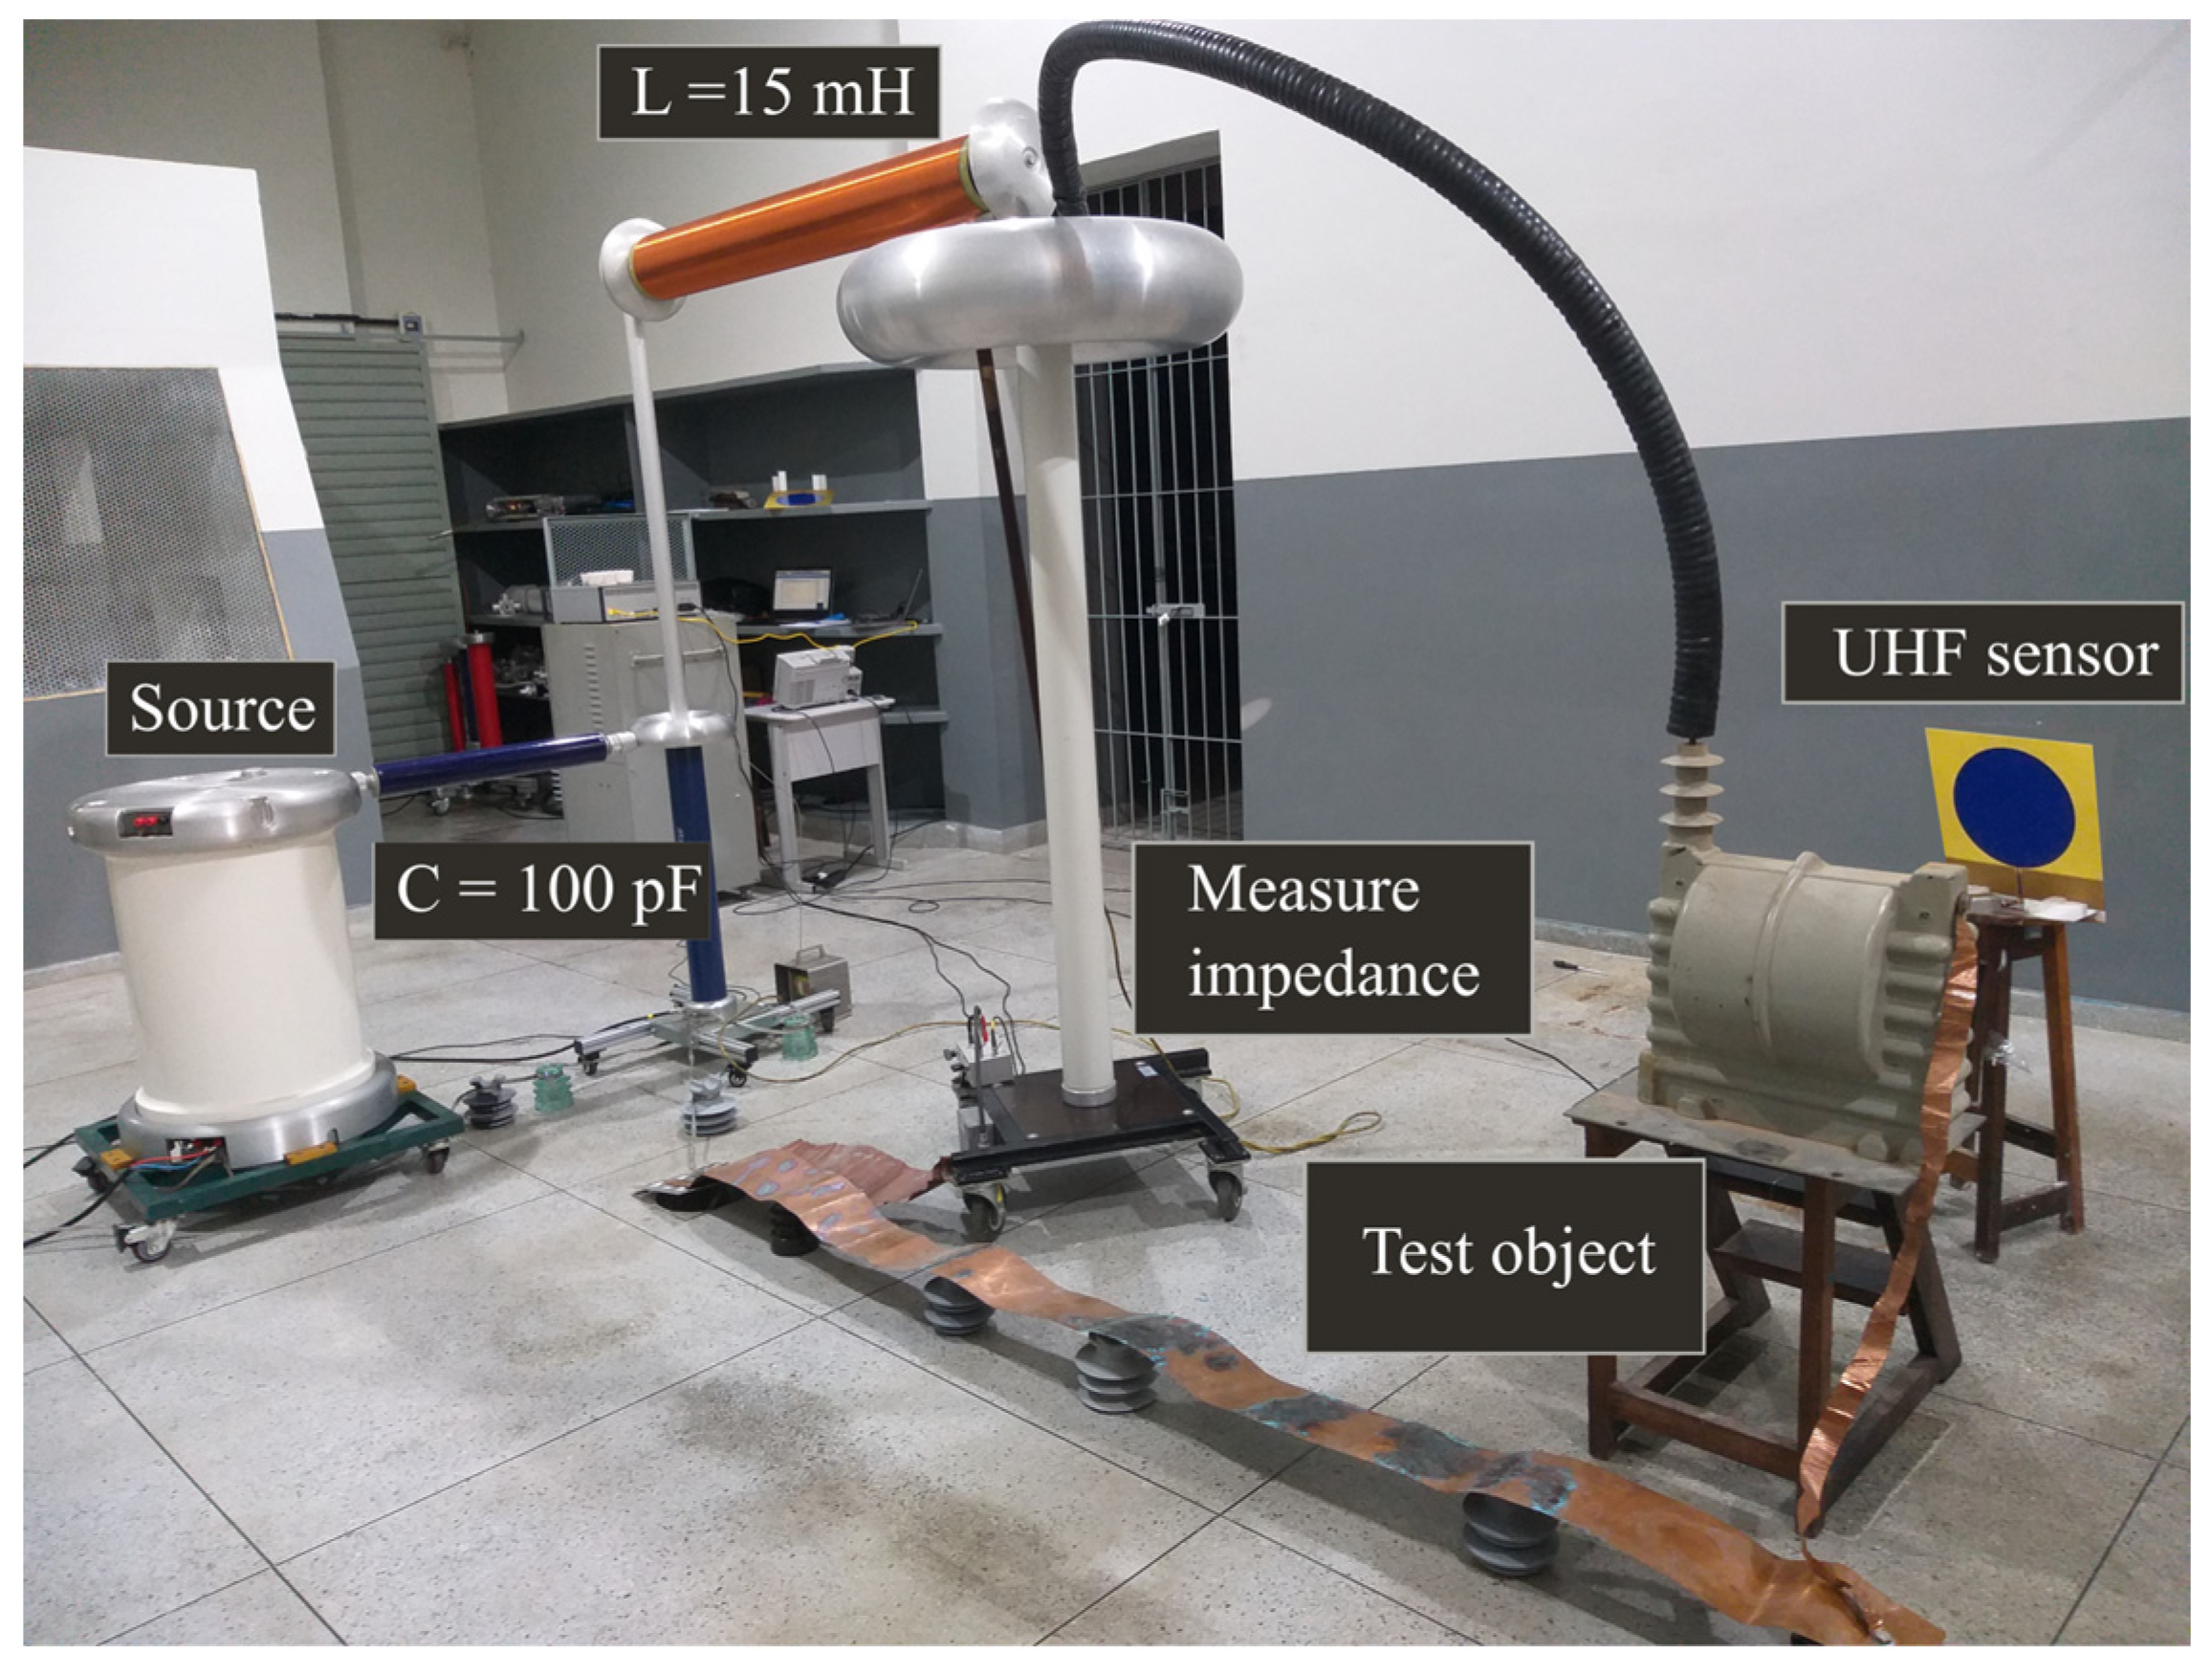
3] was added to allow an automatic and simultaneous acquisition also by the radiometric method. The proposed additions consist of acquiring, through one channel of the oscilloscope, the sinusoidal high voltage reference signal through the capacitive voltage divider and, in other channels, the signal from the LNA and the conditioned signal from the detection of the envelope. The proposed arrangement can be seen in
Figure 1 and its photograph is show in
Figure 2.
In
Figure 1 and
Figure 2, the generation of high alternating voltage is from a transformer with adjustable secondary voltage (0 - 100 kV) from the voltage variation in the primary (0 - 220 V). The measurement of the high voltage is made possible by a capacitive voltage divider for obtaining and controlling the waveform. The filtering of noise coming from the voltage source is made by a 15 mH blocking coil. The IEC 60270 measuring branch consists of a 1000 pF coupling capacitor in series with an LDM – 5 Doble Lemke measuring impedance and the LDS – 6 digital partial discharge meter, connected to a laptop with a graphical interface of the Doble Lemke LDS-6 PD Measuring System program. Finally, the system calibration is made possible using an LDC – 5 Doble Lemke calibrator.
Simultaneously with the electric method measurement, the measurement is carried out with the UHF sensor that was a printed monopole antenna, designed by [
26], with a signal conditioning circuit. The oscilloscope is a Rohde & Schwarz-RTA4004 (1 GHz and 5 GSa/s) configured for acquisition at 125 MSa/s on four channels, with 2.5 MSa per channel. Lastly, for PD generation, five test objects were used: Hydrogenerator bar with applied nominal operating voltage of 6 kV; Phenolite dielectric discs with two and three internal cavities of 2 mm diameter submitted to 16 kV and 18 kV, respectively, both designed and made by [
27] and submitted to an PD generation cell developed by [
28]; Potential transformer at 20 kV nominal voltage and; Tip-to-tip electrodes immersed in oil and spaced by 4 cm submitted to 12 kV in order to emulate oil discharges.
3. Signal Conditioning System
The signal conditioning circuit consists of a high-pass filter, a low noise amplifier and an envelope detector. Additionally, the circuit developed for the application of this work is presented in
Figure 3.
The specified conditioning system consists of a high-pass filter with a cut-off frequency of 150 MHz. The amplifier is an Oockic 40 dB low noise amplifier with frequencies between 30 MHz to 4 GHz. The envelope detector is a model based on the ADL 5511 in Schottky diode with an operating range from DC up to 6 GHz with envelopes with bandwidth up to 130 MHz, shown in [
16].
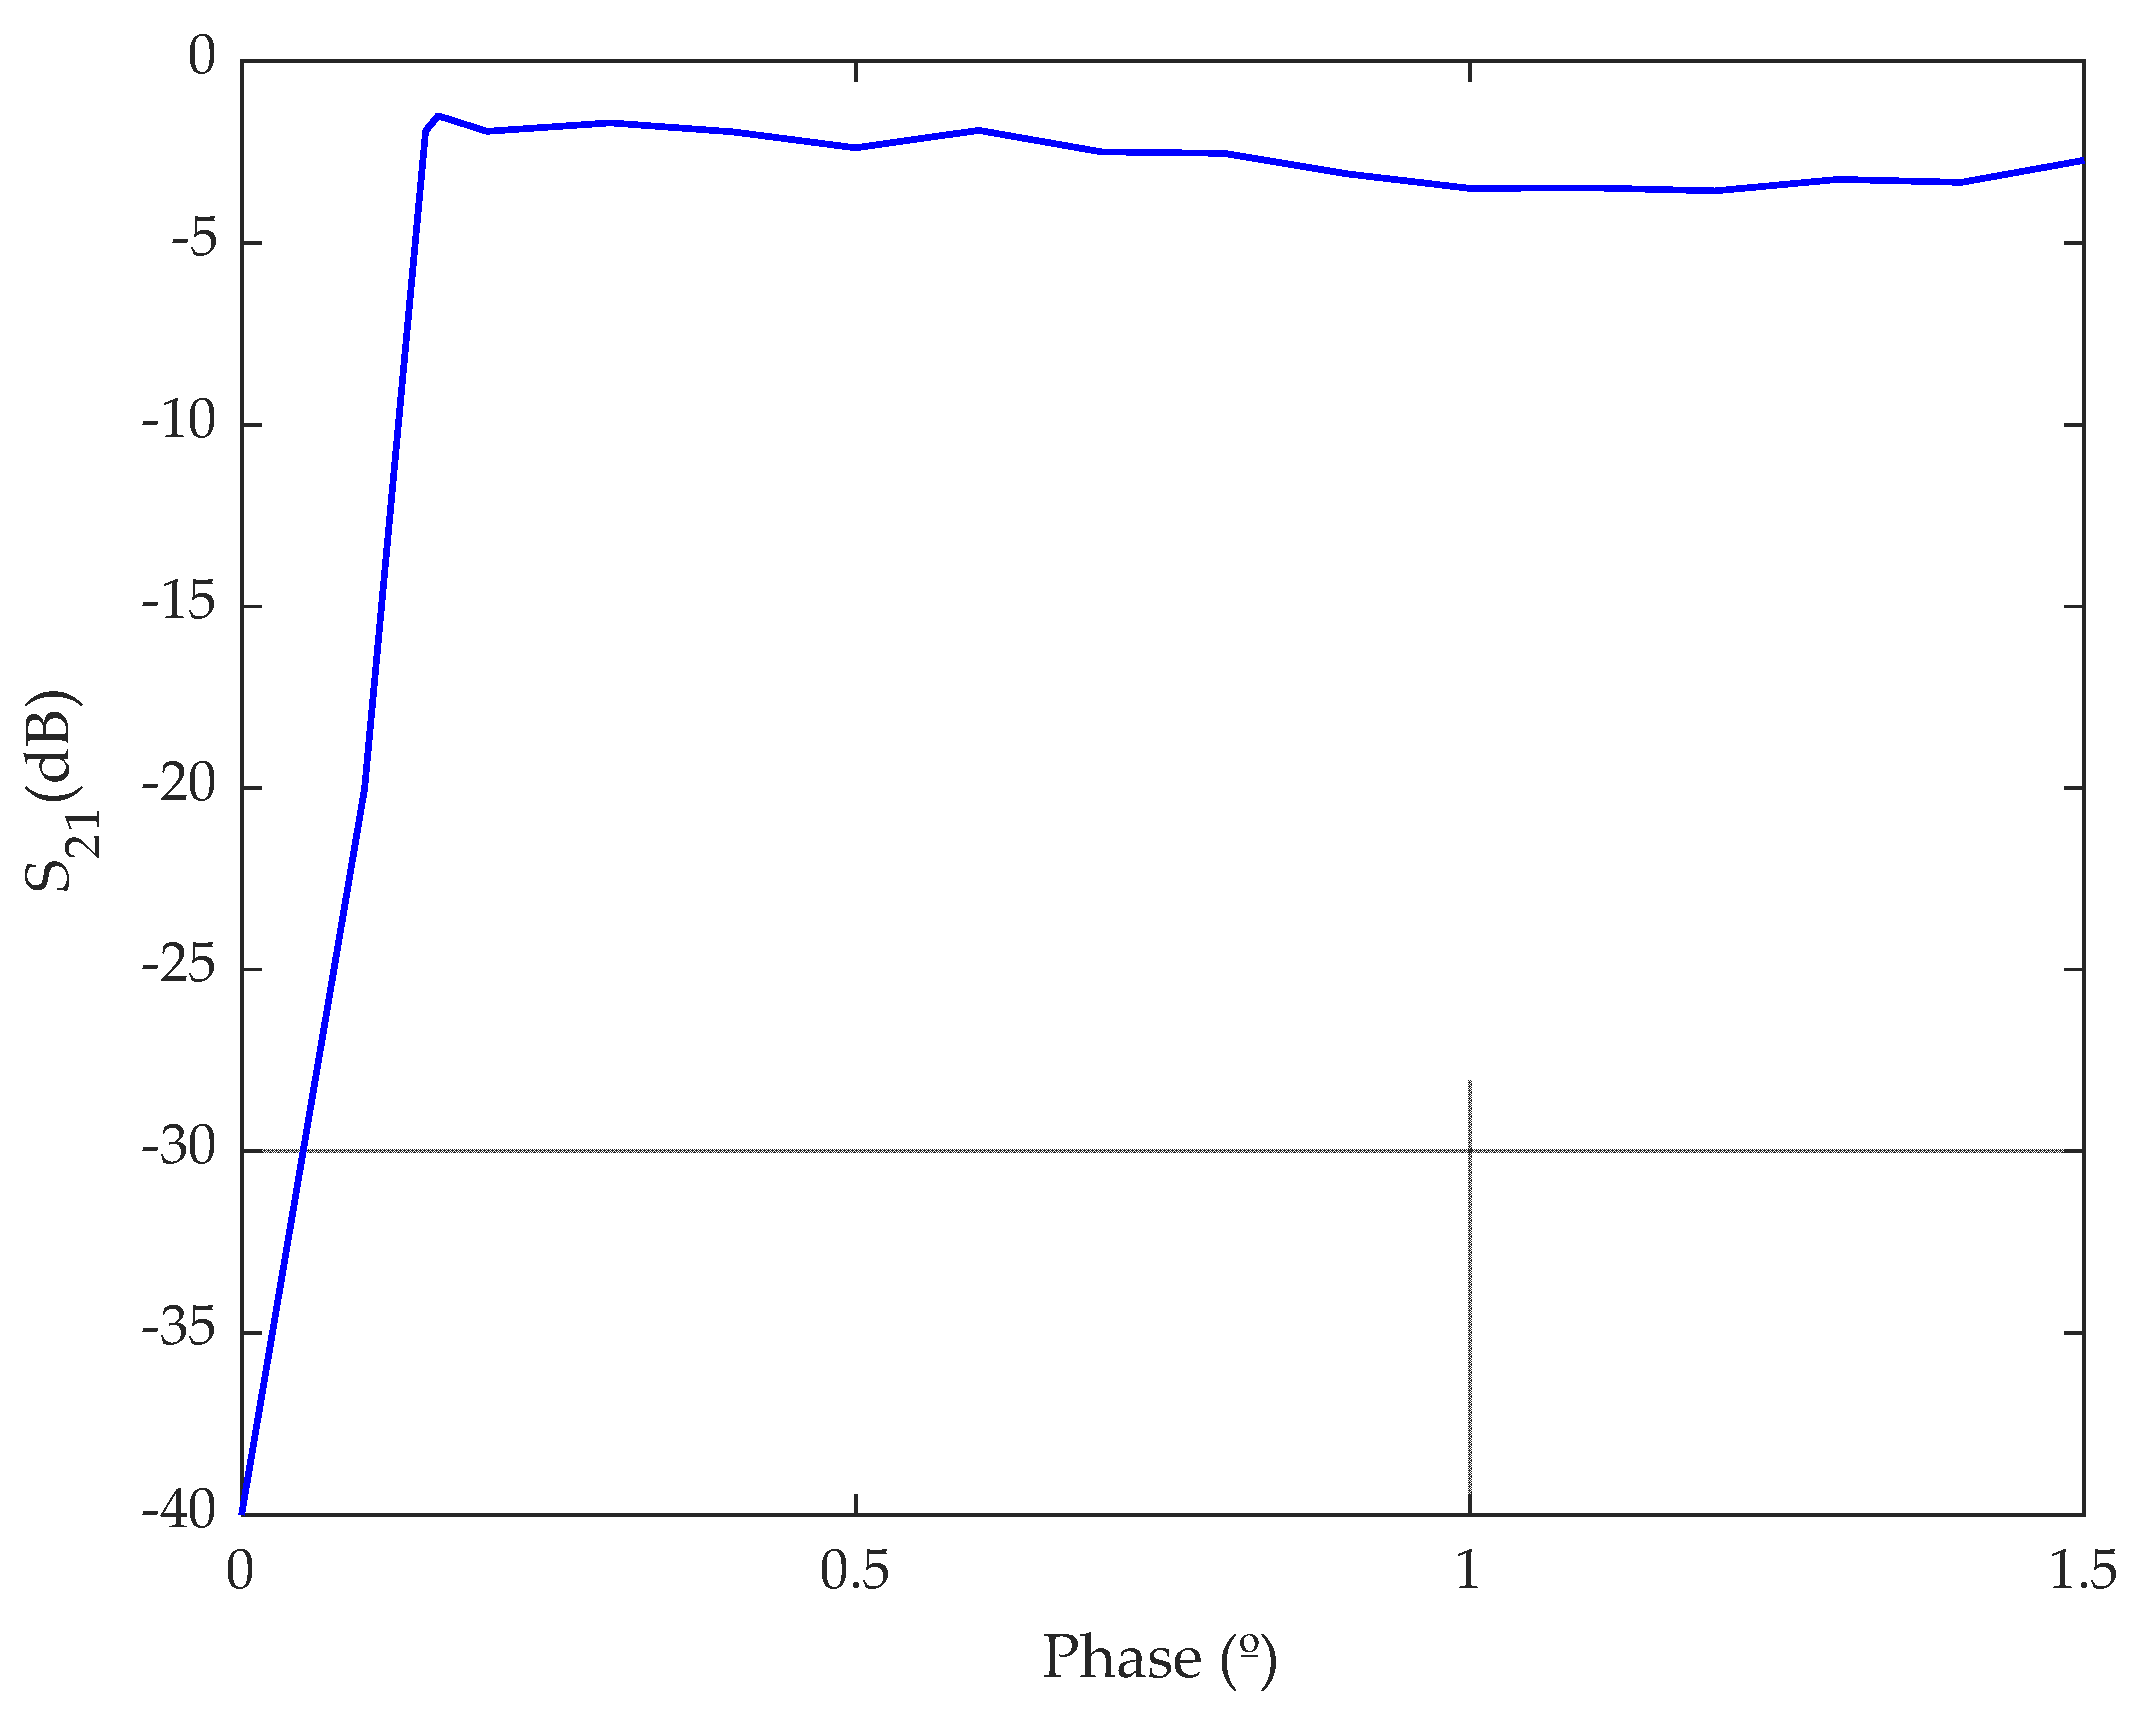
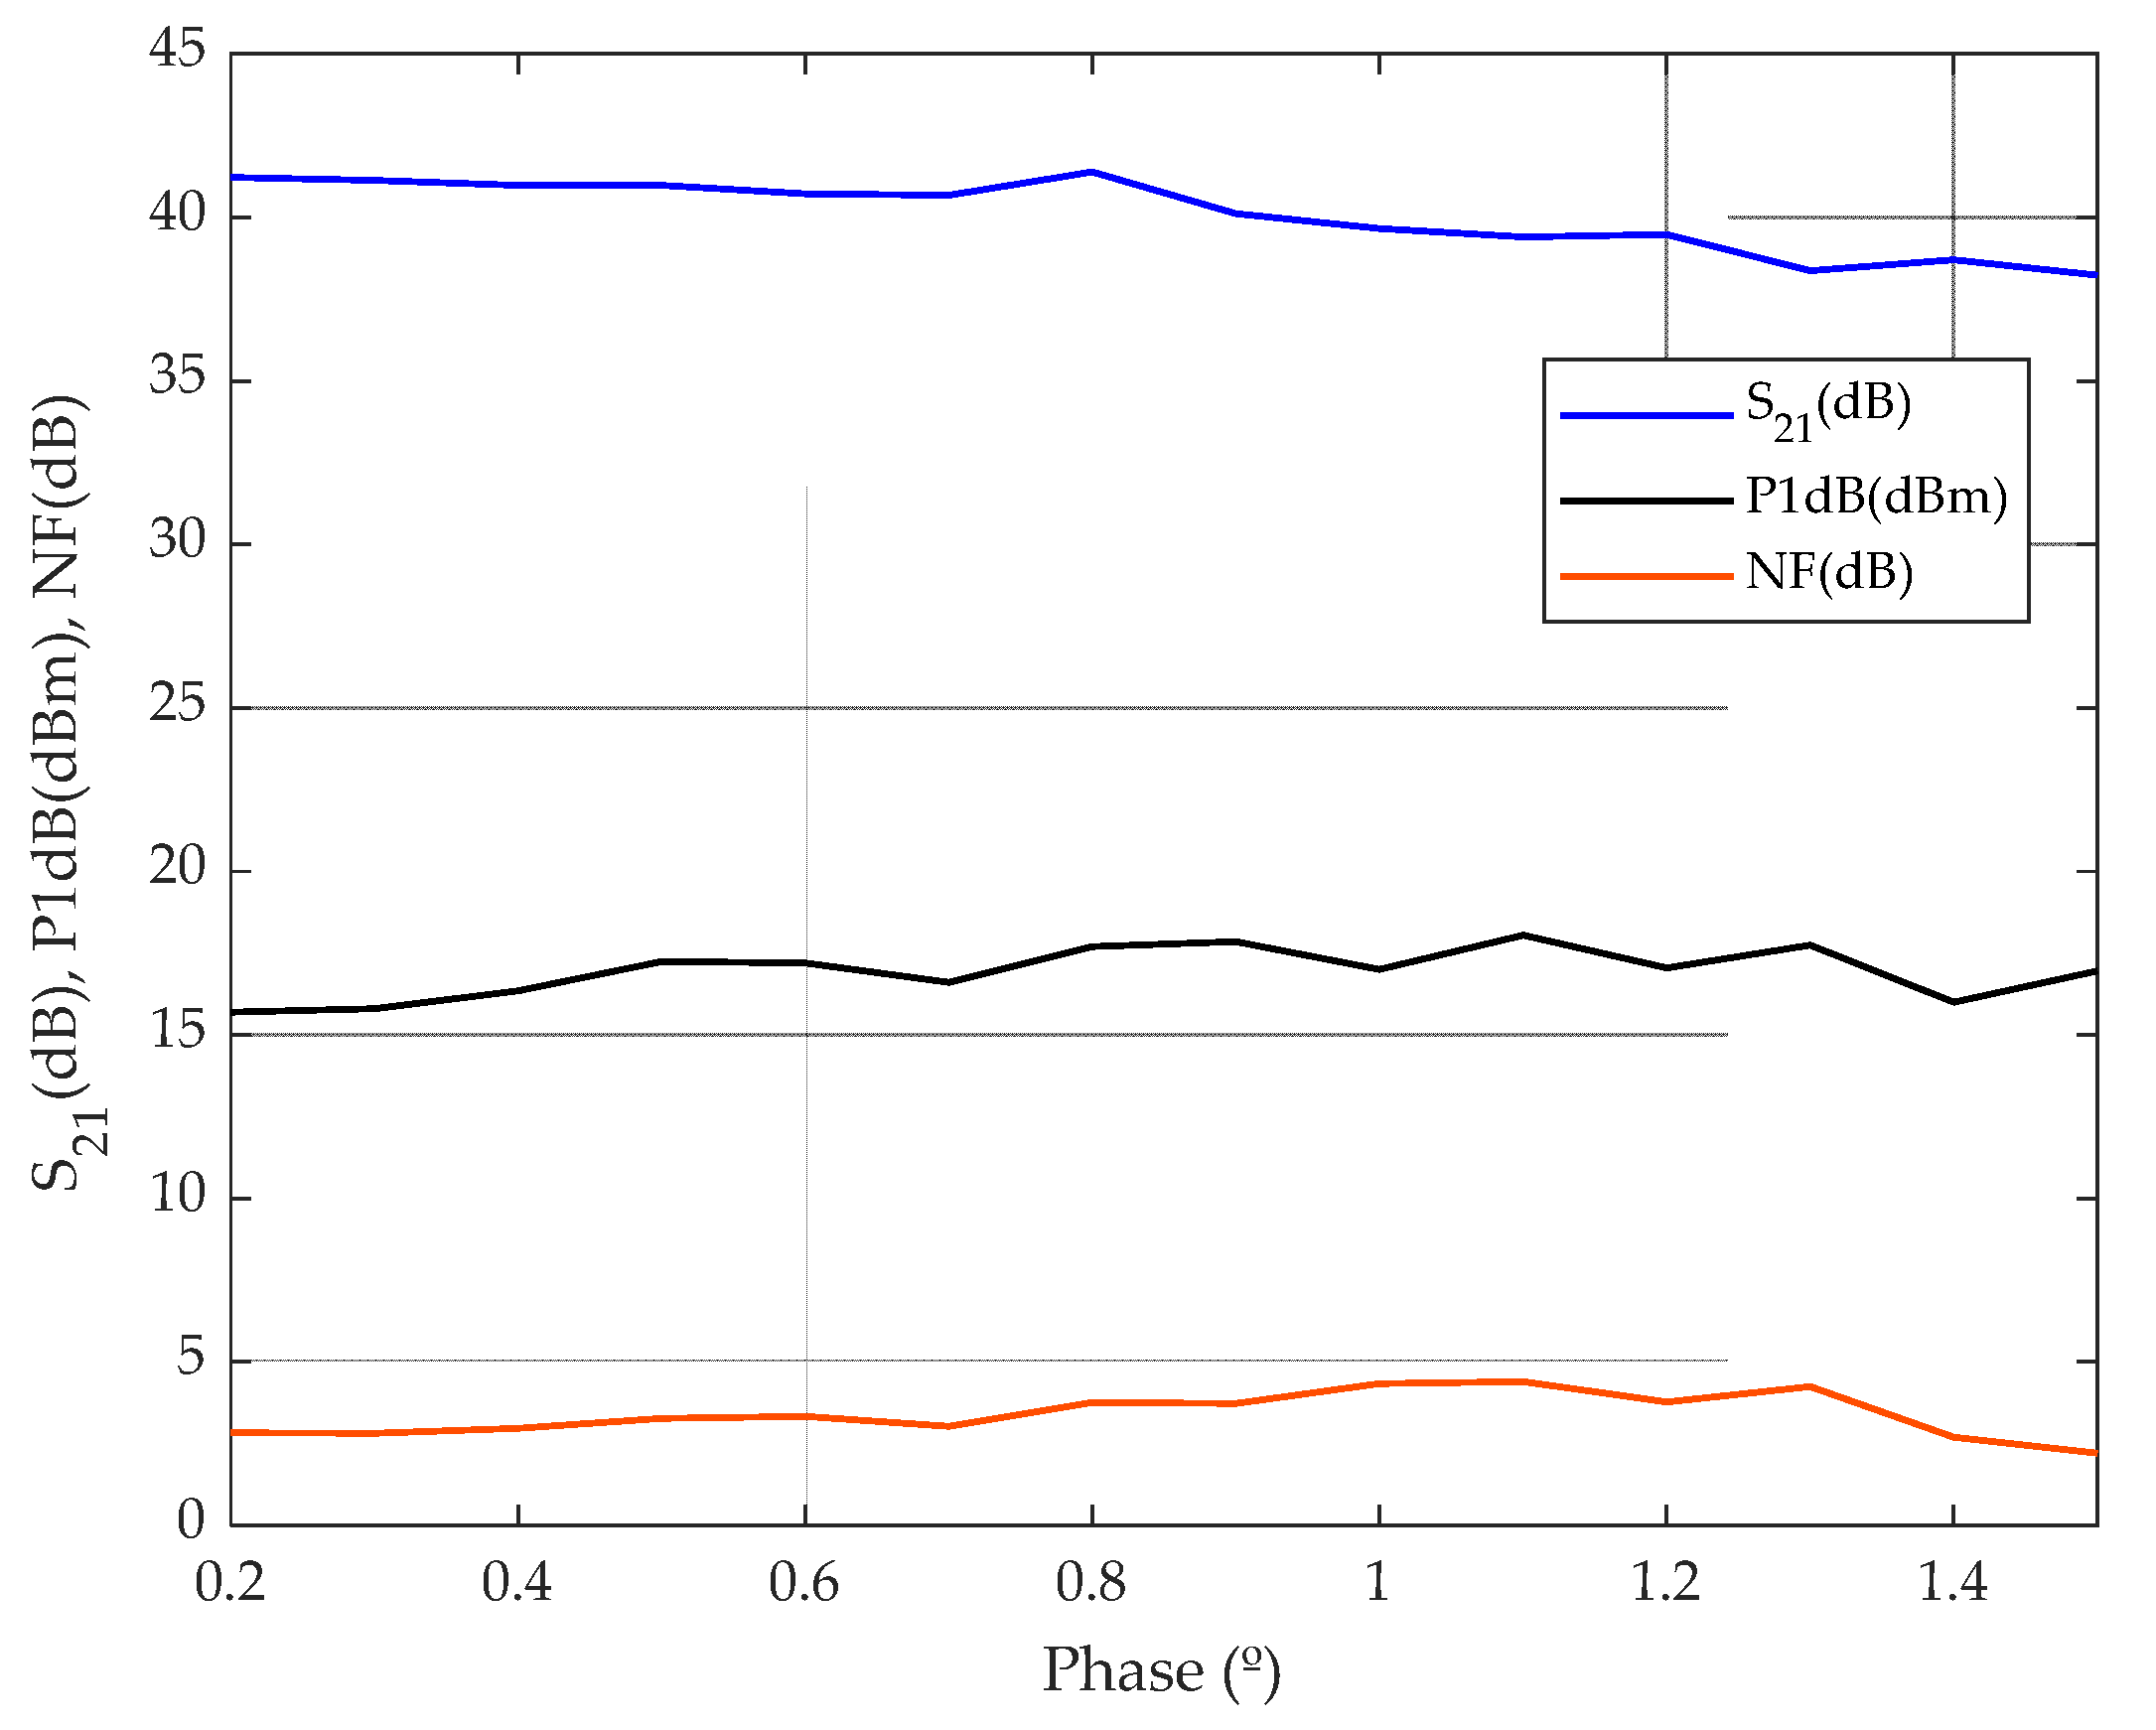
For the measurement of the filter and LNA
parameter, an ENA 5071C vector network analyzer (VNA) was used. For the measurement of the figures of merit, an MXA 9020A model spectrum analyzer was used for the noise figure obtaining, and an EXG N5172B signal generator in addition to the spectrum analyzer to obtain the compression point of 1 dB. The characterization of the signal conditioning circuit are presented in
Figure 4 and
Figure 5.
As shown in
Figure 4, the filter has a coefficient ranging from -1dB to -4 dB in the range between 150 MHz and 1.5 GHz. According to
Figure 5, the LNA has
coefficients ranging from 41 to 37 dB in the evaluated range, in addition to a noise figure (NF) always below 5 dB, which gives it the name LNA. The P1dB above 15 dBm ensures that the output signals have good amplitudes without major harmonic distortions in the amplified signal
.
For the correct analysis of the phenomena, the acquisition and filtering of the signals must be performed.
4. Computational Procedures
4.1. Thresholding Filtering
For each test object, the signals acquired by the electric method and the conditioning system were processed using universal threshold filtering. This filtering was determined as a percentage of the signal peak for each test object before being applied to the database.
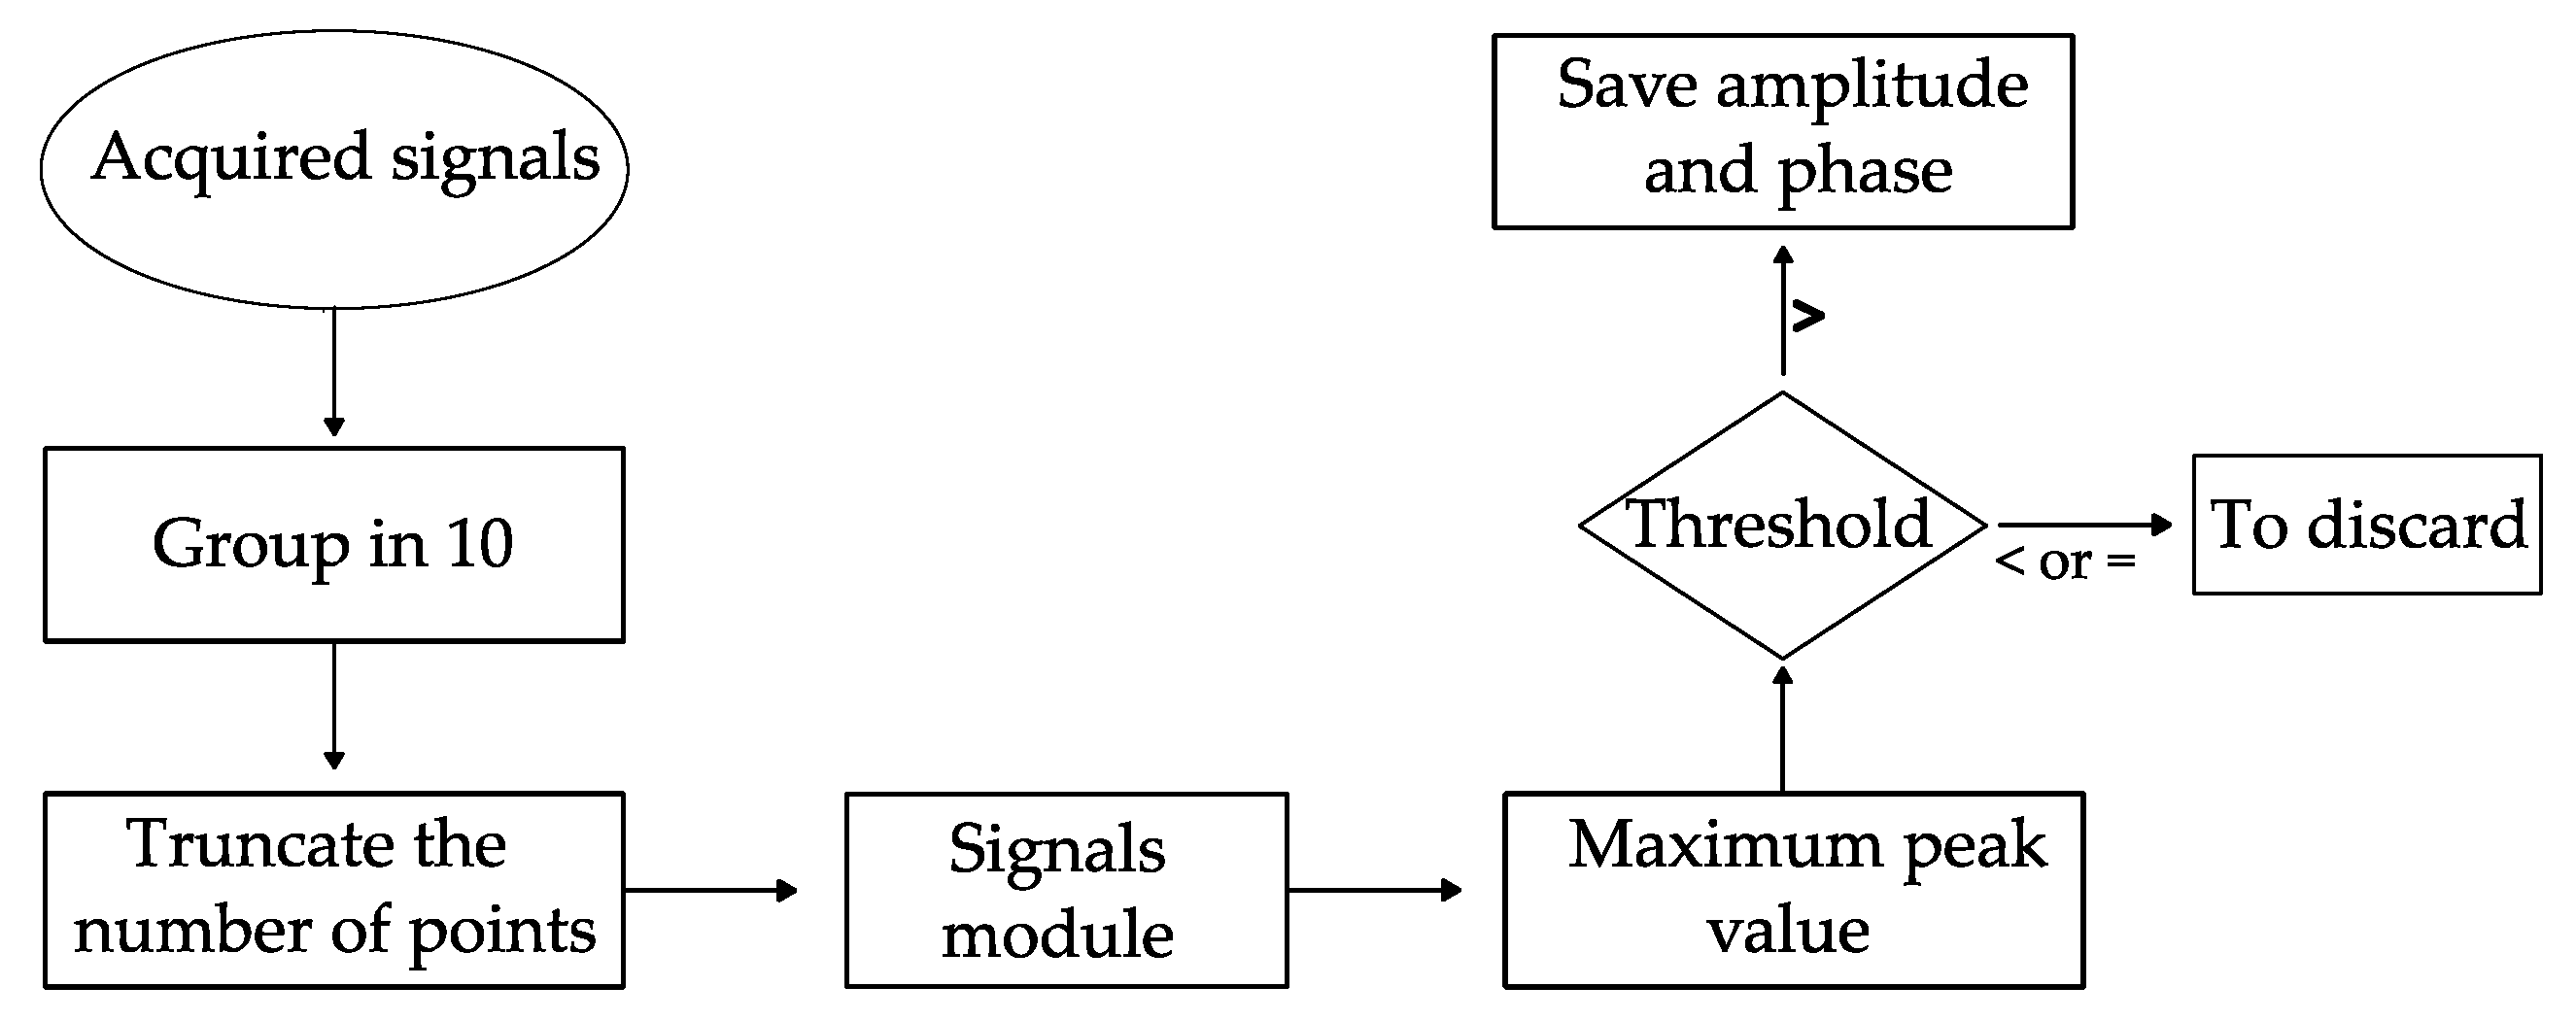
The step-by-step of this filtering consists of truncating the samples into
, separating the acquired signals into groups of ten periods and filtering them together. The maximum peak value of each set is determined from the absolute values of the signals under analysis and then the threshold is applied relative to it. The other signals are compared to the threshold and if they have a lower or equal amplitude they are discarded, if the amplitude is greater, the amplitude and phase pair is stored. It is worth mentioning that each test object has its own threshold that also varies according to the acquisition. The flowchart of this filtering methodology is shown in
Figure 6.
4.2. PRPD Pattern Representation
The final part of the algorithm presented in the previous section is the generation of PRPD patterns, which is performed with all the groupings of 10 acquisition cycles of each test object. The amplitude and phase information of the pulses is known, allowing the pulses to be plotted on the corresponding phase of the reference sinusoidal voltage.
Figure 7 shows the flowchart used to plot each envelope in the form of PRPD from a reference sinusoidal voltage.
After filtering the PD signals, the PRPD patterns are plotted. Next, as a step-in data preparation, feature extraction is carried out.
4.3. Feature Extraction
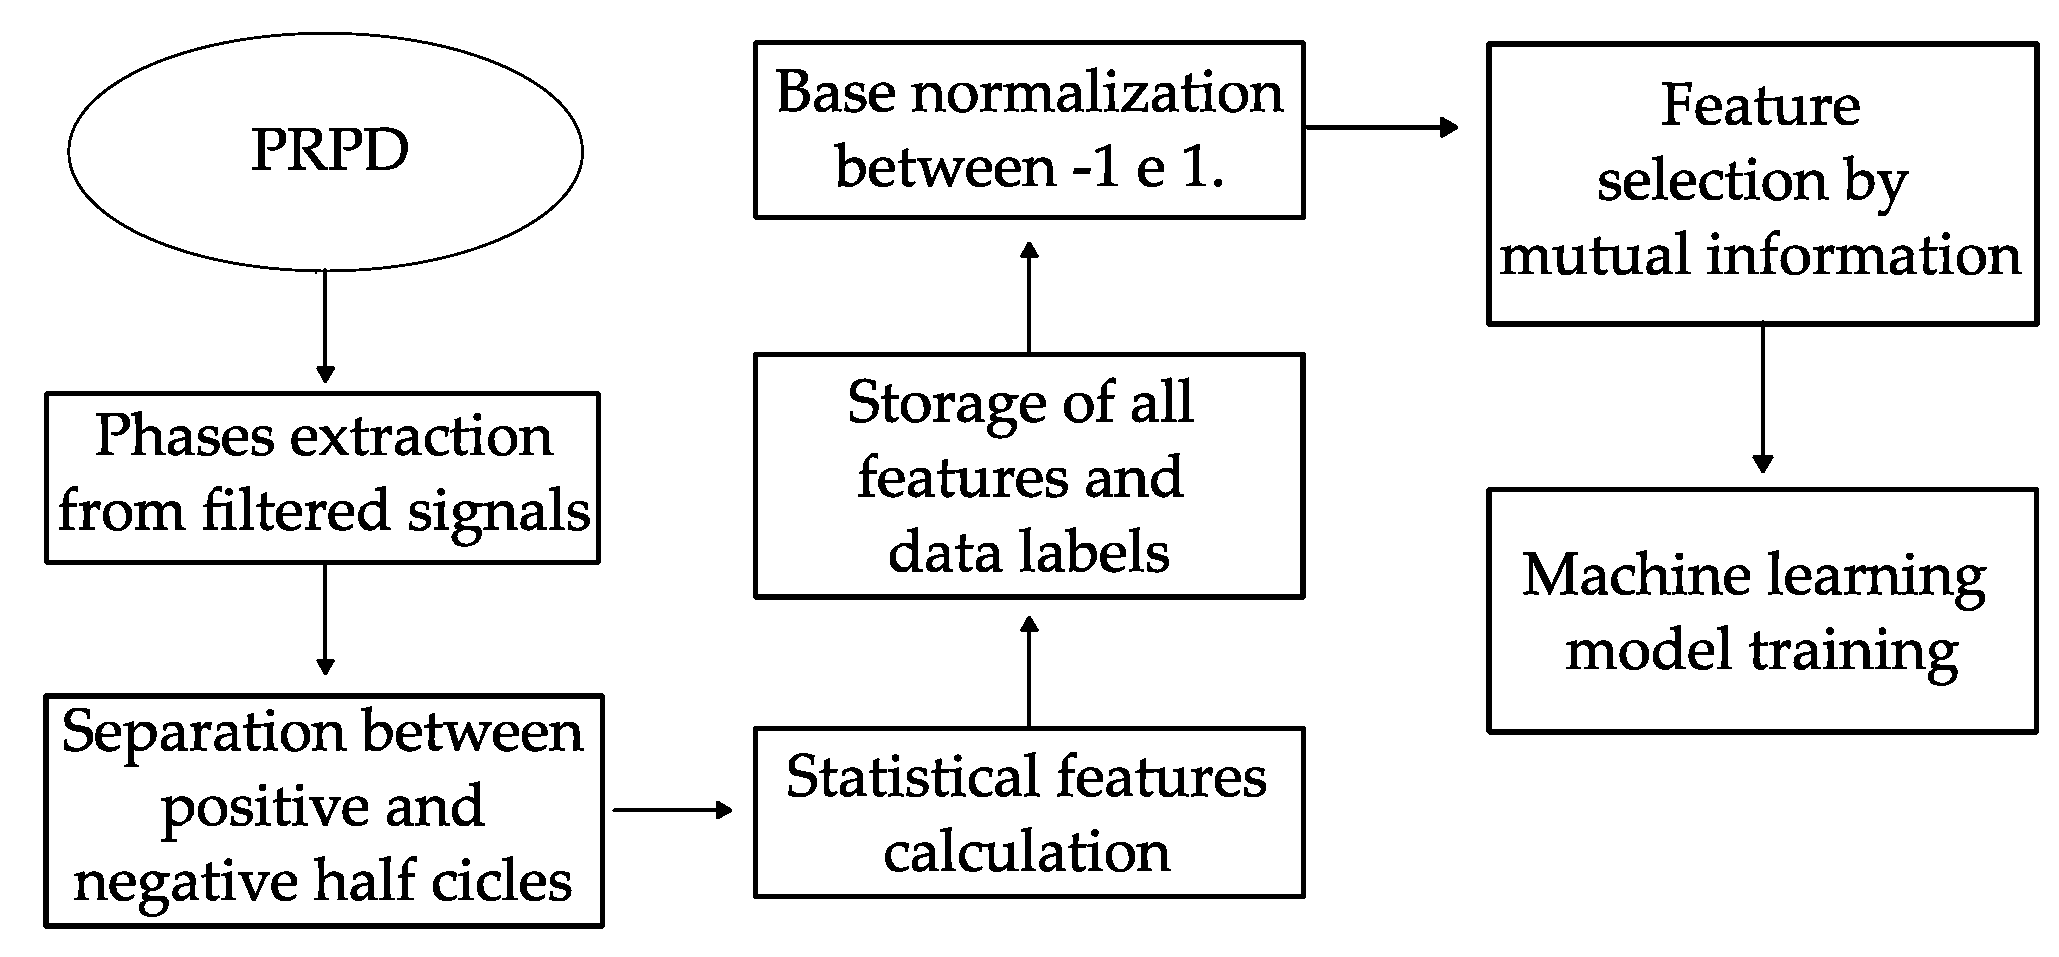
The signals have been acquired and is necessary to extract characteristics to serve as input for the classification methods used. A flowchart summarizing this step is presented in
Figure 8.
Because the number of filtering points is variable in each new PRPD, these points alone cannot be used as classifier input parameters, so a fixed number of attributes are used as input. In all, the extracted attributes are 18.
In the construction of information from large databases, it is necessary to use relationships between data so that particularities that characterize the phenomenon are evidenced. In this section, the statistical attributes that were used in the signal analysis are presented:
Minimum: is the element that represents the smallest value in a dataset;
Maximum: is the element that represents the largest value in a dataset;
Number of elements: is the amount of data in the set to be evaluated;
Mean: given by the arithmetic mean of the elements belonging to the data set;
First quartile: is the value of the data set that delimits the 25% lowest values;
Second quartile: also called median, it is the value of the data set that separates the 50% smallest from the 50% highest values;
Third quartile: is the value of the dataset that delimits the 25% largest values;
Asymmetry: is the statistical parameter that measures the degree of deviation of the symmetry of a data set from the normal distribution;
Kurtosis: A parameter that measures the degree of flattening of the distribution of a set in relation to the normal distribution.
In addition to the extraction, the choice of the best attributes was made from the SelectKBest algorithm of the scikit-learn library of the Python language, which considers the mutual information between the attributes and classifies them from the most to the least relevant according to the technique. It is worth noting that, due to the variation of ambient noise and measurement saturations, not all PRPDs are valid to serve as an example for training and testing classification models. An unbalanced database between objects is expected, with a greater number of samples available for those with the best signal-to-noise ratio. The use of classifiers for sources of partial discharges is presented in the following section.
4.4. Classification Using Machine Learning Algorithms
The extracted features serve as input to the machine learning algorithms. That is, each PRPD to be used as data for classification is transformed into the domain of its features. The step-by-step process of using the classifiers is presented in
Figure 9.
First, the machine learning algorithm should be defined as Multilayer Perceptron (MLP), Support Vector Machine (SVM), or Decision Tree (DTC). The MLP network was used because it is a well-established standard classifier. The SVM and DTC were chosen due to the ability of these classifiers to work with unbalanced databases, which is the case of this work. The number of features to be used from each of the PRPDs in the training and testing of the model is defined according to the methodology aforementioned, ranging from 1 to 18 statistical features. Next, the database is divided between 70% for training and 30% for testing.
For the MLP network, the topology used was a single hidden layer with 12 neurons. The number of input neurons in the network ranged from 1 to 18, tracking the number of features and the number of output neurons is fixed at 5, each one representing one of the test objects evaluated. The optimization algorithm used was L-BFGS. Additionally, the activation function used was relu, to improve the non-linearity of classifier [
29], with a maximum number of epochs set at 2000 to complete the training of the model.
For the SVM classifier the kernel function used was the radial basis function, or Gaussian kernel [
30]. The input layer for this classifier was set ranging from 1 to 18 and the output was set to 5.
For DTC, the criterion was set as gini, with the splitter set in best, without the number of max leaf nodes, as the default mode of the Python
Scikit-Learning library, as in [
31]. The number of inputs still was ranged from 1 to 18 features, tracking the number of features. The outputs possible to this classifier were set in 5.
In summary, two PRPD will be evaluated for the classification of partial discharges, namely: UHF signals conditioned by envelope detection and amplification stage and acquired by electric method. Both were filtered by universal threshold. This results in a combination of 108 total scenarios, 2 acquisition methods, 1 filtering method, 18 features, and 3 classifiers. The classifier’s performance was evaluated by the average accuracy of the model in 10 executions for each scenario evaluated.
5. Results
5.1. Signal Conditioning System
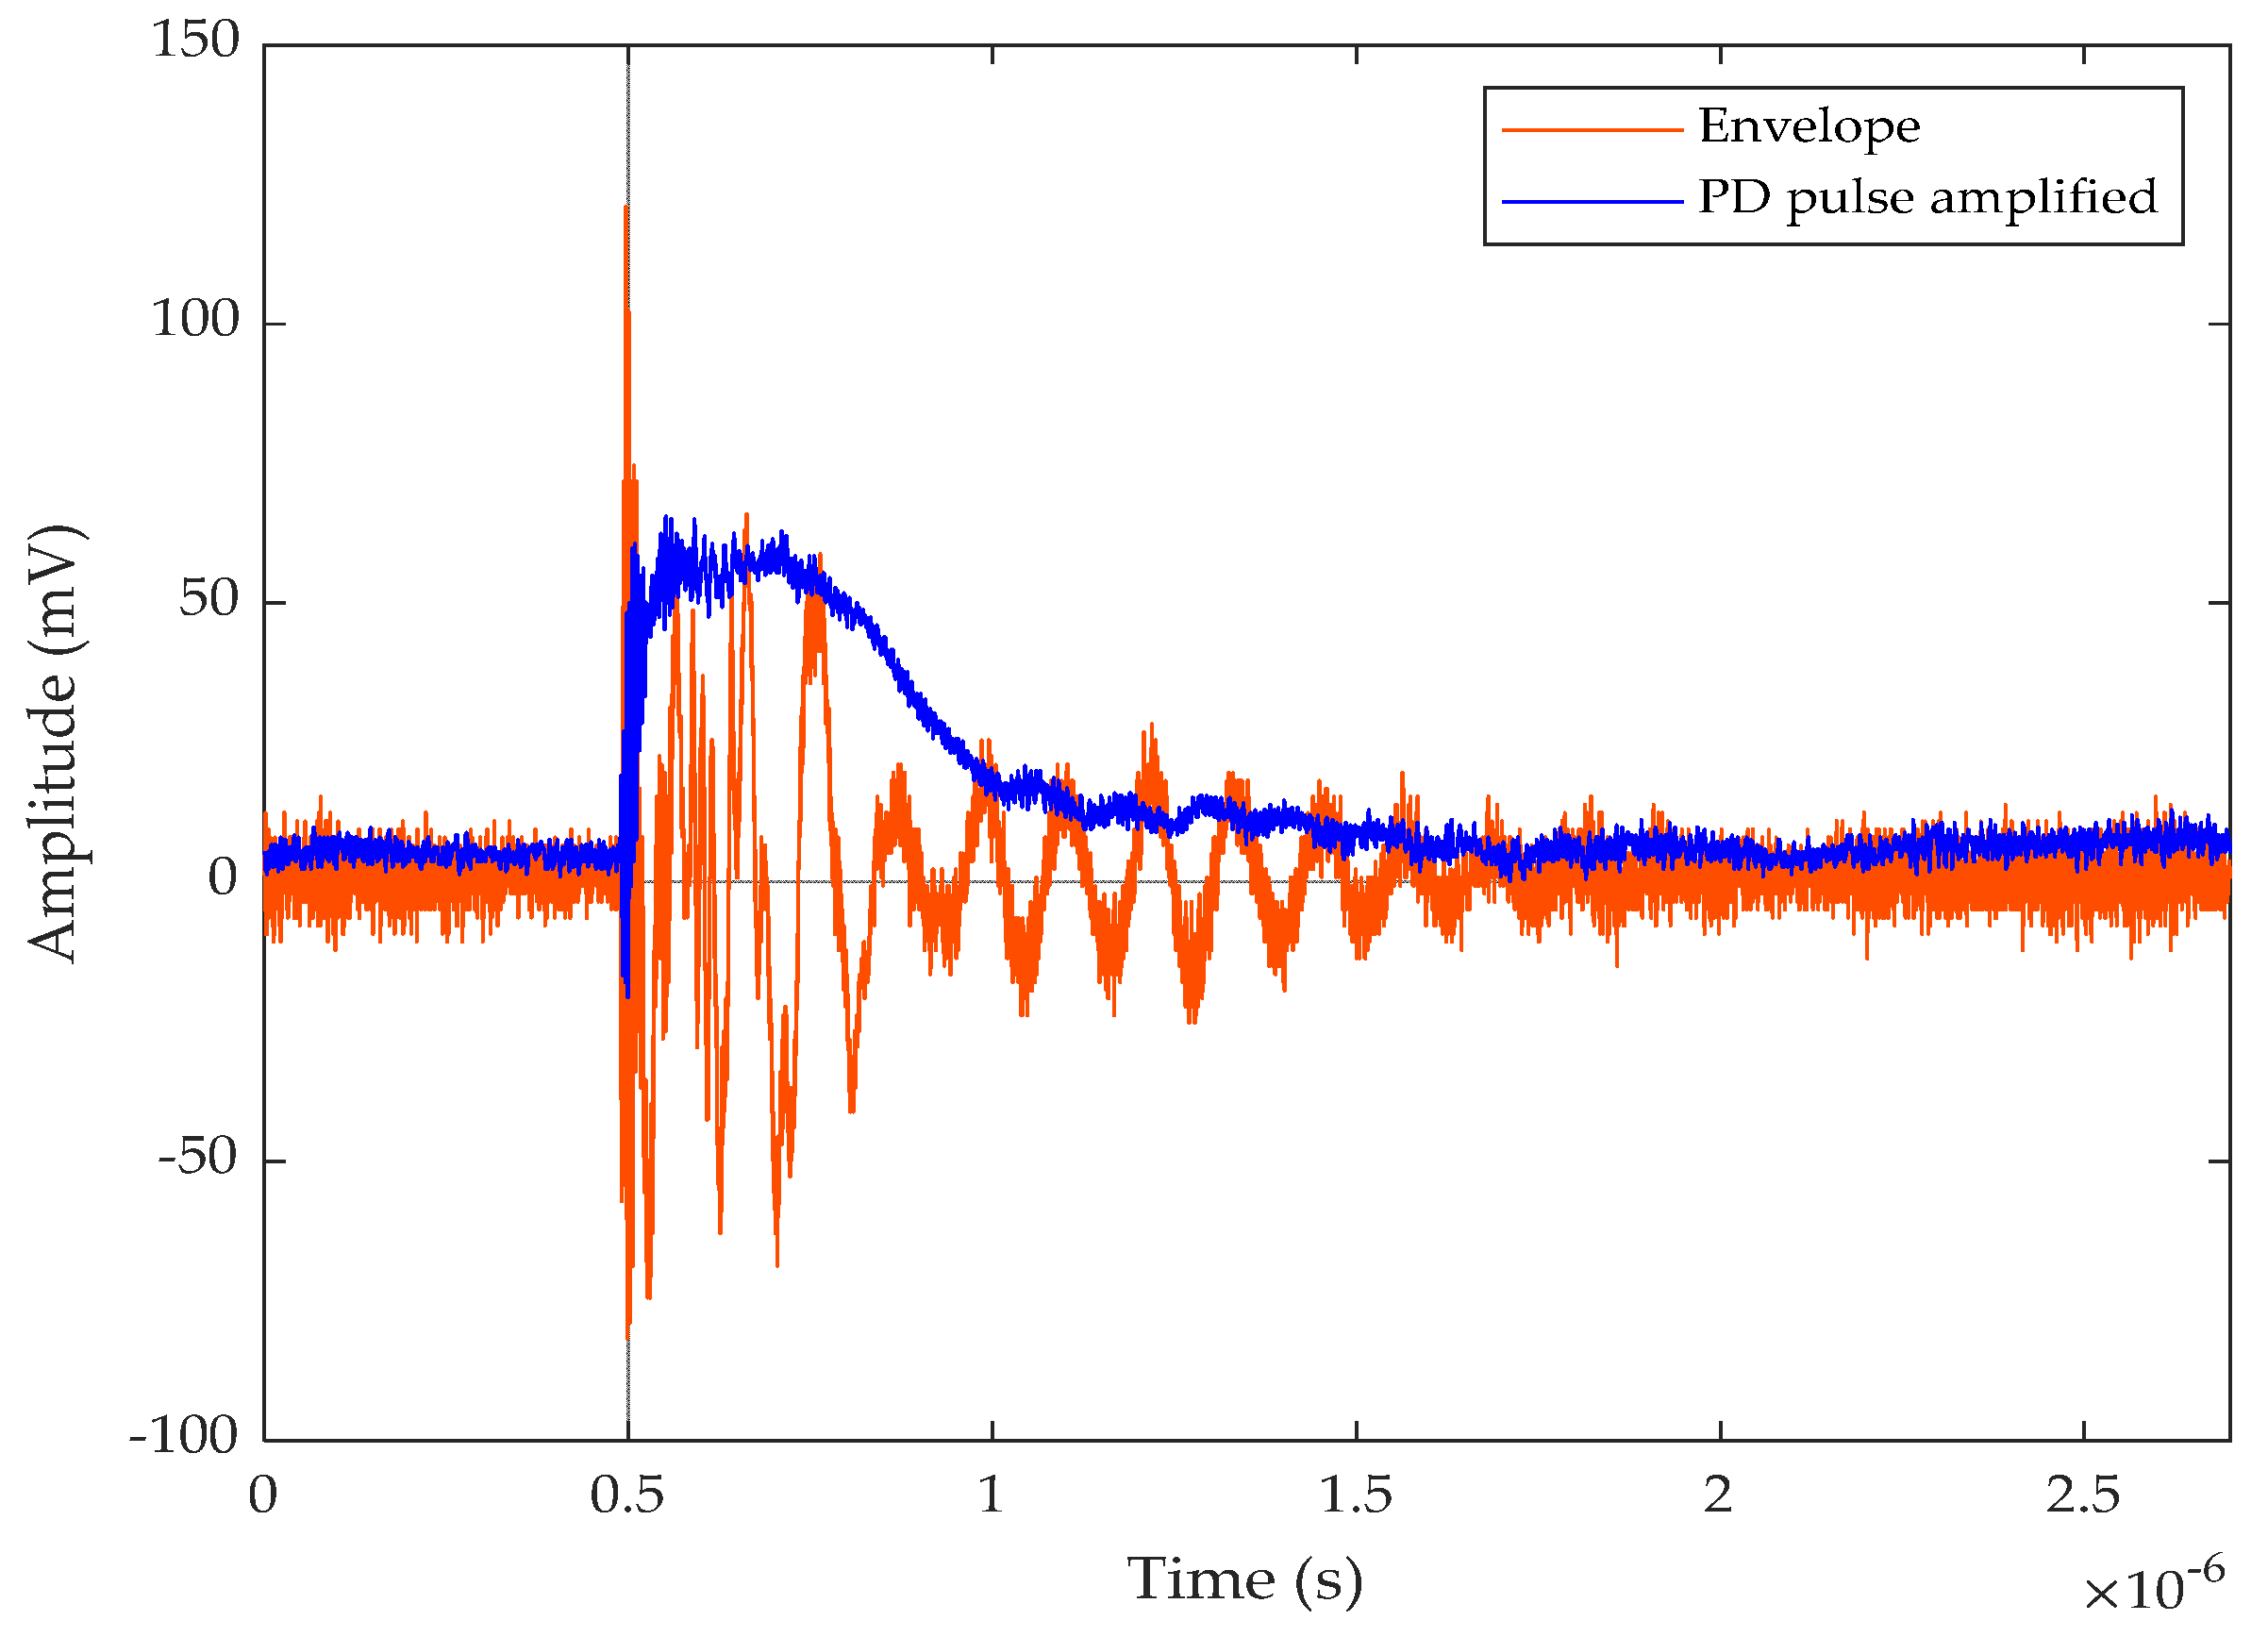
Figure 10 shows a radiometric pulse of amplified PD obtained from the PT and its respective envelope in the time domain. The
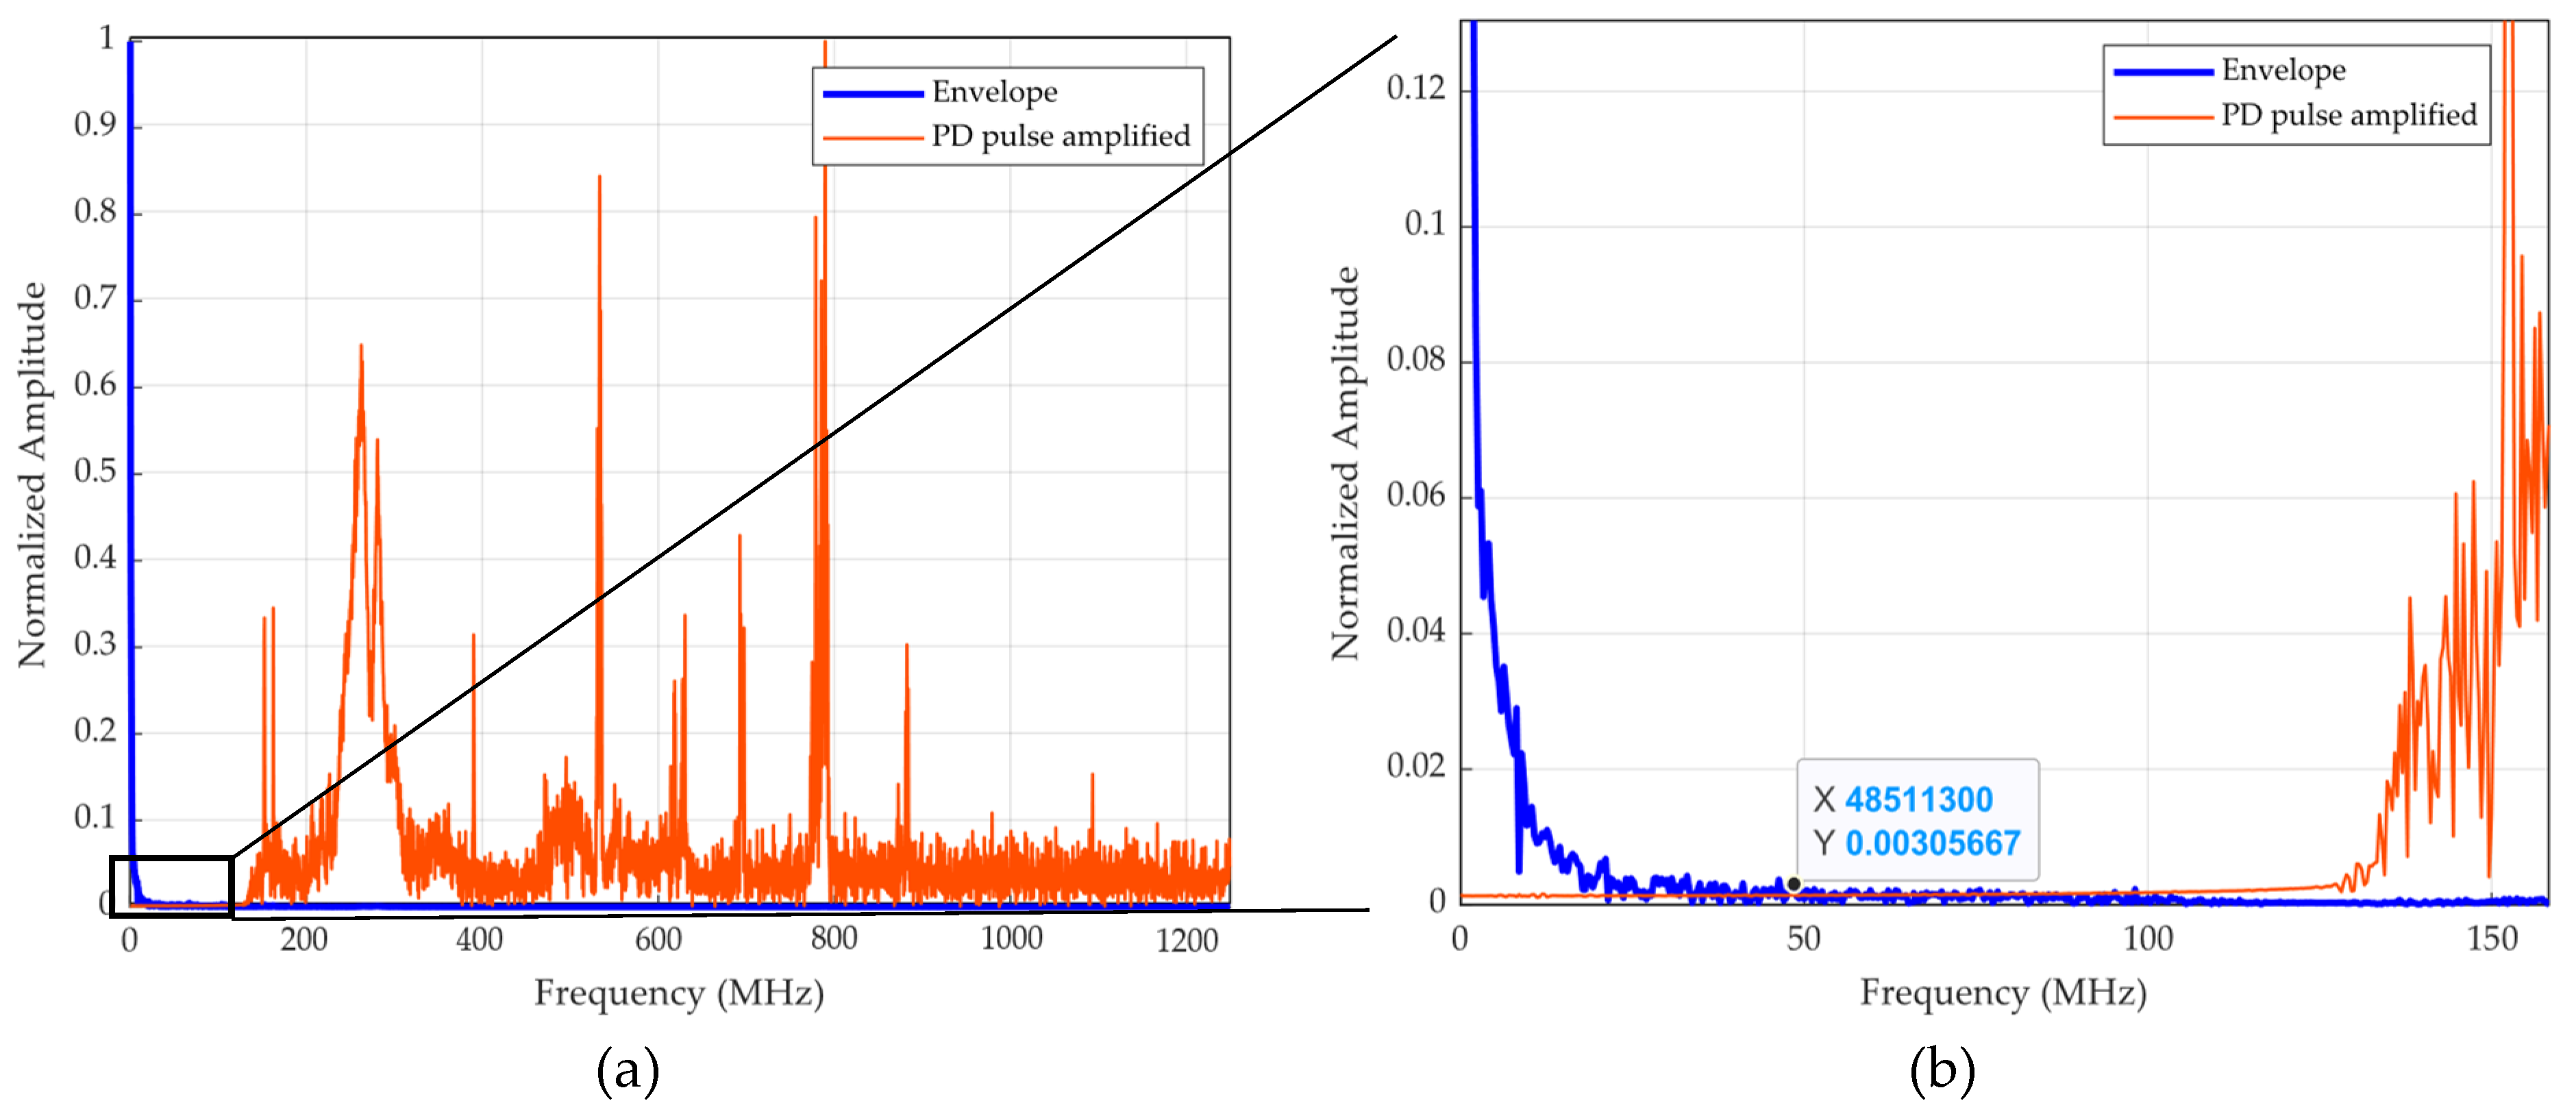
Figure 11 presents the conditioning system’s responses in frequency domain.
From the curves shown in
Figure 5, it can be seen in
Figure 11 that the partial discharge pulse has important components up to 900 MHz, while the envelope has a strong DC component and has the amplitude of the spectrum dropping. However, it turns out that the most energetic components are up to 50 MHz.
Therefore, there is a reduction of the order of 18 times of the frequency components and consequently of the hardware requirements for signal acquisition.
The signals acquired by the two techniques are compared in the common unit between the two, which is volt, or millivolt. However, all acquisitions were made after checking the background noise, which was always kept below 15 pC according to IEC 60270 method. The discharge levels captured for each test object are shown in
Table 1.
5.2. Threshold Filtering Algorithm
The signals acquired by the two methods are displayed, along with the universal threshold filtering algorithm.
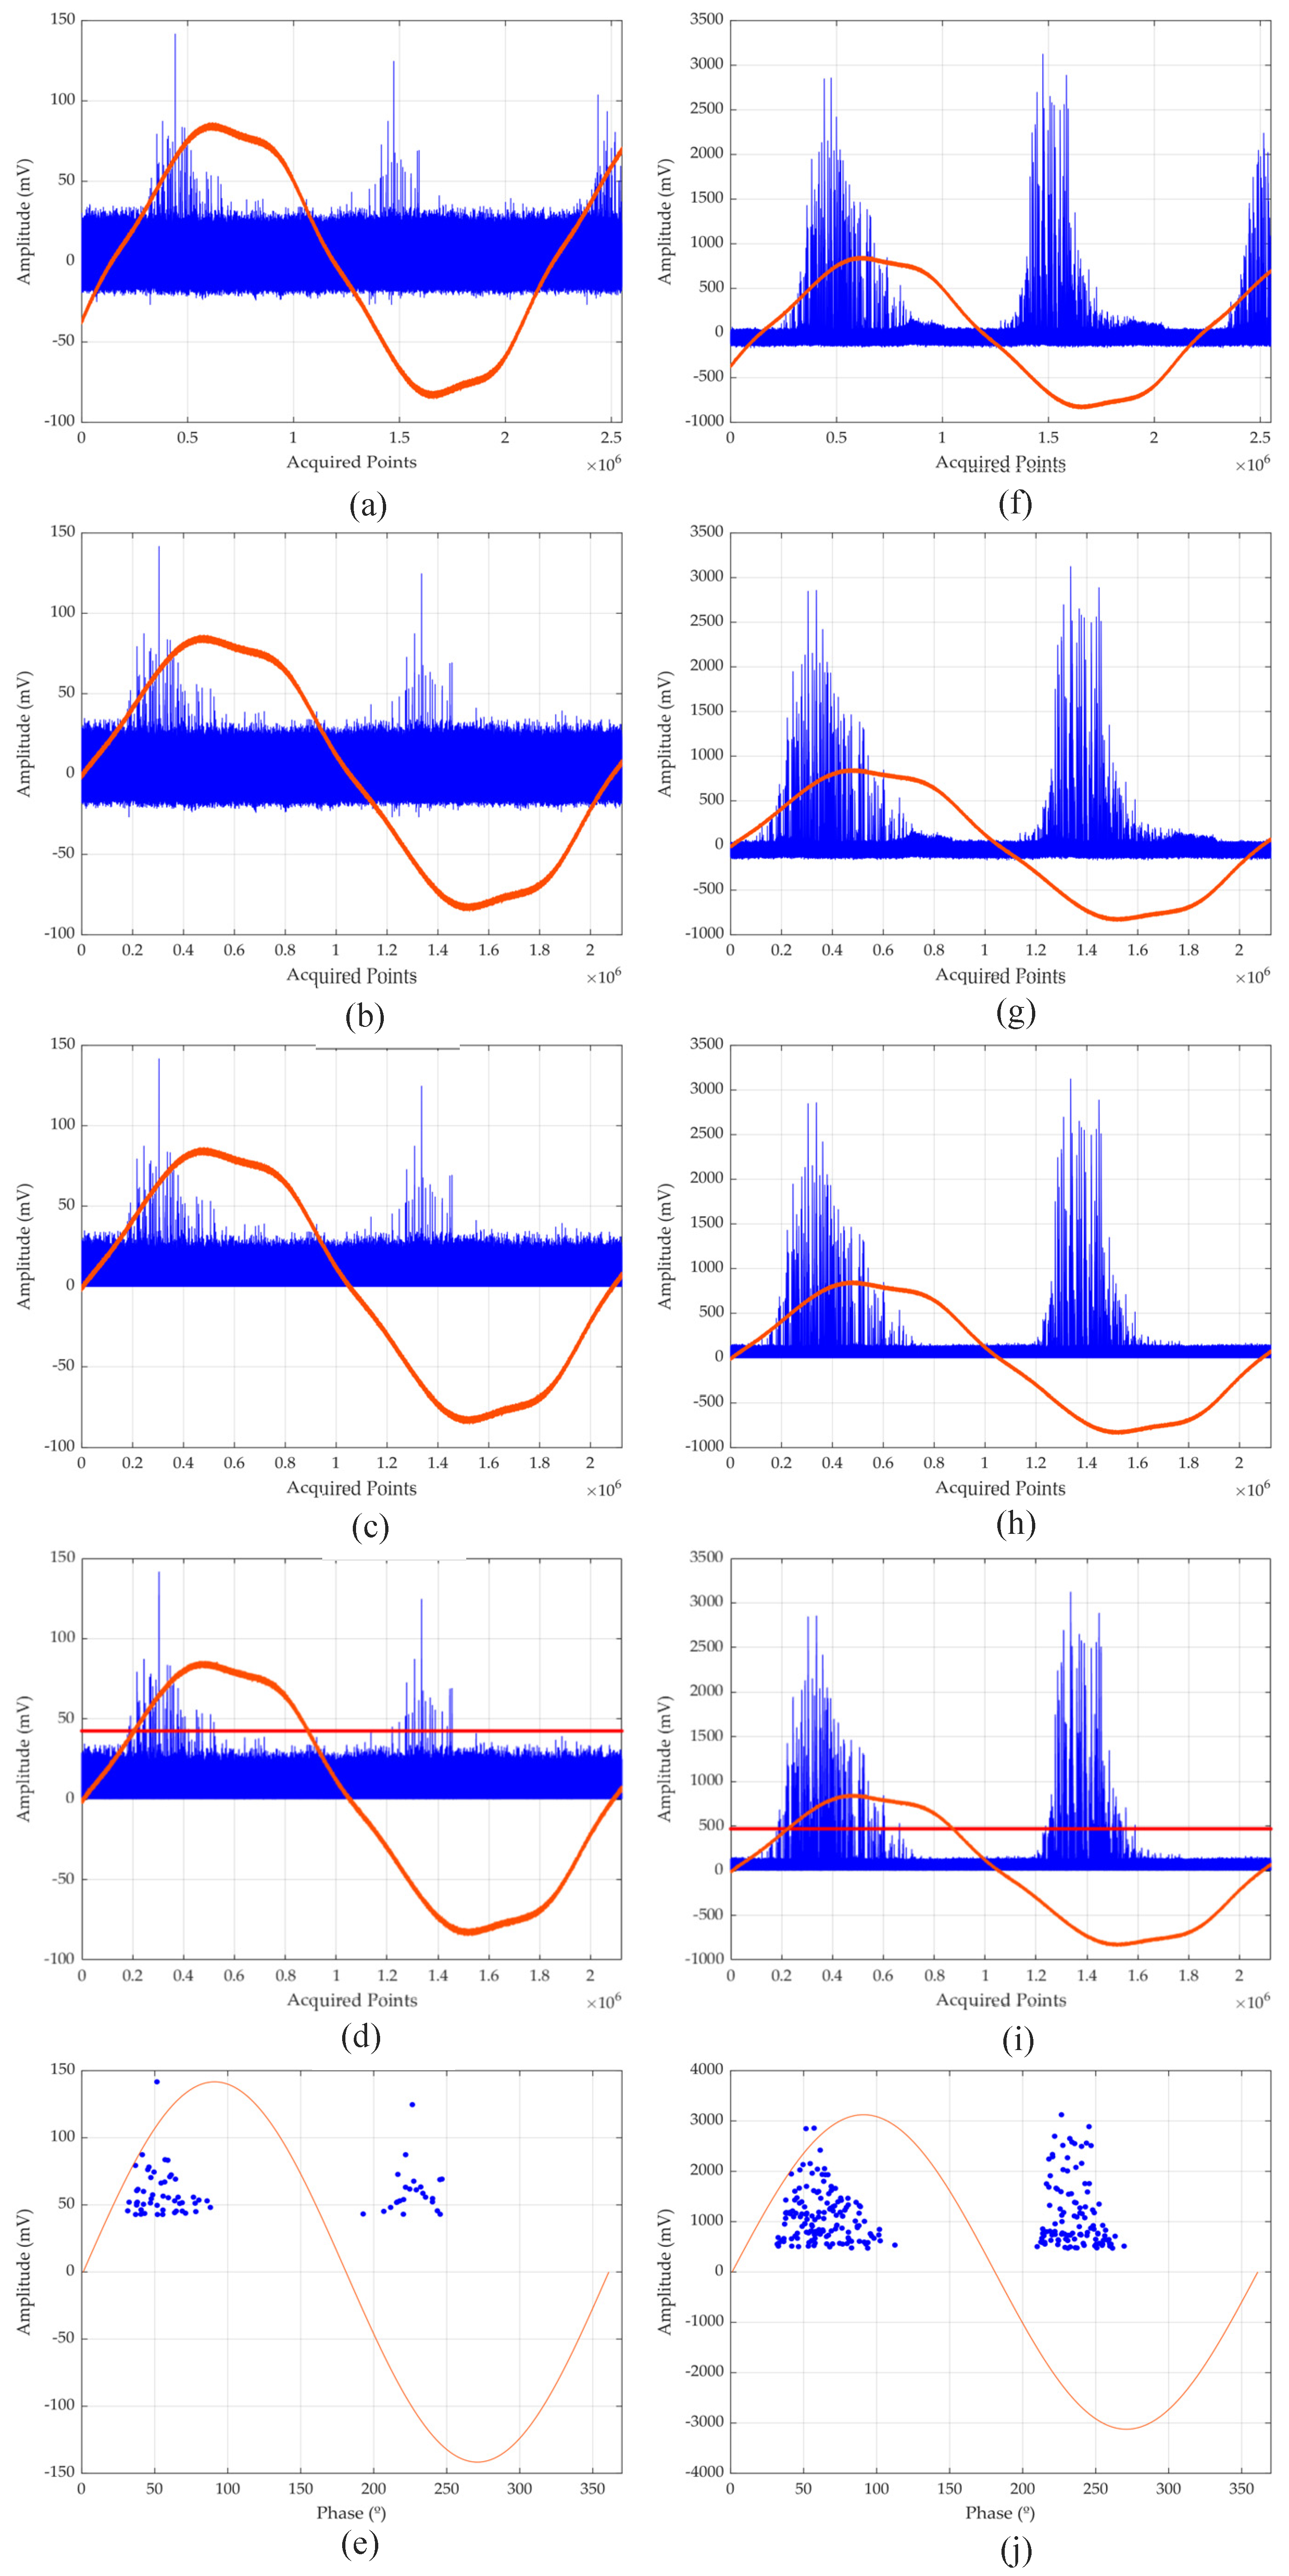
Figure 12 shows the whole process, from the acquisition to the generation of PRPD standards for dielectric disk 1. The sequence of figures on the left corresponds to the data acquired with the partial discharge signal conditioning system, while those on the right column correspond to the data obtained with the measurement standardized by IEC 60270.
In
Figure 12, figures (a) and (f) represent the signal of 10 acquisitions acquired by the oscilloscope. The first step of filtering consists of truncating these signals over a sinusoidal period to analyze only the equivalent of one power cycle, or 16.66 ms for 60 Hz. This step is presented in (b) and (g). In the next step, (c) and (h), the absolute values of the acquisition under analysis are calculated and represented. In (d) and (i) the thresholds calculated for each set of 10 acquisitions are presented, these thresholds are percentages of the highest peak value recorded. For the conditioned signals of the dielectric disk, the threshold of 30% was used and for those acquired with IEC 60270 method, the threshold was fixed at 15% for all objects under test. The difference between the amplitudes and threshold levels of the signals is due to the measurement principles. The electrical method has an electrical connection with the partial discharge generation system, which ensures greater sensitivity and signals with greater amplitudes and more prominent peaks. However, the radiometric method has losses associated with the propagation of waves in the air from the device under test to the UHF sensor. Finally, in (e) and (j) the PRPD patterns are represented after filtering the signals. Each dot represents the maximum peak of each envelope acquired.
Not all acquired signals are used to generate valid PRPD standards, since there were acquisitions that did not acquire discharges above the noise level. A comparison between the number of valid patterns for each test object is presented in
Table 2.
Each filtered PRPD was formed by 10 acquisitions, so 250 measurements made up of 10 acquisitions each would form 250 valid PRPD, if all measurements triggered the proposed threshold. For the data obtained with the electric method, 92.62% of the database was valid for the generation of PRPD standards, with 1162 standards. The acquisition with conditioning system presented 90.72% of the valid base. Comparing
Table 1 and
Table 2, it is observed that test objects that present higher PD activity (hydrogenerator bar and PT) had all the patterns valid for the attribute extraction and classification since higher PD activity are less likeable to mix with the background noise, always resulting in a successful filtering and pulse extraction process. For the test objects with lower PD activity (discs and oil discharges) the number of usable patterns is reduced when compared to TP and bar since the lower PD activity are more likeable to mix with the background noise. Through the application of the universal threshold technique, it is possible to avoid false positives, i.e., avoid confusing background noise with PD activity, ensuring robustness to the proposed methodology.
5.3. Features Extraction
For the PRPD patterns generated, the differentiation between the objects under test can be better observed in the tables containing the features of the pulse peak distributions in the phase, as illustrated in
Table 3 and
Table 4. The + and – symbols used refer to the respective positive and negative semicycles.
Table 3 refers to the 1134 valid PRPD patterns of the signals acquired with the conditioning system, while
Table 4 refers to the 1162 valid standards of the acquisition with the IEC.
Differences between the signals depending on the acquisition technique are observed as information regarding the quartiles between the phases of the pulses. However, in
Table 3 and
Table 4 there are shading zones between the test objects. Due to this difficulty of visual separation, machine learning techniques were used to perform the separations between the different sources of partial discharges. For the correct classification, ML models must be given the best features.
For the conditioned UHF data, it is verified that there are greater interquartile distances between the phases of the pulses when compared to the IEC signals.
Machine learning algorithms cannot receive PRPD without proper disposition of the features associated with the phenomenon. The features that were used as inputs to the machine learning models were statistical and referred only to the phase of the PD pulse peaks. In addition, the data used have been normalized.
Moreover, to obtain the best classification for the two databases resulting from the combinations between acquisition and filtering methods, the features were selected by the mutual information algorithm of the
Scikit-Learning library. The summary and sequential ordering of the best features for each database are presented in
Table 5.
From
Table 5, it is verified that, regardless the acquisition technique, the seven most important features are those presented in the negative semi-cycle of the PRPD patterns. Therefore, features such as maximum, third quartile, mean, median, minimum, second quartile, and number of pulses of the negative semicycle have potential for representativeness and separability between the various patterns. On the other hand, the features referring to data distributions, such as skewness and kurtosis of both semicycles, were the least representative.
The classification algorithms were trained with the best normalized features, with the number of input features ranging from 1 to 18. The features were added in the order presented in
Table 5.
5.4. Classification Using Machine Learning
The machine learning models were trained with 70% of the database and the test was performed with 30%. Both sets were randomly select and mutually self-exclusive. The classifiers used are presented in terms of accuracy for the test database in
Table 6.
Analyzing the data presented in
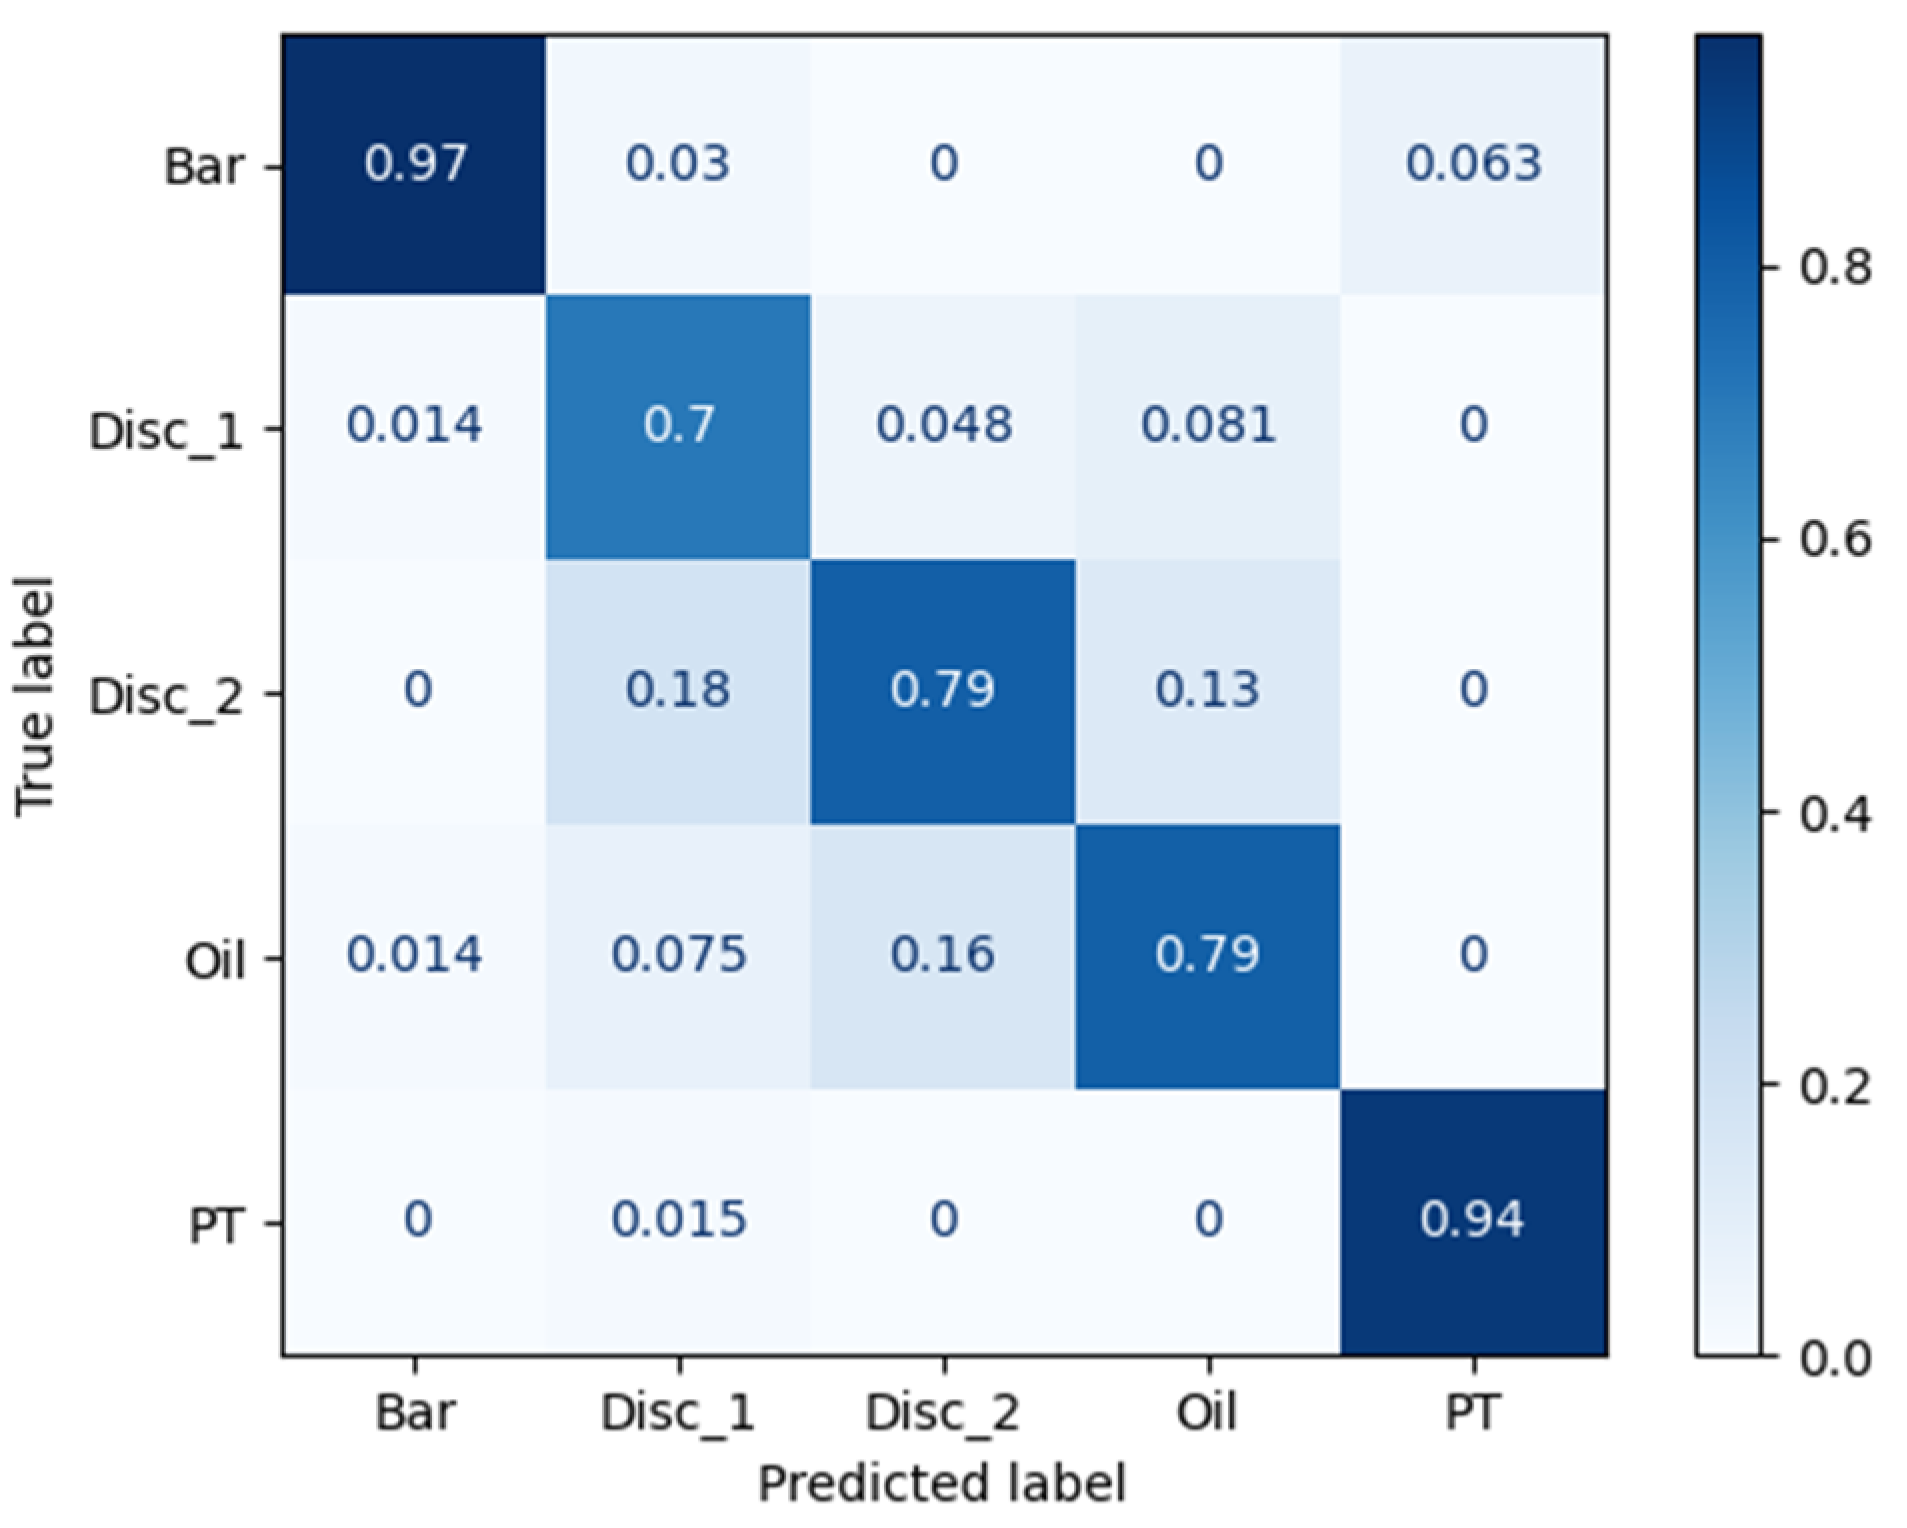
Table 6, it can be concluded that the best accuracies were obtained when applying MLP. For the case of conditioned signals, the best accuracy for the test base was 84.5% for 14 features, whose confusion matrix is shown in
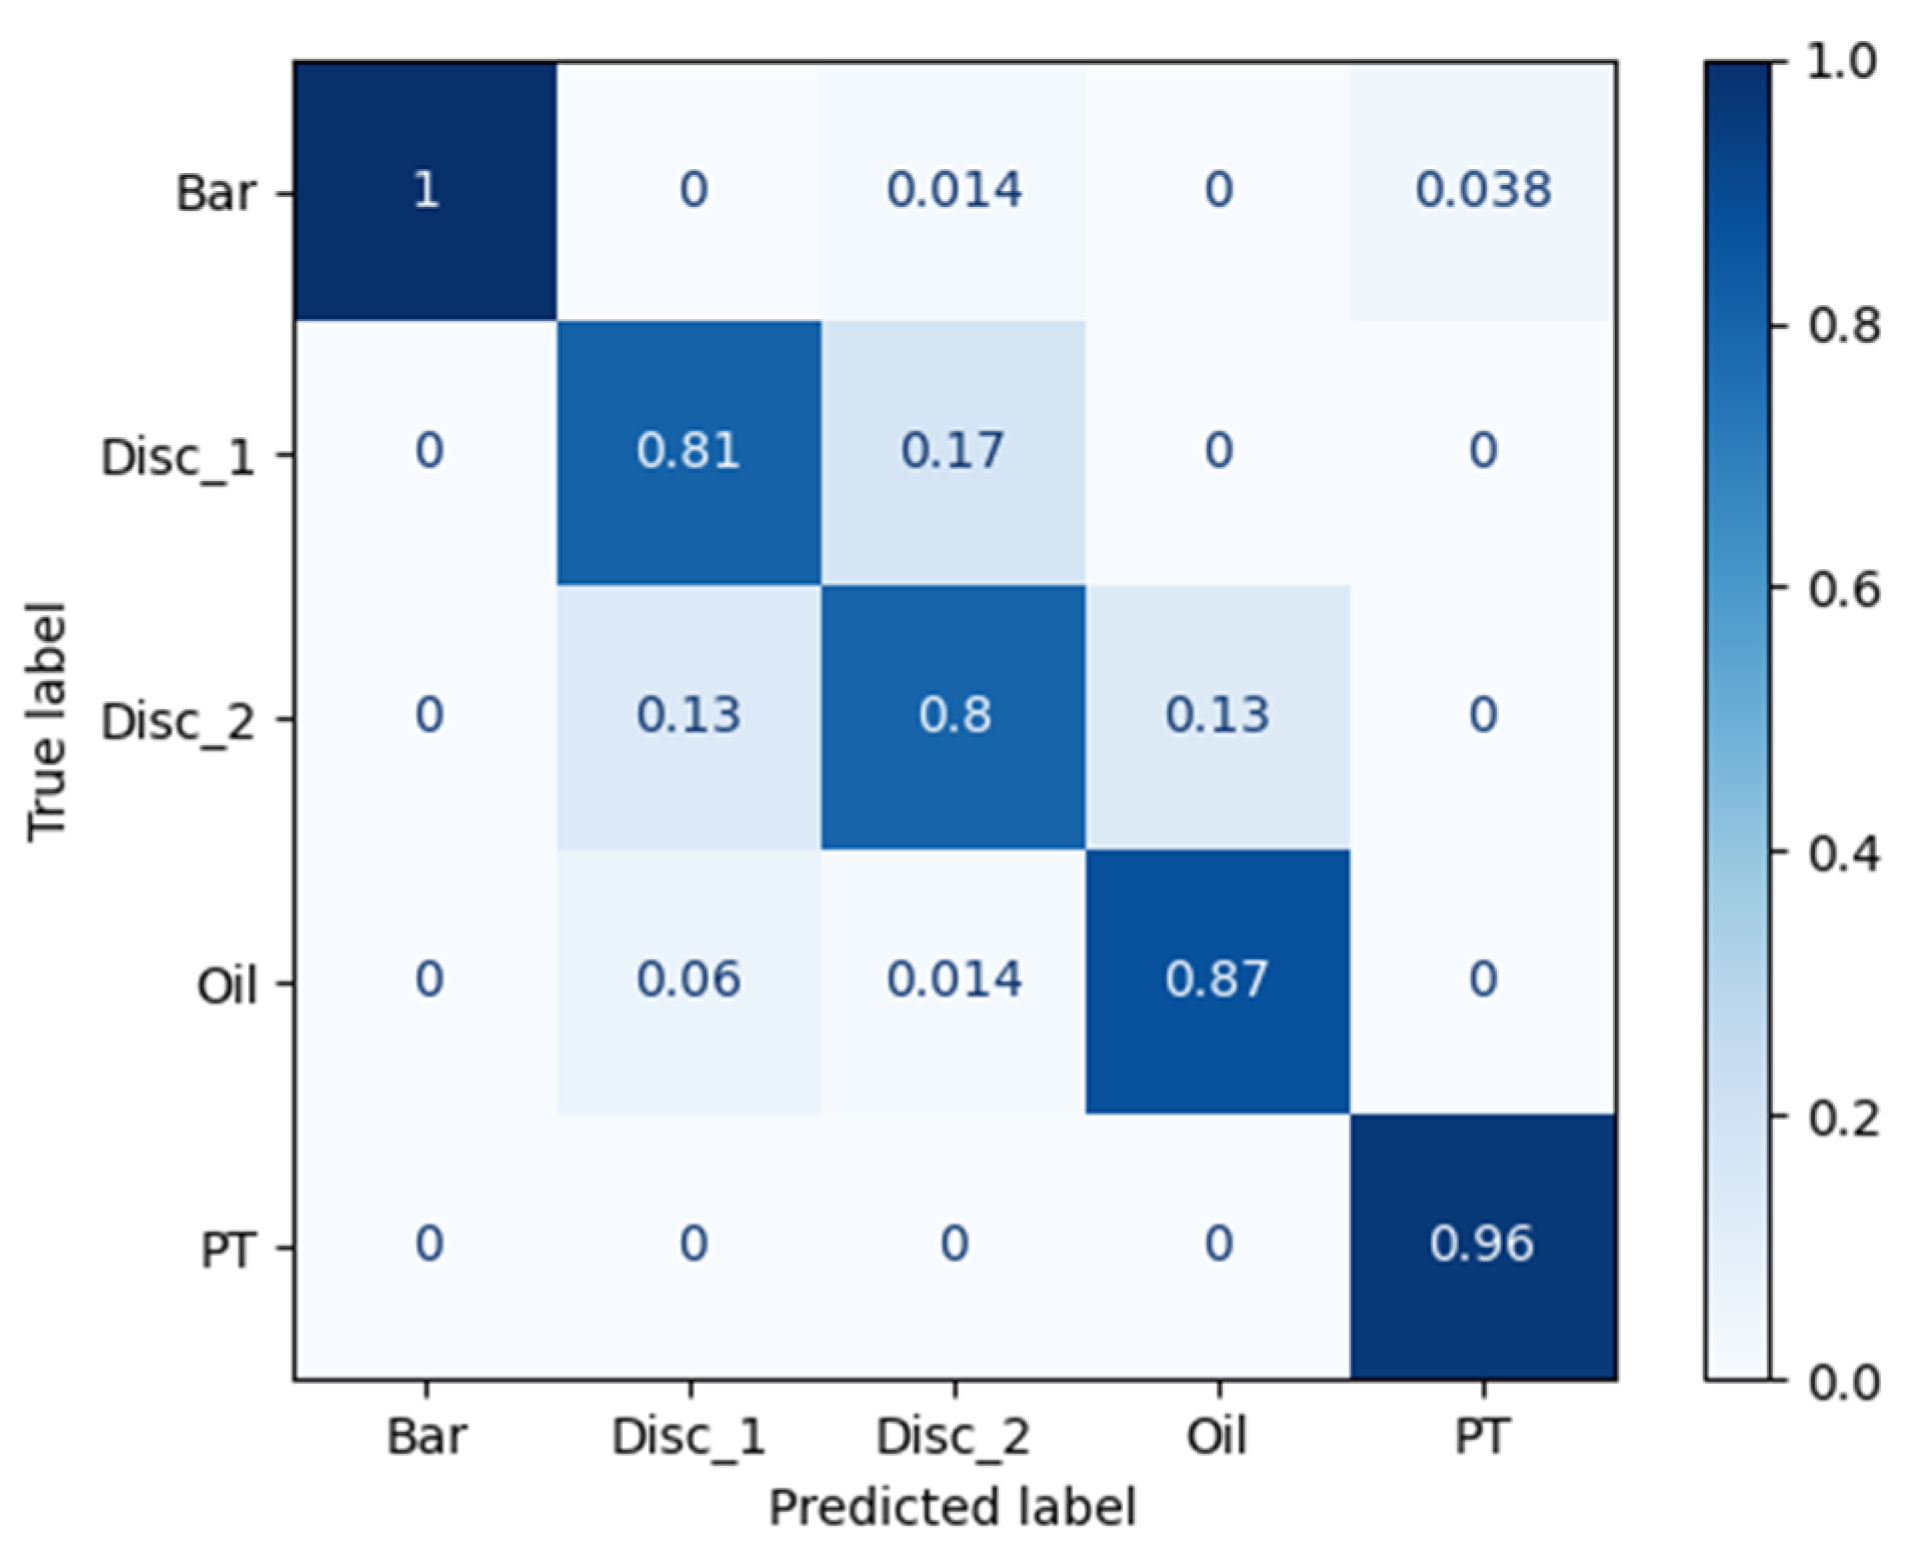
Figure 13. As for the data obtained with the IEC circuit, the best accuracy was 91.1% and obtained for MLP with 12 features, whose confusion matrix is shown in
Figure 14. The results by classification method are followed by the decision tree, with 83.6% and 90% for conditioned and electric methods, respectively, and by the SVM, with 71.2% and 74.5%, also for conditioned and electric methods, respectively.
In
Figure 13, higher accuracy rates were obtained in the classification of the hydrogenerator bar and the potential transformer, with 97% and 94%, respectively. The greatest difficulty that the model encountered was to perform the separation between discs 1 and 2 and the oil discharge, obtaining accuracies from 70% for these objects (70% disc 1, and 79% for disc 2 and oil discharge). The difficulties of classifying the dielectric disks are physically corroborated, since both are internal discharges in cavities, with only the number of cavities of difference between the objects under test. The proof of this difficulty is the classification errors of 13%, 16% and 18% among the objects tested.
For
Figure 14, it was verified that the method obtained 100% of accuracy for the hydrogenerator bus, 96% for the potential transformer, 87% for the oil discharge, 81% and 80% for the dielectric discs 1 and 2, respectively. Again, the bottleneck was the separation between the two dielectric disks. This finding corroborates the difficulty of separating the two dielectric disks regardless of the acquisition method.
6. Discussions and Conclusions
The research aims to detect and classify different patterns of internal discharges through UHF pulse capture with printed monopole PMA and signal conditioning based on envelope detection. A reduction of 18 times in the frequencies of the signals acquired with this conditioning system was verified, from 900 MHz to 50 MHz.
Five test objects, all with internal discharges, were put under test to obtain different profiles of partial discharges of the same nature, which was obtained with the confirmation of IEC 60270. The bar whose predominant defect is machine bar discharge, a type of internal discharge, dielectric discs 1 and 2 with internal discharge in controlled dielectric cavities, potential transformer with internal discharges, but due to threshing in the epoxy insulation and, finally, the discharge in oil due to tip-to-tip electrodes.
Acquisitions by the radiometric method were performed using Occkic 40 dB V2A.0 LNA conditioned signals and the ADL 5511 envelope detector. Threshold filtering technique was performed on the signals, and it was found that the amount of valid PRPD per database was above 90%.
The feature extraction considered the phase information of the filtered signals, and from these, eighteen statistical features were extracted. The models were trained from one and best feature to all features in order of mutual information pertinent to the database to be evaluated. The classifiers used were artificial neural networks in MLP configuration, support vector machines (SVM) and decision tree (DTC). In all, 108 different configurations were evaluated. In a purely numerical evaluation, the MLP network with the data acquired with IEC 60270 and 12 extracted features achieve 91.1% accuracy compared to the MLP network with 14 features extracted from the PRPD of conditioned signals, which achieved an accuracy of 84.5% for the test database.
Therefore, when it comes to technical and economic feasibility, the acquisition performed with the envelope amplification and detection circuit is quite adequate, since it allows a non-invasive acquisition, unlike the IEC method, and has a much lower necessary sampling rate to accomplish the Nyquist-Shannon criterion than the traditional radiometric method. Added to this, the price difference between an oscilloscope with high bandwidth and sample rate (5 GHz and 20 GSa/s) compared to an edge computing-based acquisition system with acquisition rates of 125 MSa/s is about 30 times.
As summary, some contributions of this work can be highlighted, such as:
Reduction of hardware requirements for the acquisition of radiometric signals from partial discharges;
Filtering methodology based on universal threshold and feature extraction by statistical methods;
Only seven statistical features extracted from the negative semicycle can classify different objects with internal discharges with accuracies greater than 76%;
With the best number of statistical features extracted from both semicycles can classify different objects with internal discharges with accuracies greater than 83%;
The classification of partial discharge sources using the radiometric method and with radiometric signal conditioning based on envelope detection circuit is feasible and competitive.
Author Contributions
Conceptualization, A.C.S.J., A.J.R.S. and G.V.R.X.; methodology, A.C.S.J. and G.V.R.X; conditioning system project, A.C.S.J., G.V.R.X., P.L.; experimentation, A.C.S.J., A.F.L.N., I.F.C. software, A.C.S.J.; validation, A.C.S.J. E.G.C., A.J.R.S, G.V.R.X.; investigation, A.C.S.J.; writing—original draft preparation, A.C.S.J., G.V.R.X.; writing—review and editing, A.C.S.J., G.V.R.X, A.J.R.S., G.K.F.SX.X., LAMMN, IFC; supervision, A.J.R.S., E.G.C. All authors have read and agreed to the published version of the manuscript.
Funding
This research and APC was partially funded by Brazilian National Council for Scientific and Technological Development (in Portuguese: Conselho Nacional de Desenvolvimento Científico e Tecnológico – CNPq, grant number 141850/2023-0. This work was partially funded by the National Institute of Science and Technology of Micro and Nanoelectronic System (INCT NAMITEC) and the RECOMBINE, Horizon 2020 MSCA RISE project 872857.
Data Availability Statement
The data presented in this document is available on request from the corresponding author.
Acknowledgments
The authors acknowledge the scholarship provided by the Brazilian National Council for Scientific and Technological Development – CNPq. The authors also acknowledge the Radiometry Laboratory and High Voltage Laboratory of the Federal University of Campina Grande, wich provided the environment and equipment for the measurement.
Conflicts of Interest
The authors declare no conflicts of interest.
References
- S. Coenen, S. Tenbohlen, S. M. Markalous e T. Strehl, “Sensitivity of UHF PD Measurements in Power Transformers,” IEEE Transactions on Dielectrics and Electrical Insulation, vol. 15, nº 6, pp. 1553-1558, December 2008.
- G. C. Montanari e A. Cavallini, “Partial Discharge Diagnostics: From Apparatus Monitoring to Smart Grid Assessment,” IEEE Electrical Insulation Magazine, vol. 29, nº 3, pp. 8-17, April 2013.
- International Electrotechnical Commission, “IEC 60270-2000: High-voltage test techniques - Partial discharge measurements,” Geneve, Switzerland, 2000.
- Y. Lu, X. Tan e X. Hu, “PD detection and localisation by acoustic measurements in an oil filled transformer,” IEE Proceedings - Science, Measurement and Technology, vol. 147, nº 2, pp. 81-85, March 2000.
- H. Liu, “Acoustic partial discharge localization methodology in power transformers employing the quantum genetic algorithm,” Applied Acoustics, Elsevier Ltd., vol. 102, pp. 71-78, January 2016.
- C. Sun, P. R. Ohodnicki e E. M. Stewart, “Chemical Sensing Strategies for Real-time Monitoring of Transformer Oil: A Review,” IEEE Sensors Journal, vol. 17, nº 18, pp. 5786-5806, September 2017.
- I. Urbaniec e P. Fracz, “Application of UV camera for PD detection on long rod HV insulator,” Measurement Automation Monitoring, pp. 64-67, March 2015.
- M. Rohani, A. Zaidi, A. Sakanovic, C. Wooi, A. Rosmi, M. Isa e B. Ismail, “Classification of Partial Discharge Detection Technique in High Voltage Power Component: A Review,” International Journal of Integrated Engineering, pp. 237-243, 31 August 2019.
- B. F. Hampton e R. Meats, “Diagnostic measurements at UHF in gas insulated substations,” IEE Proceedings C (Generation, Transmission and Distribution), vol. 135, nº 2, pp. 137-144, March 1988.
- G. V. R. Xavier, Ph. D. Thesis in portuguese: “Aplicação de Antenas Monopolo Impressas Bio-Inspiradas com Superstratos Metamateriais na Detecção e Localização de Descargas Parciais,” Campina Grande, 2021.
- L. A. M. M. Nobrega, Ph. D. Thesis in portuguese: “Novo Método para Monitoramento e Localização de Fontes de Descargas Parciais em Transformadores de Potência Utilizando Medições e Simulações na faixa UHF,” Campina Grande, 2019.
- D. W. Upton, K. K. Mistry, P. J. Mather, Z. D. Zaharis, R. C. Atkinson, C. Tachtatzis e P. I. Lazaridis, “A review of techniques for RSS-based radiometric partial discharge localization,” Sensors, vol. 21, nº 3, p. 909, January 2021.
- G. V. R. Xavier, H. S. Silva, E. G. d. Costa, A. J. R. Serres, N. B. Carvalho e A. S. Oliveira, “Detection, Classification and Location of Sources of Partial Discharges Using the Radiometric Method: Trends, Challenges and Open Issues.,” IEEE Access, vol. 9, pp. 110787 - 110810, August 2021b.
- Working Group A2.27, Cigre, “Recommendations for condition monitoring and condition assessment facilities for transformers,” 2008.
- S. Tenbohlen, C. P. Beura, W. Sikorski, R. Albarracín Sánchez, B. A. de Castro, M. Beltle, P. Fehlmann, M. Judd, F. Werner e M. Siegel, “Frequency range of UHF PD measurements in power transformers,” Energies, vol. 16, p. 1395, 30 January 2023.
- J. M. R. de Souza Neto, J. da Rocha Neto, E. C. T. Macedo, I. A. Glover e M. D. Judd, “An envelope detector as a trading cost technique for radiometric partial discharge detection,” 2014 IEEE International Instrumentation and Measurement Technology Conference (I2MTC) Proceedings, pp. 1584 - 1589, May 2014.
- A.C. Santos, I. F. Carvalho, G. V. Xavier, E. G. Costa e L. A. Nobrega, “Artificial intelligence applied to PRPD patterns classification using UHF printed monopole antenna and envelope detector,” em 23rd International Symposium on High Voltage Engineering - ISH, Glasgow - UK, 2023.
- I. F. Carvalho, A. C. Santos, L. A. Nobrega, E. G. Costa, A. D. Silva, G. R. Lira, A. C. Marotti, A. I. Costa e J. P. Souza, “PRPD analysis in current transformers using UHF sensors and signal conditioning system,” em 23rd International Symposium on High Voltage Engineering - ISH, Glasgow - UK, 2023.
- V. R. Barbosa, G. R. Lira, E. G. Costa, G. M. Galdino, A. H. Oliveira e A. C. Santos, “Estimation of the Pollution Critical Level on the Surface of Glass Insulators Based on Leakage Current,” IEEE Transactions on Power Delivery, pp. 1222 - 1232, 2 April 2024.
- C.-H. Chen e C.-J. Chou, “Deep Learning and Long-Duration PRPD Analysis to Uncover Weak Partial Discharge Signals for Defect Identification,” Applied Sciences, p. 13, September 2023.
- T.-D. Do, V.-N. Tuyet-Doan, Y.-S. Cho, J.-H. Sun e Y.-H. Kim, “Convolutional-neural-network-based partial discharge diagnosis for power transformer using UHF sensor,” IEEE Access, pp. 207377 - 207388, 17 November 2020.
- T. Pinpart e M. Judd, “Differentiating between partial discharge sources using envelope comparison of ultra-high-frequency signals,” IET science, measurement & technology, pp. 256 - 267, September 2010.
- I. F. Carvalho, E. G. da Costa, L. A. M. M. Nobrega e A. D. d. C. Silva, “Identification of Partial Discharge Sources by Feature Extraction from a Signal Conditioning System,” Sensors, vol. 24, p. 2226, March 2024.
- R. Schurch, O. Munoz, J. Ardila-Rey, P. Donoso e V. Peesapati, “Identification of Electrical Tree Aging State in Epoxy Resin Using Partial Discharge Waveforms Compared to Traditional Analysis,” Polymers, p. 17, 2023.
- J. Jiang, J. Chen, J. Li, X. Yang, Y. Bie, P. Ranjan, C. Zhang e H. Schwartz, “Partial Discharge Detection and Diagnosis of Transformer Bushing Based on UHF Method,” IEEE Sensors Journal , vol. 21, nº 15, pp. 16798 - 16806, August 2021.
- G. V. R. Xavier, E. G. d. Costa, A. J. R. Serres, L. A. M. M. Nobrega, A. C. Oliveira e H. F. Sousa, “Design and Application of a Circular Printed Monopole Antenna in Partial Discharge Detection,” IEEE Sensors Journal, pp. 3718 - 3725, 15 May 2019.
- E. C. T. Macêdo, Ph. D. Thesis in portuguese:“Metodologia Para a Classificação de Descargas Parciais Utilizando Redes Neurais Artificiais,” Campina Grande, 2014.
- J. de Souza Neto, E. De Macedo, M. Batista, T. Cavalcanti, E. C. Guedes, J. da Rocha Neto e I. A. Glover, “Early progress in the development of a radiometric PD location system,” 2012 IEEE International Instrumentation and Measurement Technology Conference Proceedings, pp. 129--133, 2012.
- Y. Wang, Y. Li, Y. Song e X. Rong, “he influence of the activation function in a convolution neural network model of facial expression recognition,” Applied Sciences. MDPI, vol. 10, p. 1897, 2020.
- S.-l. M. l. i. Python, “Scikit-learn Suport Vector Machine,” [Online]. Available: https://scikit-learn.org/stable/modules/generated/sklearn.svm.SVC.html. [Acesso em 1 June 2024].
- S.-l. M. l. i. Python, “Scikit-learn: Decision Tree Classifier,” [Online]. Available: https://scikit-learn.org/stable/modules/generated/sklearn.tree.DecisionTreeClassifier.html. [Acesso em 29 May 2024].
Figure 1.
Partial discharges measurement schematic.
Figure 1.
Partial discharges measurement schematic.
Figure 2.
Picture of experimental setup to partial discharges generation/detection.
Figure 2.
Picture of experimental setup to partial discharges generation/detection.
Figure 3.
Picture of UHF partial discharges signal conditioning system.
Figure 3.
Picture of UHF partial discharges signal conditioning system.
Figure 5.
Figures of merit of LNA.
Figure 5.
Figures of merit of LNA.
Figure 6.
Universal threshold filtering thecnique flowchart.
Figure 6.
Universal threshold filtering thecnique flowchart.
Figure 7.
PRPD pattern representation flowchart.
Figure 7.
PRPD pattern representation flowchart.
Figure 8.
Flowchart of data engineering for machine learning training.
Figure 8.
Flowchart of data engineering for machine learning training.
Figure 9.
Flowchart of classification using machine learning.
Figure 9.
Flowchart of classification using machine learning.
Figure 10.
Amplified PD pulse and it’s conditioned envelope.
Figure 10.
Amplified PD pulse and it’s conditioned envelope.
Figure 11.
Frequency domain response of PD pulse and it’s conditioning system. (a) From 0 to 1,25 GHz; (b) Zoom in from 0 to 160 MHz.
Figure 11.
Frequency domain response of PD pulse and it’s conditioning system. (a) From 0 to 1,25 GHz; (b) Zoom in from 0 to 160 MHz.
Figure 12.
Representative figure of the step-by-step universal threshold filtering technique: from (a) to (d) representation of filtering with conditioned signals. From (f) to (j) representation of the filtering of the signals acquired with the electric method.
Figure 12.
Representative figure of the step-by-step universal threshold filtering technique: from (a) to (d) representation of filtering with conditioned signals. From (f) to (j) representation of the filtering of the signals acquired with the electric method.
Figure 13.
Confusion matrix of MLP with 14 features from conditioned dataset.
Figure 13.
Confusion matrix of MLP with 14 features from conditioned dataset.
Figure 14.
Confusion matrix of MLP with 14 features from IEC dataset.
Figure 14.
Confusion matrix of MLP with 14 features from IEC dataset.
Table 1.
Partial discharges range detected.
Table 1.
Partial discharges range detected.
| Object |
Partial discharges range (pC) |
| Bar |
1500-3000 |
| Disc 1 |
180-300 |
| Disc 2 |
700-1700 |
| Oil |
200-450 |
| PT |
1100-3000 |
Table 2.
Valid PRPD quantities.
Table 2.
Valid PRPD quantities.
| Signal |
Conditioning system |
IEC |
| Bar |
250 |
250 |
| Disc 1 |
186 |
219 |
| Disc 2 |
233 |
242 |
| Oil |
215 |
201 |
| PT |
250 |
250 |
| Absolute |
1134 |
1162 |
| Percentage |
90.72% |
92.96% |
Table 3.
Features per semicycle of the filtered database of signals acquired with conditioning system.
Table 3.
Features per semicycle of the filtered database of signals acquired with conditioning system.
| |
Conditioning system dataset |
| Features |
Bar + |
Bar - |
Disc 1 + |
Disc 1 - |
Disc 2 + |
Disc 2 - |
Oil + |
Oil - |
PT + |
PT - |
| Min |
0.00 |
180.00 |
0.00 |
180.01 |
0.01 |
180.03 |
0.03 |
180.01 |
18.25 |
184.90 |
| 2nd quartile |
45.71 |
226.98 |
41.76 |
218.56 |
48.92 |
228.32 |
58.67 |
236.63 |
57.47 |
218.84 |
| Median |
84.34 |
257.92 |
67.75 |
249.01 |
64.40 |
243.92 |
81.30 |
253.86 |
66.78 |
235.78 |
| 3rt quartile |
131.22 |
306.36 |
119.33 |
304.46 |
96.16 |
279.06 |
122.73 |
285.68 |
77.76 |
250.99 |
| Max |
180.00 |
360.00 |
179.95 |
359.97 |
179.99 |
359.97 |
180.00 |
359.99 |
128.96 |
284.04 |
| Mean |
87.74 |
265.41 |
80.75 |
261.02 |
75.34 |
255.81 |
87.88 |
261.70 |
68.31 |
235.21 |
| Skewness |
0.10 |
0.23 |
0.41 |
0.37 |
0.79 |
0.77 |
0.16 |
0.44 |
0.46 |
0.00 |
| Curtosis |
-1.14 |
-1.04 |
-0.99 |
-1.10 |
-0.07 |
-0.17 |
-0.77 |
-0.33 |
0.43 |
-0.84 |
| No. of pulses |
6326 |
6899 |
5863 |
5631 |
4606 |
4554 |
6333 |
7246 |
1011 |
701 |
Table 4.
Features per semicycle of the filtered database of signals acquired with IEC 60270.
Table 4.
Features per semicycle of the filtered database of signals acquired with IEC 60270.
| |
IEC dataset |
| Features |
Bar + |
Bar - |
Disc 1 + |
Disc 1 - |
Disc 2 + |
Disc 2 - |
Oil + |
Oil - |
PT + |
PT - |
| Min |
0.54 |
180.58 |
0.27 |
180.67 |
0.27 |
181.48 |
0.45 |
181.75 |
10.93 |
192.34 |
| 2nd quartile |
47.19 |
227.58 |
44.30 |
221.92 |
51.20 |
230.08 |
69.52 |
244.91 |
57.15 |
223.51 |
| Median |
55.58 |
235.56 |
53.42 |
232.52 |
60.08 |
238.77 |
75.76 |
252.76 |
66.28 |
239.48 |
| 3rt quartile |
64.88 |
243.81 |
62.53 |
242.60 |
69.50 |
248.59 |
84.94 |
262.35 |
76.95 |
252.91 |
| Max |
179.51 |
359.91 |
179.96 |
359.91 |
179.60 |
359.91 |
179.15 |
359.64 |
129.04 |
284.34 |
| Mean |
57.60 |
237.25 |
54.39 |
237.22 |
61.28 |
241.46 |
77.89 |
254.47 |
67.51 |
238.75 |
| Skewness |
2.16 |
3.02 |
2.03 |
2.54 |
1.77 |
2.66 |
0.84 |
1.33 |
0.33 |
-0.02 |
| Curtosis |
10.71 |
17.51 |
10.50 |
7.42 |
9.03 |
10.34 |
8.56 |
7.01 |
0.67 |
-0.77 |
| No. of pulses |
15896 |
26360 |
23757 |
24129 |
6167 |
5565 |
11312 |
15663 |
5060 |
5598 |
Table 5.
Statistical features ordered by importance for the two databases.
Table 5.
Statistical features ordered by importance for the two databases.
| Order |
Conditioning |
IEC 60270 |
| 1 |
Max- |
3rd quantile - |
| 2 |
3rd quartile - |
Mean- |
| 3 |
Mean- |
Median- |
| 4 |
Median- |
Max- |
| 5 |
Min - |
2nd quartile - |
| 6 |
2nd quartile - |
Min - |
| 7 |
Number of pulses - |
Number of pulses - |
| 8 |
3rd quartile + |
2nd quartile + |
| 9 |
Mean + |
Mean + |
| 10 |
Median + |
Min + |
| 11 |
Max + |
Median + |
| 12 |
Min + |
3rd quartile + |
| 13 |
2nd quartile + |
Number of pulses + |
| 14 |
Number of pulses + |
Kurtosis - |
| 15 |
Kurtosis - |
Max + |
| 16 |
Skewness - |
Skewness + |
| 17 |
Skewness + |
Skewness - |
| 18 |
Kurtosis + |
Kurtosis + |
Table 6.
Test dataset accuracy of machine learning models.
Table 6.
Test dataset accuracy of machine learning models.
| |
Conditioning system |
IEC |
| N features |
MLP |
SVM |
DTC |
MLP |
SVM |
DTC |
| 1 |
65.4 |
67.7 |
60.1 |
60.5 |
61.9 |
67.0 |
| 2 |
67.4 |
69.5 |
66.9 |
56.2 |
64.2 |
66.5 |
| 3 |
62.5 |
68.9 |
68.9 |
73.6 |
63.6 |
68.5 |
| 4 |
70.7 |
68.6 |
68.6 |
78.5 |
74.5 |
75.9 |
| 5 |
73.0 |
69.5 |
69.5 |
76.2 |
73.6 |
76.2 |
| 6 |
71.3 |
70.1 |
71.3 |
83.7 |
71.3 |
77.7 |
| 7 |
76.8 |
70.0 |
79.2 |
83.1 |
64.5 |
80.5 |
| 8 |
81.5 |
70.5 |
82.1 |
85.1 |
64.5 |
85.7 |
| 9 |
82.1 |
70.7 |
83.6 |
90.0 |
64.8 |
85.4 |
| 10 |
83.9 |
71.1 |
83.6 |
88.5 |
64.8 |
86.2 |
| 11 |
82.1 |
71.2 |
83.3 |
89.4 |
64.8 |
89.1 |
| 12 |
80.4 |
70.1 |
82.4 |
91.1 |
64.8 |
88.0 |
| 13 |
83.9 |
64.5 |
80.6 |
90.5 |
73.4 |
89.7 |
| 14 |
84.5 |
64.8 |
82.7 |
88.3 |
72.8 |
89.7 |
| 15 |
78.3 |
64.5 |
82.7 |
89.4 |
72.5 |
89.4 |
| 16 |
74.8 |
64.9 |
82.4 |
88.8 |
73.1 |
88.8 |
| 17 |
82.1 |
64.5 |
82.4 |
87.7 |
72.8 |
89.7 |
| 18 |
77.1 |
65.2 |
82.4 |
71.0 |
73.1 |
90.0 |
| Best accuracy |
84.5% |
71.2% |
83.6% |
91.1% |
74.5% |
90.0% |
|
Disclaimer/Publisher’s Note: The statements, opinions and data contained in all publications are solely those of the individual author(s) and contributor(s) and not of MDPI and/or the editor(s). MDPI and/or the editor(s) disclaim responsibility for any injury to people or property resulting from any ideas, methods, instructions or products referred to in the content. |
© 2024 by the authors. Licensee MDPI, Basel, Switzerland. This article is an open access article distributed under the terms and conditions of the Creative Commons Attribution (CC BY) license (http://creativecommons.org/licenses/by/4.0/).
