Submitted:
04 June 2024
Posted:
05 June 2024
You are already at the latest version
Abstract
Keywords:
1. Introduction
2. Results
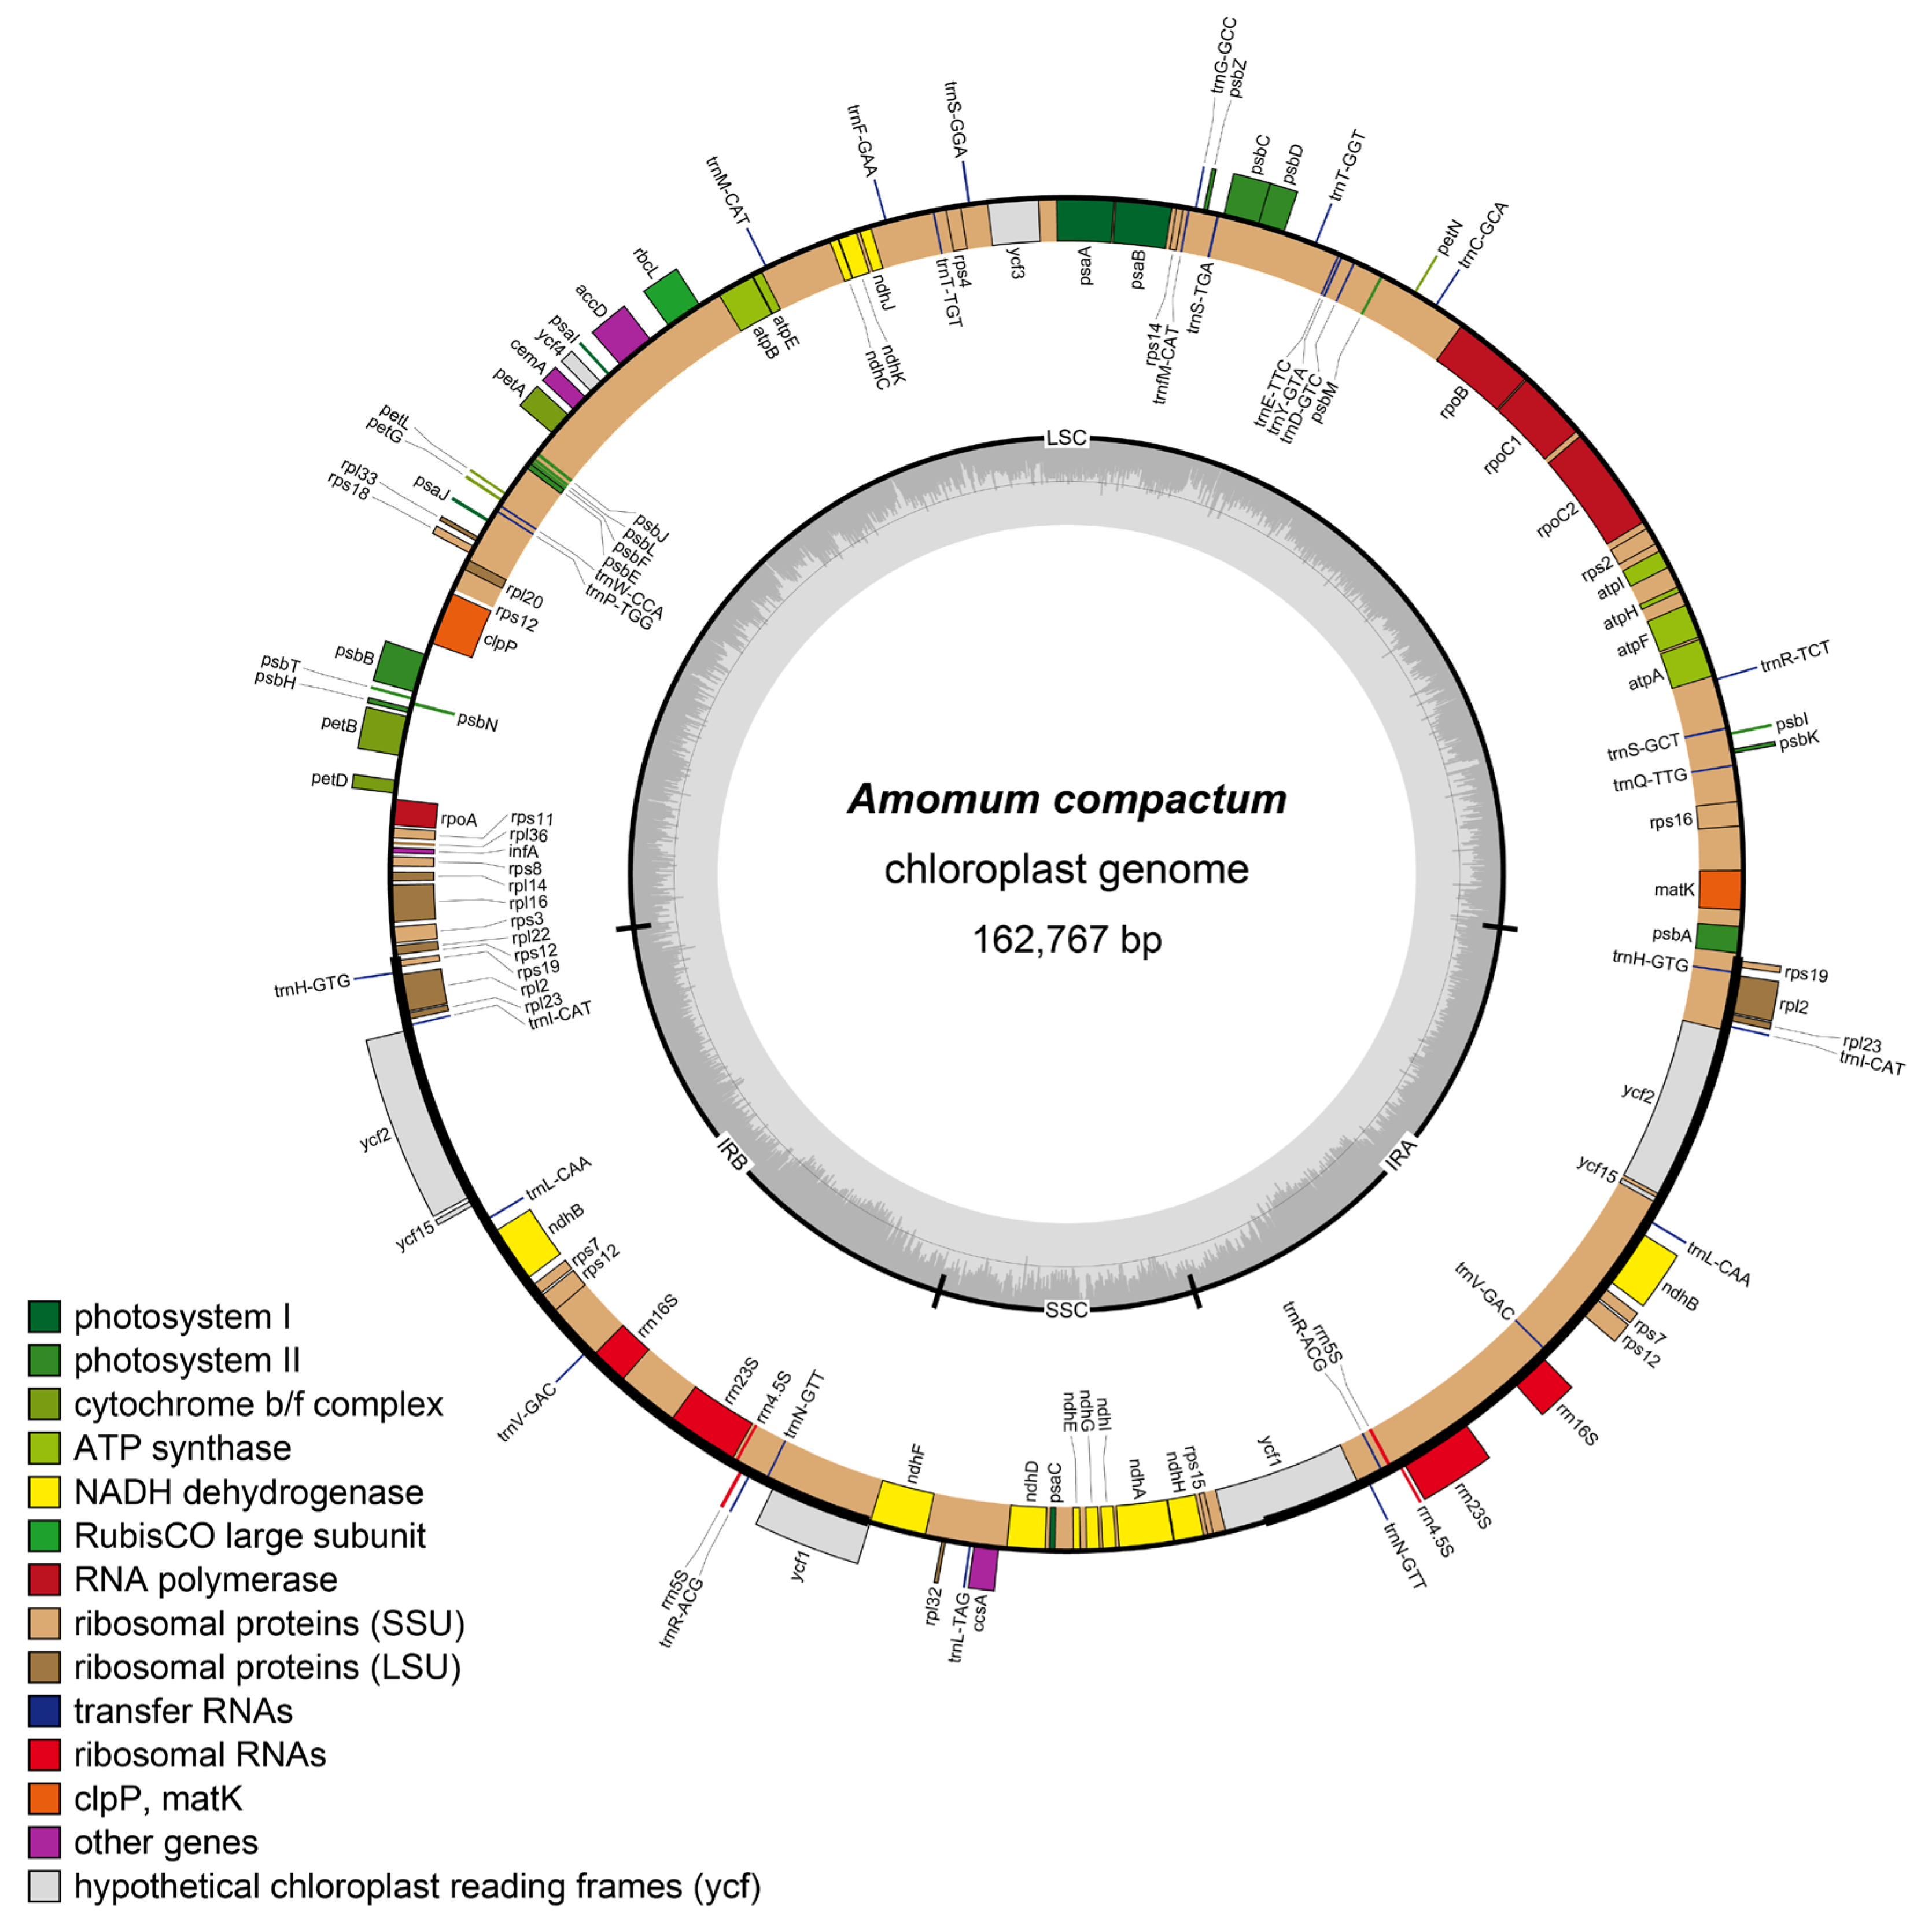
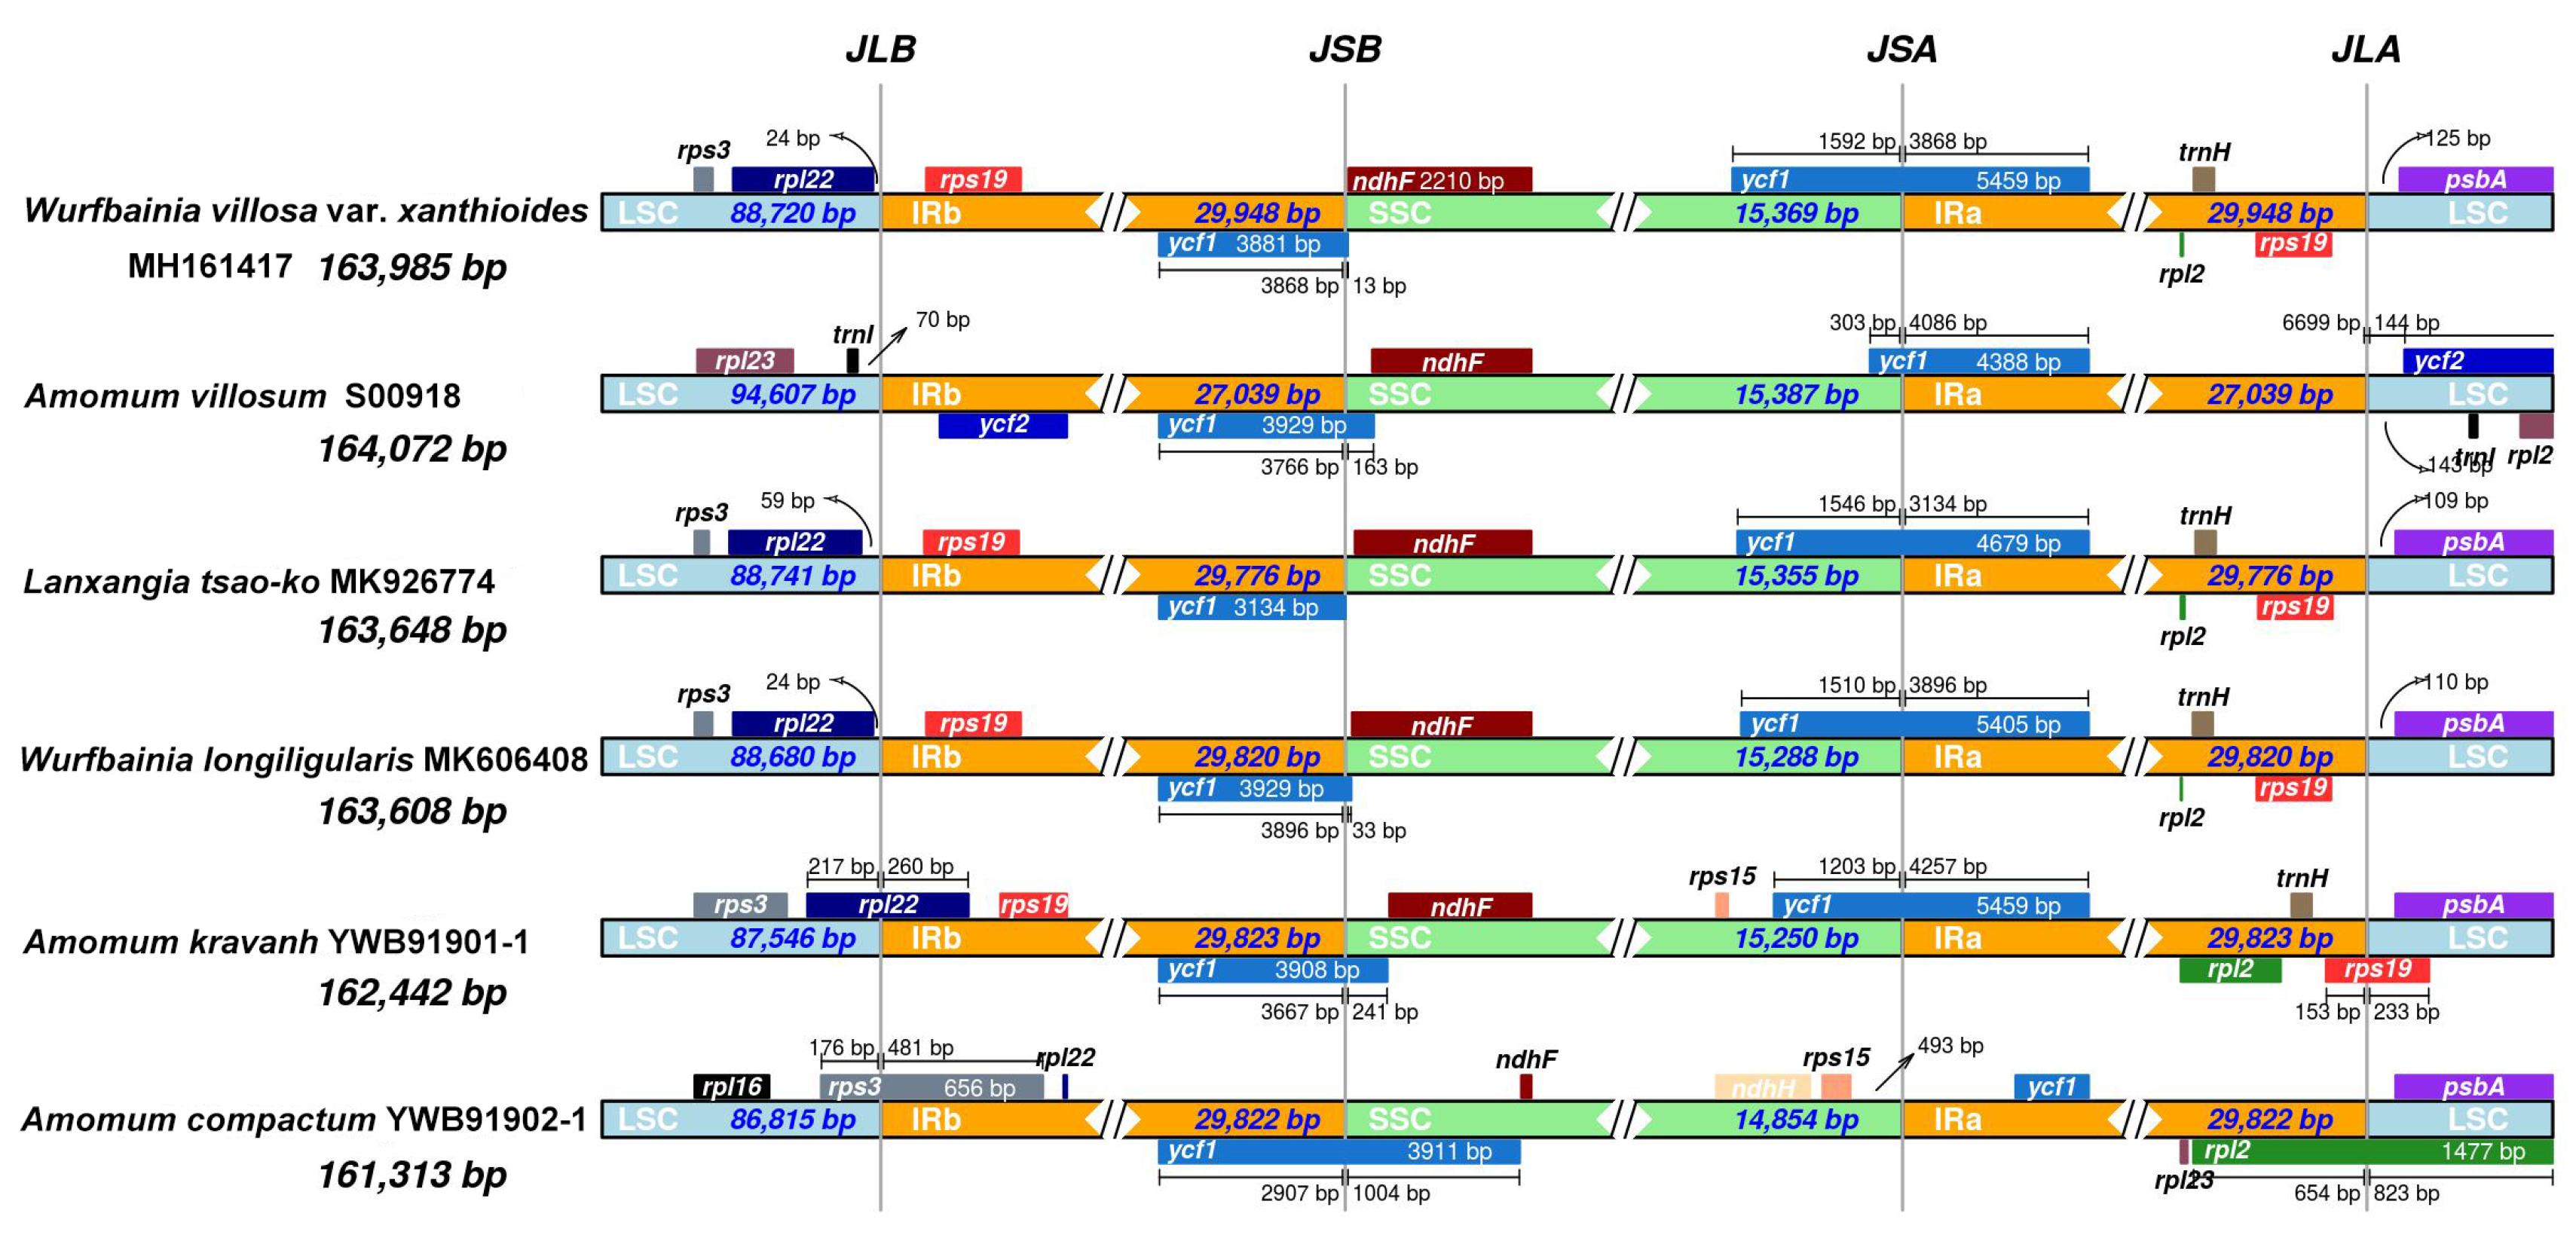
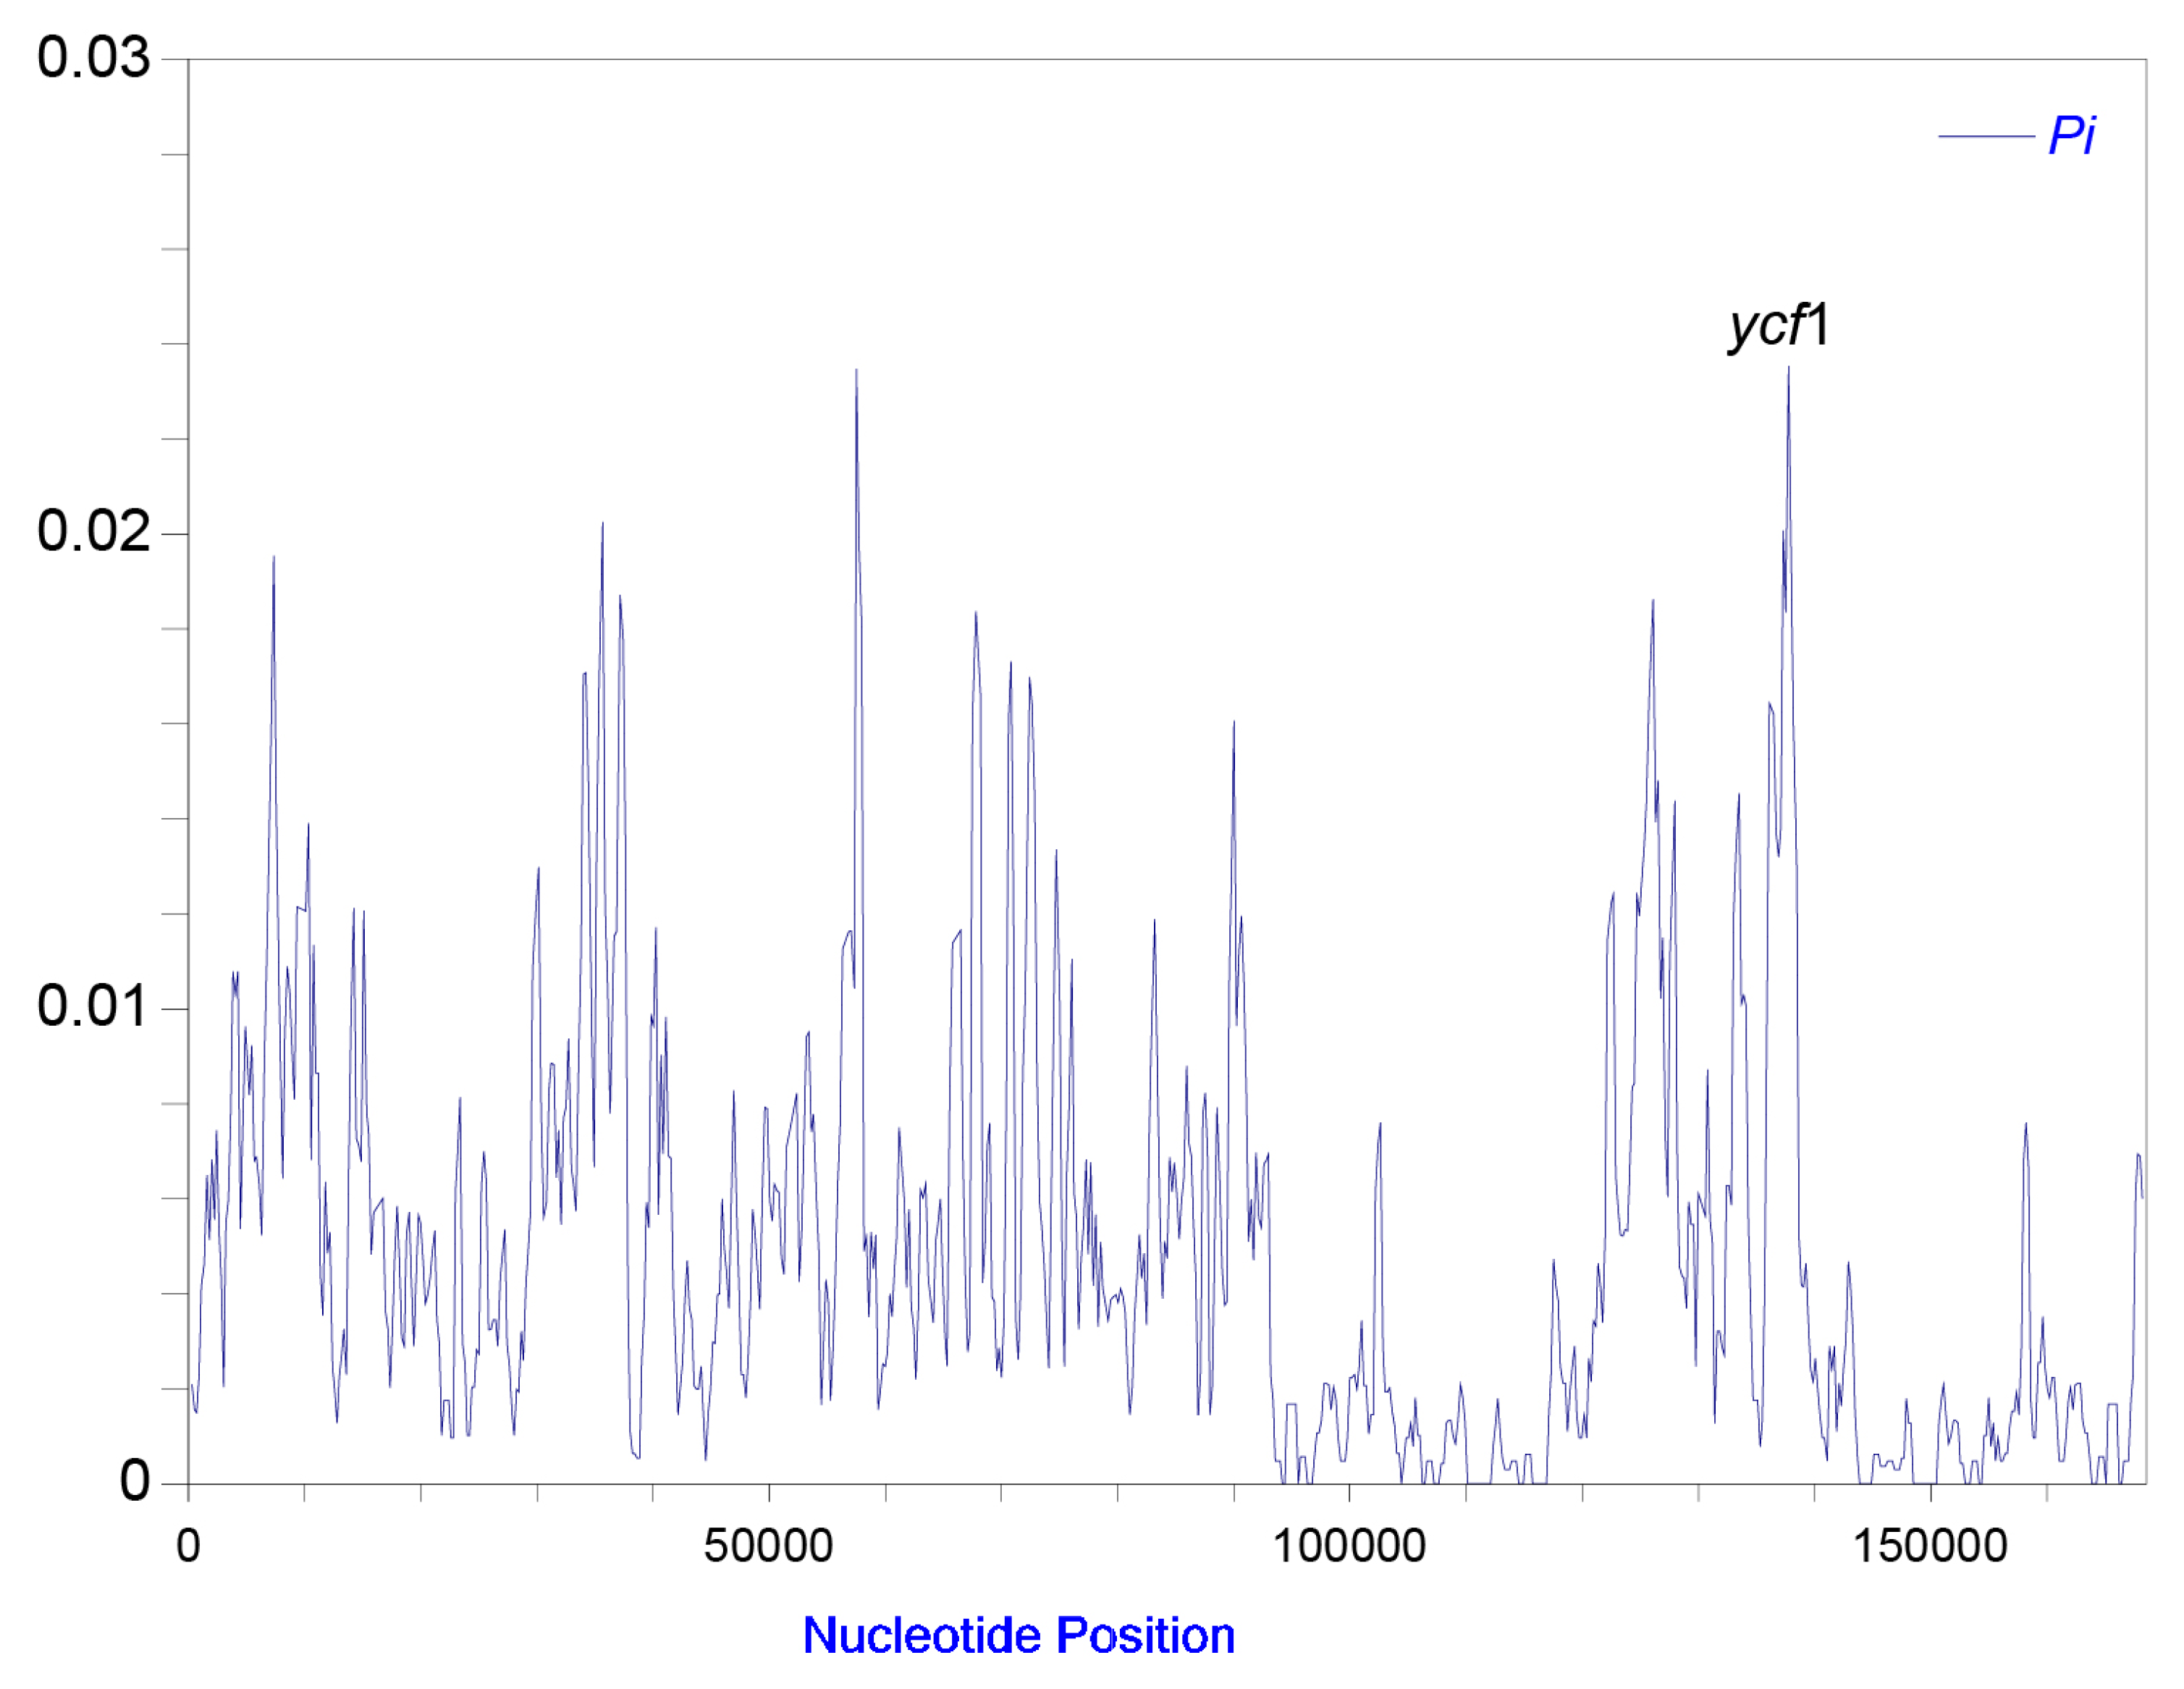
2.1. Plastome Structural Variation, Sequence Divergences, and Hypervariable Regions
2.2. Sequence Characteristics
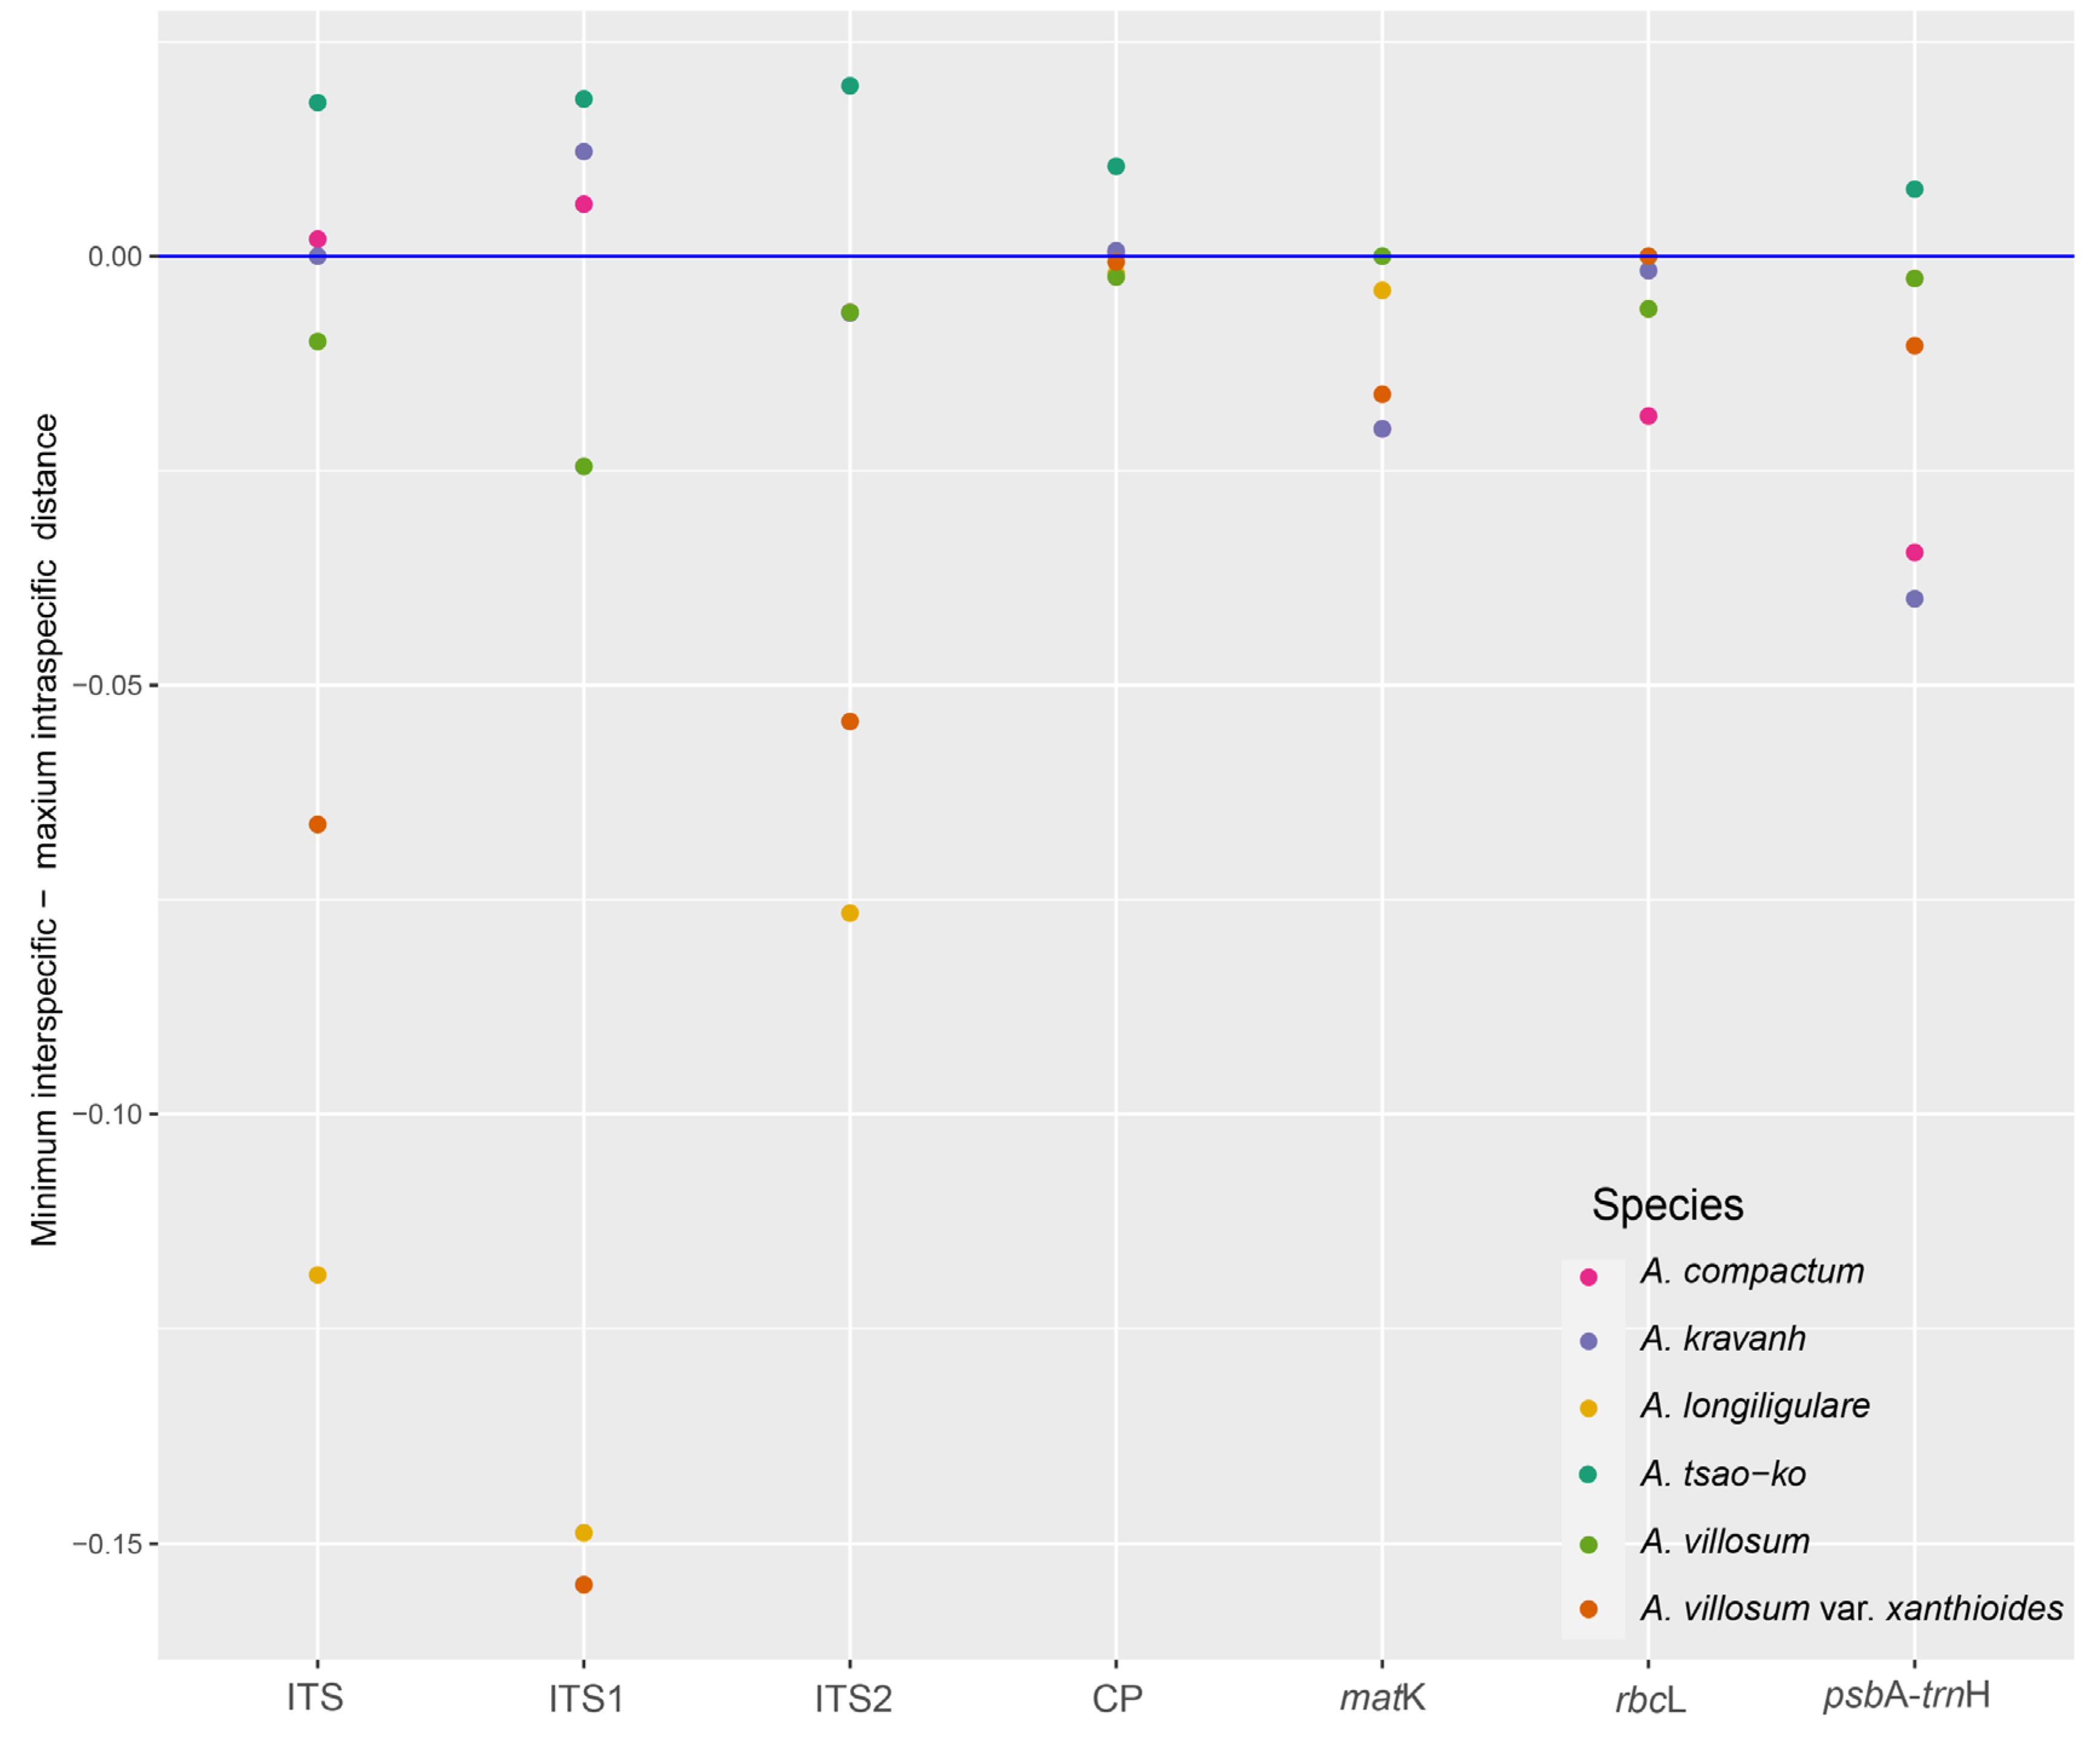
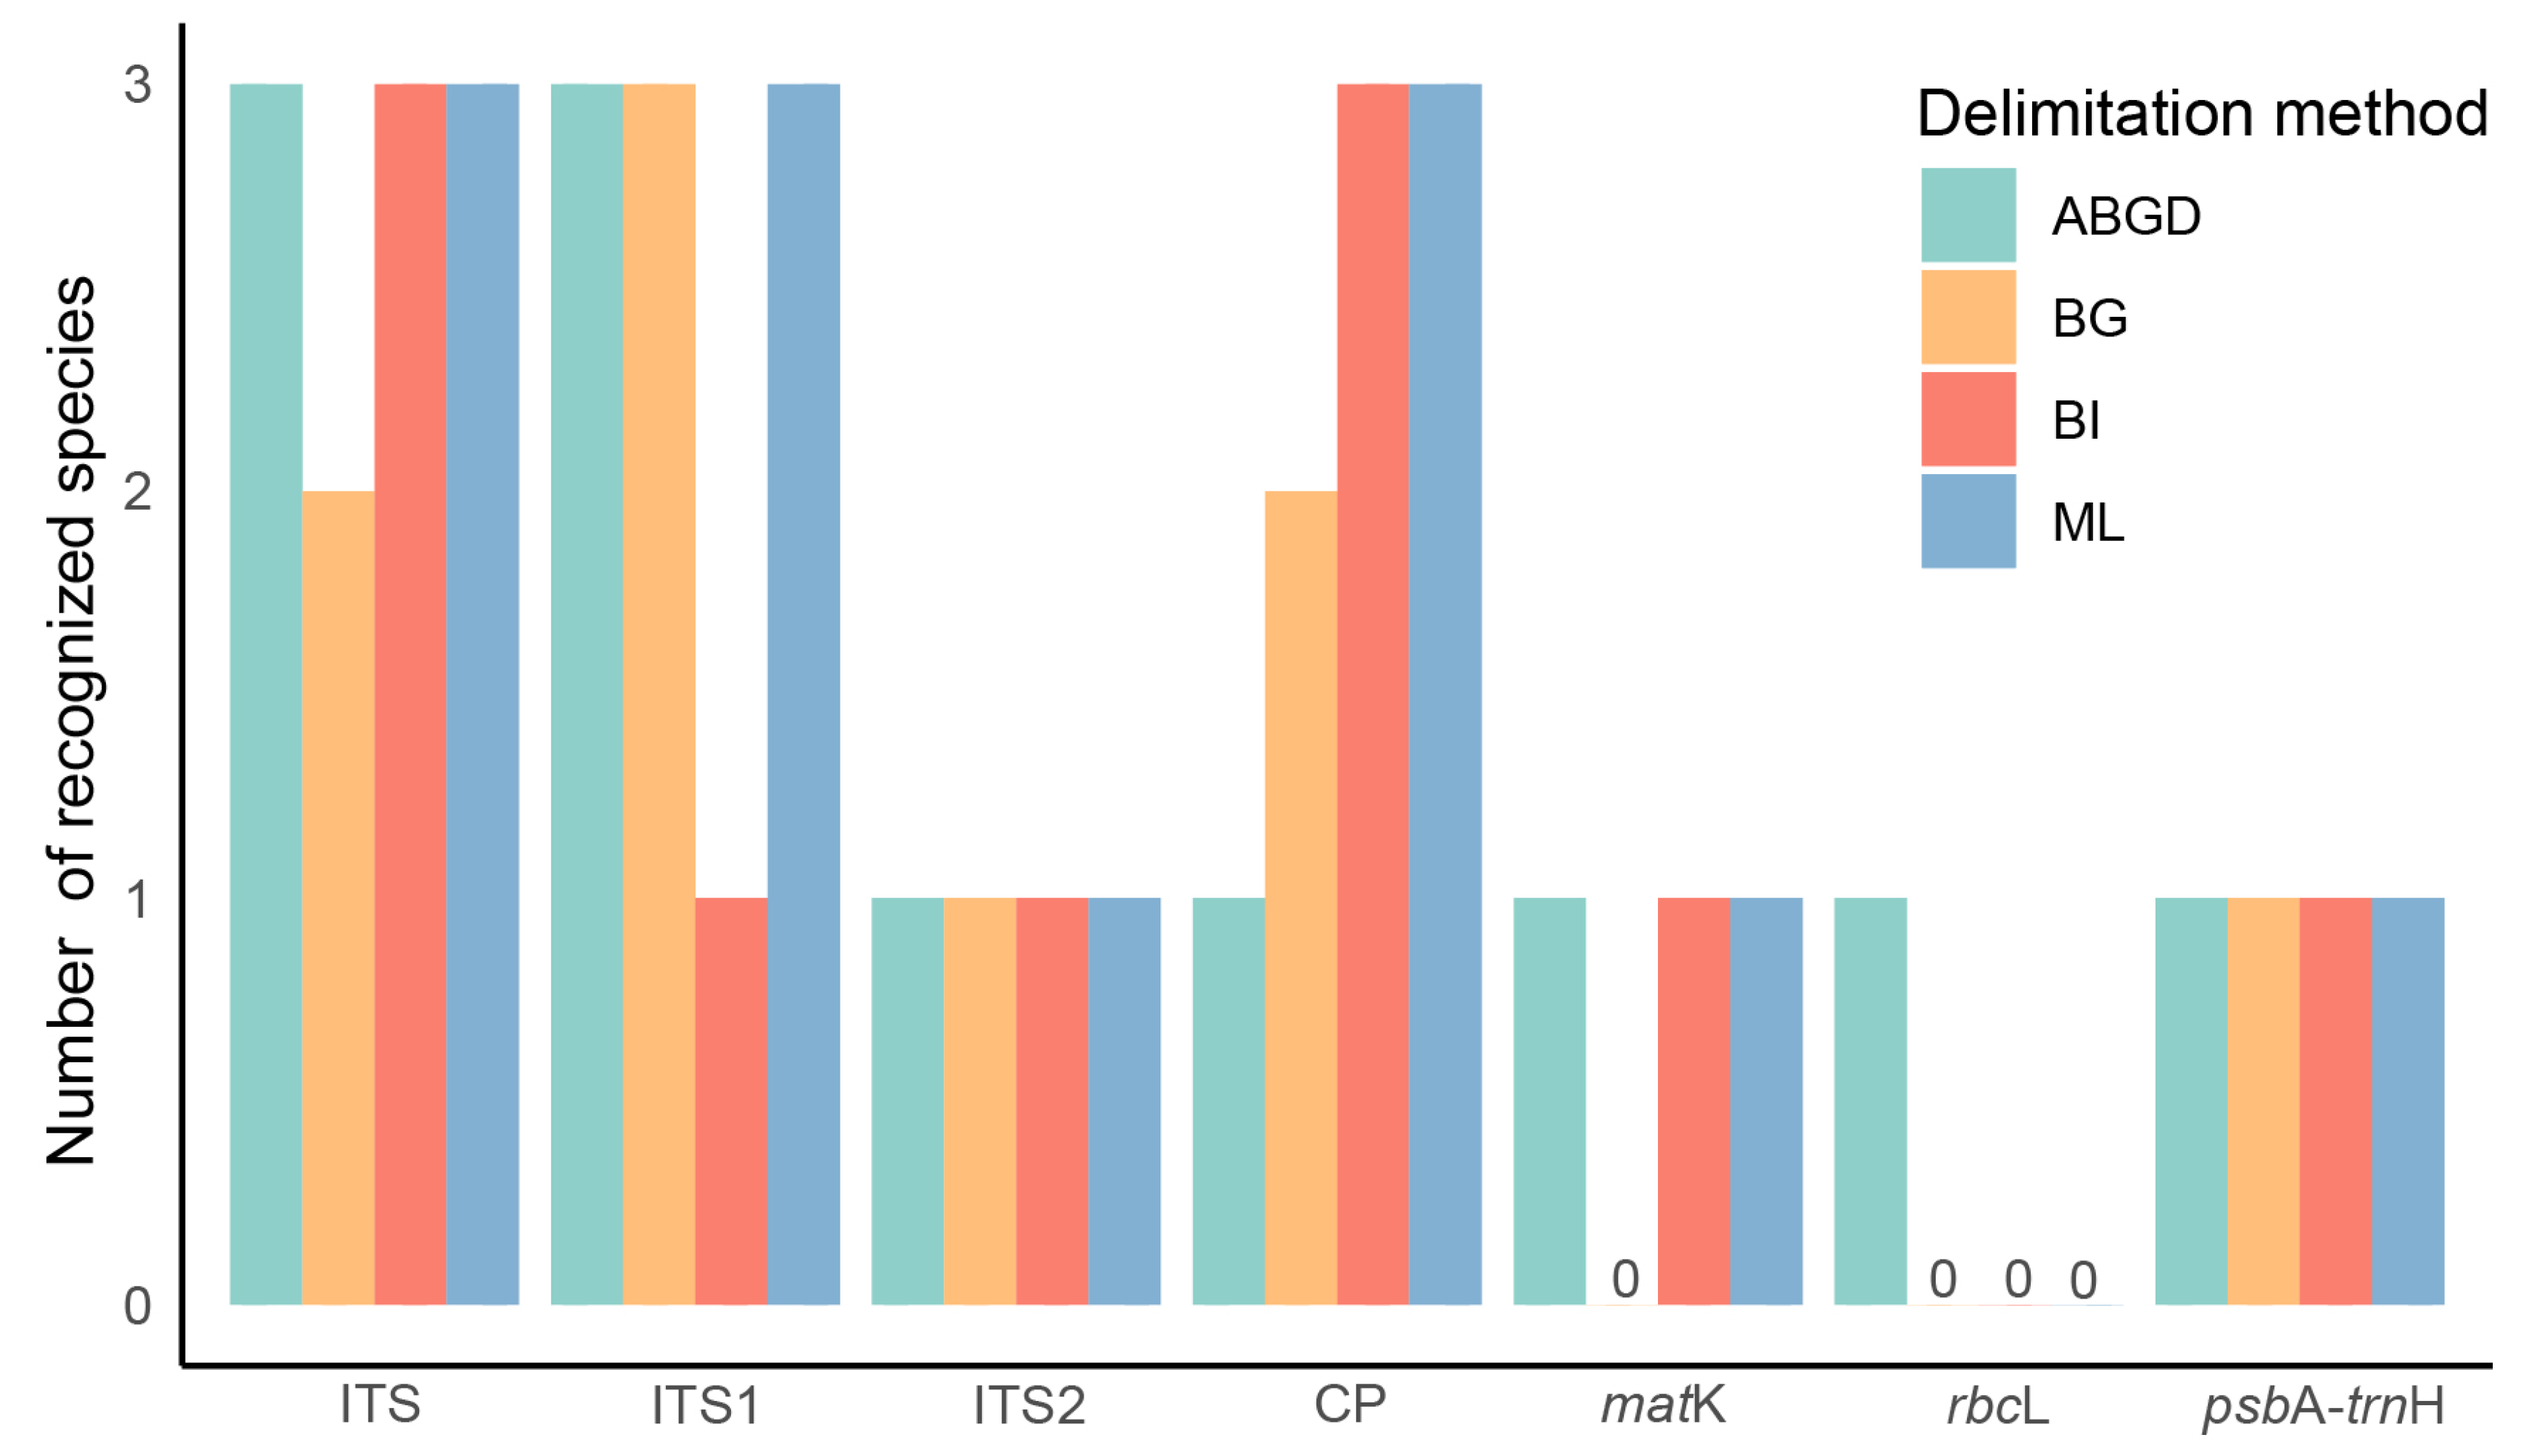
2.3. Distance based Species Discrimination
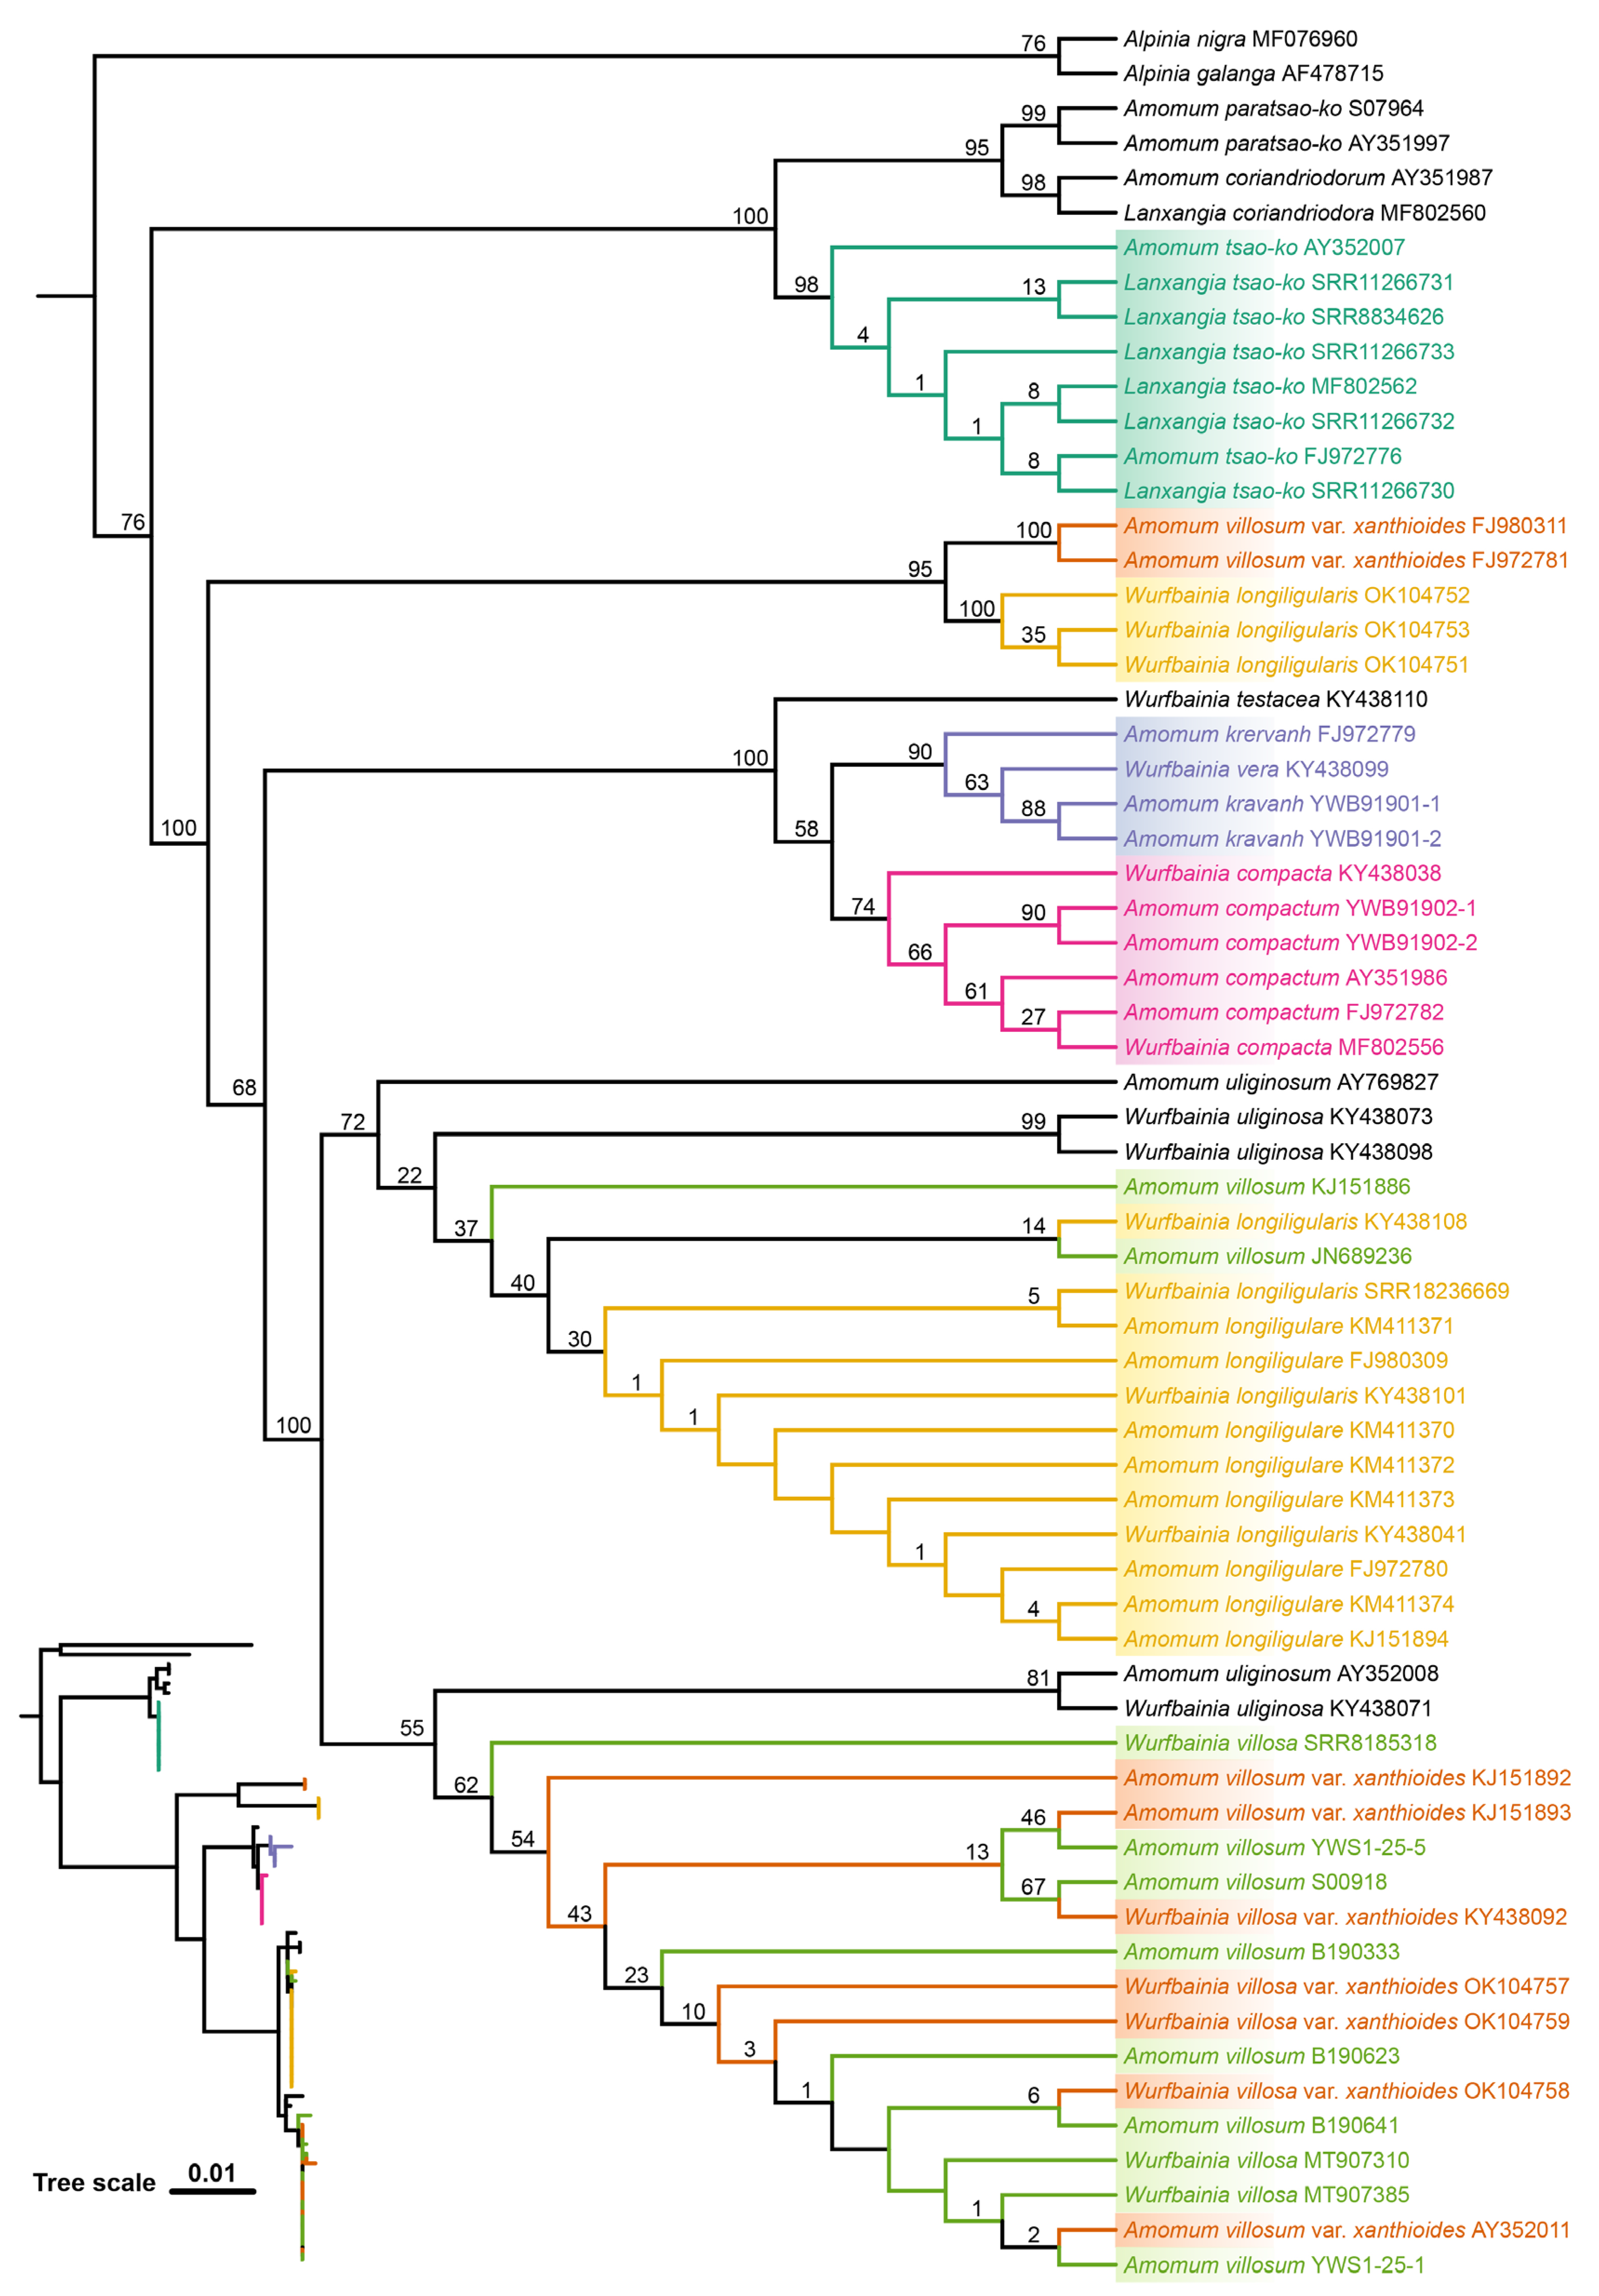
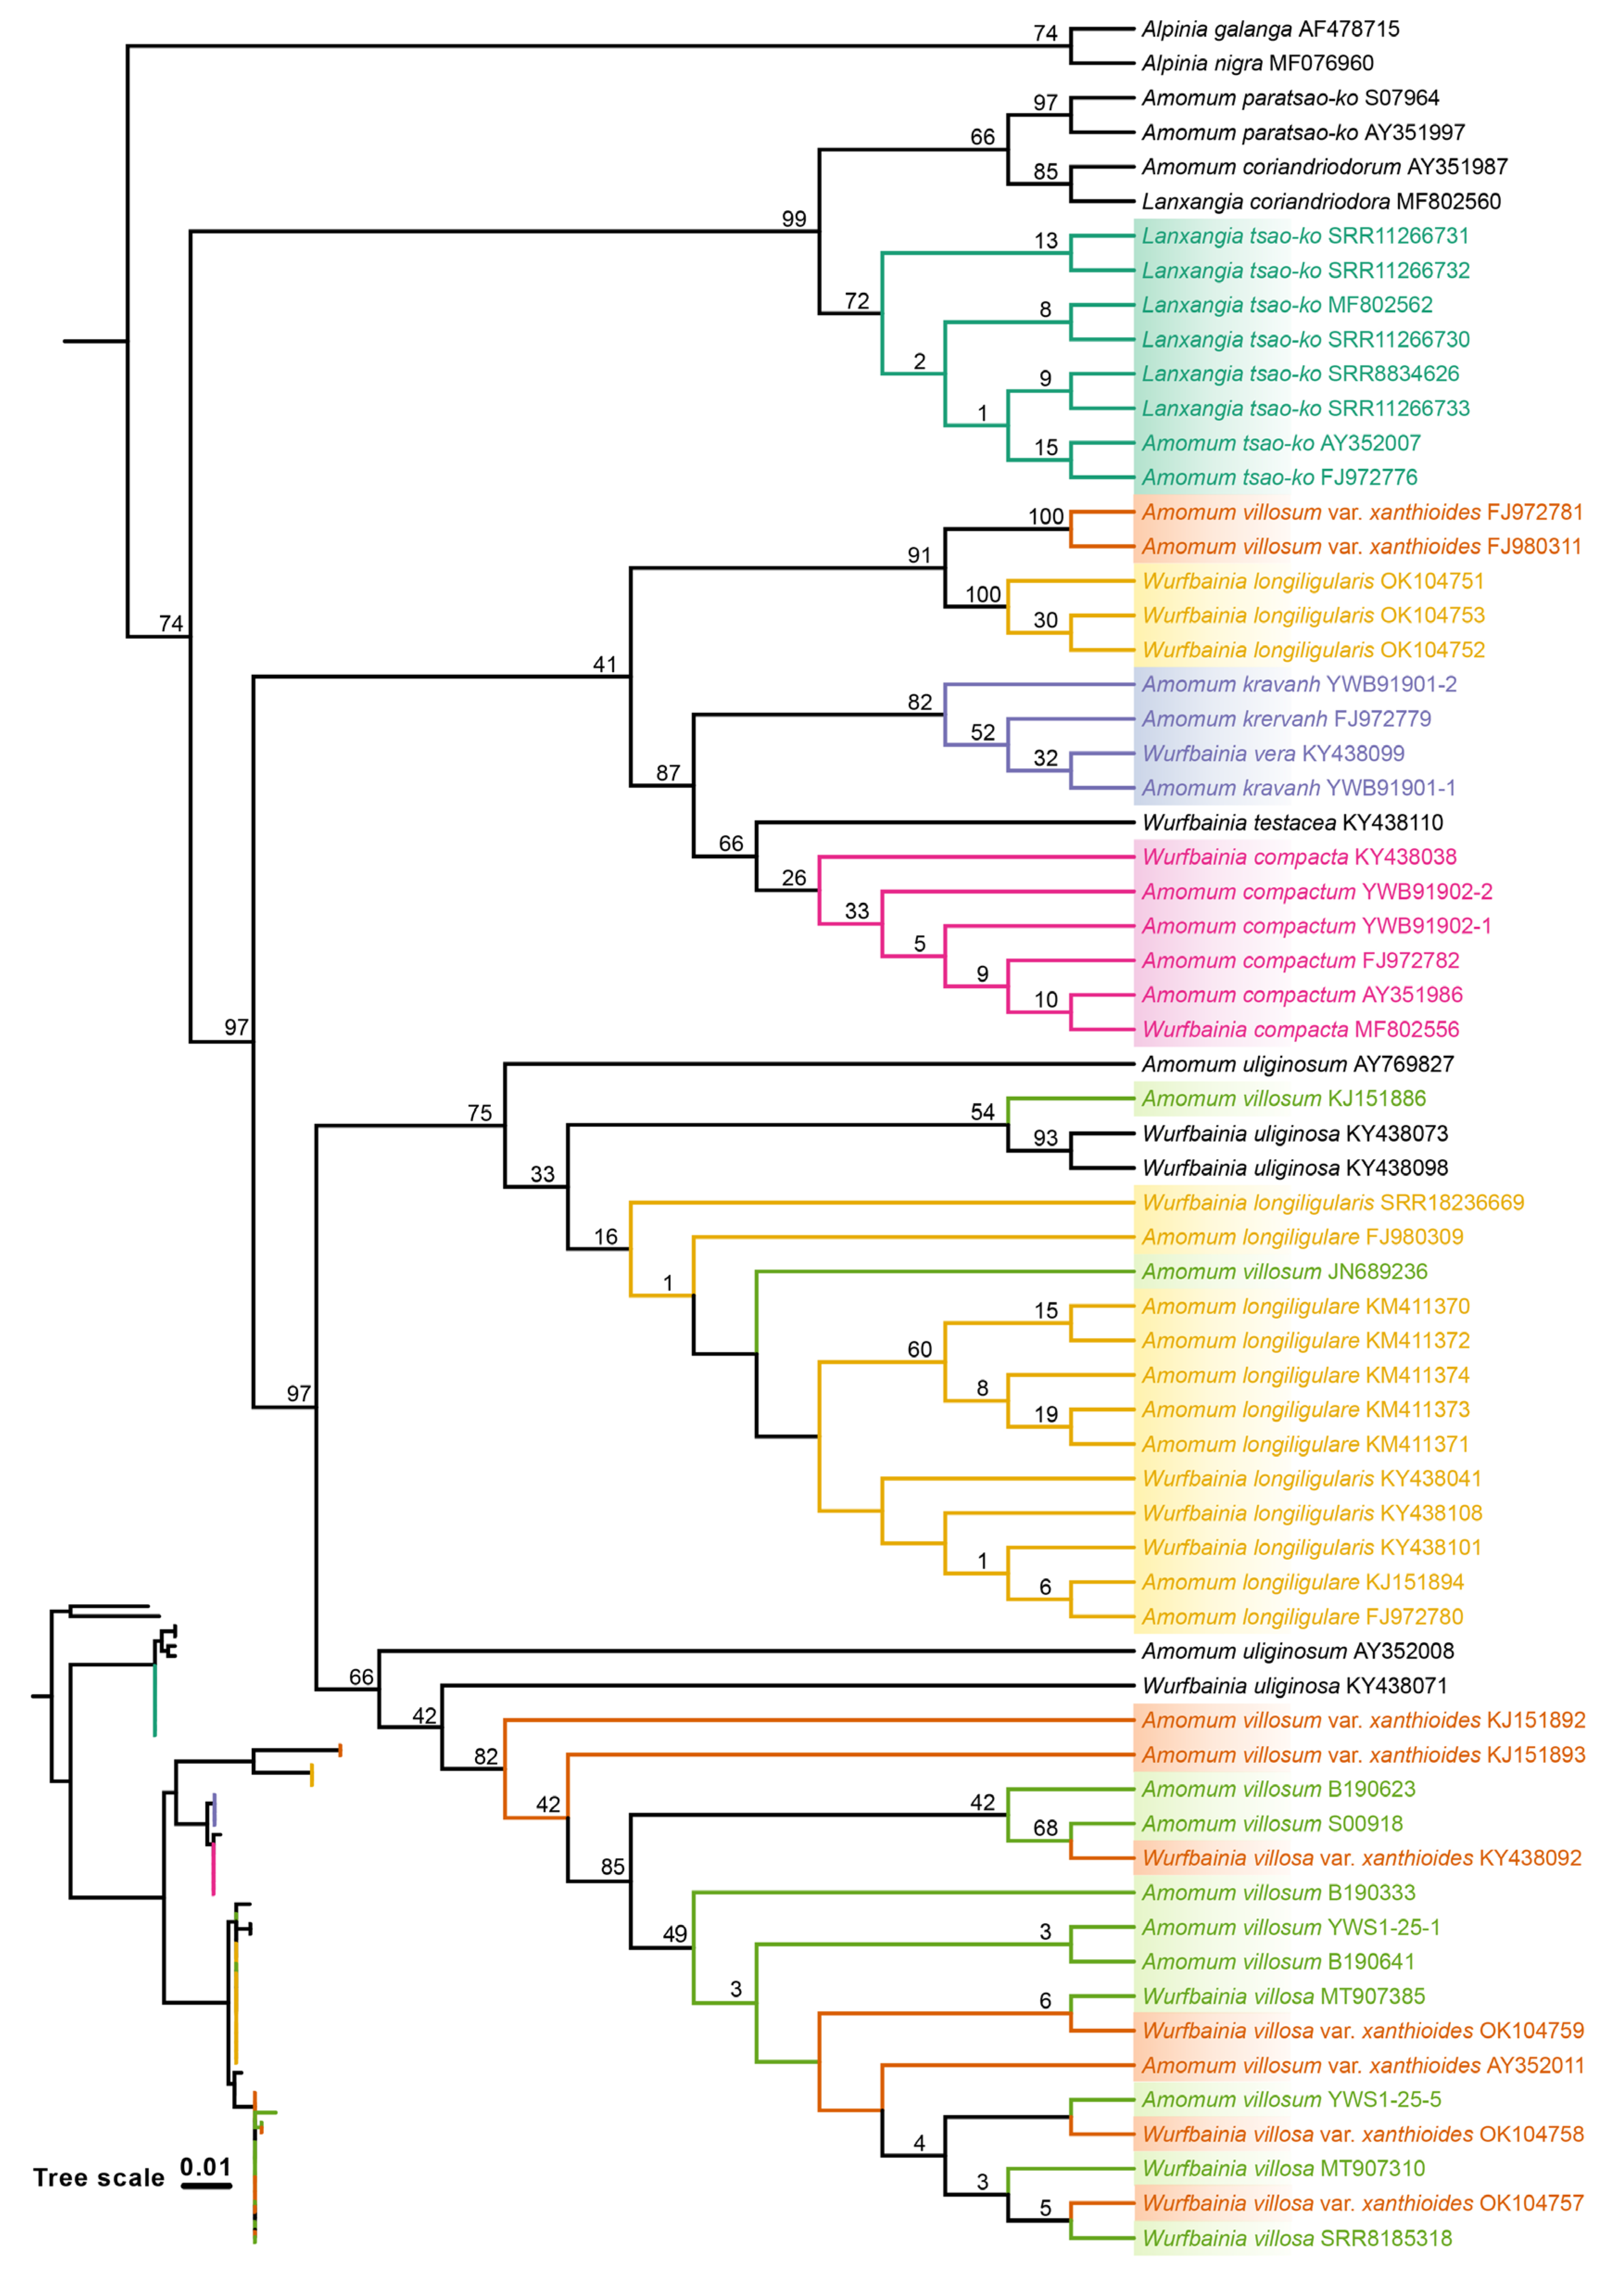
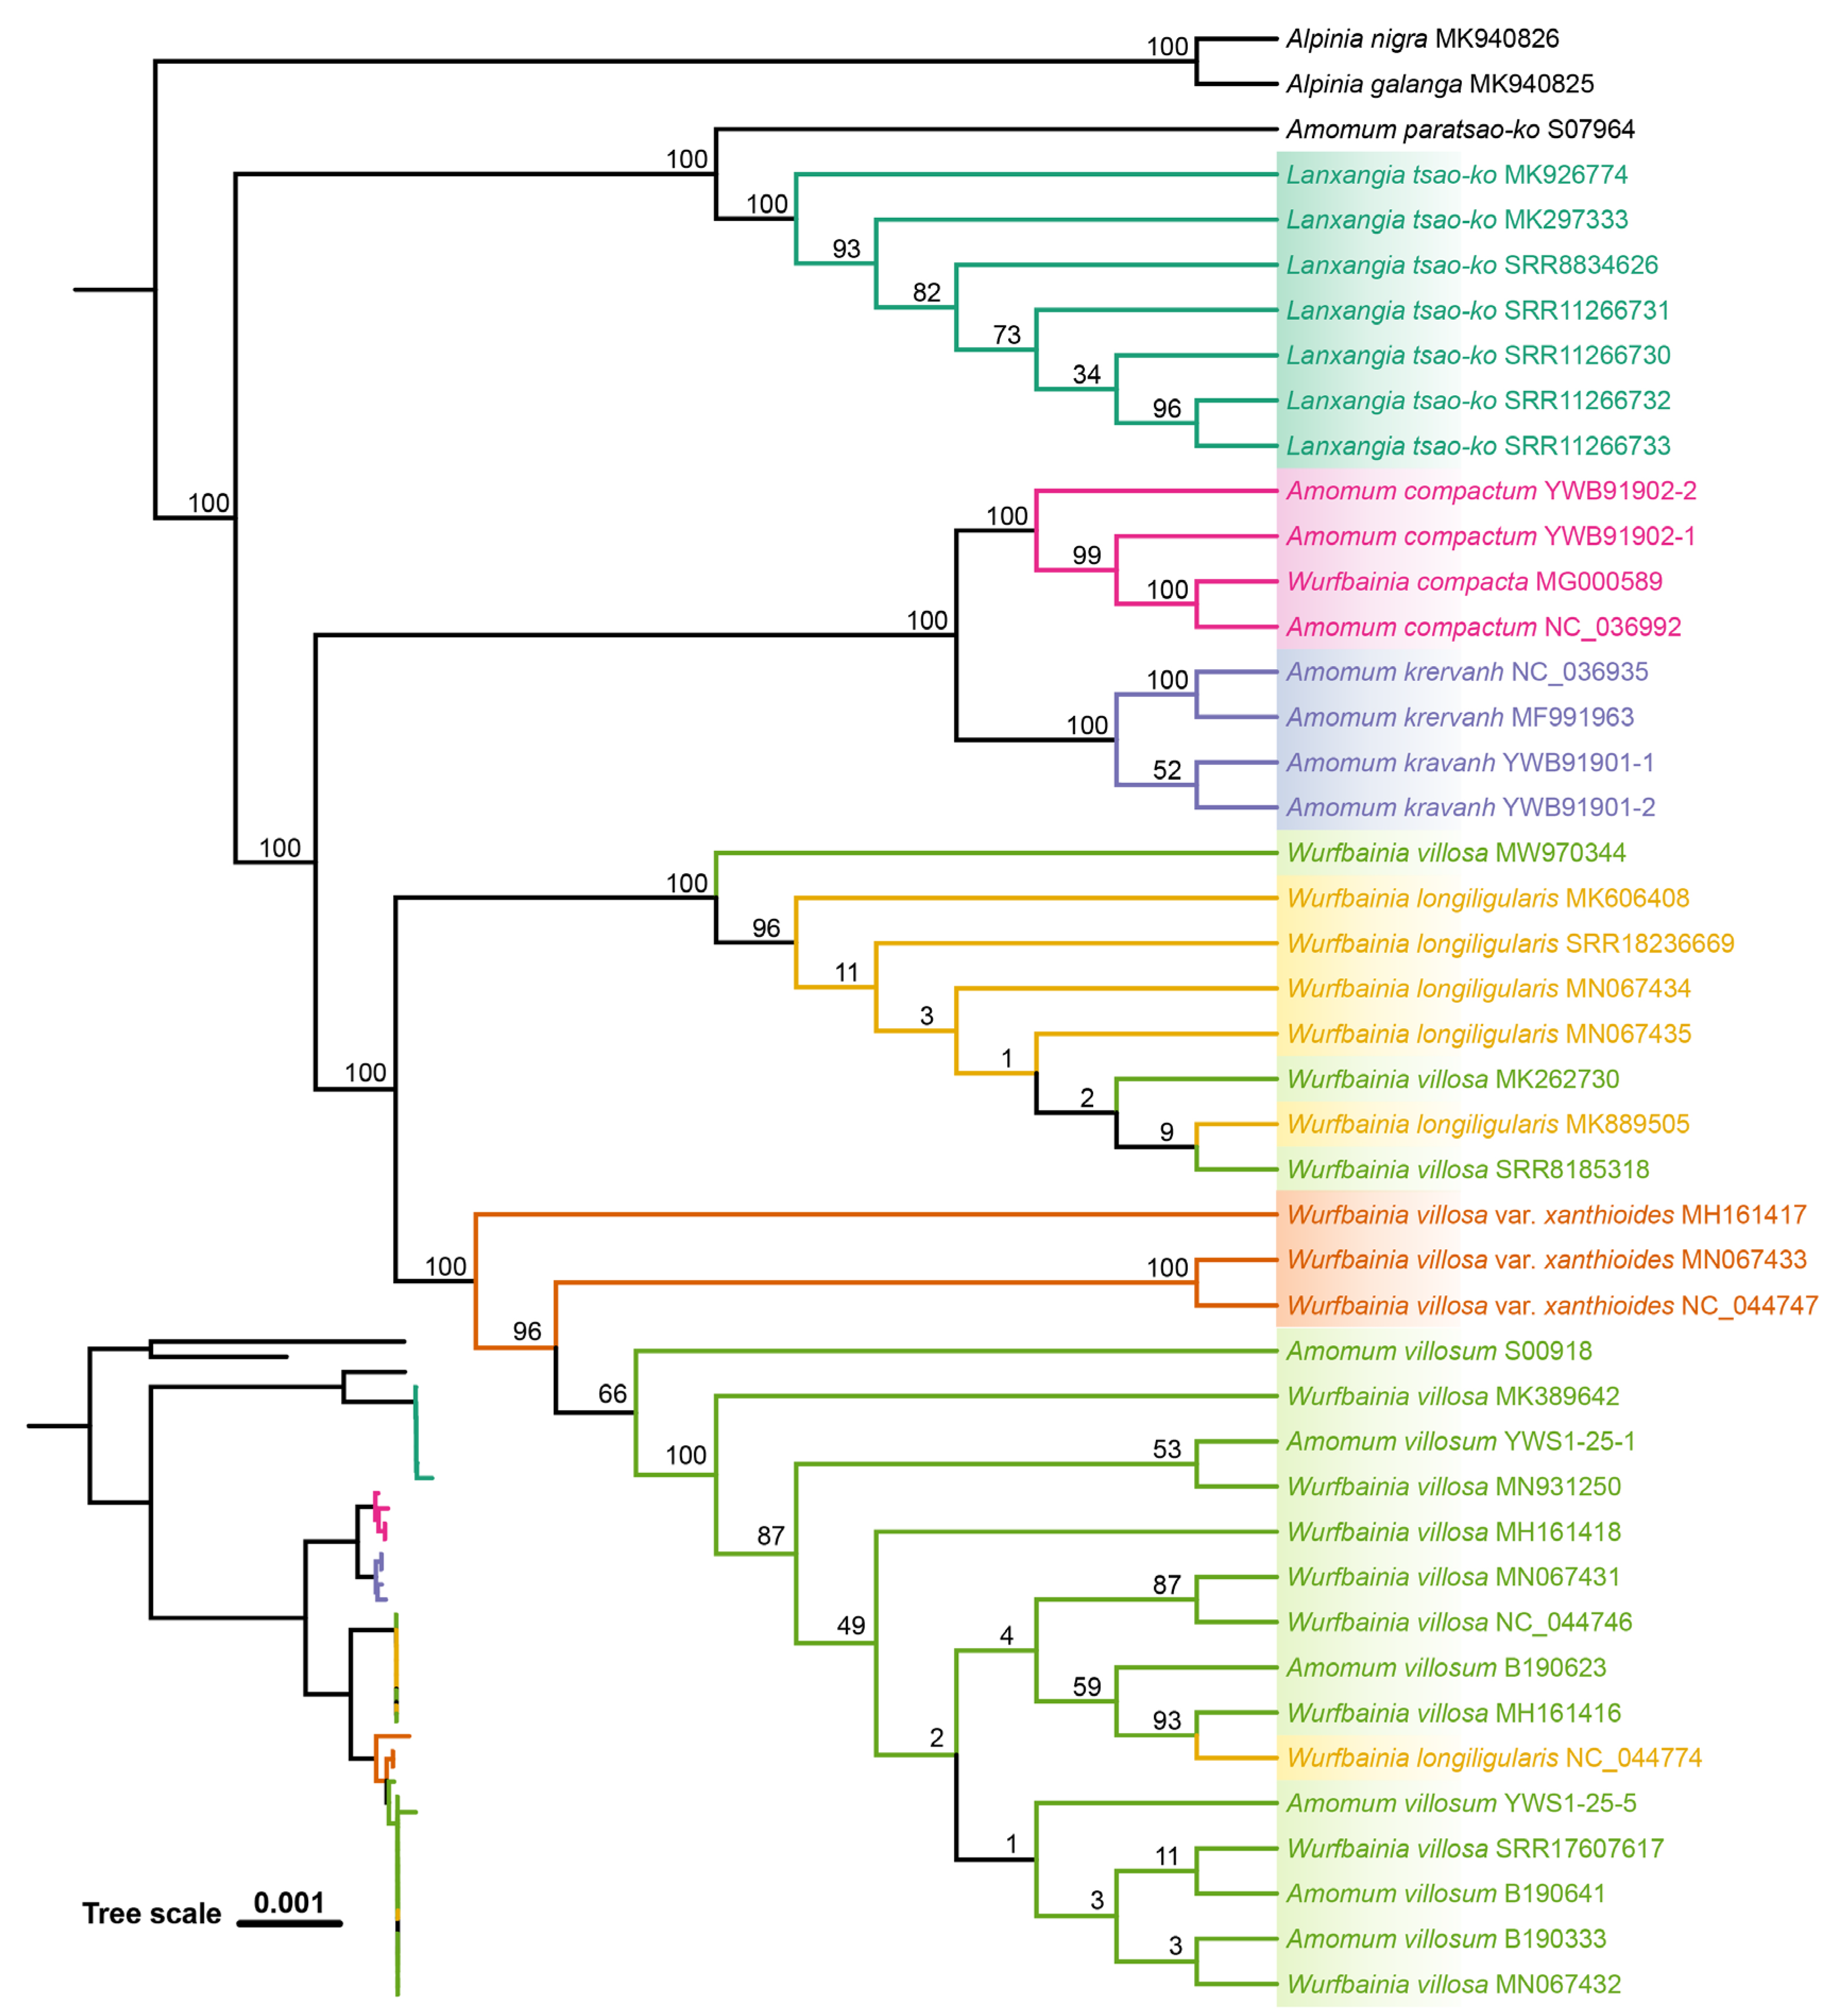
2.4. Tree based Species Discrimination
3. Discussion
3.1. Plastome Characteristics and DNA Barcodes Performance
3.2. Performance Comparison of Species Delimitation Methods
3.3. DNA Barcoding in Six Medicinal Plants within Amomum
3.4. Application of NCBI Database
3.5. ITS vs. ITS1
4. Materials and Methods
4.1. Taxon Sampling
4.2. DNA Extraction, Sequencing, Assembly and Annotation
4.3. Data Analysis
4.3.1. Plastome Structural Variation, Divergence, and Mutational Hotspot Analyses
4.3.2. Sequence-Based Analyses
4.3.3. Phylogenetic Tree-Based Analyses
5. Conclusions
Author Contributions
Funding
Data Availability Statement
Acknowledgments
References
- Bickford, D.; Lohman, D.J.; Sodhi, N.S.; Ng, P.K. L.; Meier, R.; Winker, K.; Ingram, K.K.; Das, I. Cryptic species as a window on diversity and conservation. Trends Ecol. Evol. 2006, 22, 148–155. [Google Scholar] [CrossRef] [PubMed]
- Gotelli, N.J.; Colwell, R.K. Quantifying biodiversity: procedures and pitfalls in the measurement and comparison of species richness. Ecol. Lett. 2001, 4, 379–391. [Google Scholar] [CrossRef]
- Soulé, M.E.; Wilcox, B.A. , Conservation biology. An evolutionary-ecological perspective. Addison-Wesle: London, U.K., 1980; pp. 395.
- Smith, K.F.; Behrens, M.; Schloegel, L.M.; Marano, N.; Burgiel, S.; Daszak, P. Reducing the risks of the wildlife trade. Science 2009, 324, 594–595. [Google Scholar] [CrossRef] [PubMed]
- Hebert, P.D.; Cywinska, A.; Ball, S.L.; DeWaard, J.R. Biological identifications through DNA barcodes. Proc. R. Soc. Lond. B Biol. Sci. 2003, 270, 313–321. [Google Scholar] [CrossRef] [PubMed]
- Linacre, A.; Gusmão, L.; Hecht, W.; Hellmann, A.P.; Mayr, W.R.; Parson, W.; Prinz, M.; Schneider, P.M.; Morling, N. ISFG: recommendations regarding the use of non-human (animal) DNA in forensic genetic investigations. Forensic Sci. Int.: Genet.
- Hebert, P.D.; Gregory, T.R. The promise of DNA barcoding for taxonomy. Syst. Biol. 2005, 54, 852–859. [Google Scholar] [CrossRef] [PubMed]
- Kress, W.J.; Erickson, D.L. A two-locus global DNA barcode for land plants: the coding rbcL gene complements the non-coding trnH-psbA spacer region. PLoS One 2007, 2, e508. [Google Scholar] [CrossRef] [PubMed]
- Ford, C.S.; Ayres, K.L.; Toomey, N.; Haider, N.; Van Alphen Stahl, J.; Kelly, L.J.; Wikström, N.; Hollingsworth, P.M.; Duff, R.J.; Hoot, S.B. Selection of candidate coding DNA barcoding regions for use on land plants. Bot. J. Linn. Soc. 2009, 159, 1–11. [Google Scholar] [CrossRef]
- Hollingsworth, P.M. F., L. L.; Spouge, J.L.; Hajibabaei, M.; Ratnasingham, S. A DNA barcode for land plants. Proc. Natl. Acad. Sci. U.S.A. 2009, 106, 12794–12797. [Google Scholar]
- Hollingsworth, P.M.; Graham, S.W.; Little, D.P. Choosing and using a plant DNA barcode. PLoS One 2011, 6, e19254. [Google Scholar] [CrossRef] [PubMed]
- Hebert, P.D.; Stoeckle, M.Y.; Zemlak, T.S.; Francis, C.M. Identification of birds through DNA barcodes. PLoS Biol. 2004, 2, e312. [Google Scholar] [CrossRef]
- Ward, R.D.; Holmes, B.H.; O’Hara, T.D. DNA barcoding discriminates echinoderm species. Mol. Ecol. Resour. 2008, 8, 1202–11. [Google Scholar] [CrossRef] [PubMed]
- Yoo, H.S.; Eah, J.; Kim, J.S.; Kim, Y.; Min, M.; Paek, W.K.; Lee, H.; Kim, C. DNA barcoding Korean birds. Mol. Cells 2006, 22, 323–327. [Google Scholar] [CrossRef] [PubMed]
- Kress, W.J.; Wurdack, K.J.; Zimmer, E.A.; Weigt, L.A.; Janzen, D.H. Use of DNA barcodes to identify flowering plants. Proc. Natl. Acad. Sci. U.S.A. 2005, 102, 8369–8374. [Google Scholar] [CrossRef] [PubMed]
- Kress, W.J.; Erickson, D.L.; Jones, F.A.; Swenson, N.G.; Perez, R.; Sanjur, O.; Bermingham, E. Plant DNA barcodes and a community phylogeny of a tropical forest dynamics plot in Panama. Proc. Natl. Acad. Sci. U.S.A. 2009, 106, 18621–18626. [Google Scholar] [CrossRef] [PubMed]
- Ford, C.S.; Ayres, K.L.; Toomey, N.; Haider, N.; Van Alphen Stahl, J.; Kelly, L.J.; Wikström, N.; Hollingsworth, P.M.; Duff, R.J.; Sarah, B. Hoot, R.S. C., Mark W. Chase, Mike J. Wilkinson. Selection of candidate coding DNA barcoding regions for use on land plants. Bot. J. Linn. Soc. 2009, 159, 1–11. [Google Scholar] [CrossRef]
- Hollingsworth, P.M.; Li, D.Z.; van der Bank, M.; Twyford, A. Telling plant species apart with DNA: from barcodes to genomes. Philos. Trans. R. Soc. Lond., B, Biol. Sci. 2015. [Google Scholar]
- Kane, N.C.; Cronk, Q. Botany without borders: barcoding in focus. Mol. Ecol. 2008, 17, 5175–5176. [Google Scholar] [CrossRef] [PubMed]
- von Cräutlein, M.; Korpelainen, H.; Pietiläinen, M.; Rikkinen, J. DNA barcoding: a tool for improved taxon identification and detection of species diversity. Biodivers. Conserv. 2011, 20, 373–389. [Google Scholar] [CrossRef]
- Vijayan, K.; Tsou, C.H. DNA barcoding in plants: taxonomy in a new perspective. Curr. Sci. 2010, 99, 1530–1541. [Google Scholar]
- Wang, H.; Kim, M.K.; Kwon, W.S.; Jin, H.; Liang, Z.; Yang, D.C. Molecular authentication of Panax ginseng and ginseng products using robust SNP markers in ribosomal external transcribed spacer region. J. Pharm. Biomed. Anal. 2011, 55, 972–976. [Google Scholar] [CrossRef]
- Vinitha, M.R.; Kumar, U.S.; Aishwarya, K.; Sabu, M.; Thomas, G. Prospects for discriminating Zingiberaceae species in India using DNA barcodes. J. Integr. Plant Biol. 2014, 56, 760–773. [Google Scholar] [CrossRef]
- Wang, H.; Kim, M.K.; Kim, Y.J.; Lee, H.N.; Jin, H.; Chen, J.; Yang, D.C. Molecular authentication of the oriental medicines Pericarpium Citri Reticulatae and Citri Unshius Pericarpium using SNP markers. Gene 2011, 494, 92–95. [Google Scholar] [CrossRef] [PubMed]
- JungHoon, K.J. K.; EuiJeong, D.E. D.; GuemSan, L.G. L. Evaluation of medicinal categorization of Atractylodes japonica Koidz. by using internal transcribed spacer sequencing analysis and HPLC fingerprinting combined with statistical tools. Evid. Based Complement. Alternat. Med. 2016, 2016. [Google Scholar]
- Mishra, P.; Kumar, A.; Nagireddy, A.; Mani, D.N.; Shukla, A.K.; Tiwari, R.; Sundaresan, V. DNA barcoding: an efficient tool to overcome authentication challenges in the herbal market. Plant Biotechnol. J. 2016, 14, 8–21. [Google Scholar] [CrossRef] [PubMed]
- Plants of the World Online Kew Science. https://powo.science.kew.org/taxon/urn:lsid:ipni.org:names:327296-2 (archived on 2024). 22 February.
- Xu, H.Z., <italic>Amomum</italic> Roxb. In <italic>Flora of China</italic>, Xu, H.Z., Ed. Science Press; Missouri Botanical Garden Press: Beijing, China; St. Louis, USA, 1981; Vol. 16, pp 110-135.
- Yao, J.Y., <italic>Amomum</italic> Roxb. In <italic>Flora of China</italic>, Yao, J.Y., Ed. Science Press; Missouri Botanical Garden Press: Beijing, China; St. Louis, USA, 2000; Vol. 24, pp 347–356.
- China Pharmacopoeia Commission, Pharmacopoeia of the People’s Republic of China: Part One. China Medical Science and Technology Press: Beijing, China, 2020; pp. 175–264.
- Plants of the World Online Kew Science. https://powo.science.kew.org/taxon/urn:lsid:ipni.org:names:795489-1 (archived on February 22 2024).
- iPlant. http://www.iplant.cn/info/Amomum%20krervanh (archived on February 22 2023).
- Plants of the World Online Kew Science. https://powo.science.kew.org/taxon/urn:lsid:ipni.org:names:77178294-1#synonyms (archived on February 22 2024).
- Plants of the World Online Kew Science. https://powo.science.kew.org/taxon/urn:lsid:ipni.org:names:77178281-1#synonyms (archived on February 22 2024).
- Plants of the World Online Kew Science. https://powo.science.kew.org/taxon/urn:lsid:ipni.org:names:872172-1 (archived on February 22 2024).
- Plants of the World Online Kew Science. https://powo.science.kew.org/taxon/urn:lsid:ipni.org:names:77178295-1#synonyms (archived on February 22 2024).
- Plants of the World Online Kew Science. https://powo.science.kew.org/taxon/urn:lsid:ipni.org:names:892796-1 (archived on February 22 2024).
- Alkandahri, M.Y.; Shafirany, M.Z.; Rusdin, A.; Agustina, L.S.; Pangaribuan, F.; Fitrianti, F.; Farhamzah; Kusumawati, A.H.; Sugiharta, S.; Arfania, M.; Mardiana, L.A. <italic>Amomum compactum</italic>: A review of pharmacological studies. Plant Cell Biotechnol. Mol. Biol. 2021, 22, 61–69. [Google Scholar]
- Diao, W.R.; Zhang, L.L.; Feng, S.S.; Xu, J.G. Chemical composition, antibacterial activity, and mechanism of action of the essential oil from Amomum kravanh. J. Food Prot. 2014, 77, 1740–1746. [Google Scholar] [CrossRef] [PubMed]
- Thinh, B.B.; Chac, L.D.; Hanh, D.H.; Korneeva, A.A.; Hung, N.; Igoli, J.O. Effect of extraction method on yield, chemical composition and antimicrobial activity of essential oil from the fruits of Amomum villosum var. xanthioides . J. Essent. Oil-Bear. Plants 2022, 25, 25–25. [Google Scholar]
- Chau, L.T. M.; Thang, T.D.; Huong, L.T.; Ogunwande, I.A. Constituents of Essential Oils from Amomum longiligulare from Vietnam. Chem. Nat. Compd. 2015, 51, 1181–1183. [Google Scholar] [CrossRef]
- Cho, J.H.; Lee, J.S.; Kim, H.G.; Lee, H.W.; Fang, Z.; Kwon, H.H.; Kim, D.W.; Lee, C.M.; Jeong, J.W. Ethyl acetate fraction of Amomum villosum var. xanthioides attenuates hepatic endoplasmic reticulum stress-induced non-alcoholic steatohepatitis via improvement of antioxidant capacities. Antioxidants.
- Moon, S.S.; Lee, J.Y.; Cho, S.C. Isotsaokoin, an antifungal agent from Amomum tsao-ko. J. Nat. Prod. 2004, 67, 889–891. [Google Scholar] [CrossRef] [PubMed]
- Martin, T.S.; Kikuzaki, H.; Hisamoto, M.; Nakatani, N. Constituents of Amomum tsao-ko and their radical scavenging and antioxidant activities. J. Am. Oil Chem. Soc. 2000, 77, 667–673. [Google Scholar] [CrossRef]
- Hu, Y.; Gao, X.; Zhao, Y.; Liu, S.; Luo, K.; Fu, X.; Li, J.; Sheng, J.; Tian, Y.; Fan, Y. Flavonoids in Amomum tsaoko crevost et lemarie ameliorate loperamide-induced constipation in mice by regulating gut microbiota and related metabolites. Int. J. Mol. Sci. 2023, 24. [Google Scholar] [CrossRef]
- Yue, J.; Zhang, S.; Zheng, B.; Raza, F.; Luo, Z.; Li, X.; Zhang, Y.; Nie, Q.; Qiu, M. Efficacy and mechanism of active fractions in fruit of Amomum villosum Lour. for gastric cancer. J. Cancer 2021, 12, 5991–5998. [Google Scholar] [CrossRef] [PubMed]
- Zhang, D.; Li, S.; Xiong, Q.; Jiang, C.; Lai, X. Extraction, characterization and biological activities of polysaccharides from Amomum villosum. Carbohydr. Polym. 2013, 95, 114–122. [Google Scholar] [CrossRef] [PubMed]
- Chen, Z.; Ni, W.; Yang, C.; Zhang, T.; Lu, S.; Zhao, R.; Mao, X.; Yu, J. Therapeutic effect of Amomum villosum on inflammatory bowel disease in rats. Front. Pharmacol. 2018, 9. [Google Scholar] [CrossRef]
- Li, Q.X.; Gao, G.; Ye, K.X.; Liu, J.Y.; Huang, B.Z.; Wang, A.K.; Wang, X.; Yang, G.R. Evaluation on feeding value of stems and leaves in fructus amomi. Anim. Husb. Vet. Med. 2016, 48, 61–63. [Google Scholar]
- Selvaraj, D.; Shanmughanandhan, D.; Sarma, R.K.; Joseph, J.C.; Srinivasan, R.V.; Ramalingam, S. DNA barcode its effectively distinguishes the medicinal plant Boerhavia diffusa from its adulterants. Genomics Proteomics Bioinformatics 2012, 10, 364–367. [Google Scholar] [CrossRef] [PubMed]
- Chen, S.; Yao, H.; Han, J.; Liu, C.; Song, J.; Shi, L.; Zhu, Y.; Ma, X.; Gao, T.; Pang, X. Validation of the ITS2 region as a novel DNA barcode for identifying medicinal plant species. PLoS One 2010, 5, e8613. [Google Scholar] [CrossRef] [PubMed]
- Youngbae, S.; Kim, S.; Park, C.W. A phylogenetic study of Polygonum sect. Tovara (Polygonaceae) based on ITS sequences of nuclear ribosomal DNA. J. Plant Biol.
- Yao, H.; Song, J.Y.; Ma, X.Y.; Liu, C.; Li, Y.; Xu, H.X.; Han, J.P.; Duan, L.S.; Chen, S.L. Identification of Dendrobium species by a candidate DNA barcode sequence: the chloroplast psbA-trnH intergenic region. Planta Med. 2009, 75, 667–669. [Google Scholar] [CrossRef] [PubMed]
- Nagaraj, S.; Girenahalli, R.; Tavareakere Venkataravanappa, J.; Kumar, P.; Subbarayappa, K.; Nanjappa, L. DNA based identification of species of Zingiberaceae family plants using Bar-Hrm analysis. Int. J. Res. Anal. Rev. 2019, 6, 289–294. [Google Scholar]
- Cui, Y.; Chen, X.; Nie, L.; Sun, W.; Hu, H.; Lin, Y.; Li, H.; Zheng, X.; Song, J.; Yao, H. Comparison and phylogenetic analysis of chloroplast genomes of three medicinal and edible Amomum species. Int. J. Mol. Sci. 2019, 20. [Google Scholar] [CrossRef]
- HU, Y.F. DNA barcoding sequence analysis of Amomum tsao-ko germplasm resources in Yunnan province. Chin. Tradit. Herb. Drugs 2019, 6091–6097. [Google Scholar]
- Hu, Y.F.; Zhang, X.M.; Shi, N.X.; Yang, Z.Q. DNA barcoding sequence analysis of Amomum tsao-ko germplasm resources in Yunnan province. Chin. Tradit. Herb. Drugs 2019, 50, 6091–6097. [Google Scholar]
- Doh, E.J.; Kim, J.H.; Lee, G. Identification and monitoring of Amomi fructus and its adulterants based on DNA barcoding analysis and designed DNA markers. Molecules 2019, 24. [Google Scholar] [CrossRef]
- Sone, M.; Zhu, S.; Cheng, X.; Ketphanh, S.; Swe, S.; Tun, T.L.; Kawano, N.; Kawahara, N.; Komatsu, K. Genetic diversity of Amomum xanthioides and its related species from Southeast Asia and China. J. Nat. Med. 2021, 75, 798–812. [Google Scholar] [CrossRef]
- Pan, H.; Huang, F.; Wang, P.; Zhou, L.; Cao, L.; Liang, R. Identification of Amomum villosum, Amomum villosum var. xanthioides and Amomum longiligulare by ITS-1 sequencing. J. Chin. Med. Mater.
- Shi, L.; Song, J.; Chen, S.; Yao, H.; Han, J. Identification of Amomum (Zingiberaceae) through DNA Barcodes. World Sci. Techno. Mod. Tradit. Chin. Med. 2010, 12, 473–479. [Google Scholar]
- Han, J.P.; Li, M.N.; Shi, L.C.; Yao, H.; Song, J.Y. ITS2 sequence identification of cardamom and its adulterants. Global Tradit. Chin. Med. 2011, 4, 99–102. [Google Scholar]
- Gong, L.; Ding, X.; Guan, W.; Zhang, D.; Zhang, J.; Bai, J.; Xu, W.; Huang, J.; Qiu, X.; Zheng, X.; Zhang, D.; Li, S.; Huang, Z.; Su, H. Comparative chloroplast genome analyses of Amomum: insights into evolutionary history and species identification. BMC Plant Biol. 2022, 22. [Google Scholar] [CrossRef]
- Li, D.M.; Li, J.; Wang, D.R.; Xu, Y.C.; Zhu, G.F. Molecular evolution of chloroplast genomes in subfamily Zingiberoideae (Zingiberaceae). BMC Plant Biol. 2021, 21, 1–24. [Google Scholar] [CrossRef] [PubMed]
- Jiang, D.Z.; Cai, X.D.; Gong, M.; Xia, M.Q.; Xing, H.T.; Dong, S.S.; Tian, S.M.; Li, J.L.; Lin, J.Y.; Liu, Y.Q. Complete chloroplast genomes provide insights into evolution and phylogeny of Zingiber (Zingiberaceae). BMC Genom. 2023, 24, 30. [Google Scholar]
- Liang, H.; Zhang, Y.; Deng, J.B.; Gao, G.; Ding, C.B.; Zhang, L.; Yang, R.W. The complete chloroplast genome sequences of 14 Curcuma species: insights into genome evolution and phylogenetic relationships within Zingiberales. Front. Genet. 2020, 11, 802. [Google Scholar] [CrossRef]
- Amenu, S.G.; Wei, N.; Wu, L.; Oyebanji, O.; Hu, G.W.; Zhou, Y.D.; Wang, Q. Phylogenomic and comparative analyses of Coffeeae alliance (Rubiaceae): deep insights into phylogenetic relationships and plastome evolution. BMC Plant Biol. 2022, 22, 88. [Google Scholar] [CrossRef]
- Yang, Q.; Fu, G.F.; Wu, Z.Q.; Li, L.; Zhao, J.L.; Li, Q.J. Chloroplast genome evolution in four montane Zingiberaceae taxa in China. Frontiers in Plant Science 2022, 12, 774482. [Google Scholar] [CrossRef] [PubMed]
- Li, D.M.; Zhu, G.F.; Xu, Y.C.; Ye, Y.J.; Liu, J.M. Complete chloroplast genomes of three medicinal Alpinia species: genome organization, comparative analyses and phylogenetic relationships in family Zingiberaceae. Plants 2020, 9, 286. [Google Scholar] [CrossRef] [PubMed]
- Liu, J.; Milne, R.I.; Mö, *!!! REPLACE !!!*; ller, M.; Zhu, G.F.; Ye, L.J.; Luo, Y.H.; Yang, J.B.; Wambulwa, M.C.; Wang, C.N.; Li, D.Z. Integrating a comprehensive DNA barcode reference library with a global map of yews (<italic>Taxus</italic> L.) for forensic identification. Mol. Ecol. Resour. 2018, 18, 1115–1115. [Google Scholar]
- Magoga, G.; Fontaneto, D.; Montagna, M. Factors affecting the efficiency of molecular species delimitation in a species-rich insect family. Mol. Ecol. Resour. 2021, 21, 1475–1489. [Google Scholar] [CrossRef] [PubMed]
- Zhang, L.; Huang, Y.W.; Huang, J.L.; Ya, J.D.; Zhe, M.Q.; Zeng, C.X.; Zhang, Z.R.; Zhang, S.B.; Li, D.Z.; Li, H.T. DNA barcoding of Cymbidium by genome skimming: call for next-generation nuclear barcodes. Mol. Ecol. Resour. 2023, 23, 424–439. [Google Scholar] [CrossRef]
- Yang, Z.Y.; Zhang, L. Screening potential DNA barcode regions in Amomum (Zingiberaceae). Acta Bot. Yunnanica 2010, 32, 393–400. [Google Scholar]
- Segersäll, M. DNA barcoding of commercialized plants; an examination of Amomum (Zingiberaceae) in South-East Asia. Uppsala University, Sweden, 2011.
- Leung, F.C. C.; Huang, Q.; Duan, Z.; Yang, J.; Ma, X.; Zhan, R.; Xu, H.; Chen, W. SNP typing for germplasm identification of Amomum villosum Lour. based on DNA barcoding markers. PLoS One 2014, 9. [Google Scholar]
- Gong, L.; Zhang, D.; Ding, X.; Huang, J.; Guan, W.; Qiu, X.; Huang, Z. DNA barcode reference library construction and genetic diversity and structure analysis of <italic>Amomum villosum</italic> Lour. (Zingiberaceae) populations in Guangdong province. PeerJ 2021, 9. [Google Scholar]
- Zhai, E.A.; Mi, W.J.; Cui, Y.; Hong, W.F.; Wang, Y.S.; Guo, X.Y.; Zou, H.Q.; Yan, Y.H. Comparative study of morphological identification and DNA barcoding for the authentication of medicinal Fructus Amomi. China J. Chin. Mater. Med. 2022, 47, 4600–4608. [Google Scholar]
- Kuroiwa, T.; Kawano, S.; Nishibayashi, S.; Sato, C. Epifluorescent microscopic evidence for maternal inheritance of chloroplast DNA. Nature 1982, 298, 481–483. [Google Scholar] [CrossRef]
- Smith, S.E. , Plant Breeding Reviews. Timber Press: Portland, Oregon, USA, 1989; Vol. 6.
- Wiemers, M.; Fiedler, K. Does the DNA barcoding gap exist? –a case study in blue butterflies (Lepidoptera: Lycaenidae). Front. Zool. 2007, 4, 1–16. [Google Scholar] [CrossRef]
- Wheeler, D.L.; Barrett, T.; Benson, D.A.; Bryant, S.H.; Canese, K.; Chetvernin, V.; Church, D.M.; DiCuccio, M.; Edgar, R.; Federhen, S. Database resources of the national center for biotechnology information. Nucleic Acids Res. 2007, 35, D5–D12. [Google Scholar] [CrossRef]
- Schoch, C.L.; Seifert, K.A.; Huhndorf, S.; Robert, V.; Spouge, J.L.; Levesque, C.A.; Chen, W. ; Fungal Barcoding Consortium. Nuclear ribosomal internal transcribed spacer (ITS) region as a universal DNA barcode marker for Fungi. Proc. Natl. Acad. Sci. U.S.A. 2012, 109, 6241–6241. [Google Scholar] [CrossRef] [PubMed]
- China Plant BOL Group, 1; Li, D.Z.; Gao, L.M.; Li, H.T.; Wang, H.; Ge, X.J.; Liu, J.Q.; Chen, Z.D.; Zhou, S.L.; Chen, S.L. 83. China Plant BOL Group 1; Li, D.Z.; Gao, L.M.; Li, H.T.; Wang, H.; Ge, X.J.; Liu, J.Q.; Chen, Z.D.; Zhou, S.L.; Chen, S.L. Comparative analysis of a large dataset indicates that internal transcribed spacer (ITS) should be incorporated into the core barcode for seed plants. Proc. Natl. Acad. Sci. U.S.A. 2011, 108, 19641–19646. [Google Scholar]
- Wang, X.C.; Liu, C.; Huang, L.; Bengtsson-Palme, J.; Chen, H.; Zhang, J.H.; Cai, D.; Li, J.Q. ITS1: a DNA barcode better than ITS2 in eukaryotes? Mol. Ecol. Resour. 2015, 15, 573–586. [Google Scholar] [CrossRef]
- Blaalid, R.; Kumar, S.; Nilsson, R.H.; Abarenkov, K.; Kirk, P.; Kauserud, H. ITS 1 versus ITS 2 as DNA metabarcodes for fungi. Mol. Ecol. Resour. 2013, 13, 218–224. [Google Scholar] [CrossRef] [PubMed]
- Boer, H. d.; Newman, M.; Poulsen, A.D.; Droop, A.J.; Fér, T.; Thu Hiền, L.T.; Hlavatá, K.; Lamxay, V.; Richardson, J.E.; Steffen, K.; Leong-Škorničková, J. Convergent morphology in Alpinieae (Zingiberaceae): Recircumscribing Amomum as a monophyletic genus. Taxon 2018, 67, 6–36. [Google Scholar] [CrossRef]
- Doyle, J.J.; Doyle, J.L. A rapid DNA isolation procedure for small quantities of fresh leaf tissue. Phytochem. Bull. 1987, 19, 11–15. [Google Scholar]
- Jin, J.J.; Yu, W.B.; Yang, J.B.; Song, Y.; DePamphilis, C.W.; Yi, T.S.; Li, D.Z. GetOrganelle: a fast and versatile toolkit for accurate de novo assembly of organelle genomes. Genome Biol. 2020, 21, 1–31. [Google Scholar] [CrossRef]
- Kearse, M.; Moir, R.; Wilson, A.; Stones-Havas, S.; Cheung, M.; Sturrock, S.; Buxton, S.; Cooper, A.; Markowitz, S.; Duran, C.; Thierer, T.; Ashton, B.; Meintjes, P.; Drummond, A. Geneious Basic: an integrated and extendable desktop software platform for the organization and analysis of sequence data. Bioinformatics 2012, 28, 1647–1649. [Google Scholar] [CrossRef]
- Li, R.Z.; Cai, J.; Yang, J.B.; Zhang, Z.R.; Li, D.Z.; Yu, W.B. Plastid phylogenomics resolving phylogenetic placement and genera phylogeny of Sterculioideae (Malvaceae s. l.). Guihaia 2022, 42, 42–38. [Google Scholar]
- Wick, R.R.; Schultz, M.B.; Zobel, J.; Holt, K.E. Bandage: interactive visualization of de novo genome assemblies. Bioinformatics 2015, 31, 3350–3352. [Google Scholar] [CrossRef]
- Amiryousefi, A.; Hyvönen, J.; Poczai, P. IRscope: an online program to visualize the junction sites of chloroplast genomes. Bioinformatics 2018, 34, 3030–3031. [Google Scholar] [CrossRef] [PubMed]
- Librado, P.; Rozas, J. DnaSP v5: a software for comprehensive analysis of DNA polymorphism data. Bioinformatics 2009, 25, 1451–1452. [Google Scholar] [CrossRef]
- Lohse, M.; Drechsel, O.; OrganellarGenomeDRAW, R.B. A tool for the easy generation of high-quality custom graphical maps of plastid and mitochondrial genomes. Curr. Genet. 2007, 52, 267–274. [Google Scholar] [CrossRef]
- Čandek, K.; Kuntner, M. DNA barcoding gap: reliable species identification over morphological and geographical scales. Mol. Ecol. Resour. 2015, 15, 268–277. [Google Scholar] [CrossRef] [PubMed]
- Puillandre, N.; Lambert, A.; Brouillet, S.; Achaz, G. ABGD, Automatic Barcode Gap Discovery for primary species delimitation. Mol. Ecol. 2012, 21, 1864–1877. [Google Scholar] [CrossRef]
- Kumar, S.; Stecher, G.; Li, M.; Knyaz, C.; Tamura, K. MEGA X: molecular evolutionary genetics analysis across computing platforms. Mol. Biol. Evol. 2018, 35, 1547. [Google Scholar] [CrossRef]
- Collins, R.; Cruickshank, R. The seven deadly sins of DNA barcoding. Mol. Ecol. Resour. 2013, 13, 969–975. [Google Scholar] [CrossRef] [PubMed]
- Stamatakis, A. RAxML version 8: a tool for phylogenetic analysis and post-analysis of large phylogenies. Bioinformatics 2014, 30, 1312–1313. [Google Scholar] [CrossRef] [PubMed]
- Ronquist, F.; Teslenko, M.; van der Mark, P.; Ayres, D.L.; Darling, A.; Hohna, S.; Larget, B.; Liu, L.; Suchard, M.A.; Huelsenbeck, J.P. MrBayes 3.2: efficient Bayesian phylogenetic inference and model choice across a large model space. Syst. Biol. 2012, 61, 539–542. [Google Scholar] [CrossRef]
- Posada, D. jModelTest: phylogenetic model averaging. Mol. Biol. Evol. 2008, 25, 1253–1256. [Google Scholar] [CrossRef]
- Xie, J.; Chen, Y.; Cai, G.; Cai, R.; Hu, Z.; Wang, H. Tree Visualization By One Table (tvBOT): a web application for visualizing, modifying and annotating phylogenetic trees. Nucleic Acids Res. 2023, 51, W587–W592. [Google Scholar] [CrossRef]
| Dataset | No. of samples | Aligned length (bp) | No. of variable sites (% divergence) | No. of parsimony informative sites (% divergence) | GC content (%) | No. of conserved sites (% divergence) | No. of singleton sites (% divergence) |
|---|---|---|---|---|---|---|---|
| ITS | 65 | 609 | 164 (26.9) | 120 (19.7) | 56.2 | 422 (69.3) | 42 (6.9) |
| ITS1 | 65 | 194 | 70 (36.1) | 59 (30.4) | 56.5 | 111 (57.2) | 11 (5.7) |
| ITS2 | 65 | 222 | 83 (37.4) | 58 (26.1) | 60.1 | 130 (58.6) | 23 (10.4) |
| Complete plastomes | 44 | 168519 | 5299 (3.1) | 3280 (1.9) | 36.1 | 161202 (95.7) | 1980 (1.2) |
| matK | 82 | 716 | 44 (6.1) | 28 (3.9) | 28.7 | 672 (93.9) | 16 (2.2) |
| rbcL | 61 | 490 | 12 (2.4) | 9 (1.8) | 43.2 | 478 (97.6) | 3 (0.6) |
| psbA-trnH | 66 | 804 | 65 (8.1) | 35 (4.4) | 29.2 | 690 (85.8) | 30 (3.7) |
| Sample number | Species | Country | Province | Region | County | GenBank accession numbers for each DNA region | |
|---|---|---|---|---|---|---|---|
| ITS/ITS1/ITS2 | CP/matK/rbcL/psbA-trnH | ||||||
| YWB91902-1 | Amomum compactum | China | Yunnan | Xishuangbanna Dai Autonomous Prefecture | Mengla County | OR801269 | PP826179 |
| YWB91902-2 | Amomum compactum | China | Yunnan | Xishuangbanna Dai Autonomous Prefecture | Mengla County | OR801270 | PP826180 |
| YWB91901-1 | Amomum kravanh | China | Yunnan | Xishuangbanna Dai Autonomous Prefecture | Mengla County | OR801267 | PP826177 |
| YWB91901-2 | Amomum kravanh | China | Yunnan | Xishuangbanna Dai Autonomous Prefecture | Mengla County | OR801268 | PP826178 |
| S07964 | Amomum paratsao-ko | China | Yunnan | Honghe Hani and Yi Autonomous Prefecture | Yuanyang County | OR801266 | PP826176 |
| S00918 | Amomum villosum | China | Guangxi | Fangchengang City | Shangsi County | OR801265 | PP826175 |
| B190333 | Amomum villosum | China | Yunnan | Kunming City | Xishan District | OR801256 | PP826171 |
| B190623 | Amomum villosum | China | Yunnan | Kunming City | Xishan District | OR801257 | PP826172 |
| B190641 | Amomum villosum | China | Yunnan | Kunming City | Xishan District | OR801258 | PP826173 |
| YWS1-25-1 | Amomum villosum | – | – | – | – | OR801271 | PP826181 |
| YWS1-25-5 | Amomum villosum | – | – | – | – | OR801272 | PP853448 |
Disclaimer/Publisher’s Note: The statements, opinions and data contained in all publications are solely those of the individual author(s) and contributor(s) and not of MDPI and/or the editor(s). MDPI and/or the editor(s) disclaim responsibility for any injury to people or property resulting from any ideas, methods, instructions or products referred to in the content. |
© 2024 by the authors. Licensee MDPI, Basel, Switzerland. This article is an open access article distributed under the terms and conditions of the Creative Commons Attribution (CC BY) license (http://creativecommons.org/licenses/by/4.0/).


