1. Introduction
Under the influence of the pandemic, hospitals worldwide are facing unprecedented challenges in resource management, including outpatient doctors, nurses, and ambulances. In pre-pandemic healthcare systems, hospital managements struggled with demand uncertainties as they typically had to plan their resources months in advance. Doctors needed to be recruited ahead of time, and medicines and medical equipment had to be deployed well before patients required treatment. During the pandemic, saturated hospitals in most countries, whether public or private, have struggled to serve patients on time. The consequences of resource mismatches can lead to untreated patients and delayed hospital admissions. Overall, healthcare significantly contributes to sustainable economic growth, alongside other essential government spending areas such as technology and infrastructure. Some believe that efforts to improve healthcare can significantly impact an individual’s likelihood of success, studies have shown a positive relationship between healthcare spending and GDP in OECD countries[
1,
2].
In this paper, we aim to address one of the problems facing hospitals in outpatient clinics. Hospital resource planning is crucial for outpatients. Typically, managers must decide how many doctors should be available for outpatient clinics and how many nurses should assist. They also determine the number of rooms available for treatment. The overall efficiency and profitability of clinics largely depend on how accurately managers match patient appointments with the number of doctors assigned. However, patients often change their plans at the last minute or cancel their appointments, creating challenges for managers in dealing with appointment demand uncertainties, which can result in idle doctors or untreated patients. One solution is overbooking, commonly used in industries with a high number of no-shows and replenishable products, such as the aviation industry. Nevertheless, existing overbooking methods with deterministic approaches impose restrictions on the assumptions about parameter distributions. Therefore, we propose an alternative method to manage no-shows and cancellations in healthcare systems.
2. Background
Gupta & Denton[
3] investigated the primary issues related to the operational design and patient appointment systems for Ambulatory Care Center services. They considered complex factors and various processes to develop an optimisation model aimed at minimising the costs of waiting, tardiness, and idling. In other words, when all factors are incorporated, revenue and profit can be maximised. The model addresses three types of arrival patterns: Periodic Process, Unit Process, and Single Batch Process, which define how patients arrive within a specific timeframe. This model can be applied to groups, clusters, or individuals. In our study, we have considered additional factors beyond those incorporated by Gupta and Denton, including the cost of error, which is a significant issue in Hong Kong.
Stanciu, Vargas and May[
4] addressed the problems of revenue management in operating theatres using a modified version of Lobaba’s famous EMSRb algorithm. Their main objective was to determine the optimal levels of various patients for different services. For a particular timeframe, the model calculates the time required to meet the demand based on the type of surgical procedure and patient reimbursement. This model addresses issues that previous models scarcely managed to resolve. Penalties were added to identify the cost of surgical errors, which degrade service quality and prolong medical care. These penalties can be realised in both monetary and non-monetary terms and will eventually be incorporated into the model.
Ratcliffe, Gilland and Marucheck[
5] indicated that revenue management in outpatient appointment clinics resembles that of the airline industry, particularly in terms of overbooking and no-shows. When a reservation is made, both doctors and patients are expected to arrive at the designated time and place. If either party fails to show up on time, the clinic will suffer a loss in profit as the doctors cannot utilise their time efficiently and become idle.
Given the specific information regarding bookings, researchers can derive a straightforward deterministic formula for optimising booking requests based on historical data. If the constraints are removed, the upper and lower bounds of the limits and optimal booking strategies must be redefined. Ten different policies are proposed in their sensitivity analysis to explore the relationship between model variables and expected profit. In addition to the aforementioned paper, valuable insights can be obtained from the American Health Information Management Association concerning Ambulatory Care Centres, such as Hospital-Based and Community-Based Ambulatory Care. This research can extend the model to incorporate features of Hospital-Based Ambulatory Care.
Roski and Gregory[
6] discussed numerical performance measurement metrics such as the effectiveness of care, healthcare choices, accessibility or availability of services, and patient satisfaction with medical care. The efficiency of care is our primary measurement factor, as it can impact many dimensions. Meanwhile, service quality and patient satisfaction are our secondary metrics for assessing good healthcare management.
3. Literature Review
Overbooking is widely employed in the hotel and aviation industries where resources are perishable, such as reservations and appointment bookings[
7,
8]. Appointment overbooking is a method to mitigate the impact of no-shows by reducing idle time and increasing the efficiency and utilisation rate of the system[
9]. Overbooking appointments involves scheduling more patients in a session than the number of available service providers[
10,
11,
12]. An excessive number of appointments can compensate for no-shows. Muthuraman and Lawley[
13] utilised a Stochastic Model to maximise expected profit with overbooking and unimodal no-show rates. Amnon[
14] provided advice on managing overbooking in endoscopy units. Consequently, patient access times and provider productivity can be improved. However, if the overbooking policy is implemented inefficiently, patient waiting times and system overtime may also increase. To determine the optimal overbooking policy and achieve the intended objectives, Liu and Ziya[
15] used the Single Server Queuing Model, Kim and Giachetti[
16] adopted the Stochastic Model. LaGanga and Lawrence[
17] illustrated numerical examples of overbooking strategies that lead to improvements in the performance of different service settings and cost structures in hospitals. Kolisch and Sickinger[
18]; Zeng et al.[
19] provided evidence of the efficiency of using overbooking for advanced policy systems. Liu and Ziya[
15] stated that the overbooking strategy is the best among other strategies when the number of patients is comparatively low. Kros et al.[
10] demonstrated that large facilities tend to benefit from overbooking when no-show rates are high.
Among all the uncertain factors, patient no-shows and cancellations are the most significant issues. Typically, patients cancel their appointments just before the scheduled time, resulting in last-minute cancellations. If patients cancel their appointments sufficiently in advance, the hospital can reallocate the vacancy to new patients. However, according to Liu, Ziya and Kulkarni[
20], from the patient’s perspective, they might suffer if they later find that the service is needed. Consequently, many patients choose not to show up or cancel at the last moment. Parizi and Ghate[
21] considered multi-class and multi-resource scenarios while Schuetz and Kolisch[
22] discussed the demand for different customer services and products. Most papers treat late cancellations as no-shows because rebooking is required if the cancellation occurs late, necessitating the rearrangement of resources. Wang and Gupta[
23] demonstrated that the probability of no-shows depends on time, service, and patient type, in addition to homogeneous types. Samorani and LaGanga[
24] showed that appointments can also be affected by weather conditions. Cayirli and Veral[
25] as well as Gupta and Denton[
3] , revealed that shorter appointment intervals and overbooking can mitigate the impact of no-shows.
4. Proposed Model
4.1. Basic Model
After examining the operational processes of 27 hospitals in Hong Kong and Mainland China, the most critical factors were identified and extracted to reflect the hospital's situation most accurately and simplify the complex scenario. The model is developed as follows.
Considering K types of healthcare services in Ambulatory Care Center, or K departments. The planned time frame includes a single session with consecutive time, which is divided into equal interval time slots based on the requirement of the situation of Ambulatory Care Center. The appointment-scheduling problem involves two crucial decisions:
The objective is to minimize the weighted sum of the total cost of opening consultancy rooms and the total overtime associated with overbooking a consultancy room. We introduce the following variables to develop the model.
Indexes:
i: the starting time point i, i = 0, 1, …, T-1
j: the ending time point j, j= 1, 2, …, T
k: healthcare department k, k = 1, 2, …, K
Ck: the available capacity of department or specialty k, k = 1, 2, …, K.
Ri, j, k: the revenue from an appointment generated from time i to j within department k.
xi, j, k: the number of accepted appointments from time i to j within department k.
Ui, j, k: the number of uncertain appointments from time i to j within department k.
Pi, j, k: the probability of showing up for the accepted appointment from time i to j within department k.
Ok: the number of overbooked appointments within department k.
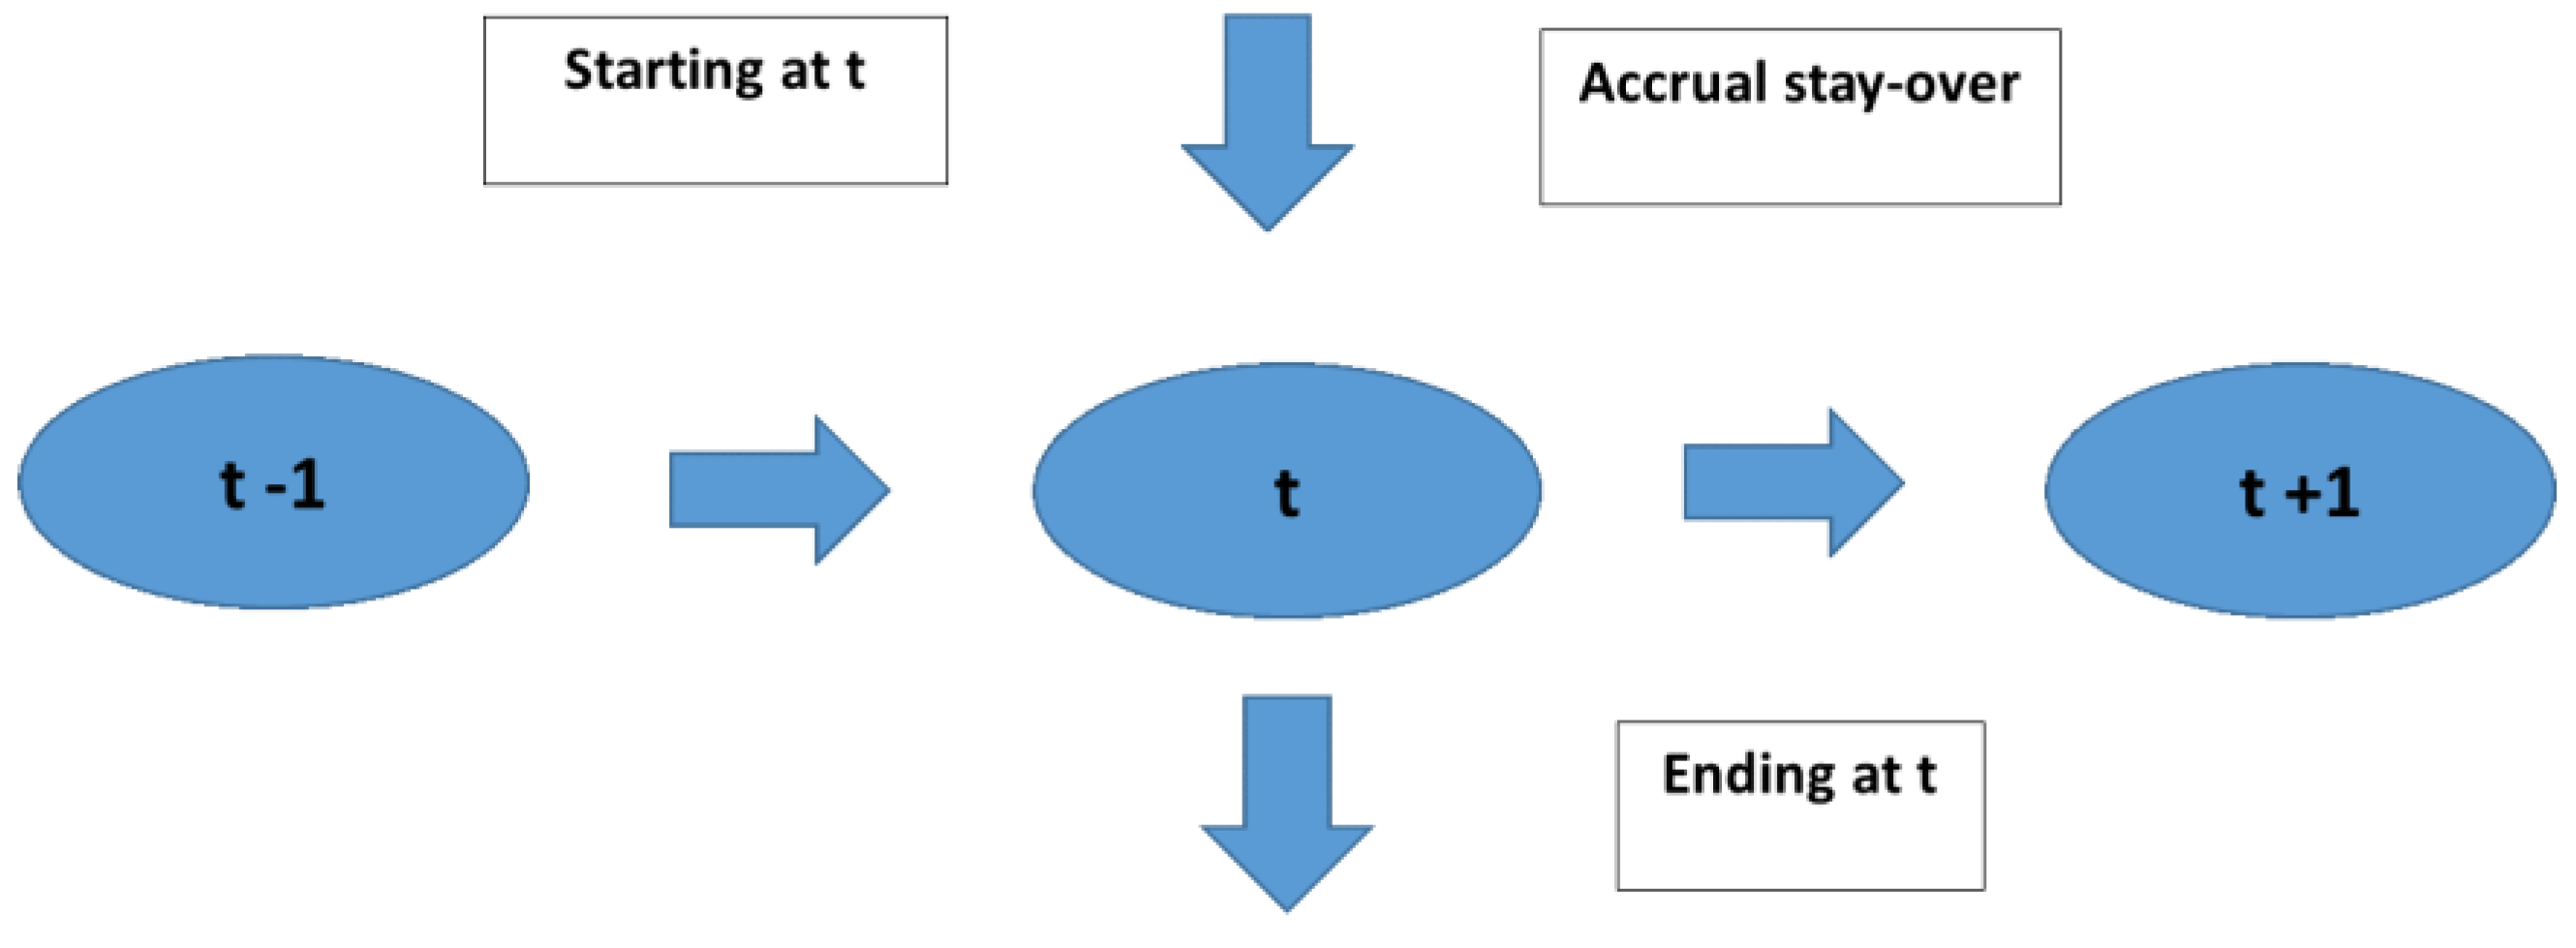
At time 0, the assumption can be made that the number of appointments is zero while it can be assumed that all the accepted appointments can be fulfilled at the ending time T. In reality, the service hour of the aforementioned hospital is from 9am to 6pm, which will be denoted by 0 to T in the research. The other assumption is that the accepted appointment lasts at least one slot, for instance, from time 1 to time 2. A network with nodes can be viewed as the starting point and ending points of an appointment, which is illustrated in the
Figure 1.
A particular time slot t and t ϵ {1, 2, ...,T - 1} in our planning horizon. The formula below indicates the utilization rate of department k, k ϵ {1, 2, …, K} at time t which embraces the existence of no-shows:
The capacity of department that has been utilized is represented in the first term. The capacity which was occupied previously and vacant again is shown in the second term. Finally, the latest accepted appointments which will continue at least one slow will be should in the third term.
Due to the problem of no-shows after the appointments are made in healthcare, the overbooking policy is made to manage the appointment scheduling. For each specialty department k with the constraints on their capacities, decision makers in hospitals may choose to invite more patients and accept more appointments than the available appointment session to mitigate the effect of no-shows. Therefore, the constraints will be modified as follows:
The revenue produced by fulfilling the consultation sessions is shown below:
The above equations appear to be a linear programming problem (LPP). However, are the uncertain parameters in equation 4 at the beginning of the time frame. As we are not able to remove the uncertainty totally in the complex situation, we should first embrace it and incorporate it in our model. Here, an interval programming based on interval analysis to tackle uncertain parameters. A linear interval programming to deal with no-shows of appointments with overbooking is presented.
4.2. Preliminary Foundation
Lai et al.[
26] presented the theoretic principle and framework of linear interval programming. First of all, assuming Ω is a set of real number. An ordered pair is defined in a bracket as an interval:
Where
refers to the lower bound and
refers to the upper bound of interval a, respectively.
The interval arithmetic is basically an extended version of ordinary arithmetic. The definitions of the mathematical operations between a pair of intervals are shown as below.
Definition 1
(Alefeld & Herzberger[27]): Let ∘ ∈ {+, -, ×, ÷} be a binary operation on Q. If two intervals, a and b, are involved, then:
Equation 6 specifies a binary operation on the set of intervals. When it comes to the case of division, the assumption will be made that 0∉b. Based on the above definition, the operations between a pair of intervals in this chapter are indicated as below:
Where k is any real number.In order to formulate the linear interval programming, the definition below is introduced.
Definition 2
(Alefeld & Herzberger[27]): Let
and
be two different intervals. Two ordered relationships
and
are defined between two intervals, a and b, as follows:
4.3. The Proposed Approach
With intervals involved, the linear programming problem (ILP) will be converted:
To maximize the return under uncertainty in constraints which is represented as interval numbers, the objective of interval linear programming is changed from the ordinary one.
Trivially, the expected value of any uncertain variable is located in the center of interval. Once the uncertain return is presented as an interval, the lower bound value of the interval indicates the pessimistic return and the upper bound value of the interval indicates the pessimistic cost. The abovementioned ILP is analogous to a combined model of expected value model with uncertainty and the pessimistic decision model.
The objective function to maximize can be regarded as a variant version of max-min problem. The constraint requirements specify the fact that the feasible solutions to ILP indicated the cost factors in the worst-case scenario. The average costs are less or equal to the maximum possible value and the expected average value of the resources with uncertainties, respectively.
Definition 3
(Lai et al.[26]): x is defined as a feasible solution to be a non-inferior solution to ILP if and only if no other feasible solution x is present so that
Based on the definition 3, the non-inferior solution to ILP can be derived in the following bi-objective programming:
To tackle multiple objective decision making (MODM) programming, A linear combination of objective functions is suggested Chankong and Haimes[
28]. Hence, the objective function of BIL can be rewritten:
Eventually, the solution of BIL can be generated from the parametric linear programming (PLP) model as follows:
where
indicates the risk appetite for decision makers.
The aforementioned equations have some strengths for calculation. The non-inferior solution is comparatively easy to be calculated by the suggested interval linear programming (λ) corresponding to various values of
. The distinguished characteristic of the suggested ILP (λ) is that the model has been already in linear programming form so that it is able to be solved efficiently by simple different linear model packages[
29] while
can be determined.
4.4. Robust Optimization Model
The suggested ILP (λ) can be used to tackle the appointment overbooking problem with no-shows in Ambulatory Care Center. From the model 4 in the previous section, equations 14 is combined into equation 4 directly. The uncertainty is depicted by the parameters
and
in objective function and constraints model 4. Eventually, the proposed model to manage no-shows with overbooking:
Where
In equation 15, the constraint of
is always true. This means the constraint of
can be removed to simplify the model (15) as:
Where
In the next session, the usefulness and effectiveness of the proposed linear interval programming model to manage no-shows with overbooking for appointments in Ambulatory Care Center will be shown.
5. Result and Discussion
In this session, the usefulness of the model will be demonstrated. Some assumptions have to be made for the sake of demonstration:
The number of departments and their capacities cannot be increased within a short timeframe.
The rate of revenue generated from an appointment is likely fixed due to the policy of the Hong Kong Hospital Authority.
The probability of showing up for an accepted appointment will not change
The demand is sufficiently high and exceeds capacity, making overbooking beneficial.
To simplify the numerical example illustration, six sessions are set to be available per day, i.e., T = 6. The length of each session can be any value and is defined by the decision-makers. Three departments will be involved. The demands for the lower bound and the upper bound are shown in
Table 1 and
Table 2, respectively.
For each period, a show-up probability (equal to 1 minus the no-show probability) can be found in
Table 2 or
Table 3. For simplicity, hospital managers decide to use constant values of 0.95 and 0.8 for the upper bound and lower bound of the show-up rate (5% and 20% for no-show rates, respectively). The revenue for each period is set at 100. These three parameters can be adjusted according to the precise information provided by the hospital managers.
Therefore, other parameters which are made constant are shown in
Table 3.
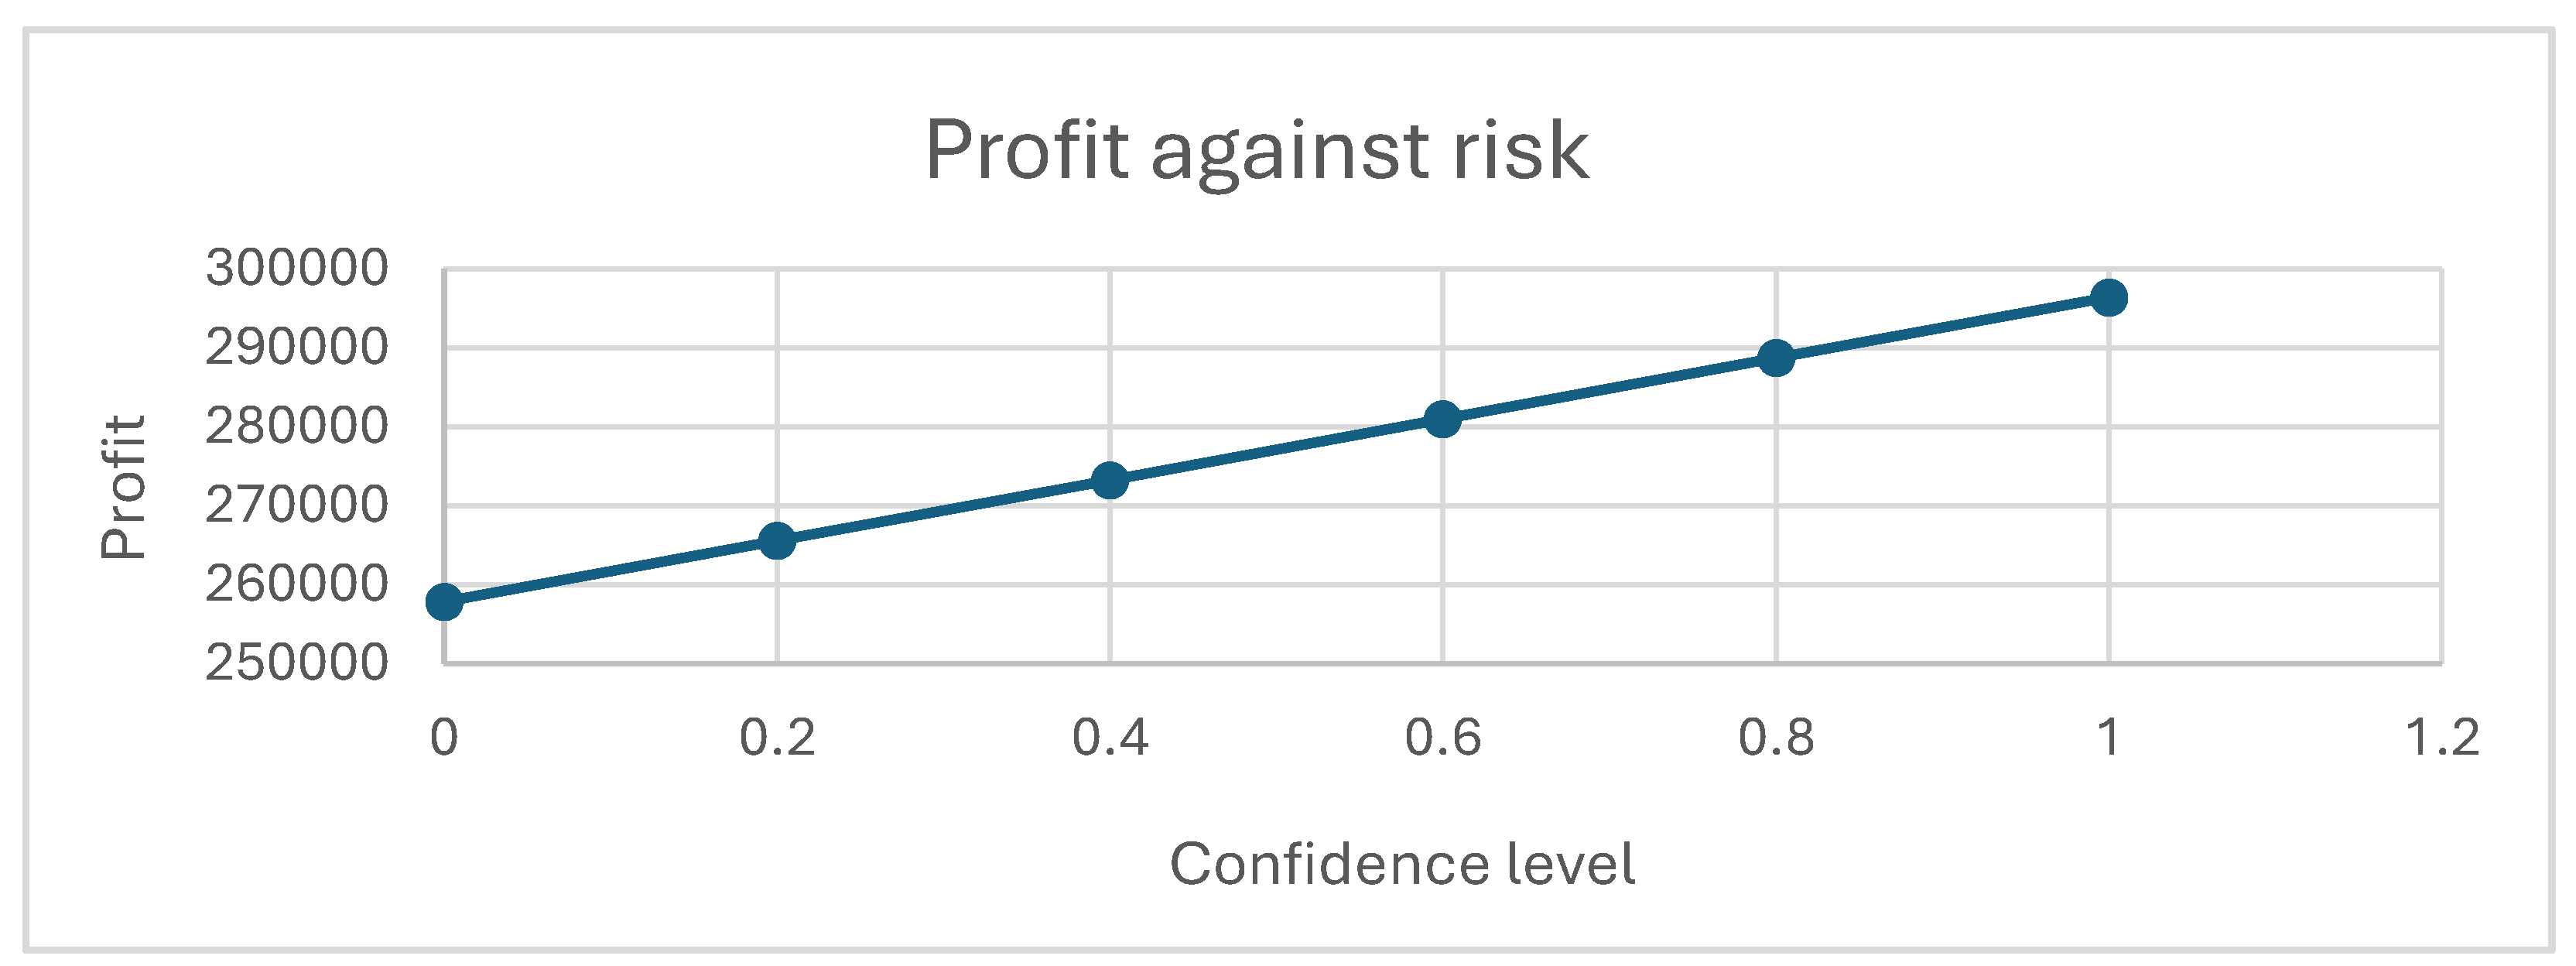
First, the risk parameter λ is examined. This parameter informs decision-makers of the expected profit after a designated period, given a certain value of λ. It also influences the configuration of the assignment between patients and doctors. The expected profit aids in capacity planning and financial management of the hospital. Note that the results of the following graphs are based on the parameters mentioned above; the patterns remain similar when the parameters vary.
In
Figure 2, when decision-makers are more confident about their estimation of uncertain parameters such as the upper and lower bounds of demand and the no-show probability, the profit increases regardless of how the demand is assigned. The confidence of the decision-makers is positively correlated with the expected profit.
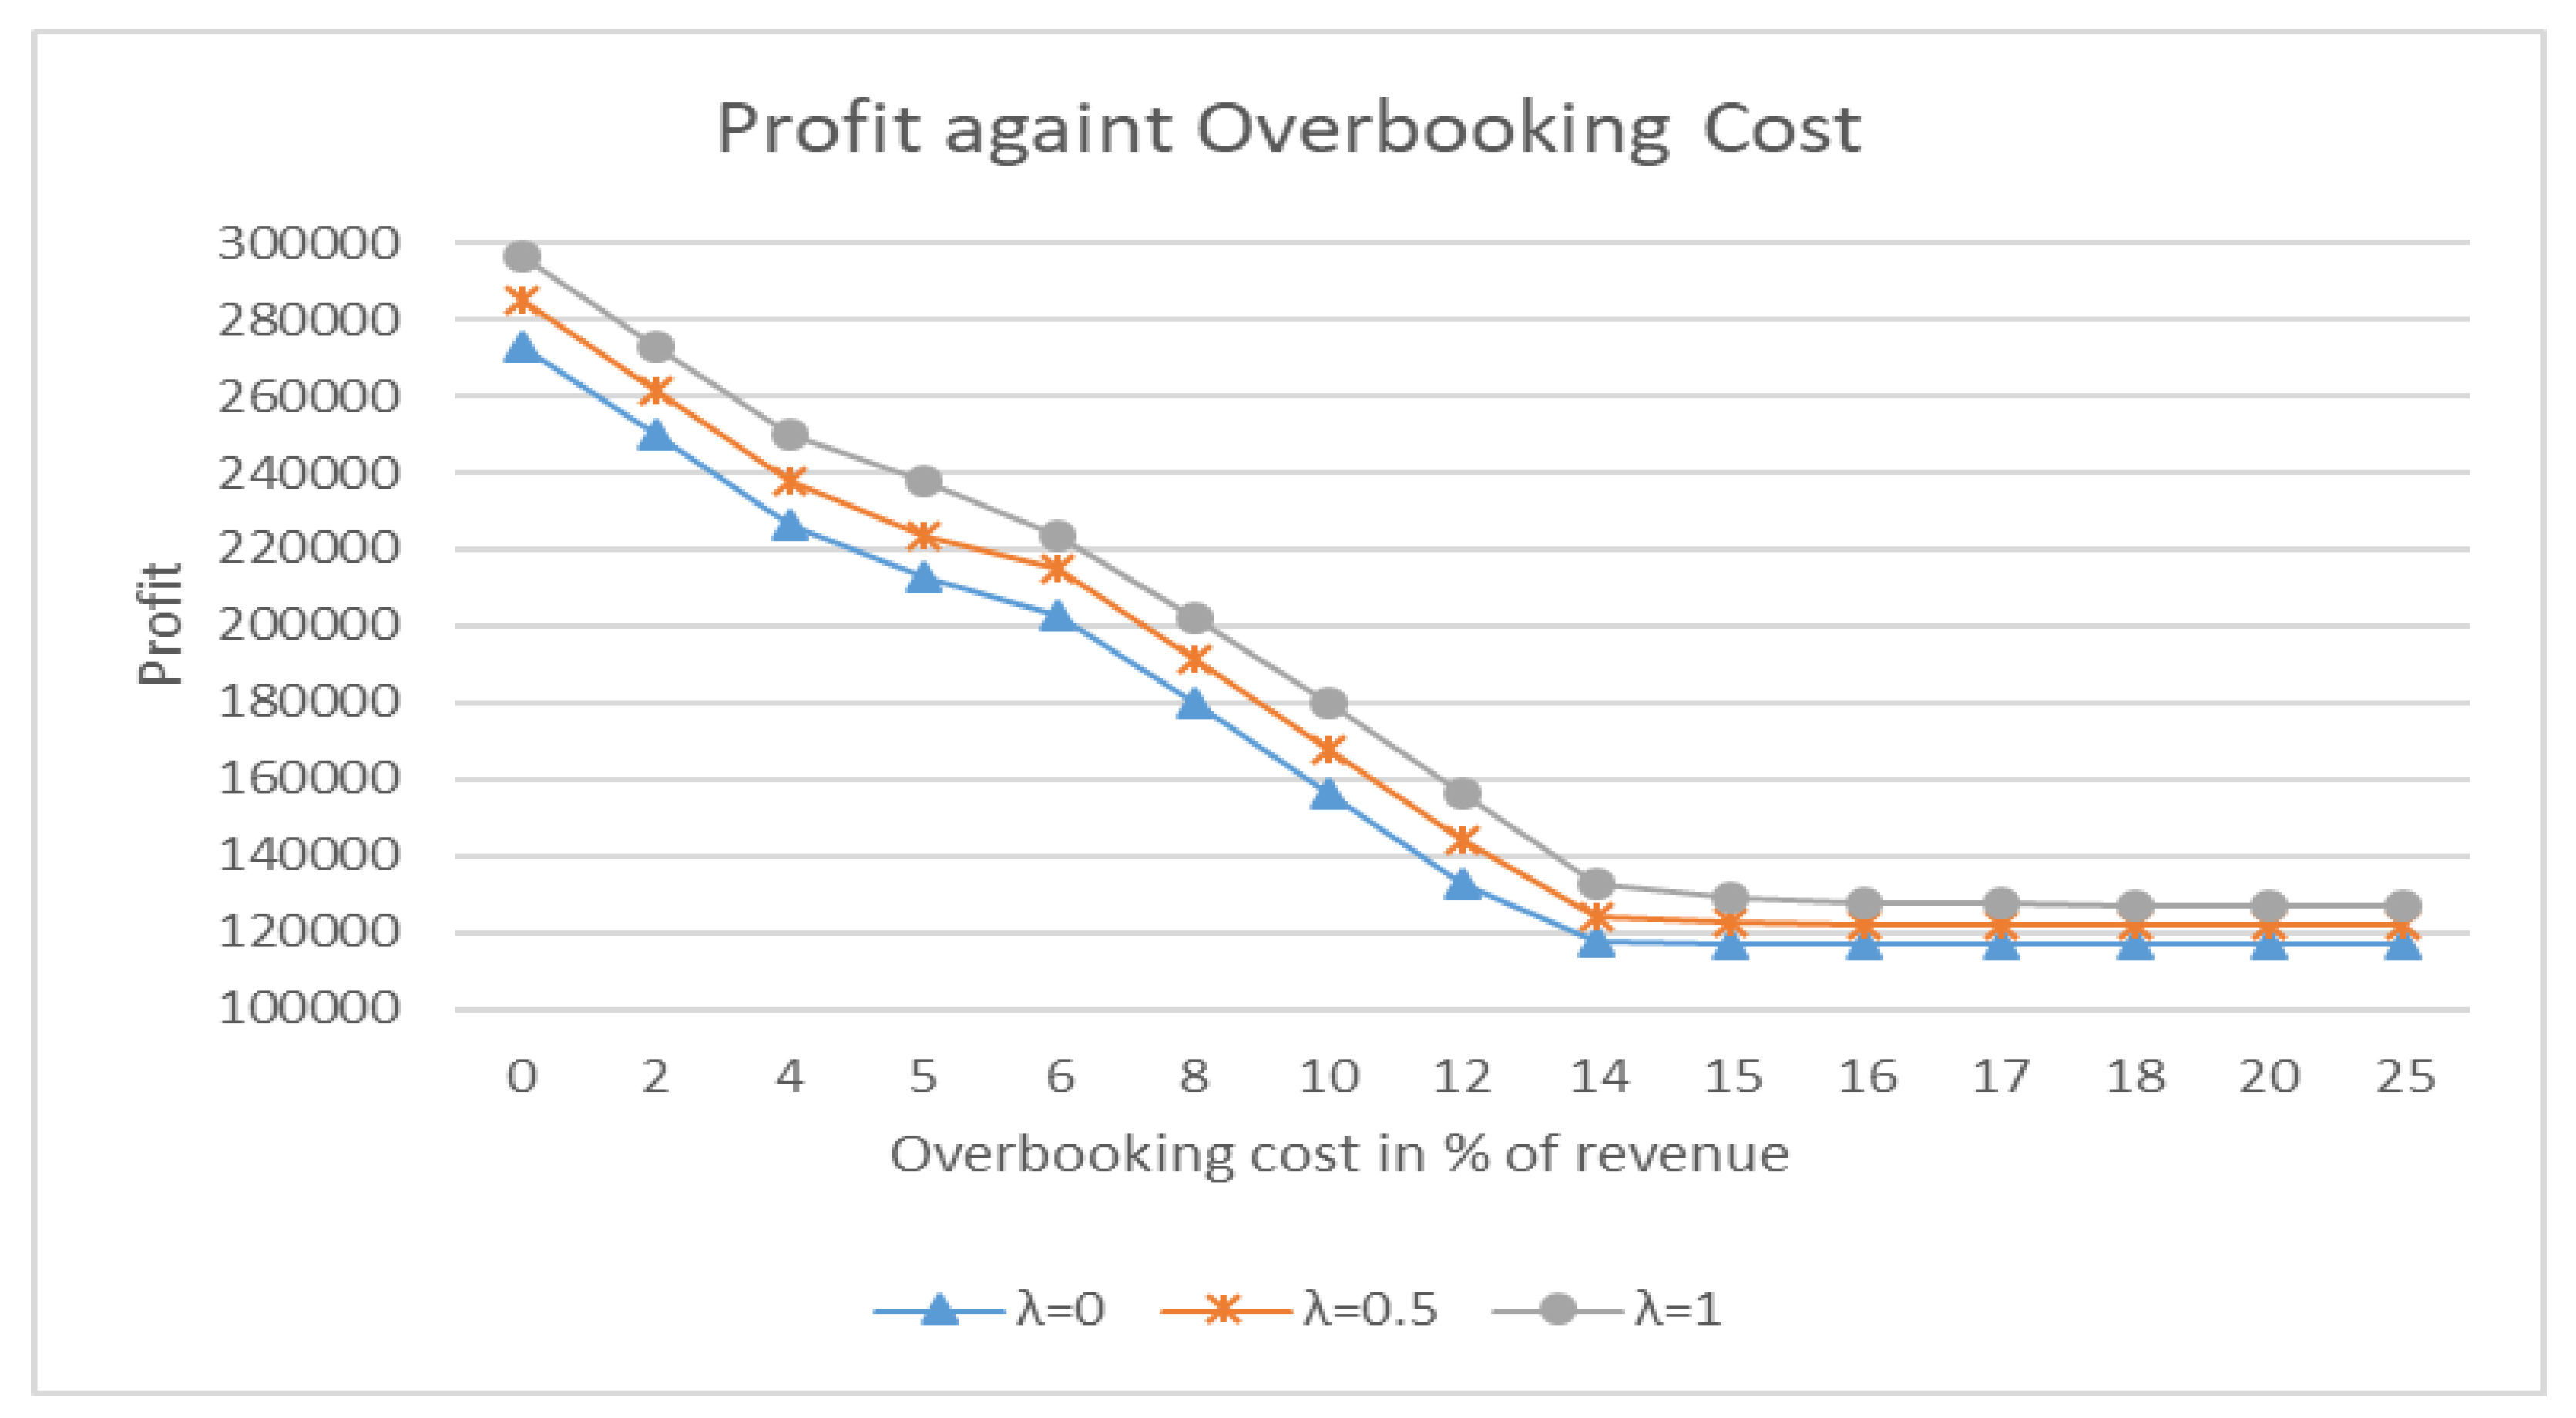
The overbooking cost affects the upper and lower bounds of profit, the configuration of the patient-doctor assignment, and the level of overbooking. In
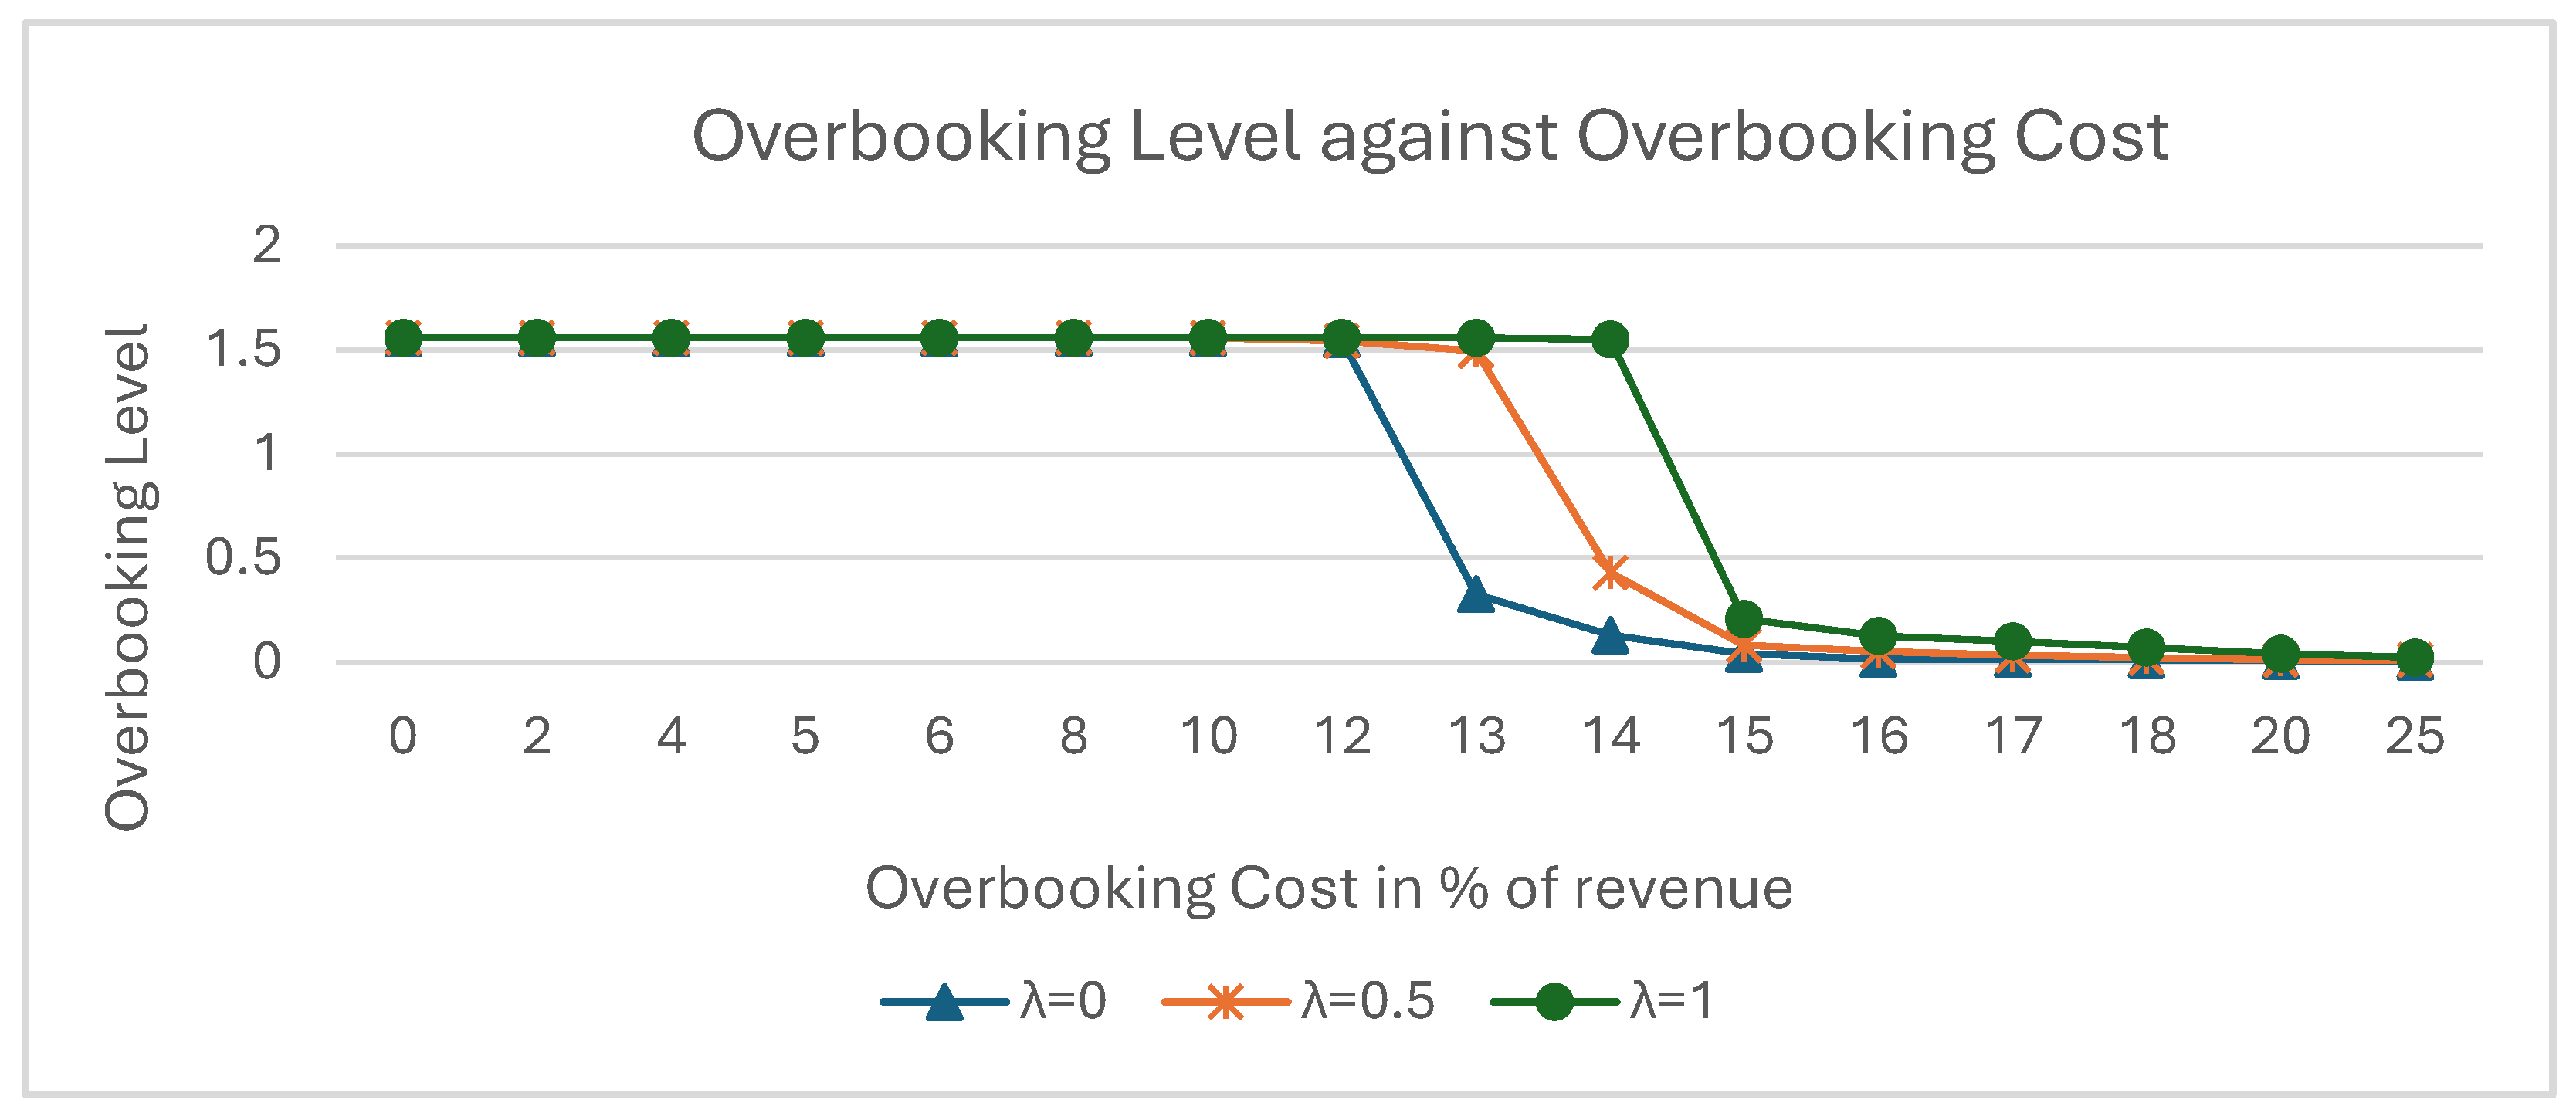
Figure 3, when overbooking is free of charge, we will fully rely on overbooking if it is possible to meet the demand for consultation services. The profit will reach its maximum value, equivalent to the revenue part of the objective function, without deductions for overbooking costs. Note that as the overbooking cost increases, the profit decreases significantly. The configuration of the assignment between patients and doctors remains similar and full until the overbooking cost reaches 10% of the revenue. At this point, the configuration will start to change, and the level of overbooking will decrease, as discussed in
Figure 4. When the overbooking cost reaches 15% of the revenue, overbooking becomes too expensive, causing the profit to decrease if overbooking is still used to meet the demand. The manager should consider not fulfilling the demand. The units of overbooking drop to less than 5% when the cost reaches 25% of the revenue. Additionally, the more risk the decision-maker is willing to take, the higher the upper and lower bounds of the profit, indicating that risk-taking decision-makers will anticipate higher profits in any situation.
The overbooking cost affects the level of overbooking, which is measured by the ratio of total overbooking units to total capacity. In Figure 11, the overbooking level is at its maximum when the overbooking cost ranges from 0% to around 10% of the total revenue. As mentioned above, overbooking is maximized to fulfill all demand. If the demand uncertainty or the range of demand increases, the overbooking level will also increase. Ideally, the overbooking level should be around 1.6 to accommodate the demand. Note that more confident decision-makers will experience a later drop in their overbooking level, meaning they adopt full overbooking at a higher cost.
When the overbooking cost is around 10%, the overbooking level starts to decrease, and not all potential patients are accommodated. The configuration of the assignments begins to change until the overbooking cost reaches 15% to 18%, depending on the confidence level of the decision-makers. More confident decision-makers are able to maintain a higher level of overbooking at the same cost. At an overbooking cost of 15%, less confident decision-makers will keep overbooking minimal, while more confident decision-makers will utilise around 10% to 20% of the overbooking level until the cost rises to 18%. (The shapes of the curves vary with different parameters such as no-show rates, but the patterns remain similar.)
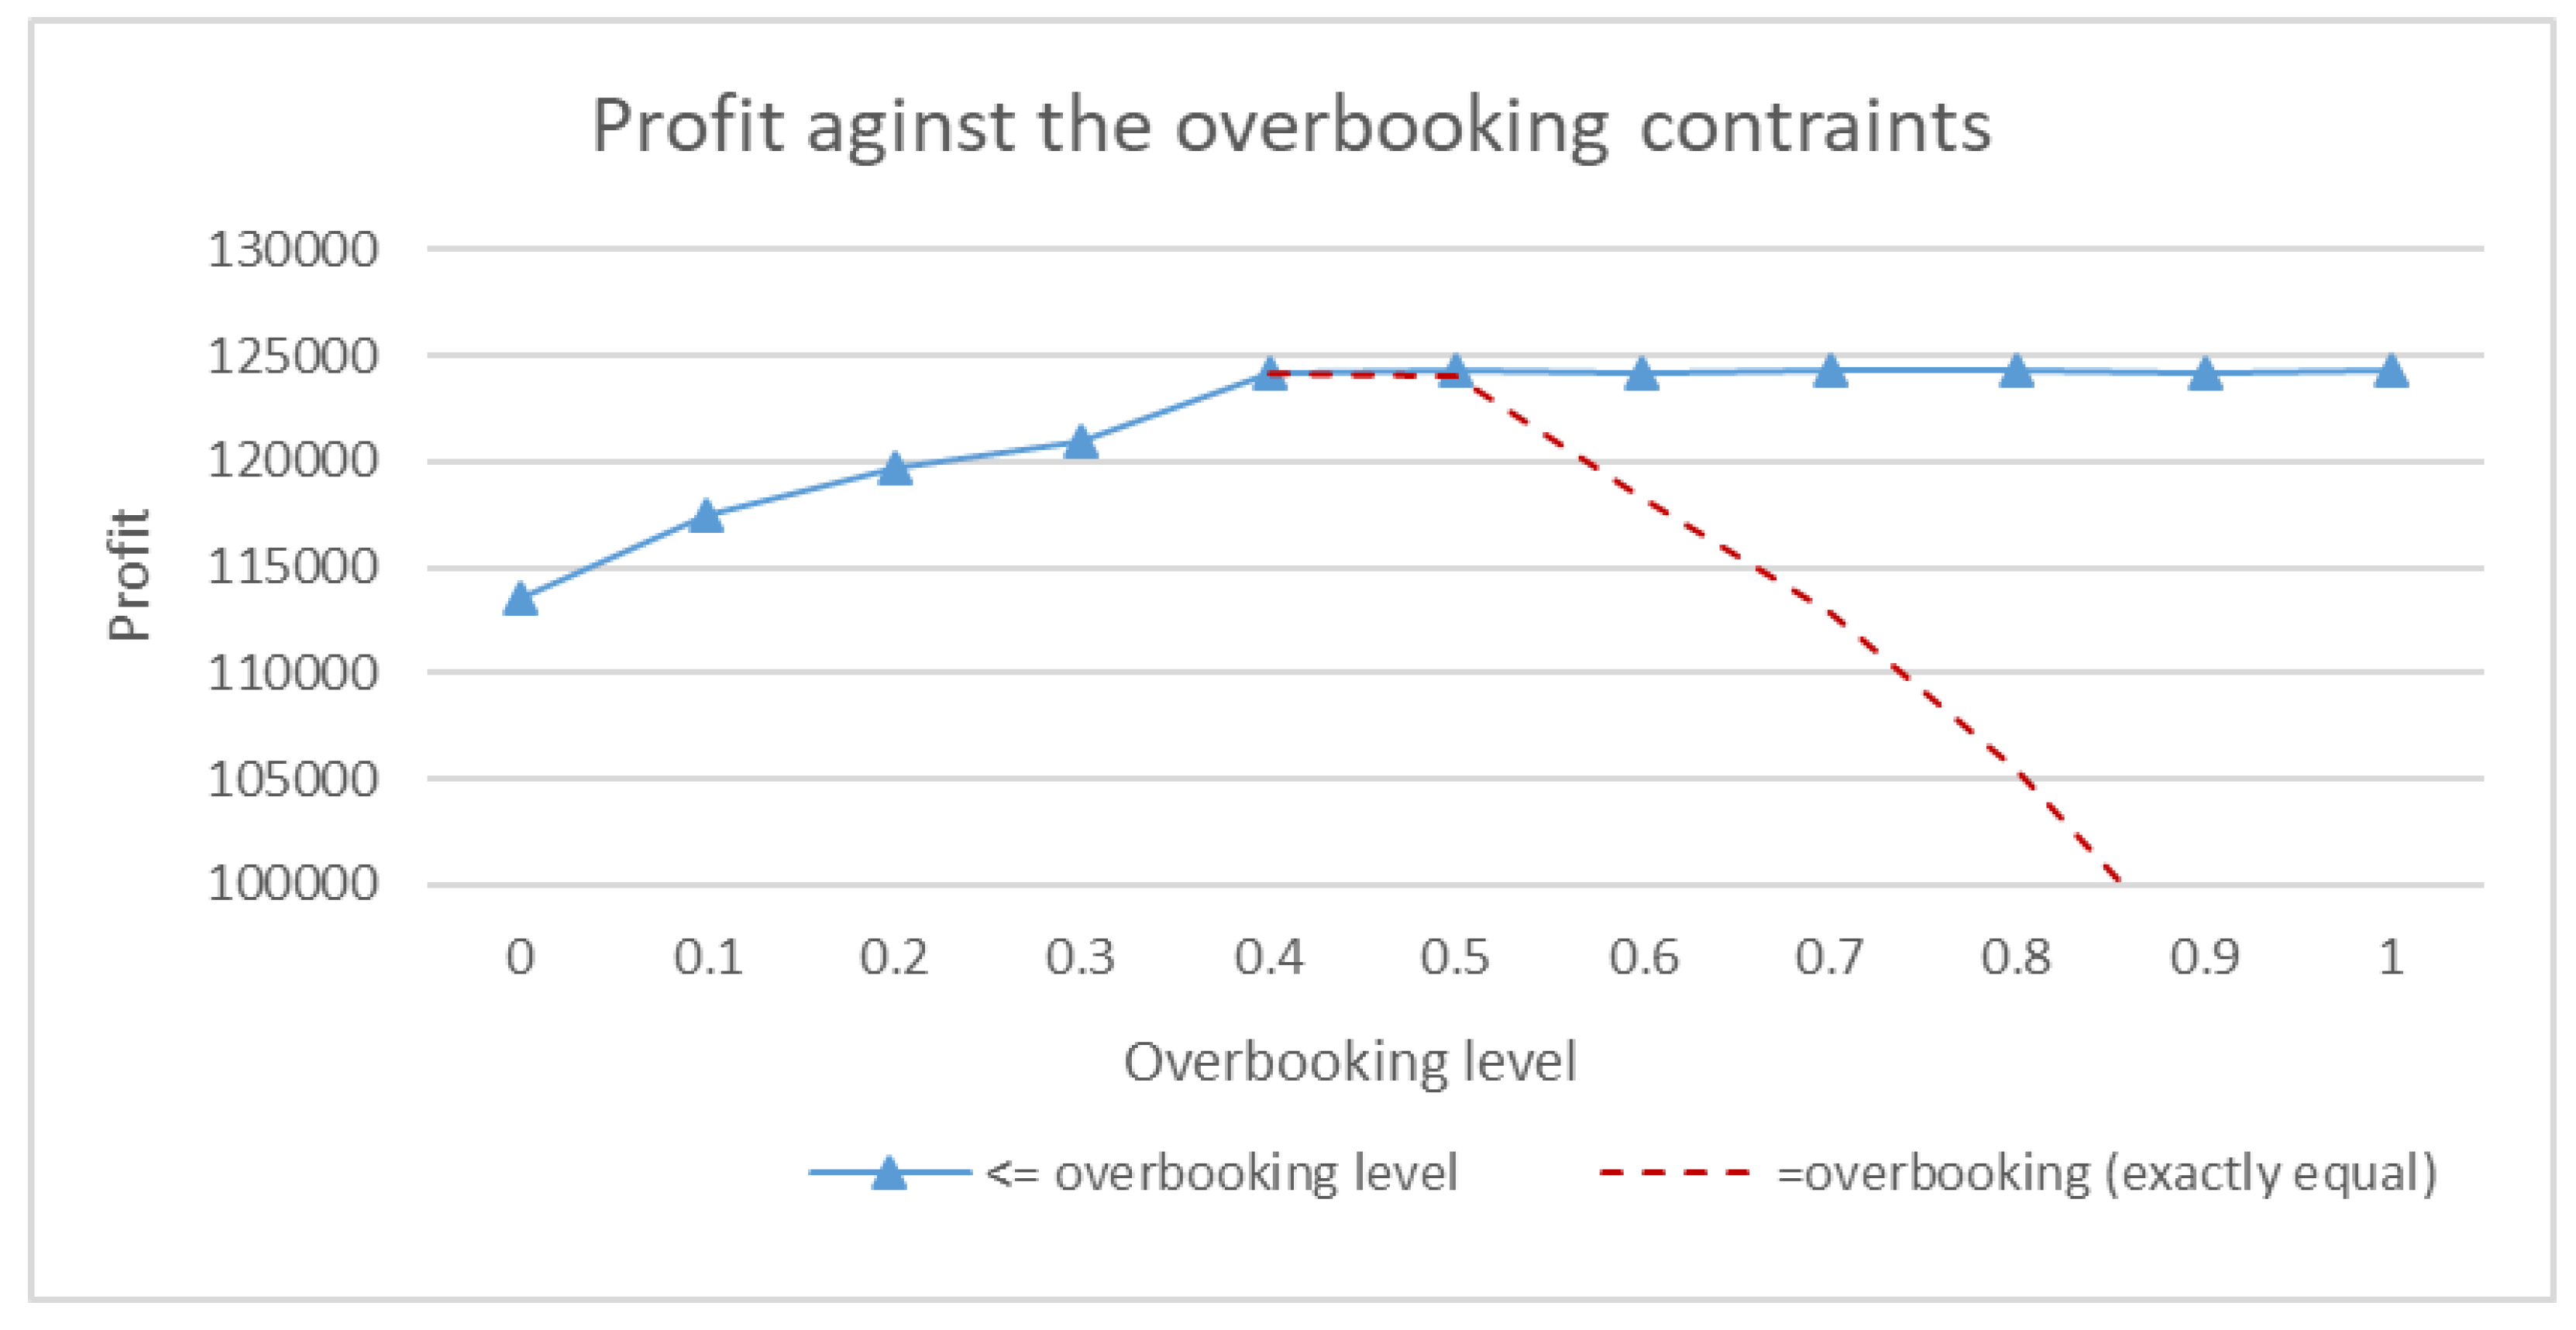
Figure 5 illustrates the relationship between profit and the ratio of overbooking. The overbooking cost is set at 14% of revenue, with a risk level of 0.5. The no-show rate remains within the boundary of 5% to 20%. Under these settings, revenue increases up to an overbooking level of 40%. Extra patients fill the empty consultation slots left by no-show patients. The optimal strategy before reaching the 40% overbooking level is to allow the hospital to overbook as much as possible. However, beyond 40%, even if a higher overbooking level is permitted, the hospital should aim for around 40% as their booking level (Blue line). If hospital managers decide to use a higher overbooking level to accommodate all potential patients, the overbooking cost will increase significantly, leading to a drop in profit. After deciding on the overbooking level, they will obtain the schedule of overbooking and the assignment of the number of consultations for each period, as shown in
Table 4 and
Table 5.
Note that decision-makers will attempt to schedule more patients who may occupy longer periods, due to the higher revenue generated when these patients show up. If decision-makers prefer a more even distribution of the schedule, the revenue across different periods can be adjusted. For a private hospital, this approach can assist in making overbooking decisions to maximise revenue. For a public hospital, the optimal solution can reduce the number of vacancies wasted due to no-shows and cancellations.
6. Management Insights
From the above analysis, hospital managers need to determine two parameters before establishing the appointment assignment policy: the risk level and the overbooking cost. The degree of risk aversion can be virtually interpreted as the confidence level. In
Figure 2, profit is directly proportional to the degree of risk aversion of the hospital managers. If managers choose to be more prudent about the risk and the consequences of overbooking, a smaller λ should be selected, resulting in a lower expected profit. Hospital managers should be clear about their short-term and long-term goals to make decisions for the sustainability of the clinics, such as choices of specialty and investment.
Once the risk aversion level is confirmed and chosen, hospital managers should carefully measure the cost of overbooking. The cost of overbooking can be tangible or intangible, depending on the definition of the managers. Tangible costs are easier to measure and can include overtime compensation for doctors, additional utility usage, or compensation for unfulfilled patients. Intangible costs may include damage to the hospital's reputation. In
Figure 3, hospital managers can foresee a drop in profit when the overbooking cost increases, as the wasted slots from overbooking will incur costs. When the cost increases to a certain level, managers should reduce the overbooking level, and the profit will essentially plateau. As the overbooking level is reduced to a minimum, the overbooking cost will not significantly affect profit. If managers consider more compensation for the issues arising from overbooking, the expected profit will further decrease.
Once hospital managers are informed about the potential profit given the risk factors and overbooking cost, they can decide on the overbooking level. In
Figure 4, managers will adopt a strategy with a high overbooking level when the overbooking cost is perceived to be low. Up to a certain point, the optimal overbooking level starts to decrease, requiring managers to carefully consider how they allocate their overbooking resources. When the overbooking cost is very high, managers should reduce the overbooking level to a minimum. Different sets of parameters will lead to different decisions at any given overbooking cost.
Due to hospital policy, a large number of overbookings is not recommended even when the overbooking cost is very low. In this case, the hospital manager should carefully consider whether to still use the optimal overbooking level. In
Figure 5, managers can achieve peak profit with the most optimal overbooking level. If they decide to increase or decrease the overbooking level, they will experience a decrease in profit due to unfulfilled demand and significant penalties associated with overbooking.
Afterwards, hospital managers should understand the overbooking level for each period as shown in
Table 4 and assign patients to different sessions as in
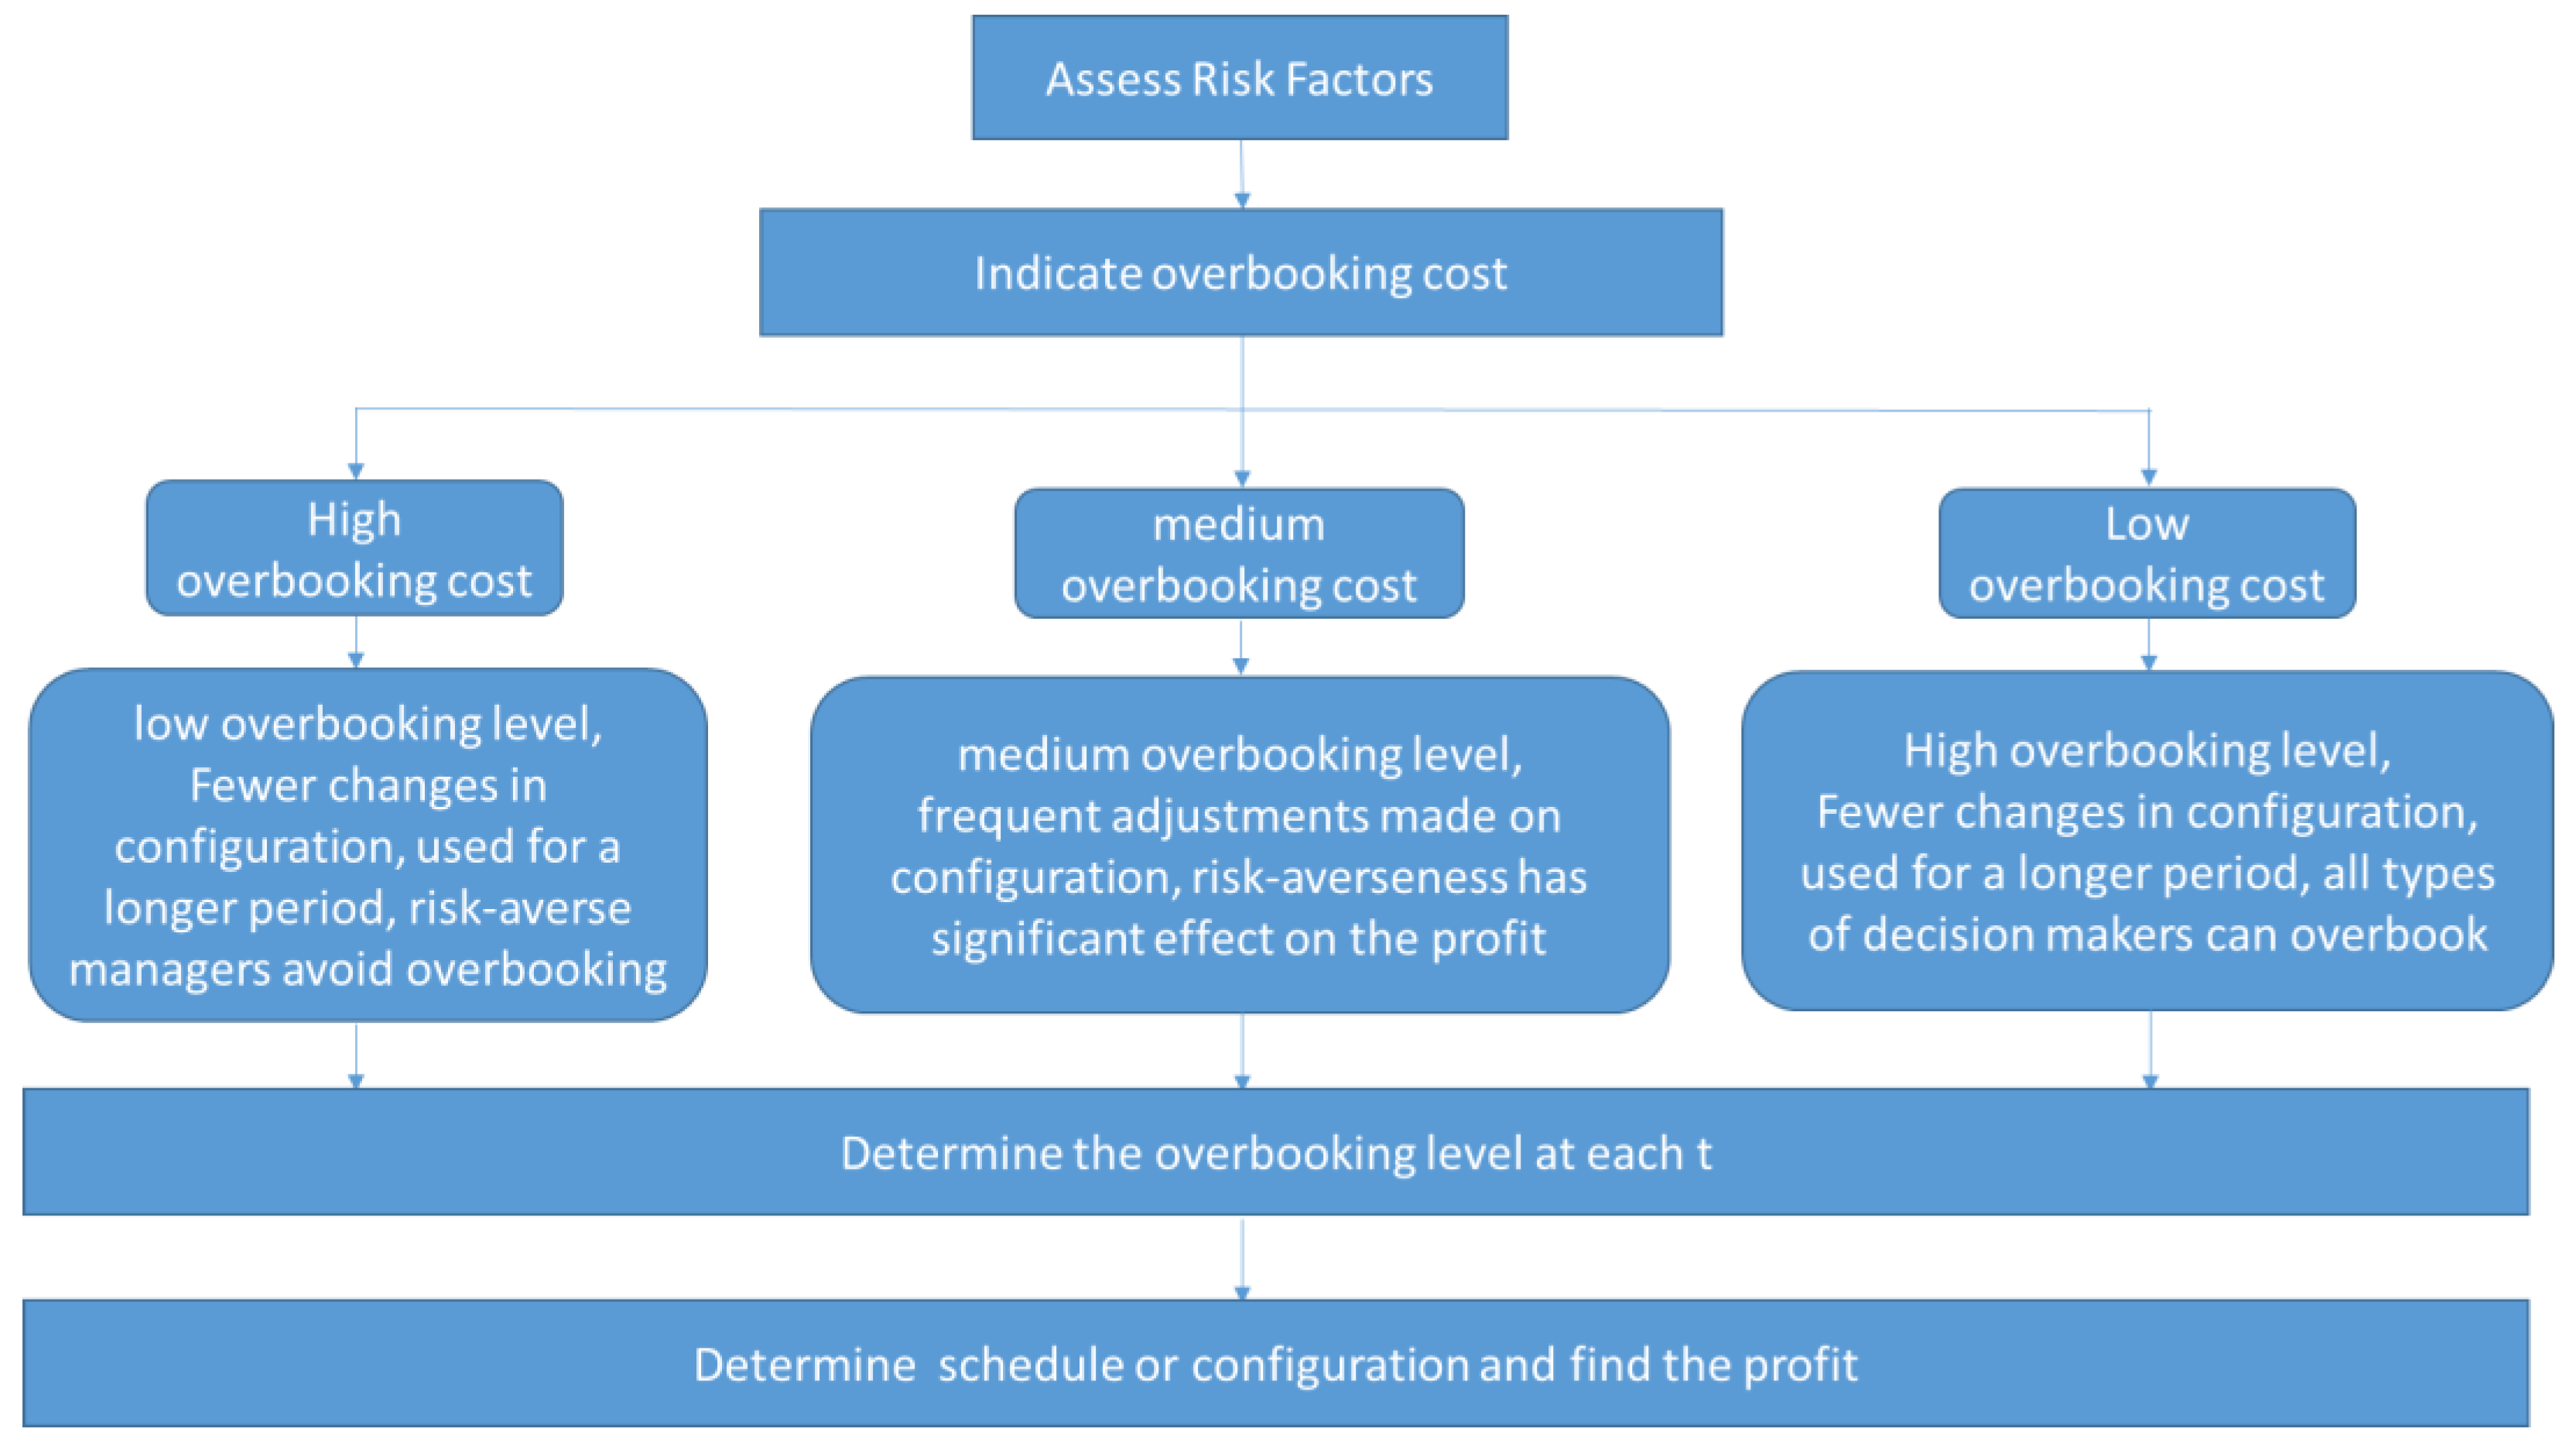
Table 5. Parameters can be added to meet the specific needs of individual hospitals. The entire action plan is outlined below.
Figure 6.
The decision flow for overbooking.
Figure 6.
The decision flow for overbooking.
7. Conclusions
The healthcare system is instrumental to societal prosperity, and the efficiency of hospital operations depends on the strategy adopted by hospital managers. In this paper, we propose a robust optimization model to address no-shows and vacancy problems using the overbooking technique. Initially, the operation of clinics has been studied in the literature with practical experience. We then established a baseline preliminary model typically used in overbooking problems. Instead of setting our parameters deterministically, we proposed a model with robust parameters. When the probability of no-shows increases, the model can generate more profit than deterministic models. The proposed model suggests that profit will increase with the amount of overbooking and decrease once it reaches a certain point. A maximum number of overbooked appointments can be calculated. The decision flow for overbooking begins by assessing the cost of overbooking. If the cost of overbooking is high, the results indicate that the overbooking level should be adopted, and other methods to accommodate no-shows should be considered. If the overbooking cost is low, a high overbooking level should be considered, and all types of decision-makers should use overbooking. A medium overbooking level should be adopted when the overbooking cost is moderate. Risk aversion is more critical in determining which methods to use. The contribution of this paper is pivotal, especially during a pandemic with a high level of uncertainty.
Author Contributions
Conceptualization, F.X., C.K.L and K.K.L.; methodology, F.X., B.R. and K.K.L.; Investigation, C.K.L, F.X.; Supervision, K.K.L.; Writing - original draft, F.X. and C.K.L; Writing - review & editing, F.X. and B.R. All authors have read and agreed to the published version of the manuscript.
Funding
This research received no external funding.
Data Availability Statement
The program code and data that support the plots discussed within this paper is available from the corresponding author upon request.
Acknowledgments
All authors acknowledge the support from their respective institutes/universities.
Conflicts of Interest
The authors declare no conflicts of interest.
References
- Weil, D.N. Accounting for the effect of health on economic growth. The Quarterly Journal of Economics 2007, 122, 1265-1306. [CrossRef]
- Stanciu, A.; Vargas, L.; May, J., A revenue management approach for managing operating room capacity. In WSC10: Winter Simulation Conference, Baltimore Maryland, USA, 2010; pp 2444-2454.
- Gupta, D.; Denton, B. Appointment scheduling in health care: Challenges and opportunities. IIE Transactions 2008, 40, 800-819. [CrossRef]
- Stanciu, A.; Vargas, L.; May, J. in A revenue management approach for managing operating room capacity, 2010 Winter Simulation Conference, 2010-1-1, 2010; 2010; pp 2444-2454.
- Ratcliffe, A.; Gilland, W.; Marucheck, A. Revenue management for outpatient appointments: Joint capacity control and overbooking with class-dependent no-shows. Flex Serv Manuf J 2011, 24, 516-548. [CrossRef]
- Roski, J.; Gregory, R. Performance measurement for ambulatory care: Moving towards a new agenda. Int J Qual Health C 2001, 13, 447-453. [CrossRef]
- Subramanian, J.; Stidham, S.; Lautenbacher, C.J. Airline yield management with overbooking, cancellations, and no-shows. Transport Sci 1999, 33, 147-167. [CrossRef]
- Liberman, V.; Yechiali, U. On the hotel overbooking problem—an inventory system with stochastic cancellations. Manage Sci 1978, 24, 1117-1126. [CrossRef]
- Ho, C.; Lau, H. Minimizing total cost in scheduling outpatient appointments. Manage Sci 1992, 38, 1750-1764. [CrossRef]
- Kros, J.; Dellana, S.; West, D. Overbooking increases patient access at east carolina university's student health services clinic. Interfaces 2009, 39, 271-287. [CrossRef]
- LaGanga, L.R.; Lawrence, S.R. Clinic overbooking to improve patient access and increase provider productivity. Decision Sci 2007, 38, 251-276. [CrossRef]
- Lee, D.K.K.; Zenios, S.A. Optimal capacity overbooking for the regular treatment of chronic conditions. Oper Res 2009, 57, 852-865. [CrossRef]
- Muthuraman, K.; Lawley, M. A stochastic overbooking model for outpatient clinical scheduling with no-shows. Iie Transactions 2008, 40, 820-837. [CrossRef]
- Sonnenberg, A. How to overbook procedures in the endoscopy unit. Gastrointest Endosc 2009, 69, 710-715. [CrossRef]
- Liu, N.; Ziya, S. Panel size and overbooking decisions for appointment-based services under patient no-shows. Prod Oper Manag 2014, 23, 2209-2223. [CrossRef]
- Kim, S.; Giachetti, R.E. A stochastic mathematical appointment overbooking model for healthcare providers to improve profits. Ieee Transactions On Systems, Man, and Cybernetics - Part a: Systems and Humans 2006, 36, 1211-1219. [CrossRef]
- LaGanga, L.R.; Lawrence, S.R. Appointment overbooking in health care clinics to improve patient service and clinic performance. Prod Oper Manag 2012, 21, 874-888. [CrossRef]
- Kolisch, R.; Sickinger, S. Providing radiology health care services to stochastic demand of different customer classes. Or Spectrum 2007, 30, 375-395. [CrossRef]
- Zeng, B.; Turkcan, A.; Lin, J.; Lawley, M. Clinic scheduling models with overbooking for patients with heterogeneous no-show probabilities. Ann Oper Res 2010, 178, 121-144. [CrossRef]
- Liu, N.; Ziya, S.; Kulkarni, V.G. Dynamic scheduling of outpatient appointments under patient no-shows and cancellations. Manufacturing & Service Operations Management 2010, 12, 347-364. [CrossRef]
- Parizi, M.S.; Ghate, A. Multi-class, multi-resource advance scheduling with no-shows, cancellations and overbooking. Comput Oper Res 2016, 67, 90-101. [CrossRef]
- Schütz, H.; Kolisch, R. Capacity allocation for demand of different customer-product-combinations with cancellations, no-shows, and overbooking when there is a sequential delivery of service. Ann Oper Res 2013, 206, 401-423. [CrossRef]
- Wang, W.Y.; Gupta, D. Adaptive appointment systems with patient preferences. Manufacturing & Service Operations Management 2011, 13, 373-389. [CrossRef]
- Samorani, M.; LaGanga, L.R. Outpatient appointment scheduling given individual day-dependent no-show predictions. Eur J Oper Res 2015, 240, 245-257. [CrossRef]
- Cayirli, T.; Veral, E. Outpatient scheduling in health care: A review of literature. Prod Oper Manag 2003, 12, 519-549. [CrossRef]
- Lai, K.K.; Wang, S.Y.; Xu, J.P.; Zhu, S.S.; Fang, Y. A class of linear interval programming problems and its application to portfolio selection. Ieee T Fuzzy Syst 2002, 10, 698-704. [CrossRef]
- Alefeld, G.; Herzberger, J. Introduction to interval computation; 1st ed.; Academic Press: Massachusetts, USA 1983; pp. 1-49.
- Chankong, V.; Haimes, Y.Y. Multiobjective decision making: Theory and methodology; 1st ed.; Courier Dover Publications: New York, 2008; pp. 291-322.
- Schrage, L. Optimization modeling with LINDO; 5th ed.; LINDO Systems Inc: USA, 2003; pp. 507-528.
|
Disclaimer/Publisher’s Note: The statements, opinions and data contained in all publications are solely those of the individual author(s) and contributor(s) and not of MDPI and/or the editor(s). MDPI and/or the editor(s) disclaim responsibility for any injury to people or property resulting from any ideas, methods, instructions or products referred to in the content. |
© 2024 by the authors. Licensee MDPI, Basel, Switzerland. This article is an open access article distributed under the terms and conditions of the Creative Commons Attribution (CC BY) license (http://creativecommons.org/licenses/by/4.0/).
