Preprint
Article

A Novel Method for the Preparation of Casein-Fucoidan Compo-Site Nanostructures

Altmetrics

Downloads

93

Views

45

Comments

0

A peer-reviewed article of this preprint also exists.

This version is not peer-reviewed

Submitted:

04 June 2024

Posted:

05 June 2024

You are already at the latest version

Alerts
Abstract
The aim of the study was to develop casein-fucoidan composite nanostructures through the method of polyelectrolyte complexation and subsequent spray drying. To determine the optimal parameters for the preparation of the composite structures and to investigate the influence of the production and technological parameters on the main structural and morphological characteristics of the obtained structures, 3(k-p) fractional factorial design was applied. The independent variables (casein to fucoidan ration, glutaraldehyde concentration and spray intensity) were varied at three levels (low, medium, and high) and their effect on the yield, the average particle size and the zeta potential were evaluated statistically. Based on the obtained results, models C1F1G1Sp.30, C1F1G2Sp.40, and C1F1G3Sp.50, which have an average particle size ranging from (265 ± 32) nm to (357 ± 25) nm, production yield in the range (48.9 ± 2.9) % to (66.4 ± 2.2) % and zeta potential varying from ( −20.12 ± 0.9) mV to (−25.71 ± 1.0) mV were selected as optimal for further use as drug delivery systems.
Keywords: 
Subject: Medicine and Pharmacology  -   Pharmacy

1. Introduction

In recent decades, biopolymers have been a subject of a serious scientific interest for the development of nanosized drug delivery systems, due to their specific characteris-tics and numerous advantages over synthetic polymers, such as low immunogenicity, high biocompatibility, biodegradability, and low toxicity [1]. Biopolymers such as pep-tides and polysaccharides have been widely used for the preparation of nanoparticu-late drug delivery systems that can provide controlled and targeted release, improving biodistribution of the encapsulated drug and minimizing its systemic toxicity [2]. Compared to polysaccharides, proteins are preferred as structure-forming biopolymers for the production of drug delivery systems due to their ability to form smaller in size particles [3]. Among the proteins used for the formulation of nanosized carriers, casein has shown optimal structural and physicochemical properties [4]. Casein is a collective term for a family of calcium (phosphate)-binding phosphoproteins commonly found in mammalian milk. Bovine milk casein consists of four peptides, namely αs1, αs2, β and k, which differ in amino acid, phosphorus, and carbohydrate content, but all of them possess amphiphilic properties [5]. Cysteine amino acid residues, which are involved in the formation of disulfide bonds, are found only in the polypeptide chains of k-casein. The lack of secondary structures of the casein molecules, due to the proline-rich amino acid residues and the ability to bind to calcium phosphate leads to the formation of electrostatic, hydrogen and hydrophobic interactions [6]. As a result, self-association of the casein peptides occurs, resulting in the formation of stable ag-glomerates known as casein micelles [6]. The inner part of the micelle is composed of αs1, αs2, and β caseins, while the outer layer, which stabilizes the micelle, contains glycosylated k-casein [7]. Casein micelles exhibit pH-dependent behavior. A decrease in the surface negative charge of the casein micelles leads to their contraction, while an increase in the charge leads to an electrostatic repulsion of the casein molecules [8].
A major problem in the development of casein-based nanostructures is the low drug encapsulation efficiency and drug loading index [9]. This is related to the use of large amounts of drug delivery systems to ensure the desired dose of the incorporated therapeutic agent [9]. Thus, the development of suitable technological approaches to over-come these drawbacks is necessary for the preparation of stable and effective drug delivery systems. One of the main approaches is the formation of casein-polysaccharide complexes.
Due to its specific physicochemical properties, casein can participate in the formation of composite nanostructures because of polyelectrolyte or chemical interactions with one or more polymers. Compared to chemically and physically cross-linked casein nanoparticles, composite nanoparticles are characterized by higher stability and possibility of modified drug release [10].
Protein-based carriers for drug delivery, including casein, are characterized by physical instability, resulting in protein aggregation and precipitation at a pH close to its isoelectric point of the protein. The incorporation of polysaccharides into the carrier structure induces steric hindrance which limits protein aggregation [11]. As a result, protein-polysaccharide composite nanoparticles have increased stability and more efficiently encapsulate hydrophilic and hydrophobic therapeutic agents [12]. These complexes also provide protection of the included substance from oxidation and hydrolysis under the influence of environmental factors such as pH, light, and temperature [13]. In addition, the colloidal network composing the nanoparticles, built of protein-polysaccharide complexes provides a delayed release of the incorporated therapeutic agent [14]. Polysaccharide complexation of proteins can be due to both covalent and non-covalent binding of biopolymers. Covalent protein-polysaccharide conjugation is due to enzymatic cross-linking (oxidases and transglutaminases), chemical cross-linking (genipin, glutaraldehyde and polyethylene glycol) or through the Maillard reaction [15].
In a study conducted by Pan et al. the Maillard reaction was used to prepare ca-sein-dextran copolymer [16]. The obtained structures showed pH-dependent behavior with micelle formation occurring at a pH equal to the isoelectric point of casein and demonstrated successful incorporation of the fluorescent agent pyrene [16].
Covalent interaction between proteins and polysaccharides also occurs because of cross-linking with transglutaminase, which catalyzes acyl-transfer reactions between the γ-carboxamide groups of glutamine residues and free amino groups [17].
Glutaraldehyde is among the most widely used chemical cross-linking agents, which provides a high degree of cross-linking of protein-polysaccharide complexes [18]. Nevertheless, the use of high concentrations of the cross-linking agent is associated with the occurrence of adverse drug reactions, such as breathing disorders, development of asthma, dermatitis, as well as irritation of the nasal mucosa and ocular conjunctiva [19].
Physical mixing of two biopolymers leads to the formation of non-covalent protein-polysaccharide bonds, which largely depends on the nature of the biopolymers, their quantitative ratio, pH of the medium and ionic strength [20]. Regarding physical protein-polysaccharide complexes, non-covalent interactions can be due to hydrogen bonding, electrostatic and hydrophobic interactions [21]. Most polysaccharides, except for chitosan, are negatively charged, and at pH values below the isoelectric point of casein, the formation of a casein-polysaccharide complex occurs [22].
Several studies on the preparation of casein-polysaccharide complexes have been reported in the literature, but only a few are related to the preparation of composite ca-sein-polysaccharide drug delivery nanocarriers. Markman et al. [23], reported the preparation of vitamin D2-loaded casein-maltodextrin nano capsules. The obtained conjugates show a high percentage of therapeutic agent incorporation efficiency (up to 90 %). Furthermore, the carrier demonstrated high colloidal stability and prevention of vitamin D2 oxidation in acidic pH conditions. Regarding the release, the carrier showed a pH-dependent behavior. Lack of release of the incorporated nutraceutical was observed at acidic pH (2.5), while at pH 7 up to 90% of the incorporated nutraceutical was re-leased, demonstrating the potential use of the carrier as a drug delivery system for targeted delivery in the small intestine. In another study, drug delivery system for epigal-locatechin-3-gallate was obtained via polyelectrolyte complexation between casein and chitosan [24]. The obtained nanostructures demonstrated average particle size of 150 nm and a high degree of biocompatibility and improved intestinal permeability of epi-gallocatechin-3-gallate. As a result of polyelectrolyte complexation, the preparation of alginate-coated casein nanoparticles loaded with doxorubicin has also been reported [25]. The results showed that after coating, the casein particles with alginate, increase of their average particle size from 264 nm to 294 nm was observed. Furthermore, the drug delivery system showed high drug loading index and encapsulation efficacy (95 %) of the cytostatic agent - doxorubicin. In vitro release was performed in two different media (pH 7.4 and pH 5) simulating systemic circulation and tumor cell pH. The results demonstrated a delayed release in alkaline pH and a more pronounced release in acidic pH [25].
One of the polysaccharides with potential application for the preparation of ca-sein-polysaccharide complexes is the biopolymer fucoidan. Fucoidan belongs to a family of sulfated, L-fucose-rich polysaccharides found in the cell wall of various species of brown algae (Phaeophyta: Laminariaceae, Fucaceae, Chordariaceae and Alariaceae) [26]. It can also be obtained from sea cucumbers (Holothuroidea: Stichopodidae, Holothuri-idae), sea urchin eggs (Echinoidea: Strongylocentrotidae, Arbaciidae) and sea grasses (Cymodoceaceae) [27]. Over 90% of the total sugar content in fucoidan consists of deoxyhexose - L-fucose [28]. Along with fucose, other monosaccharides can be found in the fucoidan structure: galactose, glucose, xylose, mannose, rhamnose, arabinose, uronic acid, and acetyl groups [29]. Although the structure and composition of fucoidans differ depending on the origin and extraction method, fucoidans can be categorized into two main types according to their monomeric subunits (Figure 1).
Type I fucoidan is composed of an α-(1→3)-α-L-fucopyranose backbone linked to sulfate radicals at the C2 and C4 positions, while type II fucoidan is composed of α-(1→3)- and α -( 1→4)-α-L-fucopyranose backbone, with sulfate radicals attached at the C2, C3, and C4 positions [28,29].
Depending on the sulfate content and molecular weight, fucoidans show different biological effects (antioxidant, antibacterial, antiviral, anticoagulant, hypolipidemic, hypoglycemic, antitumor, anti-inflammatory, and immunomodulatory). In addition to its biological activity, fucoidan also possesses suitable physicochemical properties as a drug carrier, which is confirmed by numerous reports in the literature about micro- and nanoparticles developed on this basis, liposomes, films, hydrogels, etc. [30, 31]. The polymer backbone has anionic properties due to the presence of negatively charged sulfate ester groups. Depending on the specific chemical characteristics and charge density, fucoidan can interact with various biomolecules such as proteins and other polysaccharides [32]. It is soluble in water and in acidic solutions, and its solubility depends on the molecular weight and the number of sulfate groups. The highly water-soluble fucoidans form solutions with low viscosity and are therefore not generally used as gelling agents. On the other hand, the viscoelastic properties of fucoidan are highly dependent on the origin of the polysaccharide, its concentration, molecular weight, sulfate content, pH, and temperature [27]. The interaction of fucoidan with oppositely charged biopolymers such as chitosan [33], poly (2-hydroxyethyl methacrylate) [34], soy protein isolate (SPI) [35] and lactoglobulin [36] can lead to the formation of polyelectrolyte complexes with improved characteristics for biomedical application. Polyelectrolyte complexation (complex coacervation) is one of the most widely used methods for obtaining fucoidan micro- and nanoparticles. Other common techniques for formulating drug systems from the polysaccharide are simple coacervation, ionotropic gelation, spray drying, emulsification, etc. [37].
With the possibilities of nanotechnology, the development of innovative carriers capable of providing selective and specific therapy for several diseases has long been the subject of fundamental pharmaceutical science. Polymers of natural origin such as casein and fucoidan enable the development of biodegradable nanocarriers providing modified release and targeted delivery, which significantly improves the distribution of the incorporated drugs in the body and reduces the risk of adverse drug reactions. Their complex biological effects and the ability to form electrostatic interactions provide an opportunity for the development of casein-fucoidan composite nanoscale drug delivery systems.
The aim of the present work is to develop casein-fucoidan composite nanostructures by polyelectrolyte complexation and crosslinking of the complex with glutaraldehyde. By further applying 3(k-p) fractional factorial design, the work aims to evaluate the effect of dependent variables on independent variables and outline optimal technological and process parameters for the development of effective drug delivery systems.

2. Materials

Fucoidan from Macrocystis pyrifera (11.1 kDa), sodium caseinate (from bovine milk), glutaraldehyde 25% (Mw 100.12 g/mol) were purchased from Sigma-Aldrich (St. Louis, MO, USA). All other reagents were of analytical grade.

3. Methods

3.1. Preparation of Casein/Fucoidan Composite Nanoparticles

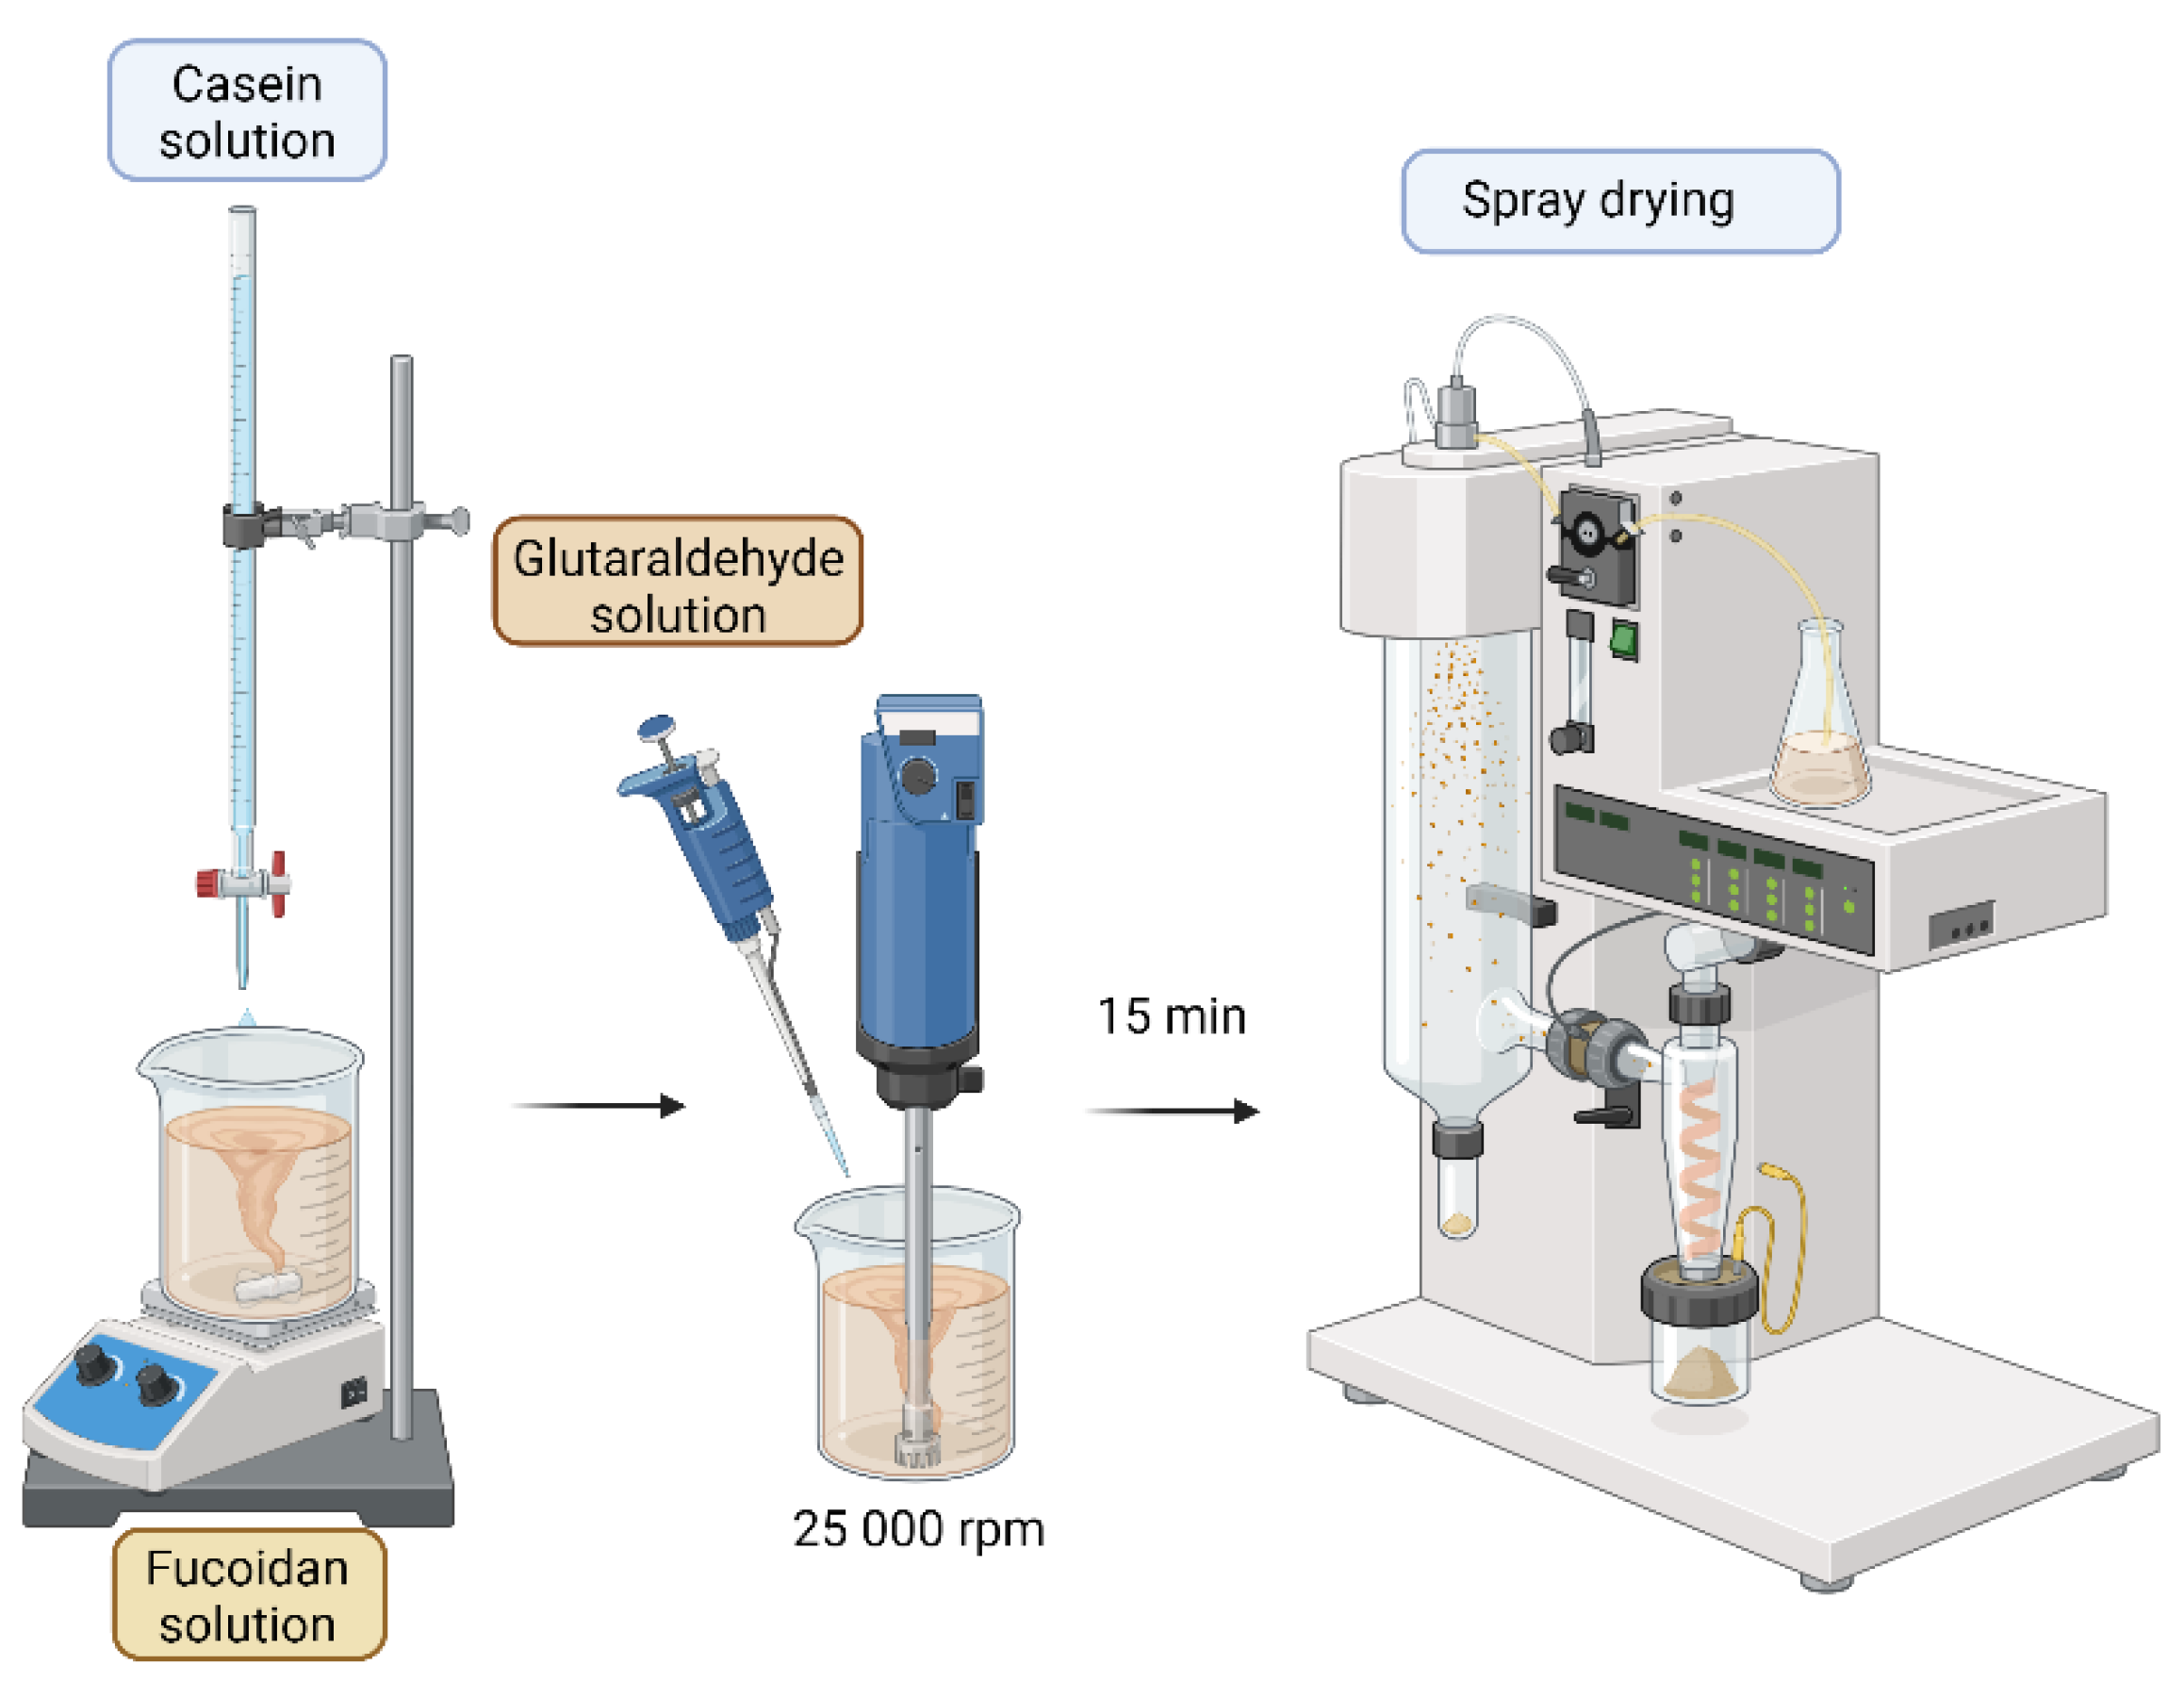
Casein/fucoidan composite nanoparticles were obtained by polyelectrolyte complexation, crosslinking of the complex with glutaraldehyde and subsequent spray drying (Figure 2).
Sodium caseinate was dissolved in deionized water pre-acidified with 0.1 M HCl solution to pH 2 to ensure protonation of the amino groups in the protein structure. For 15 min the resulting solution was added dropwise under continuous stirring at 25,000 rpm (Miccra MiniBatch D-9, MICCRA GmbH, Heitersheim, Germany) to an aqueous fucoidan solution (pH 7), negatively charged due to the presence of sulfate esters groups in its structure. As a result of the interaction of the oppositely charged biopolymers, a polyelectrolyte complex was formed, which was further cross-linked with glutaraldehyde (0.004 µL of glutaraldehyde solution for 1 mL of casein solution). The obtained nanosuspension was spray dried under the following conditions: mesh size of the spray membrane 4.0 μm; inlet temperature 30 °C; solution feed rate 30%; sputtering intensity 40%; drying gas rate 120 L/min and pressure 30 nbar. To derive optimal production conditions and study the influence of the production parameters (casein/fucoidan ratio, glutaraldehyde concentration) and the technological parameter sputtering intensity on the size, yield, and zeta potential, a 3(k-p) partial experimental design was applied. The advantage of the 3(k-p) design over the full factorial design is that not all possible combinations between independent variables are considered, which greatly reduces the number of models to be developed and therefore shortens the run time [181]. Each of the independent variables was varied at three levels: low (-1), medium (0), and high (+1), resulting in nine possible combinations. The three levels of varying the ratio of casein to fucoidan were 1:1, 2:1, 3:1, using 0.25% (w/v), 0.33% (w/v) and 0.37 % (w/v) casein solutions and 0.13% (w/v), 0.17% (w/v) and 0.25% (w/v) fucoidan solutions. Glutaraldehyde concentration was 1% (w/v), 2% (w/v) and 3% (w/v) and the sputtering intensity was 30%, 40% and 50%.

3.2. Characterization of Physicochemical Properties

3.2.1. Production Yield

The production yields of the obtained nanoparticles from different batches were calculated according to Equation (1):
P r o d i c t i o n y i e l d % = S p r a y d i e d n a n o p a r t i c l e s m g C a s e i n m g + F u c o i d a n m g × 100

3.2.2. Particle Size Analysis, Size Distribution, and Zeta Potential

The particle size of the obtained casein/fucoidan composite structures was analyzed by dynamic light scattering (Microtrac, York, PA, USA). The system measures the particle size in the range of 0.8 nm to 6.5 µm with non-invasive backscattering technology using a 3-mW helium/neon laser at a 780 nm wavelength. The system allows measurements of ζ-potential in the range from −200 mV to +200 mV. All analyses were performed in triplicates at 25 °C.

3.2.3. Scanning Electron Microscopy

Visualization of the obtained structures was performed using scanning electron microscopy (Prisma E SEM, Thermo Scientific, Waltham, MA, USA). The samples were loaded on a copper sample holder and sputter coated with carbon followed by gold using a vacuum evaporator (Quorum Q150T Plus, Quorum Technologies, UK). The images were recorded at 20 kV acceleration voltage, 10 000x magnifications using an ETD (Everhart–Thornley) detector.

3.2.4. Fourier Transform Infrared Spectroscopy (FTIR)

The structural characteristics of casein, fucoidan as well as the Cas/FN composite nanoparticles were characterized by FTIR. The spectra were collected in the range from 600 cm−1 to 4000 cm−1 with a resolution 4 nm and 16 scans, using a Nicolet iS 10 FTIR spectrometer (Thermo Fisher Scientific, Pittsburg, PA, USA). The instrument is equipped with a diamond attenuated total reflection (ATR) accessory and the spectra were analyzed with OMNIC® software package (Version 7.3, Thermo Electron Corporation, Madison, WI, USA).

3.2.5. Differential Scanning Calorimetry (DSC)

The thermal stability and phase state of the substances in the composition of the final structures were investigated using a differential scanning calorimeter DSC 204F1 Phoenix (Netzsch Gerätebau GmbH, Selb, Germany). An indium standard (Tm = 156.6 °C, ΔHm = 28.5 J/g) was used for temperature and heat flux calibration. The sample for analysis was placed in an aluminum crucible and hermetically sealed, then heated in a temperature range of 25 °C to 300 °C at a heating rate of 10 °C/min. The results were processed by Proteus software (Netzsch Gerätebau GmbH, Selb, Germany), and the obtained thermograms reflect the variation of the heat flux relative to the mass of the sample as a function (mW/mg) of the temperature.

3.3. Experimental Design and Statistical Analysis

To determine the optimal conditions for the preparation of the composite structures and to study the influence of the production and technological parameters over the main structural and morphological characteristics of the particles, a 3(k-p) fractional factorial design is applied.
Three optimal experimental responses were studied: production yield (Y1), average particle size (Y2) and zeta potential (Y3). They were the results of the individual influence and the linear interactions of the three independent variables. Hence the responses were modelled by the following linear polynomial model:
Y=β0 + β1X1 + β2X2 + β3X3 + β4X1 X2 + β5X1 X3 + β6X2 X3
The results of these experiments were compared using analysis of variance (ANOVA), which was able to determine if the factors were significant. To test whether the terms were significant in regression model, t-tests were performed using a 95% (α=0.05) level of significance. Furthermore, F-test was used to determine if there was overall regression relationship between the response variable Y and independent variables X1, X2, X3 and their linear interactions at 95% (α=0.05) level of significance. The statistical analysis was performed using Statistica 8 (TIBCO Software Inc., California, USA).

4. Results

4.1. Preliminary Experiments

Since the purposed method for the preparation of the structures is one of its kind it was necessary to define the technological parameters for the preparation of the composites by the method of spray drying.

4.1.1. Optimal Spray Head Mesh Size

To determine the optimal spray head mesh size, a suspension containing casein-fucoidan composite nanostructures obtained at a casein:fucoidan ratio of 1:1 and cross-linked with 1% glutaraldehyde solution was sprayed through three spray mesh heads with a pore size 4 µm, 5.5 µm and 7 µm, at inlet temperature 30°C, solution feed rate 30%, spray intensity 30% and drying gas rate 120 L/min. The results showed that the increase in the spray mesh head leads to increase in the particle size of the obtained structures. Since the aim was to obtain particles with sizes between 100 nm and 500 nm, 4 μm was chosen as the optimal spray head mesh size, providing the formation of composite particles with an average size of 137.22 ± 21 nm.

4.1.2. Inlet Temperature and Solution Feed Rate

Since casein denatures at temperatures above 60 °C, in order to maintain the stability of the protein, temperature of 30 °C was chosen as optimal for the spray drying.
To determine the optimum solution feed rate of the process, a suspension containing casein-fucoidan composite nanostructures prepared at a casein:fucoidan ratio of 1:1 and cross-linked with 1% glutaraldehyde was spray dried at an inlet temperature of 30⁰C, spray mesh head 4 µm, spray intensity of 30%, gas flow rate 120 L/min and solution feed rate varying from 30% to 60%. The results showed that spraying at 20% solution feed rate led to the formation of smaller particles 122 ± 27 nm, but the spray drying time was prolonged. Spray drying at a solution feed rate of 30% and 40% resulted in the production of structures with average particle size of 147 ± 28 nm and 388 ± 21 nm. Further increase in the solution feed rate up to 50% resulted in the production of larger particles with average size of 602 ± 35 nm. Based on the obtained results, the optimum solution feed rate to was set to 30 %.

4.1.3. Gas Flow Rate

The optimum gas flow rate was found in the atomization of a suspension containing casein-fucoidan composite nanostructures prepared at a casein:fucoidan ratio of 1:1 and cross-linked with 1% glutaraldehyde and spray dried at an inlet temperature of 30⁰C, spray mesh head 4 µm, spray intensity of 30%, solution feed rate 30% and varying gas flow rate from 90 L/min to 120 L/min. The results showed that spray drying at a gas flow rate of 90 L/min was inefficient and resulted in deposition of the polymer to the walls of the glass chamber. Increasing the gas flow rate to 100 L/min led to effective drying of a small part of the feeding suspension, but at the same time a part of the polymer was deposited on the walls of the glass chamber. Further increase of the gas flow rate to 120 L/min resulted in efficient drying of the suspension and the formation of composite structures demonstrating a significant yield (64.8 ± 3.0) %. As a result of these preliminary tests, gas flow rate of 120 L/min was selected as optimal for the spray drying of the composites.

4.1.4. Spray Intensity

Based on the literature review regarding the technological parameters affecting the process of nano spray drying, it was found that the spray intensity to a great extent affects the main characteristics of the obtained particles. Therefore, the influence of this technological parameter on the structural-morphological characteristics of the obtained particles was determined by applying appropriate factorial design.

4.2. Experimental Design

To determine the optimal conditions and to study the influence of the production parameters (casein/fucoidan ratio, glutaraldehyde concentration) and the technological parameter spray intensity on the size, yield and zeta potential, a 3(k-p) fractional factorial design was applied. The dependent variables were production yield (Y1), average particle size (Y2) and zeta potential (Y3), and the independent variables were casein:fucoidan ratio (X1), glutaraldehyde concentration (X2) and spray intensity (X3) (Table 1). Each of the independent variables was varied at three levels: low (-1), medium (0) and high (+1), resulting in 9 possible combinations (Table 2).
To estimate the effects of the independents on the dependent variables and to generate polynomial equations for predicting the response, linear regression analysis and analysis of variance (One way ANOVA) were applied using Statistica (TIBCO Software Inc., California, USA). The main effects of the independent variables, which represent the mean values reflecting the change of an independent variable from its lowest to its highest level on the dependent variables are presented in Table 3.
The main regression coefficients presented in the table, which apply to the linear equation, can be used to predict the responses at different levels of variation.
Y=β0 + β1X1 + β2X2 + β3X3 + β4X1 X2 + β5X1 X3 + β6X2 X3
β0 represents the intercept with the y-axis; X1, X2, X3 are the observed effects of the independent variables; X1 X2, X1 X3 and X2 X3 are the observed effects of the interaction, while β1 to β6 demonstrate the linear regression coefficients. After the evaluation of the main effects (Table 6), the determination of the significant independent variables for each dependent variable is performed by analysis of variation (One Way ANOVA) (Table 4).
In the table, the sum of squares (SS) provides information for estimating the main effects of the factors, and the F-values represent the ratios of the corresponding mean squared effects and mean squared errors [38]. The table also presents the p-values that show the statistical significance of each factor (p < 0.05).
Based on the data obtained from the analysis of variations, in terms of F and p-values, the statistical significance of each of the independent variables, as well as their combined interaction on the investigated dependent variables, can be determined. The independent variables that demonstrate the highest F-values and p < 0.05 are the main factors having a statistically significant impact on the studied dependent variables [38].
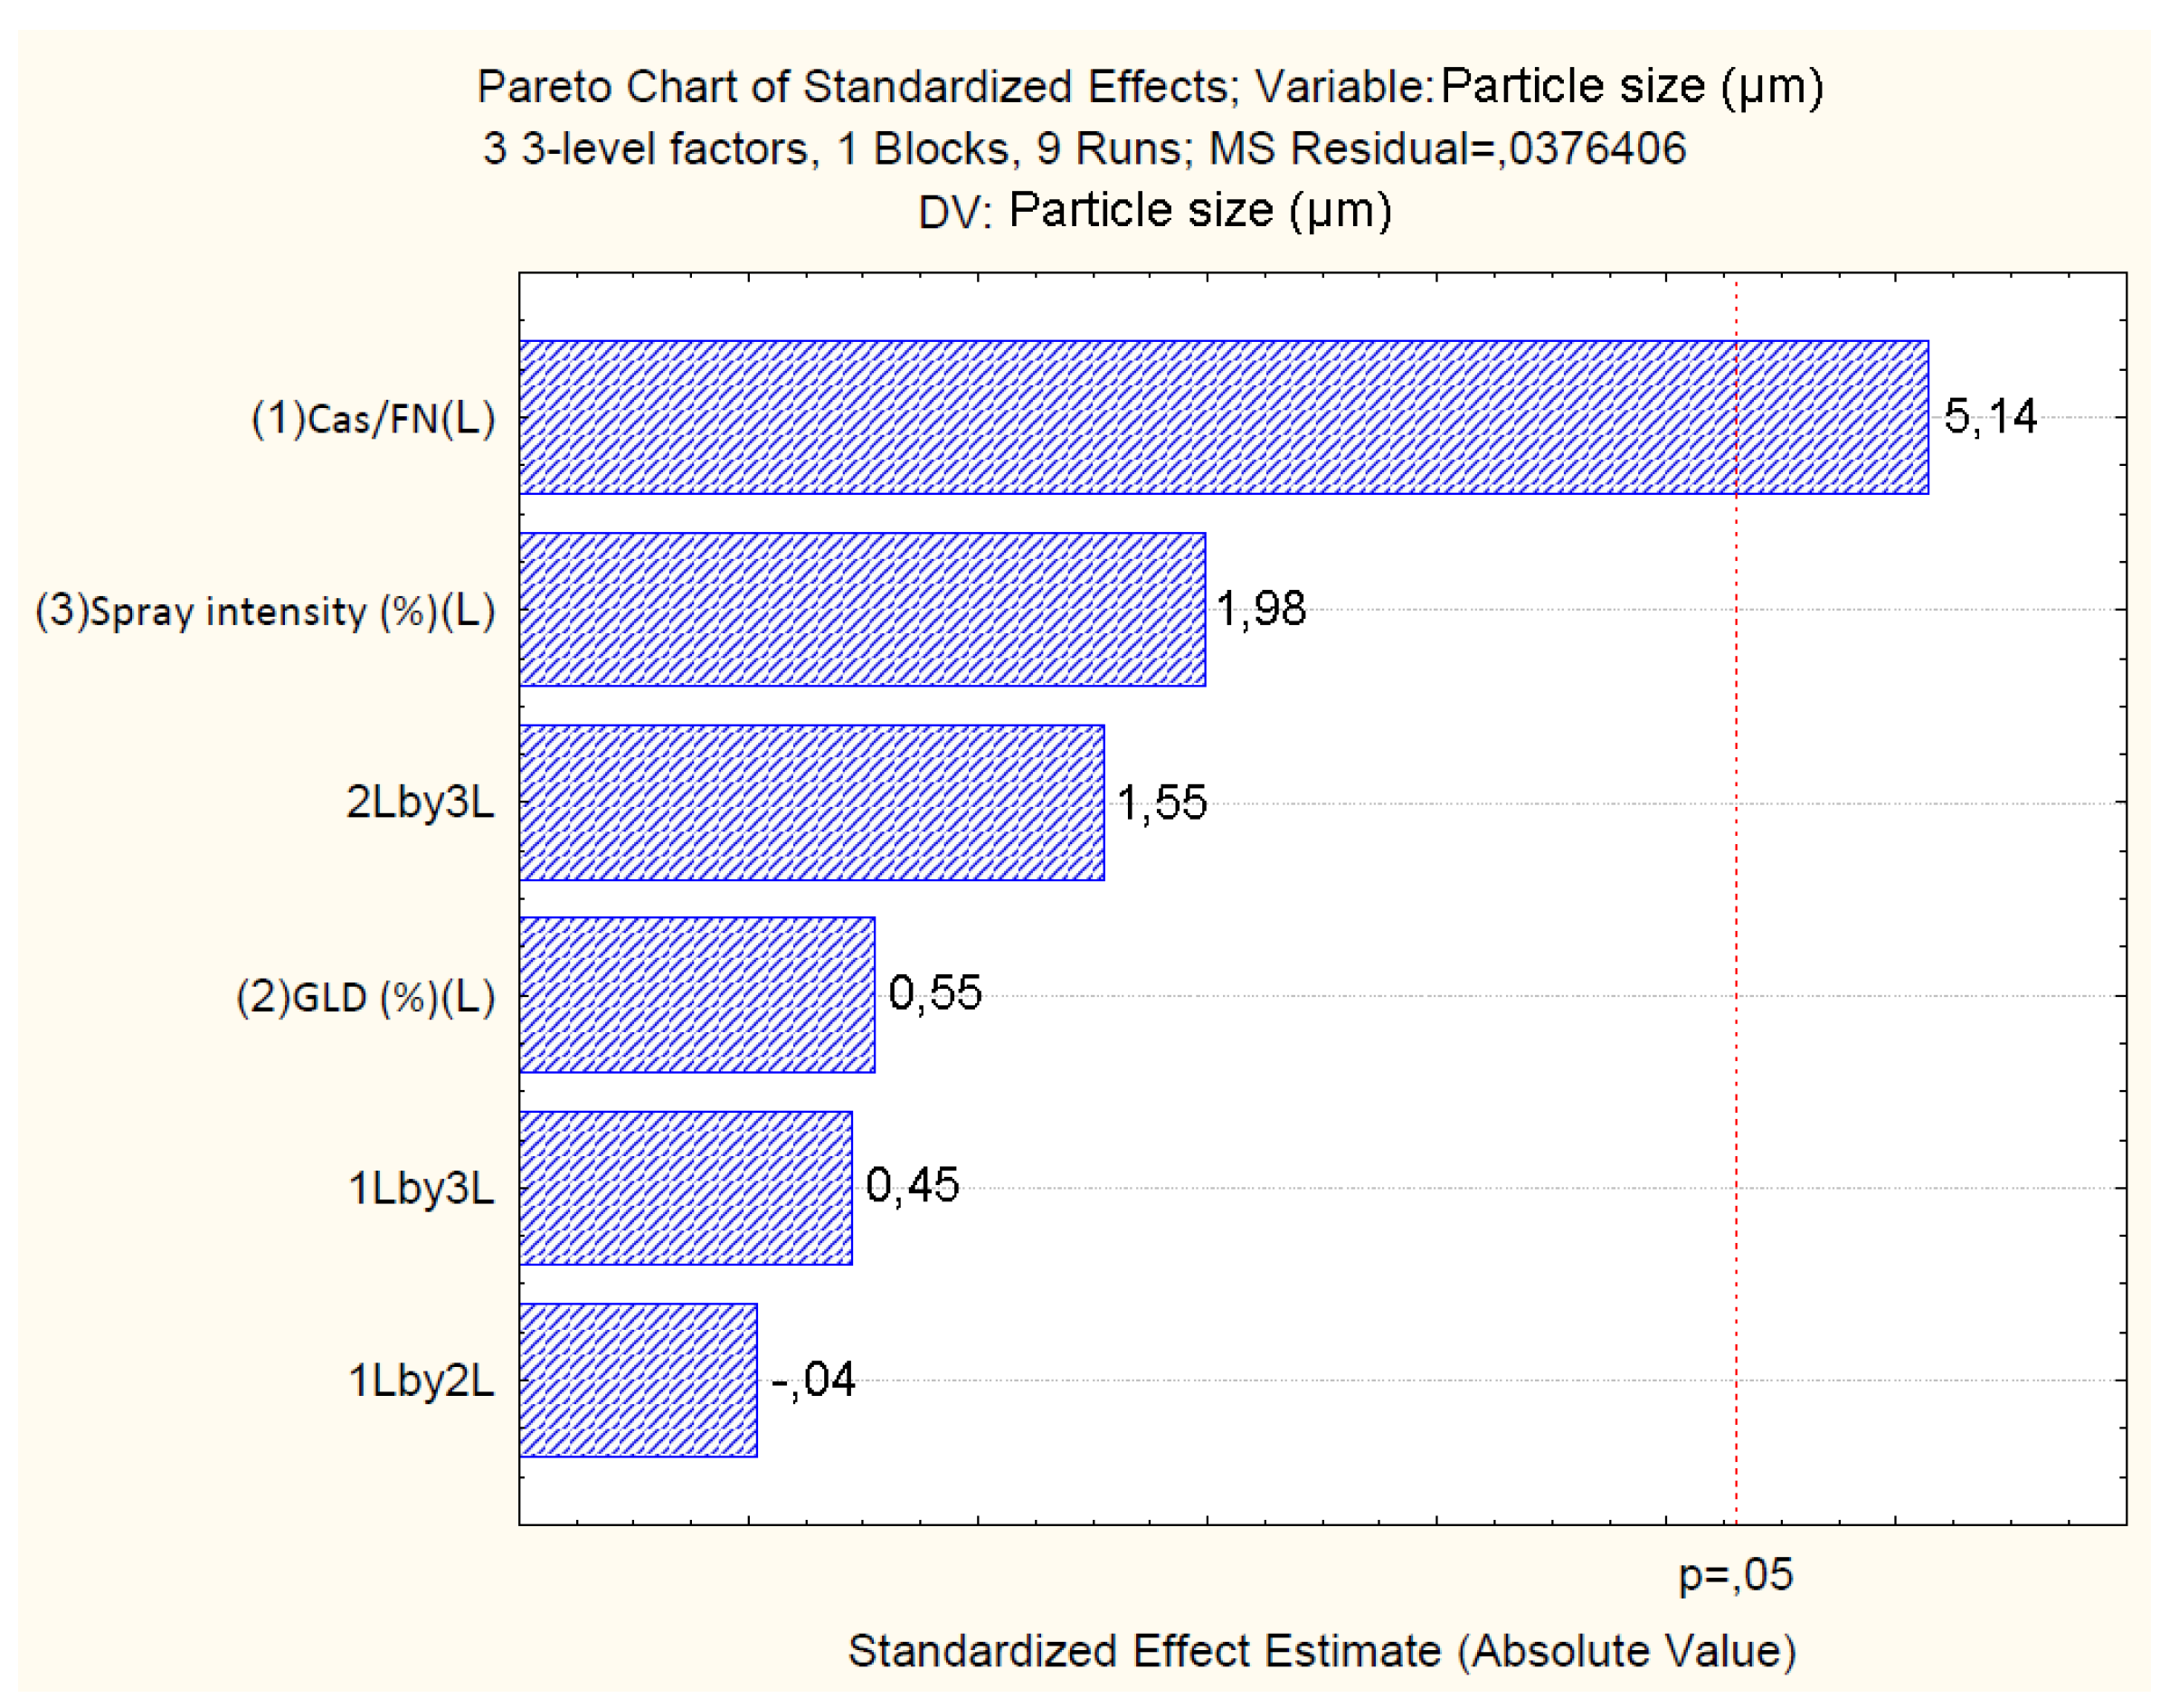
The results show that the linear increase of casein/fucoidan ratio, spray intensity and the linear interaction between casein/fucoidan and glutaraldehyde, as well as the interaction between glutaraldehyde and spray intensity has a statistically significant effect on production yield (p < 0.05). Regarding particle size and zeta potential, only a linear increase in the casein/fucoidan ratio has a statistically significant effect (p < 0.05). The standardized effects of the independent variables are represented by Pareto charts, which rank the effects of the independent variables on the dependent variables in terms of their significance.

4.2.1. Effect of Independent Variables on Particle Yield

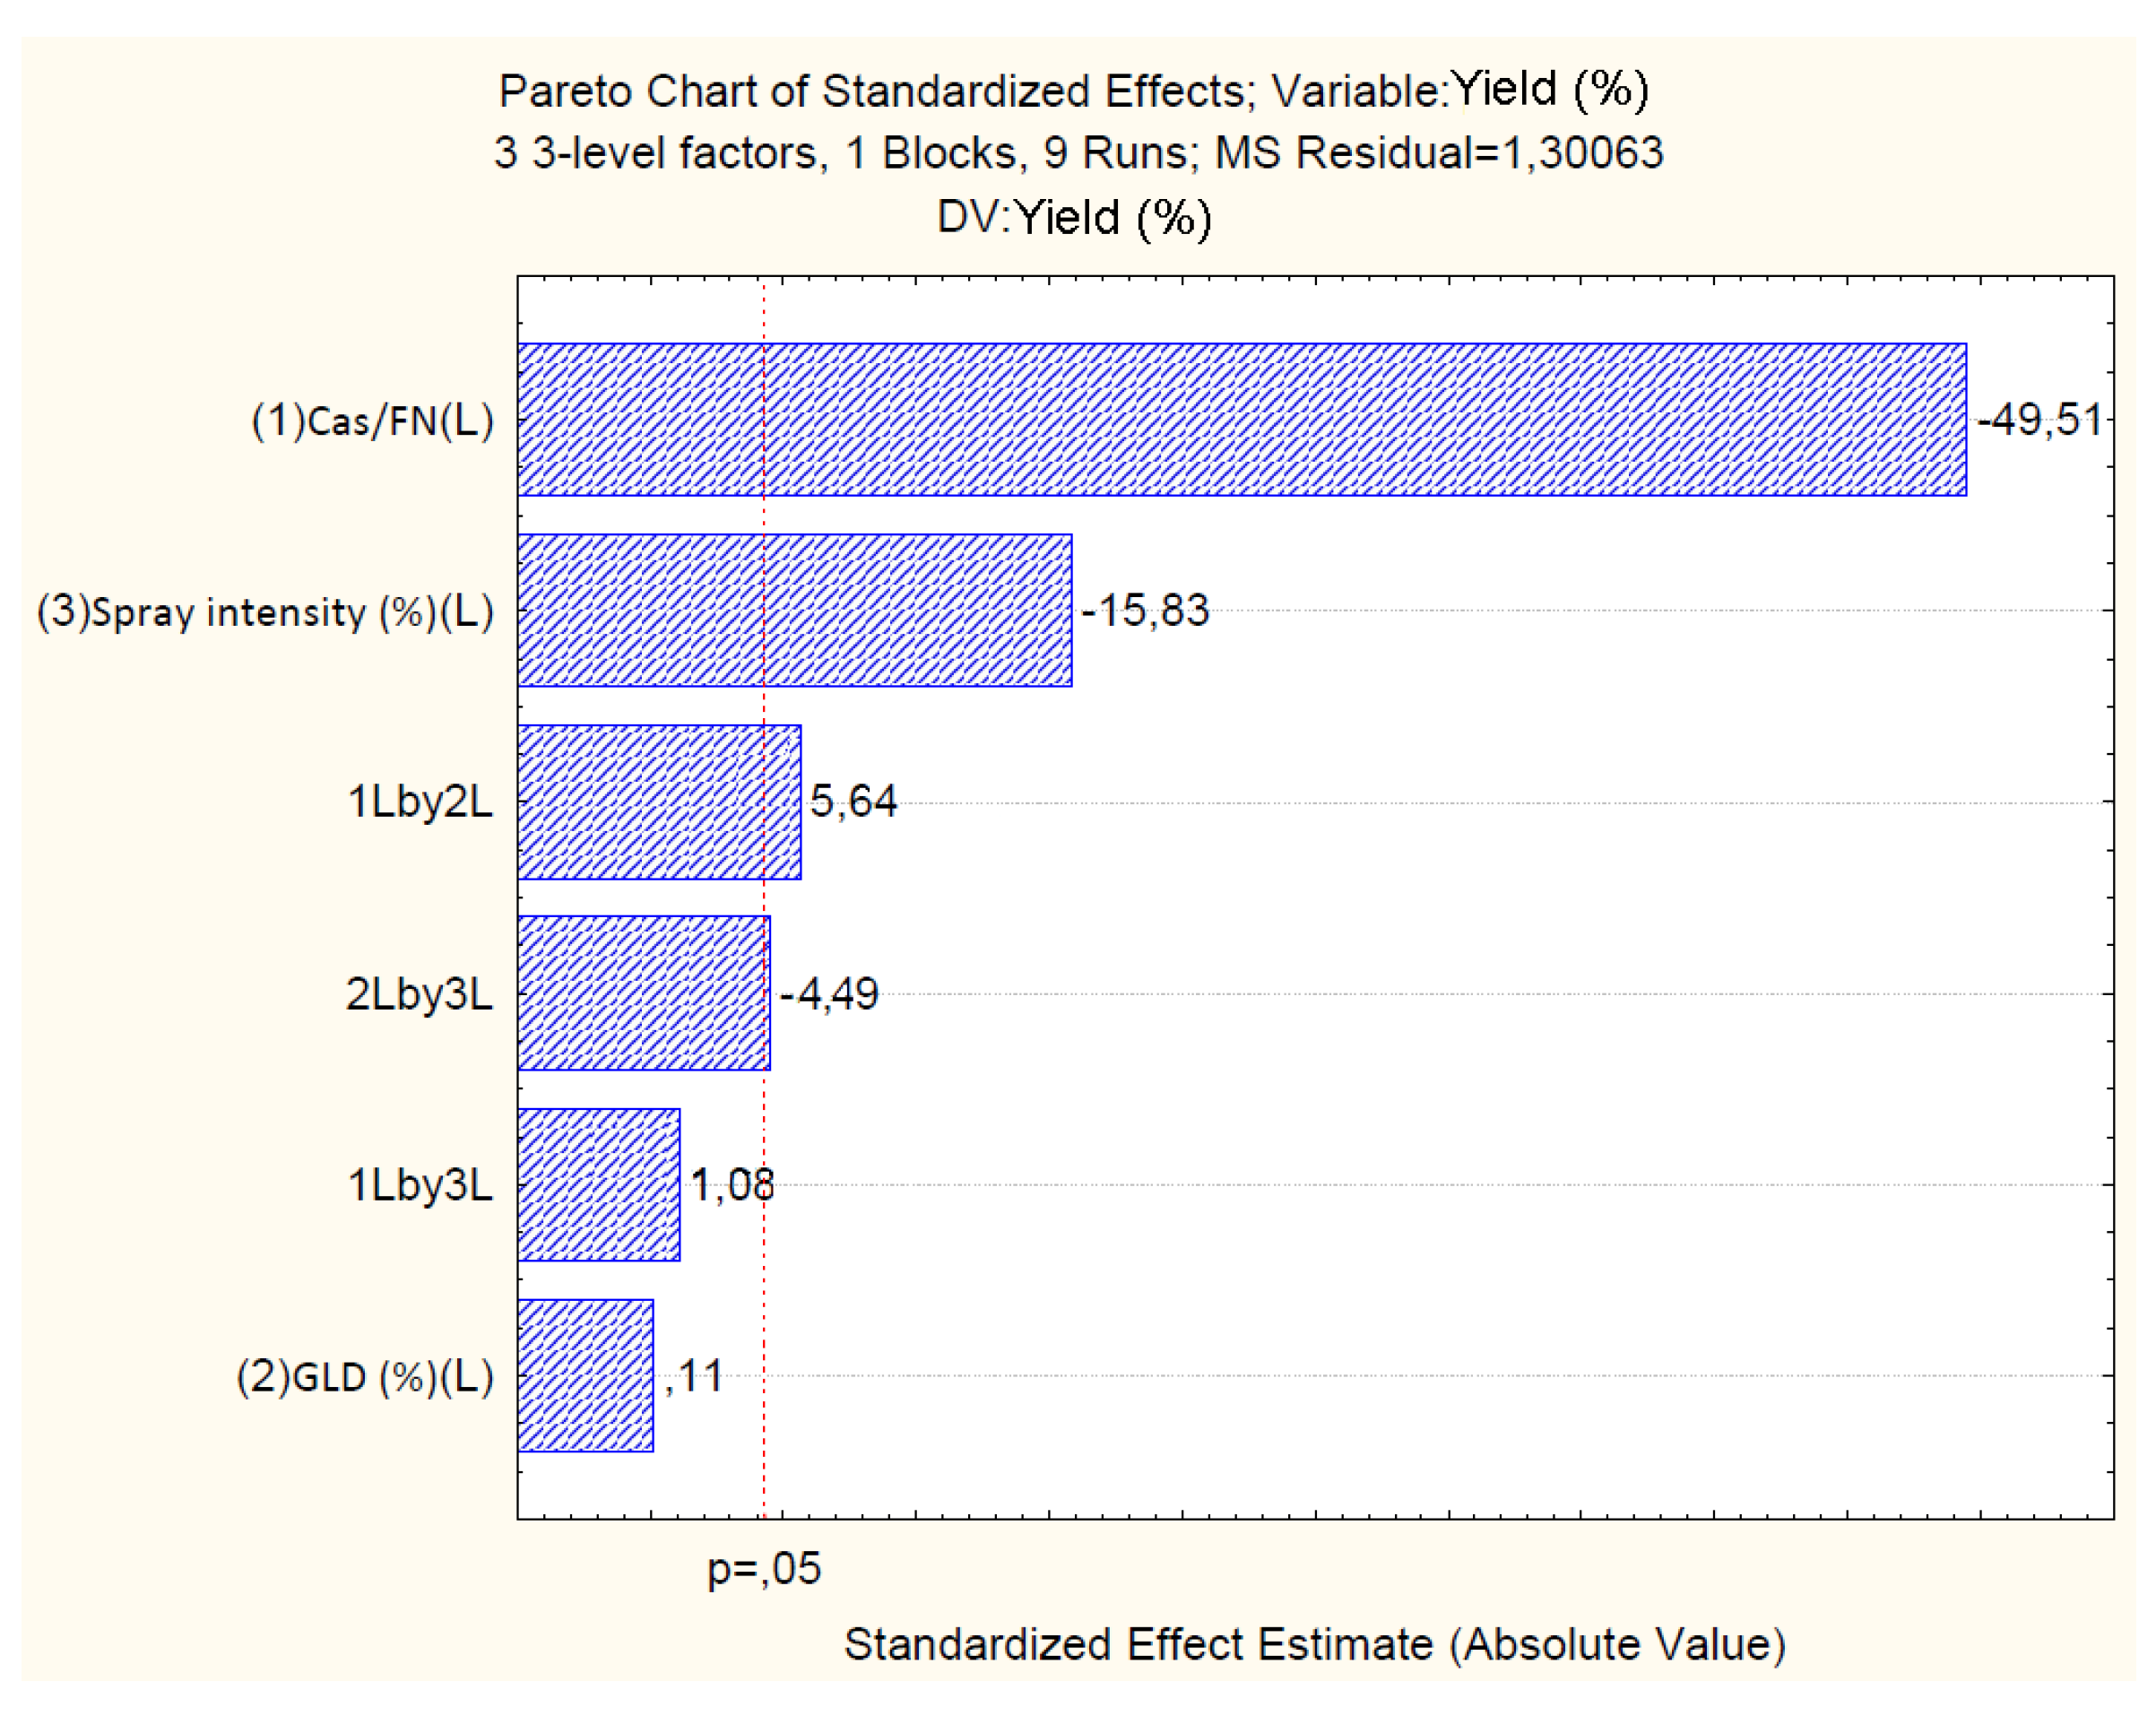
The standardized effects of the independent variables are represented by the Pareto chart (Figure 3), which confirms the results of the analysis of variance (One way ANOVA) and shows that casein/fucoidan ratio (X1), spray intensity (X3), linear interaction between casein/fucoidan ratio and glutaraldehyde concentration (X1X2), as well as the linear interaction between glutaraldehyde concentration and spray intensity (X2X3) has a statistically significant effect on the yield (p > 0.05) (Table 4).
Particle yield varied from (5.21 ± 2.2) % to (66.41 ± 2.2) % (Table 2). The model suggested that increasing the casein/fucoidan ratio as well as increasing the spray intensity led to a decrease in the yield. A similar antagonistic effect on yield was also observed with the simultaneous increase of the casein/fucoidan ratio and spray intensity. Furthermore, the model suggested that an increase in glutaraldehyde concentration and spray intensity led to an increase in the particle yield, as shown in Table 4. The two-way linear interaction between X1 and X2, as well as X2 and X3, demonstrated the change in the response that occured when two independent variables were changed simultaneously. Positive coefficients indicated a synergistic effect and negative coefficients indicated an antagonistic effect on the response [39].
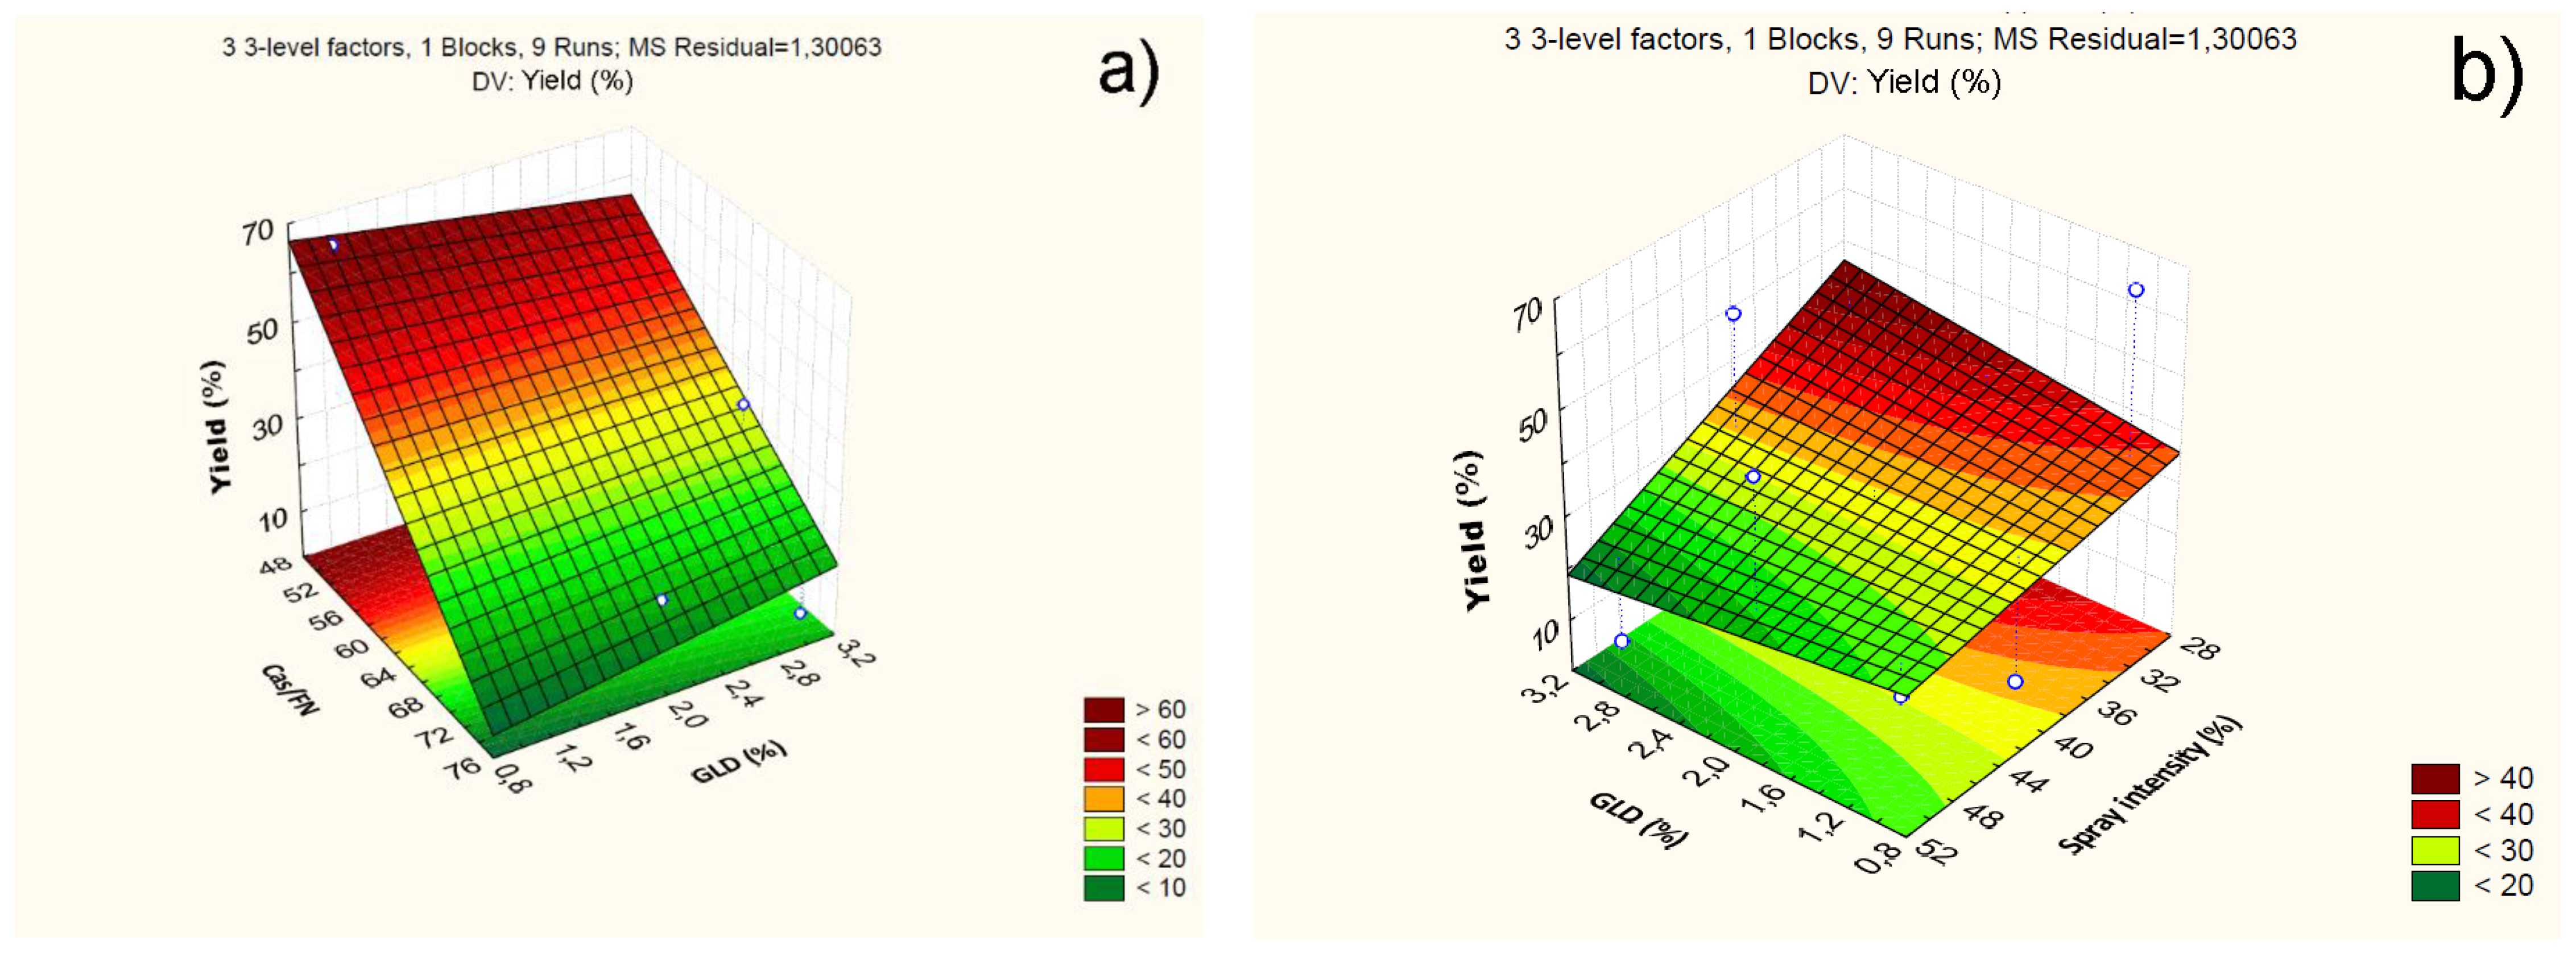
The influence of the statistically significant independent variables, as well as their complex influence on the yield, is further presented through 3D surface plots (Figure 4). The results prove that there is a tendency to increase the yield from (53.72 ± 1.9) % to (66.4 ± 2.2) %, when decreasing casein/fucoidan from 3:1 to 1:1 and decreasing glutaraldehyde concentration from 3 % (w/v) to 1 % (w/v) (Figure 4a). Probably, at higher concentrations of casein and glutaraldehyde, the viscosity of the feed suspension increases, which leads to an inefficient spray drying [40].
On the other hand, as the spray intensity decreases from 40% to 30% and the glutaraldehyde concentration increases from 1% (w/v) to 3% (w/v), there is a tendency of an increase in the yield from (38.03 ± 1.8) % to (48.91 ± 2.9) % (Figure 4b). Probably, under these conditions, an effective crosslinking of the polyelectrolyte complex occurs, reducing the viscosity of the feed suspension, which in turn leads to its effective atomization at 30%. Increasing the spray intensity leads to the generation of a larger number of droplets per unit time, which coalesce and form irregularly shaped structures [40,41].
A linear regression analysis is applied to examine the fit of experimental to predicted data obtained in terms of particle yield [42]. A linear polynomial equation is generated based on the yield regression coefficients:
Yield = 207,54-2,686.X1-6,4087.X2-0,4995.X3+0,3075X1.X2+0,0059X1.X3-0,3188.X2.X3
A correlation is observed between the experimental and the predicted data, which is confirmed by the coefficient of determination of the linear polynomial equation (R2 = 0.99). The value for the adjusted coefficient of determination (R2adj = 0.99) confirms that 99% of the obtained data can be explained by the model. The observed experimental data as well as the predicted data by the model are presented in Table 5.
One way ANOVA (One Way ANOVA) was applied to estimate the significance of the model and its application for predicting the response at different levels of variation of the independent variables (Table 6). The obtained data present a significant model describing the influence of the independent variables, values Prob > F value and p < 0.05 (p = 0.002).
Table 6. ANOVA significance testing of the proposed model.
R2 R2adj. SS df MS SS df MS F p
0.999 0.997 3629.92 6 604.98 2.601 2 1.300 465.148 0.002
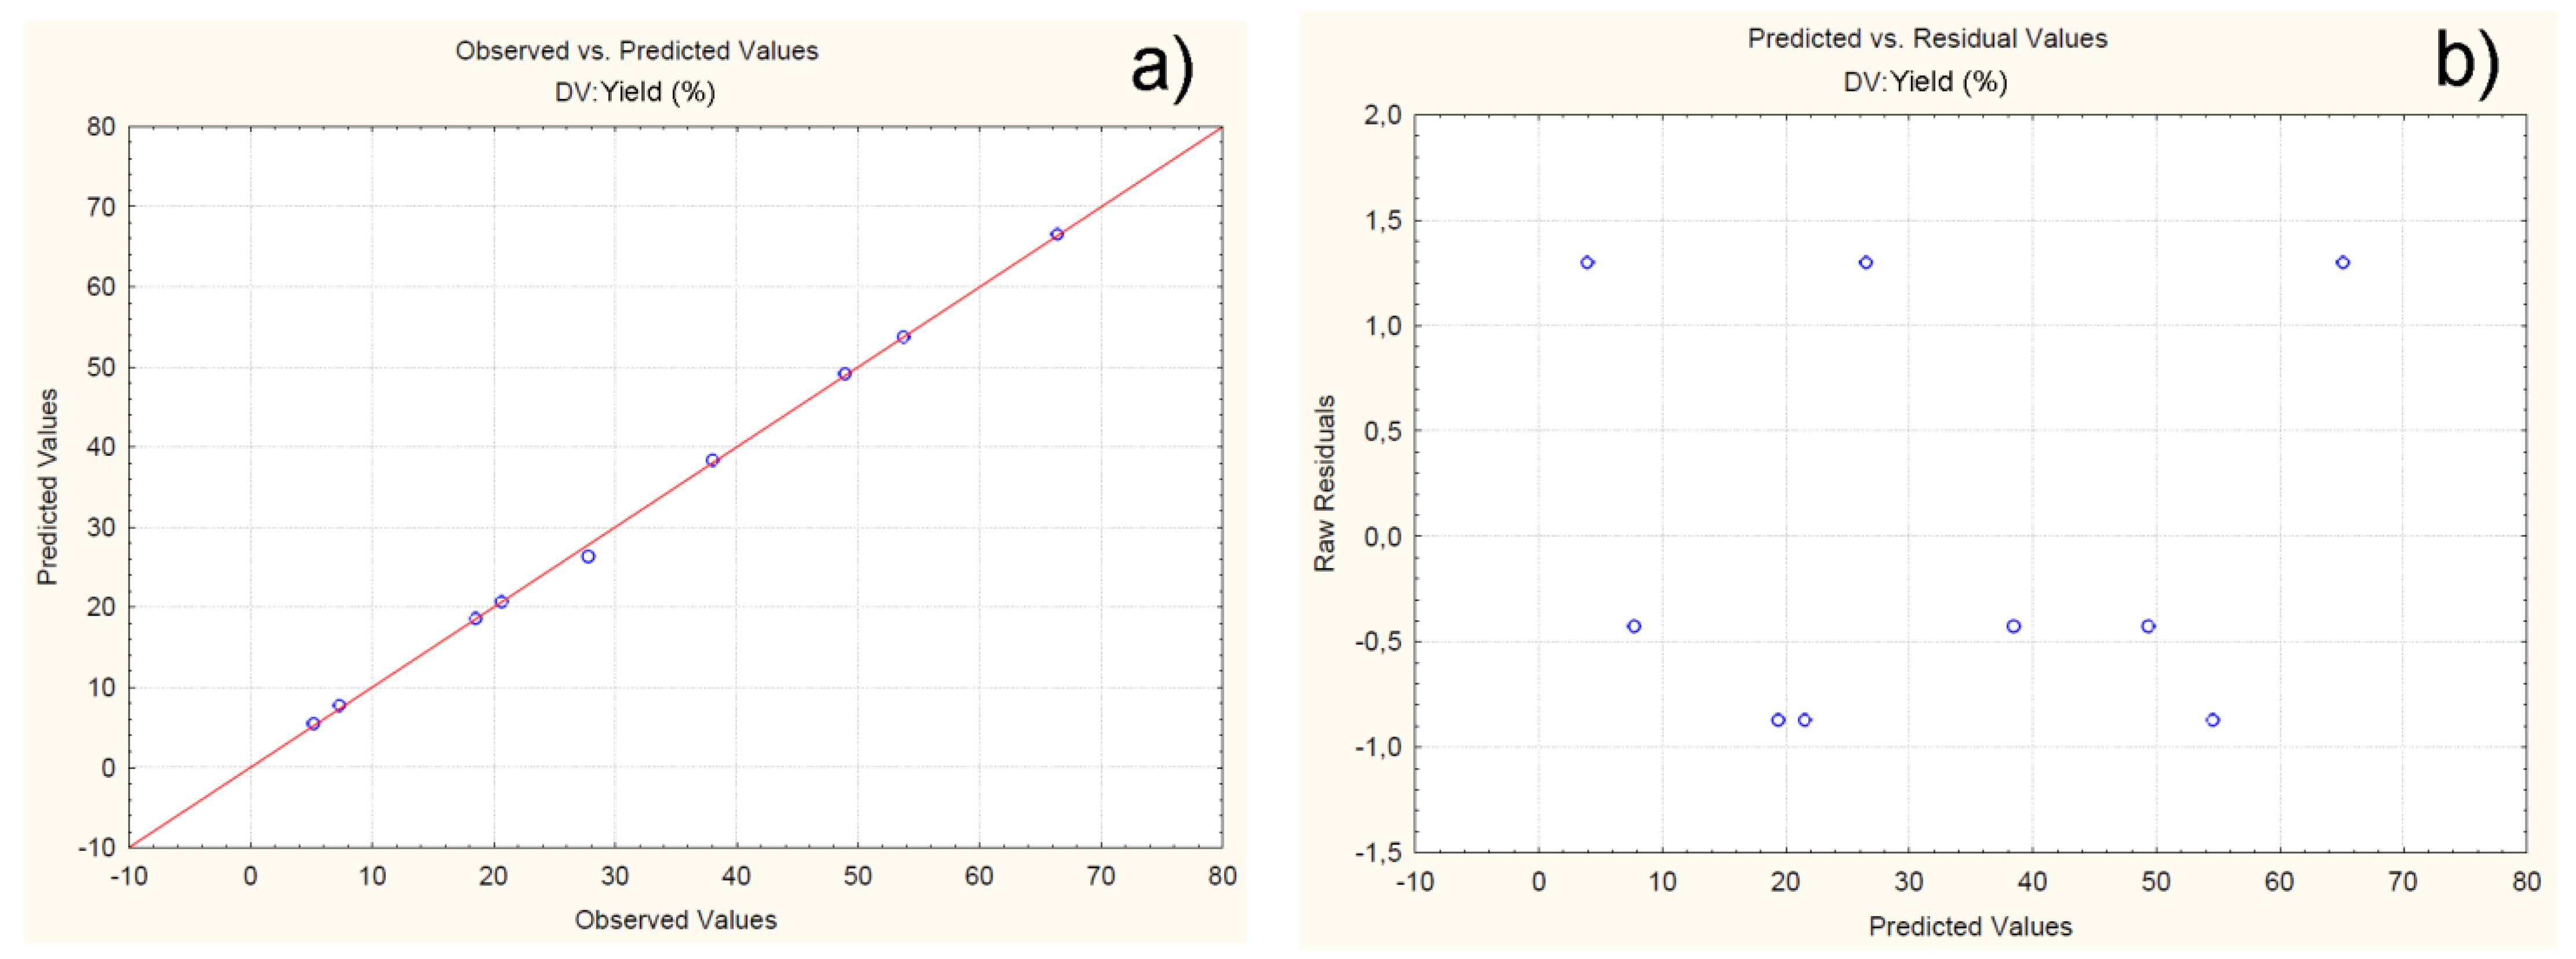
For the developed model, the possibility of observing constant variation and normal distribution of errors is assumed. To verify this claim, a normal probability plot of the residuals is generated Figure 5a. The residuals are the differences in values between the experimental and predicted values of the response. The closer the residuals are to the theoretically expected, the more reliable the model is for predicting the response. From Figure 5a it can be clearly observed that all of the experimental values are close to the theoretically expected (Figure 5a). Figure 5b is a plot representing the residuals versus the predicted response values. The presented in Figure 5b results show that the residuals are symmetrically located and tend to cluster in the low values of the Y-axis. Based on the obtained data, it can be assumed that the proposed model is adequate, in terms of its ability to predict the response, at different levels of variation of the independents.

4.2.2. Effect of Independent Variables on Particle Size

The standardized effects of the independent variables on particle size are represented by the Pareto chart (Figure 6), which confirms the results from the analysis of variance (Table 4) and shows that only the casein/fucoidan ratio has a statistically significant effect on the yield of the nanoparticles (p > 0.05), while the remaining variables (X1 X2) as well as their combined effects (X1X2, X1X3, X2X3) does not have a statistically significant effect on particle size.
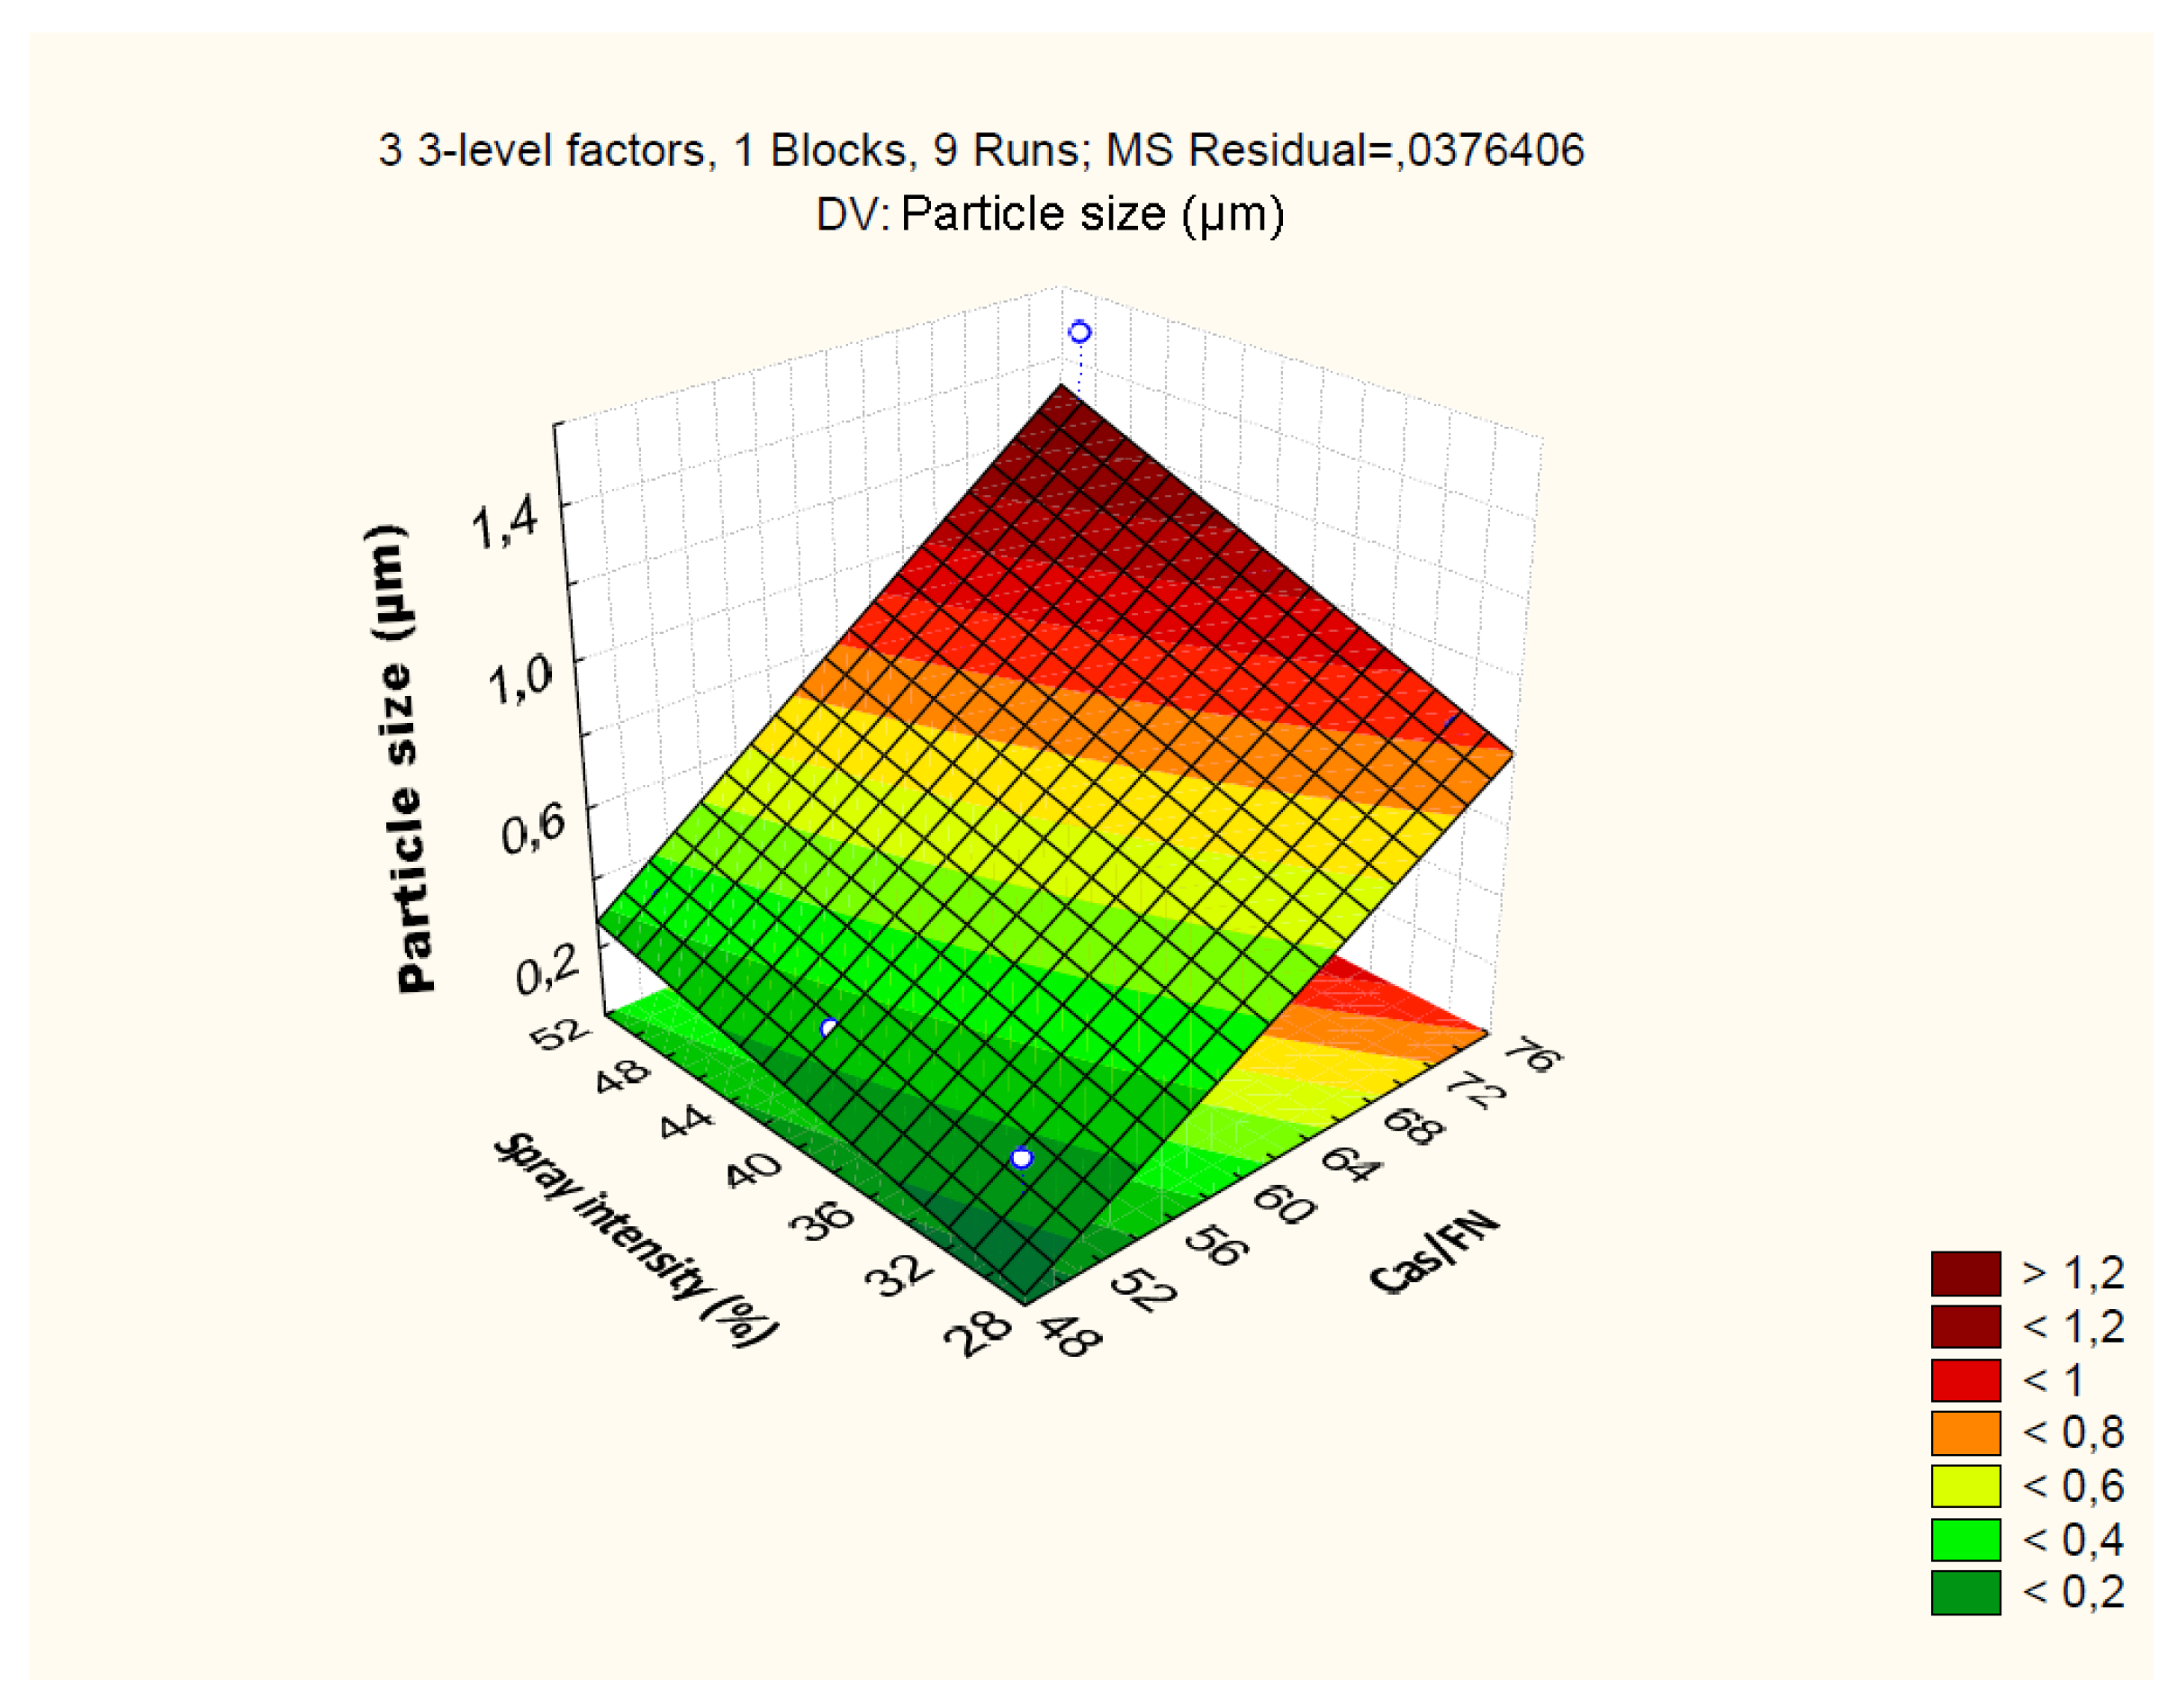
The relationship between the independent and dependent variables is further represented by 3D surface plots (Figure 7). The figure visualizes the trend of decrease of the particle size from (1515 ± 353) nm to (265 ± 32) nm with decrease in the casein/fucoidan ratio from 3:1 to 1:1 and decrease of the glutaraldehyde concentration from 3 % (w/v) to 1 % (w/v). On one hand, probably, when equivalent amounts of the two biopolymers are used, an effective polyelectrolyte complexation occurs leading to the formation of more dense particles [43]. On the other hand, low concentrations of glutaraldehyde are sufficient to saturate the free functional groups and ensure effective covalent cross-linking of the complex and the formation of smaller composite nanostructures [44].
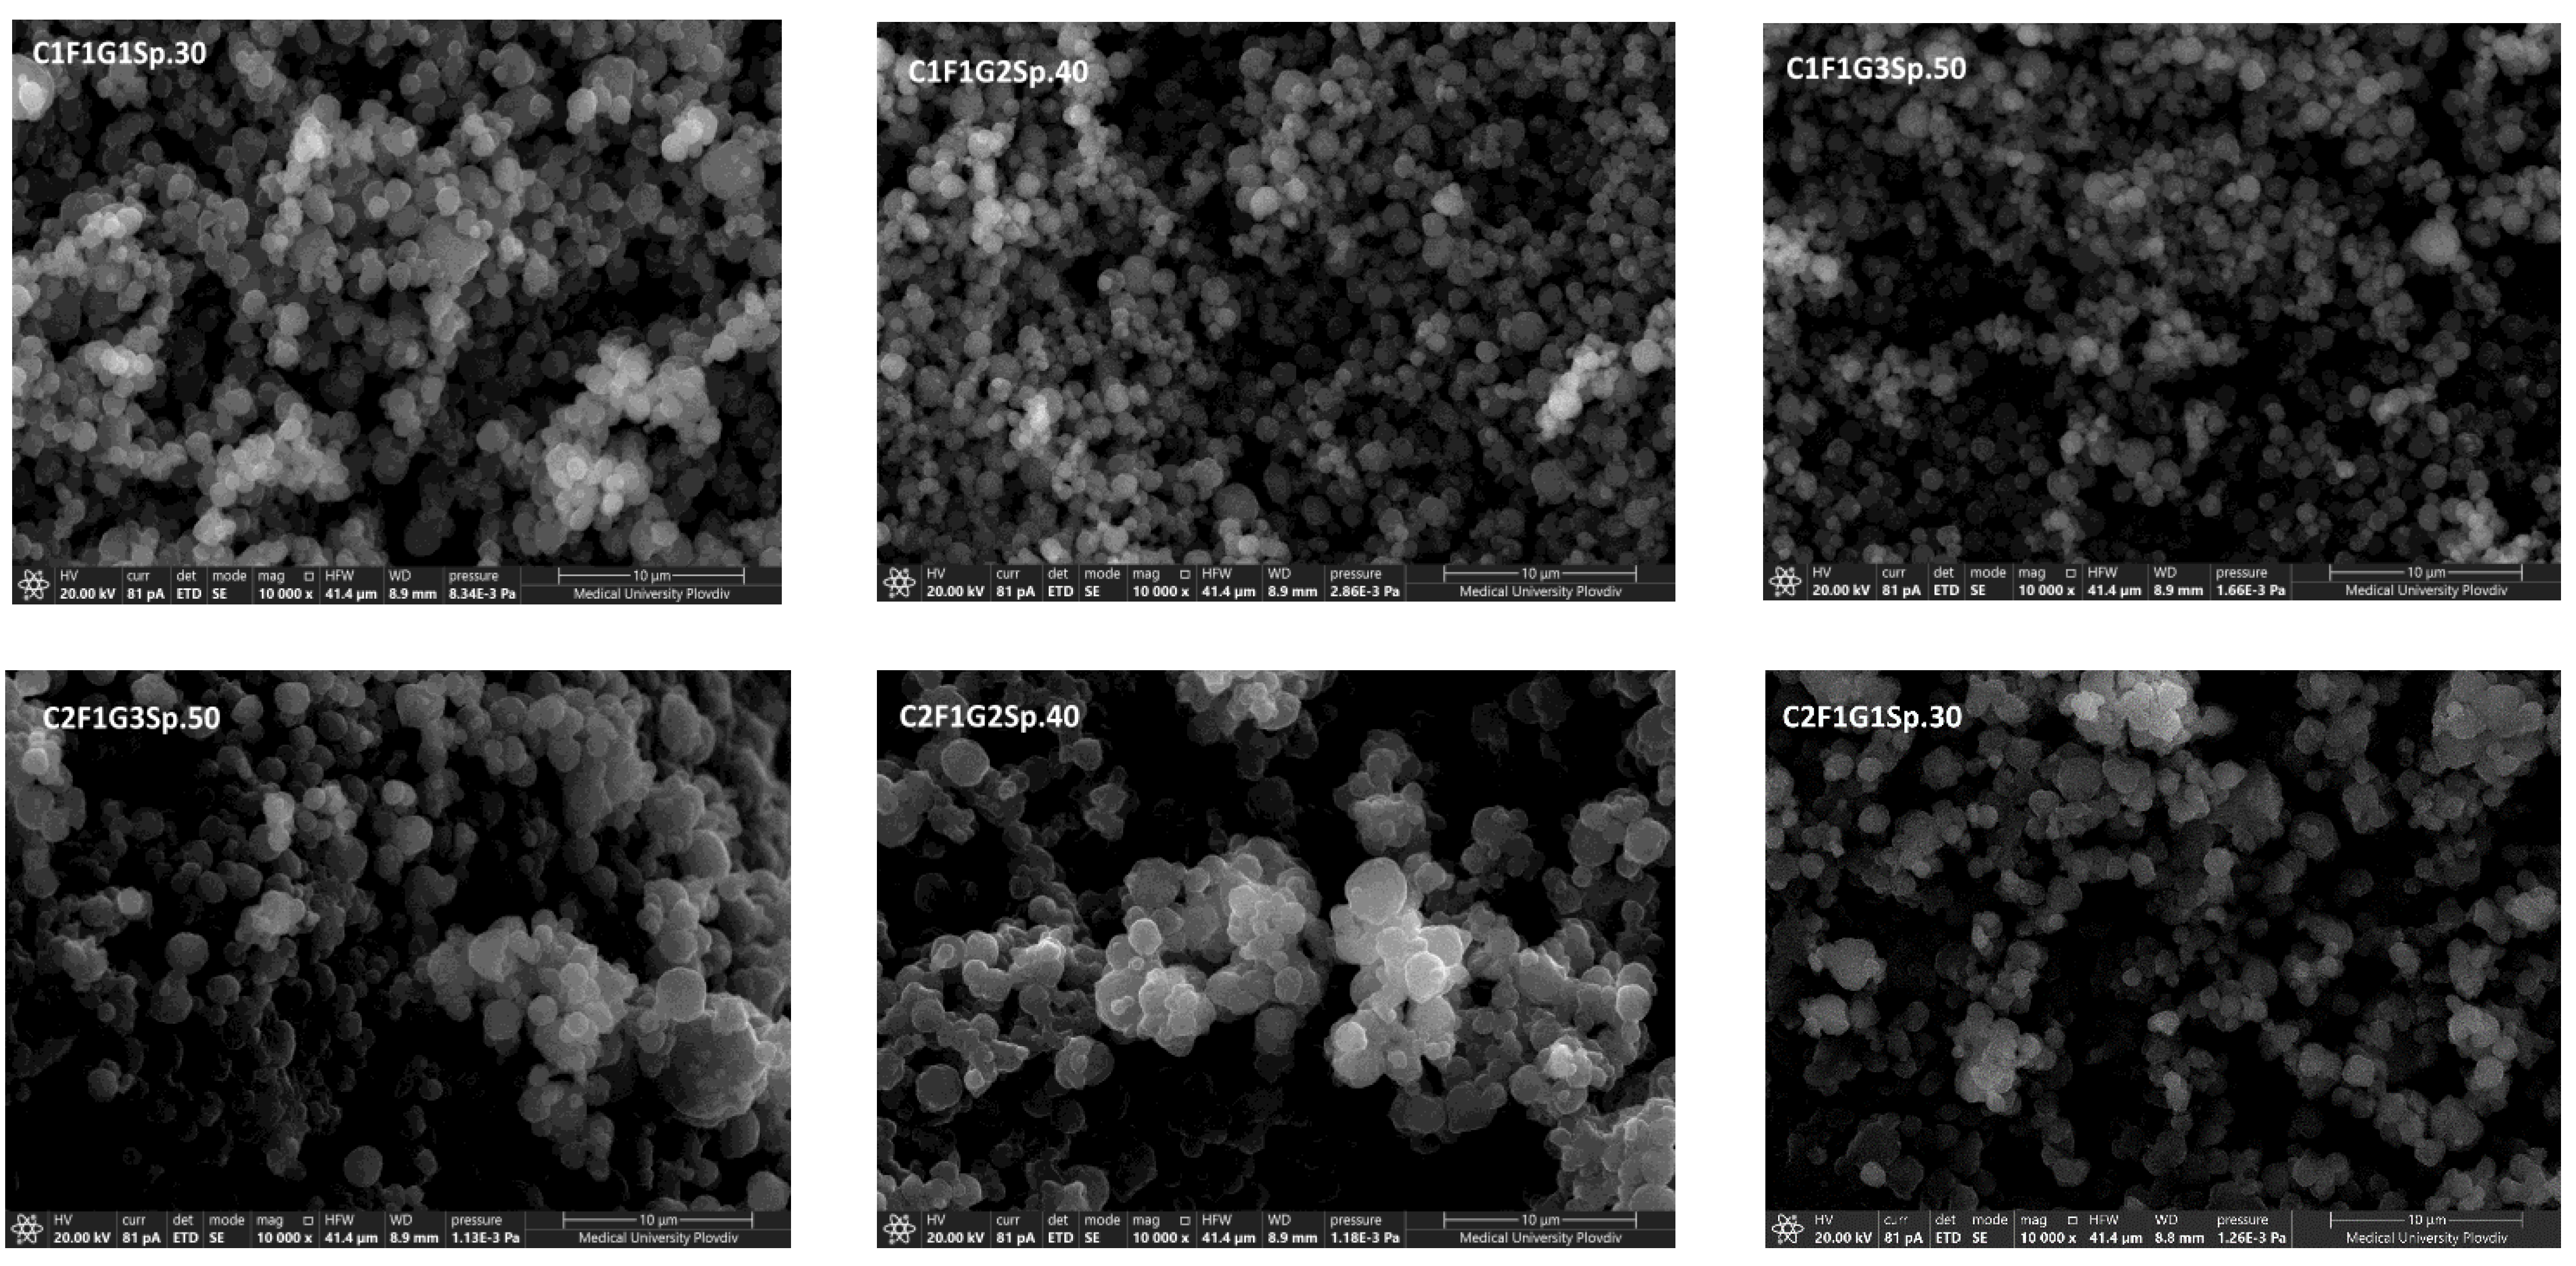
The result is also confirmed by the performed scanning electron microscopy (Figure 8). On the presented micrographs, it can be clearly visualized that the particles obtained at a casein/fucoidan ratio of 1:1 have a smooth surface and a spherical morphology. Furtheremore, increaseing of the casein/fucoidan ratio, leads to the formation of particle agglomerates with irregular shape and size up to several micrometers. Probably increasing the concentration of casein leads to inefficient polyelectrolyte complexation between the polymers, and inefficient amount of glutaraldehyde needed for the formation of denser particles. This leads to increase in the viscosity of the feeding suspension and inefficient spray drying process.
Based on the obtained regression coefficients, a linear polynomial equation is derived:
Particle size = 0,34-0,0164X1-0,6813X2-0,0471X3-0,0003X1.X2+0,0004X1.X3-0,0187X2.X3
A good correlation is found between the experimental and predicted data (R2 = 0.81). A value of R2adj = 0.69 confirms that 69% of the obtained data can be explained by the model. The observed and predicted values are presented in Table 7.
Regarding the ability of the model to predict the response at different levels of variation of the independent variables, One Way ANOVA is performed. Prob>F-value and p < 0.05 (p = 0.029) prove the ability of the model to predict the response (Table 8).
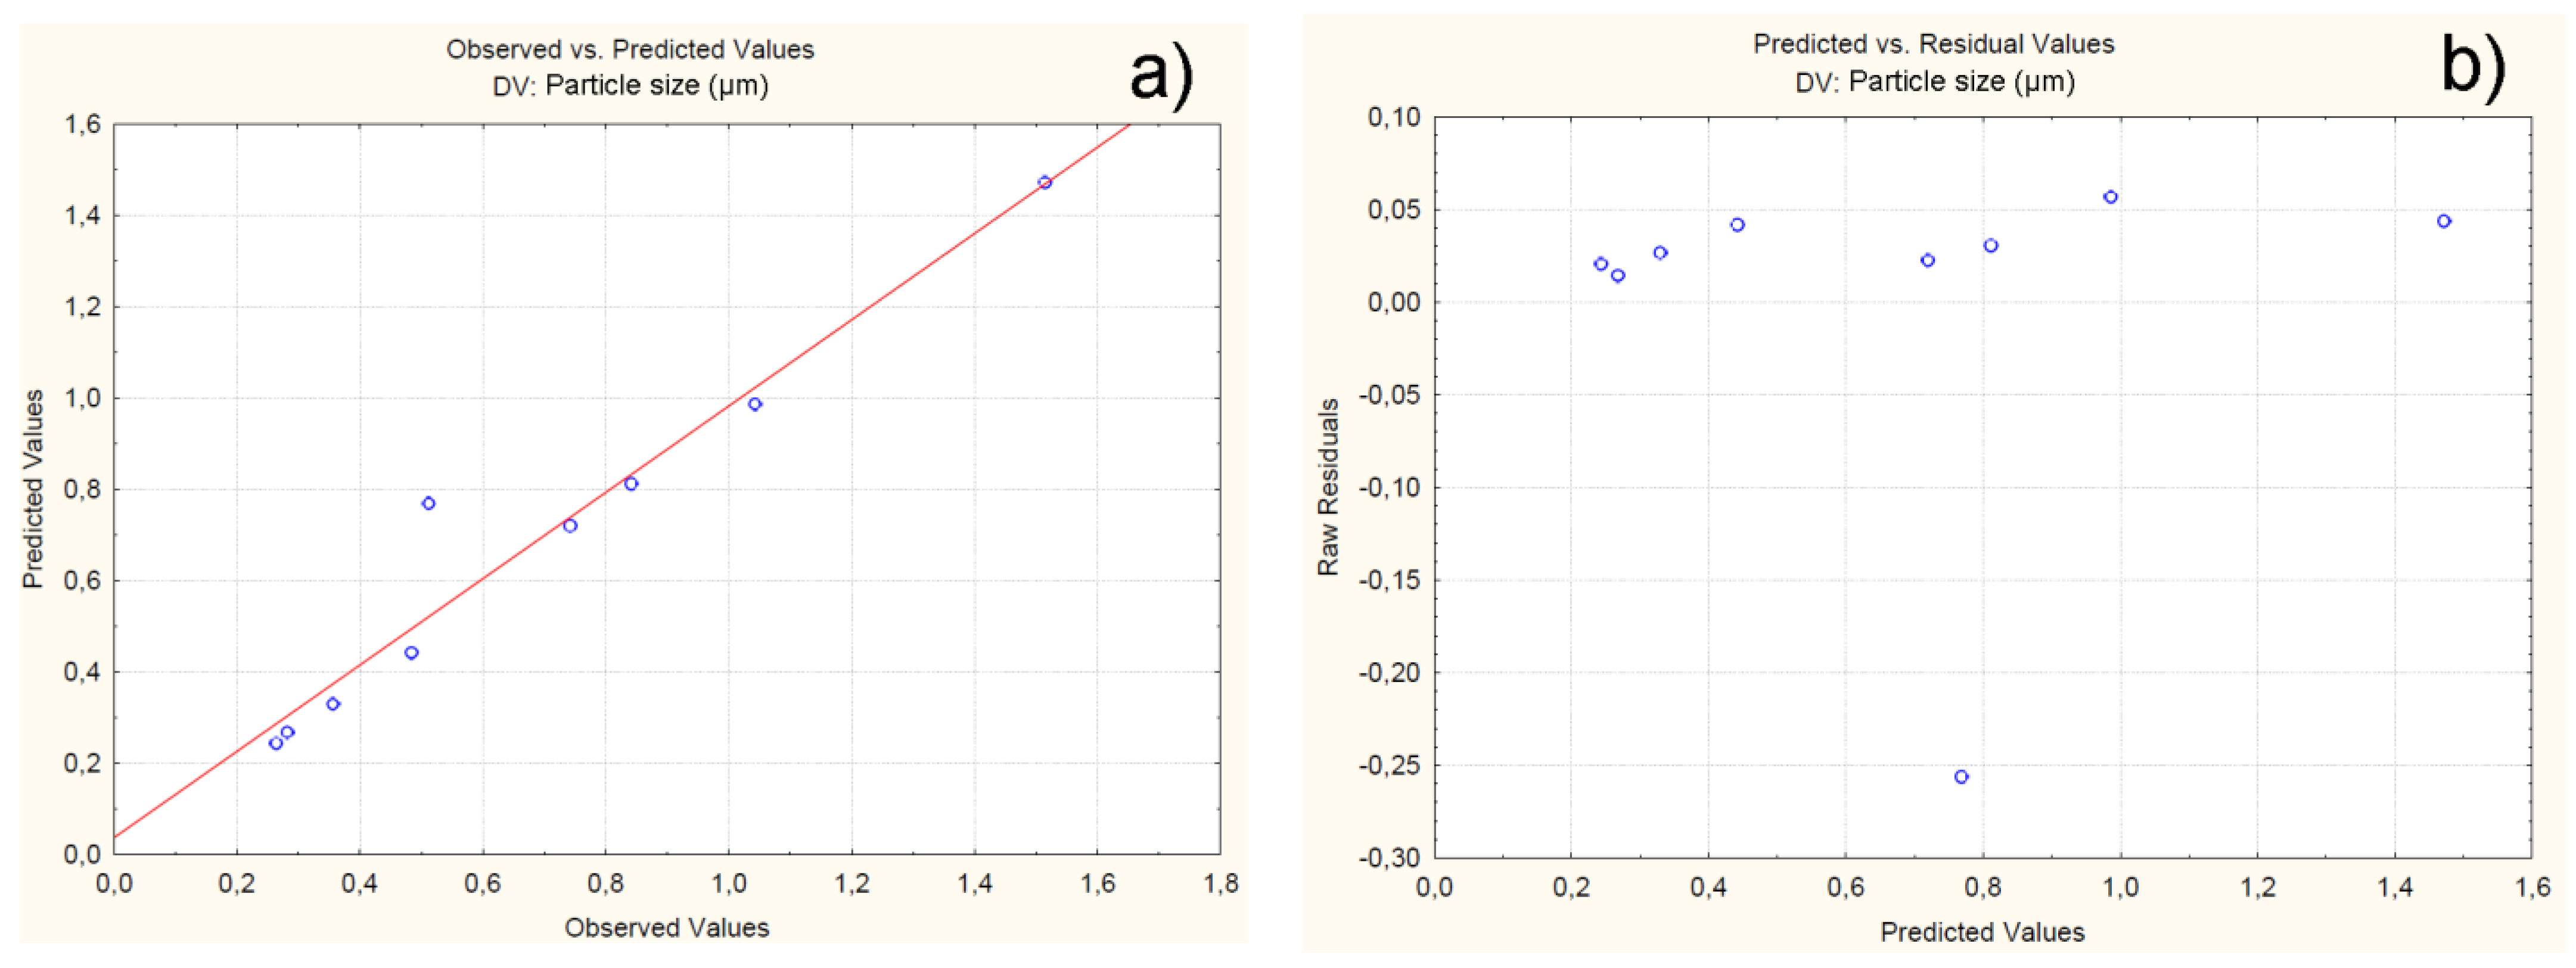
To examine the variance and normal distribution of errors, a normal probability plot of residuals and a plot of residuals versus predicted values are generated Figure 9. The results showed that all the experimental values are close to the theoretically expected ones (Figure 9a). Furthermore, the residuals are symmetrically located and tend to cluster in the low Y-axis values (Figure 9b). The obtained data confirms that the developed model can be used to predict the response, at different levels of variation of the independent variables.

4.2.3. Effect of Independent Variables on Particle Zeta Potential

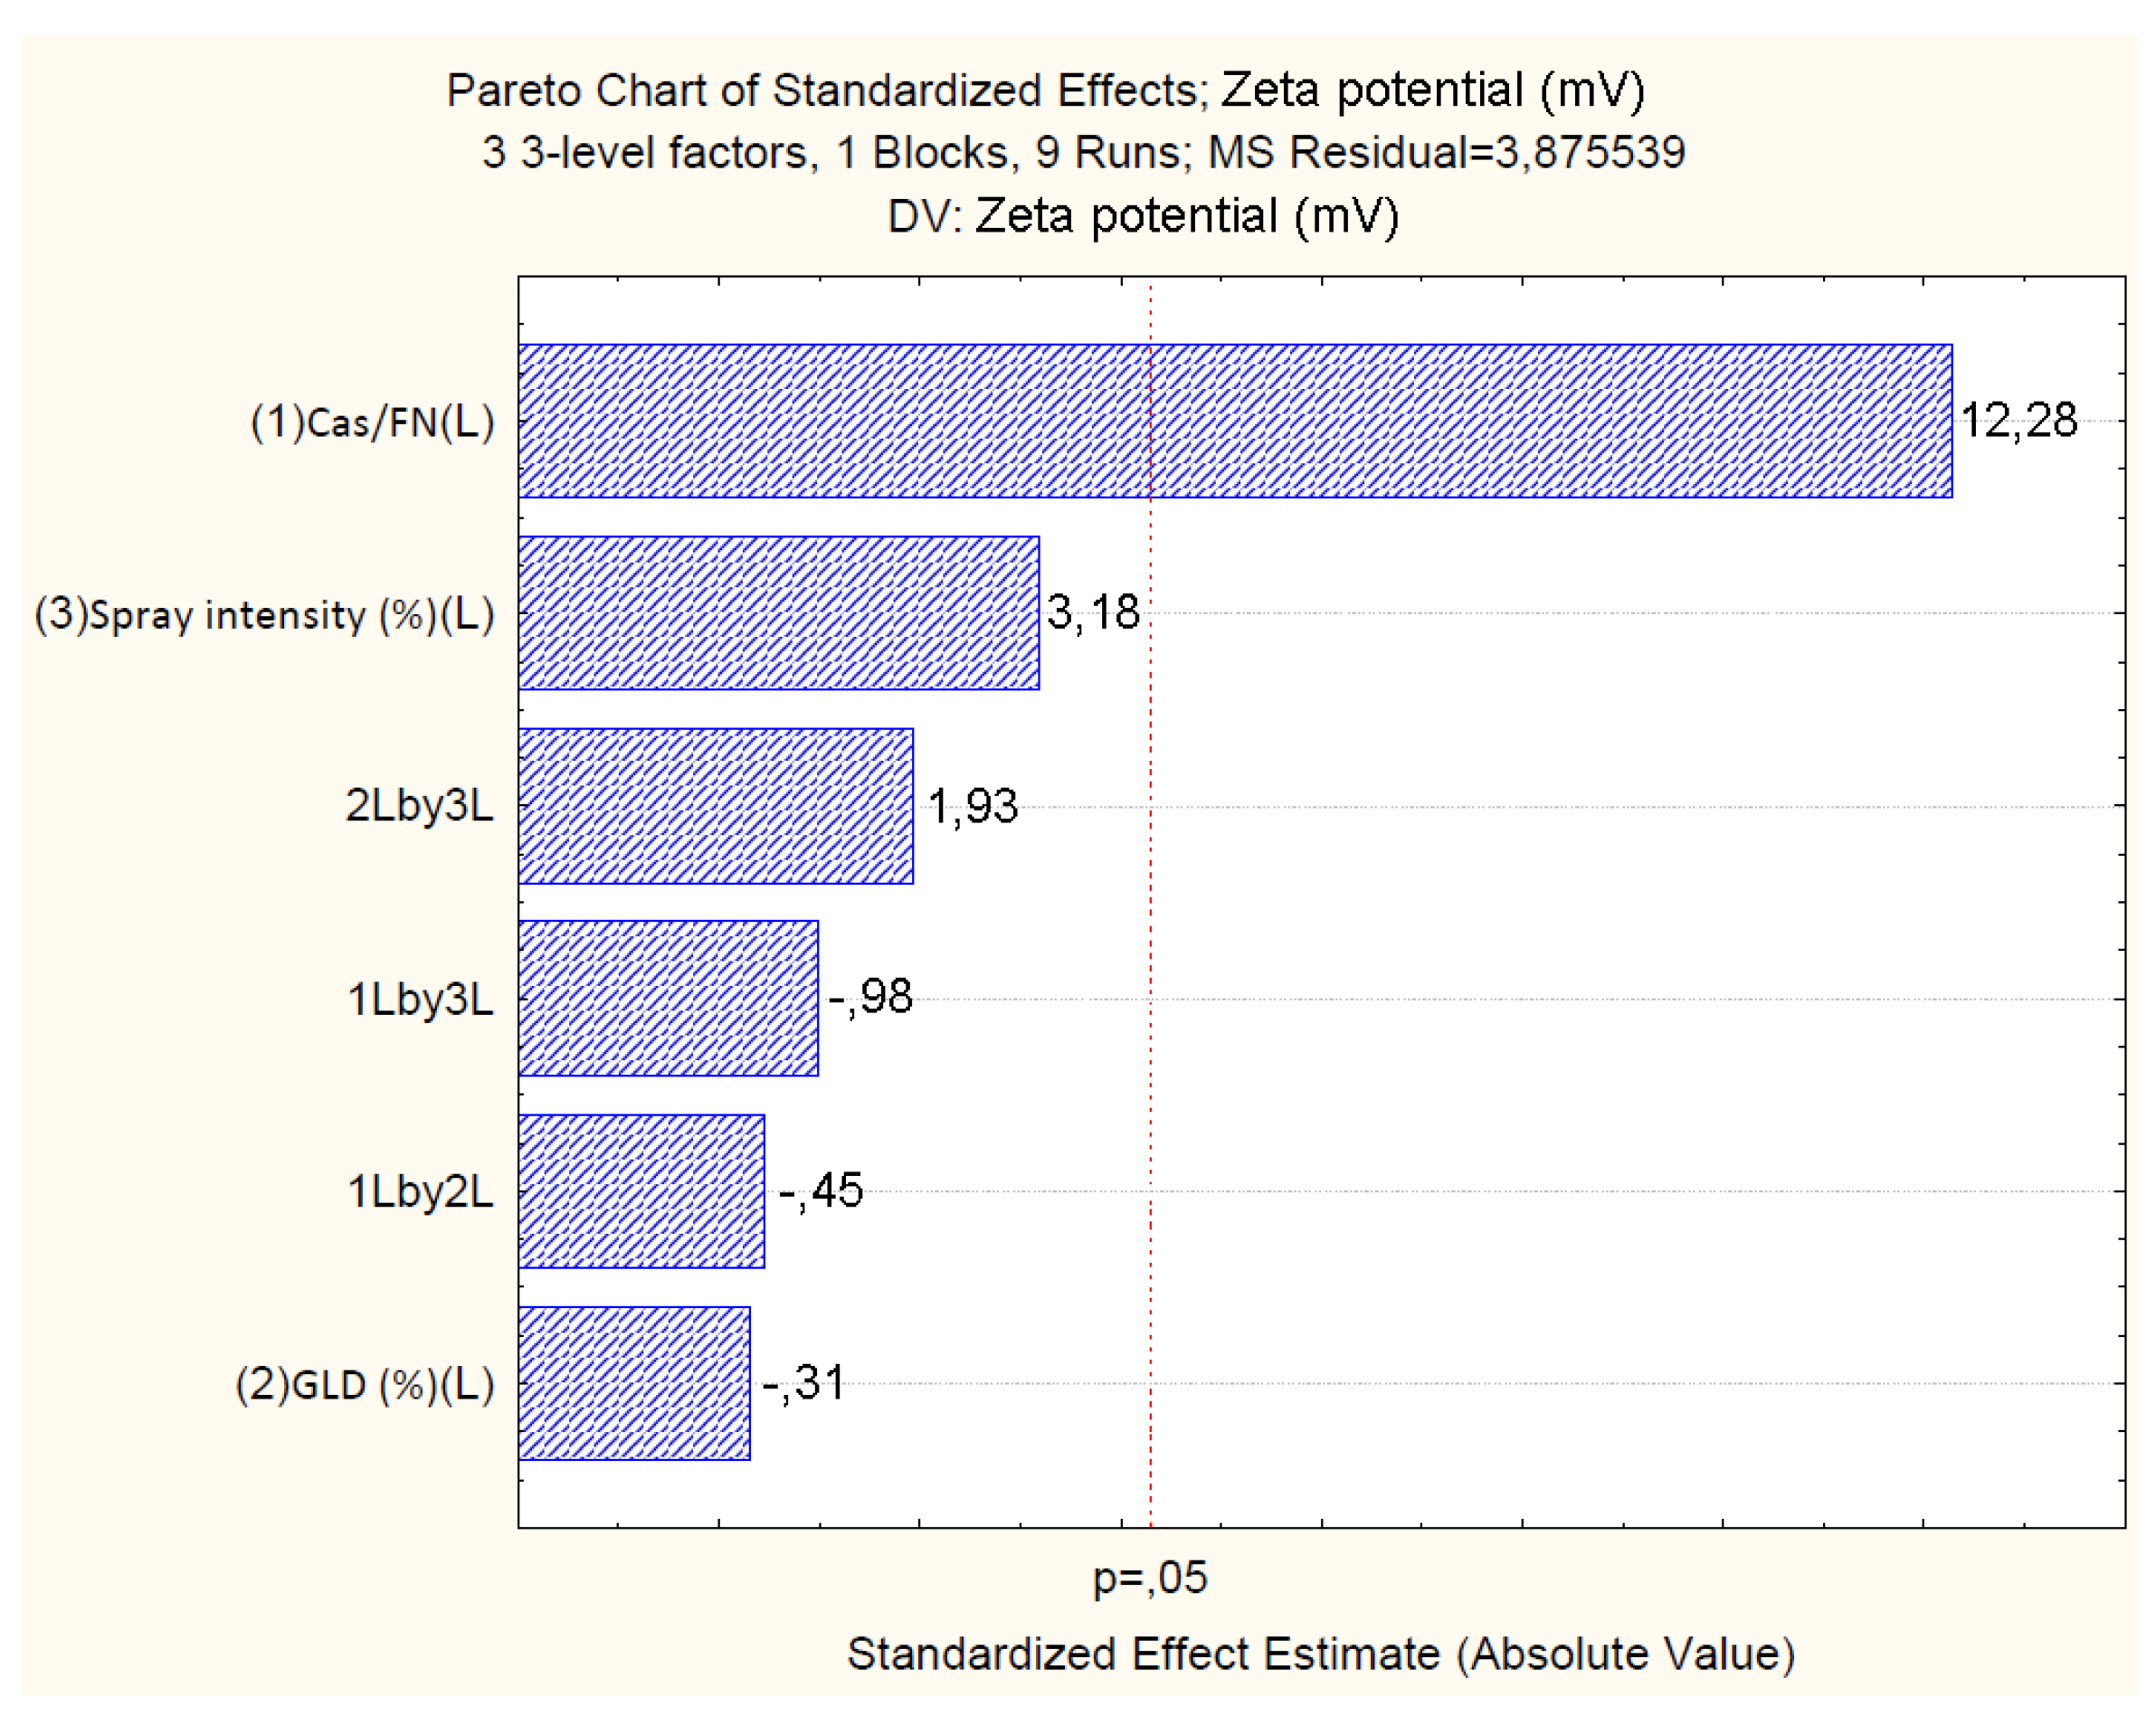
The standardized effects of the independent variables on the zeta potential of the particles are represented by Pareto chart (Figure 10), which shows that only the casein/fucoidan ratio has a statistically significant effect on the zeta potential of the nanoparticles (p > 0.05), while the other variables (X2 and X3) as well as their combined effect (X1X2, X1X3, X2X3) do not have a statistically significant effect.
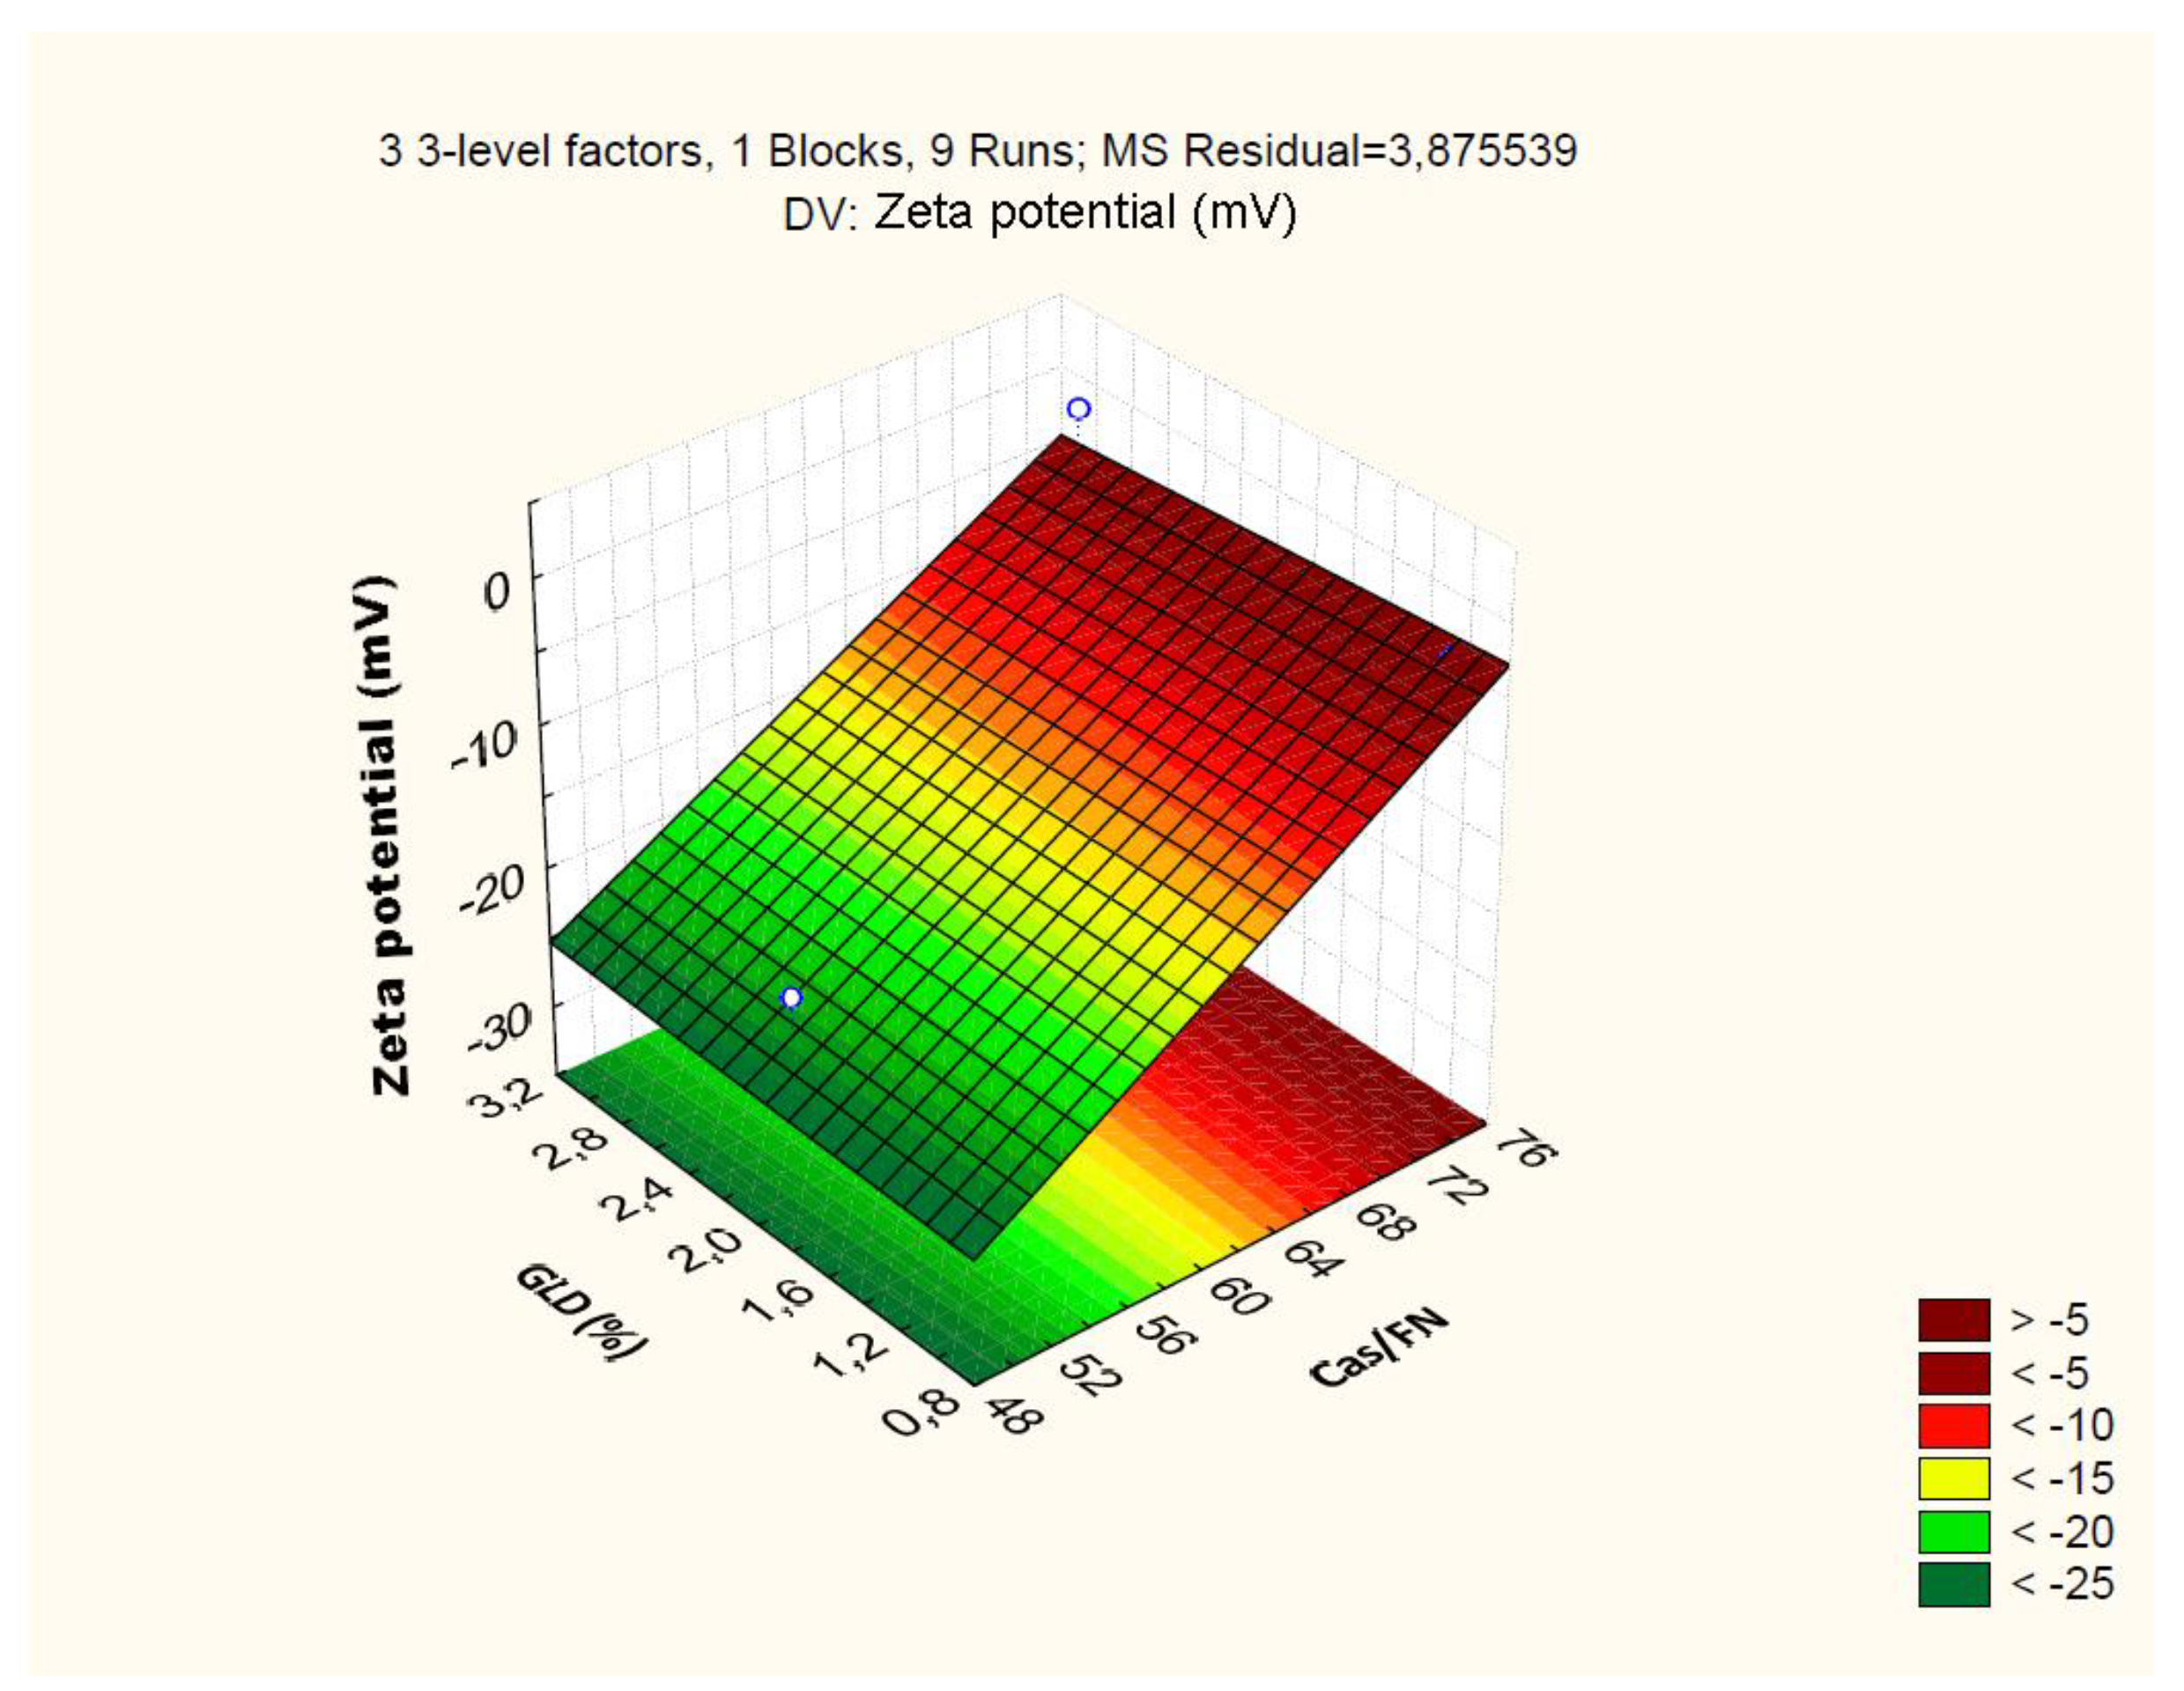
The relationship between the independent and the dependent variables is further represented by 3D surface plots (Figure 11). The figure shows a trend of an increase of the zeta potential from (-25.71 ± 1.0) mV to (-1.03 ± 1.9) mV with increasing casein/fucoidan ratio from 1:1 to 3:1, which is probably due to the ineffective coating of the casein particles with fucoidan [37]. The hypothesis is also confirmed by the larger size of these particles, which can be explained by the insufficient amount of fucoidan required for the stabilization of the obtained structures [37].
Based on the obtained regression coefficients regarding the zeta potential, a linear polynomial equation is derived:
Zeta potential = -83,33+1,24X1-7,02X2+0,37X3-0,04X1.X2-0,01X1.X3+0,24X2.X3
The good correlation between experimental and predicted data is established (R2 = 0.96), while the value of R2adj = 0.94 confirms that 94% of the obtained data can be explained by the model (Table 9).
Regarding the ability of the model to predict the response at different levels of variation of the independent variables, One Way ANOVA is performed. Prob>F-value and p < 0.05 (p = 0.0004) prove the ability of the model to predict the response (Table 10).
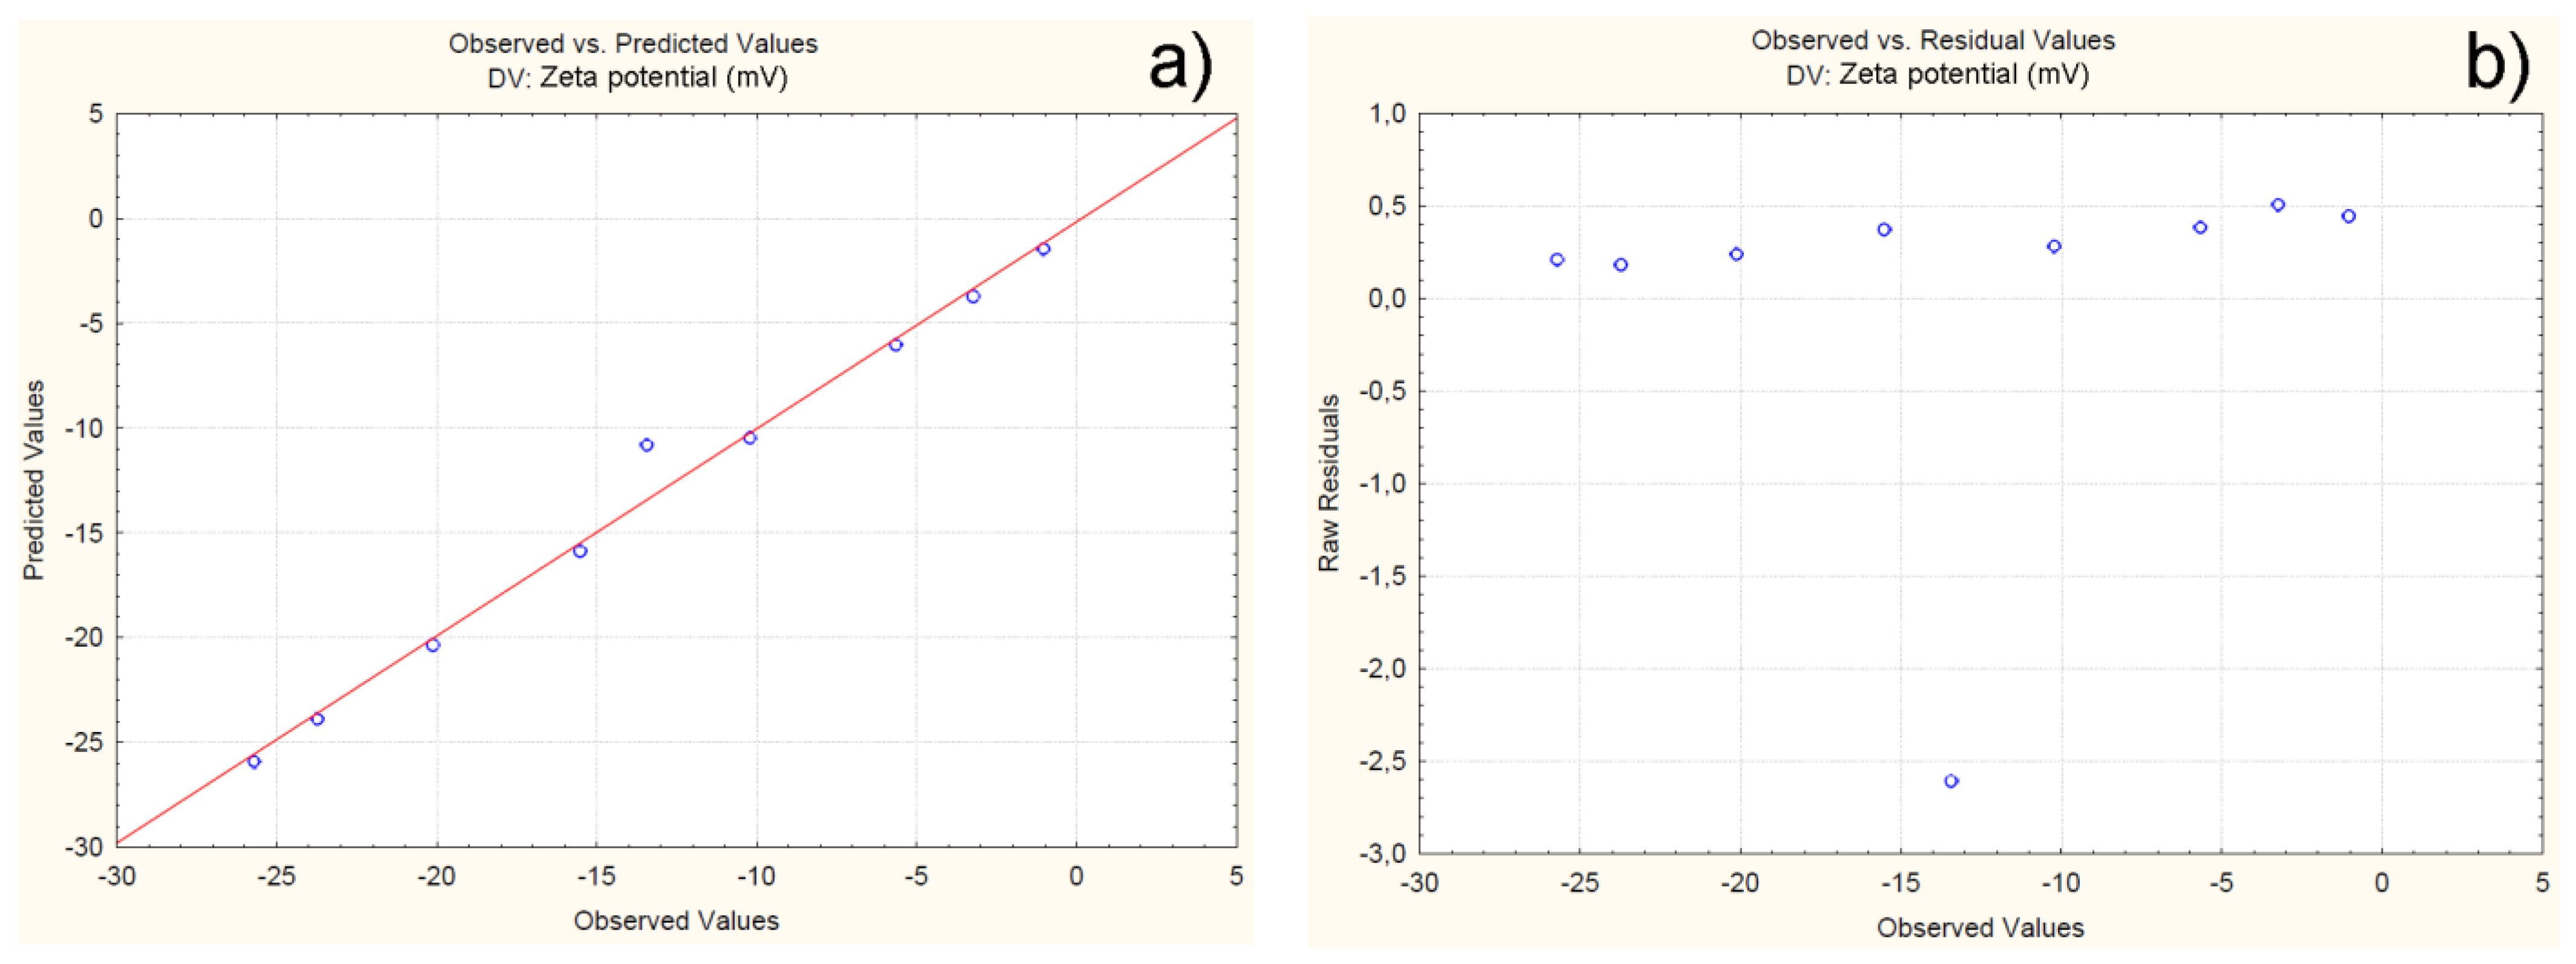
Constant variation and normal distribution of errors is represented by a normal probability plot and a plot of the residuals versus the predicted values (Figure 12). The results showe that all the experimental data are close to the theoretically expected ones (Figure 12a). Furthermore, the residuals are symmetrically located and tend to cluster in the low Y-axis values (Figure 12b). Based on the presented results, variation and normal distribution of errors are proven, which confirms the adequacy of the model.
Based on the obtained results, models C1F1G1Sp.30, C1F1G2Sp.40, and C1F1G3Sp.50, which have an average particle size ranging from (265 ± 32) nm to (357 ± 25) nm, yield (48.9 ± 2.9) % to (66.4 ± 2.2) % and zeta potential from ( −20.12 ± 0.9) mV to (−25.71 ± 1.0) mV are selected as optimal for furthere use as drug delivery system.

4.3. Determining the Compatibility and Physical State of Casein/Fucoidan Composite Nanoparticles

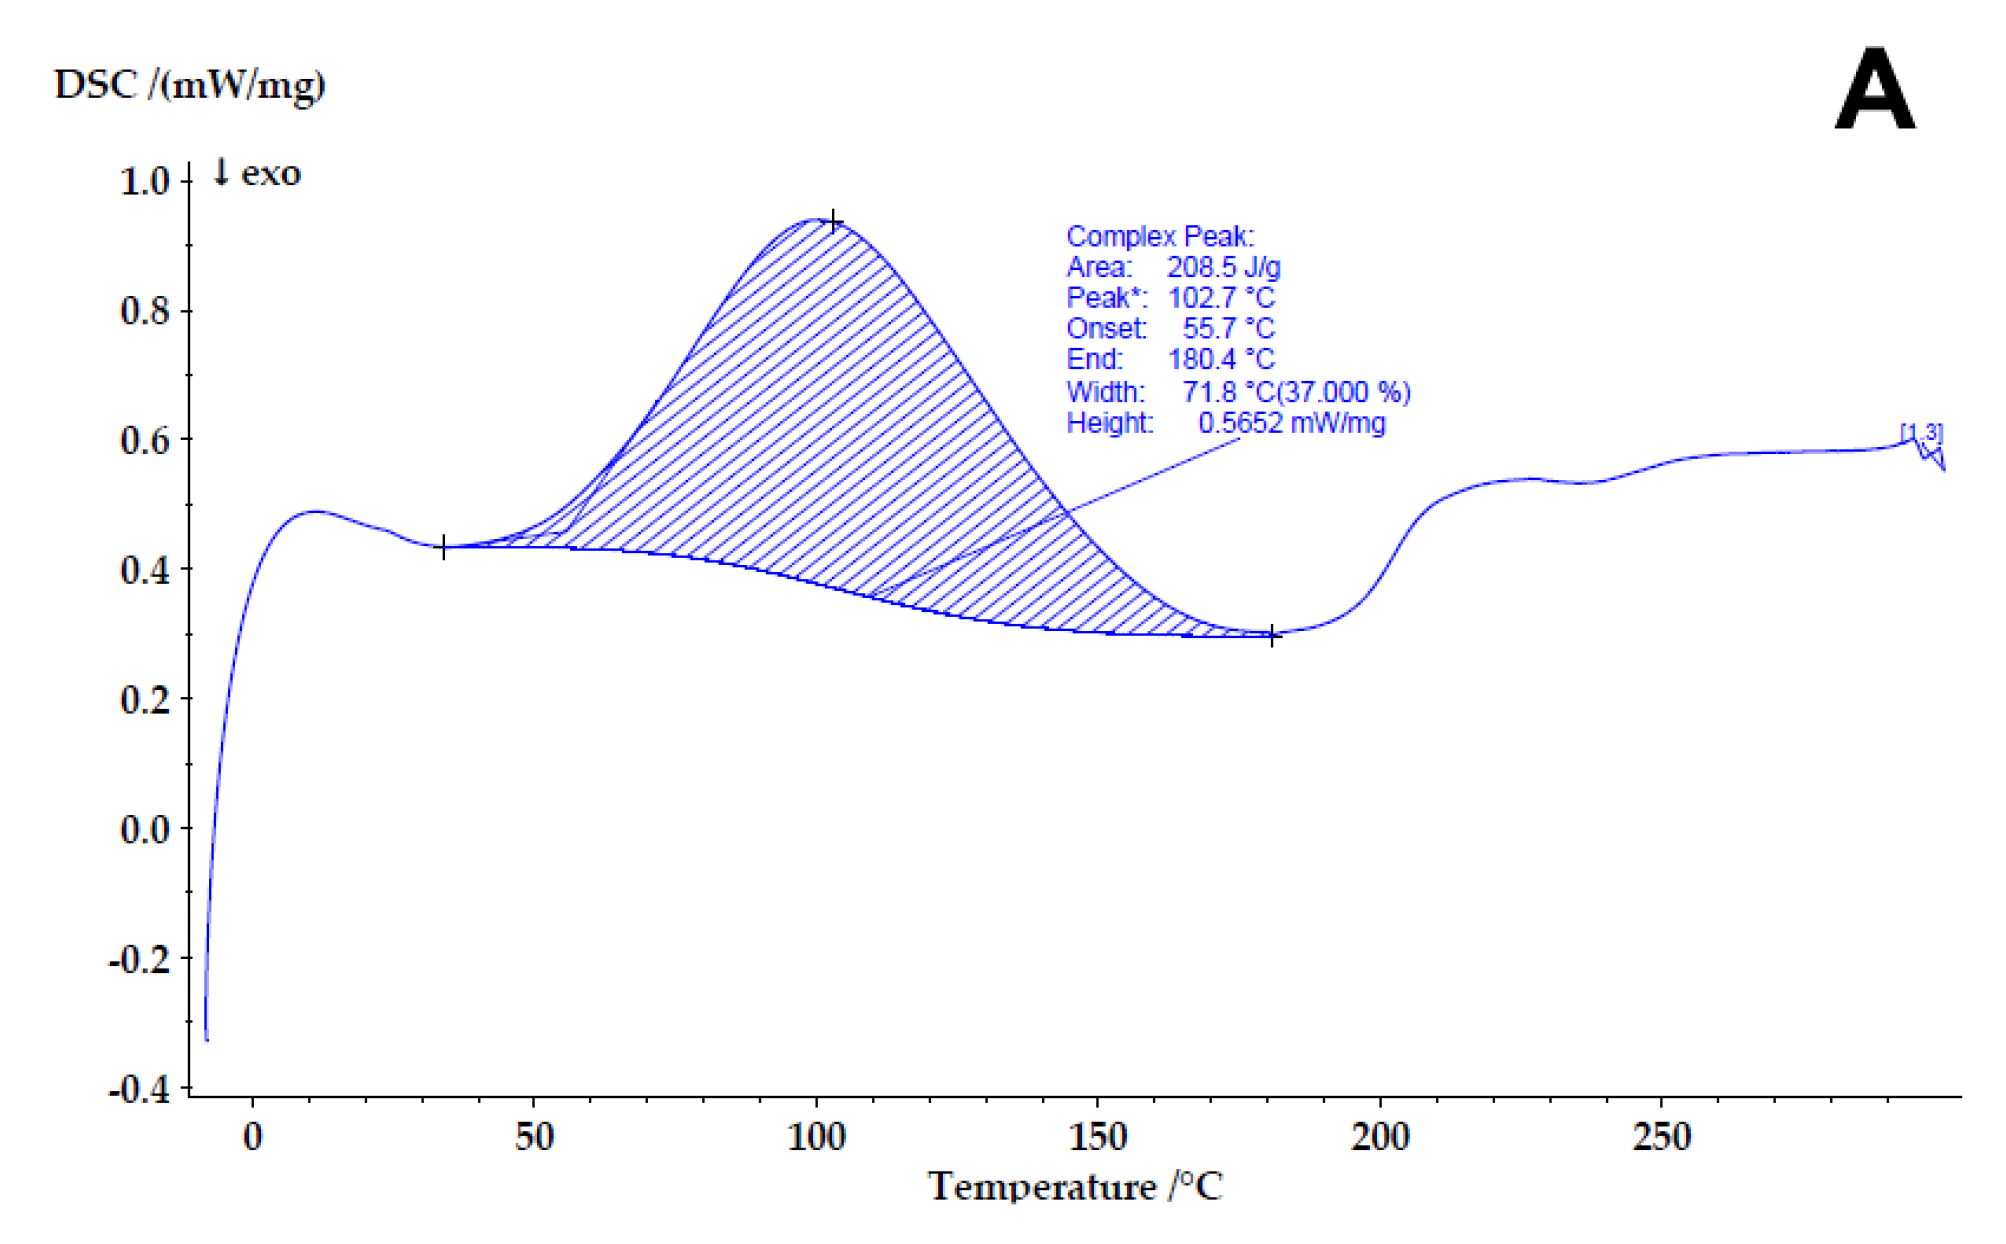
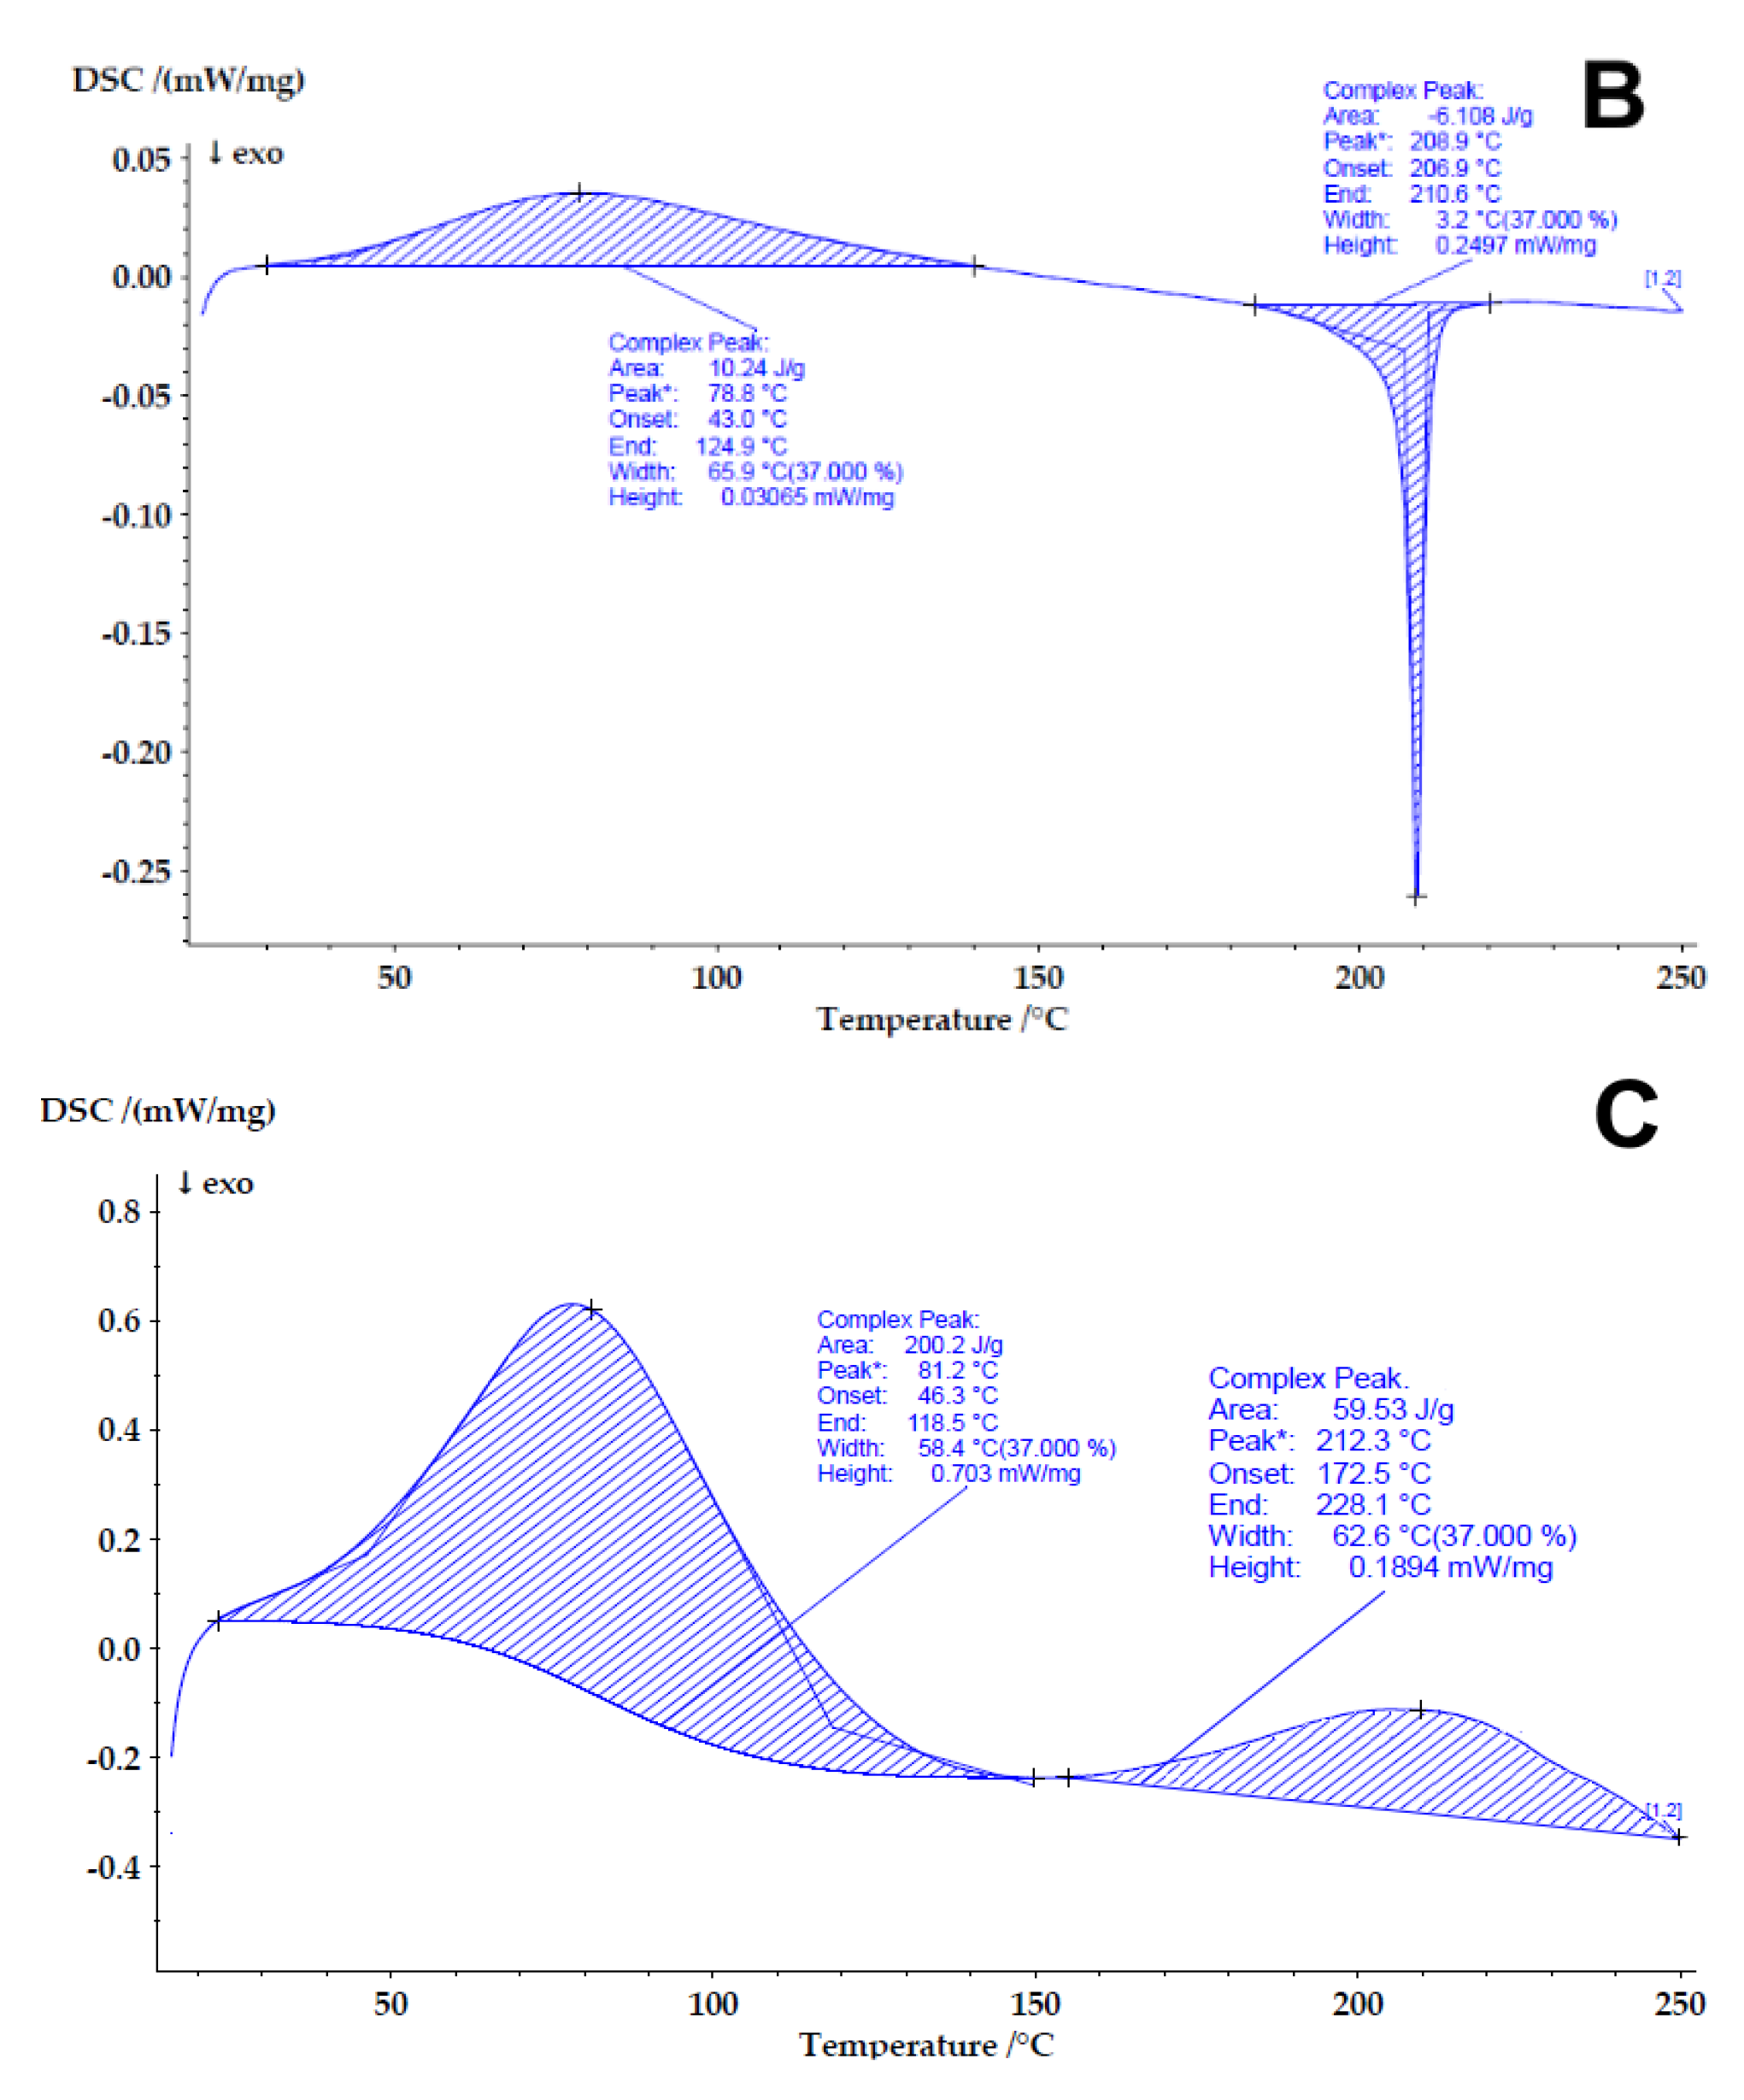
The physical state and the stability of the obtained casein/fucoidan composite nanoparticles was investigated using differential scanning calorimetry (DSC) (Figure 13).
Casein exhibited a single endothermic transition peak (Tp) at 80 °C due to its dehydration [45], releated to changes in the molecular integrity and the conformation of the protein [45].
Unlike casein, fucoidan shows two peaks at 78.8 °C and at 208.9 °C. The first peak is associated with dehydration of the polymer, while the second is a strongly exothermic peak, which is due to thermal destruction of the polymer [46]. Differences in the observed onset temperatures and temperature peak in the thermograms of the casein/fucoidan composite were observed. The onset temperature and peak were shifted to higher temperature for casein/fucoidan composites. Furthermore the composite structures demonstrates increase in the enthropy (ΔH = 59.53 J/g). A high Tp value and enthropy (ΔH) is associated with higher thermal stability, therefore, the casein/fucoidan composite structures show an increased thermal stability and subsequently becomes highly resistant to denaturation [47].
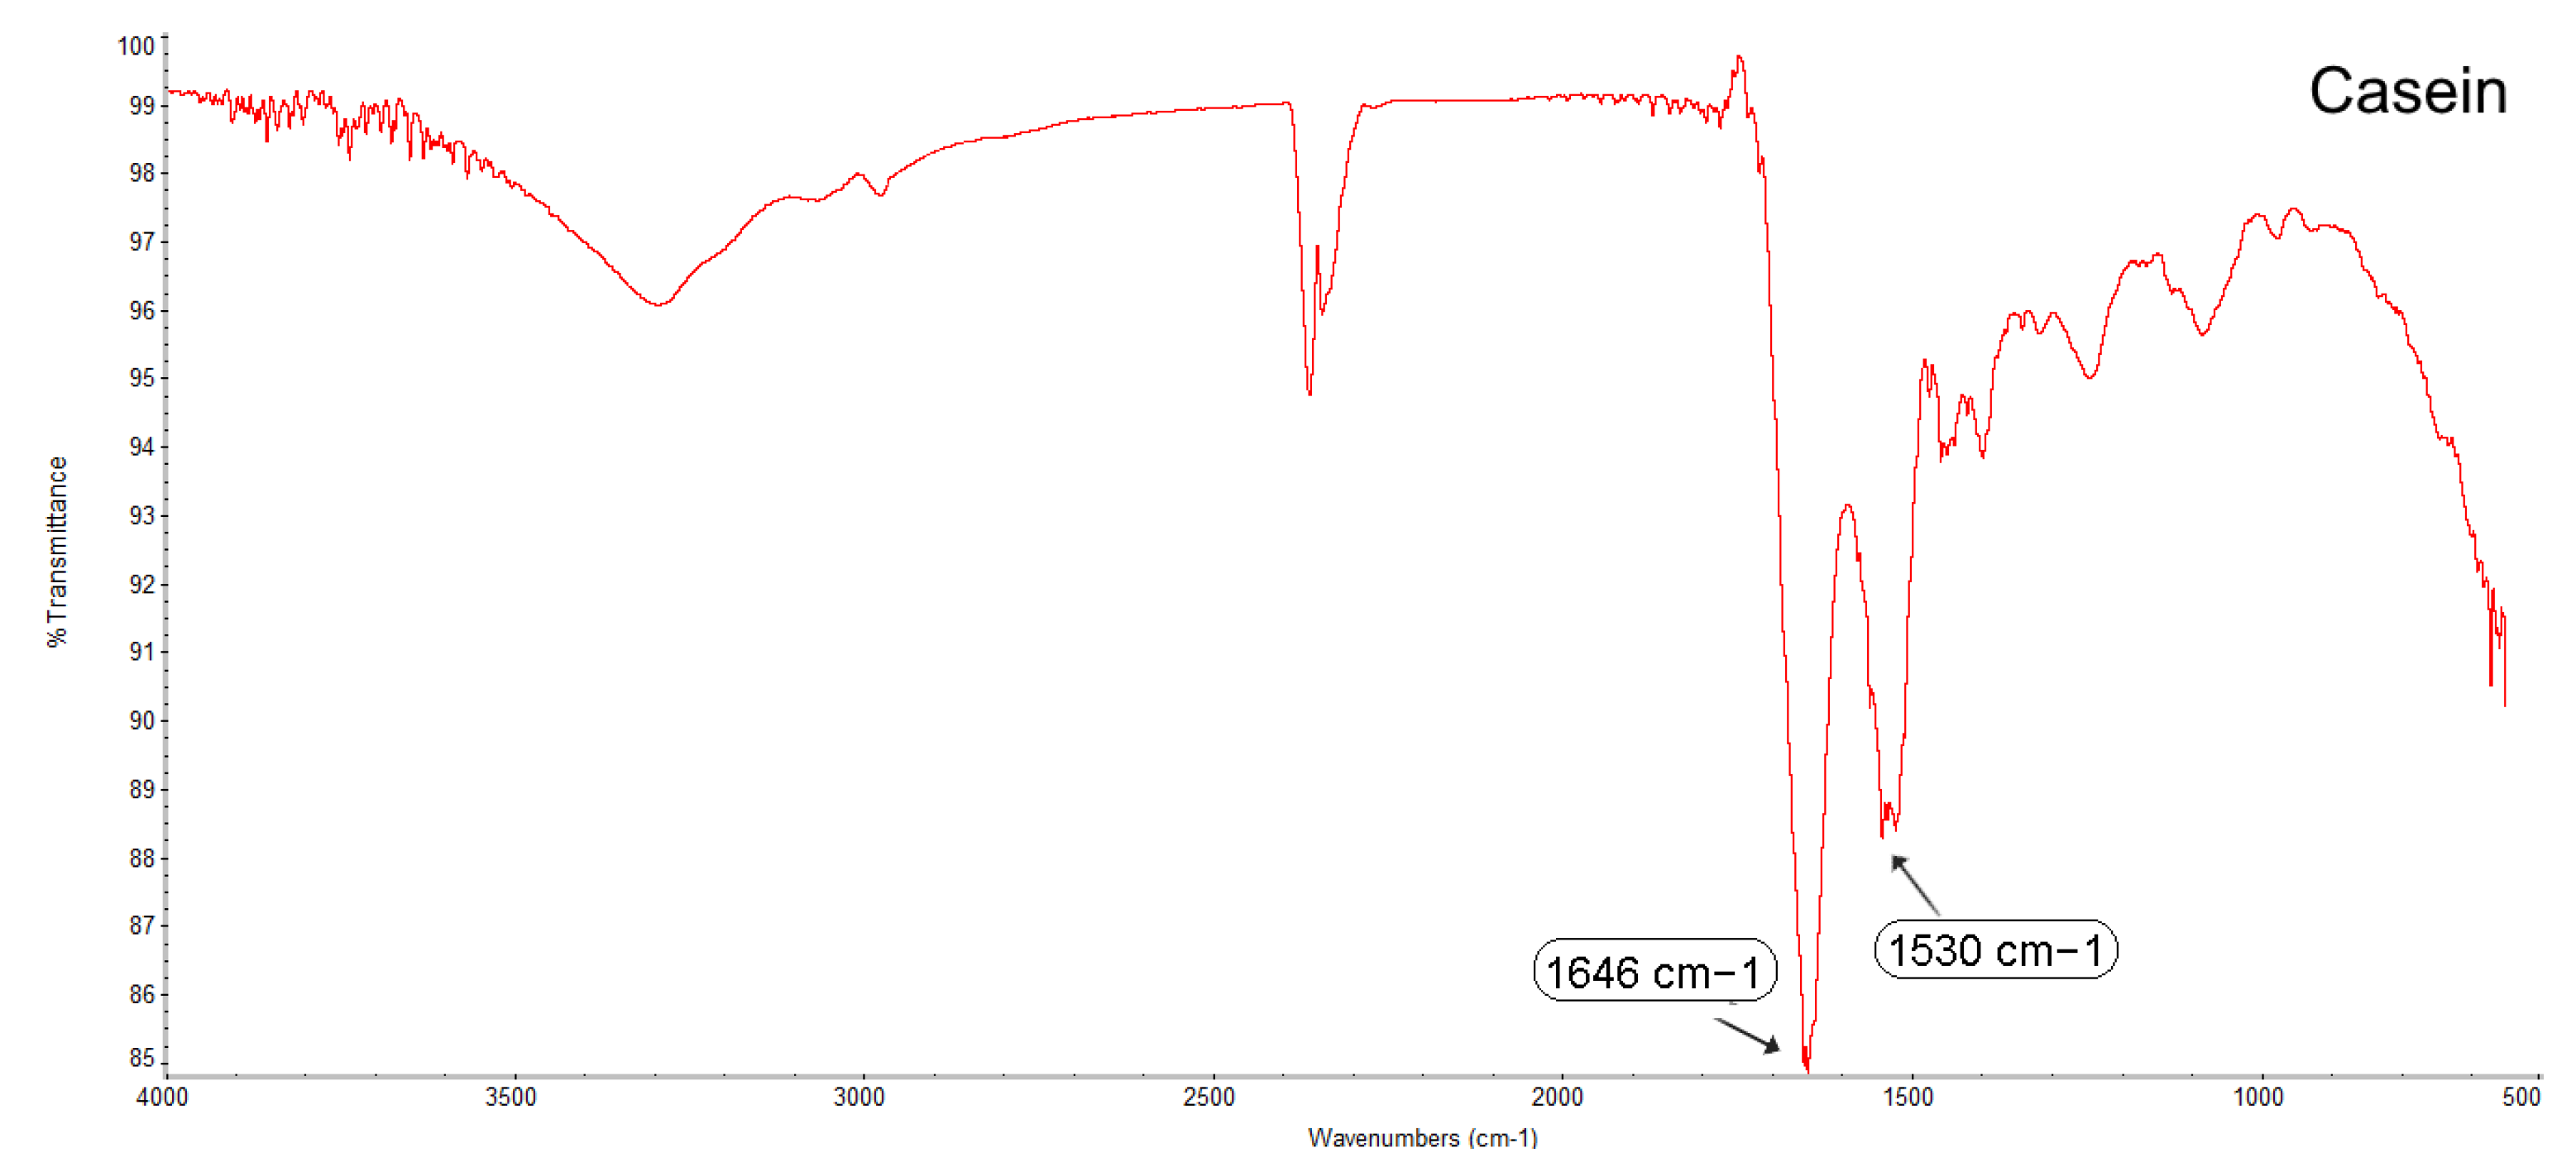
To determine the interaction between casein and fucoidan molecules and the changes in the chemical structure during the formation of the Cas/FN composite nanostructures, FTIR analysis was conducted (Figure 14). Casein show peaks at 1646 cm−1 in the amide I region and 1530 cm−1 in the amide II region, which could be assigned to the stretching of the carbonyl group (C=O) and to the symmetric stretching of N-C=O bonds, respectively [48].
The FTIR spectrum of fucoidan showed a strong absorption band at 1224 cm−1, possibly related to the O=S=O vibration of sulfuric acid (Figure 14), as the band at 849 cm−1 was the characteristic band of the sulfate bond of fucoidan. Furthermore, the band at 1058 cm−1 was attributed to the C-O-C stretching vibration of the glycosidic bond [49]. For the Cas/FN composite nanoparticles, a clear shift in the amide I region from 1646 to 1642 cm−1 and a shift in the amide II region from1530 to 1542 cm−1 were observed, due to the electrostatic interactions and hydrogen bonding between protein and polysaccharide [18].

5. Conclusion

Within the goal of this study, a novel, one of its kind technological process for the preparation of casein-fucoidan composite nanostructures combining polyelectrolyte complexation and spray drying was developed. This research demonstrated that main physicochemical properties of the obtained structures can be manipulated by various process parameters. The influence of the independent productional and technological factors was studied and optimized with the application of suitable surface response experimental design (3(k-p)). The results from the mathematical analysis showed that the casein to fucoidan ratio and spray intensity seemed to be crucial for the production yield of the obtained structure. Regarding the particle size and zeta potential, they were mainly affected by the casein to fucoidan ratio used for the preparation of the complexes. Therefore, the statistical experimental design methodology, clearly has shown its usefulness for the optimization of the productional and technological parameters for the preparation of this innovative complexes.

6. Patents

Results from this work took part in the development of Utility model: BG4536U1; Nikolay Zahariev, Bissera Pilicheva; Medical University of Plovdiv; COMPOSITE NANOPARTICLES OF CASEIN/FUCOIDAN AS A SYSTEM FOR DELIVERY OF DAUNORUBICIN HYDROCHLORIDE; Bulgaria; 11.08.2023

Author Contributions

Conceptualization, B.P. and N.Z.; methodology, N.Z.; investigation, B.P. and N.Z.; data curation, B.P.; writing—original draft preparation, N.Z.; writing—review and editing, B.P.; visualization, N.Z; supervision, B.P.; project administration, B.P.; funding acquisition, N.Z. All authors have read and agreed to the published version of the manuscript.

Funding

This research was funded by the European Union—NextGenerationEU, through the National Recovery and Resilience Plan of the Republic of Bulgaria, project no. BG-RRP-2.004-0007-C01.

Institutional Review Board Statement

Data Availability Statement

The original contributions presented in the study are included in the article, further inquiries can be directed to the corresponding authors.

Conflicts of Interest

The authors declare no conflicts of interest.

References

  1. Kučuk, N.; Primožič, M.; Knez, Ž.; Leitgeb, M. Sustainable Biodegradable Biopolymer-Based Nanoparticles for Healthcare Applications. Int. J. Mol. Sci. 2023, 24, 3188. [Google Scholar] [CrossRef] [PubMed]
  2. Vodyashkin, A.A.; Kezimana, P.; Vetcher, A.A.; Stanishevskiy, Y.M. Biopolymeric Nanoparticles–Multifunctional Materials of the Future. Polymers 2022, 14, 2287. [Google Scholar] [CrossRef]
  3. Han, M.; Liu, K.; Liu, X.; Rashid, M.T.; Zhang, H.; Wang, M. Research Progress of Protein-Based Bioactive Substance Nanoparticles. Foods 2023, 12, 2999. [Google Scholar] [CrossRef] [PubMed]
  4. Li, K.; Zhang, Y.; Hao, X.; Xie, D.; Wang, C.; Zhang, H.; Jin, P.; Du, Q. Improved Stability and In Vitro Anti-Arthritis Bioactivity of Curcumin–Casein Nanoparticles by Ultrasound-Driven Encapsulation. Nutrients 2022, 14, 5192. [Google Scholar] [CrossRef] [PubMed]
  5. Zahariev, N.; Draganova, M.; Zagorchev, P.; Pilicheva, B. Casein-Based Nanoparticles: A Potential Tool for the Delivery of Daunorubicin in Acute Lymphocytic Leukemia. Pharmaceutics 2023, 15, 471. [Google Scholar] [CrossRef] [PubMed]
  6. Lin, C.; Hsu, F.-Y.; Lin, W.-T.; Cha, C.-Y.; Ho, Y.-C.; Mi, F.-L. Biodegradable Nanoparticles Prepared from Chitosan and Casein for Delivery of Bioactive Polysaccharides. Polymers 2022, 14, 2966. [Google Scholar] [CrossRef] [PubMed]
  7. Sadiq, U.; Gill, H.; Chandrapala, J. Casein Micelles as an Emerging Delivery System for Bioactive Food Components. Foods 2021, 10, 1965. [Google Scholar] [CrossRef] [PubMed]
  8. van de Langerijt, T.M.; O’Mahony, J.A.; Crowley, S.V. Structural, Binding and Functional Properties of Milk Protein-Polyphenol Systems: A Review. Molecules 2023, 28, 2288. [Google Scholar] [CrossRef] [PubMed]
  9. Jao, D.; Xue, Y.; Medina, J.; Hu, X. Protein-Based Drug-Delivery Materials. Materials 2017, 10, 517. [Google Scholar] [CrossRef]
  10. Luo, Y.; Pan, K; Zhong, Q. Casein/pectin nanocomplexes as potential oral delivery vehicles. Int. J. Pharm. 2015, 486, 59–68. [Google Scholar] [CrossRef]
  11. Thongkaew, C.; Gibis, M.; Hinrichs, J; Weiss, J. Polyphenol interactions with whey protein isolate and whey protein isolate− pectin coacervates. Food Hydrocolloids. 2014, 41, 103–112. [Google Scholar] [CrossRef]
  12. Wei, Z.; Yang, W.; Fan, R.; Yuan, F.; Gao, Y. Evaluation of structural and functional properties of protein−EGCG complexes and their ability of stabilizing a model β-carotene emulsion, Food Hydrocolloids. 2015, 45, 337−350. [CrossRef]
  13. Bealer, EJ.; Onissema-Karimu, S.; Rivera-Galletti, A.; Francis, M.; Wilkowski, J.; Salas-de la Cruz, D.; Hu, X. Protein-Polysaccharide Composite Materials: Fabrication and Applications. Polymers. 2020, 12, 464. [Google Scholar] [CrossRef]
  14. Sun, X.; Wang, H.; Li, S.; Song, C.; Zhang, S.; Ren, J.; Udenigwe, C.C. Maillard-Type Protein–Polysaccharide Conjugates and Electrostatic Protein–Polysaccharide Complexes as Delivery Vehicles for Food Bioactive Ingredients: Formation, Types, and Applications. Gels 2022, 8, 135. [Google Scholar] [CrossRef]
  15. Dai, K.; Wang, J.; Luo, Y.; Tu, Y.; Ren, F.; Zhang, H. Characteristics and Functional Properties of Maillard Reaction Products from α-Lactalbumin and Polydextrose. Foods 2023, 12, 2866. [Google Scholar] [CrossRef] [PubMed]
  16. Pan, X.; Mu, M.; Hu, B.; Yao, P.; Jiang, M. Micellization of casein-graft-dextran copolymer prepared through Maillard reaction. Biopolymers. 2006, 81, 29–38. [Google Scholar] [CrossRef] [PubMed]
  17. Di Pierro, P.; Chico, B.; Villalonga, R.; Mariniello, L.; Masi, P. Porta, R. Transglutaminase-catalyzed preparation of chitosan− ovalbumin films. Enzyme Microb. Technol. 2007, 40, 437–441. [Google Scholar] [CrossRef]
  18. Liu, Y.; Ma, L.; Gao, C. Facile fabrication of the glutaraldehyde cross-linked collagen/chitosan porous scaffold for skin tissue engineering. Mater. Sci. Eng.C. 2012, 32, 2361–2366. [Google Scholar] [CrossRef]
  19. Takigawa, T.; Endo, Y. Effects of glutaraldehyde exposure on human health. J Occup Health. 2006, 48, 75–87. [Google Scholar] [CrossRef]
  20. Dodero, A.; Scarfi, S.; Mirata, S.; Sionkowska, A.; Vicini, S.; Alloisio, M.; Castellano, M. Effect of Crosslinking Type on the Physical-Chemical Properties and Biocompatibility of Chitosan-Based Electrospun Membranes. Polymers. 2021, 13, 831. [Google Scholar] [CrossRef]
  21. Kuo, HH.; Chan, C.; Burrows, LL.; Deber, CM. Hydrophobic interactions in complexes of antimicrobial peptides with bacterial polysaccharides. Chem Biol Drug Des. 2007, 69, 405–1. [Google Scholar] [CrossRef]
  22. Liu, F.; McClements, DJ.; Ma, C.; Liu, X. Novel Colloidal Food Ingredients: Protein Complexes and Conjugates. Annu Rev Food Sci Technol. 2023, 14, 35–61. [Google Scholar] [CrossRef] [PubMed]
  23. Markman, G.; Livney, YD. Maillard-conjugate based core-shell co-assemblies for nanoencapsulation of hydrophobic nutraceuticals in clear beverages. Food Funct. 2012, 3, 262–70. [Google Scholar] [CrossRef] [PubMed]
  24. Hu, B.; Ting, Y.; Yang, X.; Tang, W.; Zeng, X.; Huang, Q. Nanochemoprevention by encapsulation of (-)-epigallocatechin-3-gallate with bioactive peptides/chitosan nanoparticles for enhancement of its bioavailability. Chem Commun. 2012, 48, 2421–3. [Google Scholar] [CrossRef] [PubMed]
  25. Elbialy, NS.; Mohamed, N. Alginate-coated caseinate nanoparticles for doxorubicin delivery: Preparation, characterisation, and in vivo assessment. Int J Biol Macromol. 2020, 154, 114–122. [Google Scholar] [CrossRef] [PubMed]
  26. Haggag, Y.A.; Abd Elrahman, A.A.; Ulber, R.; Zayed, A. Fucoidan in Pharmaceutical Formulations: A Comprehensive Review for Smart Drug Delivery Systems. Mar. Drugs 2023, 21, 112. [Google Scholar] [CrossRef] [PubMed]
  27. Citkowska, A.; Szekalska, M.; Winnicka, K. Possibilities of Fucoidan Utilization in the Development of Pharmaceutical Dosage Forms. Mar Drugs. 2019, 17, 458. [Google Scholar] [CrossRef] [PubMed]
  28. Zayed, A,; El-Aasr, M. ; Ibrahim, AS.; Ulber, R. Fucoidan Characterization: Determination of Purity and Physicochemical and Chemical Properties. Mar Drugs. 2020, 18, 571. [Google Scholar] [CrossRef] [PubMed]
  29. Luthuli, S.; Wu, S.; Cheng, Y.; Zheng, X.; Wu, M.; Tong, H. Therapeutic Effects of Fucoidan: A Review on Recent Studies. Mar Drugs. 2019, 17, 487. [Google Scholar] [CrossRef]
  30. Kurczewska, J. Recent Reports on Polysaccharide-Based Materials for Drug Delivery. Polymers, 2022; 14, 4189. [Google Scholar] [CrossRef]
  31. Sezer, AD.; Cevher, E. Fucoidan: A versatile biopolymer for biomedical applications. In Active Implants and Scafolds for Tissue Regeneration. Editor(s): Zilberman M. Springer: Berlin/Heidelberg, Germany. 2011; 8:377–406. ISBN: 978-3-642-18064-4.
  32. Jeon, M.S.; Han, SI.; Park, Y.H. Rapid green synthesis of silver nanoparticles using sulfated polysaccharides originating from Porphyridium cruentum UTEX 161: evaluation of antibacterial and catalytic activities. J Appl Phycol 2021, 33, 3091–3101. [Google Scholar] [CrossRef]
  33. Huang, YC.; Yang, YT. Effect of basic fibroblast growth factor released from chitosan-fucoidan nanoparticles on neurite extension. J Tissue Eng Regen Med. 2016, 10, 418–27. [Google Scholar] [CrossRef]
  34. Lee, HM.; Kim, JK.; Cho, TS. Applications of ophthalmic biomaterials embedded with fucoidan. Ind. Eng. Chem. 2012, 18, 1197–1201. [Google Scholar] [CrossRef]
  35. Fan, L.; Lu, Y.; Ouyang, XK.; Ling, J. Development and characterization of soybean protein isolate and fucoidan nanoparticles for curcumin encapsulation. Int J Biol Macromol. 2021, 169, 194–205. [Google Scholar] [CrossRef]
  36. Park, HW.; Kim, DY.; Shin, WS. Fucoidan improves the structural integrity and the molecular stability of β-lactoglobulin. Food Sci Biotechnol. 2018, 27, 1247–1255. [Google Scholar] [CrossRef] [PubMed]
  37. Chollet, L.; Saboural, P.; Chauvierre, C.; Villemin, JN.; Letourneur, D.; Chaubet, F. Fucoidans in Nanomedicine. Mar Drugs. 2016, 14, 145. [Google Scholar] [CrossRef]
  38. Aleksiev, A.; Kostova, B. Development and Optimization of the Reservoir-type Oral Multiparticulate Drug Delivery Systems of Galantamine Hydrobromide. Indian Journal of Pharmaceutical Sciences. 2016, 78. [Google Scholar] [CrossRef]
  39. Penkov, D.; Lukova, P.; Manev, H.; Dimitrova, S.; Kassarova, M. Polymer Tablet Matrix Systems for the Controlled Release of Dry Betula pendula Leaf Extract. Polymers 2023, 15, 3558. [Google Scholar] [CrossRef]
  40. Dimer, F.; de Souza Carvalho-Wodarz, C.; Haupenthal, J.; Hartmann, R.; Lehr, CM. Inhalable Clarithromycin Microparticles for Treatment of Respiratory Infections. Pharm Res. 2015, 32, 3850–61. [Google Scholar] [CrossRef]
  41. Fontana, MC.; Durli, TL.; Pohlmann, AR.; Guterres, SS.; Beck, RCR. Polymeric controlled release inhalable powder produced by vibrational spray-drying: one-step preparation and in vitro lung deposition. Powder Technol. 2014, 258, 49–59. [Google Scholar] [CrossRef]
  42. Elazazy, M.; Issa, A.; Al-Mashreky, M.; Al-Sulaiti, M.; Al-Saad, K. Application of fractional factorial design for green synthesis of cyano-modified silica nanoparticles: Chemometrics and multifarious response optimization. Advanced Powder Technology. 2018, 29. [Google Scholar] [CrossRef]
  43. Figueroa, H.; Aristizabal, J.; Reinoso-Guerra, E.; Arce, B.; Vargas-Straube, M.J.; Gentil, D.; Ramírez, C.; Cordero, J.; Barrera, N.P.; Parra, C. Fractional Factorial Design to Evaluate the Synthesis and Electrochemical Transfer Parameters of h-BN Coatings. Nanomaterials 2023, 13, 2992. [Google Scholar] [CrossRef]
  44. Burova, T.; Grinberg, N.; Dubovik, A.; Plashchina, I.; Usov, A.; Grinberg, V. β-Lactoglobulin–fucoidan nanocomplexes: Energetics of formation, stability, and oligomeric structure of the bound protein. Food Hydrocolloids. 2022, 129, 107666. [Google Scholar] [CrossRef]
  45. Lakshmanan, A.; Balasubramanian, B.; Maluventhen, V.; Malaisamy, A.; Baskaran, R.; Liu, W-C. ; Arumugam, M. Extraction and Characterization of Fucoidan Derived from Sargassum ilicifolium and Its Biomedical Potential with In Silico Molecular Docking. Applied Sciences. 2022, 12, 13010. [Google Scholar] [CrossRef]
  46. Saravana, PS.; Cho, YN.; Patil, MP.; Cho, YJ.; Kim, GD.; Park, YB.; Woo, HC.; Chun, BS. Hydrothermal degradation of seaweed polysaccharide: Characterization and biological activities. Food Chem. 2018, 268, 179–187. [Google Scholar] [CrossRef] [PubMed]
  47. Hashimoto, N.; Mori, K.; Yoshida, H.; Kamiuchi, N.; Kitaura, R.; Hirasawa, R.; Yamashita, H. Thermal Stability of High-Entropy Alloy Nanoparticles Evaluated by In Situ TEM Observations. Nano Lett. 2024. [Google Scholar] [CrossRef] [PubMed]
  48. Szyk-Warszyńska, L.; Raszka, K.; Warszyński, P. Interactions of Casein and Polypeptides in Multilayer Films Studied by FTIR and Molecular Dynamics. Polymers 2019, 11, 920. [Google Scholar] [CrossRef]
  49. Soto-Vásquez, M.R.; Alvarado-García, P.A.A.; Youssef, F.S.; Ashour, M.L.; Bogari, H.A.; Elhady, S.S. FTIR Characterization of Sulfated Polysaccharides Obtained from Macrocystis integrifolia Algae and Verification of Their Antiangiogenic and Immunomodulatory Potency In Vitro and In Vivo. Mar. Drugs 2023, 21, 36. [Google Scholar] [CrossRef]
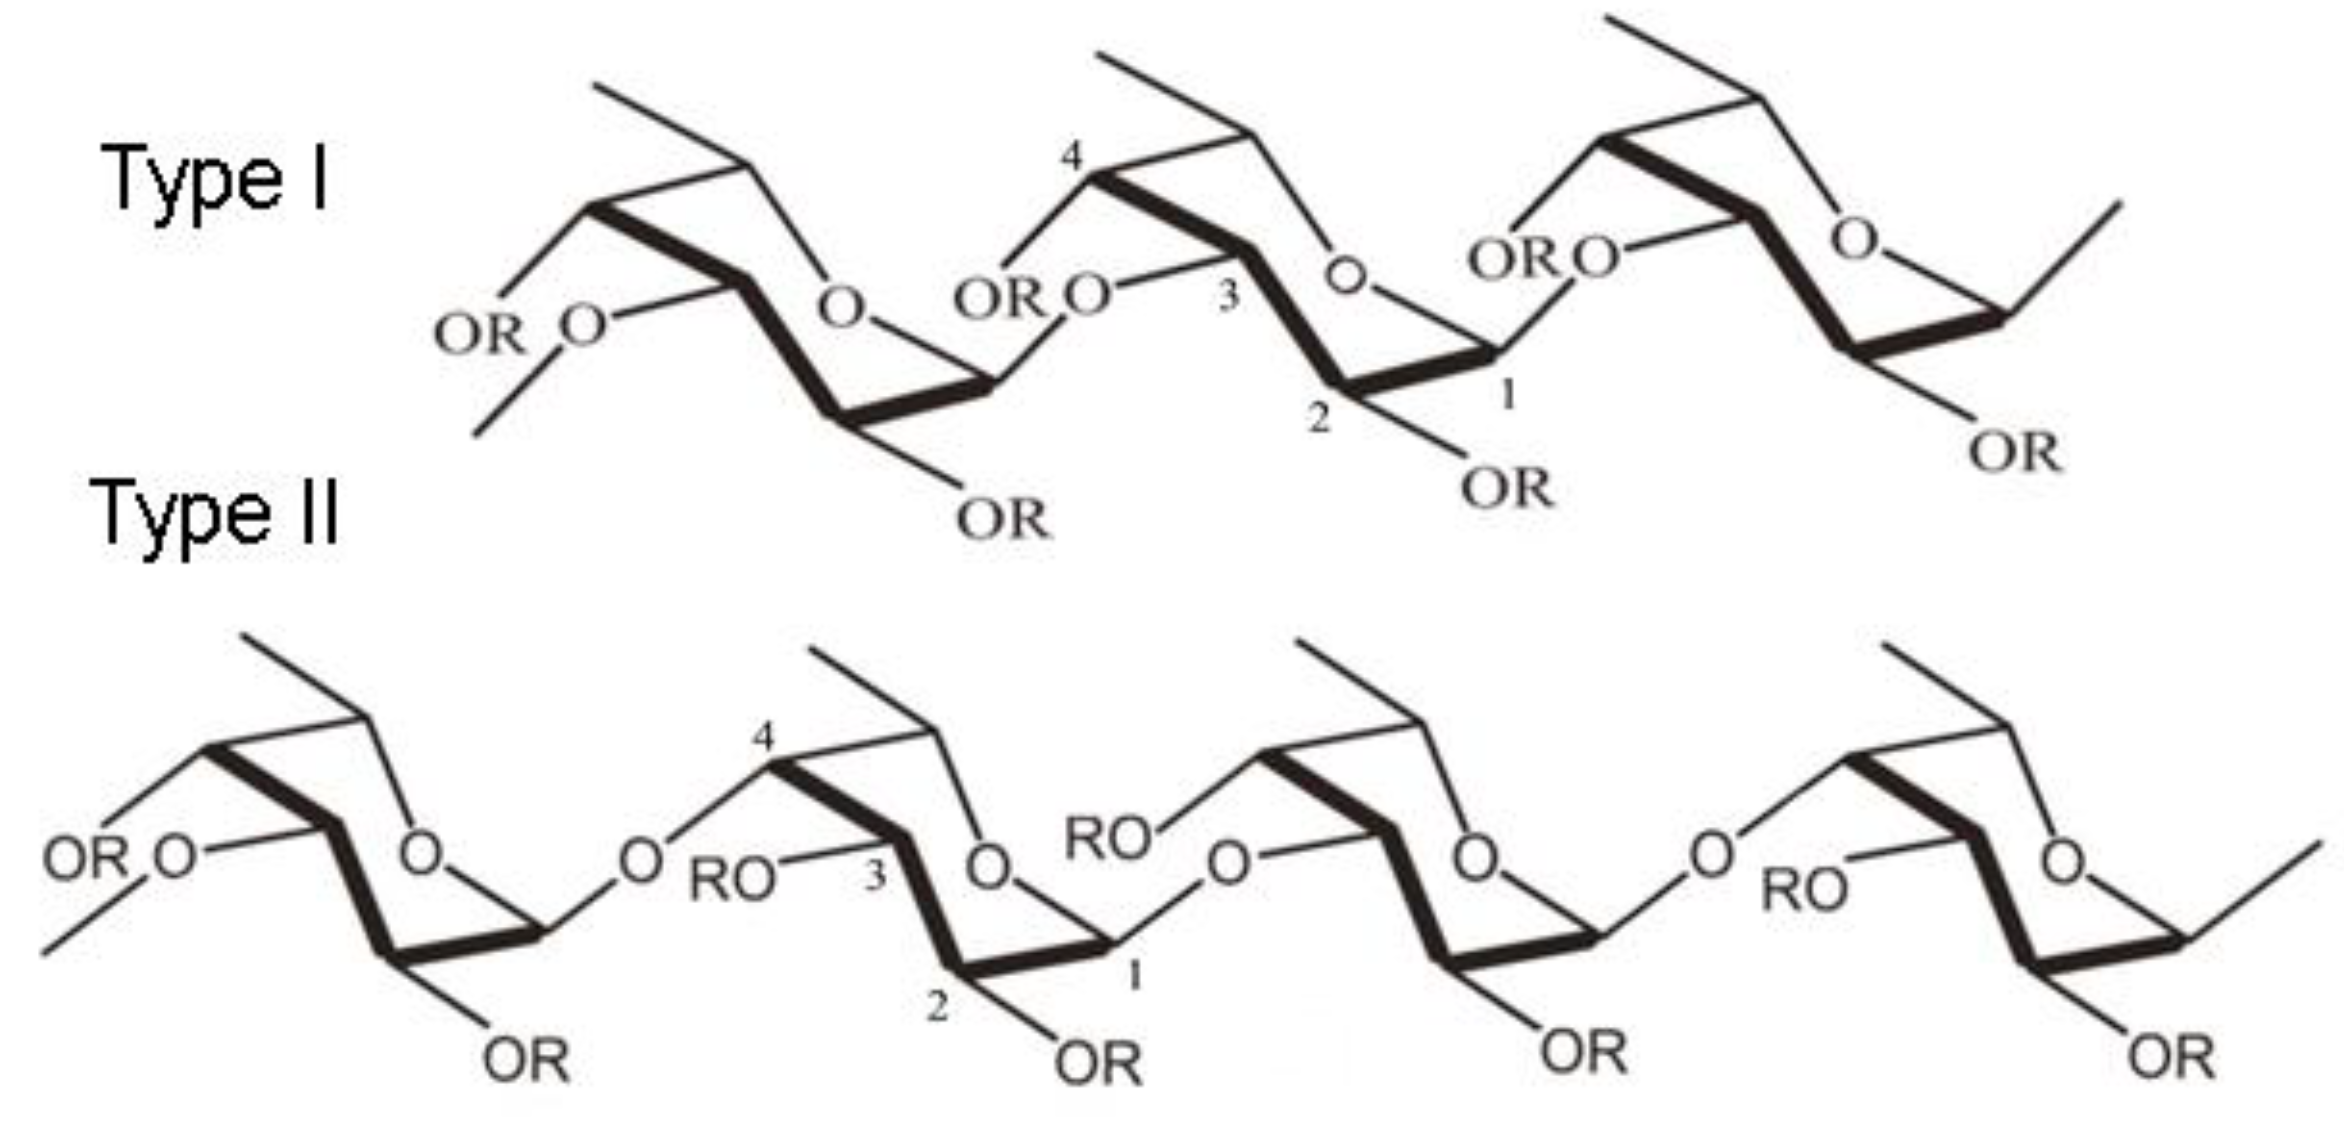
Figure 1. Fucoidan structure: α-(1→3)-α-L-fucopyranose skeleton linked with sulfate radicals at C2 and C4 position (Type I) and α-(1→3)- and α-(1→4) )-α-L-fucopyranose skeleton with sulfate radicals attached to C2, C3 and C4 positions (Type II) [27].
Preprints 108358 g001
Figure 2. Schematic representation of the preparation of casein/fucoidan composite nanoparticles (Generated using BioRender™).
Preprints 108358 g002
Figure 3. Pareto chart reflecting the standardized effect of independents on yield.
Preprints 108358 g003
Figure 4. 3D plot showing the effect of casein to fucoidan ratio and glutaraldehyde concentration on particle yield.
Preprints 108358 g004
Figure 5. Normal probability plot of residuals with respect to yield (a); Plot of residuals versus predicted values (b).
Preprints 108358 g005
Figure 6. Pareto chart showing the standardized effect of independents on particle size.
Preprints 108358 g006
Figure 7. 3D surface plot showing the effect of casein to fucoidan ratio and glutaraldehyde concentration on particle size.
Preprints 108358 g007
Figure 8. SEM micrographs of casein/fucoidan composite nanostructures of different models obtained at 10 000x magnification, accelerating voltage 20 kV using an Everhart–Thornley detector.
Preprints 108358 g008aPreprints 108358 g008b
Figure 9. Normal probability plot of residuals with respect to size (a); Plot of residuals versus predicted size values (b).
Preprints 108358 g009
Figure 10. Pareto chart showing the standardized effect of independents on size.
Preprints 108358 g010
Figure 11. 3D surface plot showing the influence of casein to fucoidan ratio and glutaraldehyde concentration on the zeta potential of the particles.
Preprints 108358 g011
Figure 12. Normal probability plot of residuals versus zeta potential (a); plot of residuals versus predicted zeta values (b).
Preprints 108358 g012
Figure 13. DSC thermograms of casein (A), fucoidan (B) and casein-fucoidan composite nanostructures (C).
Preprints 108358 g013aPreprints 108358 g013b
Figure 14. FTIR spectra of casein, fucoidan and casein-fucoidan composite nanostructures.
Preprints 108358 g014aPreprints 108358 g014b
Table 1. Variables in the 3 k-p experimental design.
Variables Levels
Independent variables -1 0 +1
X1: Casein:Fucoidan ratio 1:1 2:1 3:1
X2: Glutaraldehyde concentration (%) 3 2 1
X3: Spray intensity (%) 30 40 50
Dependent variables
Y1: Yield (%)
Y2: Particle size (µm)
Y3: Zeta potential (mV)
Table 2. Compositions and main characteristics of the nine nanoparticle models. Cas/FN - casein to fucoidan ratio; GLD - glutaraldehyde concentration, Sp.int. – Spray intensity.
Models Independent variables Dependent variables
Cas/FN GLD (%) Sp.int.(%) Size ± SD
(µm)
ζ ± SD
(mV)
Yield ± SD
(%)
C1F1G1Sp.30 -1 -1 -1 264 ± 32 -25.71 ± 1.0 66.41 ± 2.2
C1F1G2Sp.40 -1 0 +1 356 ± 11 -20.12 ± 0.9 48.91 ± 2.9
C1F1G3Sp.50 -1 +1 0 282 ± 25 -23.72 ± 1.8 53.72 ± 1.9
C2F1G1Sp.50 0 -1 +1 742 ± 252 -10.21 ± 1.5 20.66 ± 1.5
C2F1G2Sp.40 0 0 0 512 ± 360 -13.43 ± 1.6 27.81 ± 2.6
C2F1G3Sp.30 0 +1 -1 484 ± 121 -15.51 ± 1.4 38.03 ± 1.8
C3F1G1Sp.40 +1 -1 0 1043 ± 986 -3.23 ± 0.7 7.31 ± 3.4
C3F1G2Sp.30 +1 0 -1 842 ± 263 -5.65 ± 0.9 18.54 ± 2.7
C3F1G3Sp.50 +1 +1 +1 1515 ± 353 -1.03 ± 1.9 5.21 ± 2.2
Table 3. Estimation of main effects of factors and coefficients for predictive mathematical models.
Factor Yield (%) Particle size (µm) ζ (mV)
Effect SE p β Effect SE p β Effect SE p β
Mean/Int. 34.59 0.38 0.00 207.54 0.62 0.06 0.01 0.34 -14.35 0.66 0.00 -83.330
Cas/Fn (1) -45.86 0.92 0.00 -2.68 0.80 0.15 0.03 0.01 19.64 1.59 0.00 1.244
GLD (2) 0.11 0.96 0.91 -6.40 0.09 0.16 0.63 -0.68 -0.15 1.67 0.78 -7.010
Sp.Int. (3) -15.32 0.96 0.00 -0.49 0.32 0.16 0.18 -0.04 5.31 1.67 0.08 0.374
1 by 2 7.86 1.36 0.02 0.30 0.00 0.23 0.97 0.00 -1.08 2.35 0.69 -0.040
1 by 3 1.48 1.36 0.38 0.00 0.10 0.23 0.69 0.00 -2.32 2.35 0.42 -0.010
2 by 3 -6.37 1.41 0.04 -0.31 0.37 0.24 0.26 0.01 4.72 2.44 0.19 0.236
SE – Standart Error; p-value; β – regression coefficient.
Table 4. Summary results of the performed analysis of variance (One Way ANOVA) regarding the influence of the independent variables and their combined influence on the dependent.
Factor SS df MS F p
Yield: R2=0.99; R2Adj.=0.99; MS=1.30
Cas/Fn (1) 3188.93 1 3188.93 2451.84 0.00
GLD (2) 0.01 1 0.01 0.01 0.91
Spray.Int (3) 326.21 1 326.21 250.81 0.00
1 by 2 41.43 1 41.43 31.86 0.02
1 by 3 1.54 1 1.54 1.18 0.38
2 by 3 26.25 1 26.25 20.18 0.04
Error 2.60 2
Total SS 3632.52 8
Particle size: R2=0.94; R2Adj.=0.77; MS=0.03
Cas/Fn (1) 0.99 1 0.99 26.40 0.03
GLD (2) 0.01 1 0.01 0.30 0.63
Spray.Int (3) 0.14 1 0.14 3.95 0.18
1 by 2 0.00 1 0.00 0.00 0.97
1 by 3 0.00 1 0.00 0.20 0.69
2 by 3 0.09 1 0.09 2.40 0.26
Error 0.07 2
Total SS 1.36 8
Zeta potential: R2=0.98; R2Adj.=0.95; MS=3.87
Cas/Fn (1) 585.15 1 585.15 150.98 0.00
GLD (2) 0.37 1 0.37 0.09 0.78
Spray.Int (3) 39.31 1 39.31 10.14 0.08
1 by 2 0.82 1 0.81 0.21 0.69
1 by 3 3.79 1 3.79 0.97 0.42
2 by 3 14.44 1 14.44 3.72 0.19
Error 7.75 2 3.87
Total SS 633.89 8
SS – Sum of squares; df – degree of freedom; MS – mean sum of squares; F-value; p-value.
Table 5. Experimental and model-predicted values of relative yields of particles (%).
Batch Observed Predicted Residuals Error (%)
C1F1G1Sp.30 66.41 66.52 -0.11 -0.16
C1F1G2Sp.40 48.91 49.12 -0.21 -0.42
C1F1G3Sp.50 53.72 53.74 -0.02 -0.03
C2F1G1Sp.50 20.66 20.69 -0.03 -0.14
C2F1G2Sp.40 27.81 26.34 1.46 5.28
C2F1G3Sp.30 38.03 38.36 -0.33 -0.86
C3F1G1Sp.40 7.31 7.74 -0.45 -5.88
C3F1G2Sp.30 18.54 18.58 -0.04 -0.21
C3F1G3Sp.50 5.21 5.49 -0.24 -5.37
Table 7. Experimental and model-predicted values of relative particle size (µm).
Batch Observed Predicted Residuals Error (%)
C1F1G1Sp.30 0.264 0.243 0.02 -0.21
C1F1G2Sp.40 0.356 0.329 0.02 -0.23
C1F1G3Sp.50 0.282 0.267 0.01 -0.17
C2F1G1Sp.50 0.742 0.719 0.02 -0.28
C2F1G2Sp.40 0.512 0.768 -0.25 2.60
C2F1G3Sp.30 0.484 0.442 0.04 -0.37
C3F1G1Sp.40 1.043 0.986 0.05 -0.50
C3F1G2Sp.30 0.842 0.811 0.03 -0.38
C3F1G3Sp.50 1.515 1.471 0.04 -0.44
Table 8. ANOVA significance testing of the proposed model.
R2 R2adj SS df MS SS df MS F p
0.810 0.696 1.102 3 0.367 0.258 5 0.0517 7.105 0.0297
Table 9. Experimental and model-predicted values of particle zeta potential (mV).
Batch Observed Predicted Residuals Error (%)
C1F1G1Sp.30 -25.71 -25.91 0.20 -0.81
C1F1G2Sp.40 -20.12 -20.35 0.23 -1.18
C1F1G3Sp.50 -23.72 -23.89 0.17 -0.75
C2F1G1Sp.50 -10.21 -10.49 0.28 -2.75
C2F1G2Sp.40 -13.43 -10.82 2.60 -19.4
C2F1G3Sp.30 -15.51 -15.88 0.37 -2.39
C3F1G1Sp.40 -3.23 -3.73 0.50 -15.63
C3F1G2Sp.30 -5.65 -6.03 0.38 -6.75
C3F1G3Sp.50 -1.03 -1.47 0.44 -43.05
Table 10. ANOVA significance testing of the proposed model.
R2 R2adj. SS df MS SS df MS F p
0.9642 0.9642 611.22 3 203.74 22.66 5 4.533 44.94 0.00048
Disclaimer/Publisher’s Note: The statements, opinions and data contained in all publications are solely those of the individual author(s) and contributor(s) and not of MDPI and/or the editor(s). MDPI and/or the editor(s) disclaim responsibility for any injury to people or property resulting from any ideas, methods, instructions or products referred to in the content.
Copyright: This open access article is published under a Creative Commons CC BY 4.0 license, which permit the free download, distribution, and reuse, provided that the author and preprint are cited in any reuse.
Prerpints.org logo

Preprints.org is a free preprint server supported by MDPI in Basel, Switzerland.

Subscribe

© 2024 MDPI (Basel, Switzerland) unless otherwise stated