Submitted:
04 June 2024
Posted:
05 June 2024
You are already at the latest version
Abstract
Keywords:
1. Introduction
- -
- Mangrove above and below biomass: a lack of biodiversity is typically linked with a loss of biomass [39]. Likewise, tree characteristics such as age and density have been found to directly correlate with biomass [40]. Evaluating the level of biomass, a forest contains is vital to ensure the correct forestry management practices are implemented [41].
- -
- Mangrove density. The density of the mangroves affects their ability to protect the coast from storm or wave damage [11]. Although mangroves attenuate wave action [12], the more dispersed they are the less of an impact they have. Density can also potentially impact wildlife relying on the mudflats, e.g., crabs.
- -
- Soil quality. Soil composition can provide an indication of mangrove ecosystems health [36]. Mangroves regulate carbon found within coastal soils through CO2 sequestration and biomass accumulation [42,43]. They can also nullify pollutants and denitrify waterways which are secured within the soils [44]. The presence of aluminium, however, can hinder propagule growth, and is often associated with aquaculture [45].
- -
- Crab assemblages. Crabs are intertwined with the growth and development of mangroves [37]. Ferreira et al. [46] suggest that monitoring the abundance of crabs could be used to measure the success of mangrove restoration. Crabs facilitate litter decomposition through leaf processing, burying of leaves and mixing of soil and decomposing bacteria through excavations [15,47,48,49]. Concurrently, they may also influence density and community structure through direct consumption of the propagules.
- -
- Fishing pressure. Pressure from fishing activities can directly impact mangrove health. Local communities rely on resources from mangroves but can be overexploited through intense use.
2. Materials and Methods
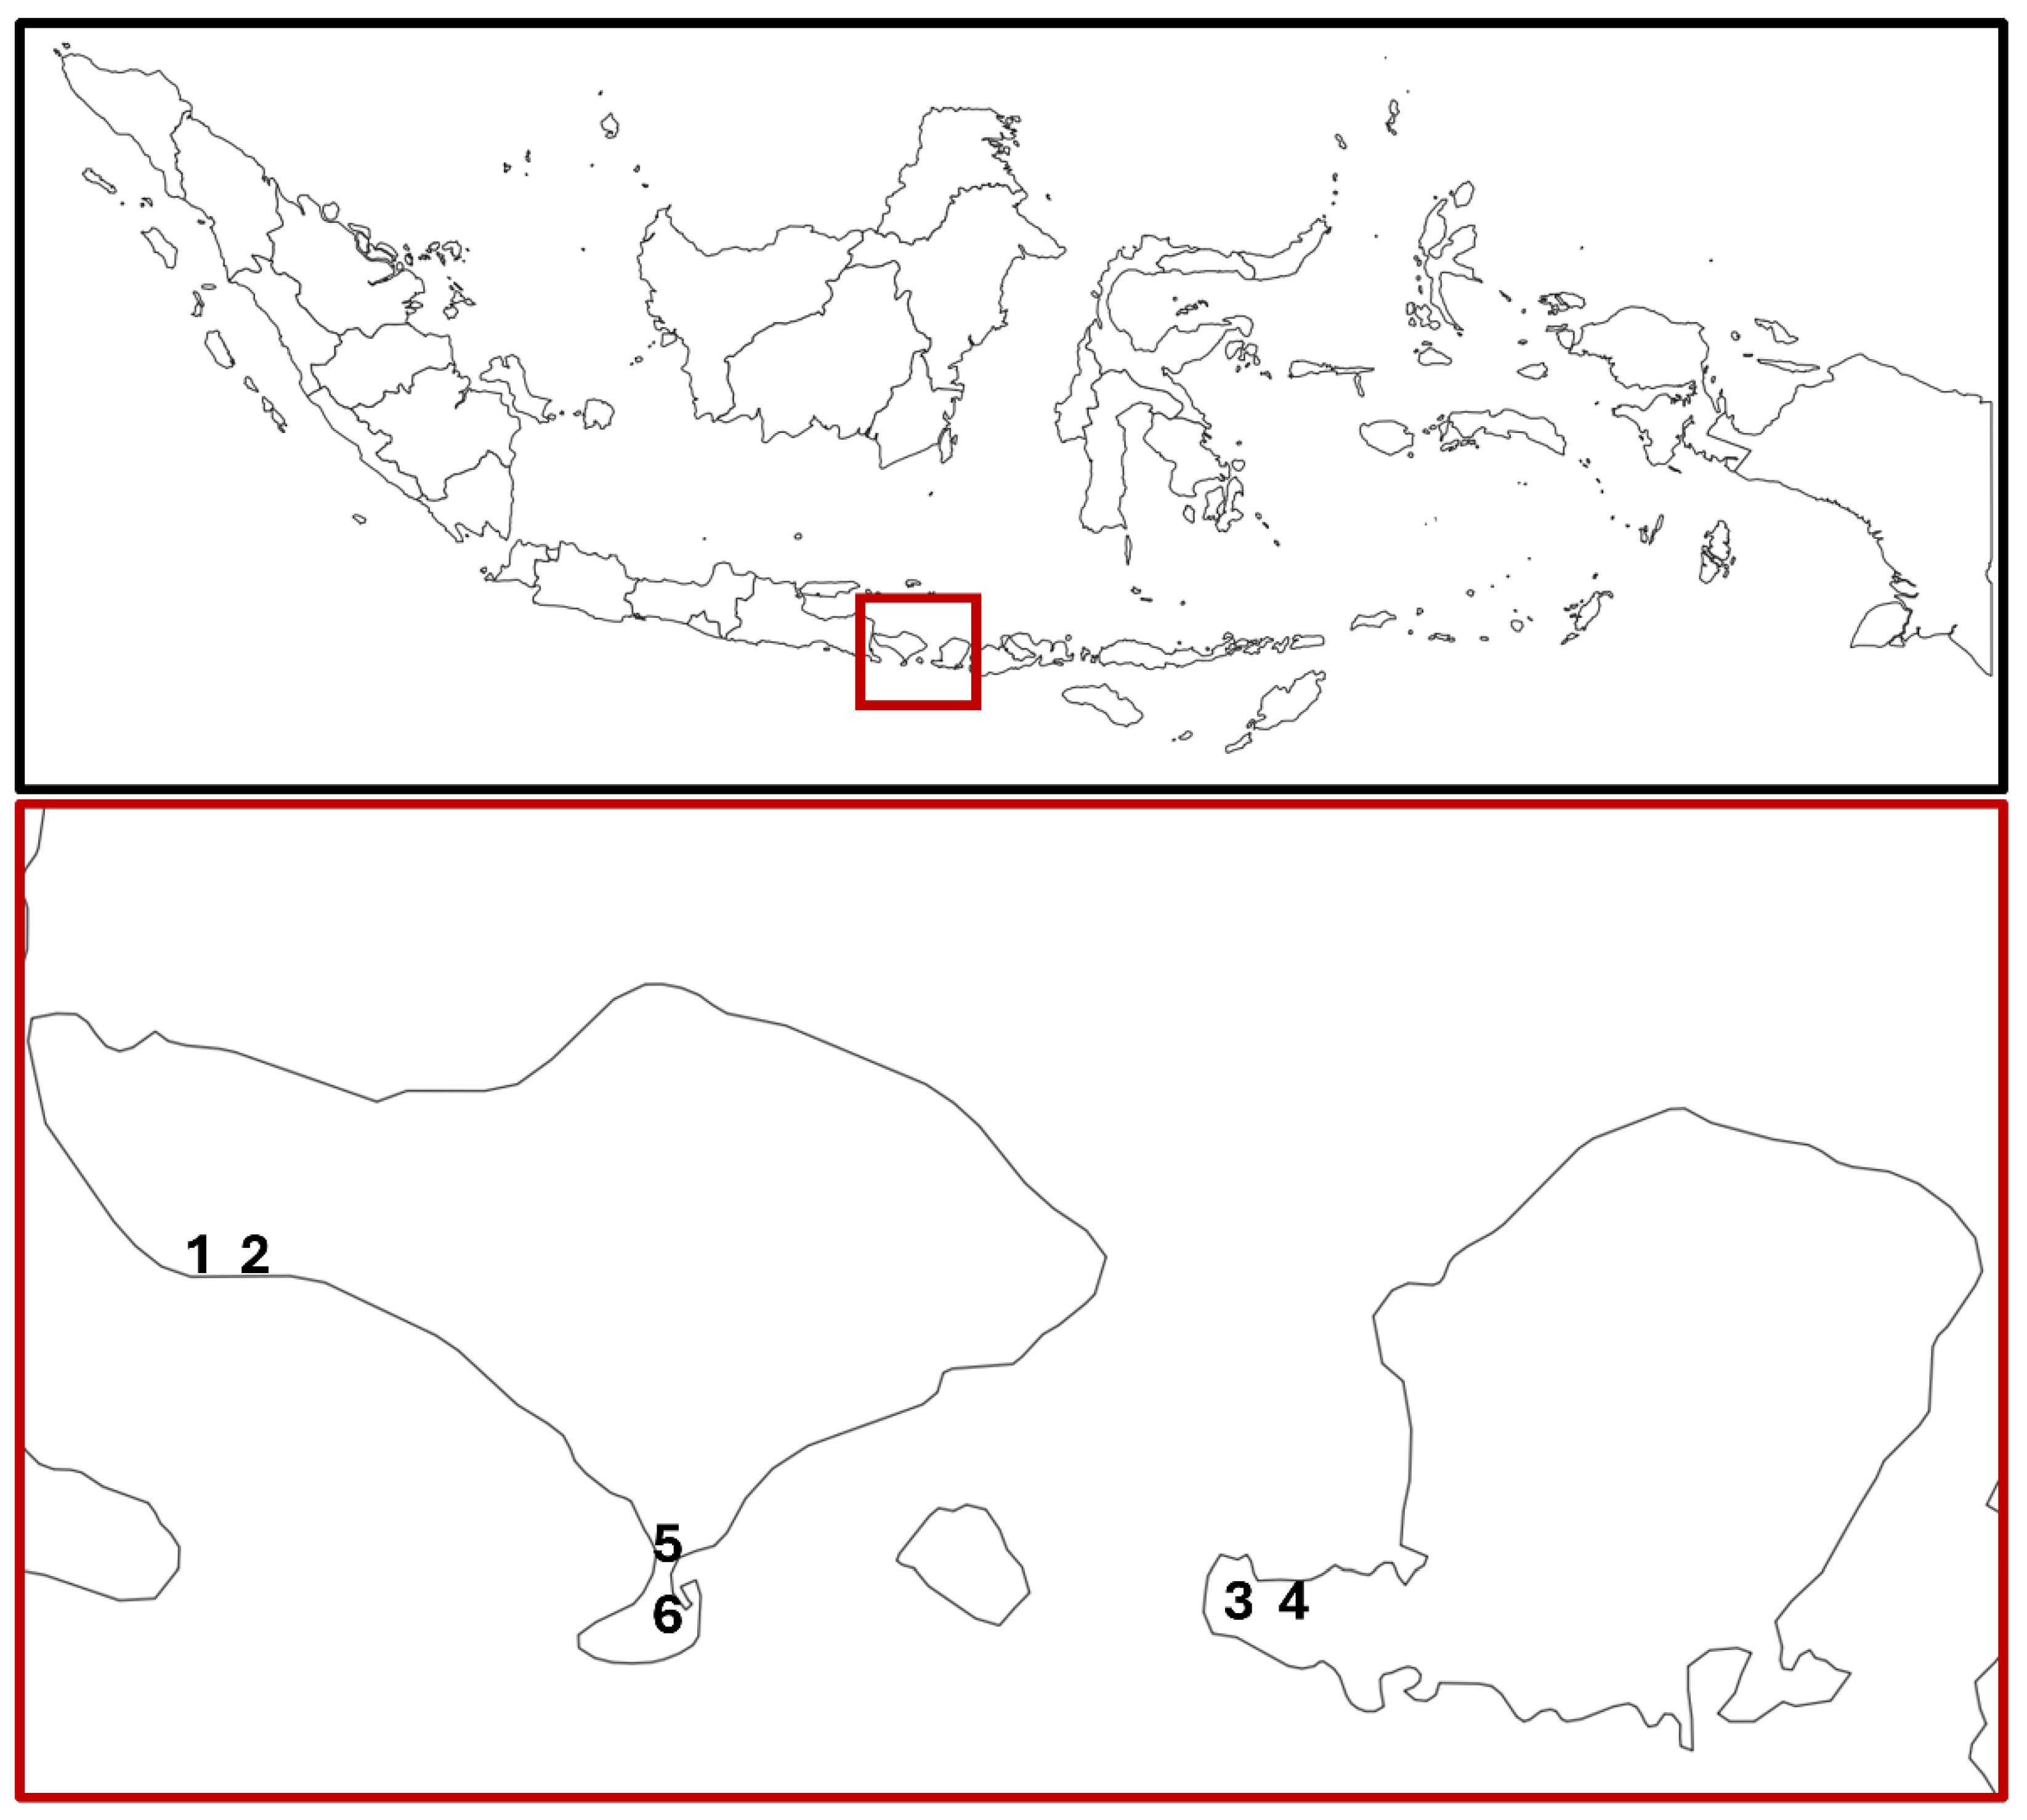
2.1. Site Selection and Descriptions
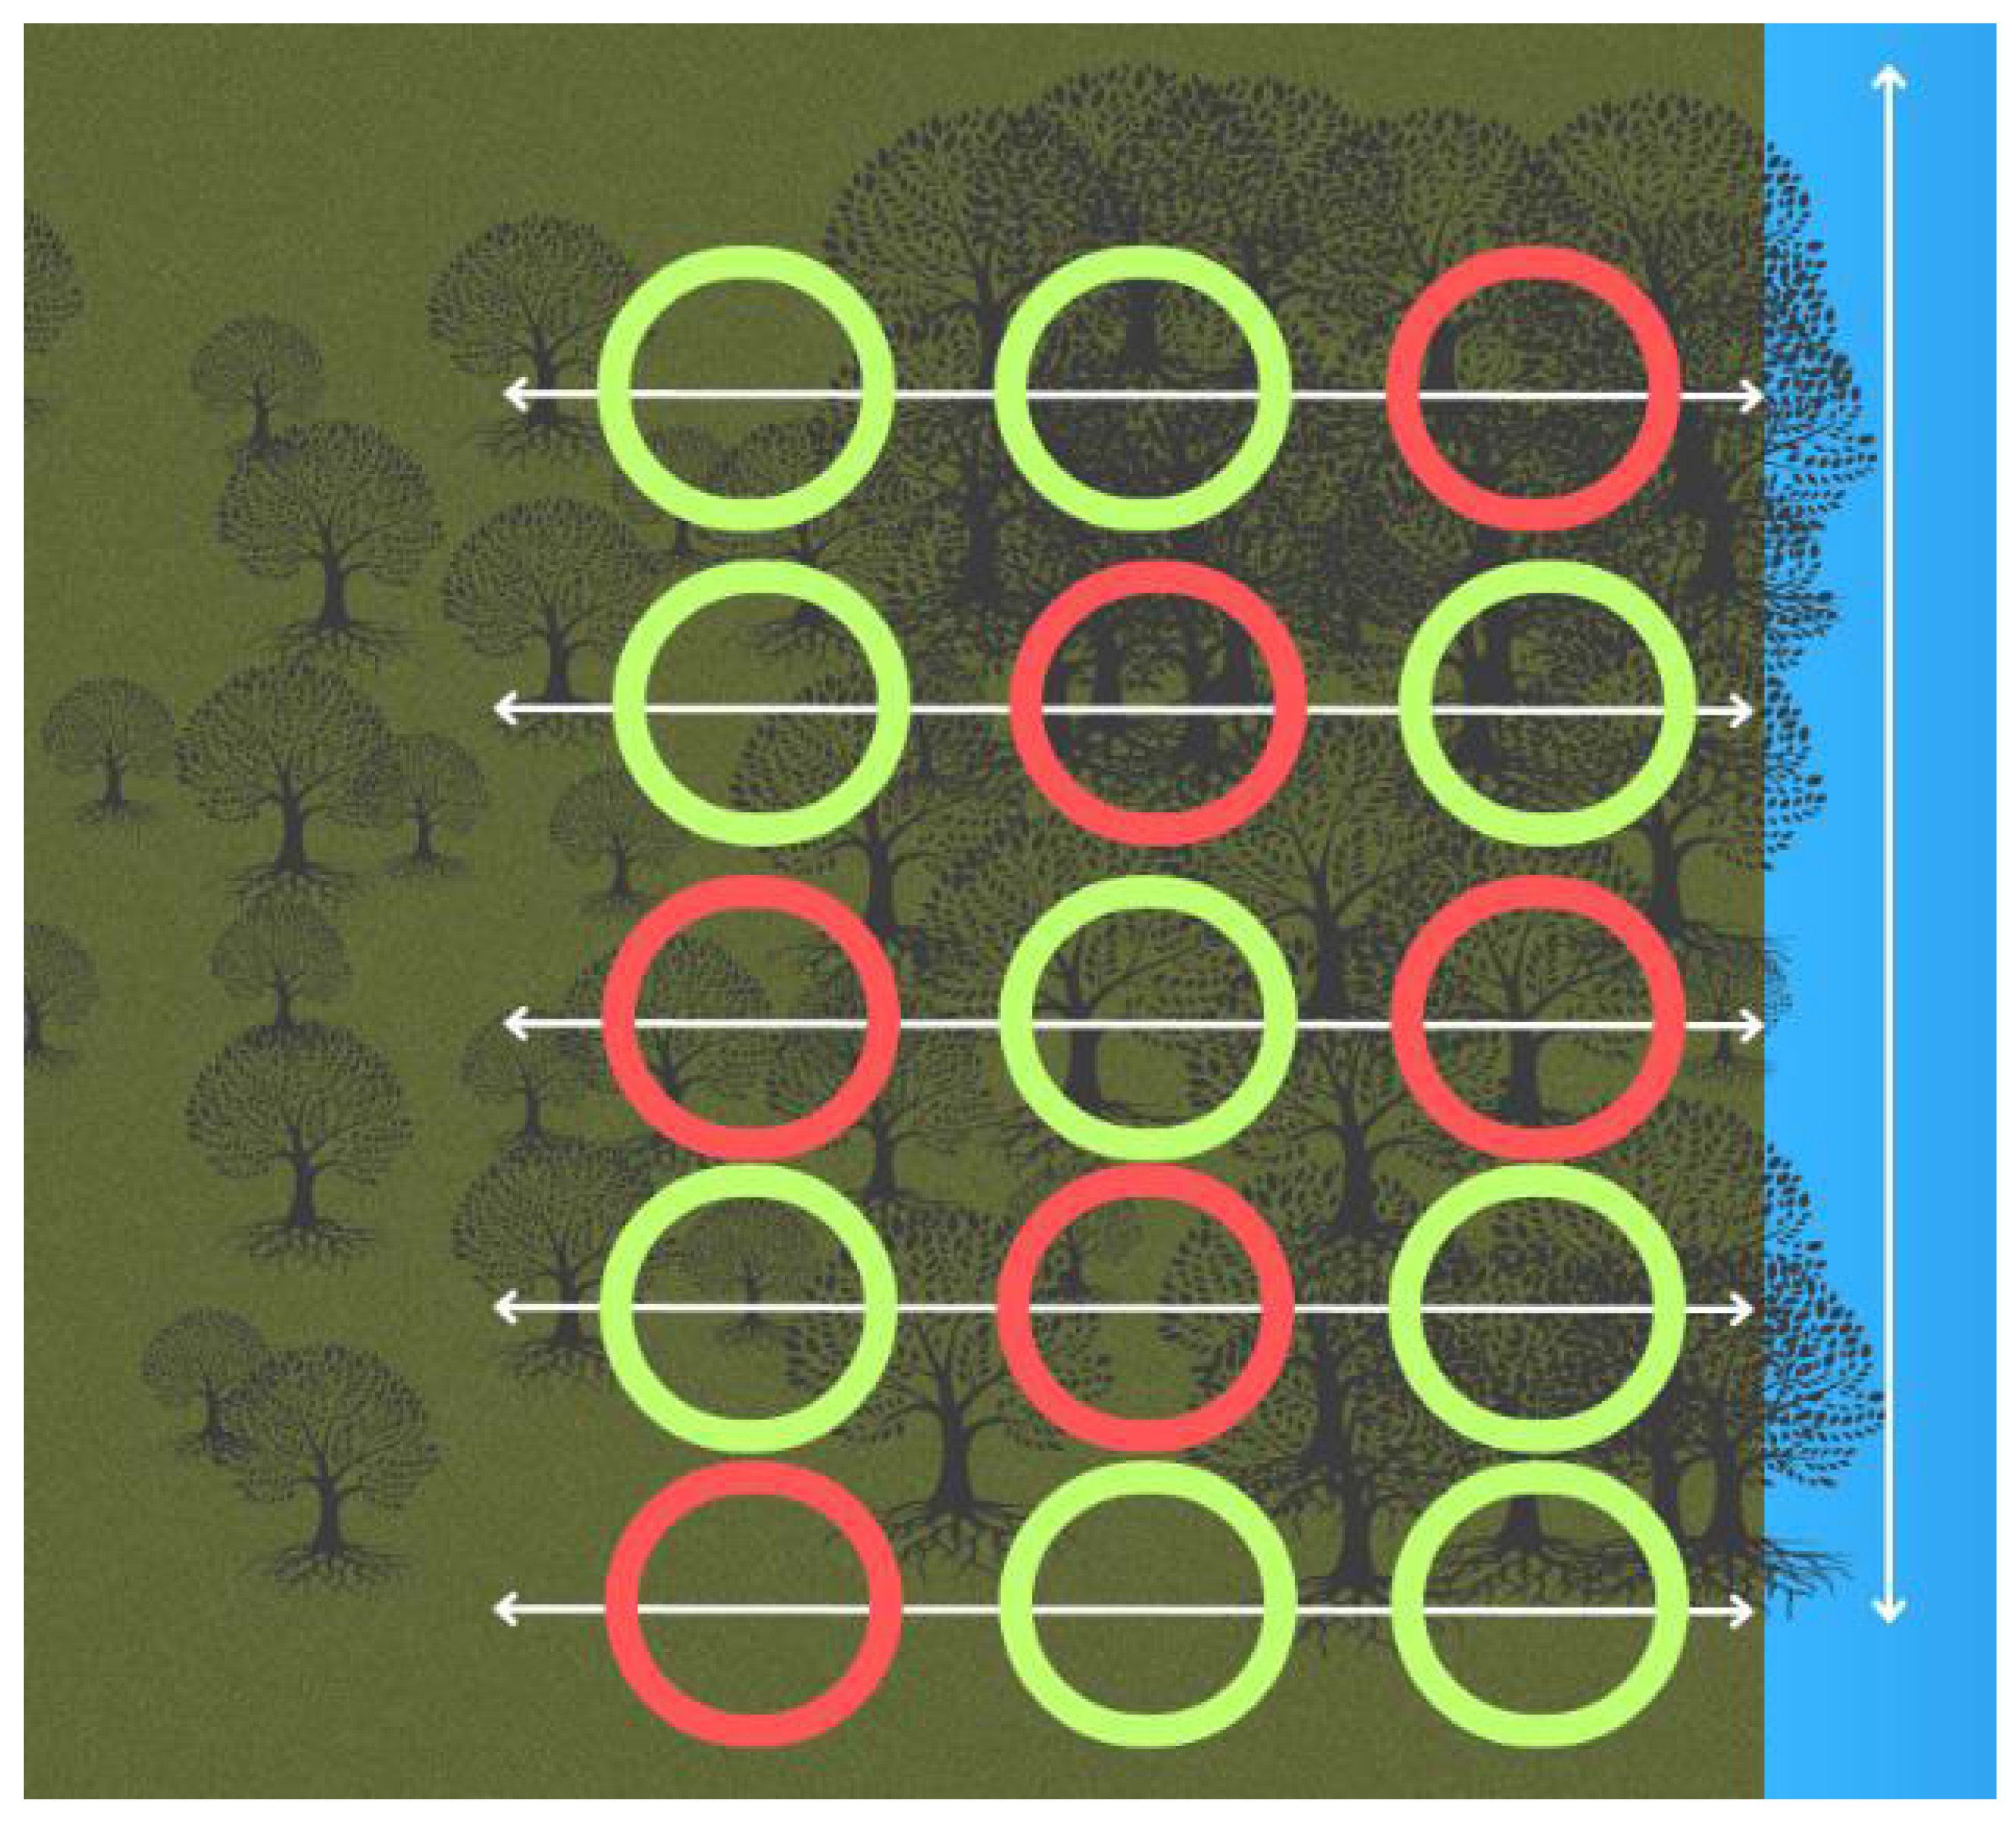
2.2. Survey Design
2.3. Mangrove Vegetation
| Species | Equation | Source |
|---|---|---|
| Above Ground Biomass | ||
| Avicennia marina | 0.1848D²˙³⁵²⁴ | [51] |
| Rhizophora apiculata | 0.38363D²˙²³⁴⁸ | [52] |
| Rhizophora mucronata | 0.128D²˙⁶ | [53] |
| Rhizophora stylosa | 0.105D²˙⁶⁸ | [54] |
| Sonneratia caseolaris | 0.04975D¹˙⁹⁴⁷⁴⁸ | [55] |
| All other species* | 0.251ρD²˙⁴⁶ | [56] |
| Below Ground Biomass | ||
| Avicennia marina | 1.28D¹˙¹⁷ | [57] |
| Rhizophora stylosa | 0.134D²˙⁴ | [58] |
| Sonneratia caseolaris | 0.0142D²˙¹²¹⁴⁶ | [55] |
| All other species | 0.199ρ0.899D²˙²² | [56] |
| * Wood density for species without an equation (ρ): Avicennia alba (0.72); Avicennia officinalis (0.72); Bruguiera gymnirosa (0.77); Ceriops decandra (0.78); Ceriops tagal (0.78); Lumnitzera racemose (0.87); Rhizophora apiculata (0.85); Rhizophora mucronate (0.82); Sonneratia alba (0.51); Xylocarpus granatum (0.70) | ||
2.5. Soil
2.6. Crabs
2.7. Fishing Pressure
2.8. Data Analysis
3. Results
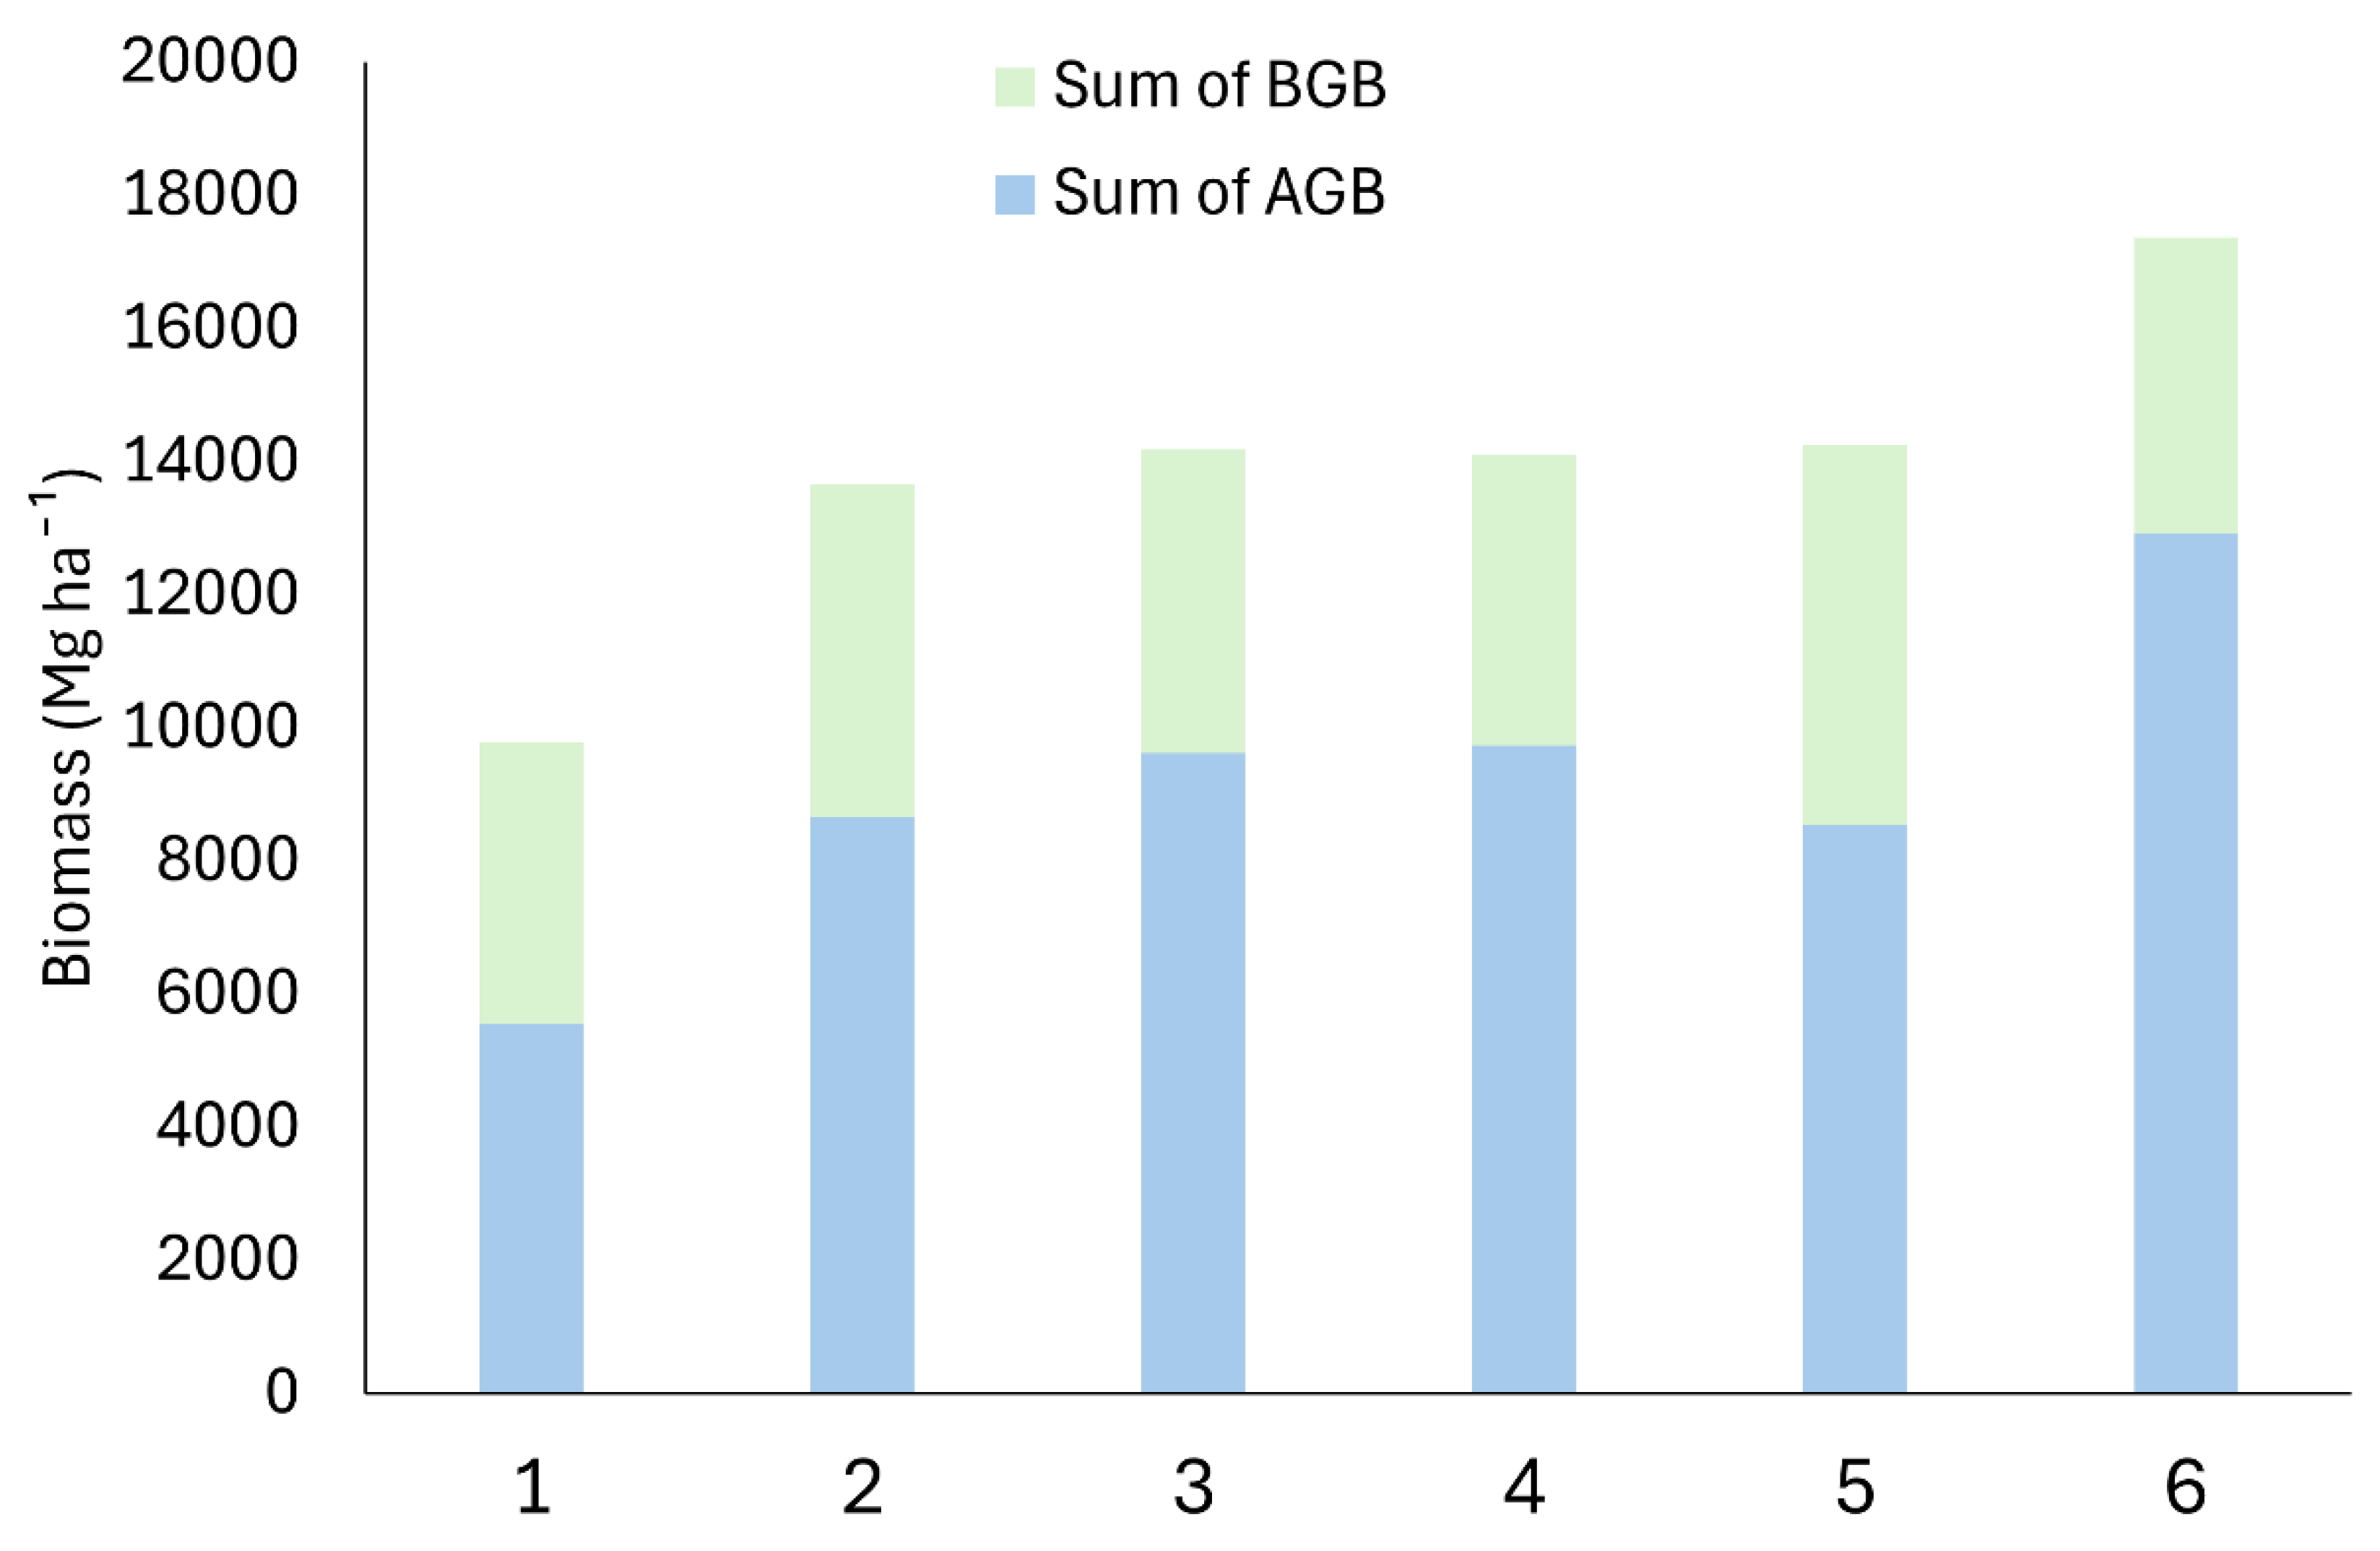
3.1. Mangrove Vegetation
| Variablea | Site 1 | Site 2 | Site 3 | Site 4 | Site 5 | Site 6 | Total |
|---|---|---|---|---|---|---|---|
| Richness | 12 | 8 | 7 | 6 | 6 | 6 | 13 |
| N trees | 1747 | 459 | 892 | 457 | 22 | 56 | 3633 |
| Mean DBH | 9.3 | 15.7 | 18.1 | 18.5 | 109.0 | 36.7 | 34.5 |
| Mean height | 2.5 | 4.2 | 4.5 | 4.1 | 6.0 | 4.9 | 4.4 |
| Mean diversity | 0.9 | 0.8 | 1.2 | 1.0 | 0.4 | 0.6 | 0.8 |
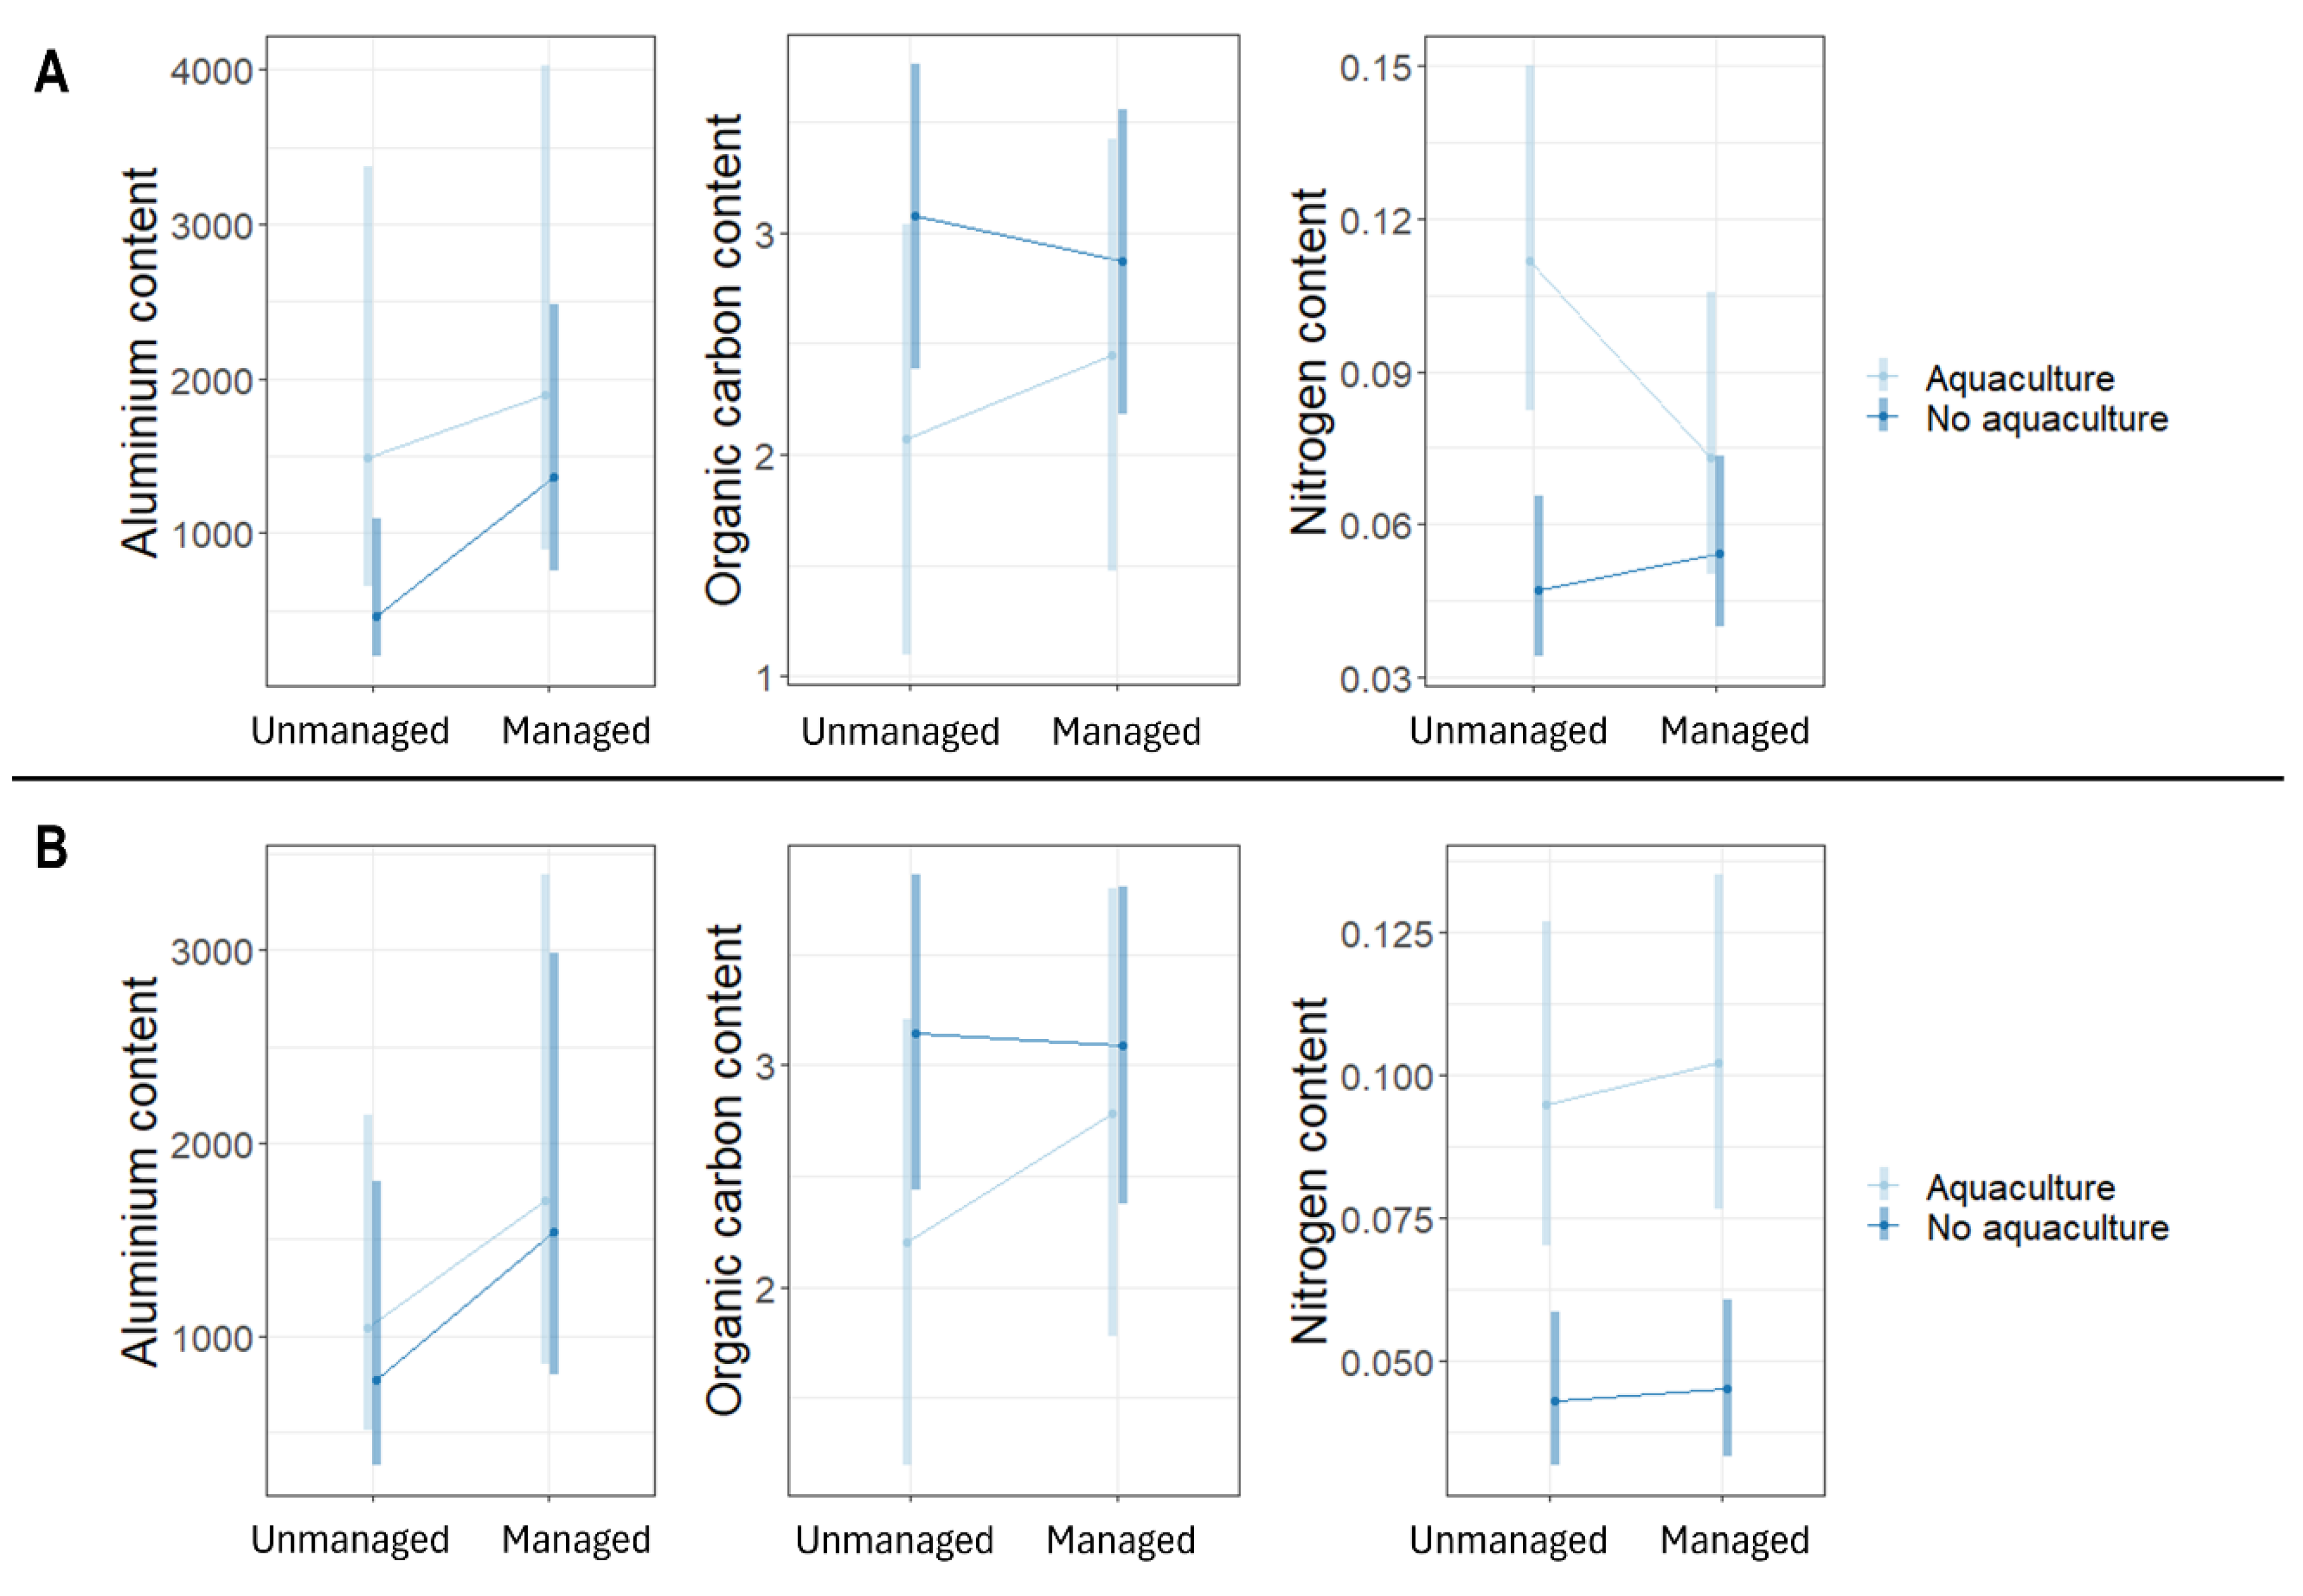
3.2. Soil
3.3. Crabs
3.4. Correlations between Variables
3.5. Fishing Pressure
4. Discussion
5. Conclusions
Supplementary Materials
Author Contributions
Funding
Data Availability Statement
Acknowledgments
Conflicts of Interest
Appendix A
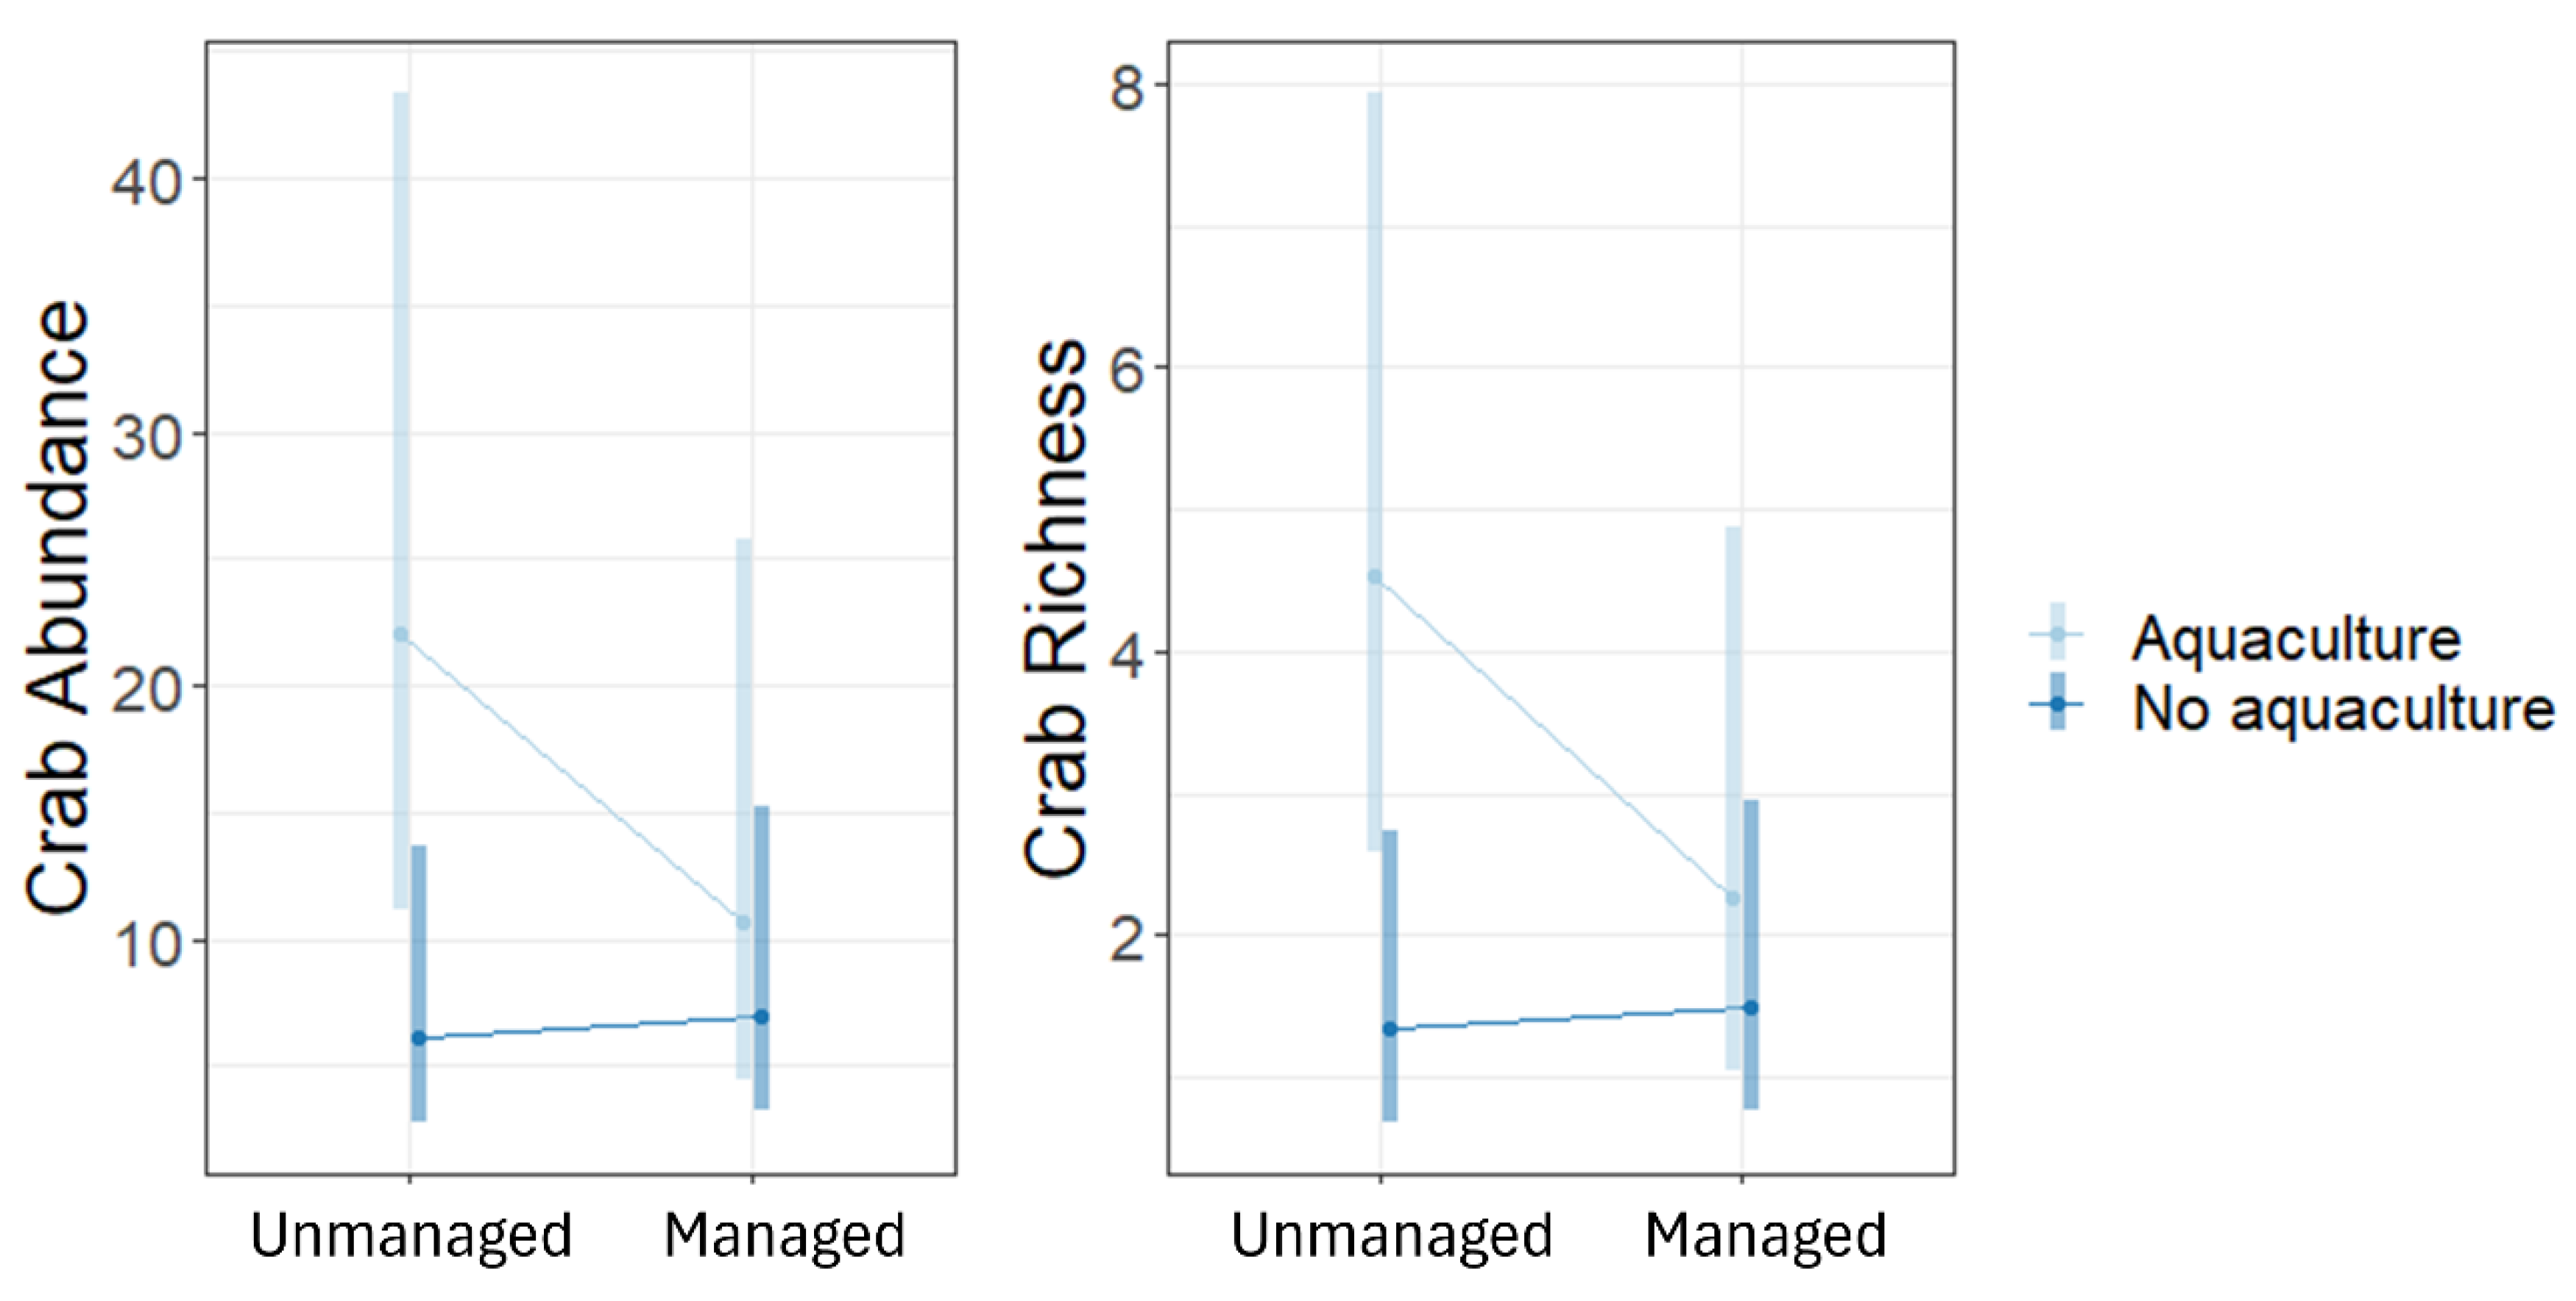
| Response variable | Predictor | Estimate | Std Error | Z value | P Value |
|---|---|---|---|---|---|
| Crab abundance | Intercept | 3.09 | 0.35 | 8.93** | <0.001 |
| No aquaculture vs aquaculture | -1.30 | 0.49 | -2.59** | 0.010 | |
| Managed vs unmanaged | -0.72 | 0.53 | -1.36 | 0.174 | |
| Interaction effect | 0.85 | 0.73 | 1.16 | 0.246 | |
| Crab richness | Intercept | 1.51 | 0.29 | 5.27** | <0.001 |
| No aquaculture vs aquaculture | -1.21 | 0.45 | -2.69** | 0.007 | |
| Managed vs unmanaged | -0.70 | 0.48 | -1.46 | 0.146 | |
| Interaction effect | 0.80 | 0.68 | 1.18 | 0.239 | |
| Crab diversity | Intercept | -0.58 | 0.56 | -1.04 | 0.297 |
| No aquaculture vs aquaculture | -1.13 | 0.83 | -1.37 | 0.171 | |
| Managed vs unmanaged | -0.36 | 0.85 | -0.43 | 0.668 | |
| Interaction effect | -0.01 | 1.26 | -0.01 | 0.994 | |
| Mangrove abundance | Intercept | 4.16 | 2.02 | 2.06* | 0.039 |
| No aquaculture vs aquaculture | -1.13 | 2.02 | -0.56 | 0.575 | |
| Managed vs unmanaged | -0.10 | 0.62 | -0.16 | 0.874 | |
| Interaction effect | -0.26 | 0.80 | -0.33 | 0.744 | |
| Mangrove AGB | Intercept | 5.91 | 0.39 | 15.15** | <0.001 |
| No aquaculture vs aquaculture | 0.71 | 0.47 | 1.53 | 0.126 | |
| Managed vs unmanaged | 0.45 | 0.54 | 0.83 | 0.409 | |
| Interaction effect | -0.67 | 0.65 | -1.02 | 0.306 | |
| Mangrove BGB | Intercept | 5.64 | 0.36 | 15.48** | <0.001 |
| No aquaculture vs aquaculture | 0.04 | 0.45 | 0.10 | 0.925 | |
| Managed vs unmanaged | 0.17 | 0.51 | 0.33 | 0.742 | |
| Interaction effect | -0.02 | 0.62 | -0.03 | 0.979 | |
| Mangrove richness | Intercept | 1.18 | 1.22 | 0.94 | 0.335 |
| No aquaculture vs aquaculture | -0.79 | 1.23 | -0.64 | 0.522 | |
| Managed vs unmanaged | -0.23 | 0.33 | -0.68 | 0.500 | |
| Interaction effect | 0.09 | 0.41 | 0.23 | 0.822 | |
| Subsoil Al | Intercept | 6.95 | 0.37 | 19.01** | <0.001 |
| No aquaculture vs aquaculture | -0.31 | 0.57 | -0.54 | 0.589 | |
| Managed vs unmanaged | 0.49 | 0.47 | 1.04 | 0.297 | |
| Interaction effect | 0.21 | 0.60 | 0.34 | 0.731 | |
| Subsoil C | Intercept | 2.20 | 0.49 | 4.48** | <0.001 |
| No aquaculture vs aquaculture | 0.95 | 0.60 | 1.57 | 0.116 | |
| Managed vs unmanaged | 0.59 | 0.70 | 0.84 | 0.400 | |
| Interaction effect | -0.64 | 0.85 | -0.76 | 0.450 | |
| Subsoil N | Intercept | -2.26 | 0.17 | -13.53** | <0.001 |
| No aquaculture vs aquaculture | -0.85 | 0.23 | -3.64** | <0.001 | |
| Managed vs unmanaged | 0.08 | 0.23 | 0.37 | 0.715 | |
| Interaction effect | -0.04 | 0.32 | -0.12 | 0.902 | |
| Topsoil Al | Intercept | 7.30 | 0.42 | 17.48** | <0.001 |
| No aquaculture vs aquaculture | -1.17 | 0.60 | -1.93t | 0.054 | |
| Managed vs unmanaged | 0.24 | 0.57 | 0.42 | 0.672 | |
| Interaction effect | 0.84 | 0.78 | 1.08 | 0.280 | |
| Topsoil C | Intercept | 2.07 | 0.48 | 4.35** | <0.001 |
| No aquaculture vs aquaculture | 1.01 | 0.58 | 1.73t | 0.084 | |
| Managed vs unmanaged | 0.38 | 0.67 | 0.56 | 0.573 | |
| Interaction effect | -0.58 | 0.82 | -0.71 | 0.480 | |
| Topsoil N | Intercept | -2.07 | 0.17 | -11.97** | <0.001 |
| No aquaculture vs aquaculture | -0.93 | 0.24 | -3.82** | <0.001 | |
| Managed vs unmanaged | -0.47 | 0.27 | -1.75t | 0.080 | |
| Interaction effect | 0.61 | 0.36 | 1.72t | 0.086 |
| Variable | AquUnm/ NoAUnm |
AquUnm/ AquMan |
AquUnm/ NoAMan |
NoAUnm/ AquMan |
NoAUnm/ NoAMan |
AquMan/ NoAMan |
|---|---|---|---|---|---|---|
| Crab abundance | 3.60 ± 1.78 Z=2.6*, p=0.047 |
2.05 ± 1.08 Z=1.4, p=0.524 |
3.14 ± 1.53 Z=2.4t, p=0.087 |
0.57 ± 0.31 Z=-1.0, p=0.737 |
0.87 ± 0.45 Z=-0.3, p=0.994 |
1.53 ± 0.84 Z=0.8, p=0.862 |
| Crab richness | 3.35 ± 1.50 Z=2.7*, p=0.035 |
2.01 ± 0.96 Z=1.5, p=0.465 |
3.01 ± 1.33 Z=2.5t, p=0.059 |
0.60 ± 0.31 Z=-1.0, p=0.758 |
0.90 ± 0.44 Z=-0.2, p=0.996 |
1.50 ± 0.77 Z=0.8, p=0.859 |
| Crab diversity | 3.10 ± 2.56 Z=1.4, p=0.520 |
1.44 ± 1.23 Z=0.4, p=0.974 |
4.50 ± 4.05 Z=1.7, p=0.337 |
0.47 ± 0.41 Z=-0.9, p=0.823 |
1.45 ± 1.35 Z=0.4, p=0.978 |
3.13 ± 2.98 Z=1.2, p=0.630 |
| Mangrove abundance |
3.11 ± 6.27 Z=0.6, p=0.944 |
1.10 ± 0.69 Z=0.2, p=0.999 |
4.45 ± 9.23 Z=0.7, p=0.889 |
0.36 ± 0.58 Z=-0.6, p=0.920 |
1.43 ± 0.71 Z=0.7, p=0.888 |
4.03 ± 6.80 Z=0.8, p=0.842 |
| Mangrove AGB | 0.49 ± 0.23 Z=-1.5, p=0.420 |
0.64 ± 0.35 Z=-0.8, p=0.842 |
0.61 ± 0.29 Z=-1.0, p=0.722 |
1.31 ± 0.59 Z=0.6, p=0.935 |
1.25 ± 0.46 Z=0.6, p=0.931 |
0.96 ± 0.44 Z=-0.1, p=0.999 |
| Mangrove BGB | 0.96 ± 0.43 Z=-0.1, p=0.999 |
0.85 ± 0.43 Z=-0.3, p=0.988 |
0.82 ± 0.37 Z=-0.4, p=0.972 |
0.88 ± 0.39 Z=-0.3, p=0.992 |
0.85 ± 0.31 Z=-0.4, p=0.975 |
0.98 ± 0.43 Z=-0.1, p=1.000 |
| Mangrove richness | 2.20 ± 2.71 Z=0.6, p=0.919 |
1.25 ± 0.42 Z=0.7, p=0.907 |
2.51 ± 3.15 Z=0.7, p=0.884 |
0.57 ± 0.56 Z=-0.6, p=0.941 |
1.14 ± 0.28 Z=0.5, p=0.949 |
2.00 ± 2.03 Z=0.7, p=0.902 |
| Subsoil Al | 1.36 ± 0.77 Z=0.5, p=0.995 |
0.61 ± 0.29 Z=-1.0, p=0.880 |
0.68 ± 0.34 Z=-0.8, p=0.968 |
0.45 ± 0.25 Z=-1.4, p=0.634 |
0.50 ± 0.19 Z=-1.9, p=0.326 |
1.11 ± 0.54 Z=0.2, p=1.000 |
| Subsoil C | 0.71 ± 0.16 Z=-1.6, p=0.454 |
0.80 ± 0.24 Z=-0.8, p=0.741 |
0.73 ± 0.16 Z=-1.5, 0.454 |
1.13 ± 0.23 Z=0.6, p=0.742 |
1.02 ± 0.22 Z=0.1, p=0.907 |
0.90 ± 0.24 Z=-0.5, p=0.742 |
| Subsoil N | 2.33 ± 0.54 Z=3.6**, p=0.002 |
0.92 ± 0.21 Z=-0.4, p=0.983 |
2.23 ± 0.51 Z=3.47**, p=0.003 |
0.40 ± 0.09 Z=-4.1**, p<0.001 |
0.96 ± 0.22 Z=-0.2, p=0.997 |
2.42 ± 0.55 Z=3.9**, p<0.001 |
| Topsoil Al | 3.21 ± 1.94 Z=1.9, p=0.281 |
0.79 ± 0.45 Z=-0.4, p=0.999 |
1.09 ± 0.56 Z=0.2, p=1.000 |
0.25 ± 0.14 Z=-2.4t, p=0.090 |
0.34 ± 0.18 Z=-2.0, p=0.226 |
1.34 ± 0.68 Z=0.66, p=0.986 |
| Topsoil C | 0.67 ± 0.19 Z=-1.7, p=0.535 |
0.85 ± 0.20 Z=-0.6, p=0.673 |
0.72 ± 0.18 Z=-1.4, p=0.535 |
1.26 ± 0.21 Z=1.1, p=0.580 |
1.07 ± 0.14 Z=0.4, p=0.673 |
0.85 ± 0.20 Z=-0.7, p=0.673 |
| Topsoil N | 2.54 ± 0.62 Z=3.8**, p<0.001 |
1.60 ± 0.43 Z=1.7, p=0.122 |
2.20 ± 0.52 Z=3.32**, p=0.003 |
0.63 ± 0.17 Z=-1.7, p=0.122 |
0.87 ± 0.20 Z=-0.6, p=0.538 |
1.38 ± 0.36 Z=1.2, p=0.264 |
References
- Biswas, P.L.; Biswas, S.R. Mangrove Forests: Ecology, Management, and Threats. In Life on Land, Encyclopedia of the UN Sustainable Development Goals; Leal Filho, W., Azul, A.M., Brandli, L., Özuyar, P.G., Wall, T., Eds.; Springer International Publishing: Cham, Switzerland, 2019; pp. 1–14. [Google Scholar]
- Kathiresan, K.; Bingham, B.L. Biology of Mangroves and Mangrove Ecosystems. Adv. Mar. Biol. 2001, 40, 81–251. [Google Scholar]
- Krauss, K.W.; Ball, M.C. On the halophytic nature of mangroves. Trees-Struct. Funct. 2013, 27, 7–11. [Google Scholar] [CrossRef]
- Naidoo, T.; Rajkaran, A.; Sershen. Impacts of plastic debris on biota and implications for human health: A South African perspective. S. Afr. J. Sci. 2020, 116, 1–8. [Google Scholar] [CrossRef] [PubMed]
- Suratman, M.N. Carbon Sequestration Potential of Mangroves in Southeast Asia. Manag. For. Ecosyst. Chall. Clim. Chang. 2008. [Google Scholar]
- Kauffman, J.C.H.; Thomas, G.C.; Kathleen, A.D.; Daniel, C.; Donato, D. Ecosystem carbon stocks of micronesian mangrove forests. Wetlands 2011, 31, 343–352. [Google Scholar] [CrossRef]
- Ferraz, A.; Saatchi, S.S.; Xu, L.; Hagen, S.C.; Chave, J.; Yu, Y.; Meyer, V.; Garcia, M.; Silva, C.A.; Roswintiart, O.; et al. Carbon storage potential in degraded forests of Kalimantan, Indonesia. Environ. Res. Lett. 2018, 13, 095001. [Google Scholar] [CrossRef]
- Donato, D.C.; Kauffman, J.B.; Murdiyarso, D.; Kurnianto, S.; Stidham, M.; Kanninen, M. Mangroves among the most carbon-rich forests in the tropics. Nat. Geosci. 2011, 4, 293–297. [Google Scholar] [CrossRef]
- Chatting, M.; Al-Maslamani, I.; Walton, M.; Skov, M.W.; Kennedy, H.; Husrevoglu, Y.S.; Vay, L.L. Future mangrove carbon storage under climate change and deforestation. Front. Mar. Sci. 2022, 9, 781876. [Google Scholar] [CrossRef]
- Sánchez-Núñez, D.A.; Bernal, G.; Pineda, J.E.M. The relative role of mangroves on wave erosion mitigation and sediment properties. Estuaries Coasts 2019, 42, 2124–2138. [Google Scholar] [CrossRef]
- Kamil, E.A.; Takaijudin, H.; Hashim, A.M. Mangroves As Coastal Bio-Shield: A Review of Mangroves Performance in Wave Attenuation. Civ. Eng. J. 2021, 7, 1964–1981. [Google Scholar] [CrossRef]
- Lee, W.K.; Tay, S.H.X.; Ooi, S.K.; Friess, D.A. Potential short wave attenuation function of disturbed mangroves. Estuar. Coast. Shelf Sci. 2021, 248, 106747. [Google Scholar] [CrossRef]
- Giesen, W.; Wulffraat, S.; Zieren, M.; Scholten, L. Mangrove Guidebook for Southeast Asia; UN Food and Agricultural Organization: Phnom Penh, Combodi, 2007. [Google Scholar]
- Faridah-Hanum, I.; Kudus, K.A.; Saari, N.S. Plant Diversity and Biomass of Marudu Bay Mangroves in Malaysia. Pakistan J. Bot. 2012, 44, 151–156. [Google Scholar]
- Twilley, R.R.; Snedaker, S.C.; Yaez-Arancibia, A.; Medina, E. Biodiversity and ecosystem processes in tropical estuaries: perspectives of mangrove ecosystems. Scope-scientific committee on problems of the Environment International Council of Scientific Unions 1996, 55, 327–370. [Google Scholar]
- Mumby, P.J.; Edwards, A.J.; Rias-Gonzalez, J.E.; Lindeman, K.C.; Blackwell, P.G.; Gall, A.; Gorczynska, M.I.; Harborne, A.R.; Pescod, C.L.; Renken, H.; et al. Mangroves enhance the biomass of coral reef fish communities in the Caribbean. Nature 2004, 427, 533–536. [Google Scholar] [CrossRef]
- Satyanarayana, B.; Quispe-Zuniga, M.R.; Hugé, J.; Sulong, I.; Mohd-Lokman, H.; Dahdouh-Guebas, F. Mangroves Fueling Livelihoods: A Socio-Economic Stakeholder Analysis of the Charcoal and Pole Production Systems in the World’s Longest Managed Mangrove Forest. Front. Ecol. Evol. 2021, 9, 621721. [Google Scholar] [CrossRef]
- Aziz, A.A.; Dargusch, P.; Phinn, S.; Ward, A. Using REDD+ to balance timber production with conservation objectives in a mangrove forest in Malaysia. Ecol. Econ. 2015, 120, 108–116. [Google Scholar] [CrossRef]
- Hutchison, J.; Spalding, M.; zu Ermgassen, P. The Role of Mangroves in Fisheries Enhancement; The Nature Conservancy: Arlington County, VA, USA; Wetlands International: Wageningen, The Netherlands, 2014; pp. 1–54. [Google Scholar]
- Alongi, D.M.D.M. Present State and Future of the World’s Mangrove Forests. Environ. Conserv. 2002, 29, 331–349. [Google Scholar] [CrossRef]
- Alongi, D.M. Climate Change and Mangroves. In Mangroves: Biodiversity, Livelihoods and Conservation; Springer Nature: Singapore, 2022; pp. 175–198. [Google Scholar]
- Polidoro, B.A.; Carpenter, K.E.; Collins, L.; Duke, N.C.; Ellison, A.M.; Ellison, J.C.; Farnsworth, E.J.; Fernando, E.S.; Kathiresan, K.; Koedam, N.E.; et al. The Loss of Species: Mangrove Extinction Risk and Geographic Areas of Global Concern. PLoS ONE 2010, 5, e10095. [Google Scholar] [CrossRef]
- Luther, D.A.; Greenberg, R. Mangroves: A Global Perspective on the Evolution and Conservation of Their Terrestrial Vertebrates. BioScience 2009, 59, 602–612. [Google Scholar] [CrossRef]
- Adame, M.F.; Connolly, R.M.; Turschwell, M.P.; Lovelock, C.E.; Fatoyinbo, T.; Lagomasino, D.; Goldberg, L.A.; Holdorf, J.; Friess, D.A.; Sasmito, S.D.; et al. Future carbon emissions from global mangrove forest loss. Glob. Chang. Biol. 2021, 27, 2856–2866. [Google Scholar] [CrossRef]
- Arifanti, V.B.; Sidik, F.; Mulyanto, B.; Susilowati, A.; Wahyuni, T.; Subarno; Yulianti; Yuniarti, N.; Aminah, A.; Suita, E.; et al. Challenges and Strategies for Sustainable Mangrove Management in Indonesia: A Review. Forests 2022, 13, 695. [Google Scholar] [CrossRef]
- Luom, T.T.; Phong, N.T.; Smithers, S.; Van Tai, T. Protected mangrove forests and aquaculture development for livelihoods. Ocean Coast. Manag. 2021, 205, 105553. [Google Scholar] [CrossRef]
- Miteva, D.A.; Murray, B.C.; Pattanayak, S.K. Do protected areas reduce blue carbon emissions? A quasi-experimental evaluation of mangroves in Indonesia. Ecol. Econ. 2015, 119, 127–135. [Google Scholar] [CrossRef]
- Tengku Hashim, T.M.Z.; Engku Ariff, E.A.R.; Suratman, M.N. Aquaculture in mangroves. Mangroves: Ecology, Biodiversity and Management, 2021, pp. 419–438.
- Richards, D.R.; Friess, D.A. Rates and drivers of mangrove deforestation in Southeast Asia, 2000–2012. Proc. Natl. Acad. Sci. USA 2016, 113, 344–349. [Google Scholar] [CrossRef]
- Valiela, I.; Bowen, J.L.; York, J.K. Mangrove Forests: One of the World’s Threatened Major Tropical Environments. Bioscience 2001, 51, 807–815. [Google Scholar] [CrossRef]
- McSherry, M.; Davis, R.P.; Andradi-Brown, D.A.; Ahmadia, G.N.; Van Kempen, M.; Brian, S.W. Integrated mangrove aquaculture: The sustainable choice for mangroves and aquaculture? Front. For. Glob. Chang. 2023, 6, 1094306. [Google Scholar] [CrossRef]
- Balmford, A.; Bruner, A.; Cooper, P.; Costanza, R.; Farber, S.; Green, R.E.; Jenkins, M.; Jefferiss, P.; Jessamy, V.; Madden, J.; et al. Economic Reasons for Conserving Wild Nature. Science 2002, 297, 950–953. [Google Scholar] [CrossRef] [PubMed]
- Aheto, D.W.; Kankam, S.; Okyere, I.; Mensah, E.; Osman, A.; Jonah, F.E.; Mensah, J.C. Community-Based Mangrove Forest Management: Implications for Local Livelihoods and Coastal Resource Conservation along the Volta Estuary Catchment Area of Ghana. Ocean Coast. Manag. 2016, 127, 43–54. [Google Scholar] [CrossRef]
- Mesta, P.; Setturu, B.; Chandran, M.D.S.; Ramachandra, T.V. Inventorying, Mapping and Monitoring of Mangroves towards Sustainable Management of West Coast, India. Geophys. Remote Sens. 2014, 3, 3–9. [Google Scholar]
- Field, C.D. Rehabilitation of mangrove ecosystems, a review. Mar. Pollut. Bull. 1998, 37, 383–392. [Google Scholar] [CrossRef]
- Ibrahim, F.H.; Yusoff, F.M.; Fitrianto, A.; Nuruddin, A.A.; Gandaseca, S.; Samdin, Z.; Kamarudin, N.; Nurhidayu, S.; Kassim, M.R.; Hakeem, K.R.; Ibrahim, S. How to develop a comprehensive Mangrove Quality Index? MethodsX 2019, 6, 1591–1599. [Google Scholar] [CrossRef]
- Faridah-Hanum, I.; Yusoff, F.M.; Fitrianto, A.; Ainuddin, N.A.; Gandaseca, S.; Zaiton, S.; Norizah, K.; Nurhidayu, S.; Roslan, M.K.; Hakeem, K.R.; et al. Development of a comprehensive mangrove quality index (MQI) in Matang Mangrove; Assessing mangrove ecosystem health. Ecol. Indic. 2019, 102, 103–117. [Google Scholar] [CrossRef]
- Biswas, S.R.; Mallik, A.U.; Choudhury, J.K.; Nishat, A. A unified framework for the restored of Southeast Asian mangroves—Bridging ecology, society and economics. Wetl. Ecol. Manag. 2009, 17, 365–383. [Google Scholar] [CrossRef]
- Cardinale, B.J.; Duffy, J.E.; Gonzalez, A.; Hooper, D.U.; Perrings, C.; Venail, P.; Narwani, A.; Mace, G.M.; Tilman, D.; Wardle, D.A.; et al. Biodiversity loss and its impact on humanity. Nat. Cell Biol. 2012, 486, 59–67. [Google Scholar] [CrossRef] [PubMed]
- Zaman, M.R.; Rahman, M.S.; Ahmed, S.; Zuidema, P.A. What drives carbon stocks in a mangrove forest? The role of stand structure, species diversity and functional traits. Estuar. Coast. Shelf Sci 2023, 295, 108556. [Google Scholar] [CrossRef]
- Duncanson, L.; Armston, J.; Disney, M.; Avitabile, V.; Barbier, N.; Calders, K.; Carter, S.; Chave, J.; Herold, M.; Crowther, T.W.; et al. The importance of consistent global forest aboveground biomass product validation. Surv. Geophys. 2019, 40, 979–999. [Google Scholar] [CrossRef] [PubMed]
- Mcleod, E.; Chmura, G.L.; Bouillon, S.; Salm, R.; Björk, M.; Duarte, C.M.; Lovelock, C.E.; Schlesinger, W.H.; Silliman, B.R. A Blueprint for Blue Carbon: Toward an Improved Understanding of the Role of Vegetated Coastal Habitats in Sequestering CO2. Front. Ecol. Environ. 2011, 9, 552–560. [Google Scholar] [CrossRef] [PubMed]
- Inoue, T. Carbon sequestration in mangroves. Blue Carbon in Shallow Coastal Ecosystems. Carbon Dynamics, Policy, and Implementation, 2019, pp.73-99.
- Valiela, I.; Cole, M.L. Comparative evidence that saltmarshes and mangroves may protect sea grass meadow from land-derived nitrogen loads. Ecosystems 2002, 5, 92–102. [Google Scholar] [CrossRef]
- Ma, L.; Yang, S. Growth and physiological response of Kandelia obovata and Bruguiera sexangula seedlings to aluminum stress. Environ. Sci. Pollut. Res. 2022, 29, 43251–43266. [Google Scholar] [CrossRef]
- Ferreira, A.C.; Ganade, G.; de Attayde, J.L. Restoration versus natural regeneration in a neotropical mangrove: Effects on plant biomass and crab communities. Ocean Coast. Manag. 2015, 110, 38–45. [Google Scholar] [CrossRef]
- Aschenbroich, A.; Michaud, E.; Stieglitz, T.; Fromard, F.; Gardel, A.; Tavares, M.; Thouzeau, G. Brachyuran crab community structure and associated sediment reworking activities in pioneer and young mangroves of French Guiana, South America. Estuar. Coast. Shelf Sci. 2016, 182, 60–71. [Google Scholar] [CrossRef]
- Kristensen, E.; Penha-Lopes, G.; Delefosse, M.; Valdemarsen, T.; Quintana, C.O.; Banta, G.T. What is bioturbation? The need for a precise definition for fauna in aquatic sciences. Mar. Ecol. Prog. Ser. 2012, 446, 285–302. [Google Scholar] [CrossRef]
- Agusto, L.E.; Sara, F.; Jimenez, P.J.; Quadros, A.; Cannicci, S. Structural characteristics of crab burrows in Hong Kong mangrove forests and their role in ecosystem engineering. Estuar. Coast. Shelf Sci. 2020, 248, 106973. [Google Scholar] [CrossRef]
- Tobias, A.; Umali, A.G.A.; Malabrigo, P.; Galang, M.A. Mangrove Forest Inventory and Estimation of Carbon Storage and Sedimentation in Pagbilao. Wealth Account. Valuat. Ecosyst. Serv. 2017, 1–95. [Google Scholar]
- Dharmawan, I.W.S.; Siregar, C.A. Karbon tanah dan pendugaan karbon tegakan. Jurnal Penelitian Hutan Dan Konservasi Alam 2008, 5, 317–328. [Google Scholar] [CrossRef]
- Vinh, T.V.; Marchand, C.; Linh, T.V.K.; Vinh, D.D.; Allenbach, M. Allometric models to estimate above-ground biomass and carbon stocks in Rhizophora apiculata tropical managed mangrove forests (Southern Viet Nam). For. Ecol. Manag. 2019, 434, 131–141. [Google Scholar] [CrossRef]
- Fromard, F.; Puig, H.; Mougin, E.; Marty, G.; Betoulle, J.L.; Cadamuro, L. Structure, above-ground biomass and dynamics of mangrove ecosystems: New data from French Guiana. Oecologia 1998, 115, 39–53. [Google Scholar] [CrossRef] [PubMed]
- Clough, B.F.; Scott, K. Allometric relationships for estimating above-ground biomass in six mangrove species. For. Ecol. Manag. 1989, 27, 117–127. [Google Scholar] [CrossRef]
- Hanh, N.T.H.; Tinh, P.H.; Tuan, M.S. Allometry and biomass accounting for mangroves Kandelia obovata Sheue, Liu & Yong and Sonneratia caseolaris (L.) Engler planted in coastal zone of Red River Delta, Vietnam. Int. J. Dev. Res 2016, 6, 7804–7808. [Google Scholar]
- Komiyama, A.; Poungparn, S.; Kato, S. Common allometric equations for estimating the tree weight of mangroves. J. Trop. Ecol. 2005, 21, 471–477. [Google Scholar] [CrossRef]
- Komiyama, A.; Ong, J.E.; Poungparn, S. Allometry, biomass, and productivity of mangrove forests: A review. Aquat. Bot. 2008, 89, 128–137. [Google Scholar] [CrossRef]
- Gevana, D.; Im, S. Allometric models for Rhizophora stylosa Griff. in dense monoculture plantation in the Philippines. Malaysian For. 2016, 79, 39–53. [Google Scholar]
- Sparks, D.L.; Page, A.L.; Helmke, P.A.; Loeppert, R.H.; Soltanpour, P.N.; Tabatabai, M.A.; Johnston, C.T.; Sumner, M.E. Methods of Soil Analysis, Part 3–Chemical Methods; Soil Science Society of America Inc.: Madison, WI, USA, 1996. [Google Scholar]
- Reis-Filho, J.A.; Harvey, E.S.; Giarrizzo, T. Impacts of small-scale fisheries on mangrove fish assemblages. ICES J. Mar. Sci. 2018, 76, 153–164. [Google Scholar] [CrossRef]
- Tahiluddin, A.; Sarri̇, J. An Overview of Destructive Fishing in the Philippines. Acta Nat. Sci 2022, 3, 116–125. [Google Scholar] [CrossRef]
- Brooks, M.E.; Kristensen, K.; Van Benthem, K.J.; Magnusson, A.; Berg, C.W.; Nielsen, A.; Skaug, H.J.; Machler, M.; Bolker, B.M. glmmTMB balances speed and flexibility among packages for zero-inflated generalized linear mixed modelling. R J 2017, 9, 378–400. [Google Scholar] [CrossRef]
- Hartig, F. DHARMa: residual diagnostics for hierarchical (multi-level/mixed) regression models. R Packag version 020, 2018.
- Wei, T.; Simko, V.; Levy, M.; Xie, Y.; Jin, Y.; Zemla, J. Package ‘corrplot’. Statistician 2017, 56, e24. [Google Scholar]
- Zhila, H.; Mahmood, H.; Rozainah, M.Z. Biodiversity and biomass of a natural and degraded mangrove forest of Peninsular Malaysia. Environ. Earth Sci 2015, 71, 4629–4635. [Google Scholar] [CrossRef]
- Hilmi, N.; Chami, R.; Sutherland, M.D.; Hall-Spencer, J.M.; Lebleu, L.; Benitez, M.B.; Levin, L.A. The role of blue carbon in climate change mitigation and carbon stock conservation. Front. Clim. 2021, 3, 710546. [Google Scholar] [CrossRef]
- Herrera-Silveira, J.A.; Pech-Cardenas, M.A.; Morales-Ojeda, S.M.; Cinco-Castro, S.; Camacho-Rico, A.; Sosa, J.P.C.; Mendoza-Martinez, J.E.; Pech-Poot, E.Y.; Montero, J.; Teutli-Hernandez, C. Blue carbon of Mexico, carbon stocks and fluxes: a systematic review. PeerJ 2020, 8, e8790. [Google Scholar] [CrossRef]
- NFCCC C. (2015). Adoption of the Paris Agreement. I:proposal by the president (Draft Decision). https://unfccc.int/resource/docs/2015/cop21/eng/l09r01.pdf.
- Taillardat, P.; Friess, D.A.; Lupascu, M. Mangrove blue carbon strategies for climate change mitigation are most effective at the national scale. Biol. Lett. 2018, 14, 20180251. [Google Scholar] [CrossRef]
- Reis, C.R.G.; Nardoto, G.B.; Oliveira, R.S. Global overview on nitrogen dynamics in mangroves and consequences of increasing nitrogen availability for these systems. Plant Soil 2017, 410, 1–19. [Google Scholar] [CrossRef]
- Karstens, S.; Lukas, M.C. Contested aquaculture development in the protected mangrove forests of the Kapuas estuary, West Kalimantan. Geoöko 2014, 35, 78–121. [Google Scholar]
- Reef, R.; Feller, I.C.; Lovelock, C.E. Nutrition of mangroves. Tree Physiol 2010, 30, 1148–1160. [Google Scholar] [CrossRef]
- Oxmann, J.F.; Pham, Q.H.; Schwendenmann, L.; Stellman, J.M.; Lara, R.J. Mangrove reforestation in Vietnam: the effect of sediment physicochemical properties on nutrient cycling. Plant Soil 2010, 326, 225–241. [Google Scholar] [CrossRef]
- Tam, N.F.Y.; Yao, M. Normalisation and heavy metal contamination in mangrove sediments. SciTotal Environ 2019, 216, 33–39. [Google Scholar] [CrossRef]
- Parman, R.P.; Kamarudin, N.; Ibrahim, F.H.; Nuruddin, A.A.; Omar, H.; Abdul Wahab, Z. Geostatistical Analysis of Mangrove Ecosystem Health: Mapping and Modelling of Sampling Uncertainty Using Kriging. Forests 2022, 13, 1185. [Google Scholar] [CrossRef]
- Clarke, P.J.; Kerrigan, R.A. The effects of seed predators on the recruitment of mangroves. J Ecol 2002, 90, 728–736. [Google Scholar] [CrossRef]
- Imbert, D.; Rousteau, A.; Scherrer, P. Ecology of mangrove growth and recovery in the Lesser Antilles: State of knowledge and basis for restoration projects. Restor Ecol 2000, 8, 230–236. [Google Scholar] [CrossRef]
- Marine Conservation Institute. (2023) Global Marine Fishing Protection, Available at: Global Marine Protection | Marine Protection Atlas (mpatlas.org) (Accessed on 24 May 2024).
- Grorud-Colvert, K.; Sullivan-Stack, J.; Roberts, C.; Constant, V.; Horta e Costa, B.; Pike, E.P.; Kingston, N.; Laffoley, D.; Sala, E.; Claudet, J.; et al. The MPA Guide: A framework to achieve global goals for the ocean. Science 2021, 373, 1215. [Google Scholar] [CrossRef]
- Russ, G.R.; Alcala, A.C.; Maypa, A.P.; Calumpong, H.P.; White, A.T. Marine reserve benefits local fisheries. Ecol. Appl. 2004, 14, 597–606. [Google Scholar] [CrossRef]
- Gokkon, B. (2019). ‘Bali Mangrove Bay is Now a Conservation Zone, Nixing Reclamation Plan. Retrieved August 06, 2020’. Available at: https://news.mongabay.com/2019/10/bali-benoa-bay-mangrovesconservation-reclamation/ (Accessed: 6 May 2024).
- Gell, F.R.; Roberts, C.M. Benefits beyond boundaries: The fishery effects of marine reserves. Trends Ecol Evol 2003, 18, 448–455. [Google Scholar] [CrossRef]
| Site | Designation | Use |
|---|---|---|
| Site 1 | Unmanaged | Current aquaculture site which has been unmanaged for more than 10 years, with local communities extracting resources (shrimps and fishes) |
| Site 2 | Managed | Current aquaculture site which has been managed and restored over the last 20 years, and still used as an aquaculture farm for mangrove mud crabs, shrimp, and oysters. |
| Site 3 | Managed | Under restoration since 2021 from the NGO SORCE. This site has been subjected to deforestation of the mangrohasto create a road through the landward area of the mangrove forest. |
| Site 4 | Unmanaged | Site selected for future restoration by SORCE but was unmanaged at the time of the surveys. This site has seen more natural recruitment in these areas than that of Site 3, with many young Ceriops species in the areas that could be classed as mudflats |
| Site 5 | Managed | A tourist attraction with wooden walkways built within the mangrove forest, however this has been closed off to the public for several years and needs permission to be entered. There is evidence that restoration was conducted recently and is on-going. |
| Site 6 | Unmanaged | Used by local fisherman to moor boats and fish along the mudflats. This site is unmanaged and has been historically deforested for economic development |
| Variablea | Site 1 | Site 2 | Site 3 | Site 4 | Site 5 | Site 6 | Total |
|---|---|---|---|---|---|---|---|
| Richness | 14 | 8 | 8 | 3 | 5 | 6 | 18 |
| N individuals | 123 | 65 | 26 | 46 | 63 | 22 | 345 |
| Diversity | 1.66 | 1.80 | 1.45 | 0.79 | 1.18 | 1.52 | 1.96 |
Disclaimer/Publisher’s Note: The statements, opinions and data contained in all publications are solely those of the individual author(s) and contributor(s) and not of MDPI and/or the editor(s). MDPI and/or the editor(s) disclaim responsibility for any injury to people or property resulting from any ideas, methods, instructions or products referred to in the content. |
© 2024 by the authors. Licensee MDPI, Basel, Switzerland. This article is an open access article distributed under the terms and conditions of the Creative Commons Attribution (CC BY) license (http://creativecommons.org/licenses/by/4.0/).


