VP-AA-TEGDM terpolymers were synthesized in ethanol from monomer mixtures with molar compositions of 98 : 2 : 2 (
CPL1), 95 : 5 : 2 (
CPL2), and 98 : 2 : 5 (
CPL3). Linear PVP was obtained as well. The microstructure of the studied terpolymers can be assessed by literature and our own data on the reactivity of comonomers. Ordinary constants of binary copolymerization are relative activities of monomers in terpolymerization. In this regard, based on the literature data on the binary copolymerization of VP, MMA as a linear analogue of TEGDM and AA, conclusions can be drawn about the distribution of VP, AA and TEGDM units in VP-AA-TEGDM terpolymers. We have shown [
20] that TEGDM is more active in radical copolymerization than VP. This fact is consistent with data on the relative activities of MMA and VP [
35,
36]. In turn, according to [
37], the binary copolymerization constants
r1 of MMA (
M1) and
r2 AA (
M2) are 1.25 and 0.225, respectively, i.e., methacrylate is more active than AA. Since
r1 ×
r2 < 1, the distribution of these units in the MMA-AA copolymer is statistical. Other methacrylates also show higher activity. For example, the relative activities of AA and methoxypolyethylene glycol methacrylate in water were 0.02—0.07 and 1.14—1.20, respectively [
38]. Thus, provided that TEGDM and MMA are equally active, the bifunctional monomer is also more reactive than AA. In turn, VP (
M1) is more reactive than AA (
M2) in binary copolymerization, and taking into account the copolymerization constants
r1 = 2.46 and
r2 = 0.179, a statistical VP-AA copolymer is formed [
39]. Based on this data, it can be assumed that the polymer chain at the initial stages consists of statistically distributed units of VP, TEGDM and AA. At deep stages, PVP chains formed from the monomer, which is in excess, are attached to the “pendant” C=C bonds of TEGDM units, i.e. VP or chains consisting of VP and AA units. The result is a 3D structure with branches in the polymer chains; both VP and AA units may be present at the ends of polymer chains.
2.1. VP-AA-TEGDM Copolymers Structure of and Their Physicochemical Characteristics
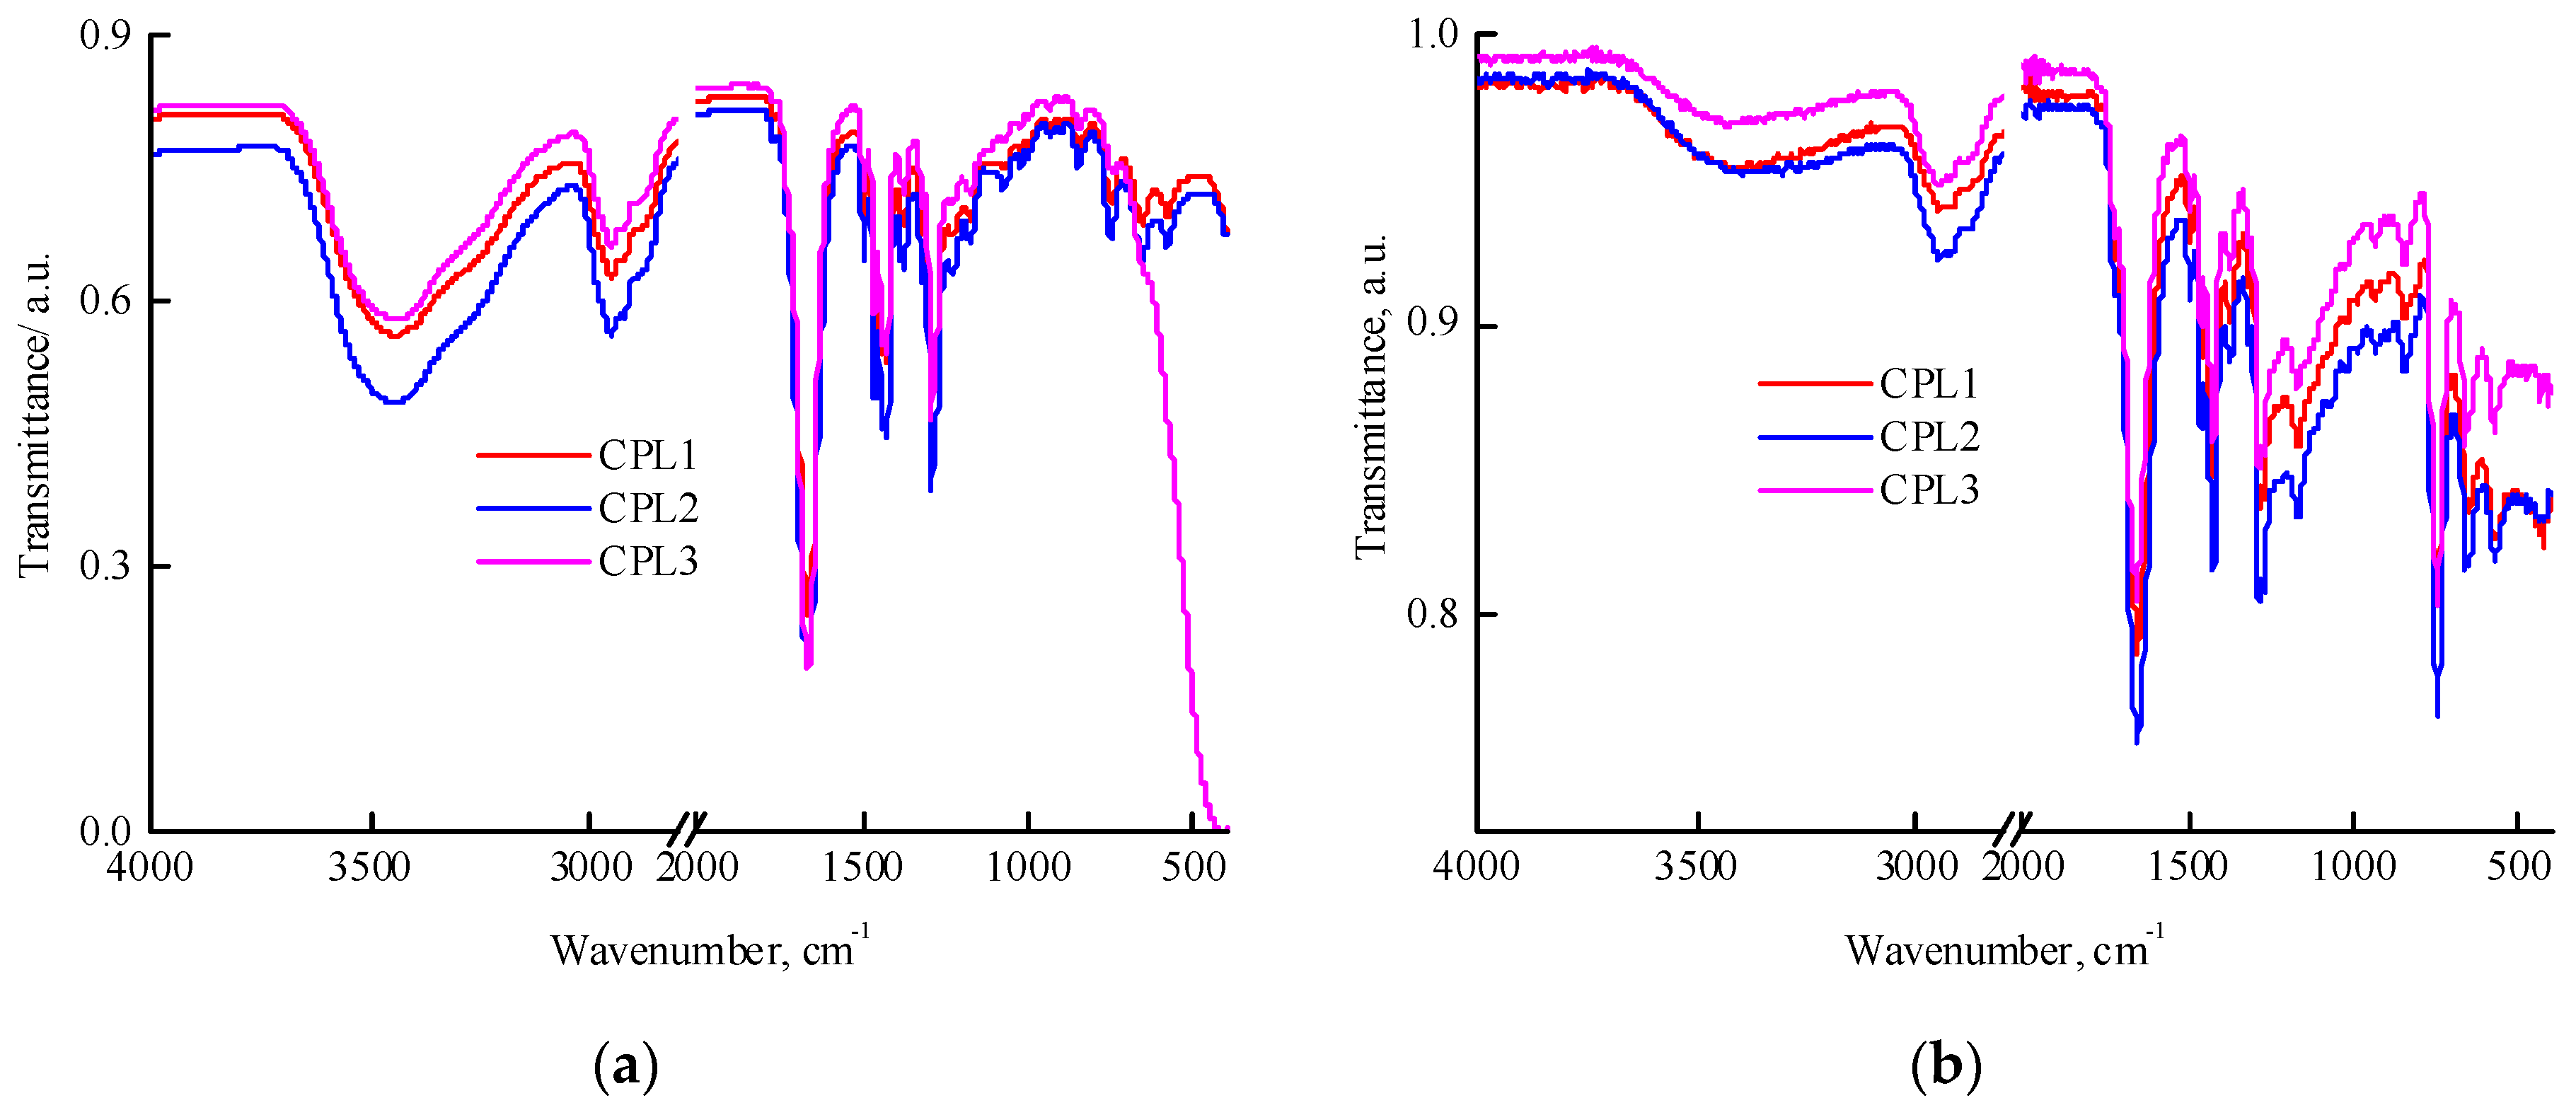
All terpolymers are soluble in polar media such as DMSO, N-methylpyrrolidone, ethanol and water but poorly soluble in low-polar media such as THF and chloroform. The IR spectra of films of a VP-AA-TEGDM terpolymer fractions partially dissolved in chloroform (
Figure 1a) and powders insoluble in this solvent (
Figure 1b) were recorded. In films cast from chloroform, an intense absorption band was observed, attributed to the C=O stretching vibrations of VP groups with a wavenumber of ~1660 cm
-1. In the spectrum of the CPL3, the C=O group of TEGDM units is presented as a shoulder at 1719 cm
-1 and is poorly resolved. It is not possible to identify AA units in this region of the spectrum due to overlapping with the TEGDM and VP absorption band corresponding to C=O vibrations; the characteristic stretching vibrations of OH groups within the region of 3000—3600 cm
-1 are overlapped by the absorption of adsorbed water hydrogen bonded to the copolymers [
40]. However, absorption in 3200—3000 cm
-1 region indicates the presence of COOH groups in studied terpolymers.
Figure 1b shows the IR spectra of the fractions insoluble in chloroform that are distinguished with higher content of (di)methacrylates, as evidenced by increasing in the absorption region of the stretching vibrations of methacrylic C=O groups and contain significantly less water, i.e. differ in composition and degree of hydrophilicity from the fraction soluble in chloroform.
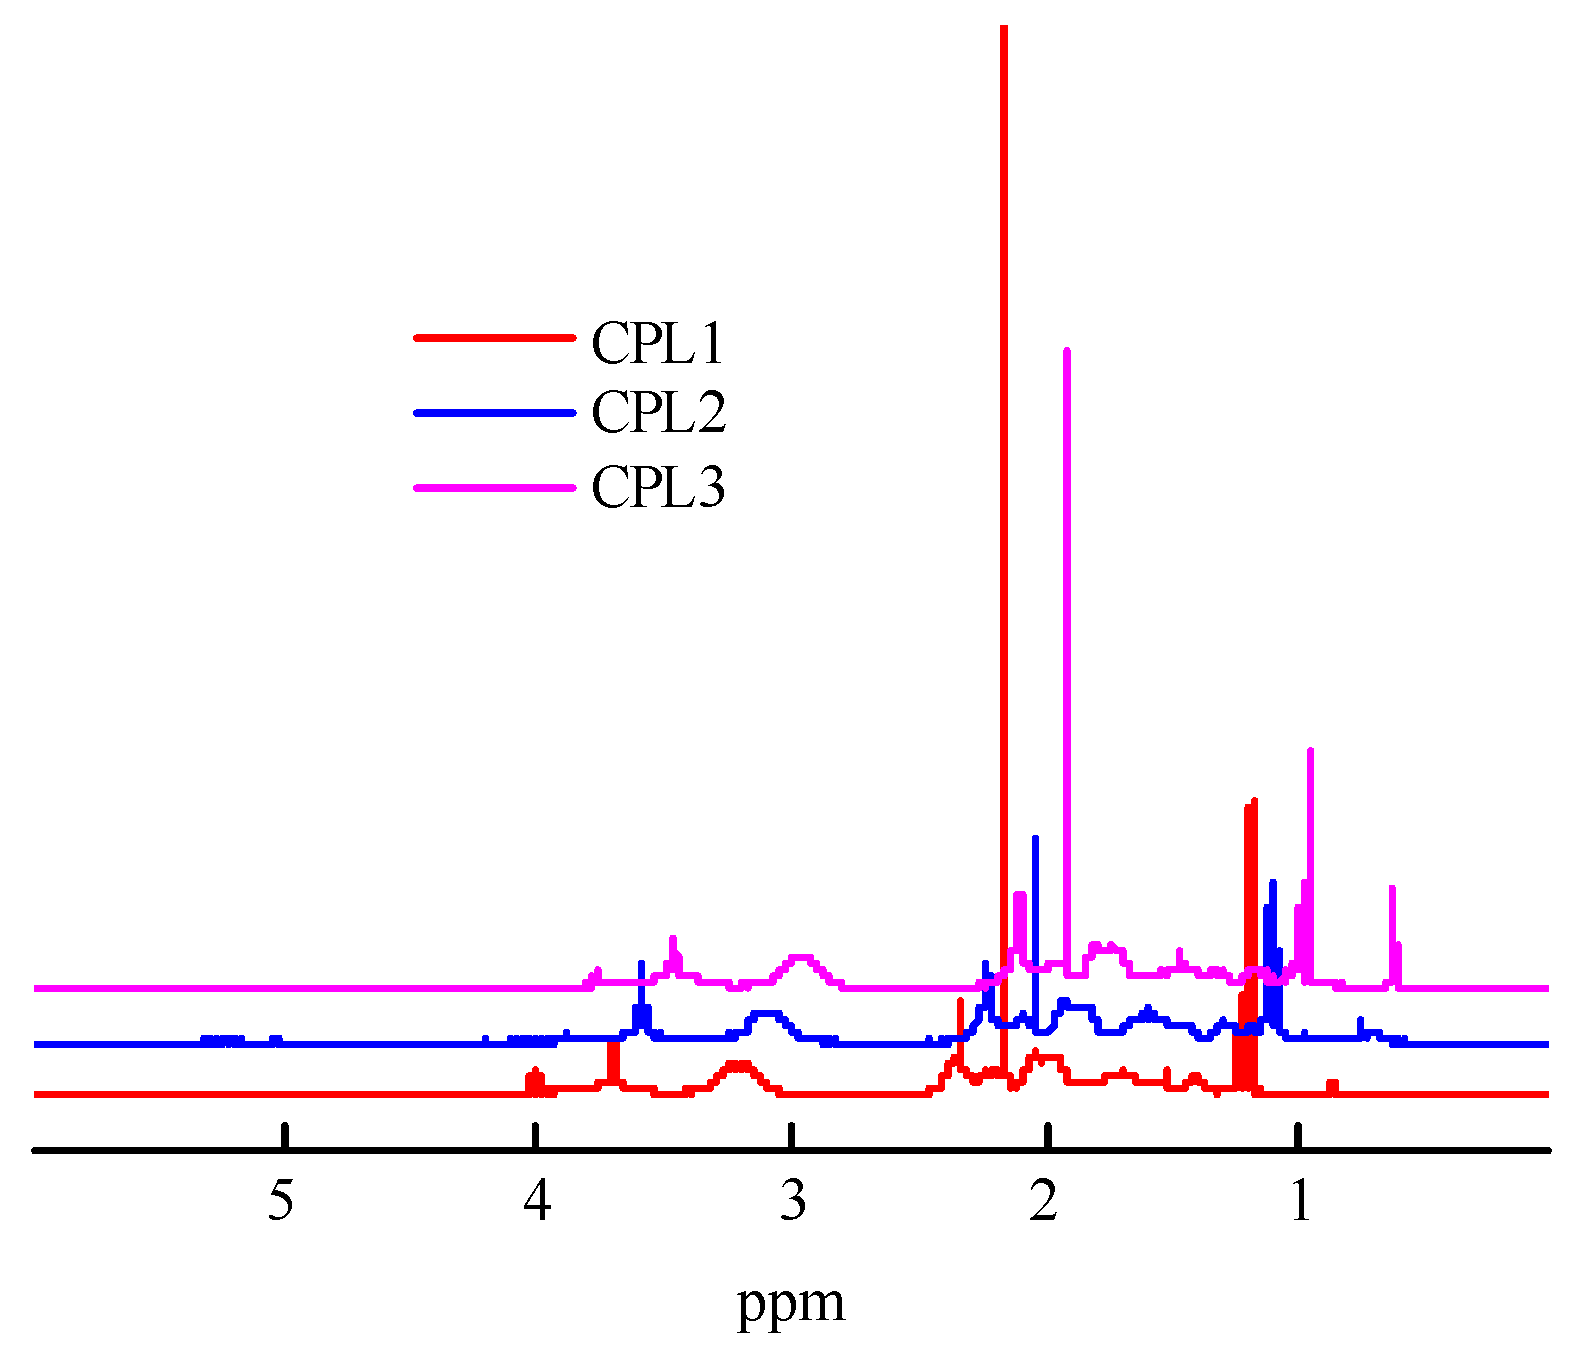
Figure 2 shows the
1H NMR spectra of the CPL1-CPL3. The main signals were described as the VP units [
41], constituting a major portion of terpolymers. The
1Н NMR spectra show two groups of signals corresponding to VP units. The first group includes signals at δ3.0–4.0 ppm due to NCHα protons of polymer chains and СН
2С=О moieties of pyrrolidone. The second group is composed of signals at δ1.4−2.4 ppm related to protons of CН
2 moieties in polymer chains and С–СН
2–С and NСН
2 moieties of pyrrolidone. The signals attributed to C=CH
2 units were not observed, showing a high conversion for these groups. The proton present in the carboxylic group of AA unites resonates at δ11.2 ppm [
39]. But they do not appear in the
1H NMR spectra of all terpolymers due to the low concentration of AA units. The signal at ~δ2.4 was attributed to the protons of water molecules.
Using elemental analysis, the N content in the resulting VP-terpolymers was determined (
Table 1). The terpolymers contain nitrogen, a characteristic of VP units. Based on N content data, the monomer compositions of terpolymers were calculated.
Figure S1 shows chromatograms of CPL1-CPL3 obtained from two detectors – a refractometer and light scattering data. It can be seen that CPL3 contains a high molecular weight fraction, in contrast to the other terpolymers, which indicates the presence of a highly branched fraction in this terpolymer. Molecular mass characteristics – absolute weight-average molecular masses M
w and polydispersity PD are given in
Table 1. From this data it follows that an increase in the AA content in the monomer mixture leads to a ~2-fold decrease in the molecular weight of the CPL2. An increase in the TEGDM content in the monomer mixture under CPL3 preparation leads to a sharp increase in the M
w and PD values of the resulting terpolymer apparently due to its high degree of branching. The highly branched copolymers synthesized by radical copolymerization have a wide molecular mass distribution due to their statistical nature [
42]. To control the molecular mass distribution of VP-TEGDM copolymers, we used 1-decanethiol as regulator of polymer chain length [
20]. However, its residues are included in polymer chains and pollute the copolymer by sulfur-containing compound. As a consequence, copolymers’ production is complicated and their cost rises; moreover, their special purification is necessary.
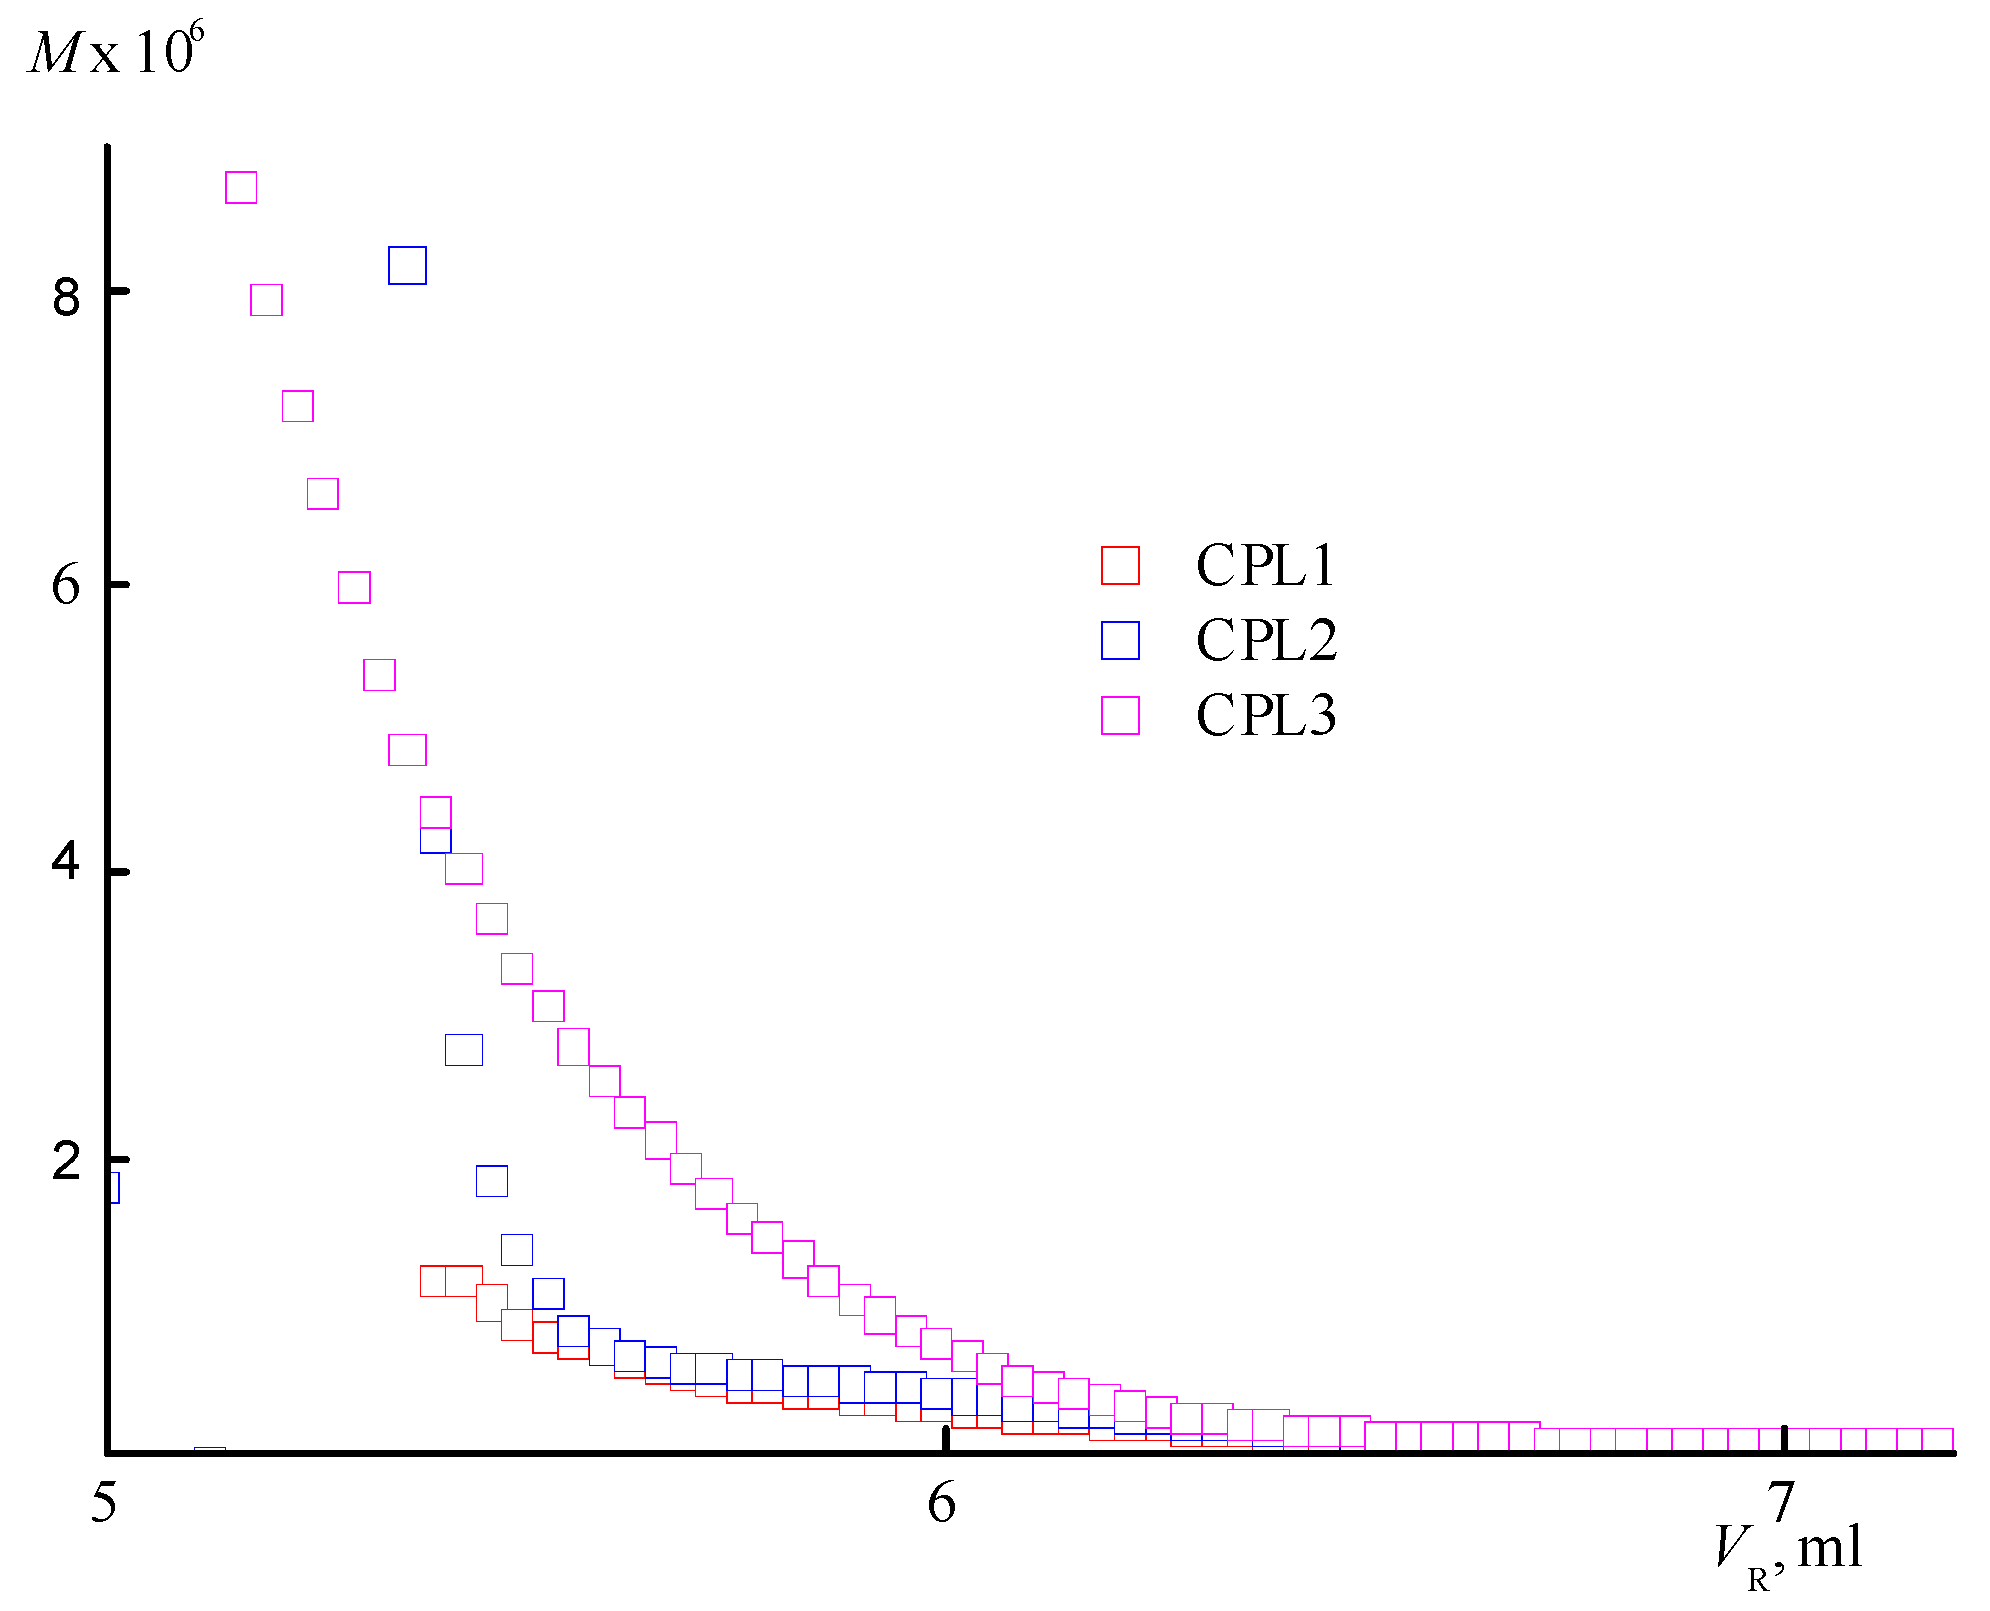
An increase in the degree of branching with increasing TEGDM content of the CPL3 is evidenced by an analysis of the dependencies of the molecular weight (M) on the eluent volume V
R (
Figure 3). It is located above similar dependence for the copolymers CPL1 and CPL2. At the same V
R value, CPL3 macromolecules with a higher molecular weight and degree of branching are eluted. Based on the SEC data, it can be assumed that the CPL1 and CPL2 are weakly branched or have the structure of nanogels like cross-linked cyclic structures. AA units promote aggregation of polymer chains due to a strong intermolecular interactions, which favours intra- and intermolecular cross-linking reactions.
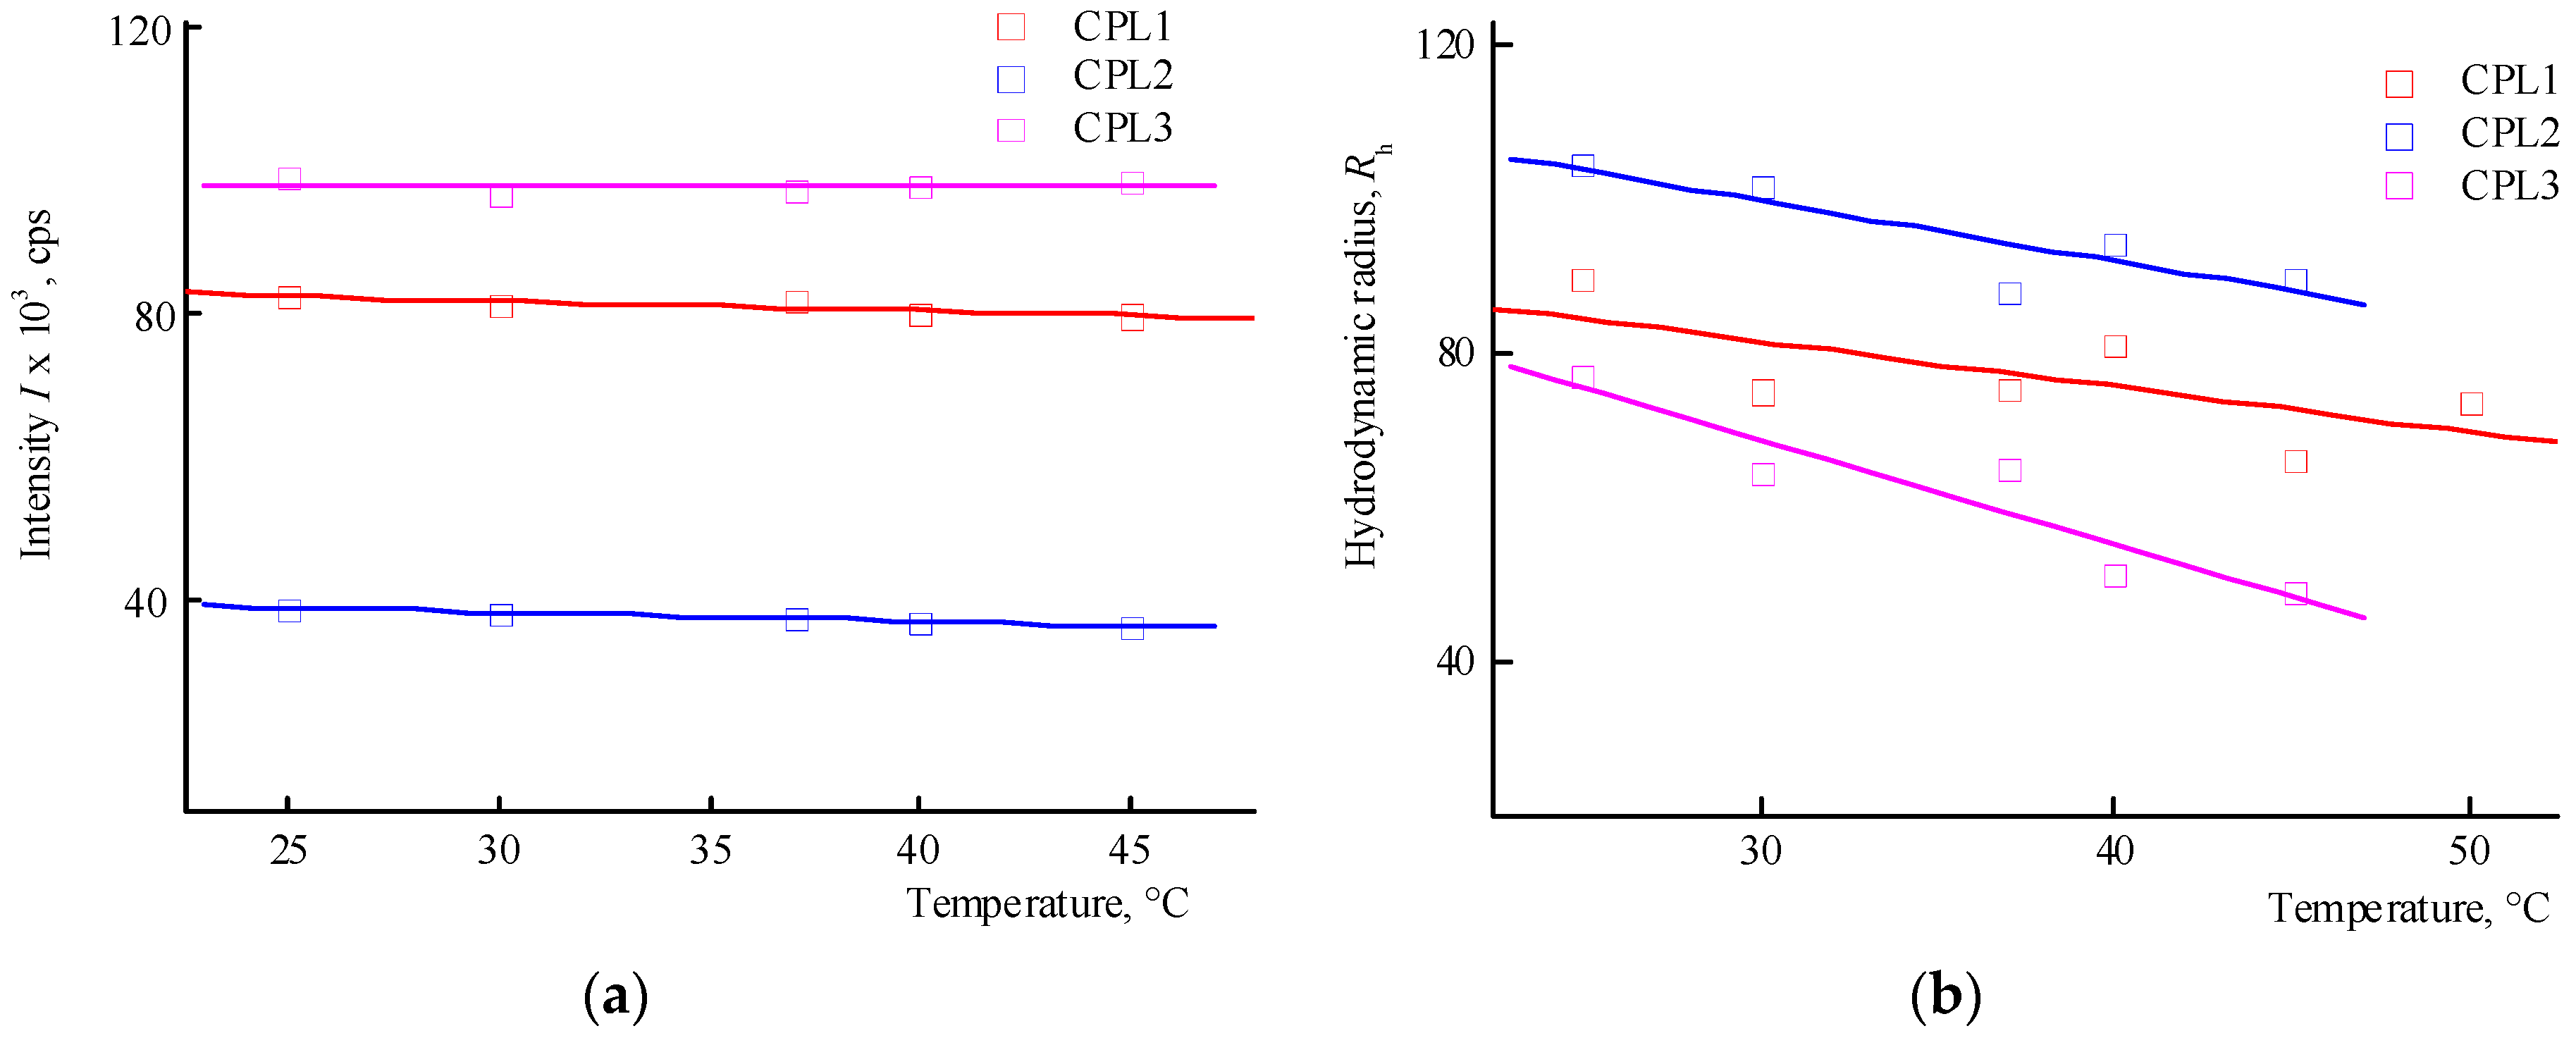
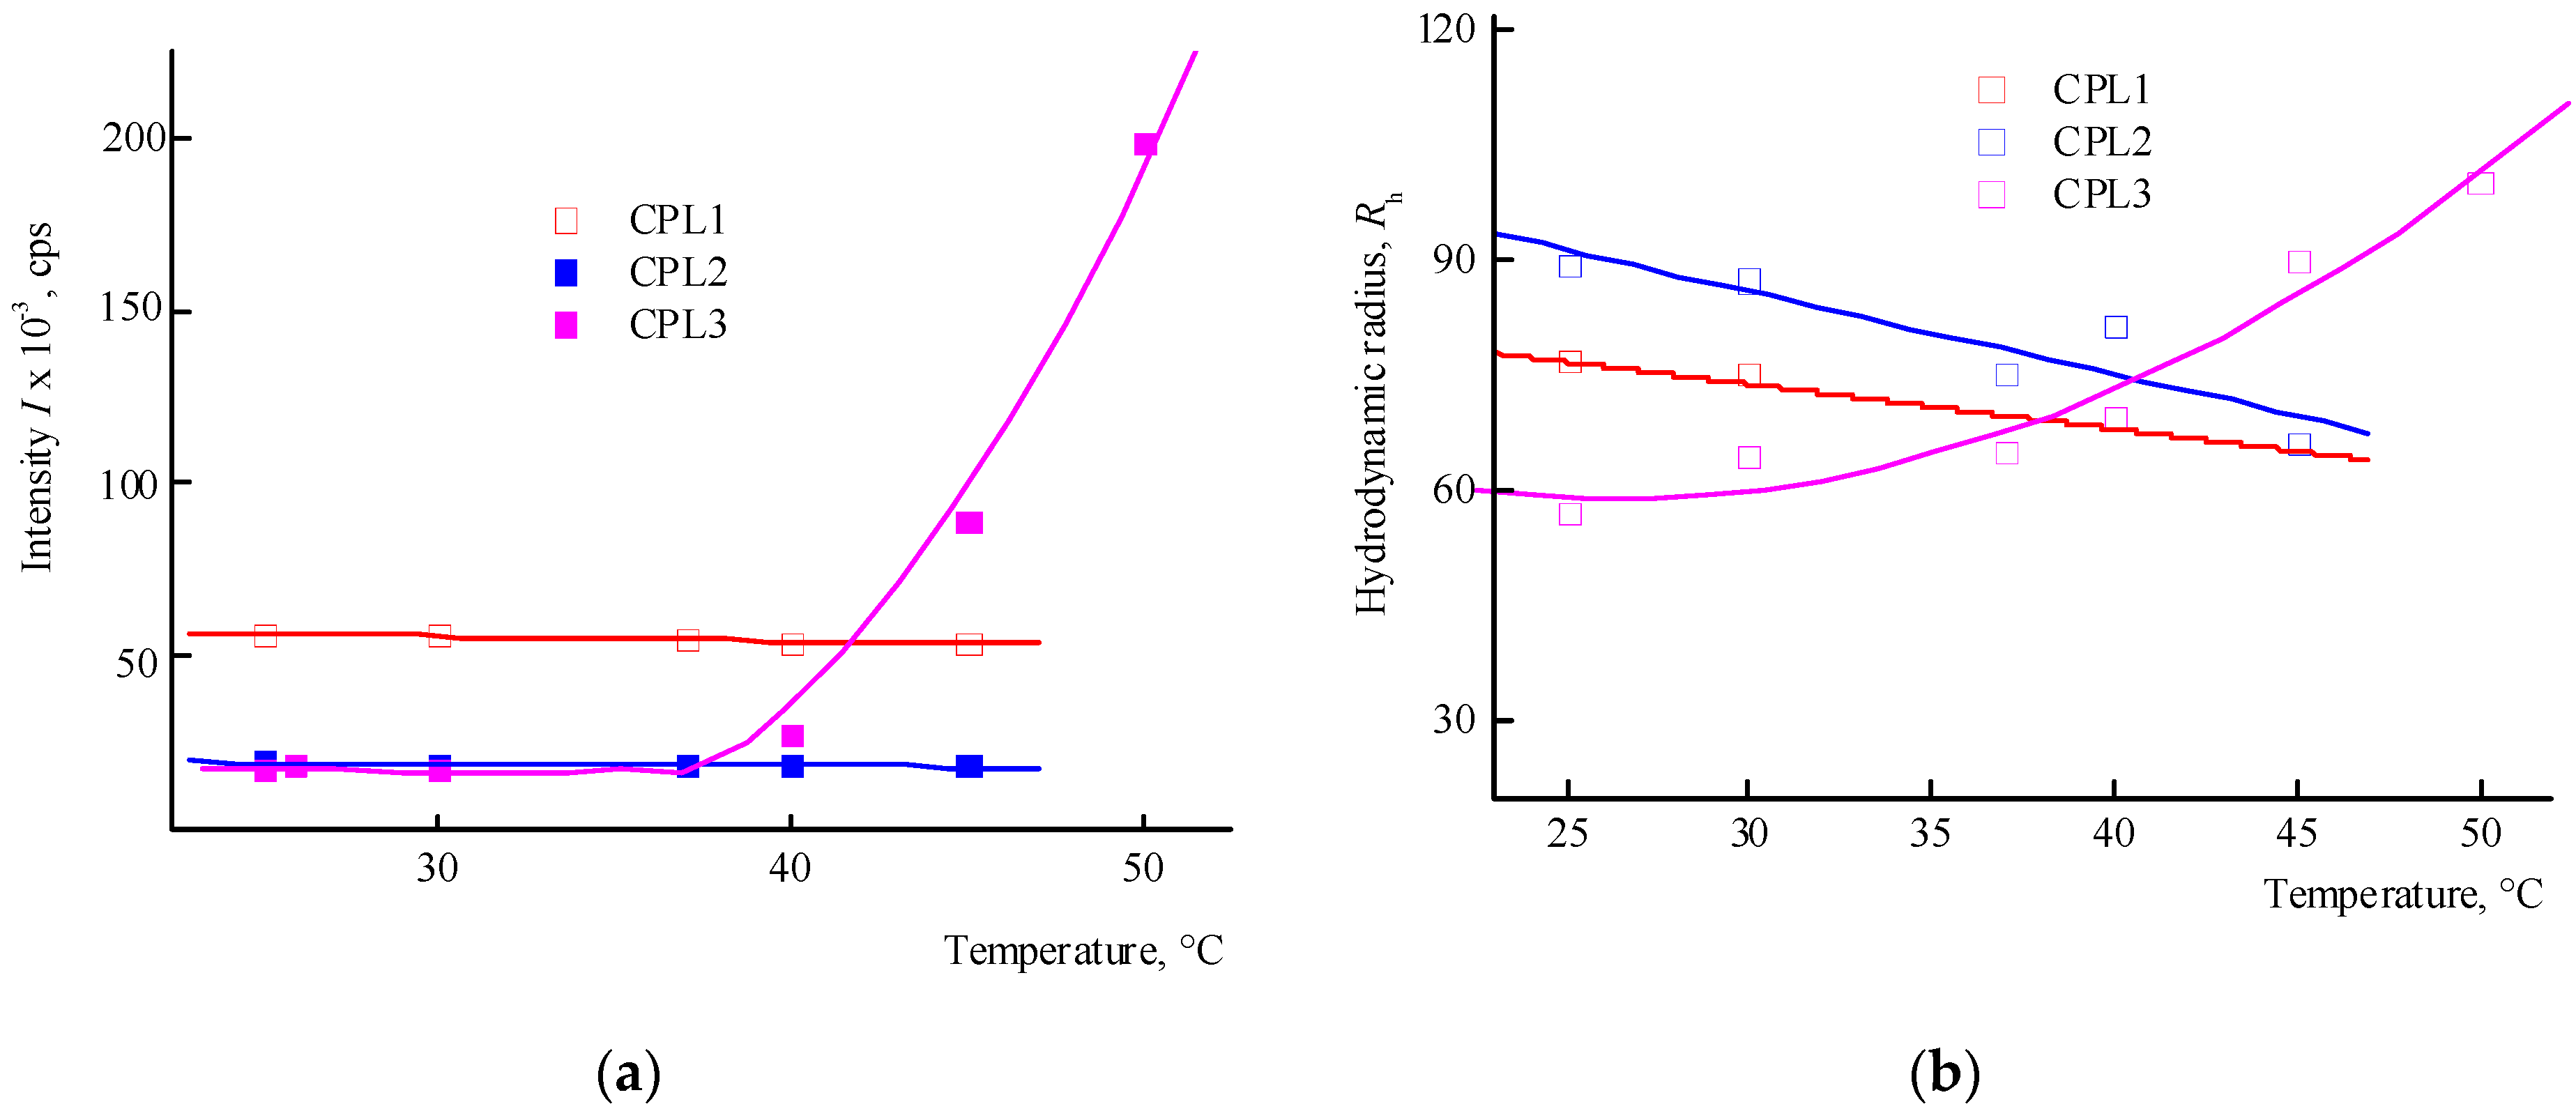
The behaviour of CPL1-CPL3 in water and PBS was investigated by DLS method in the range of 20—50 °C. The distribution of the intensity of light scattering by the size of the scattering centers by aqueous buffer solutions (pH 7.4) of terpolymers is bimodal. The main contribution in it is made by scattering centers, the R
h values of which at 25 °C lies in the interval of ~ 80—100 nm (
Table 1).
Figure 4a shows the dependencies of the average intensity of light scattering by CPL1-CPL3 aqueous PBS on temperature. It can be seen that in the studied temperature interval, the intensity of light scattering practically does not change, i.e. their clouding point lies above 50 °C. In this case, the size of the main type of dispersing centers decreases (
Figure 4b). It is known [
37] that pK
a of AA is 4.25 in water and its units in the terpolymers will be in partially ionized form. Accordingly, the proportion of this form will increase in PBS.
The distribution of the intensity of light scattering by aqueous solutions (pH 6) on scattering centers of CPL1-CPL3 is bimodal as well.
Figure 5 shows the dependencies of the average intensity of light scattering by aqueous solutions of CPL1-CPL3 and the average hydrodynamic radius
Rh of their dispersing centers on temperature. It can be seen that the aqueous solutions of CPL1 and CPL2 do not respond the temperature change, like in buffer solutions. Perhaps this is due to a topological structure of their nanogel particles and strong intramolecular interactions of polymer chains. However, with an increase in temperature, the intensity of the scattering of light of the aqueous CPL3 solution increases, i.e. this terpolymer is thermo-sensitive. The growth in intensity occurs at ~ 40 ºС, and the aqueous solution begins to become cloudy. This process is reversible – when cooling to room temperature, the solution again becomes transparent. In work [
40], we have shown that water molecules bond with the oxygen C=O of VP lactam ring, ether and carbonyl groups of TEGDM units. The addition enthalpy (−∆
H) of one water molecule on the С=О groups of VP units for the VP-VP-VP copolymer moiety is 4—6 and 2—4 kcal mol
−1 on the ether and carbonyl groups of the TEGDM unit [
40]. The H-bonds between (di)methacrylates units and water are primarily destroyed with increasing temperature, and the solubility of the copolymer decreases.
Thus, among the polymers studied, only CPL3 with a high molecular weight and content of TEGDM units is thermo-responsive in water. However, its cloudy point in PBS is shifted to higher temperature values. The lack of a terpolymer aggregation is due to the presence of charged carboxyl groups of the AA units, which apparently leads to the expanding of polymer chains and stabilizing their solutions.
2.3. Polymer Compositions of Methyl Pheophorbide a as Hydrophobic Dye and Their Characterization
The process of encapsulation of MPP into terpolymer NPs is based on the mechanism of their intermolecular association. MPP limited solubility in IPA promotes association with NPs, which occurs due to the physical capture of dye molecules by the polymer matrix with penetration into the internal cavities of NPs. As a consequence, “guest-host” complexes are formed, in which hydrophobic interactions between dye molecules and low-polar regions of polymer chains stimulate the penetration of “guest” molecules in these moieties of individual macromolecules and their aggregates.
CPL1-CPL3 terpolymers consist of hydrophilic VP and AA units and hydrophobic TEGDM units; their macromolecules can be considered as structures in which there are regions that differ significantly in polarity and are formed by moieties of polymer chains consisting of TEGDM, VP and AA units. To achieve thermodynamic stability by reducing the hydrophobic interaction of non-polar groups and water molecules, individual amphiphilic macromolecules adopt a like core-shell form, where hydrophobic regions assemble into regions protected by a hydrophilic shell. Hydrophobic compounds can be easily encapsulated into such structures. Here we used the water-insoluble dye MPP, which exhibits high fluorescence in the red region of the spectrum, to obtain its water-soluble structures and study their penetration and accumulation in various cells.
The dye was encapsulated into terpolymers using a simple and efficient method [
27,
28]. At the first stage, solutions of the terpolymers in isopropyl alcohol were used to maintain the homogeneity of the medium and prevent self-aggregation of macromolecules and large particles formation. According to DLS, terpolymers exist in an alcohol solution mainly as individual macromolecules with
Rh ~ 4 nm. The dye was dissolved in toluene or DMSO. After introducing of a solution of the dye into the terpolymer solution and removing the solvents, polymer compositions of MPP were obtained, which easily dissolved in water or PBS to form transparent or opalescent systems, depending on the type of terpolymers and PC concentration.
Figure S2 shows absorption spectra of MPP solutions of different concentrations in toluene and DMSO. There is an intense absorption Q-band in the visible region with a maximum at wavelengths of 675 and 672 nm
S0.0→S1.0 transition [
33] in toluene and DMSO, respectively. The dependencies of its optical density on concentration in the range less than 10
-4 — 10
-5 M in both the solvents are linear, and the molar extinction coefficient is equal to 54438 and 38898 L/M × cm, respectively. However, MPP molecules aggregate over time, and the
A([MPP]) dependence becomes nonlinear; the maximum of the absorption band shifts to 668 nm as a result of MPP aggregation in the polar medium.
2.4. Polymer Compositions of MPP (PC1-PC4) Produced with the 1st Method
Encapsulation of MPP into polymer particles CPL1-CPL3 was carried out to prepare PC1-PC3 compositions. For comparison, a composition based on PVP (PC4) was prepared as well.
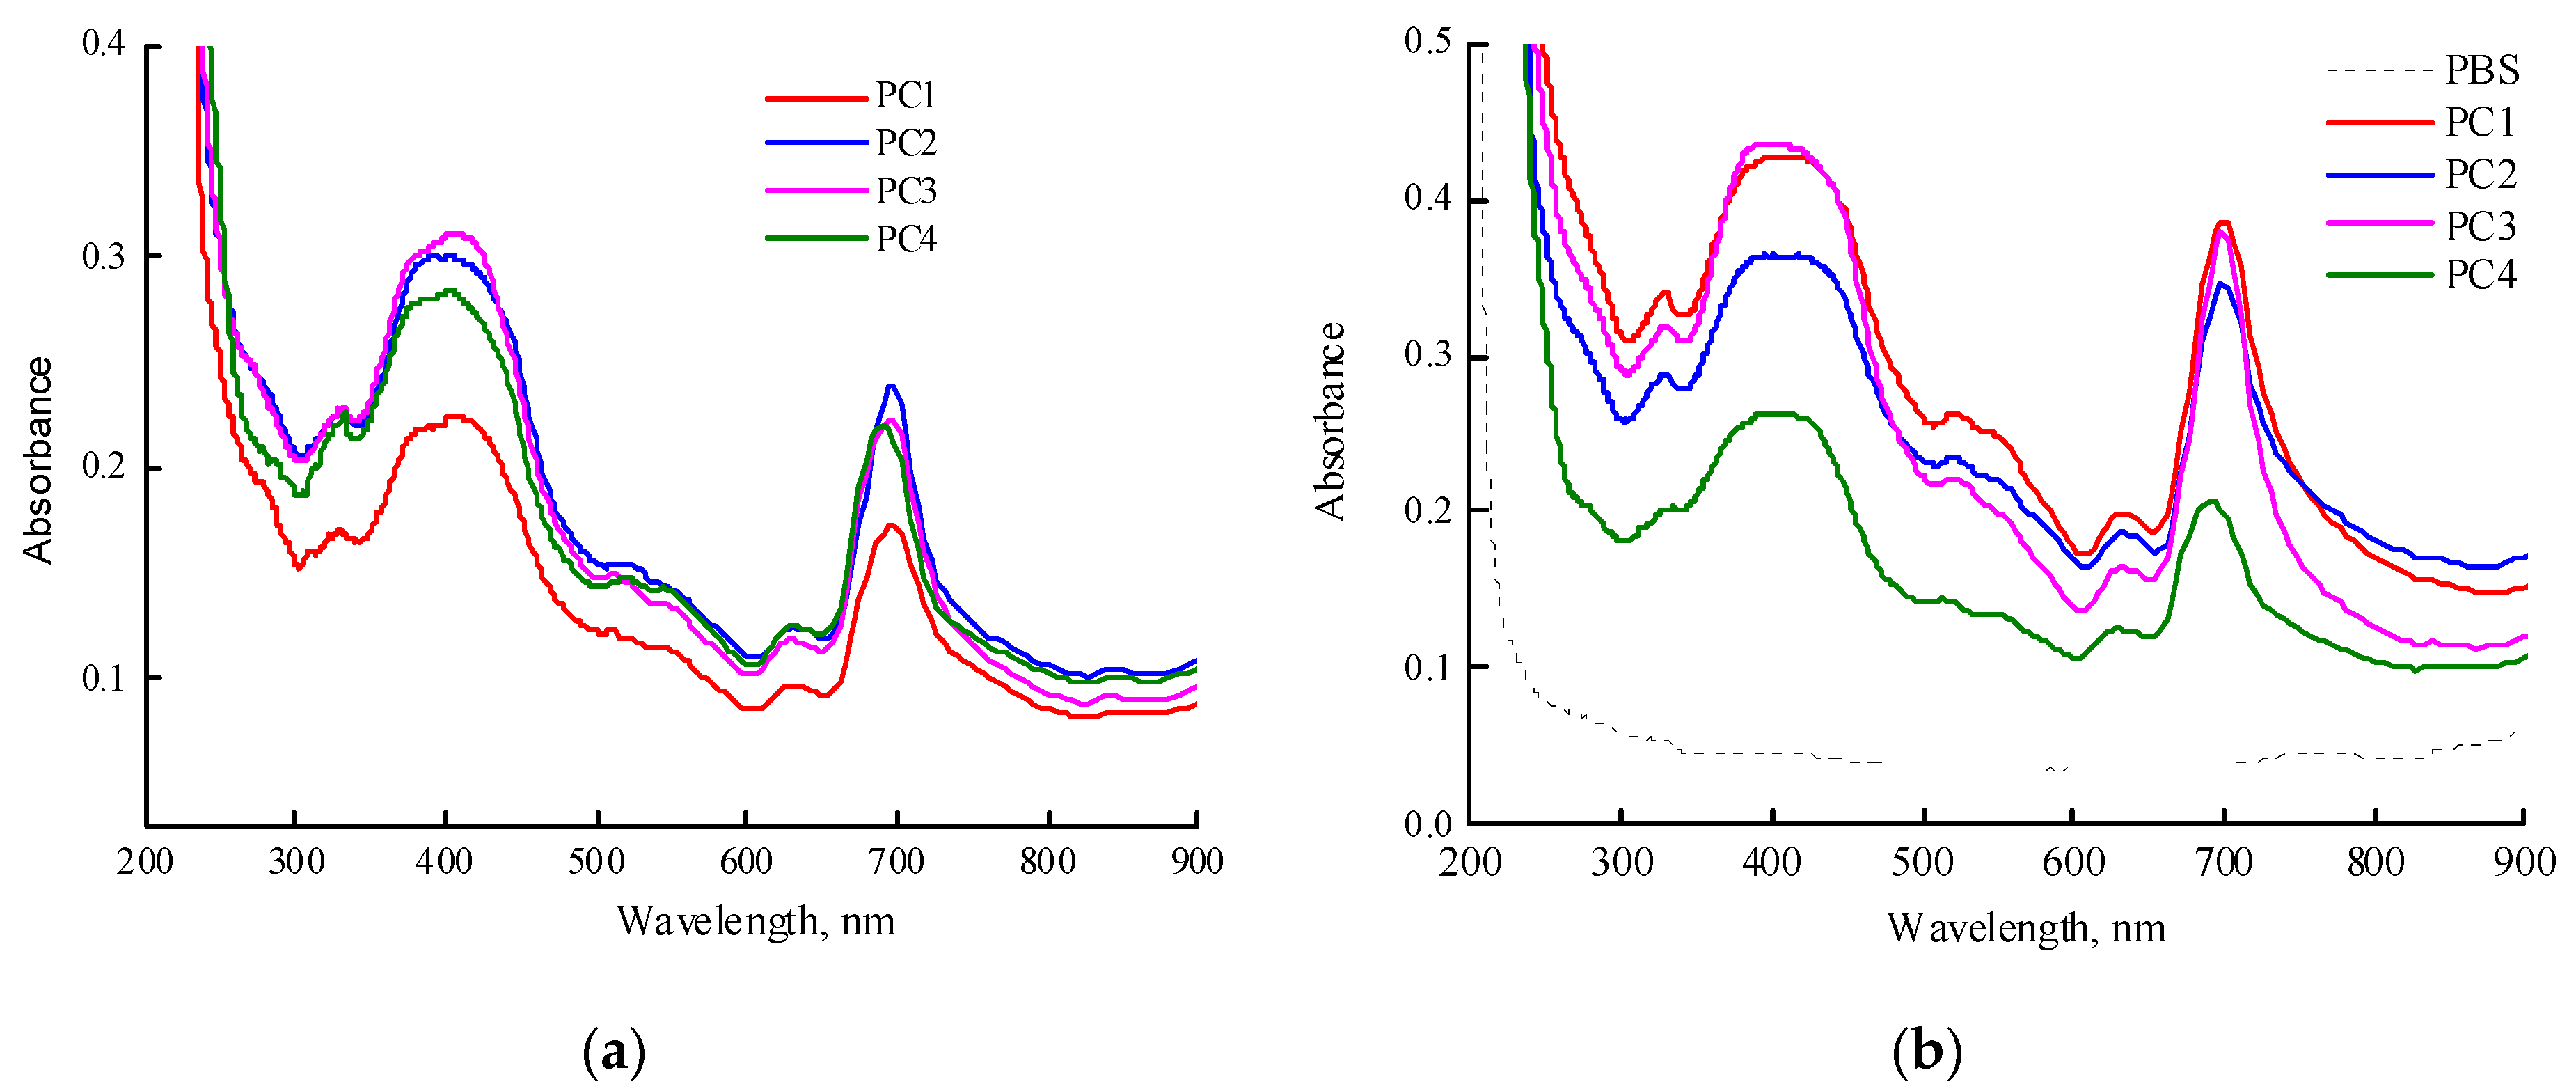
Figure 7a shows the absorption spectra of freshly prepared aqueous solutions of MPP terpolymer compositions (~1 mg mL
-1). It should be noted that PC1, PC2, and PC4 dissolved quickly, in contrast to PC3. The maximum of the Q-absorption band of encapsulated MPP in water was 698 nm and, compared to one in toluene and DMSO, was red-shifted by more than 20 nm. It should be noted that the maximum absorption band of MPP encapsulated in PVP was about 690 nm, i.e. differed by 8 nm from the MPP encapsulated in terpolymers.
However, the absorption spectra of the solutions of all studied systems have changed over time (
Figure S3). Thus, in an aqueous solution of PC1, the absorption band continued to shift to the red region of the spectrum and its optical density decreased. In an aqueous solution of PC2 in the visible region, the entire absorption spectrum decreased as a result of phase precipitation from the colloidal solution, but the position of the maximum of the absorption band remained the same. In the case of PC2, an increase in the optical density of the absorption band was observed, apparently as a result of an increase in the solubility of the original MPP. In the spectrum of the aqueous solution of PC4, the changes were the most significant. The maximum of the absorption band first shifted to 698 nm, its optical density decreased and the optical density of the MPP absorption bands at 634 and 757 nm increased, probably as a result of the appearance of different aggregates (H and J-aggregates) inside or on the surface of nanoparticles. Thus, in aqueous solutions of nanostructures, significant changes occur over time, associated with a slight precipitation of large NPs-MPP, an increase in the interaction of MPP-polymer, and also aggregation of encapsulated MPP molecules in NPs. The PC4 structures were less stable than those based on terpolymers; H- and J-aggregates increased over time. Vice versa, PC3 structures based on CPL3 with a high molecular weight and content of TEGDM units are the most stable in water; in them, the aggregation of MPP molecules is suppressed, but the interaction with the terpolymer is enhanced and is accompanied by a hyperchromic effect (
Figure S3c). The content of H- and J-aggregates increased over time.
Figure 7b shows absorption spectra of freshly prepared solutions of PC1 (0.98 mg mL
-1), PC2 (1 mg mL
-1), PC3 (0.86 mg mL
-1), PC4 (1.08 mg mL
-1) in PBS. The same features as described above for water solutions are observed in this media. The maximum Q-band absorption of MPP encapsulated in CPL1-CL3 is observed at a wavelength of 698 nm, in contrast to PVP itself, for which it is 690 nm. These differences are probably associated with the localization of MPP molecules in regions of NPs that provide strong interaction between the functional groups of MPP and terpolymers. However, over time, these trends also increase in PVP-based NPs.
To calculate the MPP content in compositions (the MPP loading), they were dissolved in DMSO and solutions containing 1.0, 1.1, 0.96 and 0.86 mg mL
-1 PC1-PC4 were obtained, respectively. The absorption spectra of the freshly prepared solutions were recorded and the absorption band of MPP in DMSO was observed at 672 nm, similar to that in DMSO (
Figure S4) as a result of its release from polymer nanoparticles. Knowing the molar extinction coefficient of MPP in DMSO and the concentrations of MPP composition in DMSO, the MPP loading was calculated. According to calculations, they were 1.76, 1.55, 1.61 and 1.28%, in PC1-PC4, respectively. The theoretical MPP loading were 1.53, 1.46, 1.47 and 1.35%, respectively. Taking into account experimental errors, it can be assumed that the efficiency of MPP encapsulation in terpolymers is
ca 100%, and it is about 94.8% in the case of PC4. The efficiency of encapsulation was calculated as the encapsulated mass of MPP by the total mass of the dye in the MPP-composition preparation. It should be noted that after 3 months, significant changes occurred in solutions of MPP composition in DMSO. The solutions remained clear and no phase separation was observed. However, the optical density of the dye absorption band decreased by 60–70% due to MPP release from NPs to DMSO, and aggregation of its molecules. The appearance of absorption in the region of 700 nm indicated the formation of J-aggregates of MPP in this solvent.
The sizes of scattering centers of PC1-PC4 depending on their concentrations in the PBS were determined by the DLS (
Table S1). It can be seen that the solutions contain fairly large particles, the size of which decreases with concentration; it indicates the aggregative nature of these formations. Hydrophobic MPP molecules included in NPs enhance their hydrophobicity, which increases their tendency to aggregation. It is possible that some MPP molecules adsorbed on the surface of NPs can form supramolecular clusters, connecting individual nanostructures with each other. In dilute solutions of PC2 and PC3, the size of scattering centers is higher and is about 190 and 140 nm, respectively, and decreases after solution filtration. The reason for this is the increase in hydrophobicity of the original polymer nanoparticles and MPP structures based on them.
2.6. Polymer Compositions of MPP Obtained by the Second Method
Encapsulation of MPP into polymer particles was carried out according to the method described in the Experimental Section; here, we used a solution of MPP in DMSO (0.8 mg mL
-1) and calculated MPP content per copolymer was higher than 3%. The resulting MPP compositions based on CPL1, CPL2 and CPL3 (PC5-PC7) were easily dissolved in PBS (1.1, 0.98, 1.1 mg mL
-1); all the solutions were transparent. The absorption spectra of freshly prepared solutions were recorded (
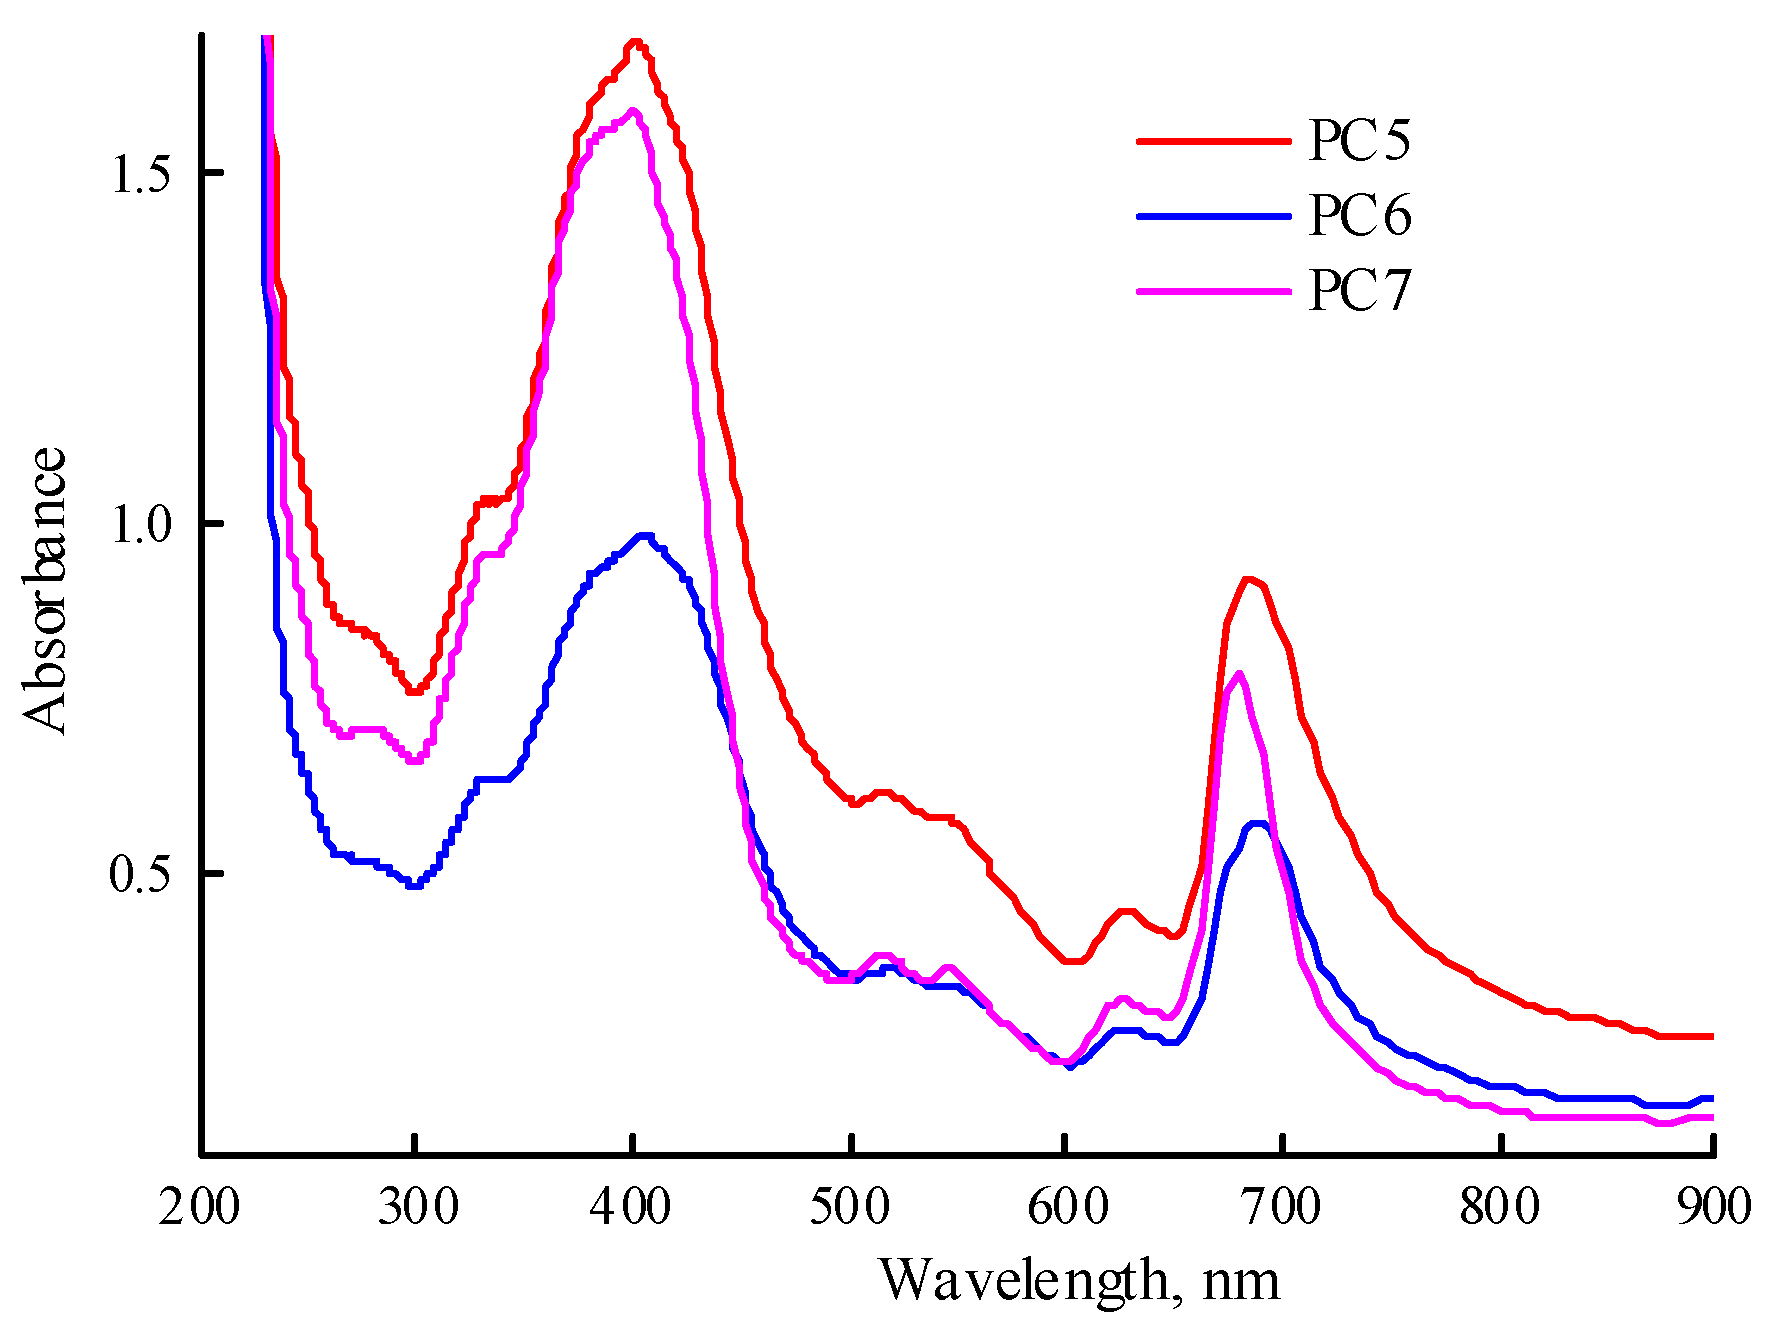
Figure 9). The Q-band absorption is higher than in
Figure 7b, due to the higher content of MPP in the obtained compositions. There are differences in the position of the absorption band maximum depending on the type of polymer matrix. Changes occur in all solutions over time. Thus, in solution of PC5, the absorption band of MPP shifts to the red region of the spectrum from 683 to 694 nm and its absorption decreases. In the PC6 solution, the MPP absorption band also shifts to the red region of the spectrum to 698 nm during the same observation time, but its absorption decreases slightly. In the PC7 solution, the position of the maximum of the absorption band does not change, but its absorption decreases and additional absorption appears in the region of 700—750 nm, characteristic of MPP J-aggregates.
To calculate the content of MPP in PC5-PC7 (the MPP loading), their solutions in DMSO were prepared and the absorption spectra were recorded; the calibration dependence of the optical density of the absorption band on the concentration of MPP in DMSO was used as well. According to experimental data, the MPP loading in PC5 was 3.27%, and in PC6 and PC7 were only ca. 2.5 and 2.2%, respectively. The calculated content of MPP in these compositions (MPP loading) was 3.28, 3.15 and 3.10% MPP. The encapsulation efficiency in the first case was ~100%, in the others – 80 and 71%, respectively. However, the data on the MPP loading in PC6 and PC7 appear to be of estimation due to possible incomplete release from polymer matrices CPL2 and CPL3 characterized by a high molecular packing density compared to CPL1, as well as intermolecular interactions with terpolymers.
As in aqueous solutions, changes also occur in the spectra of solutions of MPP compositions in DMSO over time. However, they manifest themselves only in a decrease in the optical density of the Q-band at 672 nm by ~30—40% and the appearance of slight absorption in the region of 700—720 nm, associated with the J-aggregates of MPP molecules.
Table S2 shows the sizes of the main scattering centers of PC5-PC7 in PBS at 25 °C. It can be seen that they weakly depend on the PС concentration in the solution. As expected, their size decreases after filtering of dilute solutions. However, their tendency to aggregation is so high that in a solution filtered from large particles, micron-sized particles are still recorded as a result of PC aggregation.
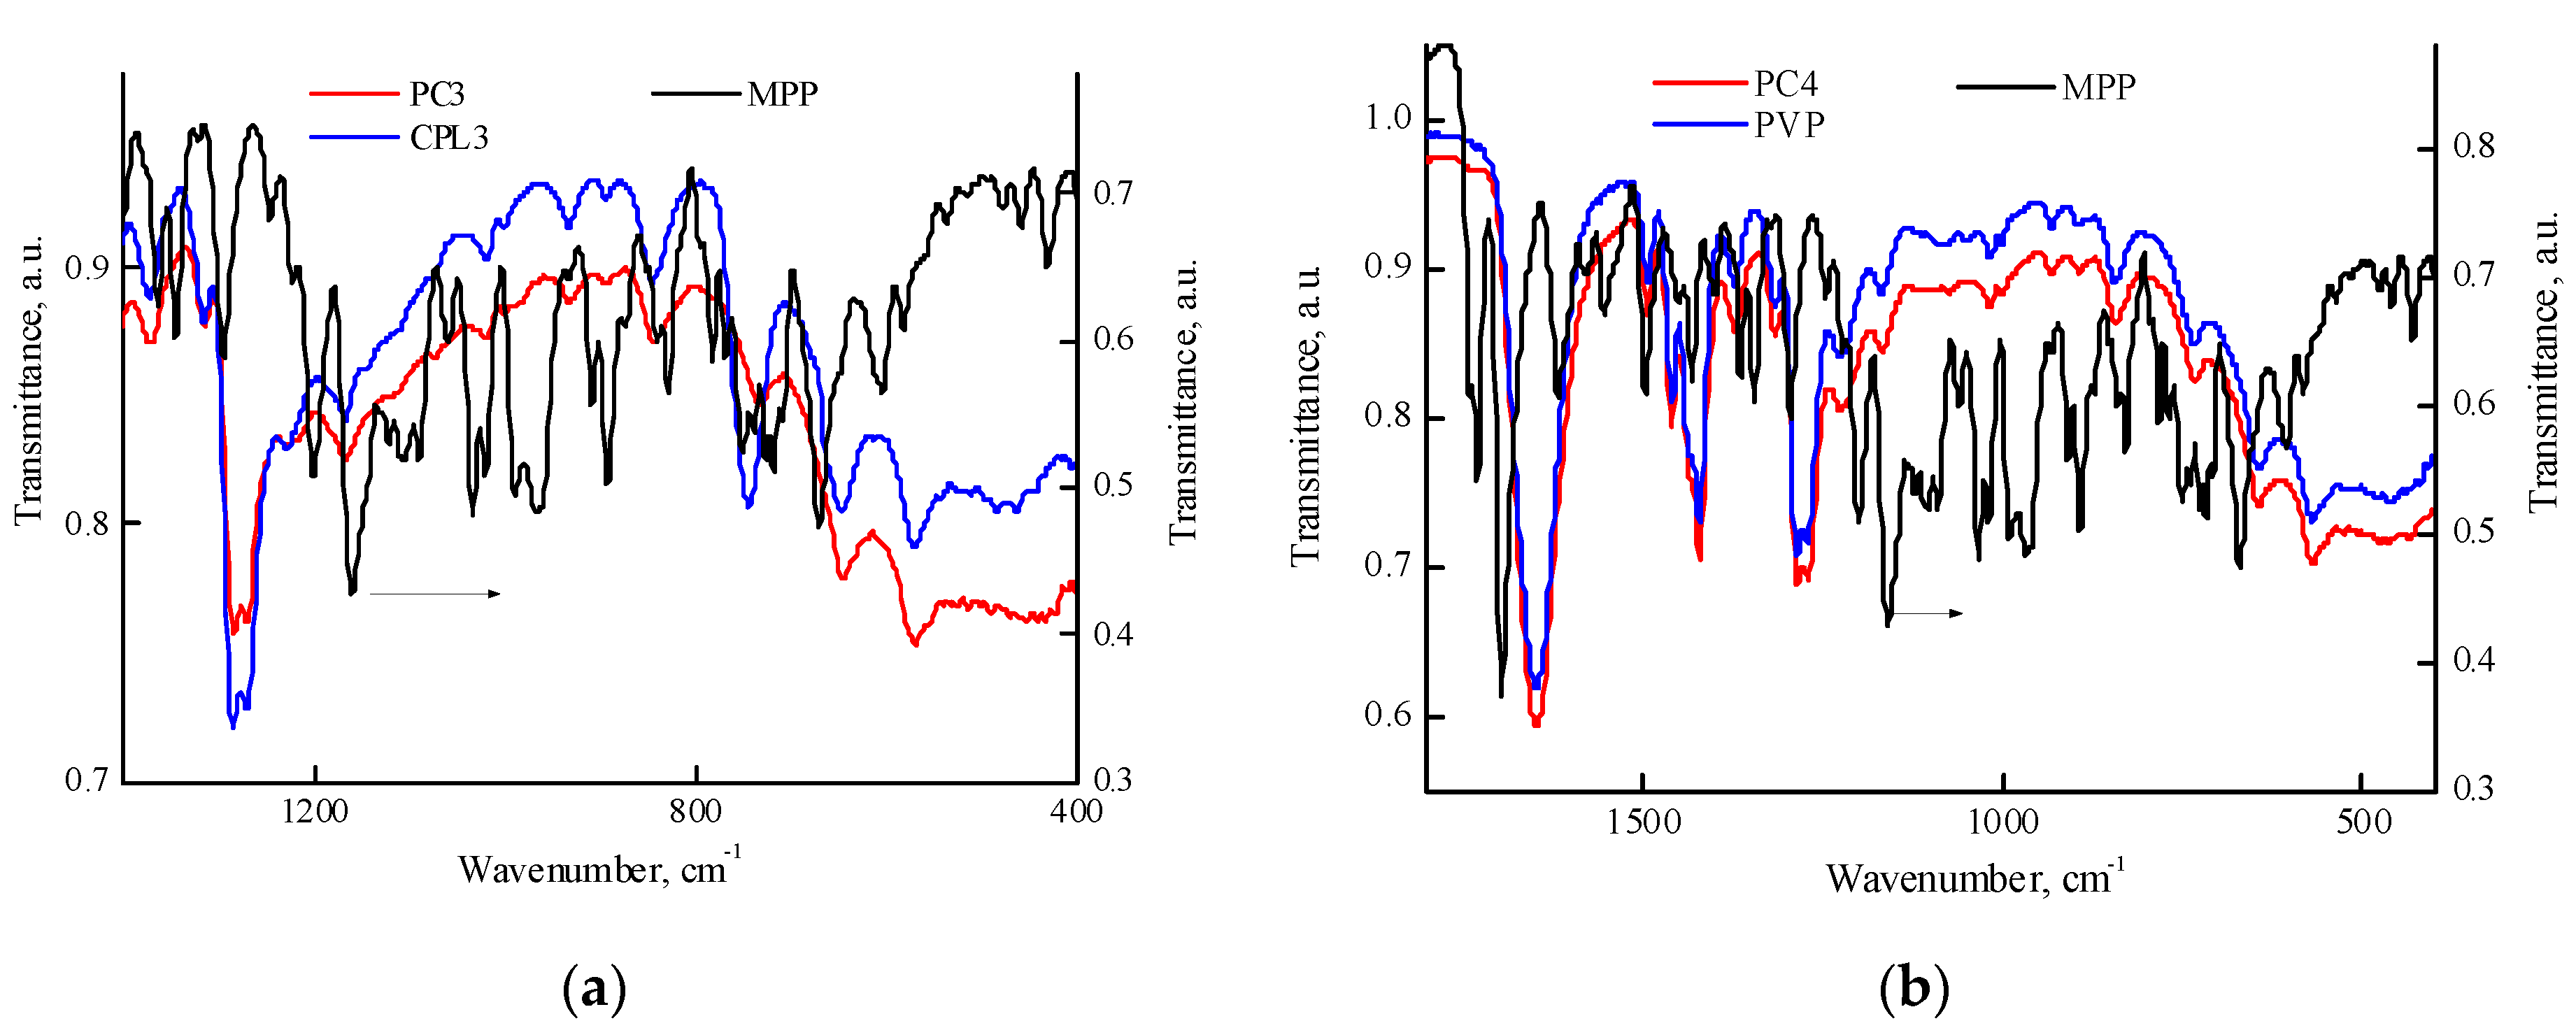
Figure S5 shows the IR spectra of MPP and PC5 and PC7 powders in the regions of 1400—400 cm
-1. It can be seen that in the IR spectrum of the PC5 powder (
Figure S5a), the CPL1 band at 744 cm
-1 shifts to the region of lower wavenumbers, and the spectrum in the region of 750—400 cm
-1 changes due to the redistribution of the intensities of the absorption bands in this region. A similar shift occurs in the PC6 composition. Even more pronounced changes are in the IR spectrum of PC7 powder (
Figure S5b). They are the result of the MPP influence on the vibrational structure of terpolymers, associated not only with a shift in the absorption band but also with the presence of new bands, and are not associated with the residual solvent – DMSO.
2.7. Quantum Chemical Modeling of MPP Structures with Terpolymer
Analysis of the absorption spectra shows that specific processes occur in aqueous solutions of PC, associated not only with the aggregation of NP-MPP and MPP, but also with subtle intermolecular interactions between the terpolymer and the dye molecules. In this regard, we carried out quantum chemical modelling of possible structures formed due to intermolecular interactions between MPP and terpolymers chains.
Several groups of hydrogen atoms can take part in a formation of hydrogen bonds with copolymer units, all of them have approximately the same partial positive charge, ca. +0.2, except the hydrogen atoms at the nitrogen atoms, for which the charge is +0.42, that is, this position would be the most likely for the formation of an intermolecular bond if not for the steric hindrances that may arise. The MPP oxygen atoms can also form bonds with the hydrogens of the VP and TEGDM units, and especially with the protons of the MAA units [
43].
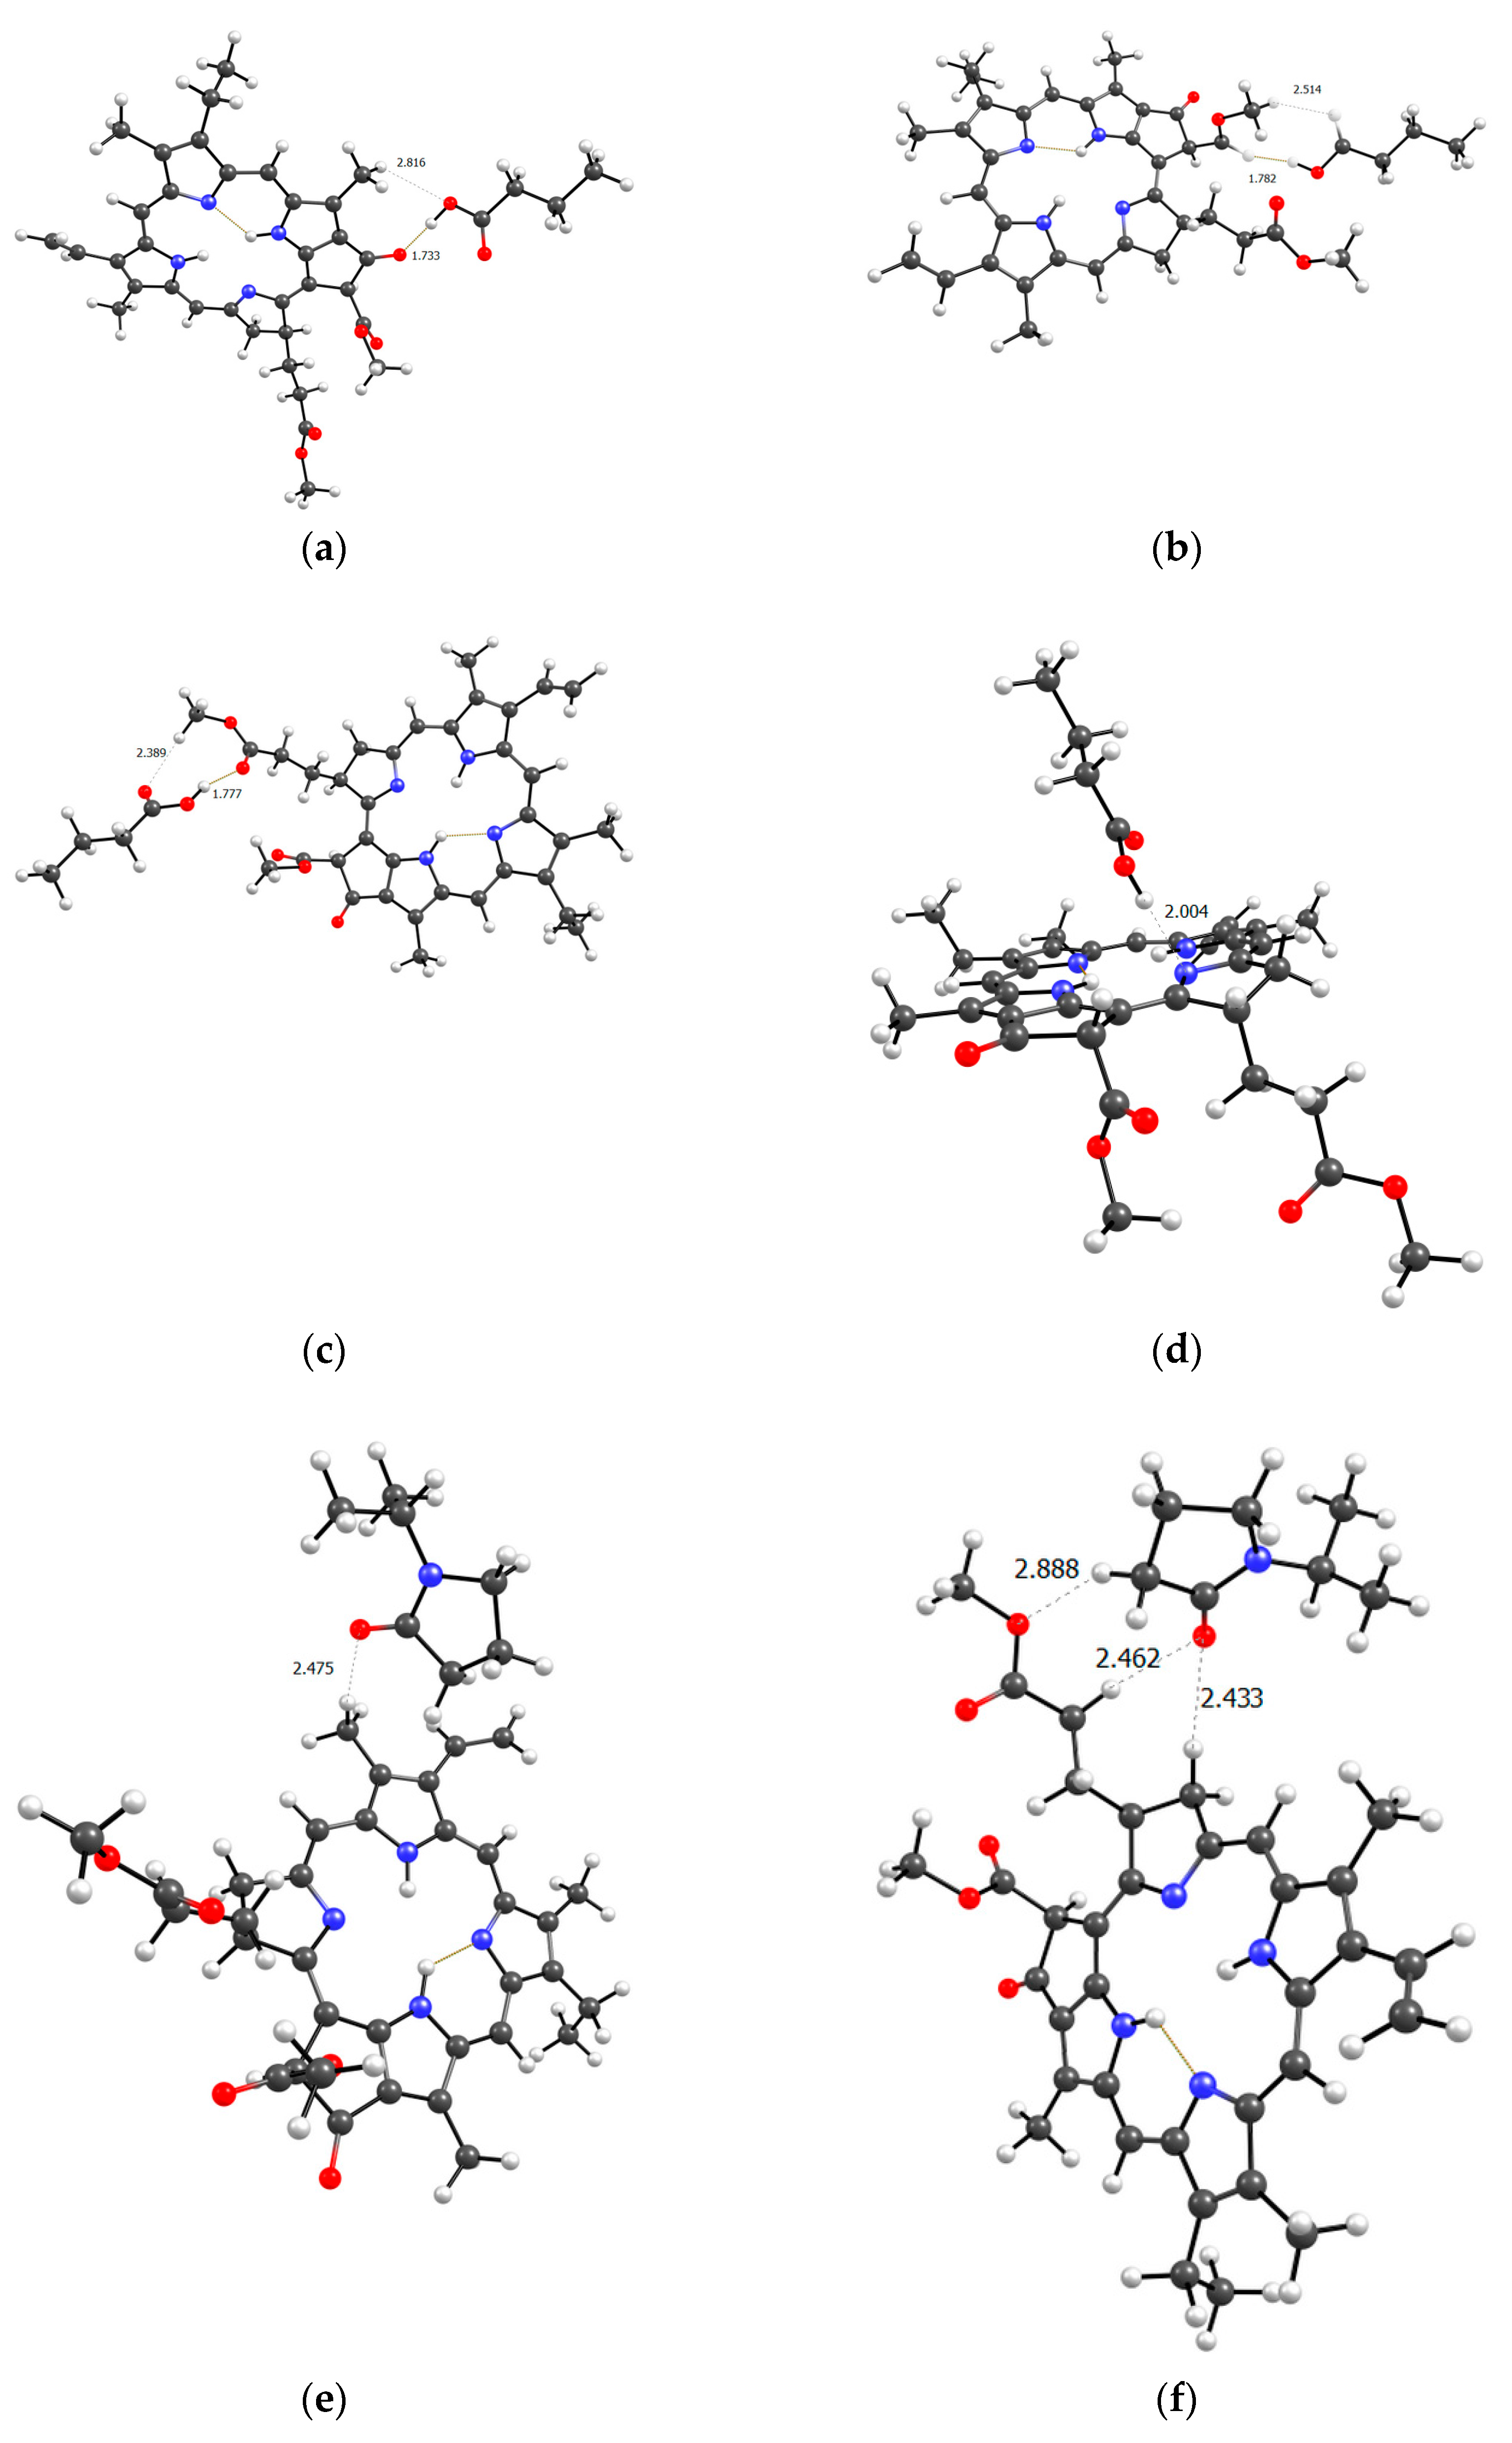
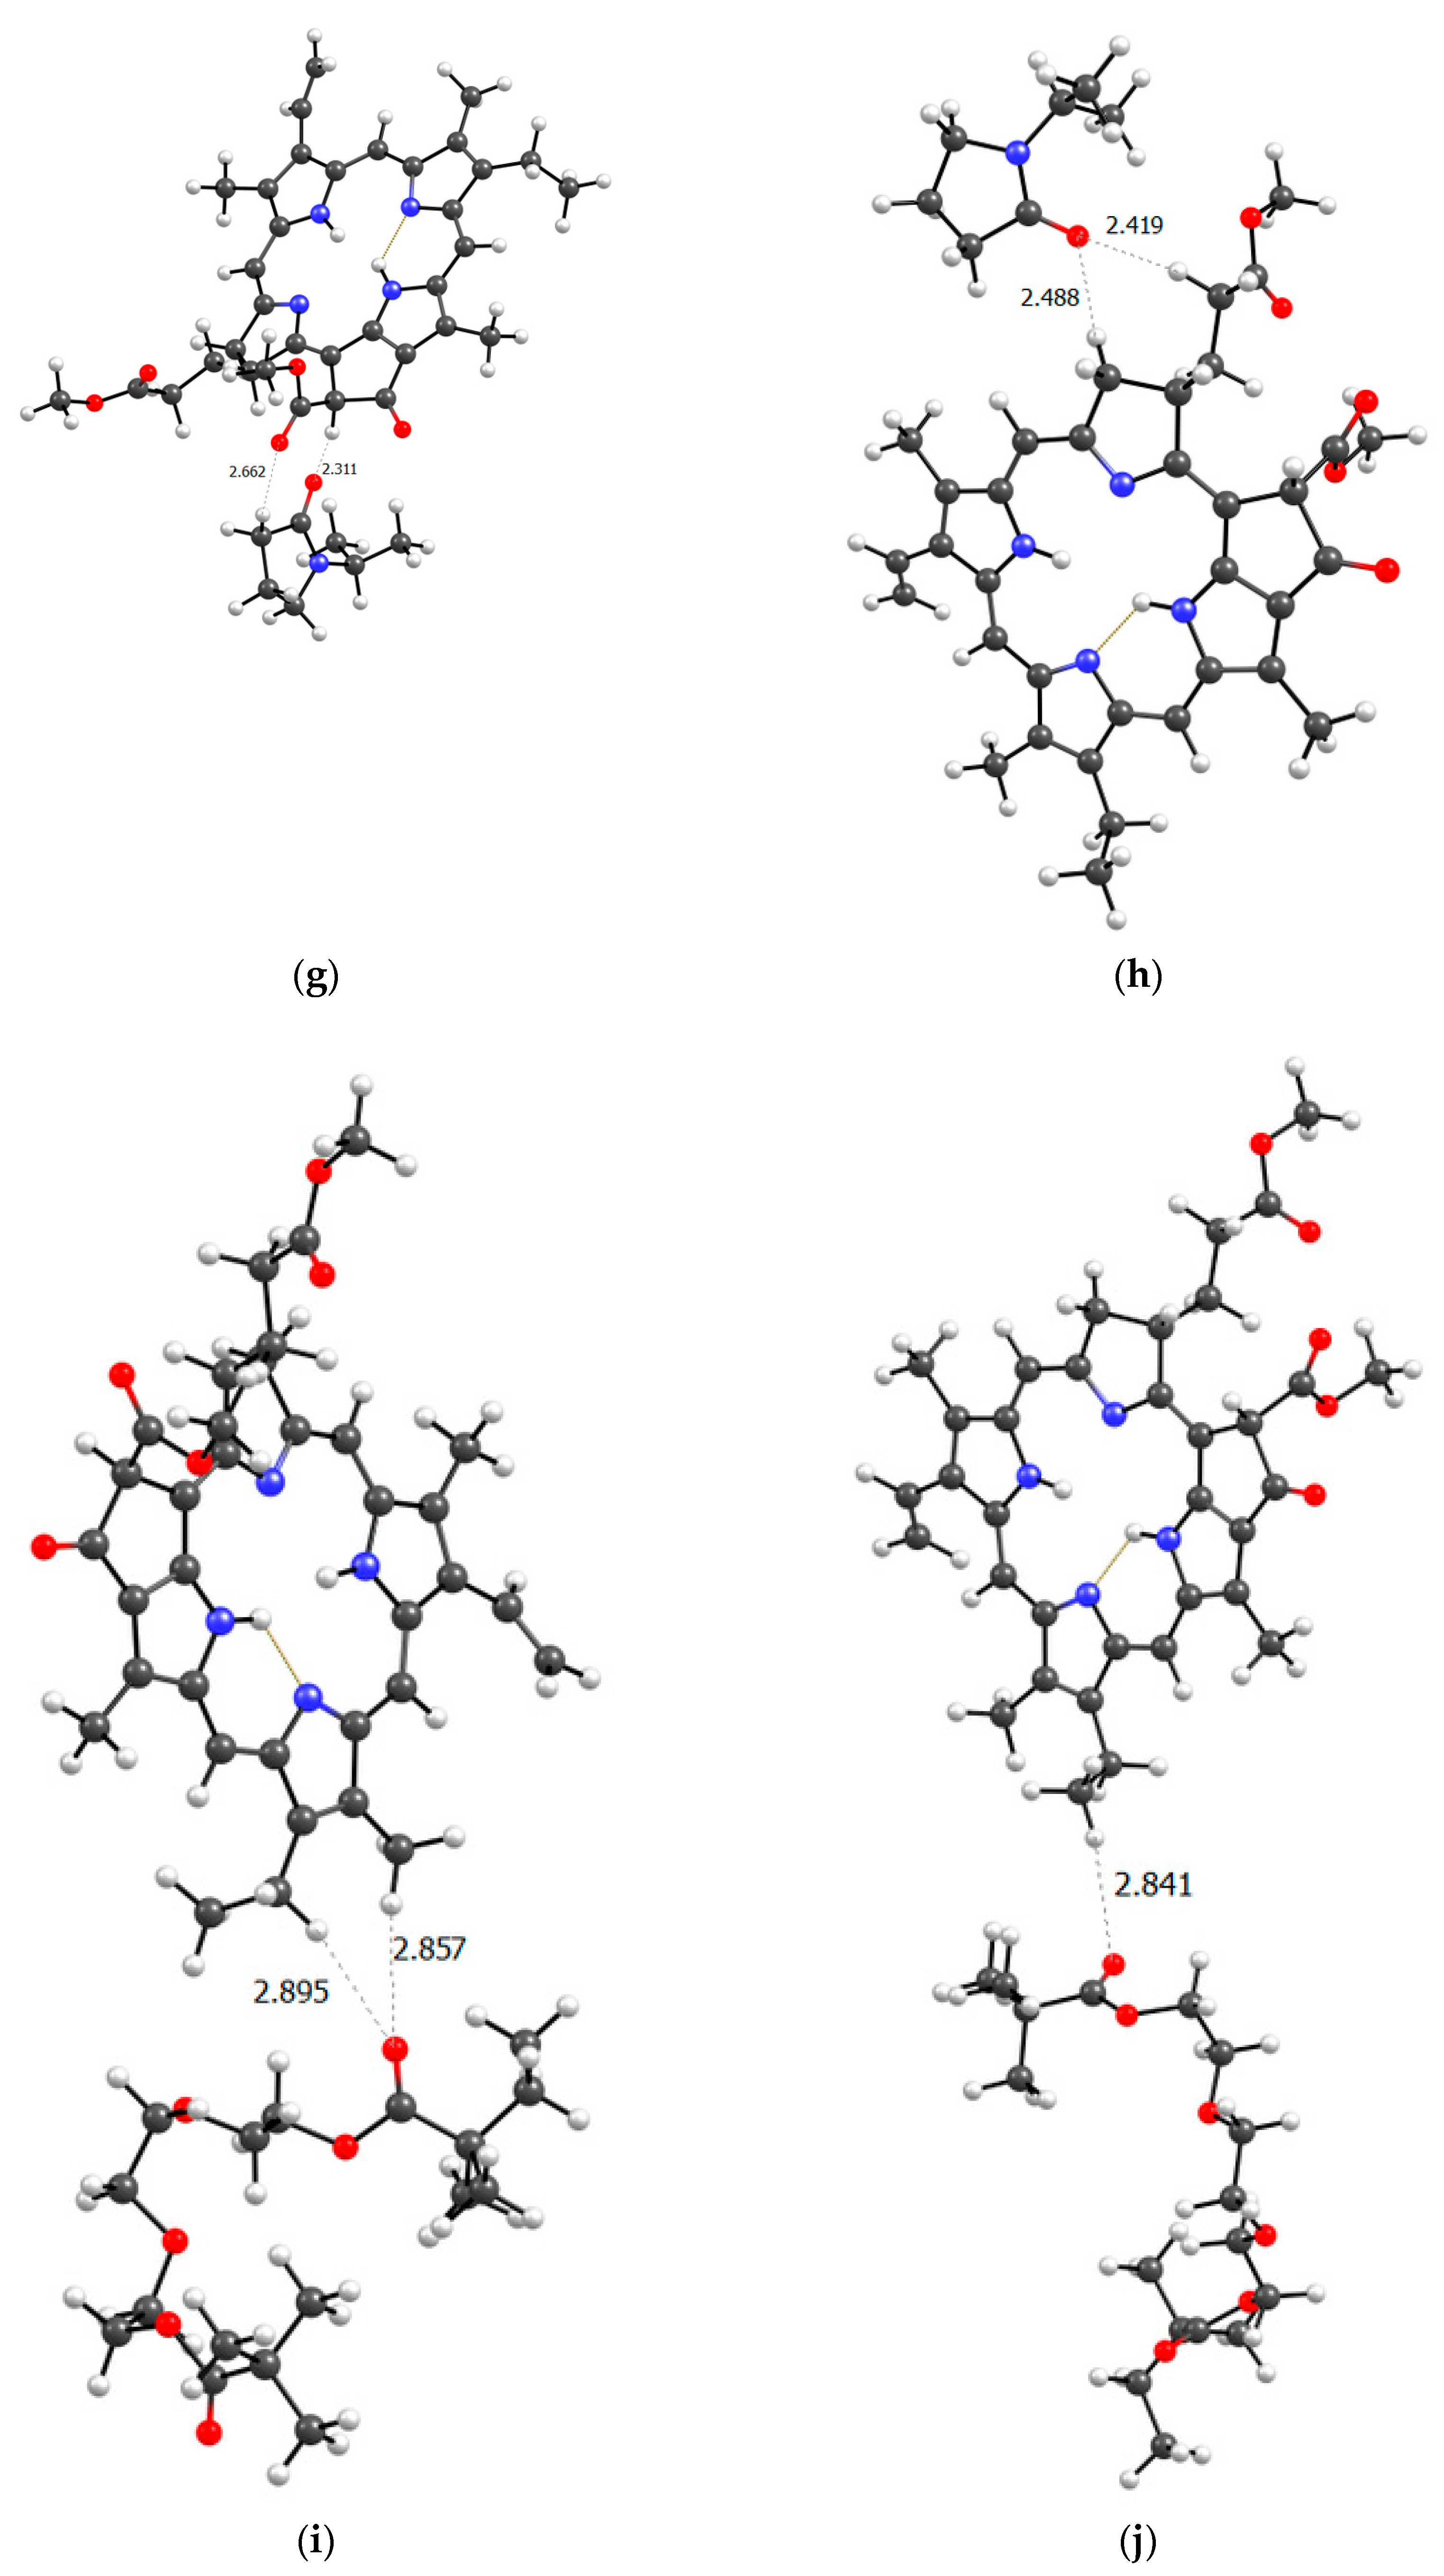
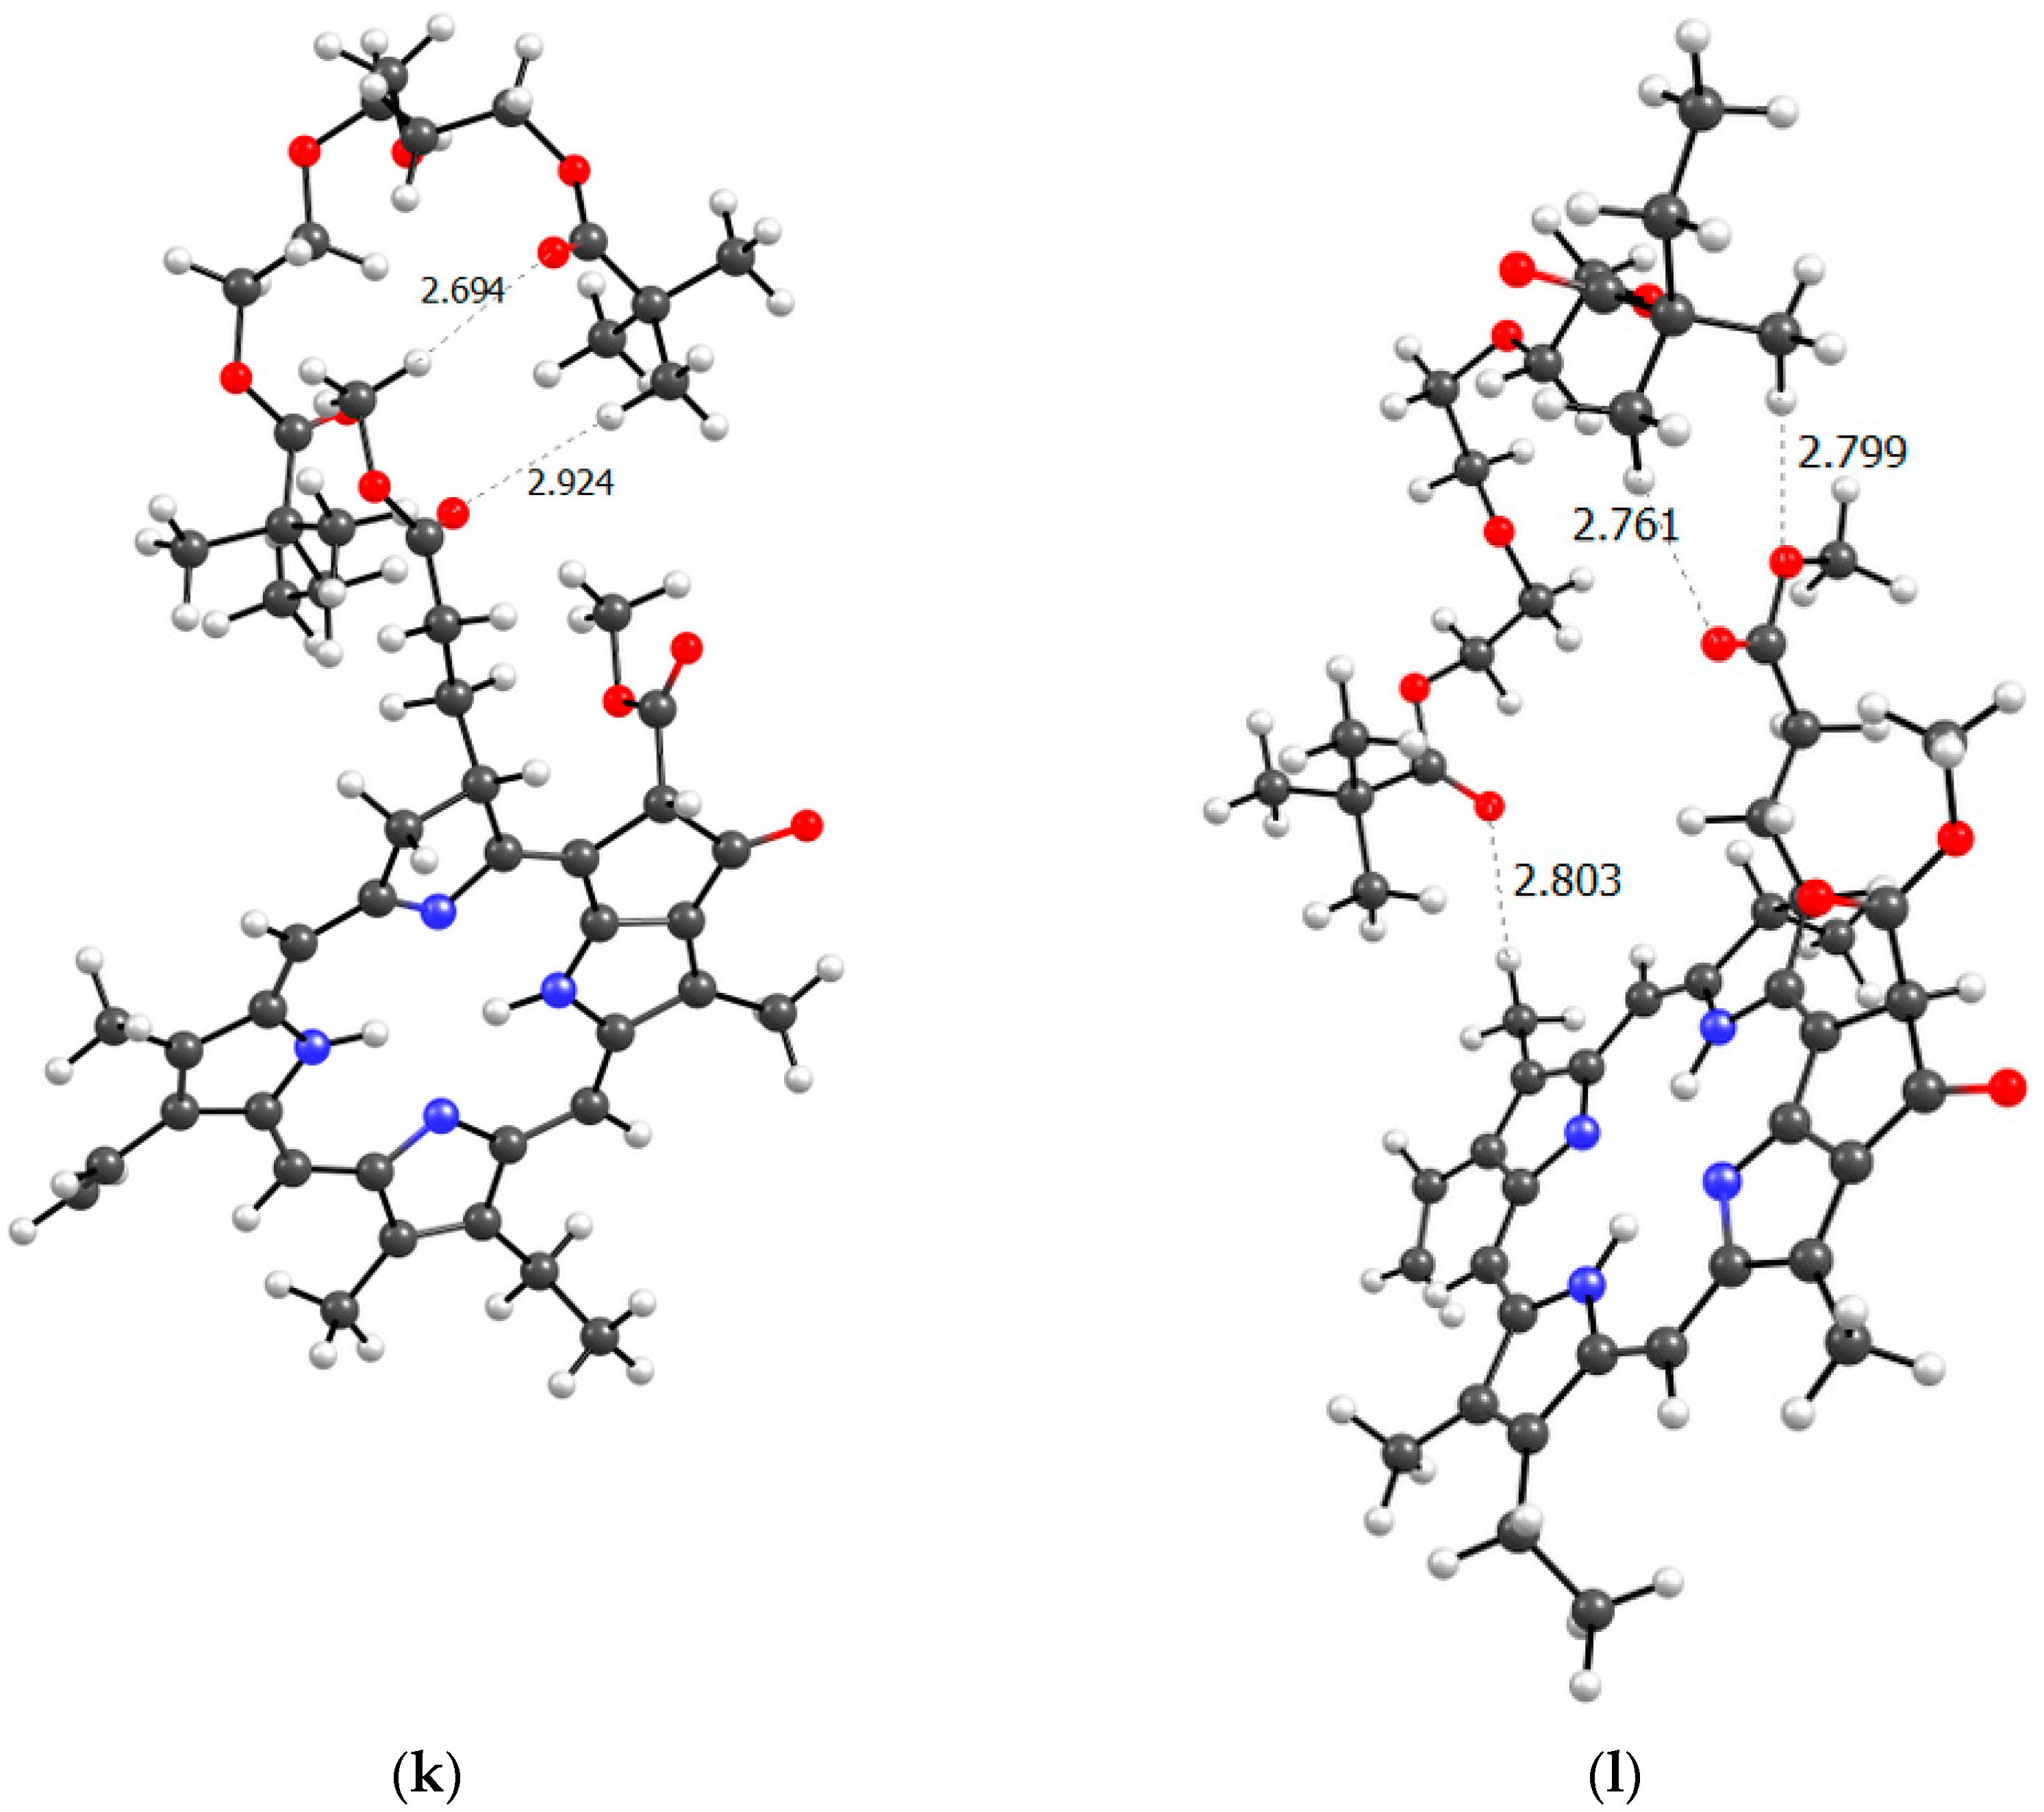
Figure 11 shows all the possible dimers formed by the monomer units of the terpolymer and MPP in all different possible ways.
From the structure of the obtained dimers it is clear that the shortest hydrogen bonds are formed with the AA unit (OH group hydrogen atom, MPP oxygen atoms), the shortest bond among them, according to DFT calculations, is between the hydrogen of the OH group of AA and the oxygen of the C=O ring of MPP (
Figure 11). In addition to this, bonds are formed due to the C=O oxygen atom of the AA unit and the hydrogen of MPP. That is, we can say that this unit is the main to form bonds between the terpolymer and MPP. VP units can bind due to the oxygen of the lactam ring, as we demonstrated earlier [
44] and numerous hydrogen atoms of the CH-groups of the MPP molecule. Hydrogen bonds appear as addition ones due to the oxygen atoms of MPP. As usual, the weakest bonds [
45] are formed by the TEGDM unit, but at the same time, bonds are more often observed due to the hydrogen atoms of C—H groups.
To get closer to understanding the structure of the real PVP-AA-TEGDM-MPP system, it is necessary to consider the terpolymer section based on the available experimental data. In the terpolymer, if we average the available data, 80% are VP units and approximately 10% each are AA and TEGDM units. This means that polymer chains contain sections consisting only of VP units. Clearly, these could be binding sites for MPP, since we have seen that the VP units easily form hydrogen bonds with them.
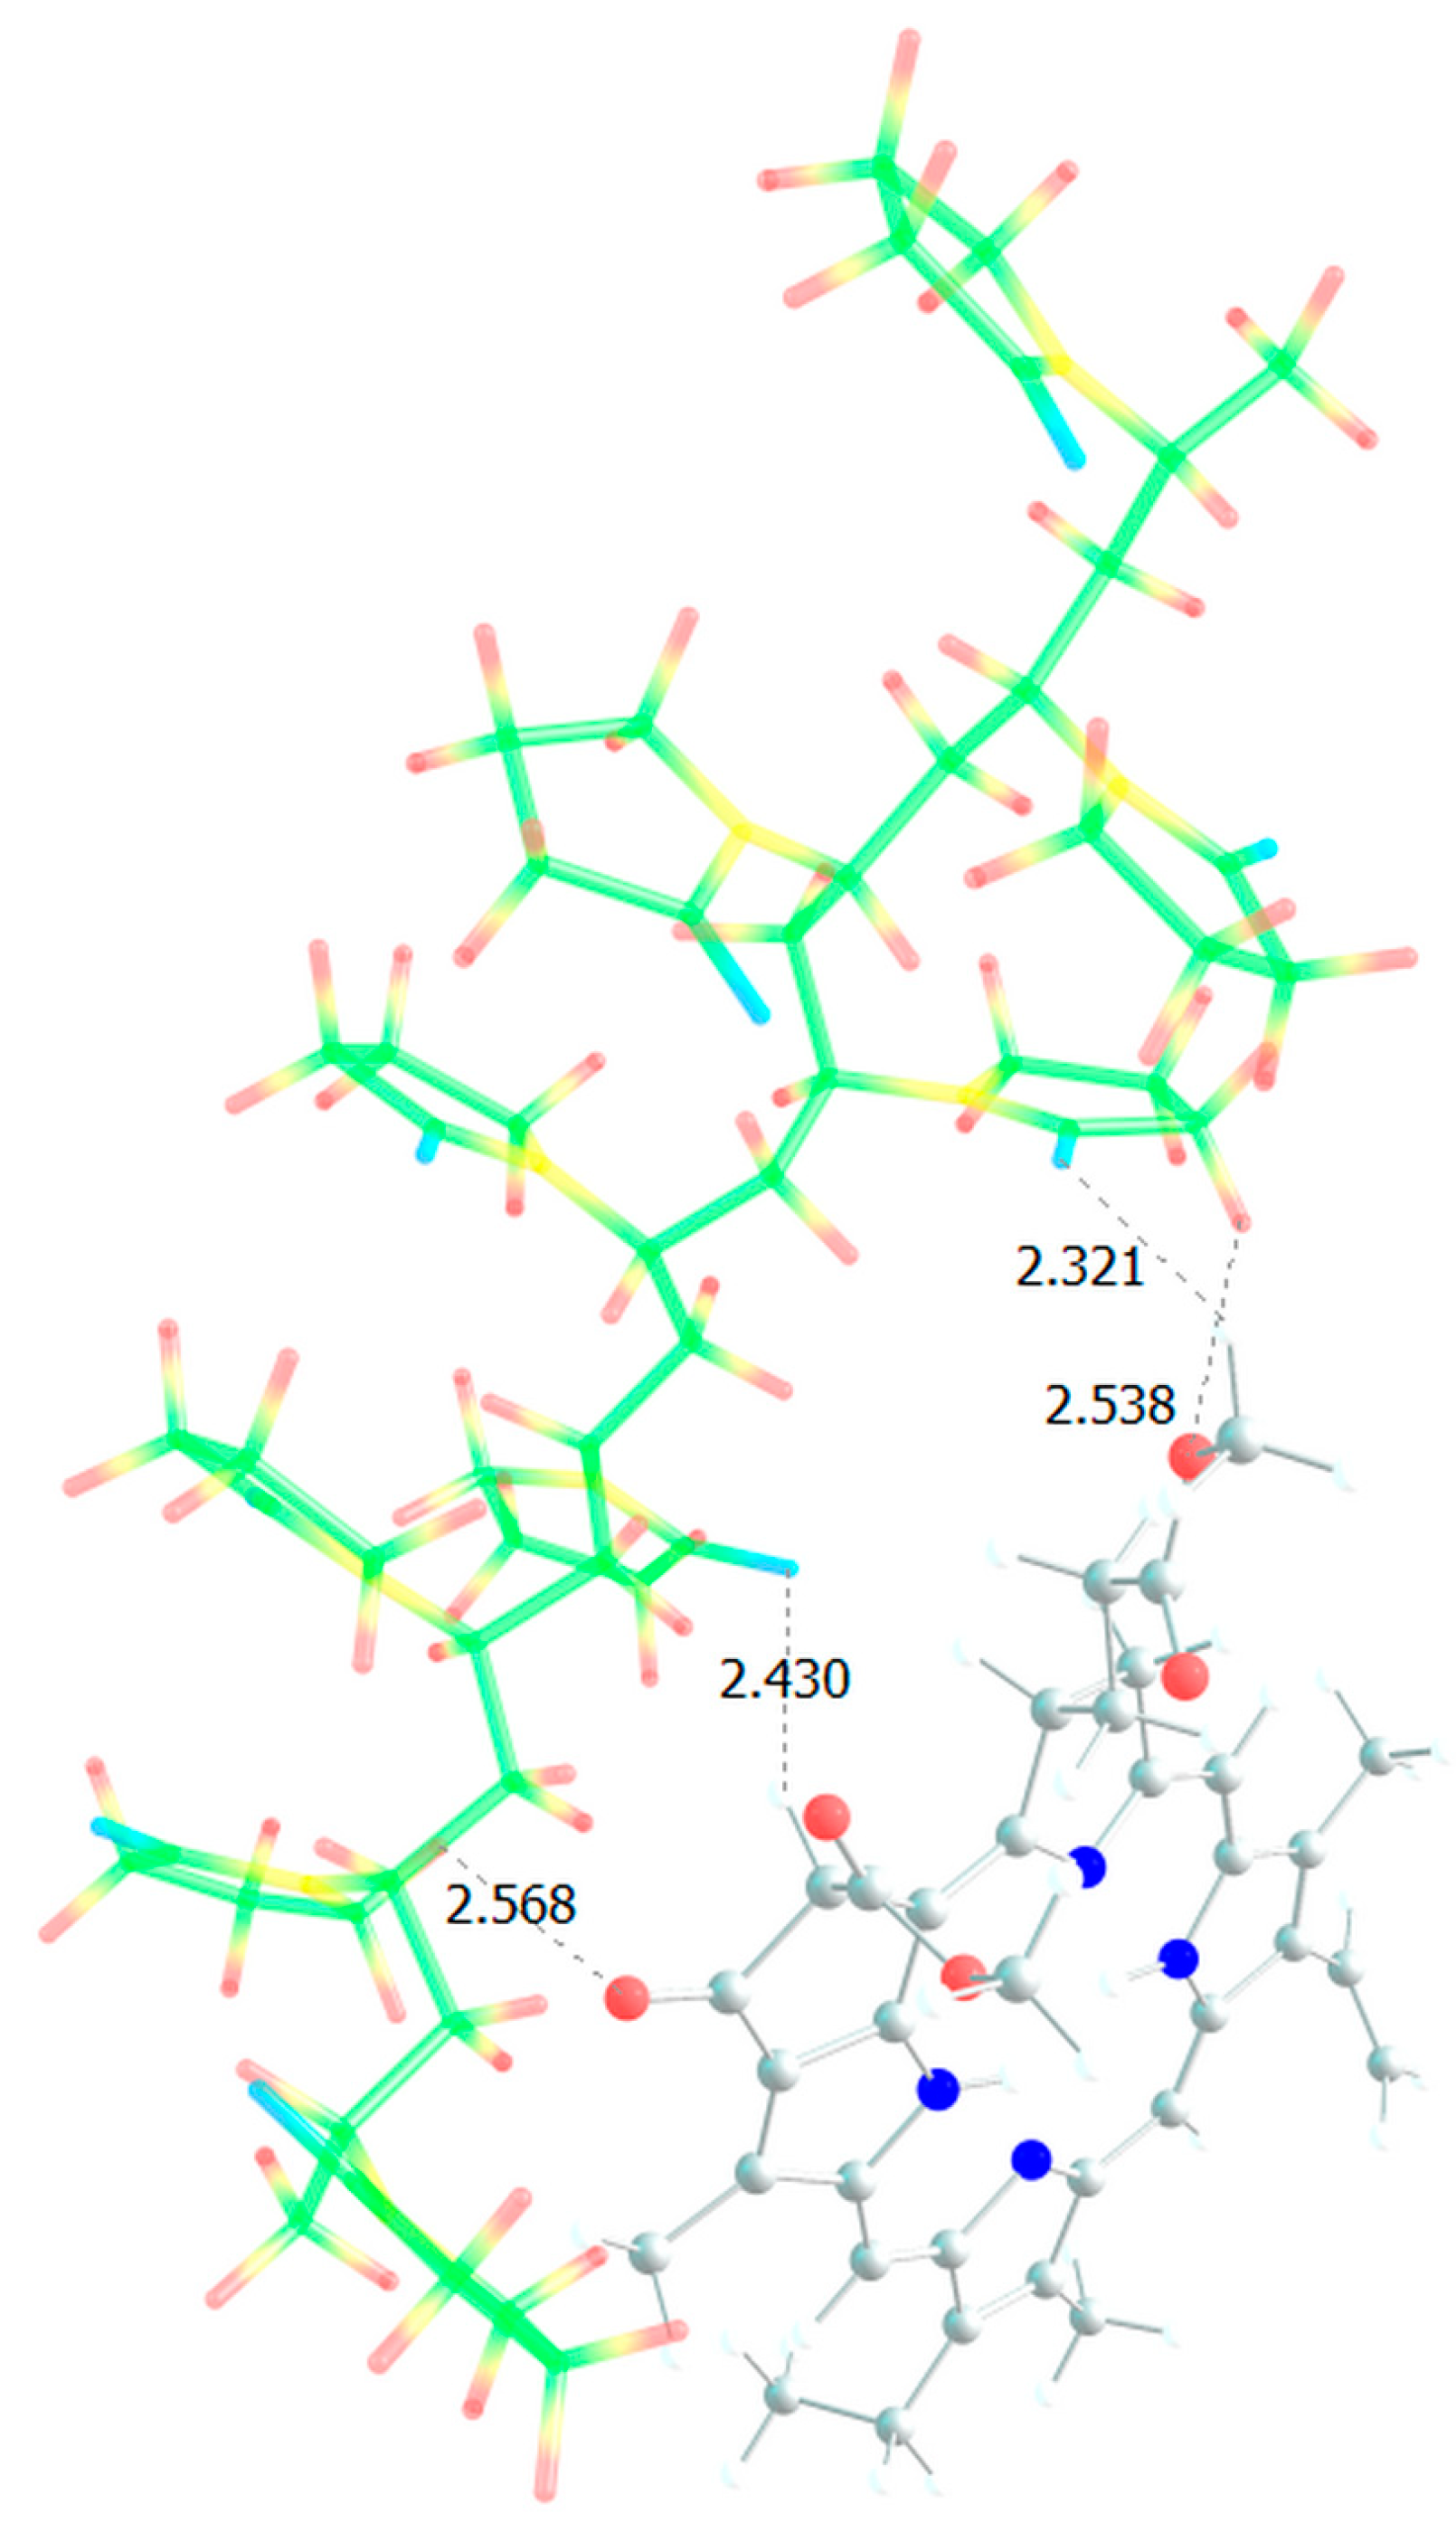
Figure 12 shows a model of the PC4 binding site − optimized geometry of the MPP-10VP complex.
It is obvious that hydrogen bonds are formed, as we saw for dimers, stronger due to the oxygen atoms of the lactam ring, and less strong due to the oxygen atoms of the MPP. That is, the PC4 system may well exist according to calculations. However, we have a terpolymer, and it is interesting to predict how the introduction of additional units will affect it. So far, from the analysis of the dimers structure, we can believe that the introduction of AA units should strengthen the connection of MPP with the terpolymer, which cannot be said about TEGDM units. To make the comparison correct, we will again take 10 units, but replace 2 of them with AA and TEGDM units. We know that TEGDM is ~4 times more active than VP and ~50 times more active than AA. Most likely, the TEGDM unit will be either at the beginning of the chain or in the center (the most active), and the AA units will be at the end of the terpolymer chain (the most inactive). As a result, we obtain a structure containing both additional units, shown in
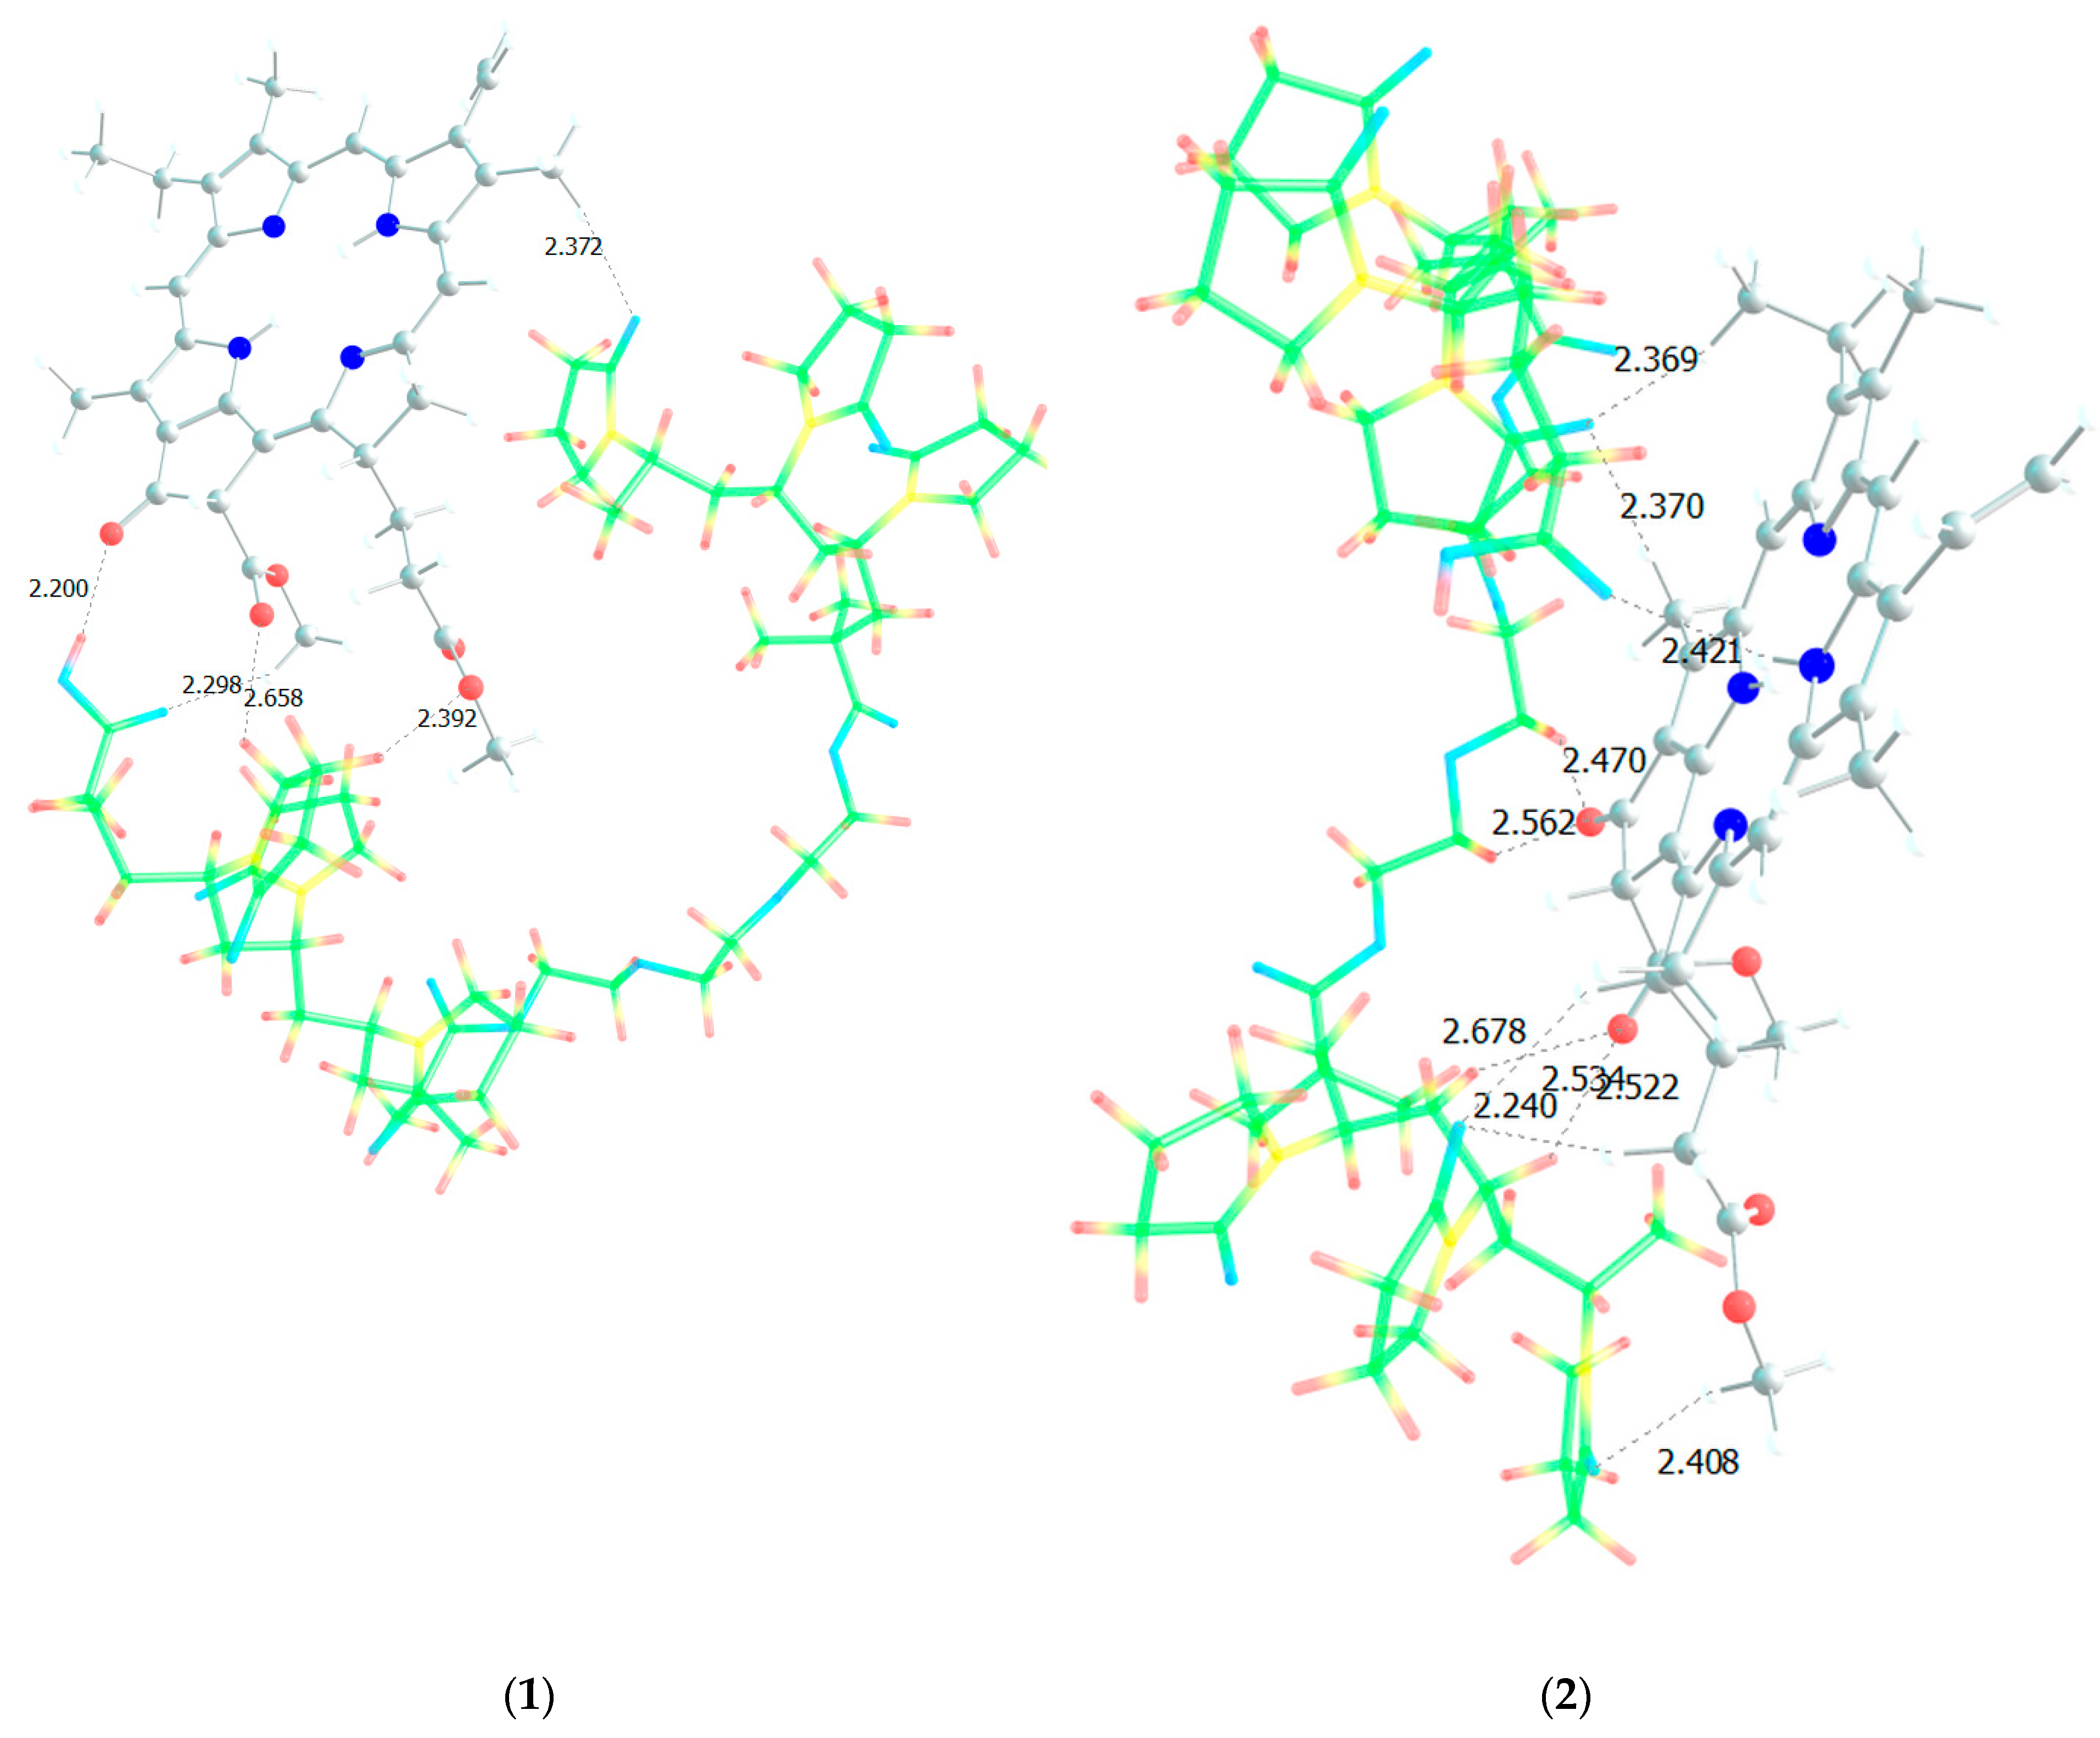
Figure 12. Next, an attempt was made to find possible strong MPP structures with this resulting site (
Figure 13).
It is easy to see that with such a binding site the MPP molecule forms more bonds and the strongest is occurred to be OH (AA)…CO(MPP), as in the previously modelled dimers. Obviously, the VP-AA-TEGDM-MPP system is stronger than the PC4 one. Quite strong, unlike model dimers, H(TEGDM)-O(MPP) bonds are added to the C=O(VP)-H(MPP) bonds. As is known, the addition of AA and TEGDM units to the composition of polymer chains will lead to the formation of a terpolymer that will have changed properties and structure compared to PVP. Copolymerization of these monomers with VP will lead to a branched copolymer structure, since acrylic acid forms side chains, and triethylene glycol dimethacrylate will contribute to the formation of soft segments in the polymer structure. Moreover, due to the addition of acrylic acid, the copolymer may have increased adsorption capacity and will be more compatible with some other compounds or surfaces due to changes in the chemical nature of the polymer. Quantum chemical calculations of the binding sites of the guest molecule MPP with VP-AA-TEGDM chains explain this by the formation of a larger number of hydrogen bonds and their greater strength.
Thus, we have developed polymer compositions of a fluorescent dye, methyl pheophorbide a based on ternary copolymers of N-vinylpyrrolidone with different structures and physicochemical properties, which, being dissolved in aqueous media, exist in the form of polymer nanoparticles loaded with ca. 1.5 — 3% dye. There are intermolecular bonds between the molecules of the encapsulated dye and the functional groups of the terpolymer that hold it in the polymer matrix.
2.8. Cytotoxicity and Intracellular Accumulation of Polymer Compositions with PC1-PC7
To study the penetration and accumulation of polymer particles in cells, polymer compositions of MPP were used, obtained by two methods and differing in the content of MPP. The introduction of MPP into polymer compositions can significantly change their biological activity, including cytotoxic properties. On the other hand, the structure and characteristics of terpolymers may influence the ability of MPP to accumulate in cells. It was investigated the effect of native MPP and PC1-PC4, as well as PC5-PC7 on the viability of
FetMSC and
HeLa cells. The studied compositions at a maximum concentration of 1 mg mL
-1 (MPP content either 15 or 34 mg mL
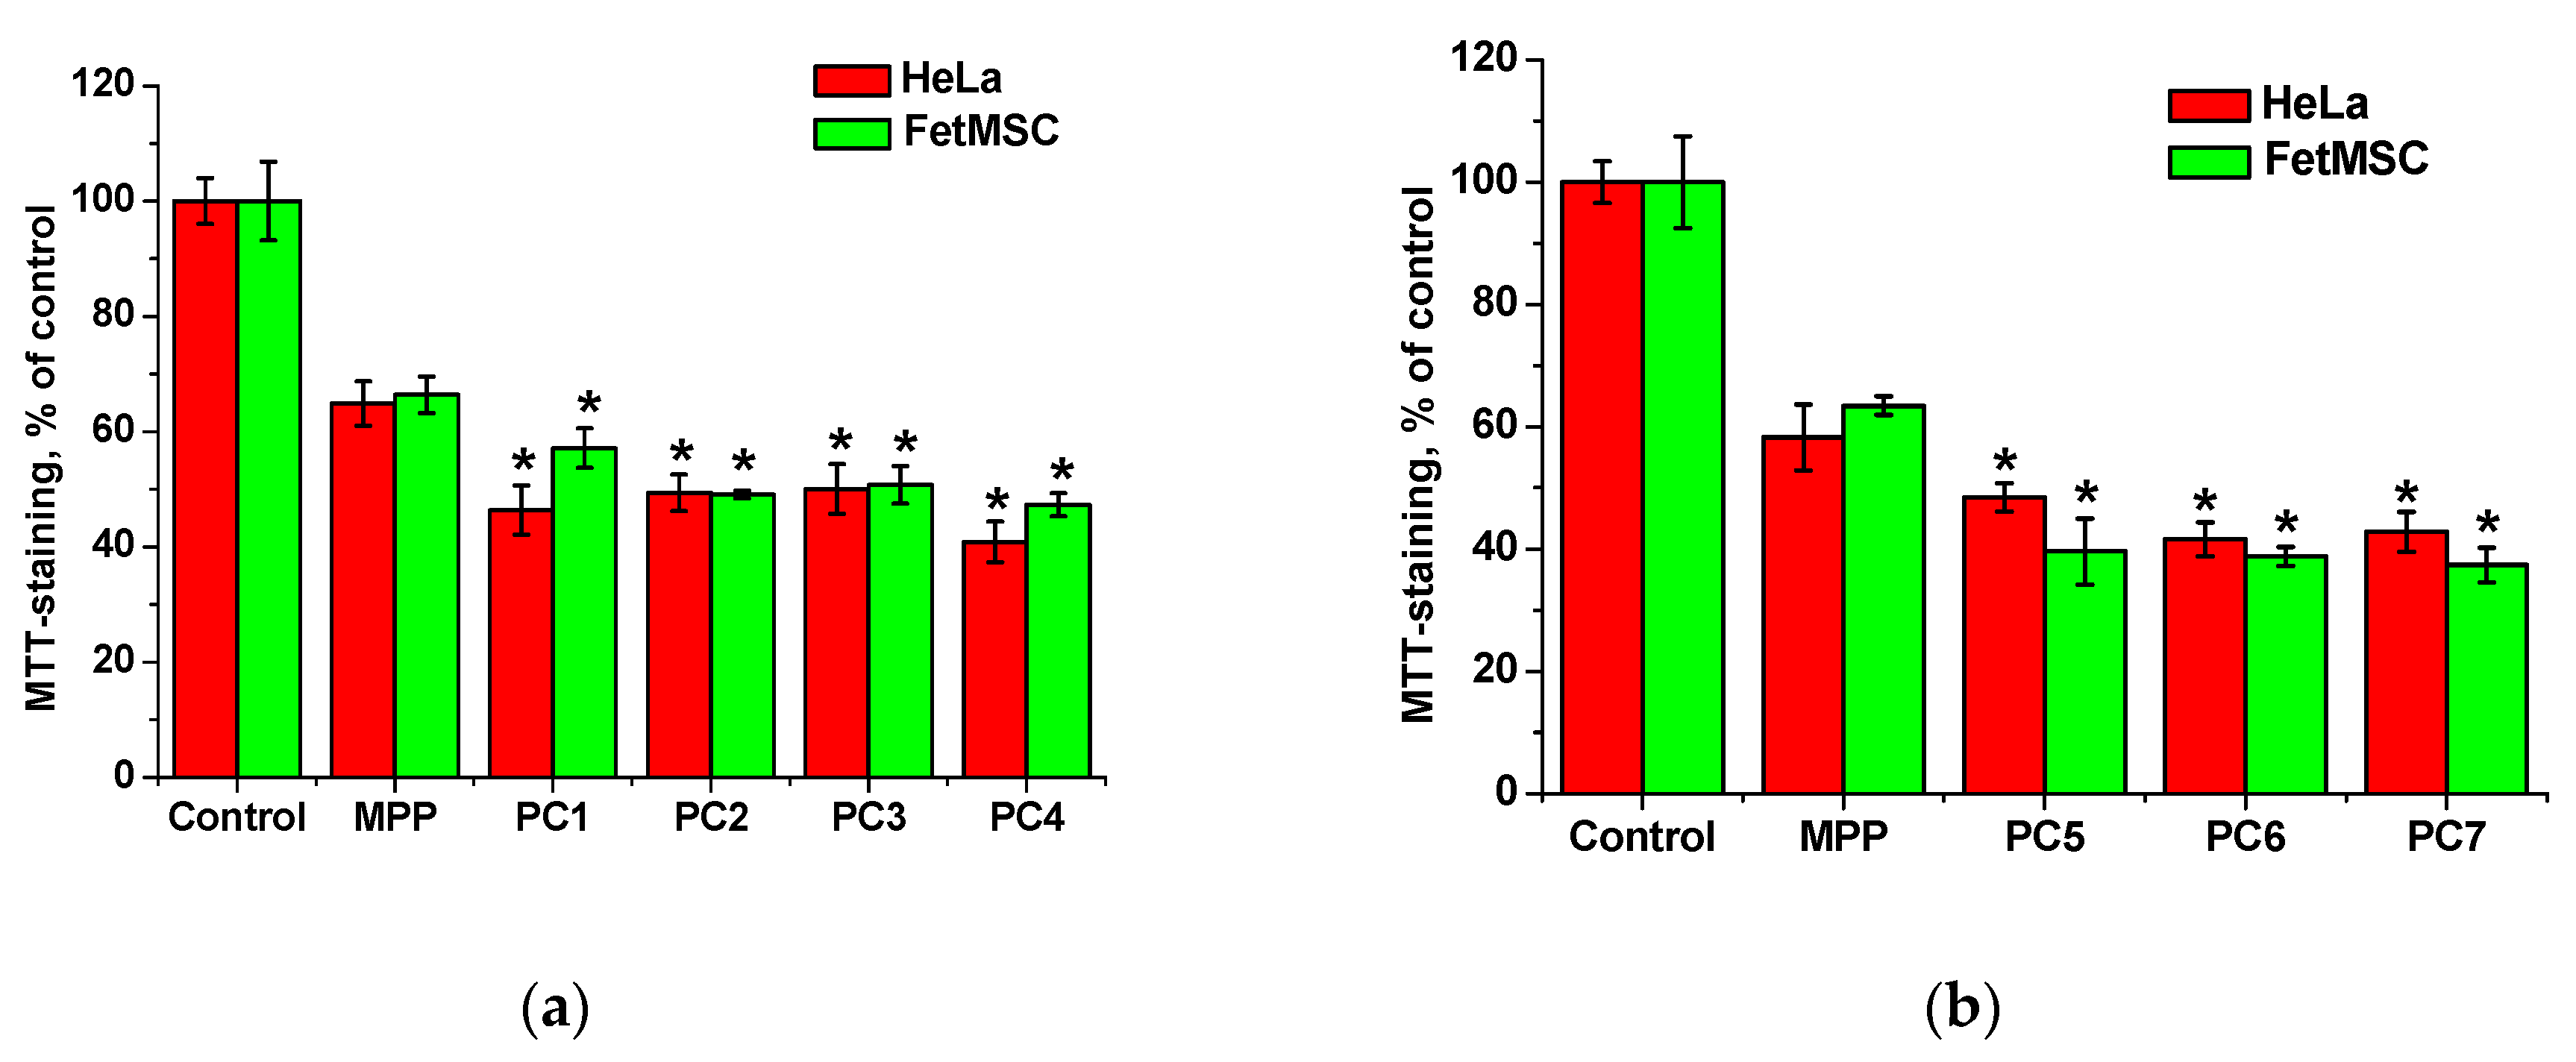
-1) were compared with native MPP at similar concentrations with exposure as long as 72 h. Main results are represented on
Figure 14.
From the data shown in
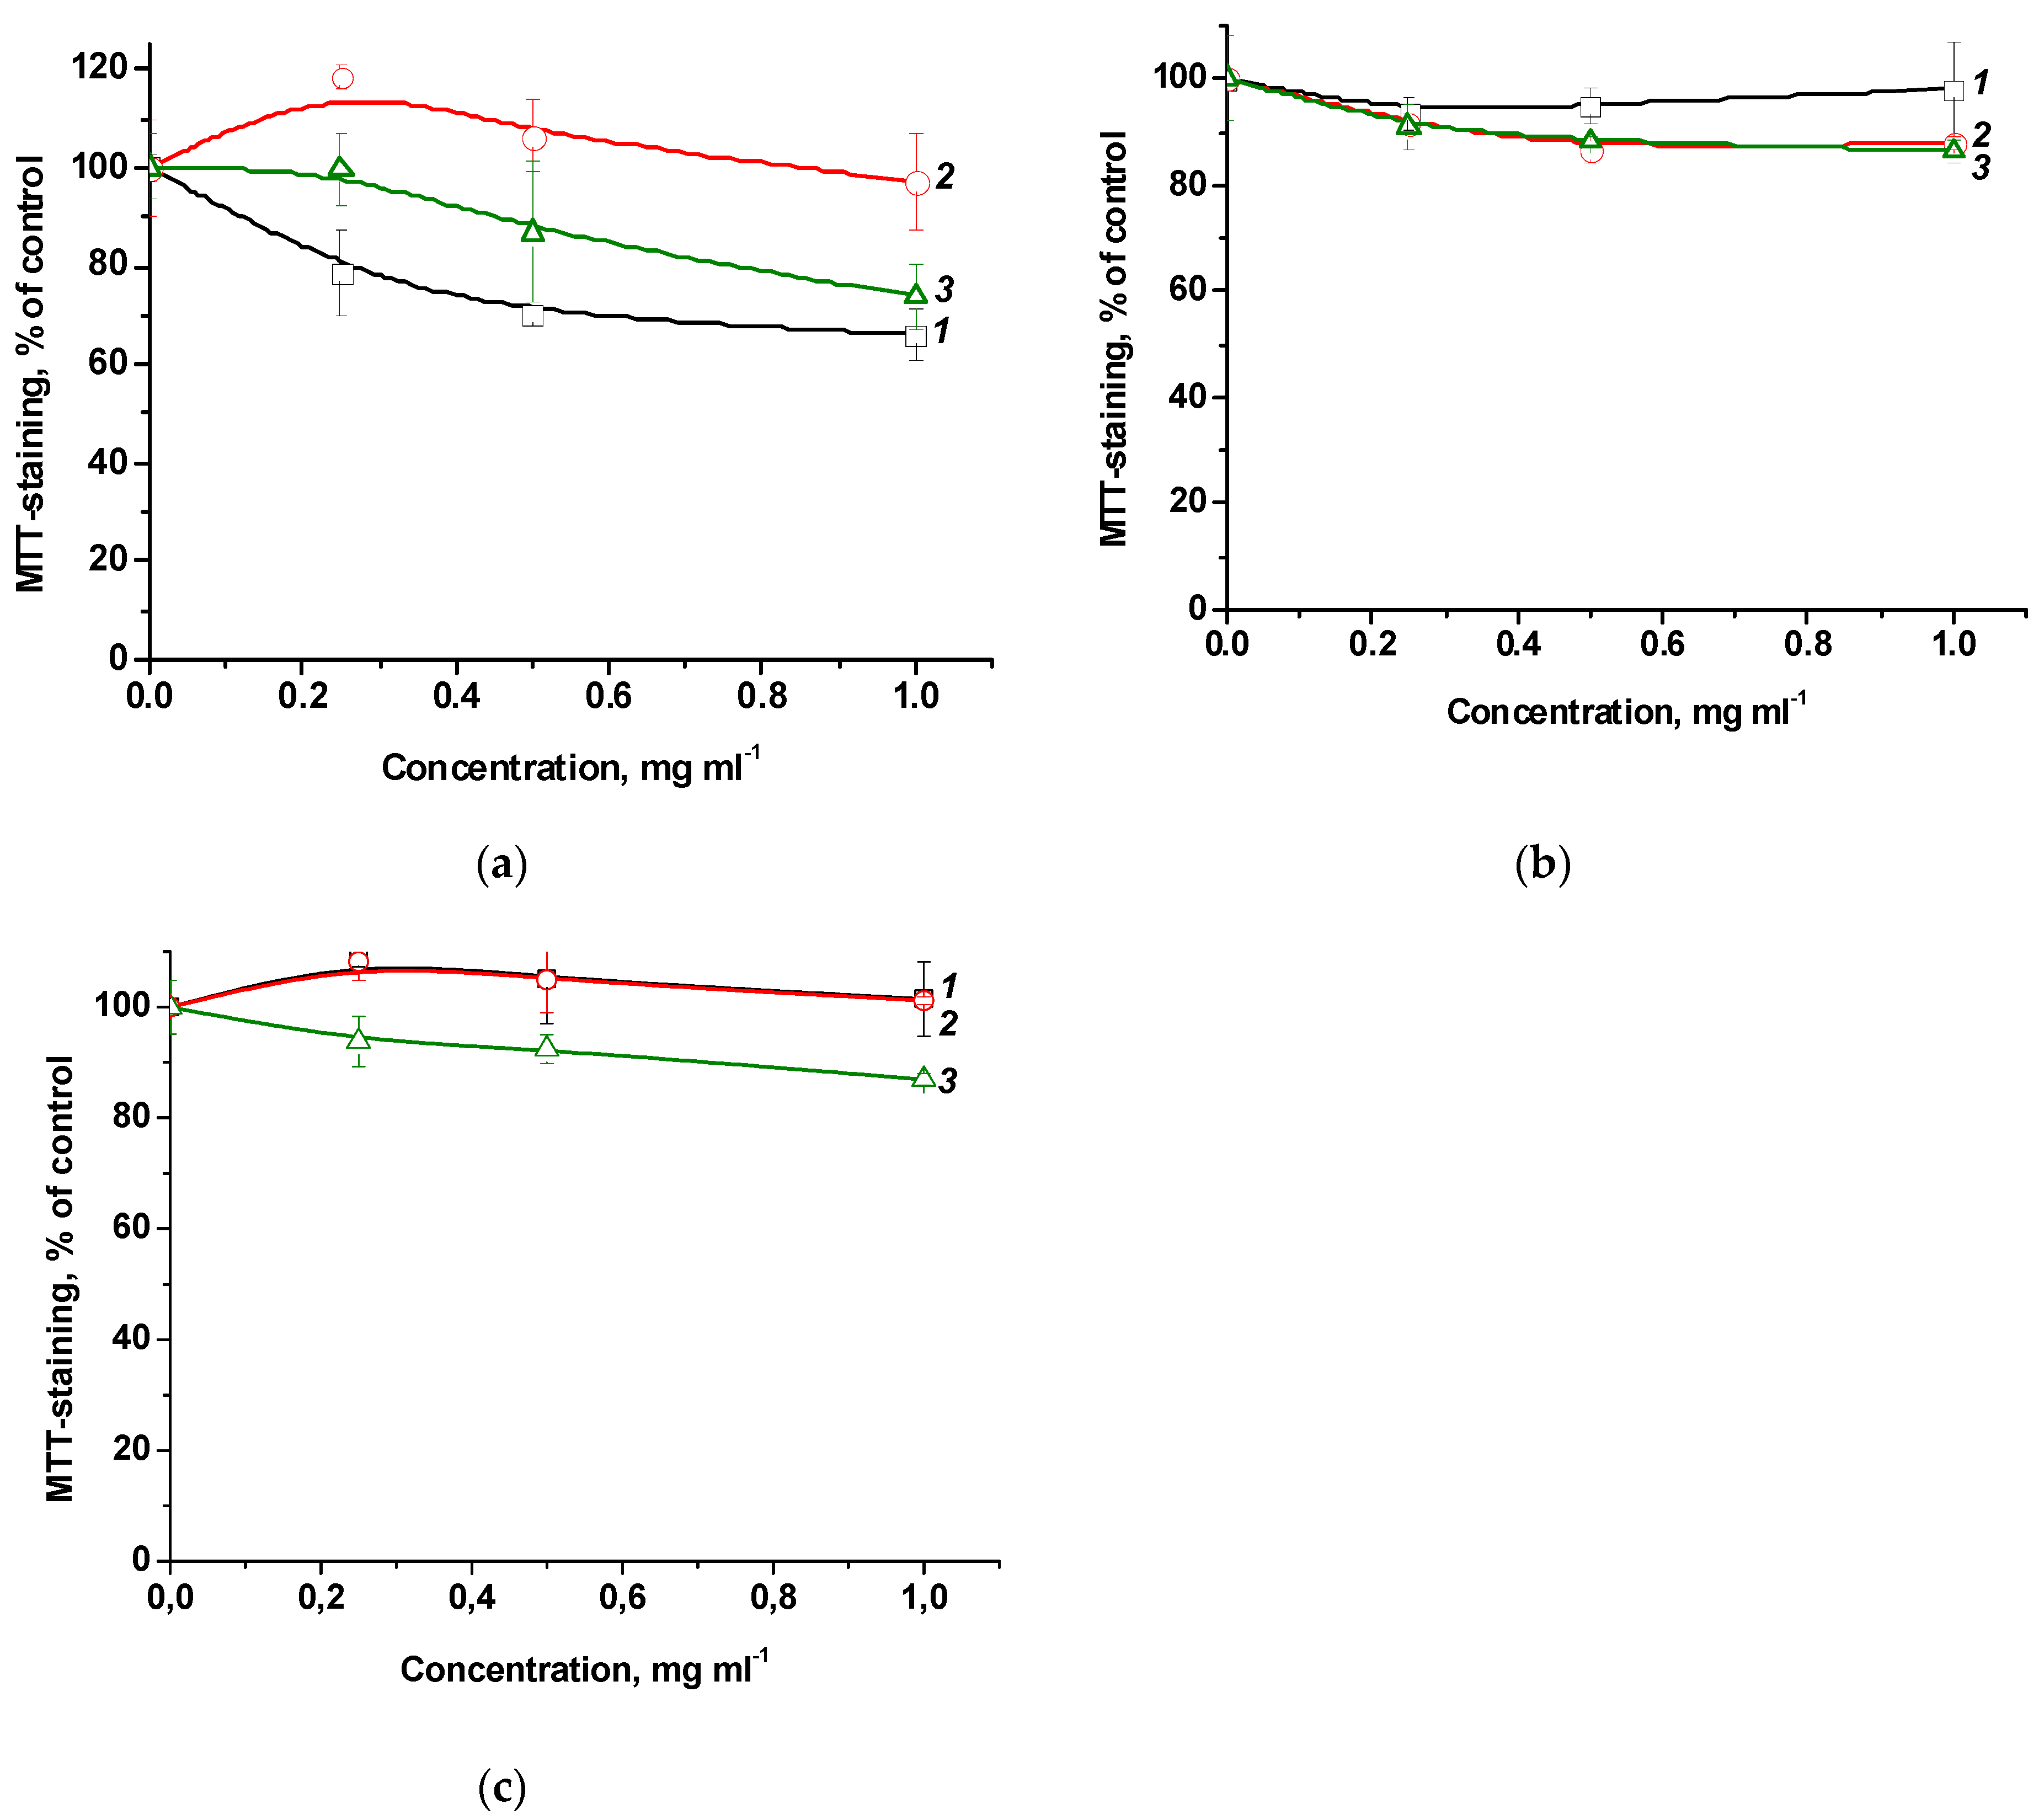
Figure 14, it follows that MPP, regardless of concentration, causes a decrease in the viability of both non-tumor and tumor cells by ~40% relative to the control. The cytotoxic effect of MPP in polymer compositions was enhanced in all cases. Since this effect cannot be explained by the cytotoxic activity of the copolymers (
Figure 6), it can be assumed that the nanoparticles significantly influenced the accumulation of MPP in cells. The effect of lower (0.03 to 0.5 mg mL
-1) concentrations of polymer compositions with MPP on the viability of non-tumor and tumor cells was investigated (
Figure S6). It was found that compositions with different MPP contents differed significantly in the severity of the cytotoxic effect. So, polymer compositions PC1, PC2, PC3 containing ~1.5% MPP at low concentrations did not cause a significant decrease in cell viability, while similar polymer compositions PC5, PC6, PC7 containing
ca. 3.4% MPP even at the minimum concentration reduced MTT staining by 20-30% relative to the control. Interestingly, compositions containing 1.5% MPP were less toxic to non-tumor cells (
Figure S6a) compared to tumor ones (
Figure S6b). It can be assumed that this effect is associated with a more rapid accumulation of nanoparticles in tumor cells. Another interesting fact is that the use of the PC4 polymer composition based on PVP led to the same decrease in cell viability of both lines as the use of the PC5-PC7 polymer compositions with 3.4% MPP.
Figure S6 shows that curves
4-6 and
7 almost completely coincide.
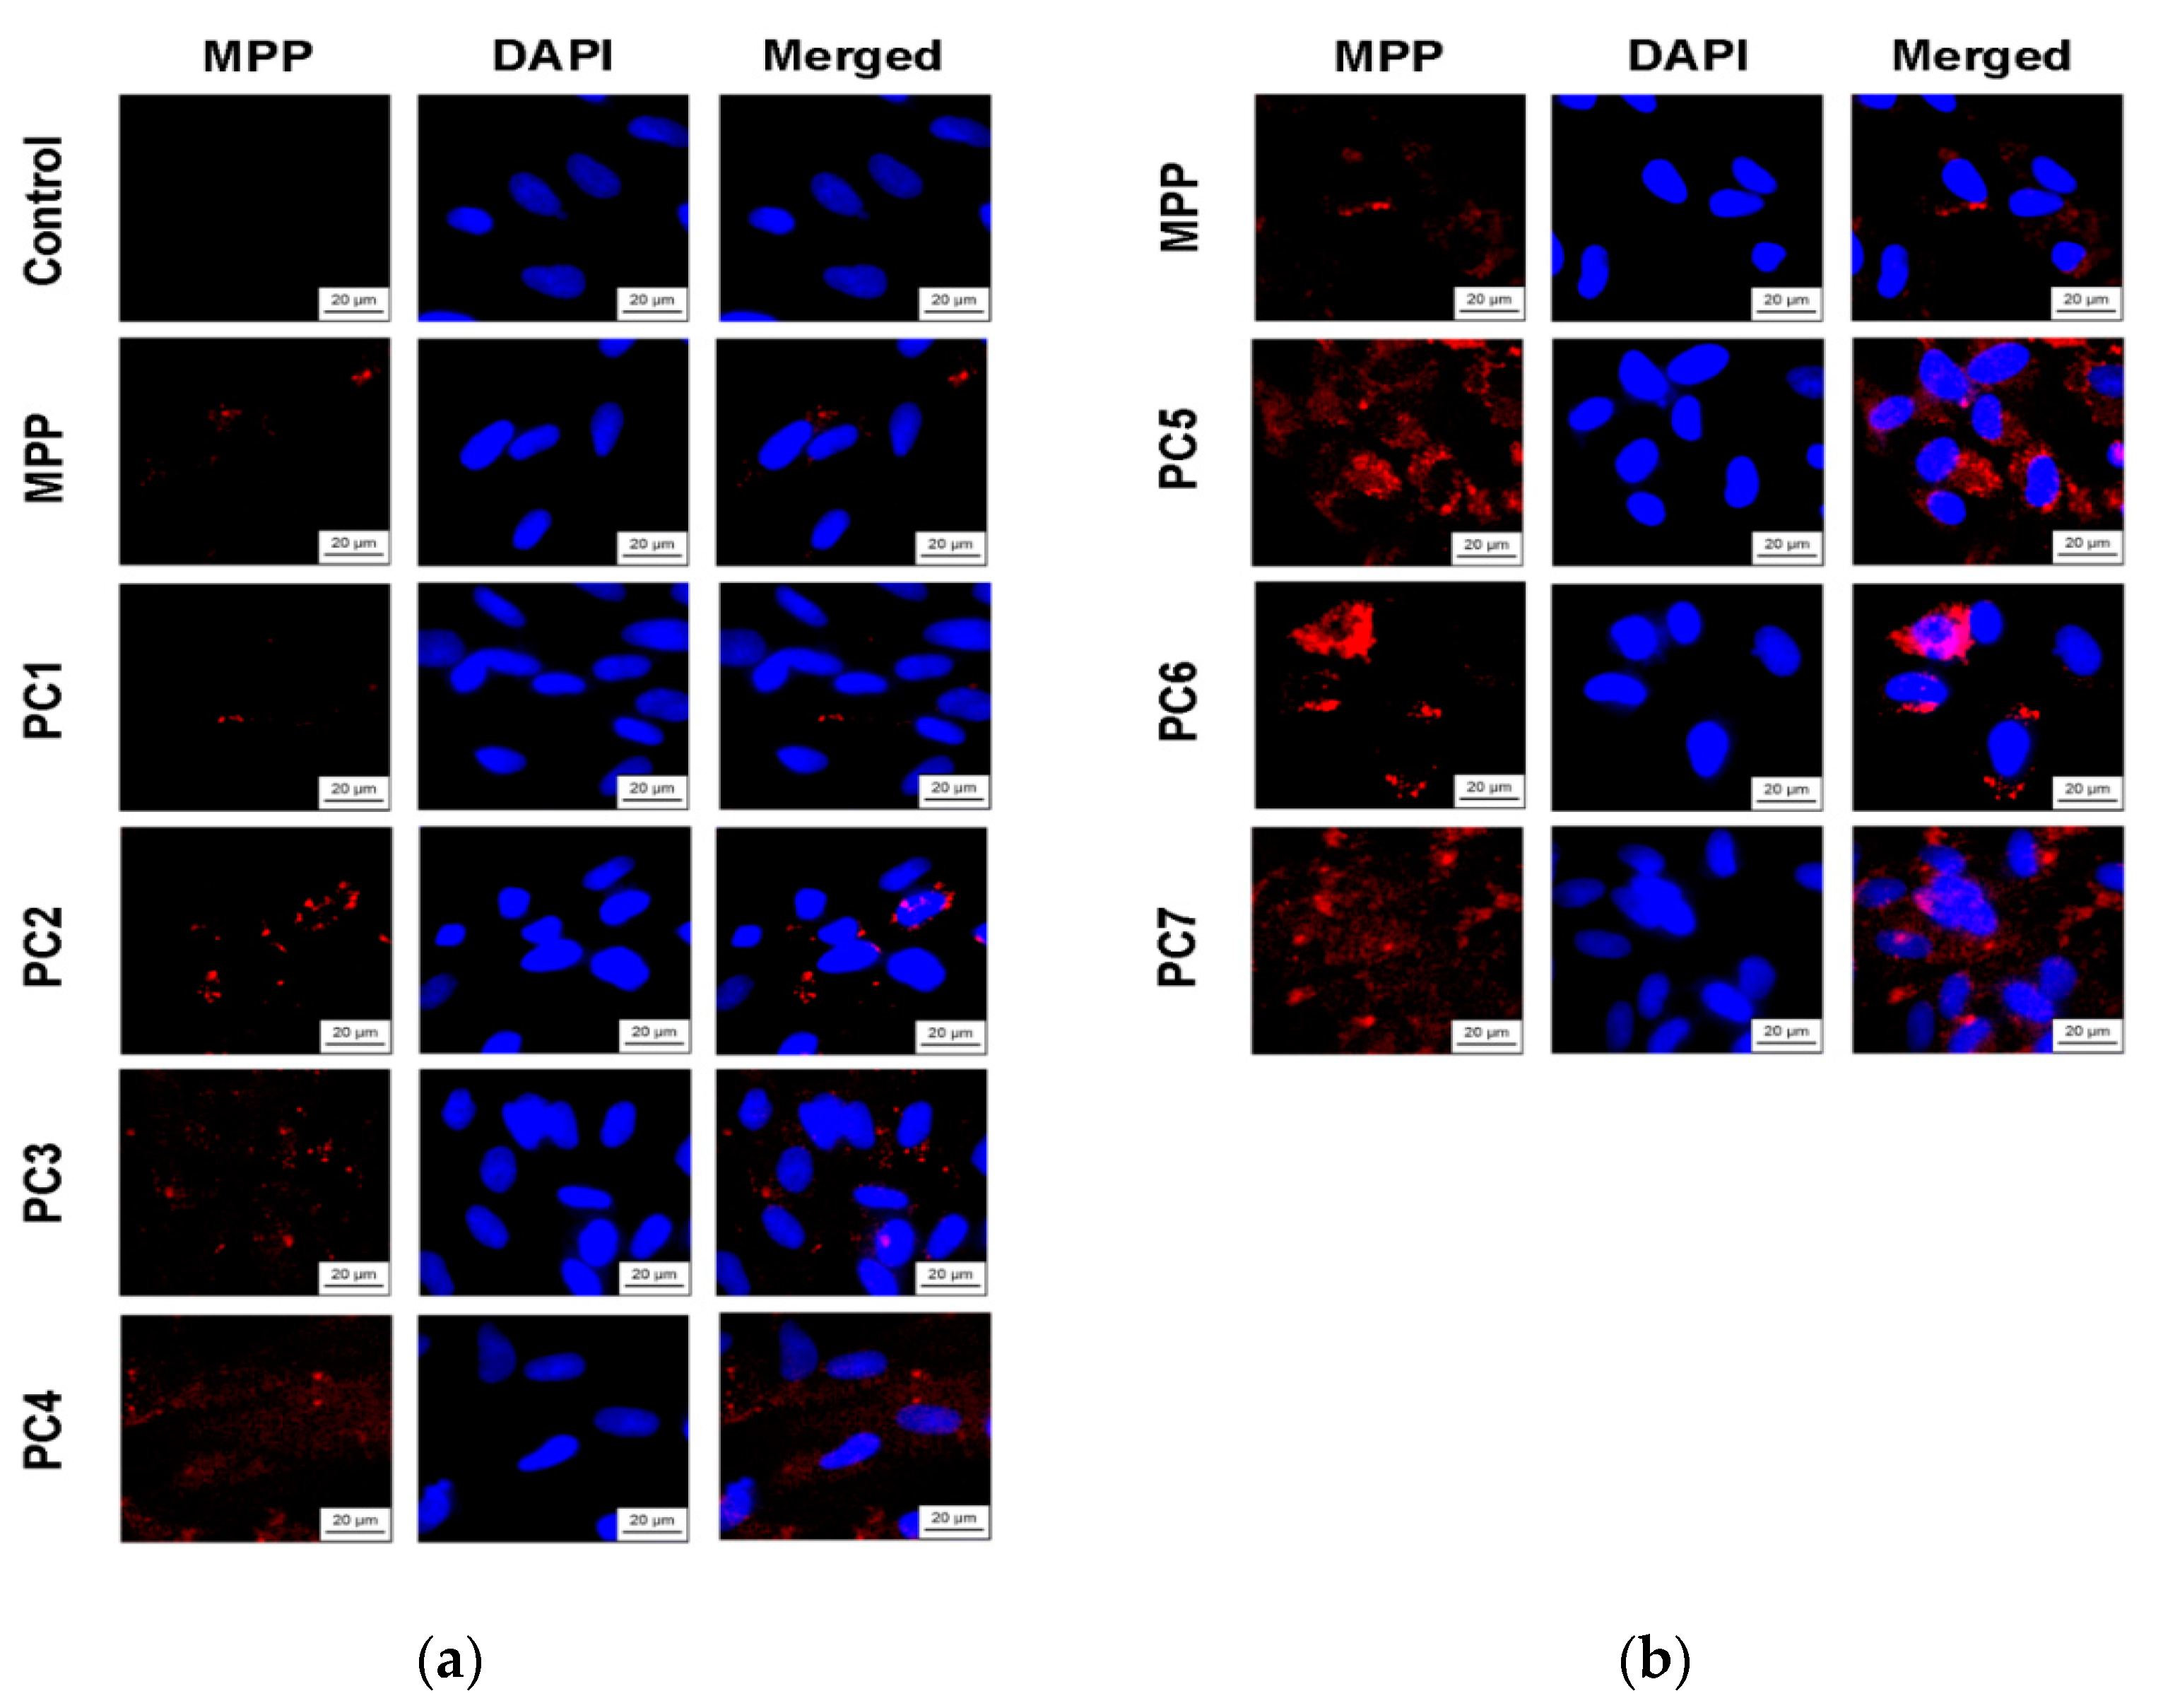
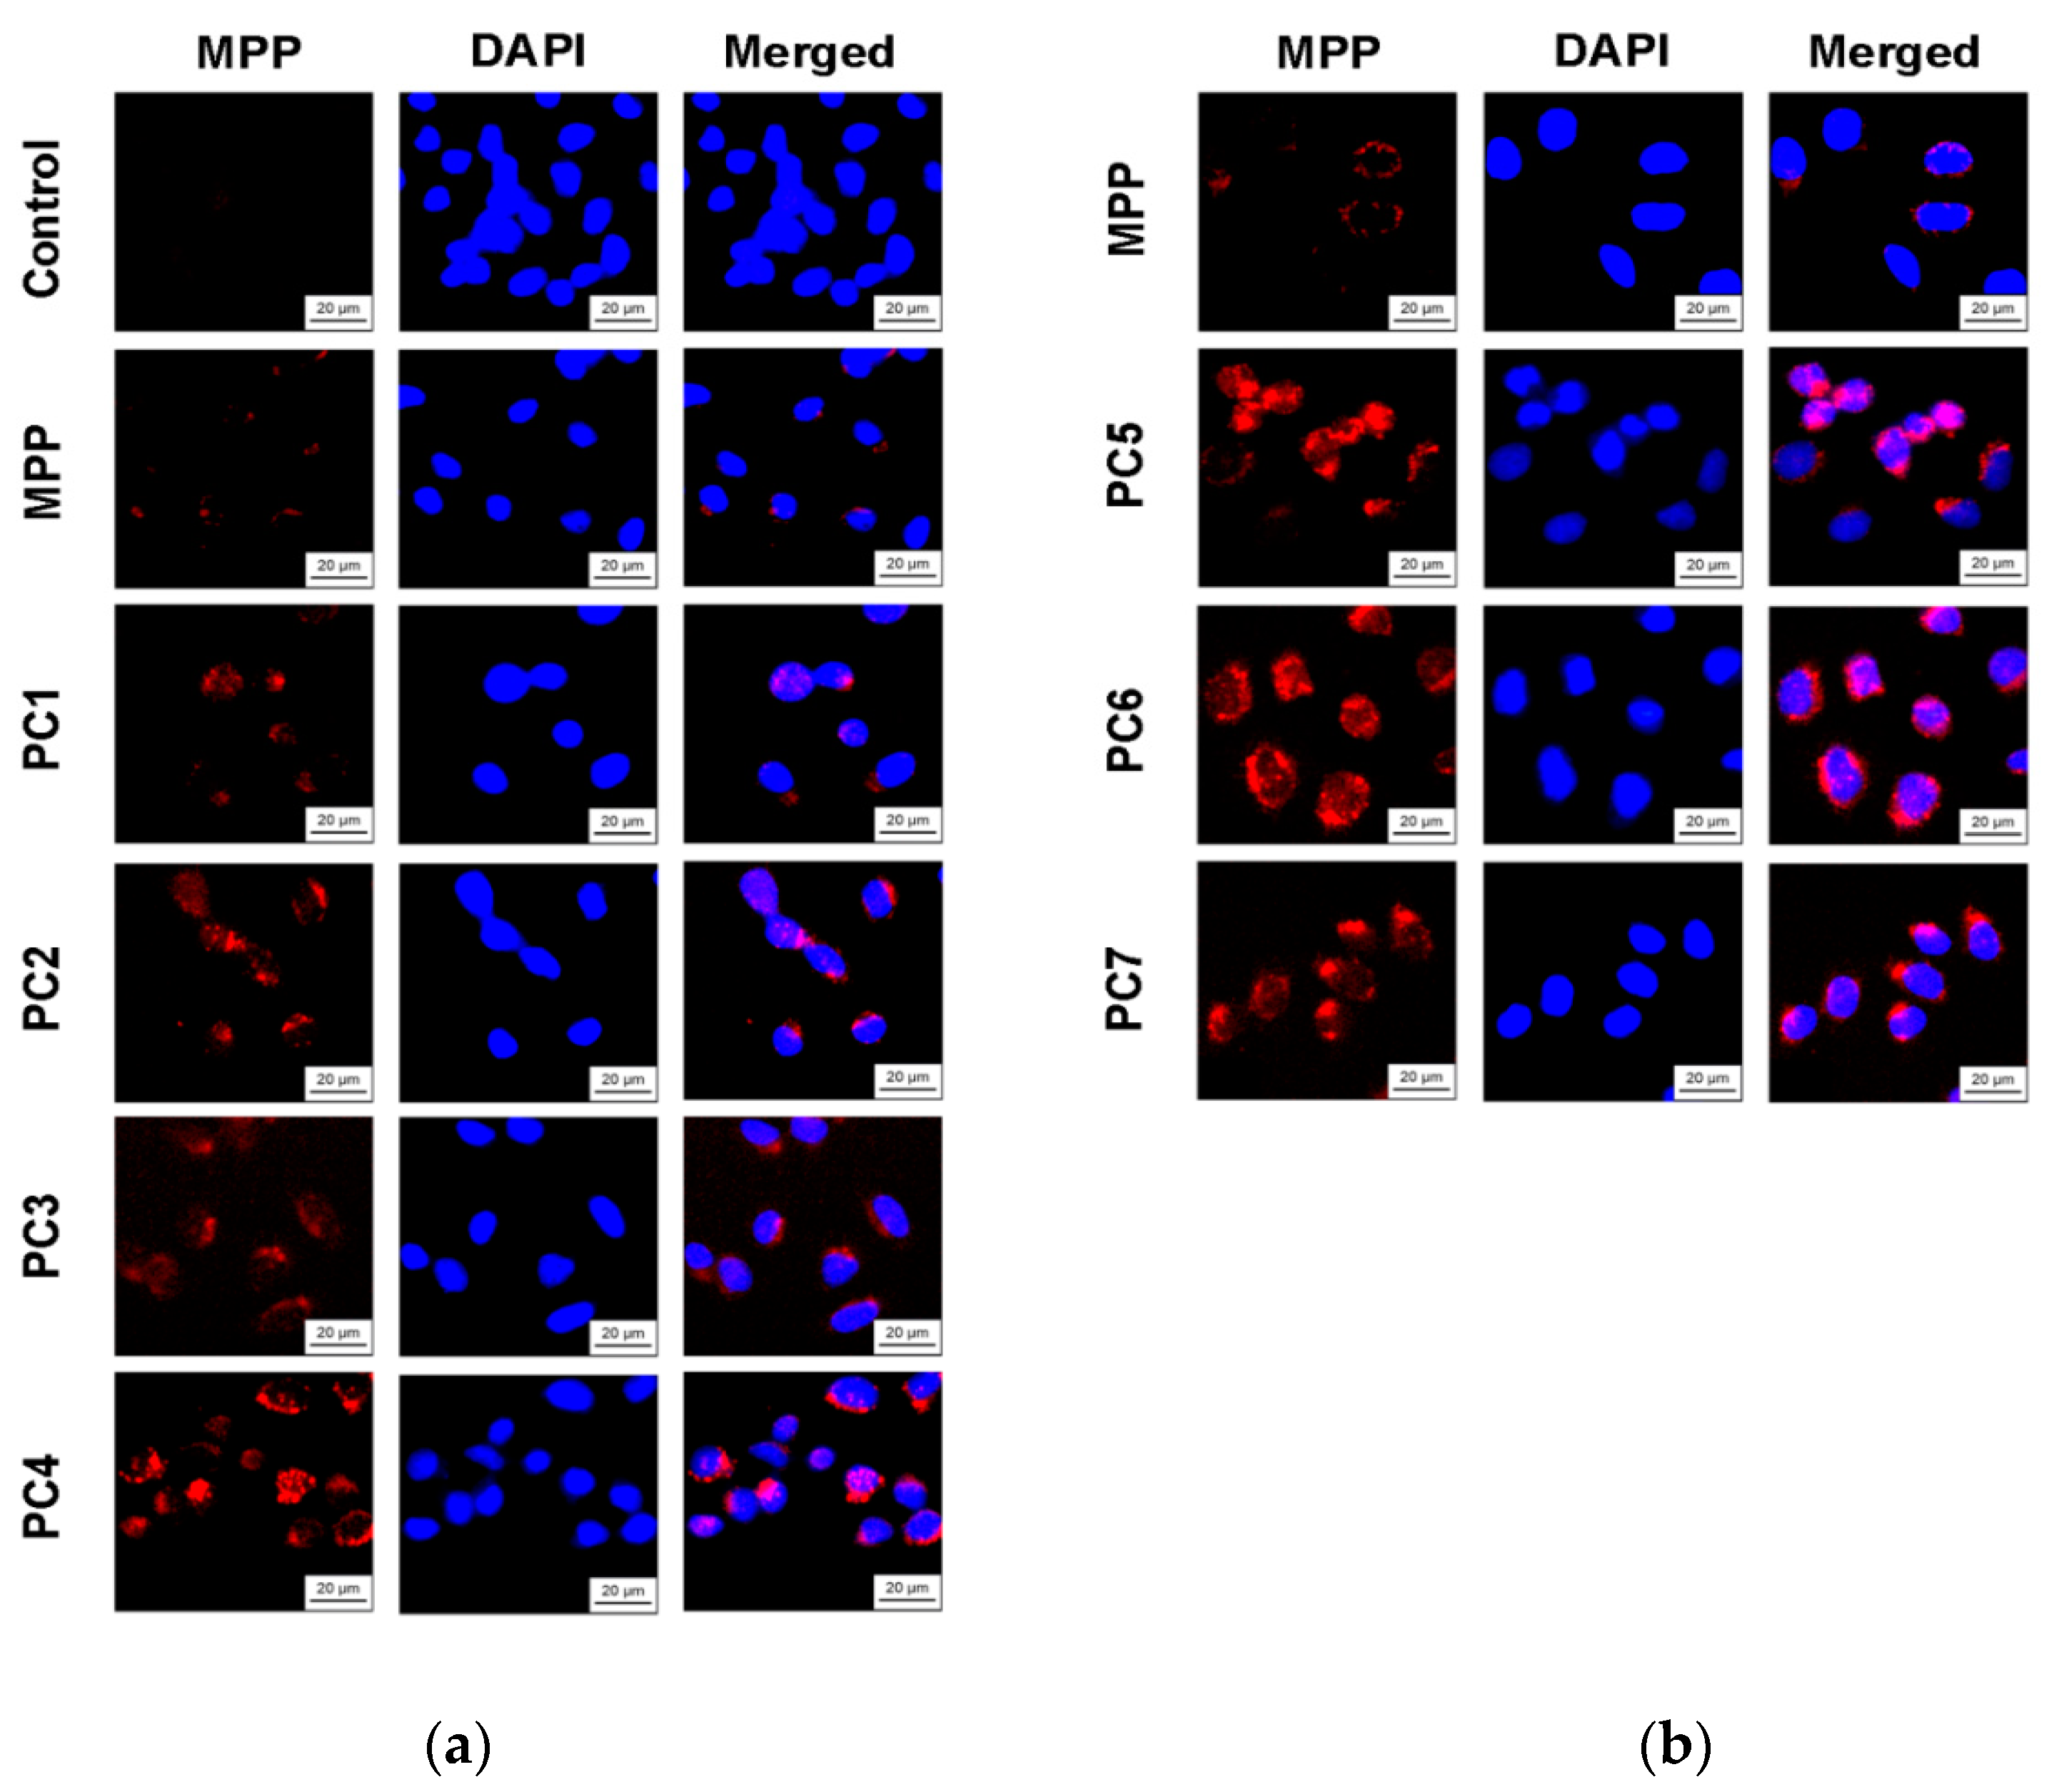
Since we assumed that the use of nanoparticles significantly changes the rate of accumulation of MPP in non-tumor and tumor cells, the accumulation of polymer compositions and native MPP was studied using fluorescence microscopy at high concentrations of nanoparticles (1 mg mL
-1) and short exposure of 6 h. The microscopy results are presented in
Figure 15 and
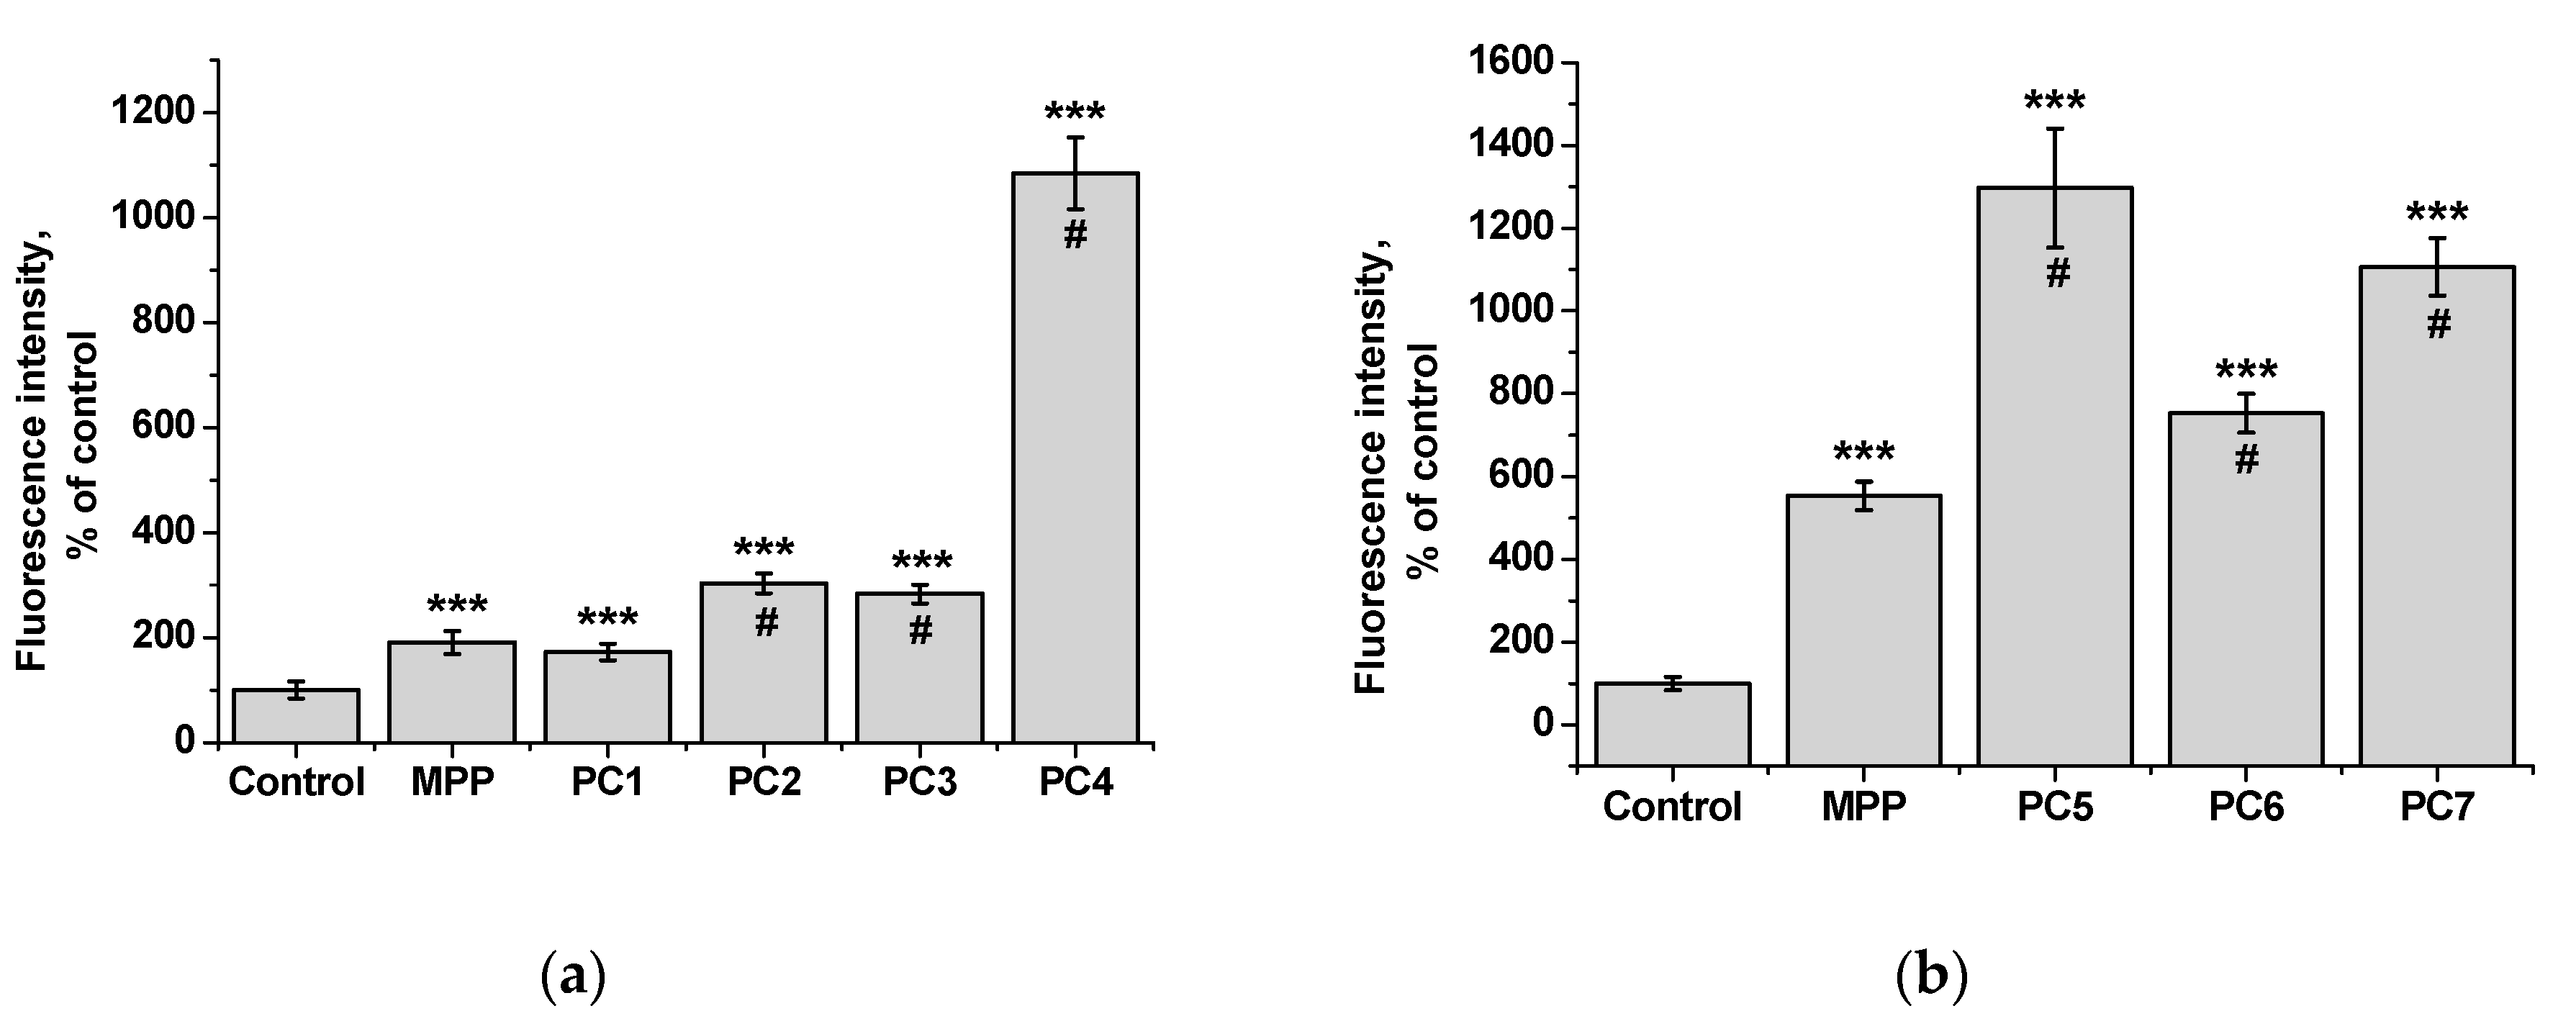
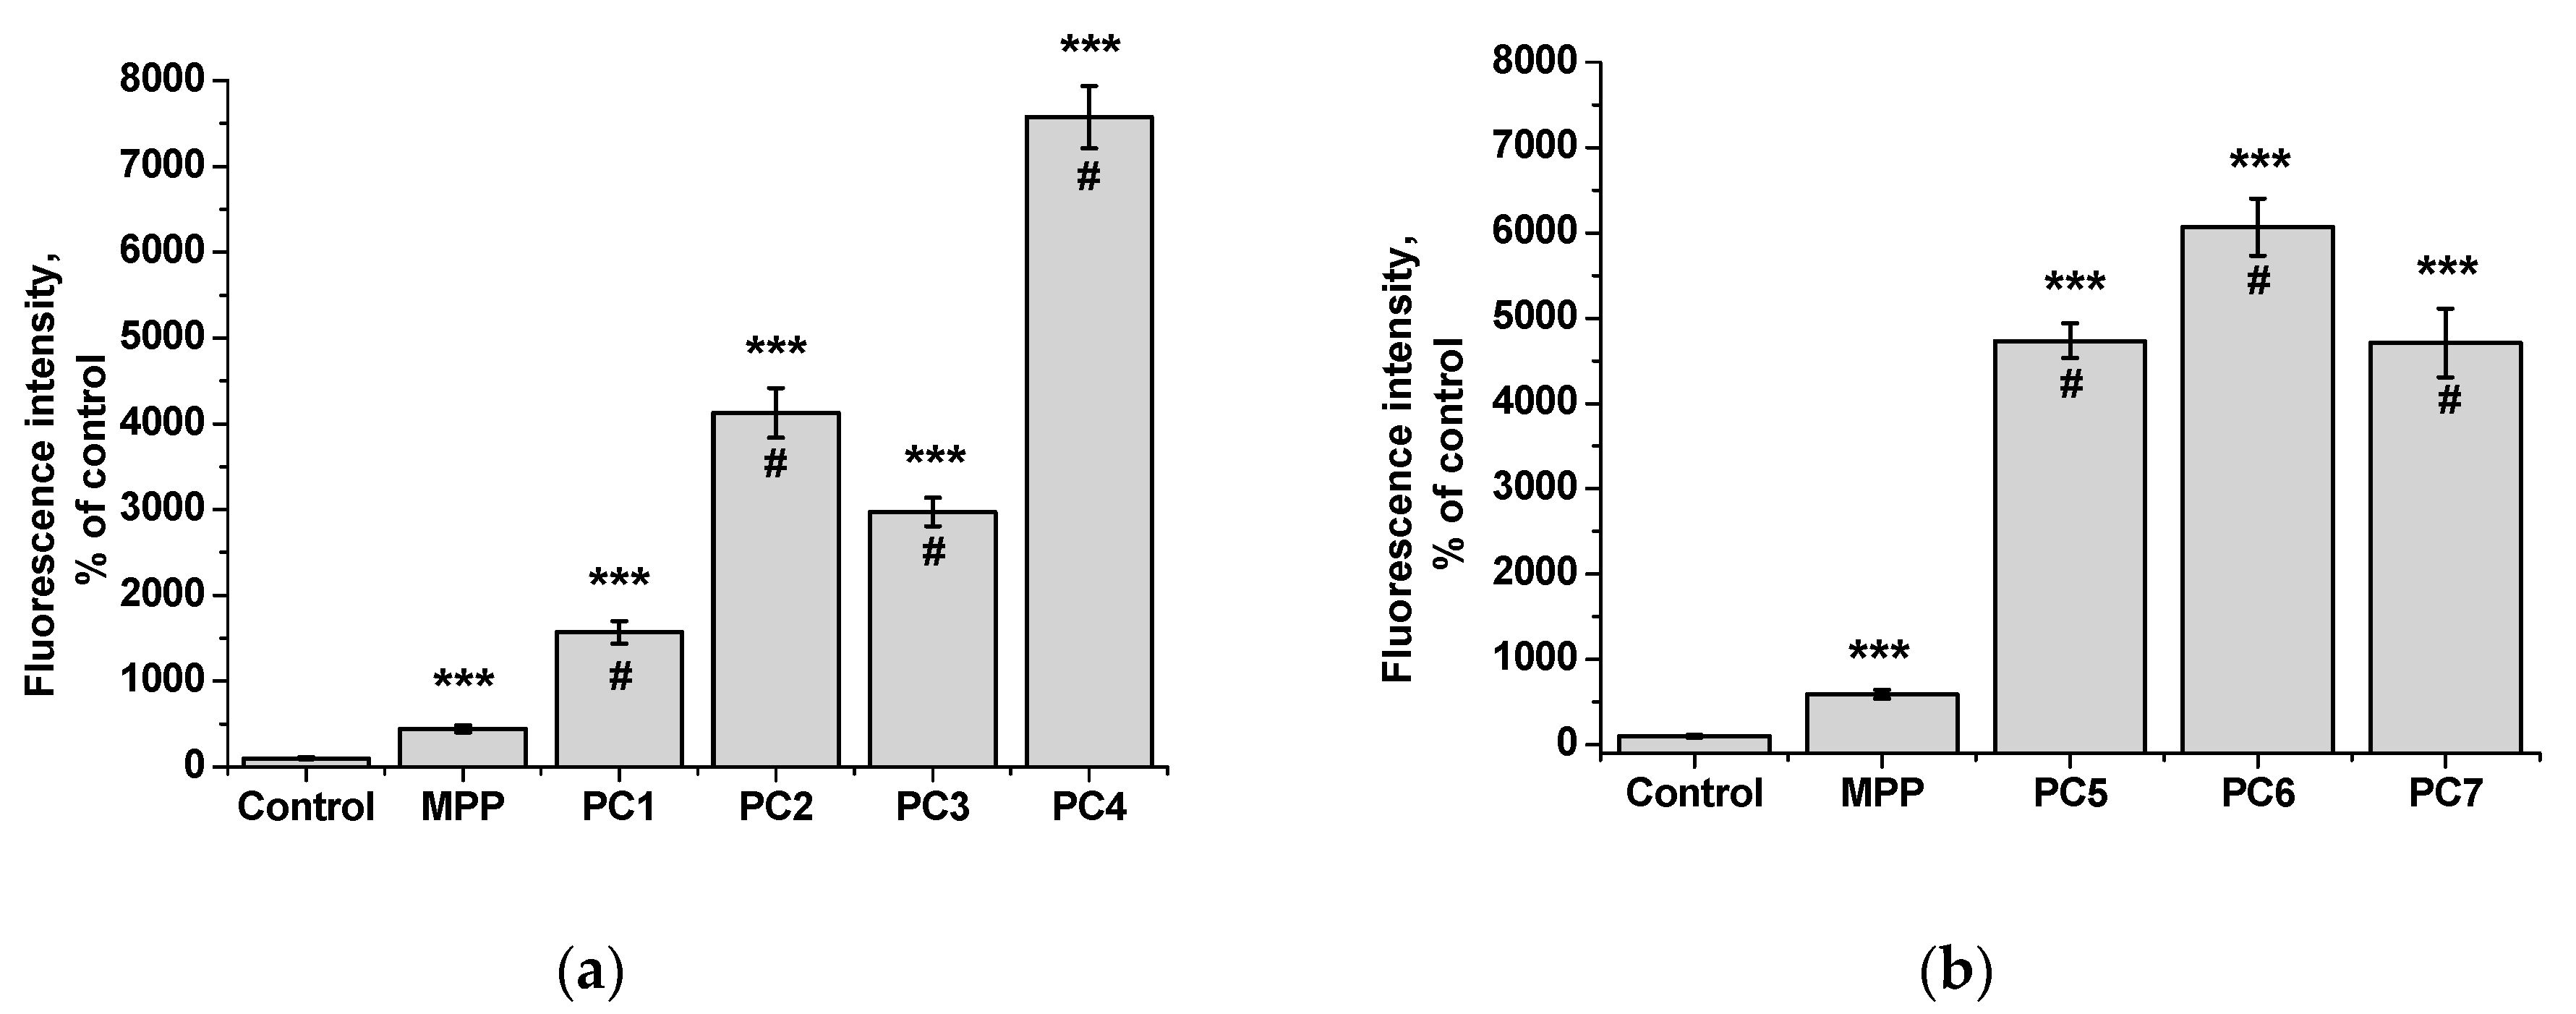
Figure 17, quantitative analysis of fluorescent staining is shown in
Figure 16 and
Figure 18.
From the data presented it follows that the use of nanoparticles in most cases increased the accumulation of MPP in both non-tumor and tumor cells. However, the ability to accumulate MPP nanoparticles with different cell types varied significantly. Thus, for PC1-PC3 in
FetMSC cells, an increase in fluorescence intensity was observed by 2—3 times relative to the control (which is close to the indicators of native MPP), and in tumor cells - by 16—30 times. For the PC5-PC7, an increase of 8—13 times relative to the control was detected in non-tumor cells, while in
HeLa cells an increase of 50—60 times was detected. As in the case of the effect on cell viability, PC4 nanoparticles in terms of MPP accumulation were close not to the group of polymer compositions containing 1.5% MPP, but with 3.4% MPP. Moreover, this effect was manifested in both cell lines. If to compare the data on the cytotoxicity of nanoparticles with data on their intracellular accumulation, one can conclude that polymer compositions containing 3.4% MPP cause a significant increase in the content of MPP in cells, which is accompanied by an increase in their toxicity for both types of cells. The use of a polymer composition containing linear PVP (PC4) as a copolymer significantly increased the intracellular accumulation of MPP compared to compositions based on terpolymers. This is likely due to the rapid release of MPP from PVP-based polymer particles and the resulting increase in fluorescence. From polymer nanoparticles based on terpolymers, densely packed macromolecular structures, the release of MPP occurs more slowly and its fluorescence is lower during the observation period. This assumption is based on data from studying the interaction of polymer nanoparticles with biological objects - liposomes and highly diluted mouse subcellular brain homogenate [
28] and the observed increase in MPP fluorescence as a result of release from NPs; the release rate depends on the structure of the polymer matrix. Thus, nanosized systems based on terpolymers have great prospects from the point of view of prolonged action of MPP. By controlling the composition of copolymers, their degree of branching and the density of molecular packaging, it is possible to regulate effectively the rate of release of MPP and the duration of its action as a fluorescent diagnostic agent and a photosensitizer in photodynamic therapy of oncological and microbial diseases.
