
Submitted:
04 June 2024
Posted:
06 June 2024
You are already at the latest version
Abstract
The link between the world of communication and the world of racing is provided by telemetry systems in electric racing cars. These systems send real-time data about the vehicle’s behavior and systems to enable informed decisions during the race. The aim of this research was to integrate telemetry into the battery bank of a racing electric vehicle to find the optimal values of current and voltage that optimize the charging process, thus improving the vehicle’s performance in competition using Response Surface Analysis. Particularly, the telemetry system consisted of an Arduino Mega, a digital wattmeter, and temperature sensors, all installed in the vehicle. Once the telemetry data was obtained, a response surface design was adapted with current, voltage, and temperature as factors, varying from low to high values, with the objective function being to minimize the battery’s charging time. Applying the response surface methodology and the steepest descent algorithm, it was found that all factors significantly affect the charging time, with the minimum charge time being 6961 seconds, obtained with a current of 2.4 amps and voltages of 50.5 volts and 43.6 volts.
Keywords:
Battery bank optimization
; Battery management system
; Electric vehicles
; Lithium-ion batteries
; Response surface methods
1. Introduction
According to the [1], 65% of global greenhouse emissions are due to carbon dioxide attributable to fossil fuel and industrial processes. The energy transition is an urgent need faced by various industries, primarily the automotive industry. We, as a society, have the obligation to adopt economic and sustainable solutions for the environment and the fight against climate change, which is increasingly close to becoming irreversible [2].
Electric vehicles are one of the options presented by the industry in response to this need. Their operation requires alternative energy sources to fossil fuels. However, their adoption and widespread use present significant technical and scientific challenges. Prominent among these challenges are battery range, charging time, and battery life, particularly for battery-only electric vehicles compared to hybrids [3].
Lithium-ion batteries are currently the most suitable energy storage device for powering electric vehicles, due to their attractive properties. These include high energy efficiency, lack of memory effect, long cycle life, high energy density and high power density [4]. The challenges for batteries include driving range (currently from 200 to 350 km with a full charge), charging time (full charging takes 4 to 8 hours), battery cost, and bulk and weight (battery packs are heavy and take up considerable vehicle space) [5]. If the widespread adoption of this mode of transport is sought, these challenges must be addressed through efficient and environmentally sustainable solutions.
The behaviour of a battery can be understood through a combination of physical and electrochemical model-based explanations, as well as data. The collection of data plays an important role in understanding the different models required for accurate fuel gauging. It is important to note that the collection of data and the development of battery models are inextricably linked until such time as adequate models have been defined and the parameters estimated.[6]
To address these challenges and develop solutions, real-time monitoring tools are required for battery performance, enabling actions to improve battery efficiency and vehicle performance. Various Industry 4.0 tools, such as sensors, web applications, mobile applications, and communication protocols, among others, along with new technologies and telemetry, collect data on battery performance. This data can be analyzed to determine performance factors and generate solutions that optimize batteries and address the challenges posed.
One of the optimization techniques is the response surface methodology (RSM), a statistical and mathematical technique used to model and analyze phenomena where the main objective is to optimize the response variable, which is influenced by several variables and their interactions [7]. Optimization supports decision-making by determining which changes in the causal variables generate the optimal value of the response variable.
In the present study, the main objective is to integrate a telemetry system that measures the charging time of a battery bank (lithium-ion power batteries), which are the foundation of electric vehicles. Using RSM, we aim to determine the optimal values of current, voltage, and temperature to improve the efficiency of the vehicle. The vehicular telemetry system integrates current, voltage, and temperature sensors into a prototype with a microcontroller. Data is acquired during electric battery charge cycles and a response surface design was employed, to minimize battery charging time using the steepest descent optimization algorithm.
2. Materials and Methods
The objective of this study is to optimize the charging process of a battery bank in an electric vehicle. Telemetry was used to integrate current, voltage, and temperature sensors through a prototype seamlessly integrated into the battery bank. The RSM methodology was applied to the data generated by the sensors to optimize the charging time and minimize it. The input variables for the optimization were current, voltage, and temperature difference. This section is divided into two subsections: the first describes the study methods, and the second section outlines the six steps of the experimental analysis.
2.1. Study Methods
2.1.1. Battery Bank of the Electrical Vehicle
There can be an infinite number of shapes, sizes, and storage capacities for batteries. The main differences lie in the electrochemical characteristics needed to meet specific requirements. Consequently, there is a specific battery for every need and application. This is why solutions are often based on the use of basic storage units that are commercial and standardized. One of these units is the 18650 battery, named because it is standardized in shape and size: 18 mm in diameter, 65 mm in length, with the "0" indicating its cylindrical shape. The only aspects that have changed with the improvement of electrolyte technology are its storage capacity and charging technology. Other battery types have been developed, but the 18650 remains one of the most widely used. In fact, the energy storage in the first versions of the well-known electric vehicle Tesla Roadster was obtained from a special configuration of 18650 battery packs.
The energy storage system studied can be seen in Figure 1. It consists of basic 18650 battery units with a nominal capacity of 2500mAh at 3.6V. The configuration includes a small pack of four batteries connected in parallel, equivalent to a 3.6V and 10Ah battery. Thirteen of these packs are connected in series to obtain a total pack or equivalent battery of 10Ah at 46.8V.
The actual battery configuration is shown in Figure 2. This battery arrangement also necessitates an external physical protection system. The pack is encased in a 1.1mm thick aluminum casing to enhance isolation between the casing and the batteries. This aluminum cover not only encloses and shields the batteries from impact but also provides a surface to dissipate the heat generated inside the battery pack. The configuration includes a lithium battery protection system (BMS 48V 13S) and a PCB 13S protection plate rated up to 30A.
The internal structure of a lithium battery is shown in Figure 3. The stack of electrodes of commercial lithium-ion batteries in the current market is a multi-layered structure. A single repeatable unit consists of a cathode, an anode, and two layers of separator. The cathode is made of an aluminium foil coated on both sides by an active material with a binder. Similarly, the anode is composed of a copper foil coated with graphite (or silicon) particles.[8]
One of the most critical factors affecting battery performance is the operating temperature of the batteries. Each individual cell or unit behaves as a heat source due to the heat released from the electrochemical process and the inherent internal resistance of the battery itself. The energy balance of the cell is expressed by the equation 1 [9].
Where h is the convective heat transfer coefficient, and and are the surface and ambient temperatures, respectively, is the average rate or total heat generation, which includes the sum of all heats generated in the battery: the heat of reaction, ohmic heat, active polarization heat, and secondary or lateral heat, respectively, as shown in the equation 2 [10].
Although the latter heat, in equation 3, is usually not taken into account.
2.1.2. Telemetry

Table 1.
Description of Variables and Units of Measurement.
| Variable | Description | Unit of Measurement |
|---|---|---|
| Temperature | Temperature measured by MCP9701 sensor | Celsius (°C) |
| Current | Current measured by ACS709 sensor | Amperes (A) |
| Voltage | Voltage measured by Analog Voltage Divider module | Volts (V) |
The implementation of an efficient and accurate telemetry system is crucial for ensuring proper monitoring of the battery bank in electric vehicle applications. In this context, various sensors and devices have been employed for the acquisition of crucial data, including temperature, current, and voltage measurements. Each of these components plays a critical role in real-time tracking of the battery bank’s operational status, providing vital information for optimizing the charging and discharging processes, as well as preventing potential failures and maximizing energy efficiency. This section will detail the technical aspects and key features of the MCP9701 temperature sensors, ACS709 current sensors, and Analog Voltage Divider module for voltage measurement, as well as the ESP32 controller with LoRa module used for data acquisition and transmission. Additionally, the Raspberry Pi 4 with LoRa module acts as a Node-RED server for storing and visualizing the collected information.
Temperature: The telemetry system implemented for the battery bank utilizes temperature probes based on the MCP9701 sensor. This sensor can accurately measure temperature over a wide range, from -10°C to +125°C. The output of the MCP9701 is calibrated with a slope of 19.53 mV/°C and has a DC offset of 400 mV. These features enable reliable and precise temperature measurement of both the battery bank and the surrounding environment. The temperature data captured by the MCP9701 is integrated with the rest of the telemetry data and transferred to the central database with a sampling frequency of 1 second, allowing for real-time monitoring and the generation of detailed logs for further analysis.
Current:
The battery bank telemetry system employs the Allegro ACS709 sensor for precise current measurement. This sensor is specifically designed for real-time current monitoring applications. The board used is a simple carrier for the ACS709 sensor, which utilizes the Hall effect to measure current over a range of up to ±75A. The sensor offers a low-resistance current path of approximately 1.1 m and provides electrical isolation of up to 2.1 kV RMS. The ACS709 has been optimized for optimum accuracy in currents ranging from -37.5 A to 37.5 A. Its analog voltage output is linear for current magnitudes up to 75 A, with the output voltage centered at and a typical error of .
Additionally, it can operate in a voltage range of 3 V to 5.5 V, allowing it to connect directly to 3.3 V and 5 V systems. This precise measurement capability and wide operating range make the ACS709 sensor an ideal choice for monitoring the battery bank’s charging current with high reliability and accuracy. The current data captured by the ACS709 is integrated with the rest of the telemetry data and logged into the central database, facilitating continuous monitoring and optimization of the battery bank’s charging process.
Voltage: The Analog Voltage Divider module was employed for voltage measurement in the battery bank telemetry system. This module can detect the supply voltage over a wide range, from 8V to 100V. Its operation is based on the principle of the voltage divider, which allows the input voltage to be reduced by a factor of 20. Since the ESP32’s analog input typically has a maximum of 5V, the input voltage of the analog voltage detection module cannot exceed 5V * 20, which is equivalent to 100V. This feature ensures that the input voltage is within the safe range and compatible with the ESP32. The ability to detect voltages over a wide range, combined with compatibility with the ESP32’s analog input, makes the Analog Voltage Divider module a suitable option for accurately measuring the battery bank voltage. The voltage data captured by this module is integrated with other telemetry data and logged into the central database, facilitating continuous monitoring and efficient management of the battery charging process.
Controller: The ESP32 controller, equipped with a LoRa module enabling its connection to a Raspberry Pi 4, is used for data acquisition. The Raspberry Pi 4, in turn, is equipped with a LoRa module serving as a Node-RED server responsible for storing and visualizing the collected information. The ESP32 acts as a remote node that collects data from the battery bank’s telemetry system, utilizing its LoRa module to transmit this data to the Raspberry Pi 4 wirelessly. The Raspberry Pi 4, functioning as a Node-RED server, receives this data and processes it for storage in a database and subsequent visualization in the form of graphs or tables. This configuration allows for efficient and wireless communication between the ESP32 and the Raspberry Pi.
2.1.3. Response Surface Methods
The response surface methodology (RSM) is a set of mathematical and statistical tools whose main objective is to optimize a response of interest influenced by a variety of variables and determine the optimal operating conditions of the system. The modeling is carried out through the estimation of a polynomial of first order or higher, generally applying the ordinary least squares method, to develop a second-order model on a response surface in equation 4.
RSM is a sequential procedure where current operating conditions are considered non-optimal if the appropriate model is not first order. The objective is, starting from the current operating conditions, to find the trajectory towards the optimum, applying an algorithm such as the one with the highest rise to maximize the response (or descent to minimize), through a second order model where the top represents the point of maximum response [7]. Response surfaces are plotted in two (contour) or three dimensions (response surface) in order to characterize the shape of the surface and locate the optimum, the coefficients of the second-order model can be estimated through regression analysis and analysis of variance ANOVA applied in order to interpret the effect that the input variables have on the response.
RSM is a sequential procedure where current operating conditions are considered non-optimal if the appropriate model is not of first order. The objective is to find the trajectory towards the optimum starting from the current operating conditions, applying an algorithm such as the one with the steepest ascent to maximize the response (or descent to minimize it), through a second-order model where the peak represents the point of maximum response [7]. Response surfaces are plotted in two dimensions (contour) or three dimensions (response surface) to characterize the shape of the surface and locate the optimum. The coefficients of the second-order model can be estimated through regression analysis, and analysis of variance (ANOVA) is applied to interpret the effect that the input variables have on the response.
We selected the initial, the final voltage and, the current as input variables, the charge time is the response variable. The levels and variables in Table 2.
2.2. Experimental Analysis
The process was carried out in six steps, which are described below.
Step 1. Experimental design
Critical variables were selected: charging current, battery voltage, and battery and ambient temperatures. These variables were chosen due to their direct impact on system efficiency and their key role in designing a highly effective telemetry system for electric vehicles. The experimental design is shown in Table 1. Current levels ranged between 1.0 and 3.0, voltage varied between 51.0 and 51.4, and an RSM design of with three central points was selected.
Step 2. Design and development of the prototype The developed prototype is characterized by the integration of current, voltage, and temperature sensors, in accordance with the previously conceived design. To ensure consistent operation and accurate communication, the sensor layout was optimized, and a suitable microcontroller was configured.
Step 3. Data acquisition and registration Once implemented in the electric vehicle, the prototype was configured to capture telemetry data on battery charge and discharge cycles. This enabled the accurate collection of relevant information during crucial operational situations.
Step 4. Data analysis The data obtained underwent a rigorous pre-processing process to eliminate outliers and rectify possible errors in the acquisition system. To guarantee the integrity and reliability of the data, advanced statistical techniques were applied. These techniques allowed for the discovery of subtle patterns and interdependent relationships between key variables.
Step 5. Determining the Optimal Charge Current Through a statistical analysis based on a response surface design, exploring different combinations of current and voltage levels, we were able to establish the optimal charging time. This resulting value, aimed at maximizing electric vehicle efficiency by minimizing battery charging time, was derived directly from the results obtained from this detailed analysis. We established a confidence level of 95% ().
Step 6. Validation of the Prototype and Results To ensure the reliability and effectiveness of the prototype, it underwent tests under various operating conditions. The results obtained were evaluated in accordance with the objectives previously outlined, providing an accurate assessment of the feasibility and coherence of the approach adopted.
All the mathematical and statistical calculations were carried out using RStudio Desktop 4.2.0.
3. Results
Telemetry System for Competitive Electric Vehicles
The designed telemetry system for competitive electric vehicles is illustrated in Figure 4. This system incorporates key sensors, including those for current, voltage, battery temperature, ambient temperature, distance, and GPS.
Data transmission is facilitated by LoRa technology, ensuring reliable long-distance communication. The data is encapsulated in JSON format. The Node-RED platform serves as the interface for data visualization and management, allowing competition teams to monitor vehicle performance in real-time. The customization of the printed circuit board (PCB) and render is shown in Figure 5, ensuring the system’s resilience under extreme conditions. This is supported by a Raspberry Pi that hosts a Node.js server for real-time data processing and storage.
The prototype, achieving a Technology Readiness Level (TRL) of Figure 6, has been completed, soldered, and tested. Figure 6 shows the fully assembled prototype. The robust construction of the prototype ensures its resistance to vibrations, impacts, and adverse conditions. Additionally, progress has been made in filling out the registration forms for both the prototype and the software used in the telemetry system.
Screening experiments
We applied the experimental design methodology previously described. The response surface methodology is a sequential process. The first step is to determine, from the selected factors, those that affect the response variable. In the second stage, the optimal value of the response variable is determined. A response surface design of was adjusted, and the objective function was to minimize the battery charging time using the steepest descent algorithm. The coefficients are presented in Table 3, and the results of ANOVA are shown in Table 1.
From Table 3 and Table 1 we conclude all the coefficients are statistically significant due the p-values , the Current is statistically significant due the interaction with the initial voltage, then the second order model is adequate to find the optimal operating conditions with . According to the estimated coefficients in Table 3, we established the initial voltage as the most important variable for the minimization of the charge time. The optimal conditions according to the steepest descent algorithm in Table 5.
From Table 3 and Table 1, we conclude that all the coefficients are statistically significant, as evidenced by the p-values being less than 0.05. The current is statistically significant due to its interaction with the initial voltage. Therefore, the second-order model is deemed adequate to find the optimal operating conditions, with an . According to the estimated coefficients in Table 3, we established the initial voltage as the most important variable for minimizing the charge time. The optimal conditions, as determined by the steepest descent algorithm, are presented in Table 5.
It is important to note that while integrated temperature sensors were included in the system for monitoring purposes, temperature was not used as a factor in the optimization process. This is because controlling temperature under real-world conditions is challenging.
In Figure 7, the response surface illustrating the relationship between the charging current and the battery bank charging time is presented. It is observed that the optimal charging current is around 2.38 A, with an estimated charging time of approximately 6961.08 seconds. Given that the objective function is to minimize the charging time, this configuration is considered ideal.
The figure also reveals that as the charging current increases, the charging time decreases significantly, as reflected in the red areas of the surface. However, it is important to note that an increase in charging current also leads to a rise in the battery temperature. This temperature increase can cause battery failures, reduce its lifespan, and pose risks to the electric vehicle.
Therefore, although increasing the charging current may seem like an effective strategy to reduce charging time, it is crucial to find a balance that considers both the efficiency of the charging time and the safety and durability of the battery. Optimization should thus include not only the minimization of charging time but also proper thermal management to prevent overheating and ensure the safe and prolonged operation of the battery system.
Figure 8, shows the response surface and contour plot for different charging currents and initial voltages. The optimal region is observed around 6000 seconds. The response surface illustrates that as the initial charging voltage increases, the charging time decreases. Additionally, it is evident that a higher charging current results in a shorter charging time, with the initial voltage having less influence on this relationship.
However, it is important to consider that lithium batteries require careful control of the charging current to prevent an increase in temperature, which could lead to battery degradation, reduced lifespan, and potential safety hazards. While increasing the charging current can significantly reduce the charging time, it is essential to balance this with thermal management strategies to maintain battery integrity and ensure safe operation.
Figure 9, shows the response surface and contour plot for the final voltage of the battery bank versus the charging current. It is observed that as the final charging voltage increases, the charging time will also be longer. This time can be reduced by increasing the charging current, as evidenced in the contour plot, where the optimal region is around 8000 seconds. However, it is crucial to control this condition because increasing the charging current also leads to a rise in battery temperature. This temperature increase can affect performance, reduce the battery’s lifespan, and pose safety risks.
The optimization of the charging process must balance the reduction of charging time with thermal safety. While increasing the charging current might seem like an effective solution to reduce charging time, it is necessary to implement temperature control measures to avoid damage and risks. Effective thermal management is essential to maintain the battery’s integrity during the charging process. In conclusion, Figure 9 highlights the complex relationship between the final voltage and charging current in the battery charging process, emphasizing the importance of identifying optimal conditions and applying thermal management strategies to achieve a balance between charging efficiency and operational safety.
4. Discussion
This article presents a telemetry system designed to measure the factors affecting the charging time of a lithium-ion battery bank. The system integrates current, voltage, and temperature sensors into a prototype equipped with a microcontroller. The primary objective was to minimize the charging time—considered the response variable—by improving the efficiency of the vehicle. Data was collected throughout the electric battery charging cycles to achieve this goal. Once the telemetry data was collected, a response surface design was applied using current and voltage as factors, varying from low to high values, with the objective of minimizing the battery’s charging time. The response surface methodology and the steepest descent algorithm revealed that both current and voltage significantly impact charging time. The minimum charging time of 6961 seconds was achieved with a current of 2.4 amps and voltages of 50.5 volts and 43.6 volts. As previously mentioned, temperature was monitored but not used as a factor in the optimization process.
Some authors explore various aspects of charging optimization, reliability analysis, and project-based learning related to lithium-ion batteries and electric vehicles. These topics include charging strategies based on temperature rise and charge time, multi-objective optimization methods, reliability optimization for battery packs, and project-based learning for electric vehicle innovation. Several charging optimization strategies have been proposed for lithium-ion batteries, focusing on balancing charging time and battery longevity.
[11] developed a strategy using an Enhanced Thermal Behavior Model and a Genetic Algorithm (GA) to improve solution accuracy at high charging currents. This method employs a polarization-based optimization strategy to balance charging speed and battery lifetime. The GA is used to find the optimal charging current trajectories, considering temperature rise constraints and charging time.
[12] applied a Multi-objective Charging Optimization Method that divides the charging process into multiple stages, optimizing the charging currents for each stage. This method aims to reduce both charging time and temperature rise, considering the limitations of charging current in different State of Charge (SOC) stages. Using an off-line first-order equivalent circuit model and a battery thermal model, the strategy estimates temperature rise and balances charging time and temperature increase. The optimal charging currents for eight stages were determined to be 39.4, 36.4, 30.1, 14.0, 13.1, 12.4, 8.2, and 10.0 A, resulting in a charging process that took 1620 seconds with a temperature rise of 3.37°C. However, achieving this optimal time requires a high-capacity battery, which differs significantly from the one used in our research.
[13] utilized a Variable Frequency Pulse Charge System (VFPCS) to identify the optimal pulse charge frequency for providing optimal pulse current (PC) charging to the battery, thereby reducing charging time. Compared to the standard constant current-constant voltage (CC-CV) charge system, this method increased charging speed by about 21%. They developed an optimization approach using Particle Swarm Optimization (PSO) and a fuzzy-deduced fitness evaluator to determine an optimal charging pattern, which charged batteries to above 80% capacity in 3060 seconds. This approach improved charging times by approximately 56.8% compared to the conventional CC-CV method.
Other studies focus on optimizing the charging process by managing the current and voltage profiles to enhance battery performance and longevity. [14] introduced a method for selecting optimal charging parameters that maximize battery cycle life while minimizing charging time. This approach considers the effects of voltage and current on capacity curves. The battery is charged at a constant current until a specified voltage is reached, after which the voltage is held constant and the current gradually decreases. The optimal current in the constant current (CC) stage is determined by the ratio of weighting on total charging time (TTC) and energy loss (EL), as well as the battery’s resistance. The paper presents models that accurately predict battery capacity over multiple cycles. These models and methods are validated with experimental data, demonstrating their effectiveness in real-world scenarios.
According to [15], the maximum acceptable terminal voltage and the maximum current during charging are crucial parameters that influence the charging process. These parameters affect not only the life of the battery but also the efficiency and speed of charging. For instance, higher current levels can reduce the time-to-charge (TTC) but also increase energy losses (EL) due to the proportional relationship between EL and the square of the current.
5. Conclusions
The detailed analysis of response surfaces reveals the importance of striking a balance between charging efficiency and thermal management to maximize the performance and durability of batteries in electric vehicles. It has been identified that, to reduce charging time, it is crucial to maintain a low final charging voltage and increase the charging current. For example, it was observed that a charging current of approximately 2.38 A resulted in an optimal charging time of around 6961.08 seconds, although this time may vary depending on specific charging conditions and battery capacity.
The study’s results highlight the critical role of the charging current in battery charging time. It was demonstrated that an increase in the charging current leads to a significant reduction in charging time. However, this benefit must be balanced with adverse effects on battery temperature. Increasing the charging current was observed to raise the temperature, which could compromise long-term battery safety and durability.
While fast charging offers benefits in terms of convenience and practicality for electric vehicle users, it also presents significant challenges in terms of thermal management and battery safety. The findings of this study underscore the need to research and develop fast charging strategies that minimize negative impacts on battery temperature while maximizing charging efficiency. Emerging thermal management techniques and advances in battery materials offer promising opportunities to address these challenges and move towards more efficient and safe energy storage systems.
Author Contributions
Conceptualization, A.F. Villa-Salazar, I.N. Gomez-Miranda; methodology, A.F. Villa-Salazar, I.N. Gomez-Miranda, A.F., Romero-Maya, J. D. Velásquez-Gómez; formal analysis, A.F. Villa-Salazar, I.N. Gomez-Miranda, A.F., Romero-Maya, J. D. Velásquez-Gómez, K. Lemmel-Vélez; investigation, A.F. Villa-Salazar, I.N. Gomez-Miranda, A.F., Romero-Maya, J. D. Velásquez-Gómez, K. Lemmel-Vélez; data curation, A.F. Villa-Salazar, I.N. Gomez-Miranda; original draft preparation, A.F. Villa-Salazar, I.N. Gomez-Miranda, K. Lemmel-Vélez; writing—review and editing, A.F. Villa-Salazar; supervision, A.F. Villa-Salazar, I.N. Gomez-Miranda, A.F., Romero-Maya, J. D. Velásquez-Gómez, K. Lemmel-Vélez. All authors have read and agreed to the published version of the manuscript. All authors have read and agreed to the published version of the manuscript.
Funding
This research received no external funding
Informed Consent Statement
Not applicable
Data Availability Statement
The dataset generated and analyzed during the current study is available from the corresponding author on reasonable request.
Acknowledgments
The authors would like to thank the university IUPB for allowing us to carry out the experiments within the framework of the institutional project “Escudería Bravo”.
Conflicts of Interest
The authors declare no conflict of interest.
References
- IPCC.; others. Climate Change 2014: Mitigation of Climate Change. Contribution of Working Group III to the Fifth Assessment Report of the Intergovernmental Panel on Climate Change; Cambridge University Press, 2014; p. 147. ISBN: 978-1-107-05821-7.
- IPCC.; others. Climate Change 2022: Impacts, Adaptation and Vulnerability. Contribution of Working Group II to the Sixth Assessment Report of the Intergovernmental Panel on Climate Change; Cambridge University Press, 2022; p. 3056 [CrossRef]
- Mothilal Bhagavathy, S.; Budnitz, H.; Schwanen, T.; McCulloch, M. Impact of charging rates on electric vehicle battery life. Findings 2021, 2021. [Google Scholar] [CrossRef]
- Ding, Y.; Cano, Z.P.; Yu, A.; Lu, J.; Chen, Z. Automotive Li-Ion Batteries: Current Status and Future Perspectives. Electrochemical Energy Reviews 2019, 2, 1–28. [Google Scholar] [CrossRef]
- Sanguesa, J.A.; Torres-Sanz, V.; Garrido, P.; Martinez, F.J.; Marquez-Barja, J.M. A review on electric vehicles: Technologies and challenges. Smart Cities 2021, 4, 372–404. [Google Scholar] [CrossRef]
- Balasingam, B.; Avvari, G.; Pattipati, B. and Pattipati, K.B.Y. A robust approach to battery fuel gauging, part II: Real time capacity estimation. Journal of Power Sources 2014, 269, 949–961. [Google Scholar] [CrossRef]
- Myers, R.H.; Montgomery, D.C.; Anderson-Cook, C.M. Response surface methodology: process and product optimization using designed experiments; John Wiley & Sons, 2016; p. 856. ISBN: 9781118916032.
- Zhu, J.; Wierzbicki, T.; Li, W. A review of safety-focused mechanical modeling of commercial lithium-ion batteries. Journal of Power Sources 2018, 378, 153–168. [Google Scholar] [CrossRef]
- Xia, Q.; Wang, Z.; Ren, Y.; Yang, D.; Sun, B.; Feng, Q.; Qian, C. Performance reliability analysis and optimization of lithium-ion battery packs based on multiphysics simulation and response surface methodology. Journal of Power Sources 2021, 490, 229–567. [Google Scholar] [CrossRef]
- Sato, N. Thermal behavior analysis of lithium-ion batteries for electric and hybrid vehicles. Journal of power sources 2001, 99, 70–77. [Google Scholar] [CrossRef]
- Zhang, C.; Jiang, J.; Gao, Y.; Zhang, W.; Liu, Q.; Hu, X. Charging optimization in lithium-ion batteries based on temperature rise and charge time. Applied energy 2017, 194, 569–577. [Google Scholar] [CrossRef]
- Sun, J.; Ma, Q.; Liu, R.; Wang, T.; Tang, C. A novel multiobjective charging optimization method of power lithium-ion batteries based on charging time and temperature rise. International Journal of Energy Research 2019, 43, 7672–7681. [Google Scholar] [CrossRef]
- Ghaeminezhad, N.; Monfared, M. Charging control strategies for lithium-ion battery packs: Review and recent developments. IET Power Electronics 2022, 15, 349–367. [Google Scholar] [CrossRef]
- Abdollahi, A.; Han, X.; Avvari, G.; Raghunathan, N.; Balasingam, B.; Pattipati, K.R.; Bar-Shalom, Y. Optimal battery charging, Part I: Minimizing time-to-charge, energy loss, and temperature rise for OCV-resistance battery model. Journal of Power Sources 2016, 303, 388–398. [Google Scholar] [CrossRef]
- Abdollahi, A.; Raghunathan, N.; Han, X.; Pattipati, B.; Balasingam, B.; Pattipati, K.; Bar-Shalom, Y.; Card, B. Battery health degradation and optimal life management. 2015 IEEE AUTOTESTCON. IEEE, 2015, pp. 146–151.
Figure 1.
10Ah battery at 46.8V with a mixed configuration of 18650 batteries.
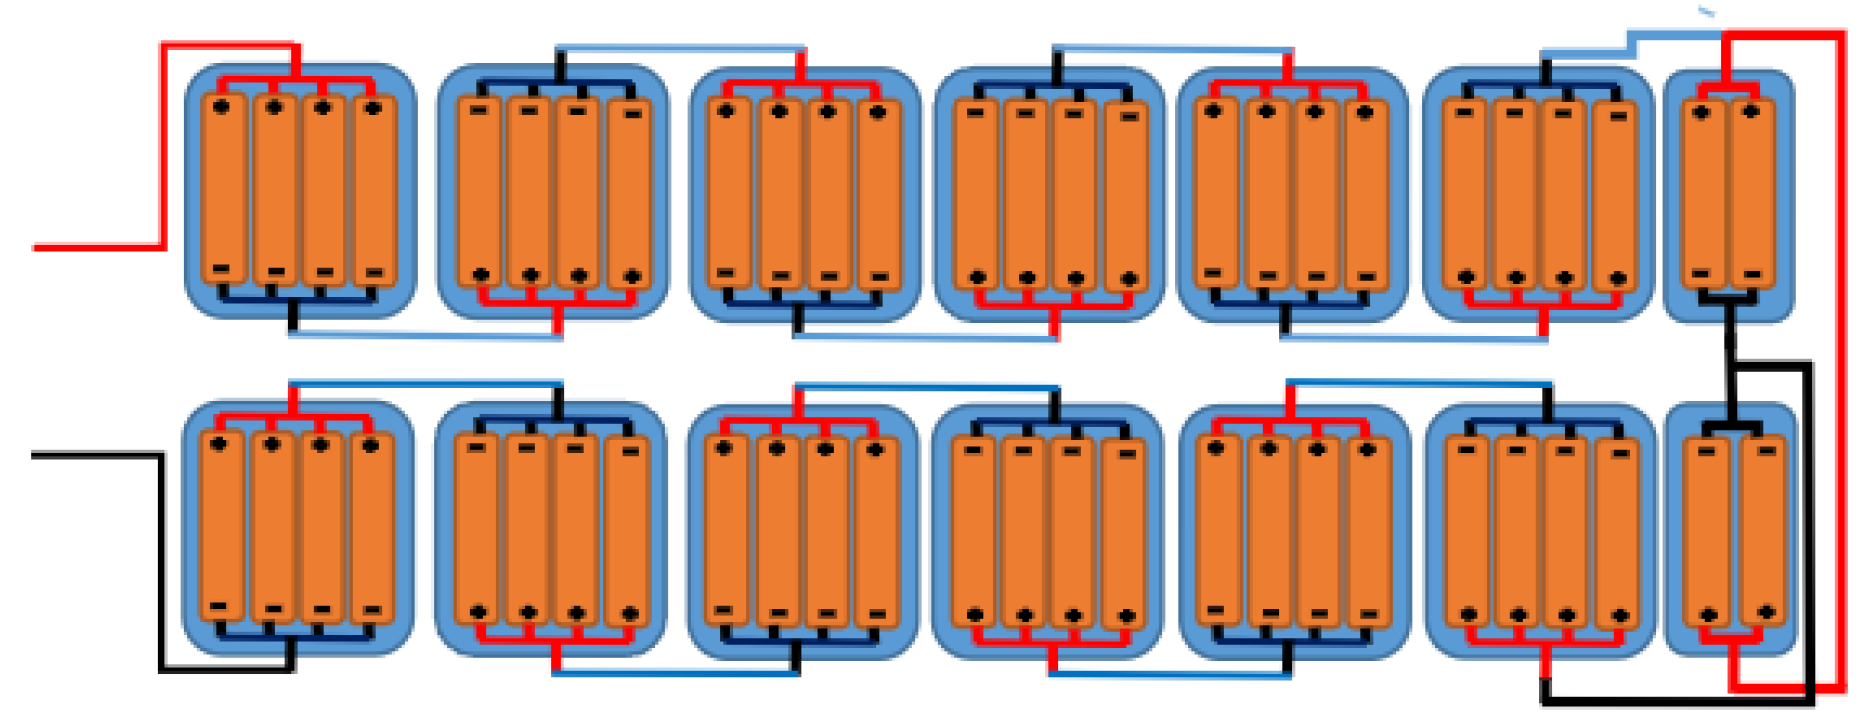
Figure 2.
Internal configuration 18650 battery pack.

Figure 3.
Internal structure lithium battery.
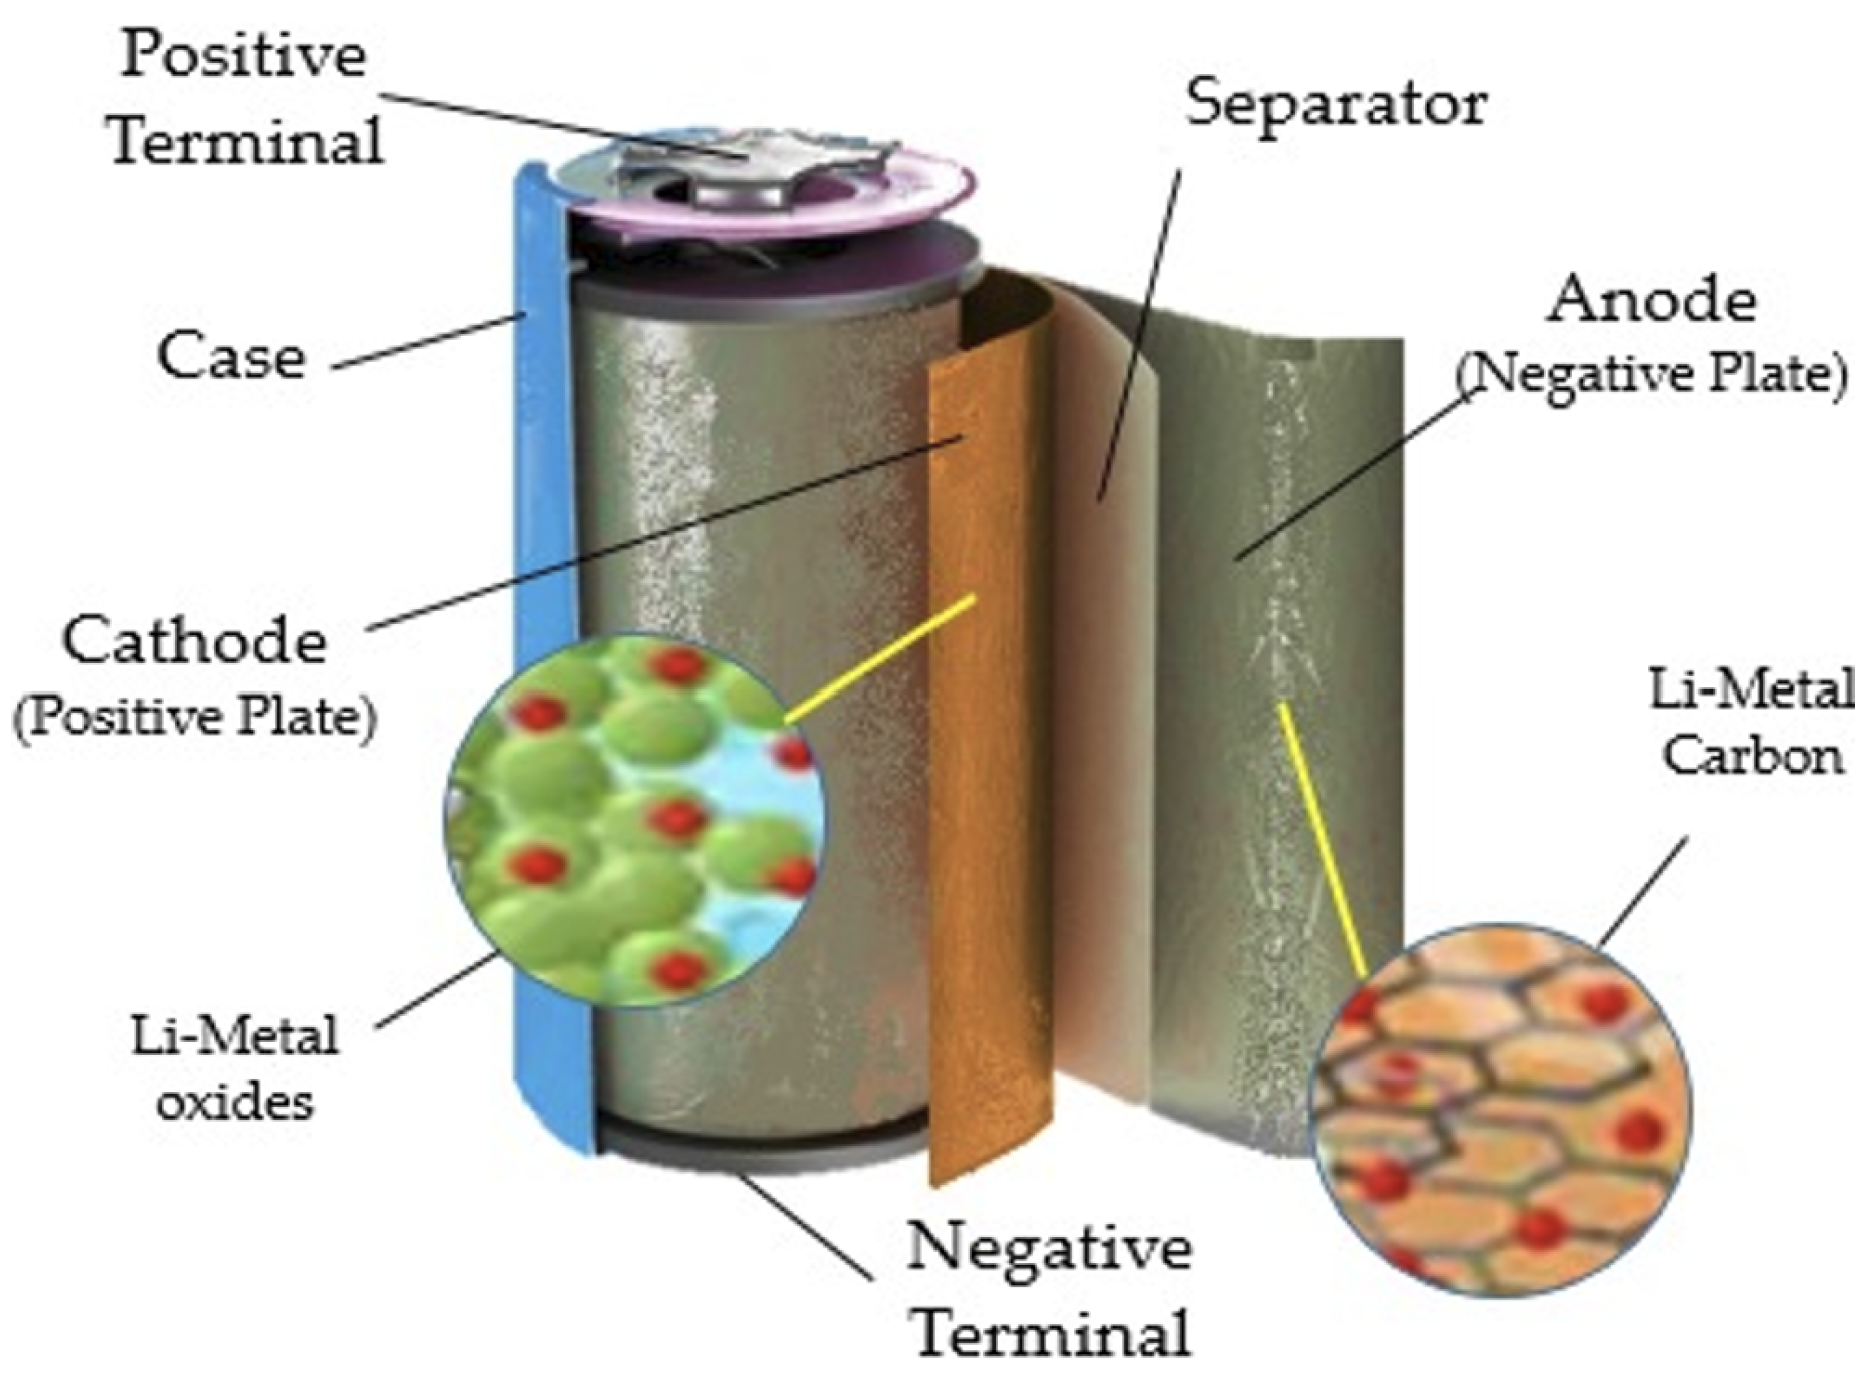
Figure 4.
Schematic of the Designed Telemetry System for Competitive Electric Vehicles.
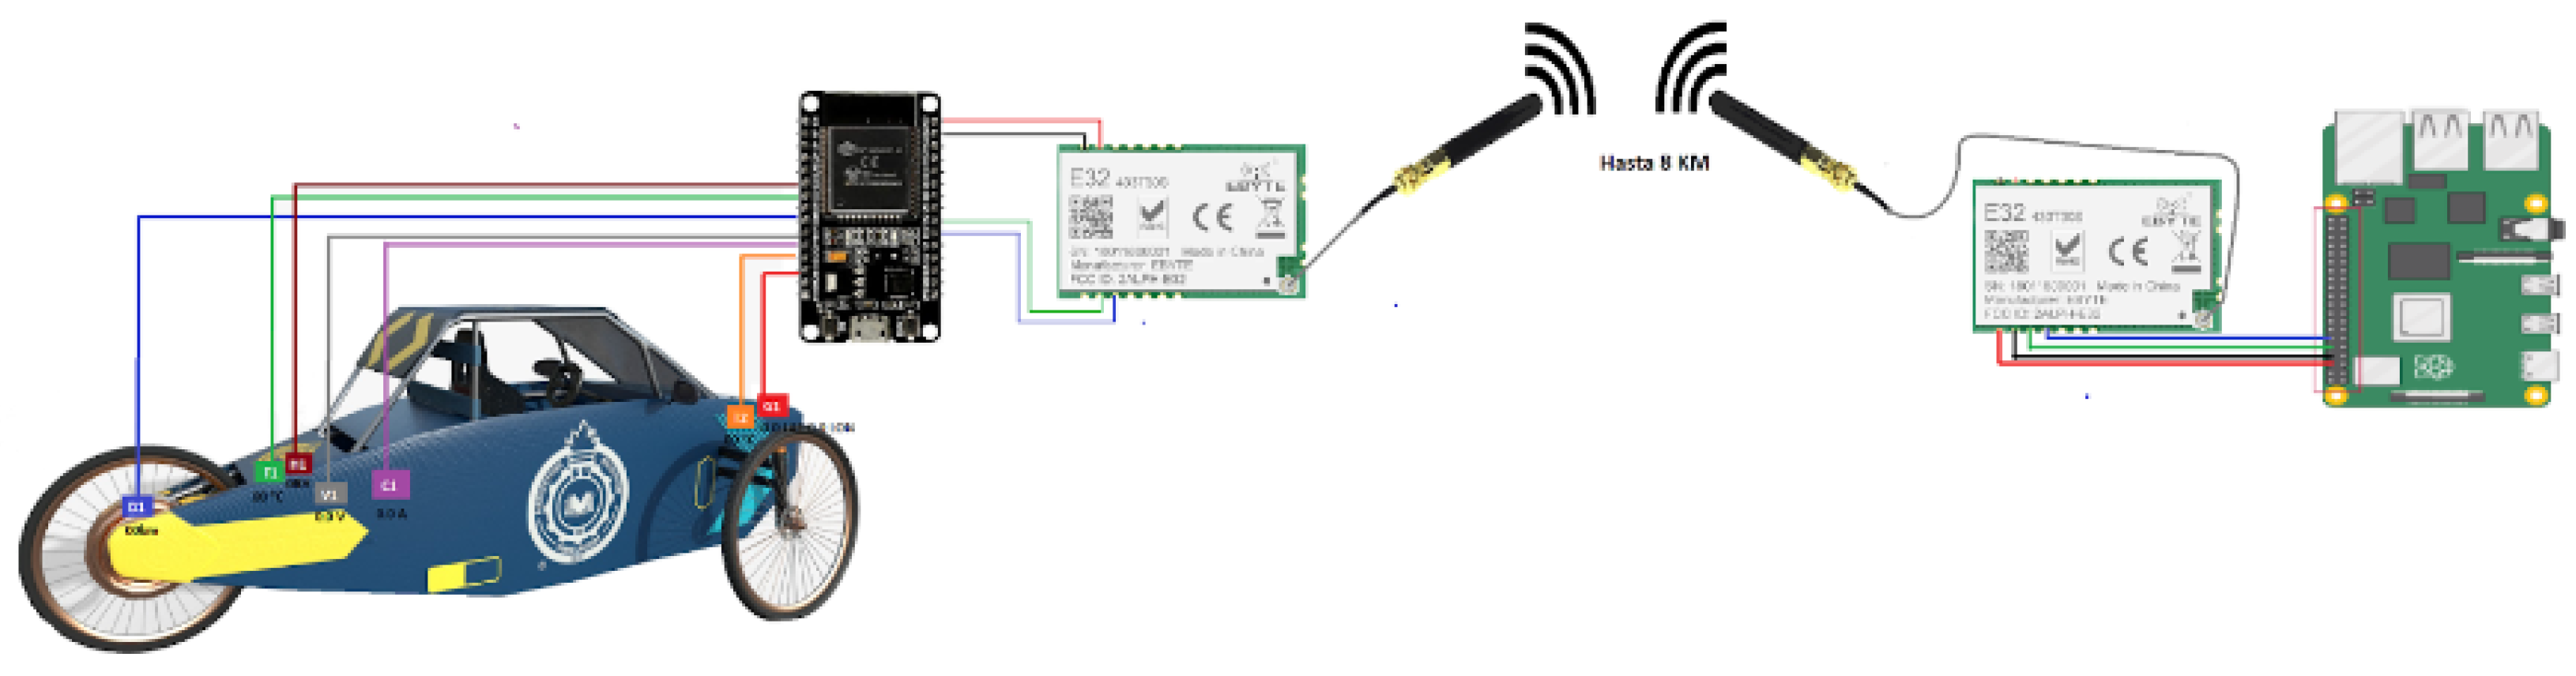
Figure 5.
Customized PCB and Render for the Telemetry System.
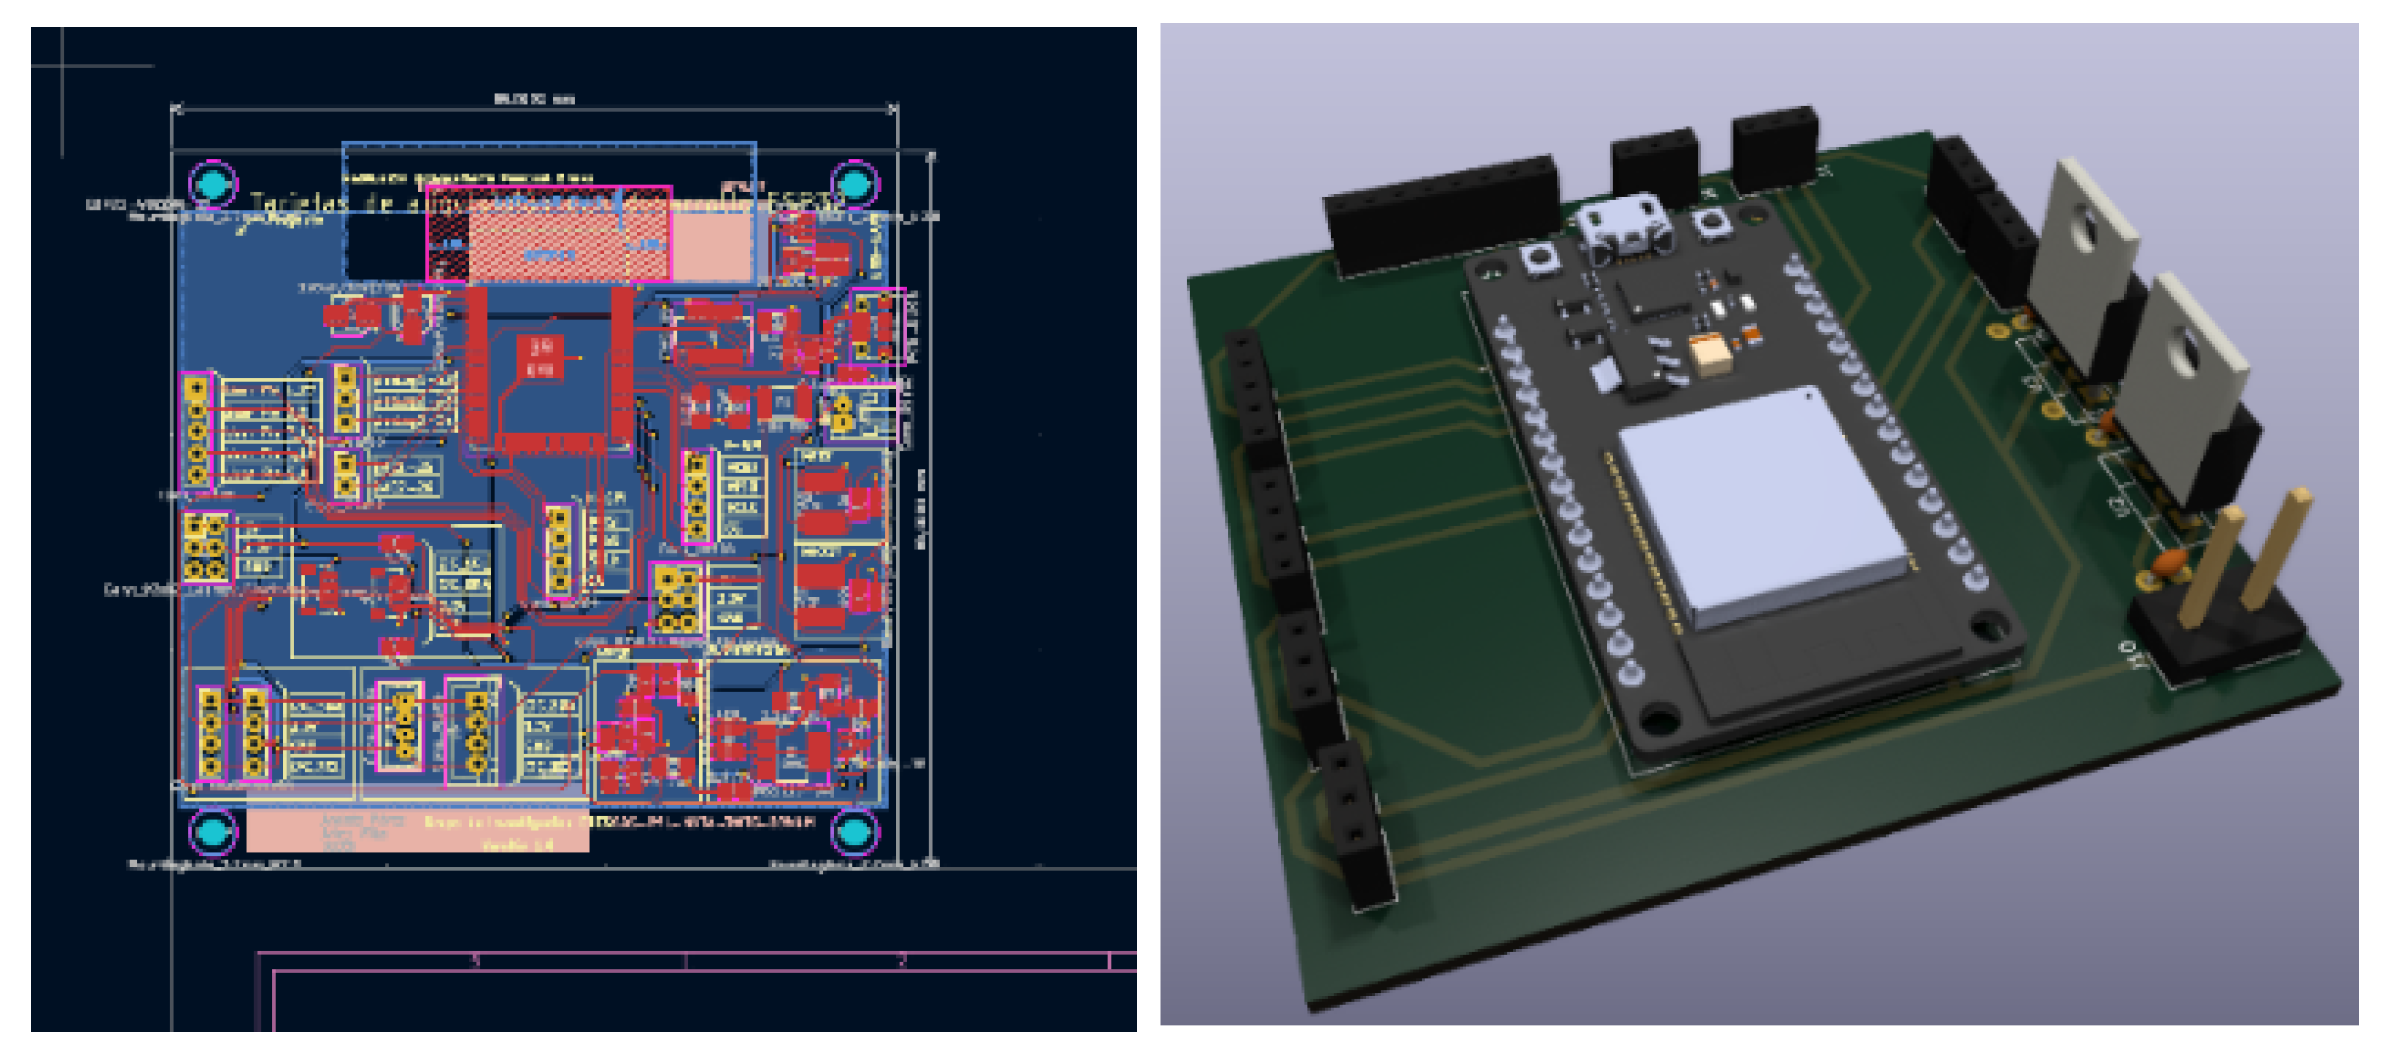
Figure 6.
Assembled Prototype of the Telemetry System.
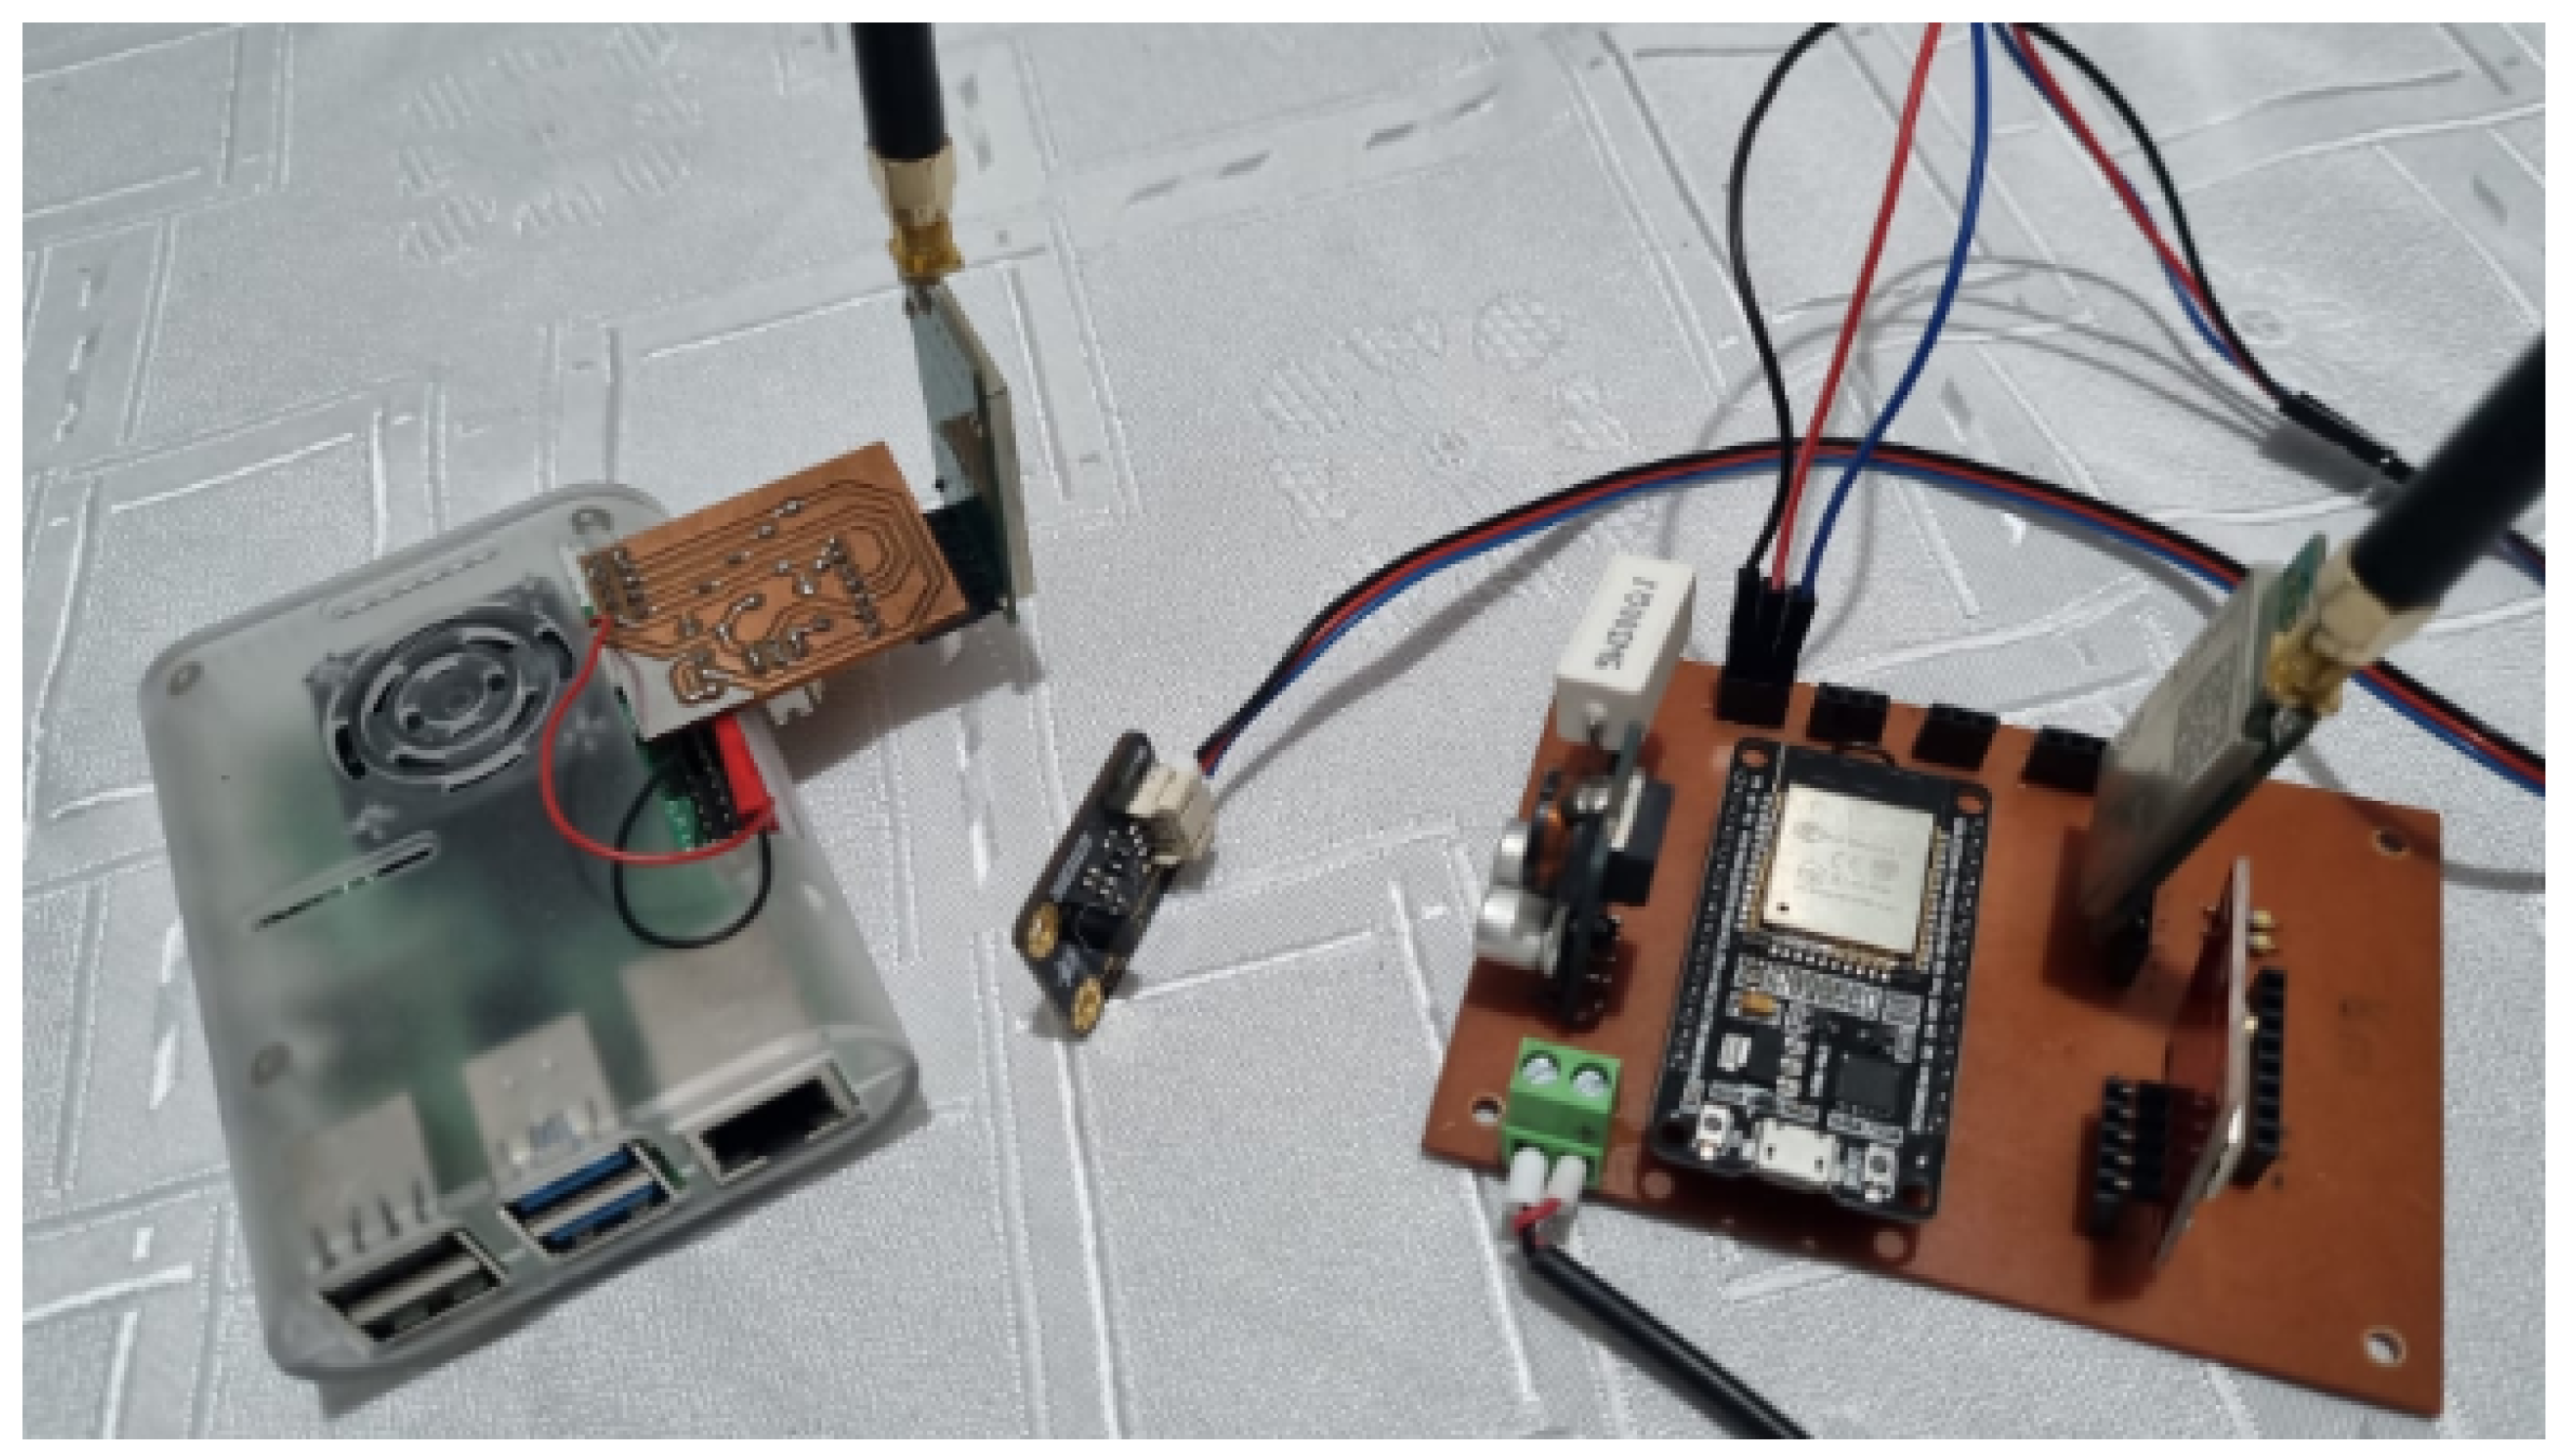
Figure 7.
Response surface and contour graph Initial voltage and Final voltage.
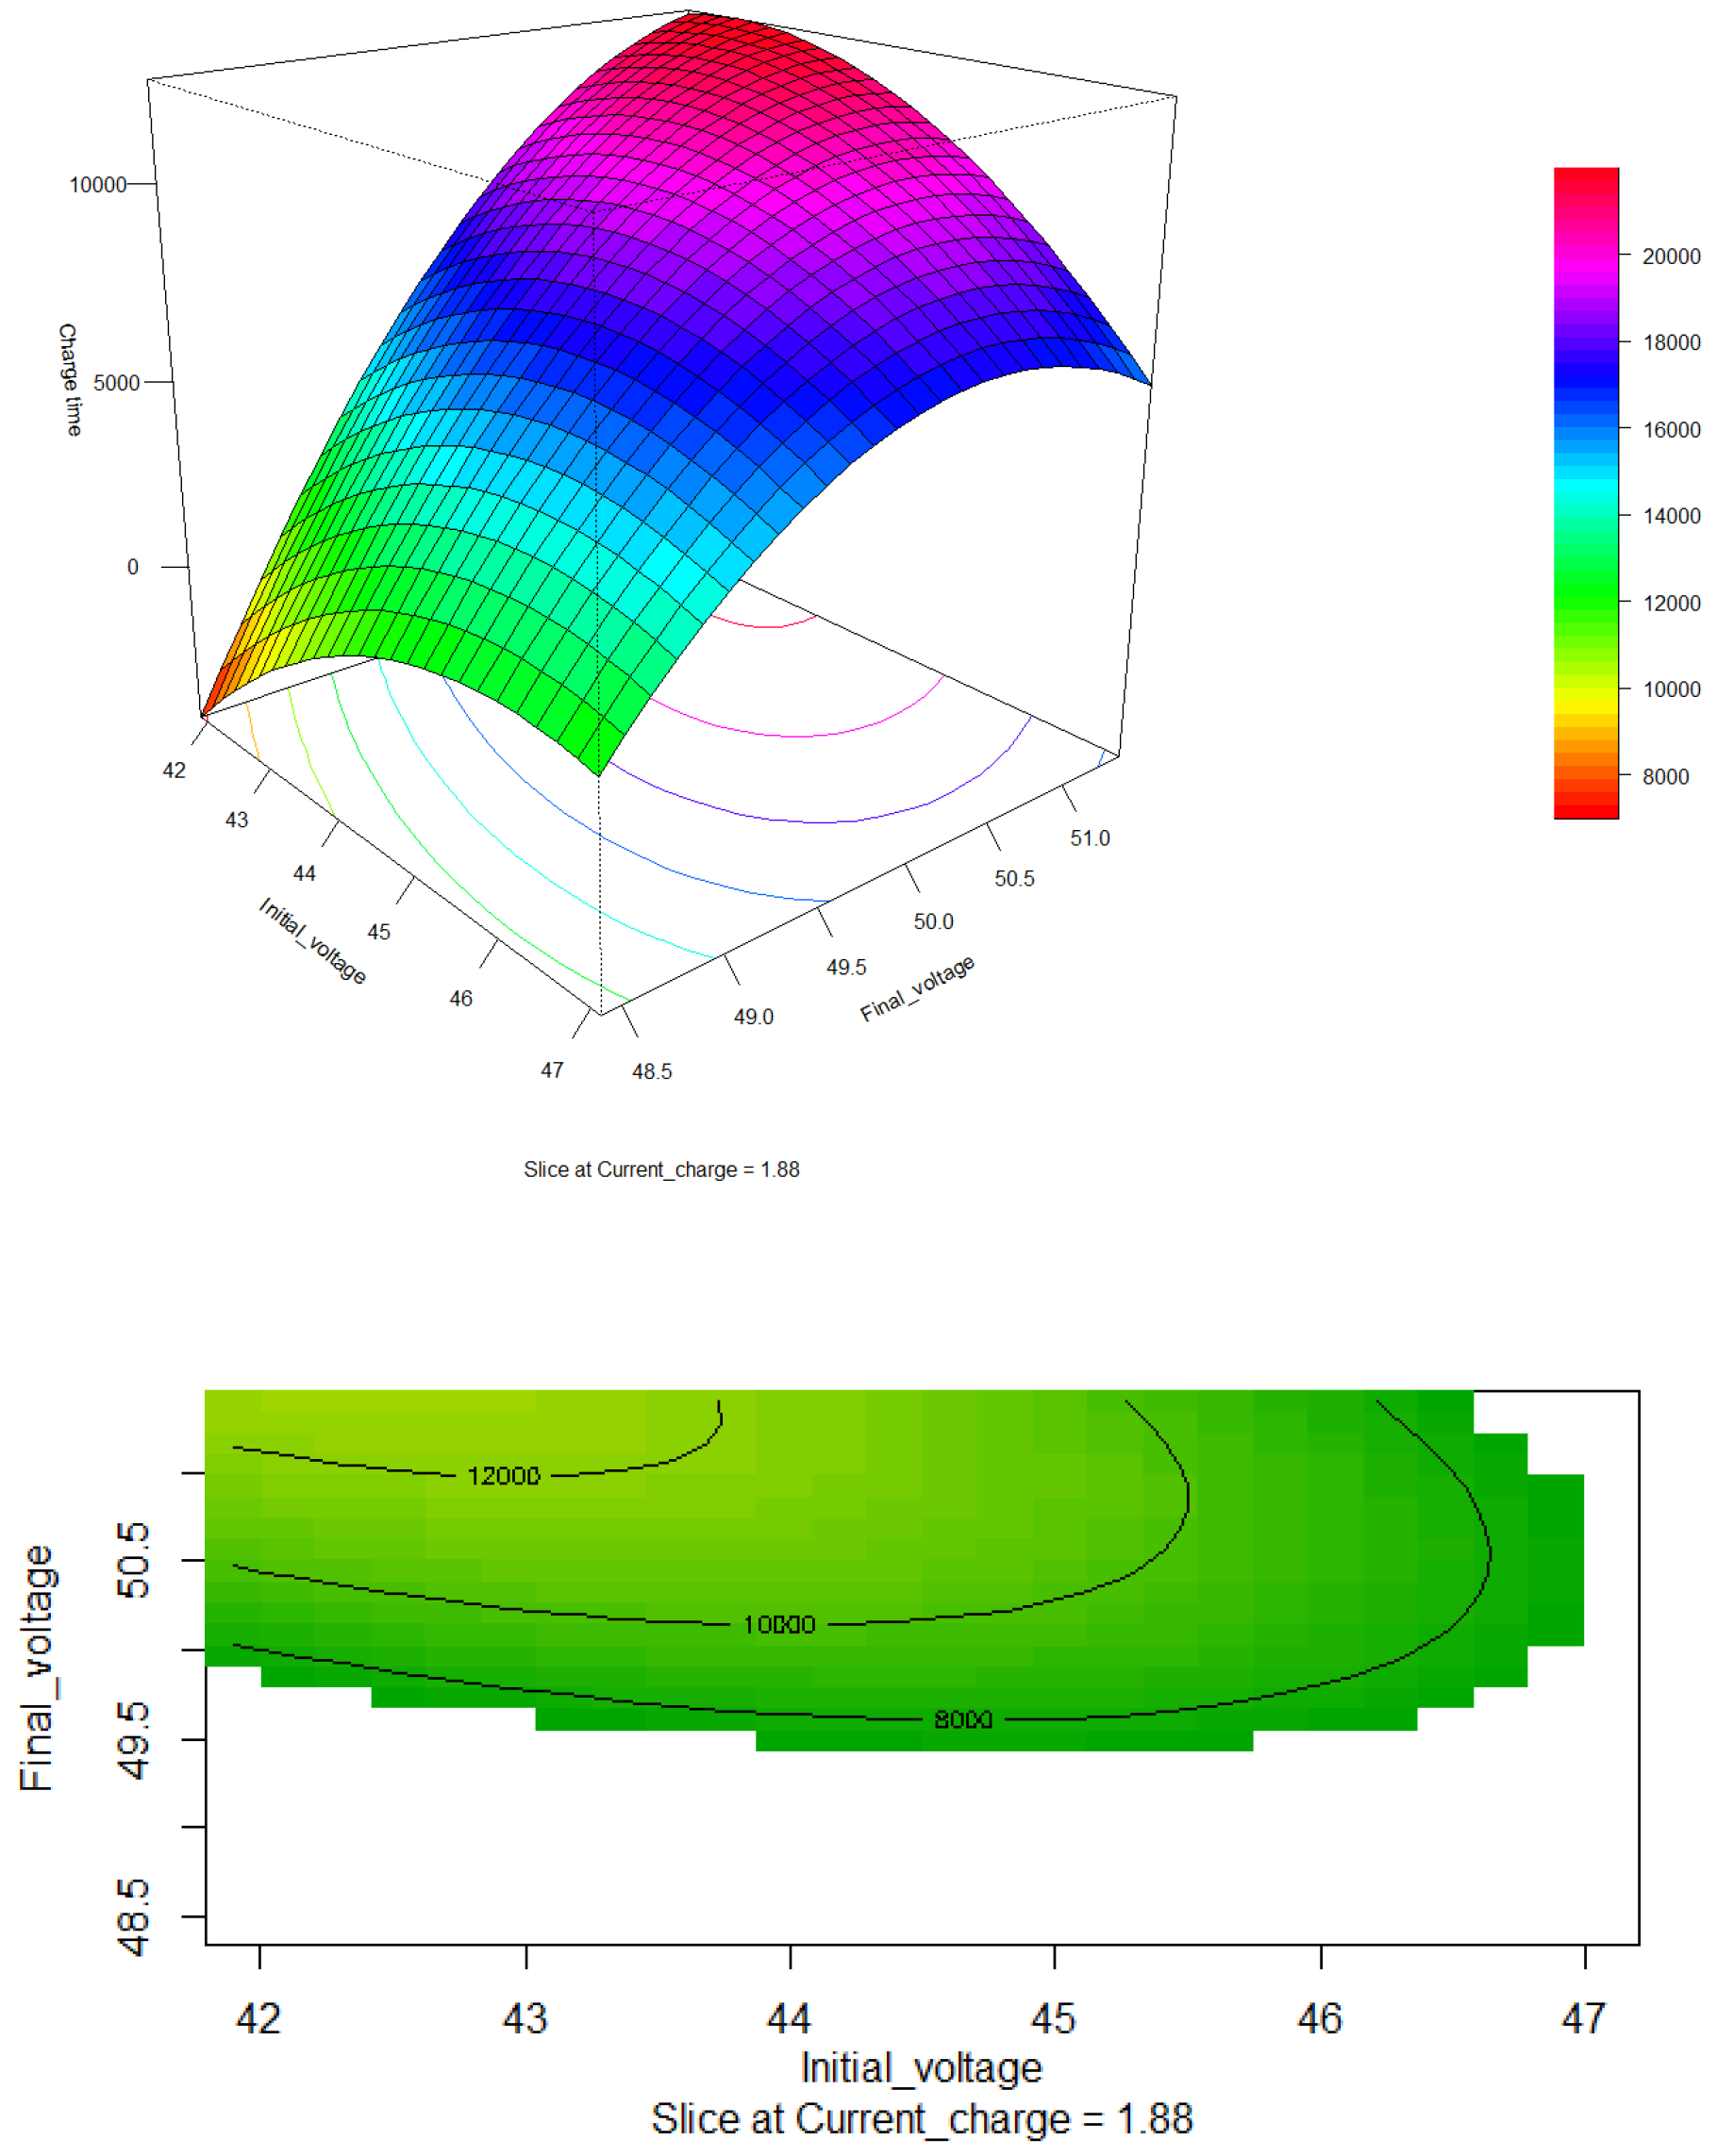
Figure 8.
Response surface and contour graph Initial voltage and Current.
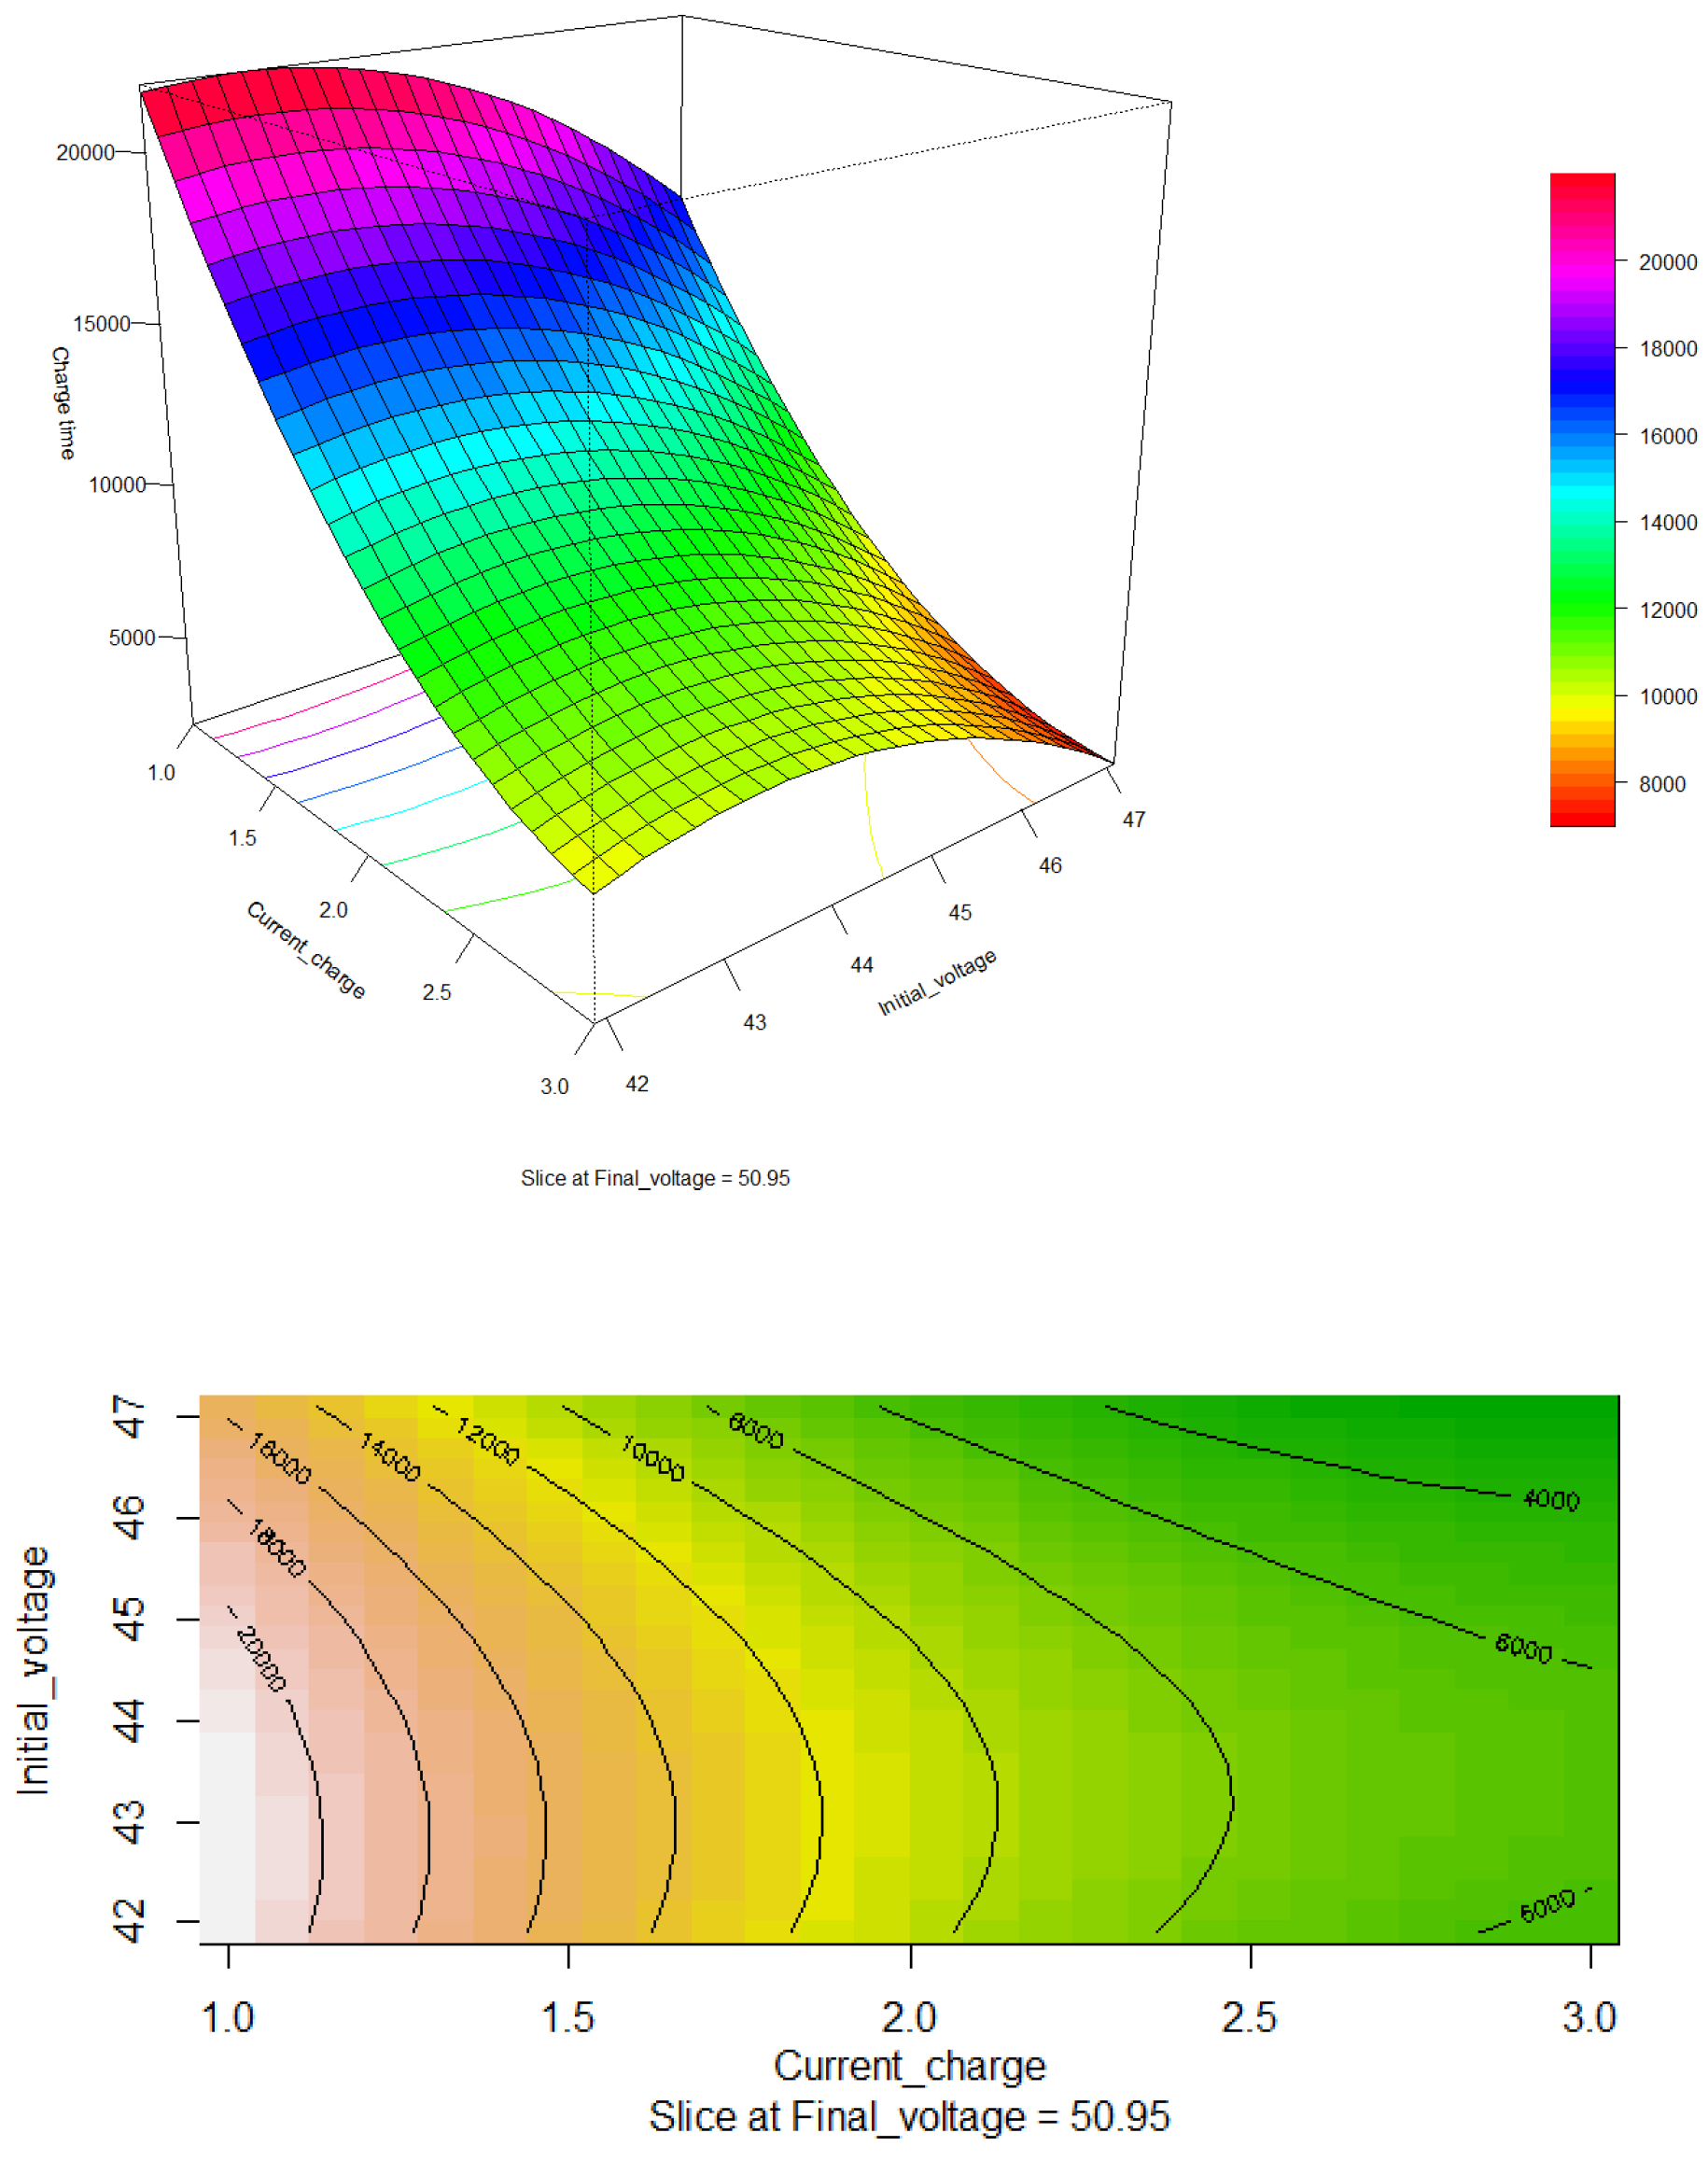
Figure 9.
Response surface and contour graph Initial voltage and Current.
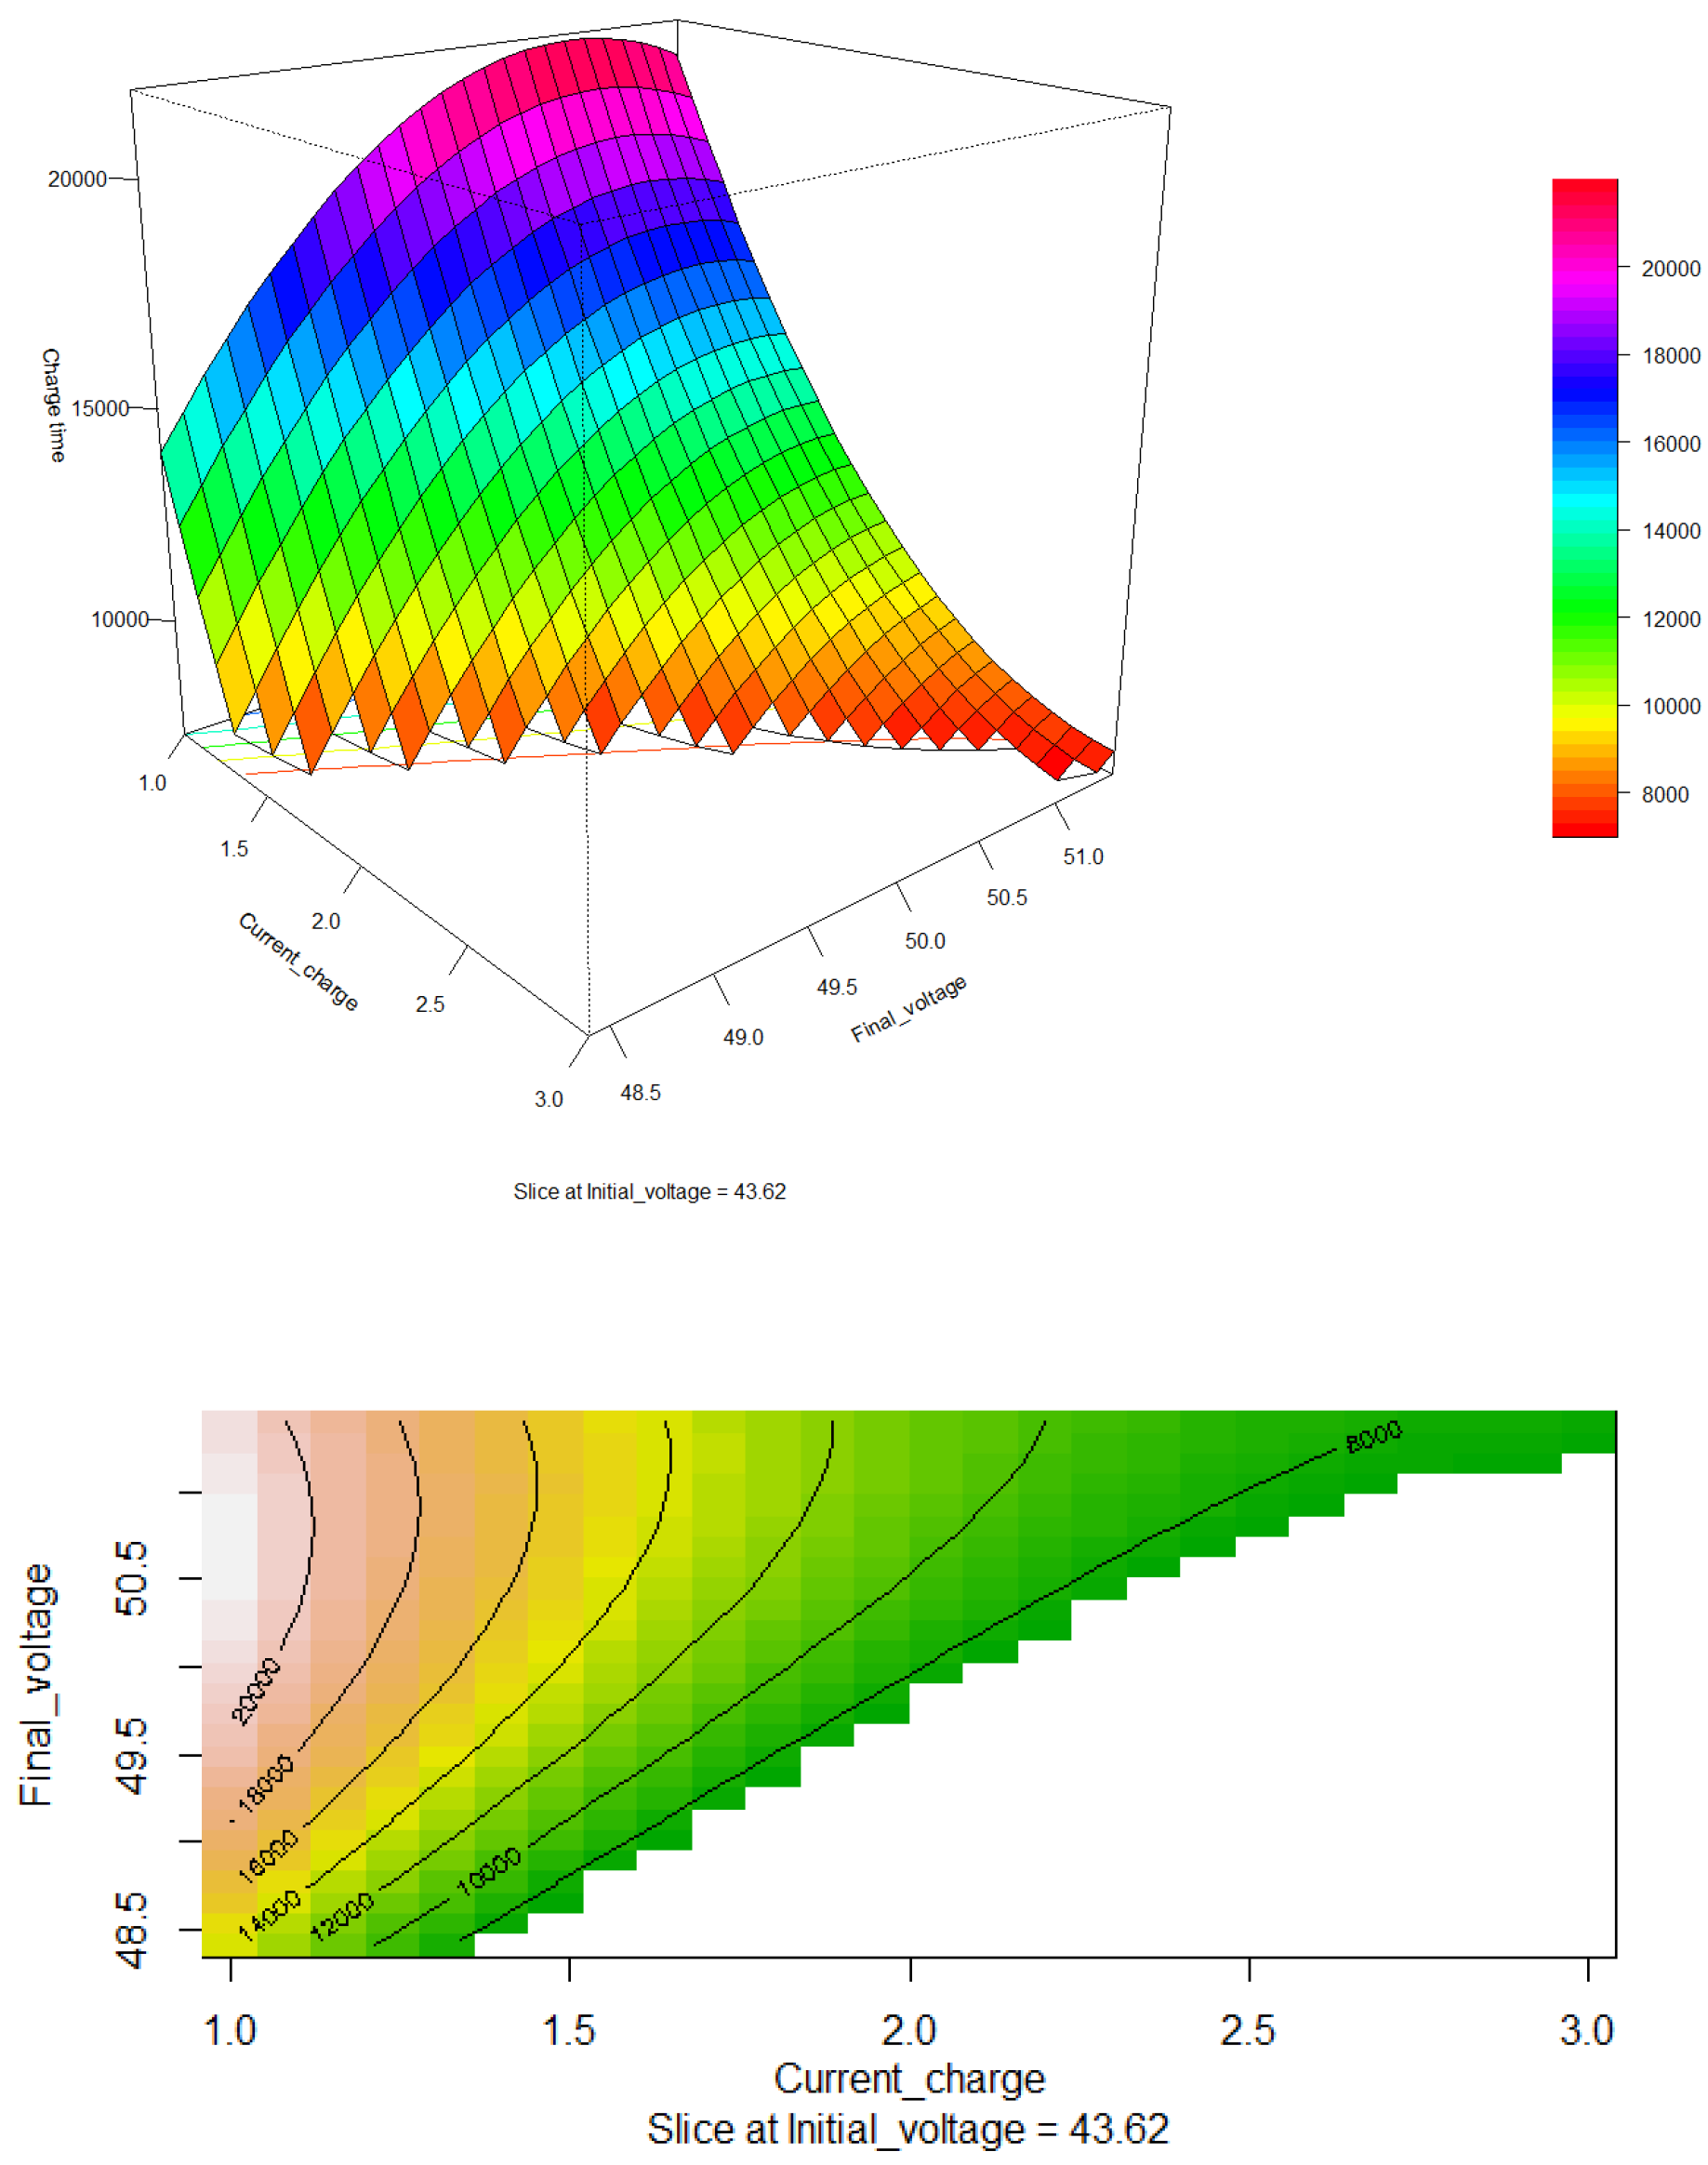
Table 2.
Variables and levels for the experimental design.
| Variable | Level values | ||
|---|---|---|---|
| Low (-1) | High (+1) | Central point (0) | |
| Initial voltage | 41.90 | 47.10 | 43.62 |
| Final voltage | 48.40 | 51.40 | 50.95 |
| Current | 1.00 | 3.00 | 1.87 |
Table 3.
Significance of the coefficients of the second order model.
| Variable | Estimated coefficient | Standard error | t-value | p-value |
|---|---|---|---|---|
| (Intercept) | 10847.14 | 59.01 | 183.81 | 0.0000297 |
| Initial voltage | -7623.16 | 132.58 | -57.50 | 0.0003023 |
| Final voltage | -925.51 | 111.35 | -8.31 | 0.0141686 |
| Current | 2160.70 | 328.60 | 6.58 | 0.0223553 |
| Initial voltage:Final voltage | 604.88 | 140.52 | 4.31 | 0.0499609 |
| Initial voltage:Current | 3188.83 | 983.85 | 3.24 | 0.0834490 |
| Final voltage:Current | -3081.11 | 1273.96 | -2.42 | 0.1367503 |
| Initial voltage2 | 3150.71 | 76.42 | 41.23 | 0.0005878 |
| Final voltage2 | -2187.42 | 153.35 | -14.27 | 0.0048787 |
| Current2 | -3245.88 | 1365.87 | -2.38 | 0.1406564 |
Table 4.
ANOVA for the second order model.
| Effect | Degree of freedom | Sum squared | Mean squared | F value | p-value |
|---|---|---|---|---|---|
| Individual | 3 | 252049528.00 | 84016509.00 | 32585.70 | 0.00 |
| Interactions | 3 | 11876795.00 | 3958932.00 | 1535.50 | 0.00 |
| Quadratic | 3 | 16040688.00 | 5346896.00 | 2073.80 | 0.00 |
| Residuals | 2 | 5157.00 | 2578.00 |
Table 5.
Optimal operating conditions.
| Initial voltage | Final Voltage | Current | Estimated charge time |
|---|---|---|---|
| 43.56 | 50.46 | 2.38 | 6961.08 |
Disclaimer/Publisher’s Note: The statements, opinions and data contained in all publications are solely those of the individual author(s) and contributor(s) and not of MDPI and/or the editor(s). MDPI and/or the editor(s) disclaim responsibility for any injury to people or property resulting from any ideas, methods, instructions or products referred to in the content. |
© 2024 by the authors. Licensee MDPI, Basel, Switzerland. This article is an open access article distributed under the terms and conditions of the Creative Commons Attribution (CC BY) license (http://creativecommons.org/licenses/by/4.0/).
Copyright: This open access article is published under a Creative Commons CC BY 4.0 license, which permit the free download, distribution, and reuse, provided that the author and preprint are cited in any reuse.


