1. Introduction
The implementation of sensors that consume minimal power and single node data transfer using narrowband network, are widely used in IoT systems. These systems are developed and deployed through countless applications, including medical [
1], global positioning systems [
2], intrinsic safety systems [
3] and light spectrum analysis systems [
4]. Regardless of the application in which the IoT system is deployed, all systems have certain aspects in common, such as a self-powered sensor with an internal or external battery, limited number of registers published into the network, data refresh rates greater than 1 second, and despite being interfaced into a single communication port, not all devices are synchronized with a real-time stamp. This affects any detailed analysis of the data acquired.
This paper aims to present a portable device using the Internet of Things (IoT), which combines industrial peripherals and sensors, providing a platform for the synchronization of systems used in general or specific applications, such as Photovoltaic farms, Wind Turbines, Hybrid Renewable Energy Systems (HRES) and general industrial application. The structure, topology, and interface of the portable IoT station will be described, and simplified examples of data formatting, pre-processing, published in a single communication bus network managed by a Programmable Logic Controller (PLC) will be provided.
Currently, any portable instrumentation utilized in a HRES for troubleshooting or performance evaluation acquires individual readings, which are not compiled, processed, or published into a network. This characteristic influences the overall productivity of the technician or engineering, which is assessing the system to identify an issue, or to acquire systematic metrics for predictive or corrective maintenance.
Depending on the occasion, a failure might occur at certain stages of the operation of the system that is being analyzed. For example, most failures in a photovoltaic installation occur when the solar irradiation or the temperature index is above certain levels, predefined by the system’s overall performance. When an individual rating is analyzed, the data synchronization and analysis might be inaccurate since the technician can only analyze each rating individually.
The synchronization of multiple systems through a single communication bus is essential for system optimization and load management since every data register utilizing each device must be delivered simultaneously to avoid data mismatch. Several platforms can be created in the portable IoT station, and each platform consists of hardware blocks, which can be customized to a specific application, being system control, supervision, or integration.
The objective of this paper is to propose a centralized solution, operating as an edge computer capable of collecting multiple readings from decentralized sensors, controllers, and peripherals eliminating any complications with data synchronization. Consequently, this allows the technician or engineer responsible for commissioning or troubleshooting the HRES to deploy this unit at any pre-existing system. This paper describes the overall performance of the portable IoT station, by analyzing the response time of a variable from field acquisition to visualization utilizing a MQTT server and a local hosted approach through a hardwired or Wi-Fi connection.
The methodology implemented in the portable IoT station follows edge computing principles. All variables and registers defined across a system are combined into a PLC, responsible for conditioning and publishing these variables and registers into a single Modbus Transmission Control Protocol and Internet Protocol (TCP/IP), Open Platform Communications United Architecture (OPC-UA) or Message Queuing Telemetry Transport (MQTT) server.
The concept of having a portable IoT station to compile multiple communication protocols into a single communication interface utilized for troubleshooting and analysis of HRES has already been discussed [
5]. This paper evolves the conceptual system into a prototype showing how the system can designed, assembled, and programmed to achieve its desired outcome. All components utilized in the portable IoT station are classified as industrial grade, by achieving and exceeding existing industry standards. By using these components, the portable IoT station is subsequently enabled to be deployed into any industrial application, including energy management and production.
This paper incorporates the following sections as follows:
Related Work
Review of Challenges in Portable IoT Systems
System Structure
Considerations for Cyber Security
System Topology
System Implementation
System Commissioning
Performance Results and System Optimization
Future Work
Conclusions
2. Related Work
As stated previously, there are various applications for portable IoT systems. Over the last few years, the need for weather stations propelled the implementation of sensors interconnected through a mesh topology network, forming a decentralized application of IoT systems. This topic is outlined by Novianty et al. [
6]. The authors proposed a cost-effective solution, supported by a prototype which enabled the direct communication between the sensor and the MQTT server. A similar approach for low cost IoT system was implemented by Anik et al. [
7]. However, the authors decided to integrate the sensors into a Building Data Lite (BDL), instead of reporting the data through a mobile app or webserver. Several other authors utilized a low-cost IoT hardware to implement weather sensors into a decentralized network with microcontroller-based platforms, such as Arduino, Raspberry-PI and NodeMCU [
8,
9,
10]. Despite having an accessible hardware based in a low-cost platform, each of these systems presents limitations on the product life span and data refresh rate.
In 2023 Hachisuca et al. [
11] developed a prototype combining customized hardware with sensors commonly used in weather stations to create an ideal solution for agricultural applications. The topology proposed used most of the potential of IoT systems in a decentralized application, connecting several nodes into a single IoT gateway and reporting the data to a MQTT server network. This topology was also utilized by Dubey et al. [
12] in 2023. Dubey and associates aimed to create new farming process based on the data collected across the farm, including the integration of the IoT system with irrigation systems.
In both papers, Hachisuca et al. and Dubey et al. addressed the creation of flags and alarms which can trigger an additional process, correlating the IoT network with a supervisory system, ensuring that an action is taken based on the status of the farm. This approach was also utilized by Gsangaya et al. [
13] notwithstanding the fact that having a decentralized network of sensors with self-power platforms counting on battery storage only introduces limitations to the overall autonomy of the system. Furthermore, to address energy limitations of a decentralized IoT network, Warnakulasooriya et al. [
14] developed a portable weather station with IoT network coupled with a solar charger to power the internal battery bank, significantly increasing the autonomy of the system.
The implementation of auxiliary power systems coupled with a portable or fixed IoT system was also implemented by Mariadass et al. [
15], with a potable solar mobile system, operating as a power distribution device, providing AC and DC energy supplies for general applications. Unlike other prototypes and topologies already cited in this paper, Mariadass et al. did not aim to have a decentralized IoT network; instead they wanted to use the IoT network to report the status of their prototype which consisted of a battery cell, solar charger, solar panels, modular power supply and an inverter. The same structure was utilized by Putra et al. [
16,
17]. These researchers utilized a redundant communication network with LoRaWAN and Wi-Fi, to ensure that either communication protocol would reach the MQTT sever.
Each system referenced as a relevant work, uses certain aspects of the system topology and hardware structure implemented on the portable IoT station. Unfortunately, the system proposed in this paper does not have a direct comparison for its hardware structure, firmware configuration and desired application. Nonetheless the literature review allowed some of the challenges commonly identified in IoT systems to be highlighted and addressed on the portable IoT station.
Currently there are no records of a portable IoT station which has configurable hardware, programmable logic controller, internal uninterruptable power supply, redundant communication protocols and multiport hardware interface. These features are a consequence of a new architecture compiling several communication protocols, enabling various components, sensors, and gateways to receive, process and synchronize the data collected. Meanwhile reporting or publishing it to a dedicated server is presented.
3. Review of Challenges in Portable IoT Systems
Based on the latest publications of portable IoT systems, challenges can be summarized as follows:
3.1. Data Flow and Refresh Rate
To address the data flow and refresh rate issues on IoT systems with decentralized networks, the portable IoT station increases the data flow bandwidth to the user interface with alternative communication protocols, which includes LTE and direct Wi-Fi connection. Several factors may impact on the data flow bandwidth in a wireless network. In this paper, a comparison between wired and wireless network was done, based on: firstly, the amount of data submitted; and secondly, the time required for the system to be updated through the network.
In addition to the comparison conducted between wired and wireless networks, both systems had a data latency reduction on the overall processing time required by the PLC to receive and publish a global variable back to the gateway with the implementation of input filters with conditional functional blocks at the web interface of the PLC. These filters are configurable and can include basic logic functions. In both applications presented in this paper, three filters were applied, ensuring that only registers with variations above 5% of the previously registered value are transmitted to the rest of the network.
3.2. Energy Autonomy
To address the energy autonomy, the portable IoT station has an uninterrupted power supply designed based on the IEEE Std 485-2020. Allowing the portable IoT station to be operational from 1.5 to 2 hours depends on the number of inputs connected to the PLC interface. As well, the station has a power supply integrated, allowing the station to be stationary.
3.3. Redundant Communication Protocol
There are in total eight communication protocols implemented into the portable IoT station, Wi-Fi, LoRaWAN, LTE, Modbus RTU, Modbus TCP/IP, XanBus, LAN and USB (Serial). The data can also be published into a MQTT or OPC-UA server. In summary, there are at least two communication protocols available for every type of data transmission required in the portable IoT station:
Wireless communication: Wi-Fi, LoRaWAN and LTE.
Wired communication: Modbus TCP/IP, XanBus and LAN.
Serial communication: Modbus RTU and USB (serial).
4. System Structure
The hardware proposed for the portable IoT station is specifically designed to synchronize all data registers existing in an HRES. Its structure targets three main functions: power quality analysis, troubleshooting and system supervision. It is important to note that the proposed system is portable and needs to be self-powered. This feature enables the station to be transported to various locations and does not require additional infrastructure. This characteristic makes it possible for the portable IoT station to be connected directly to remote installations, for instance small photovoltaic installations or small energy storage systems, where standalone applications are commonly applied without a grid integration.
The portable IoT station is not only ideal for HRES but also for any industrial application where remote diagnosis or supervision is required. In addition to the flexibility provided by the portable IoT station, it allows the data to be displayed in many forms and gathered through direct USB and Ethernet connection or wirelessly, since all the data acquired by the station is published in a MQTT server via LTE or Wi-Fi connection. This process permits the system operator to visualize all data with a cell phone, laptop, or tablet through a web browser interface.
The hardware used and layout applied to the case enables the system to operate continuously in any environment with ambient temperatures varying from -10°C to 45°C. Using a PLC and an Energy Meter (EM) means that the system acquires voltage and current, and its fundamental characteristics, such as frequency, harmonic distortion, power factor and load characteristics.
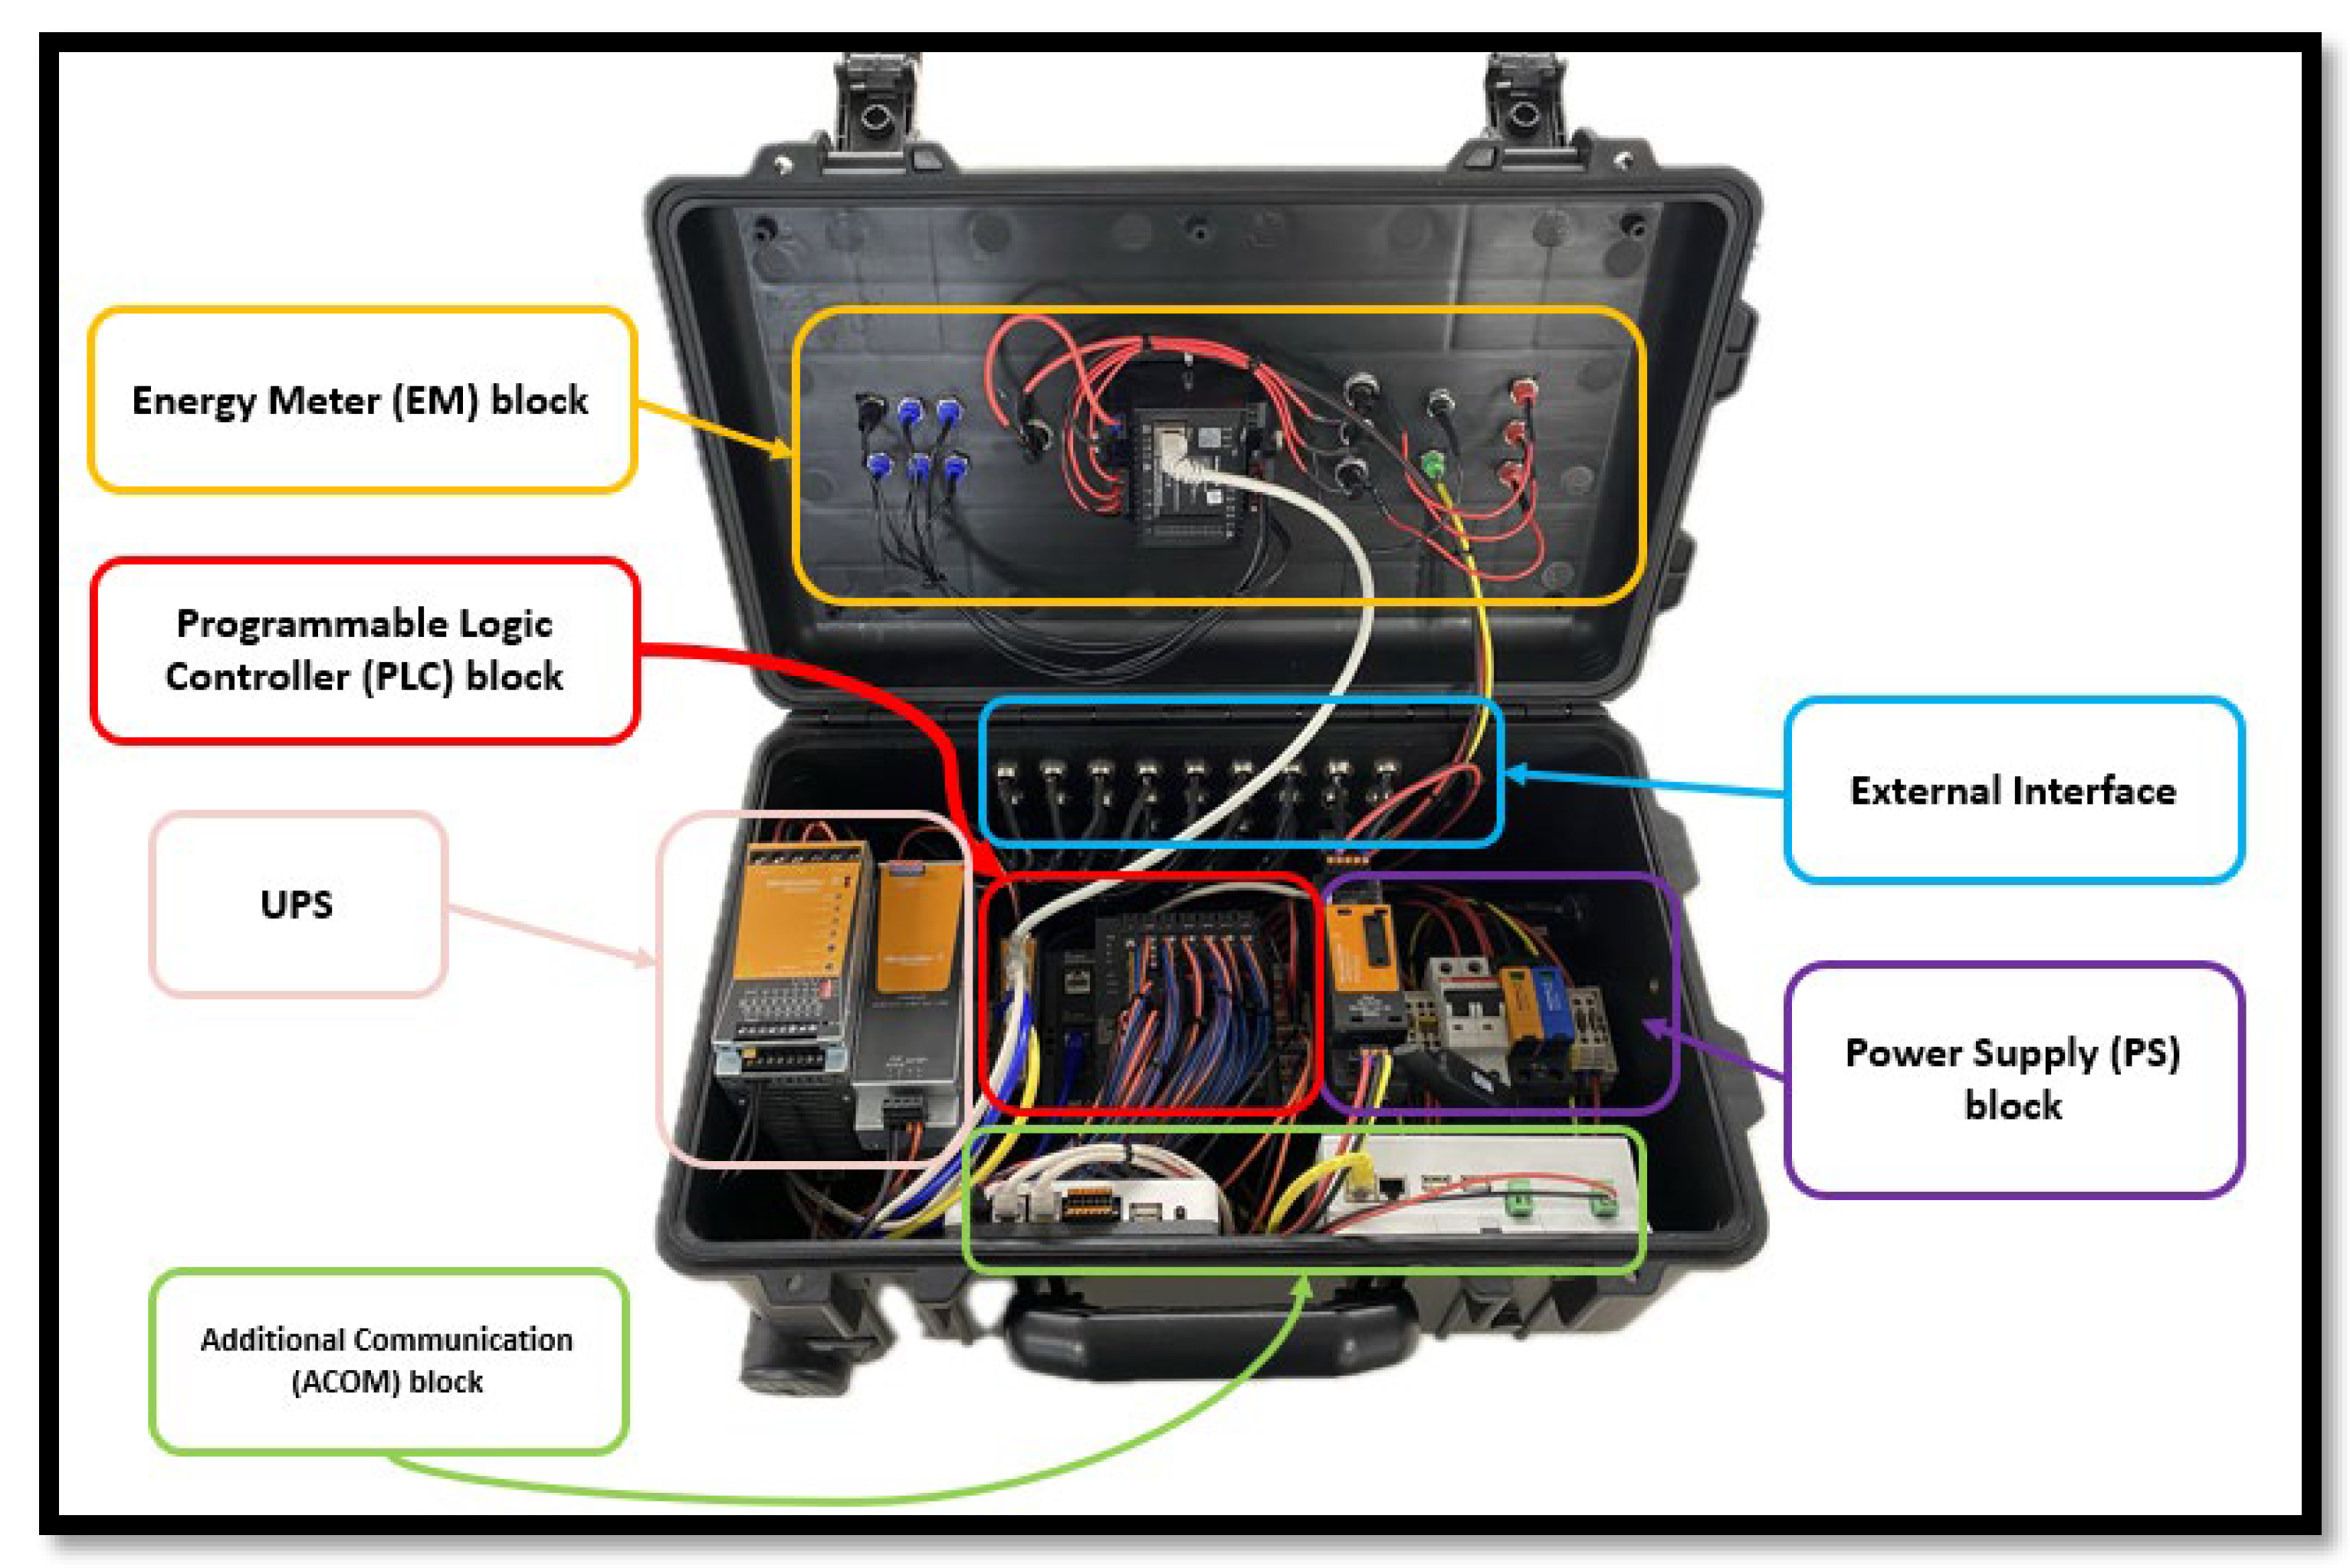
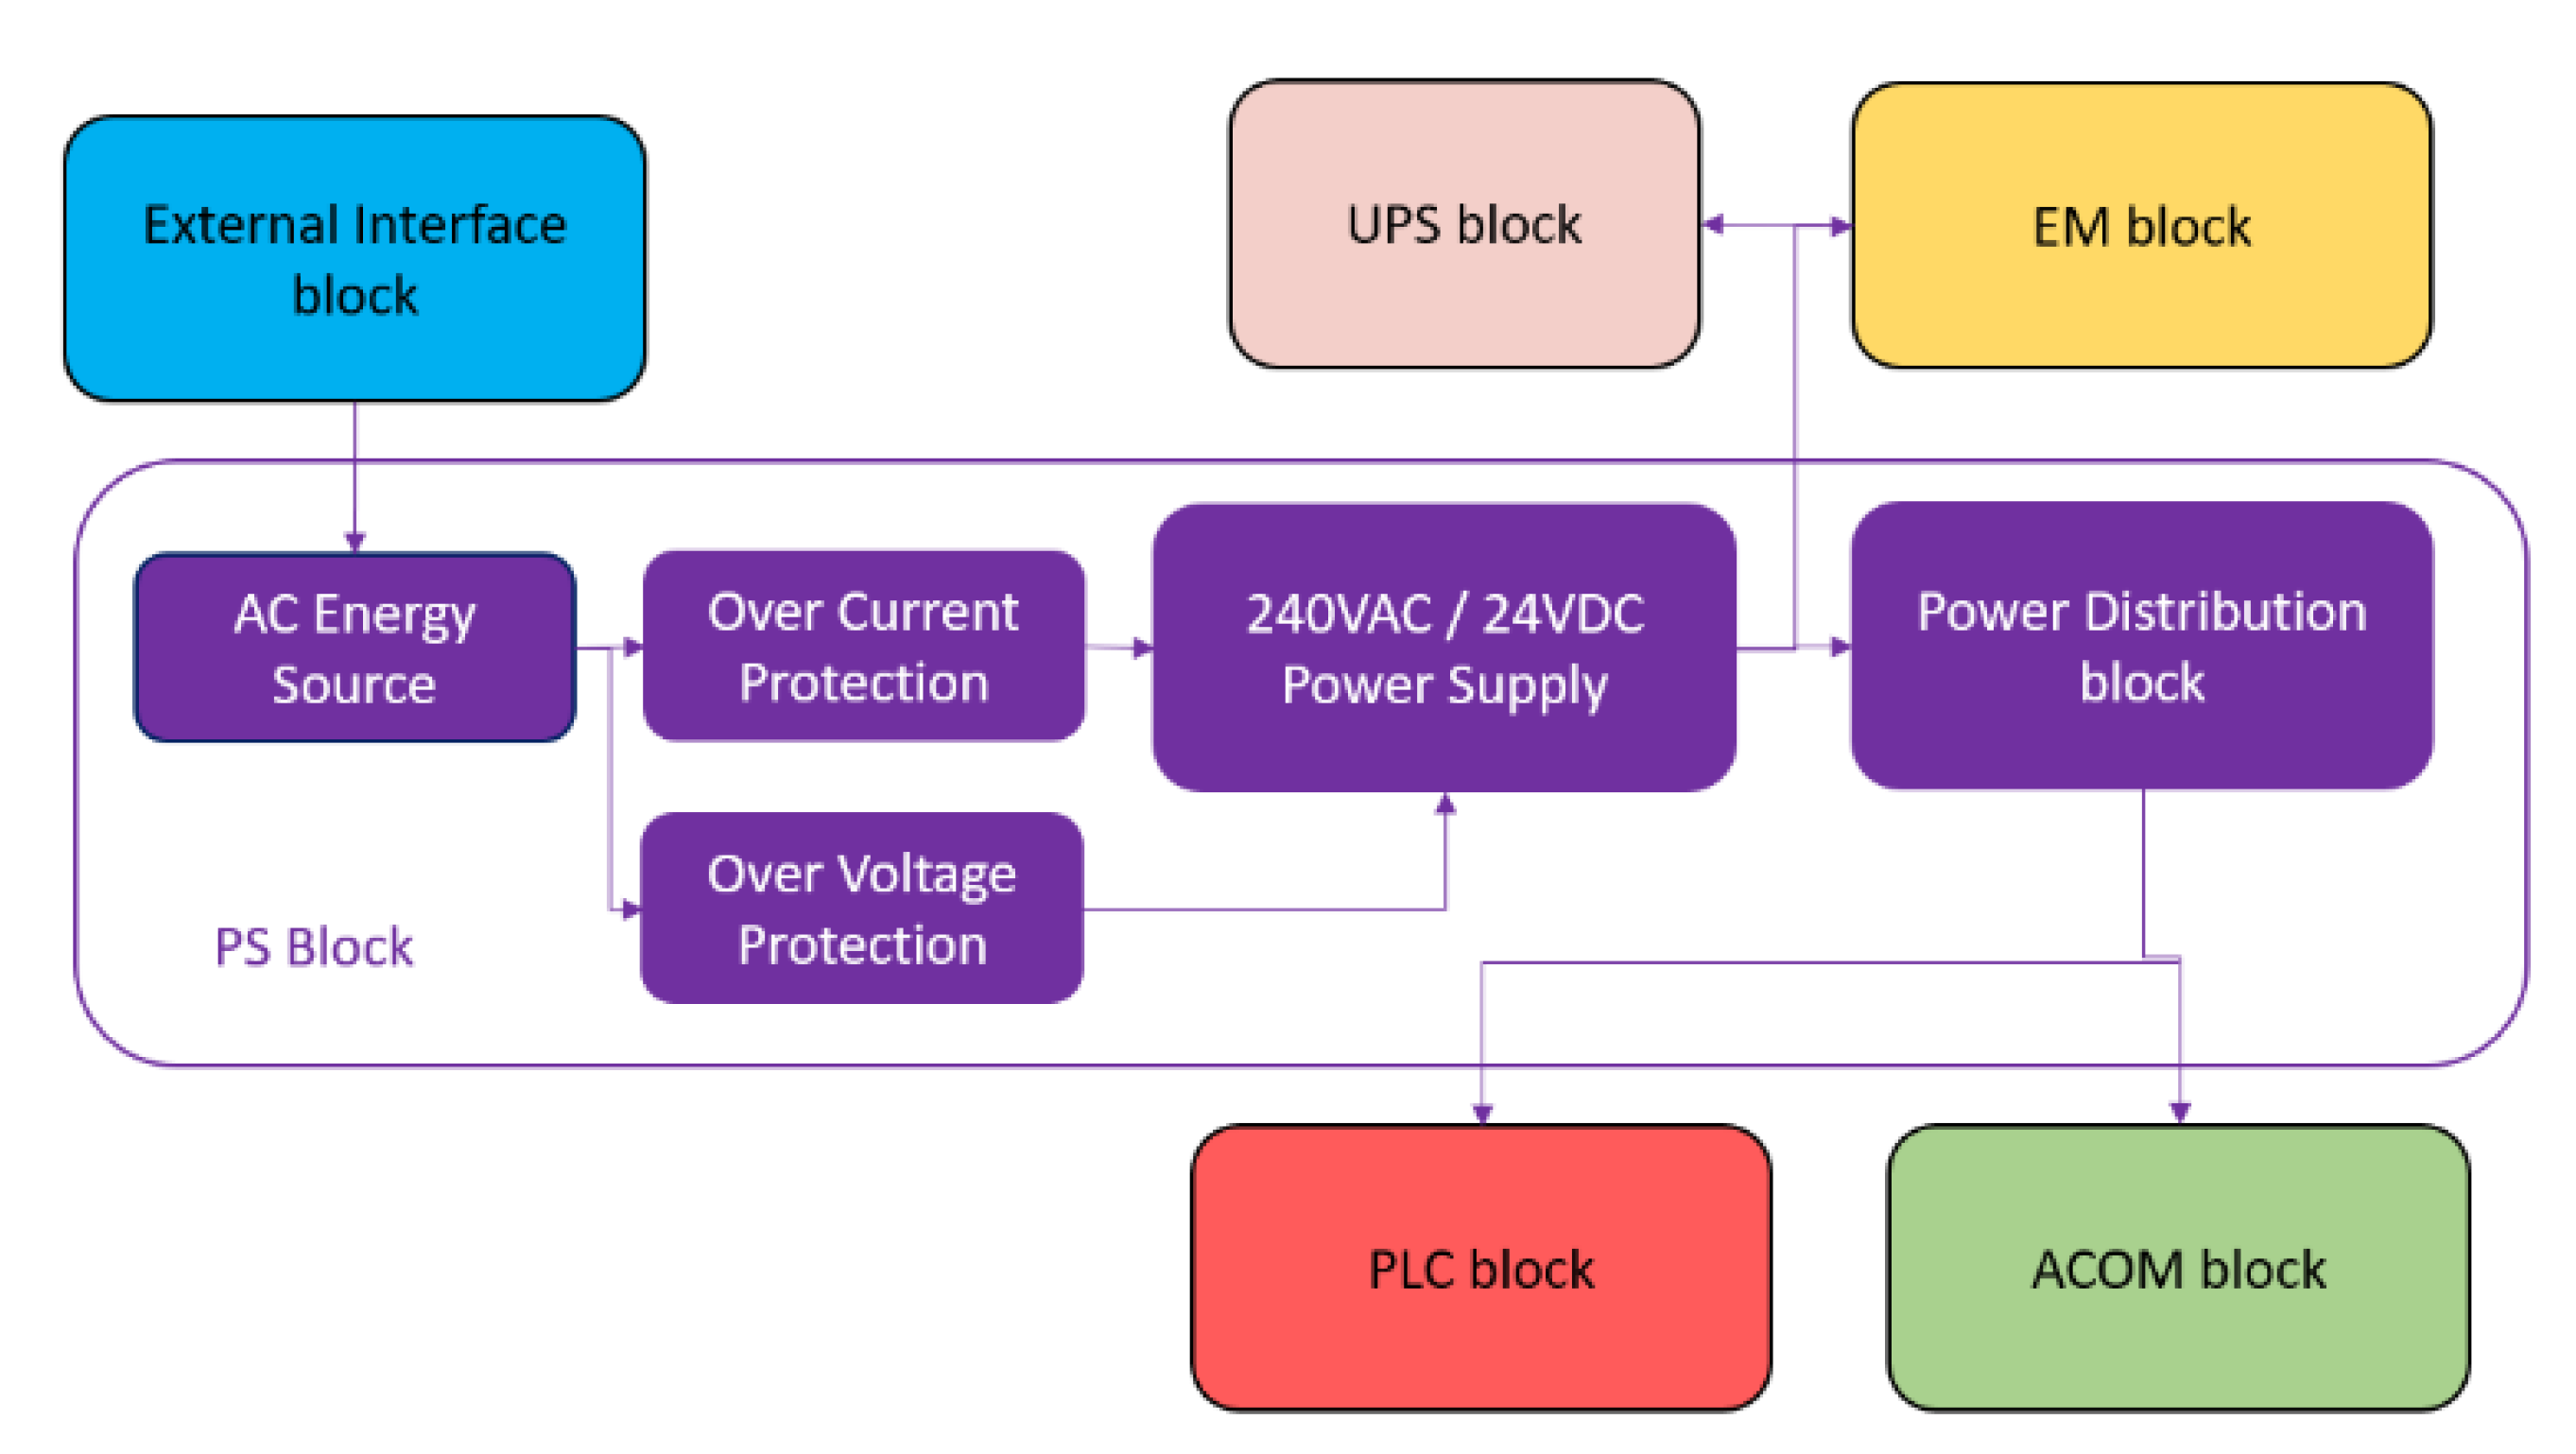
The system integrated into the portable IoT station has a block structure classified into five independent systems.
Figure 1 depicts the general arrangement of the internal assembly used on the portable IoT station; it also illustrates the location of each block structure.
The following table documents the list of materials used in the portable IoT station, and this list can be used to replicate the prototype presented in this paper.
4.1. Power Supply (PS)
The PS block allows the portable IoT station to have the UPS charged, as well as have the means to operate indefinitely. This is possible as long as an external energy source with nominal voltage varying from 110 to 240VAC is supplied and connected to the unit.
4.2. Uninterruptible Power Supply (UPS)
The UPS block enables the station to be energized without an external energy source, allowing the unit to be operational during transport. The topology applied to this block is essential to ensure that the unit can be fully portable, allowing up to 2 hours of autonomy based on the battery module installed of 3400mAh.
The UPS control has an inbuilt DC/DC converter, which ensures stability at the 24 VDC line until the battery module reaches its limits based on the State of Charger (SoC) pre-defined inside the UPS control module. To achieve the optimal longevity of the battery module, the UPS control is configured to maintain a charge rate of 0.4 C. Therefore, it is required to have the system connected to the main supply for at least 2.5 hours to have the battery module fully charge.
4.3. Energy Meter (EM)
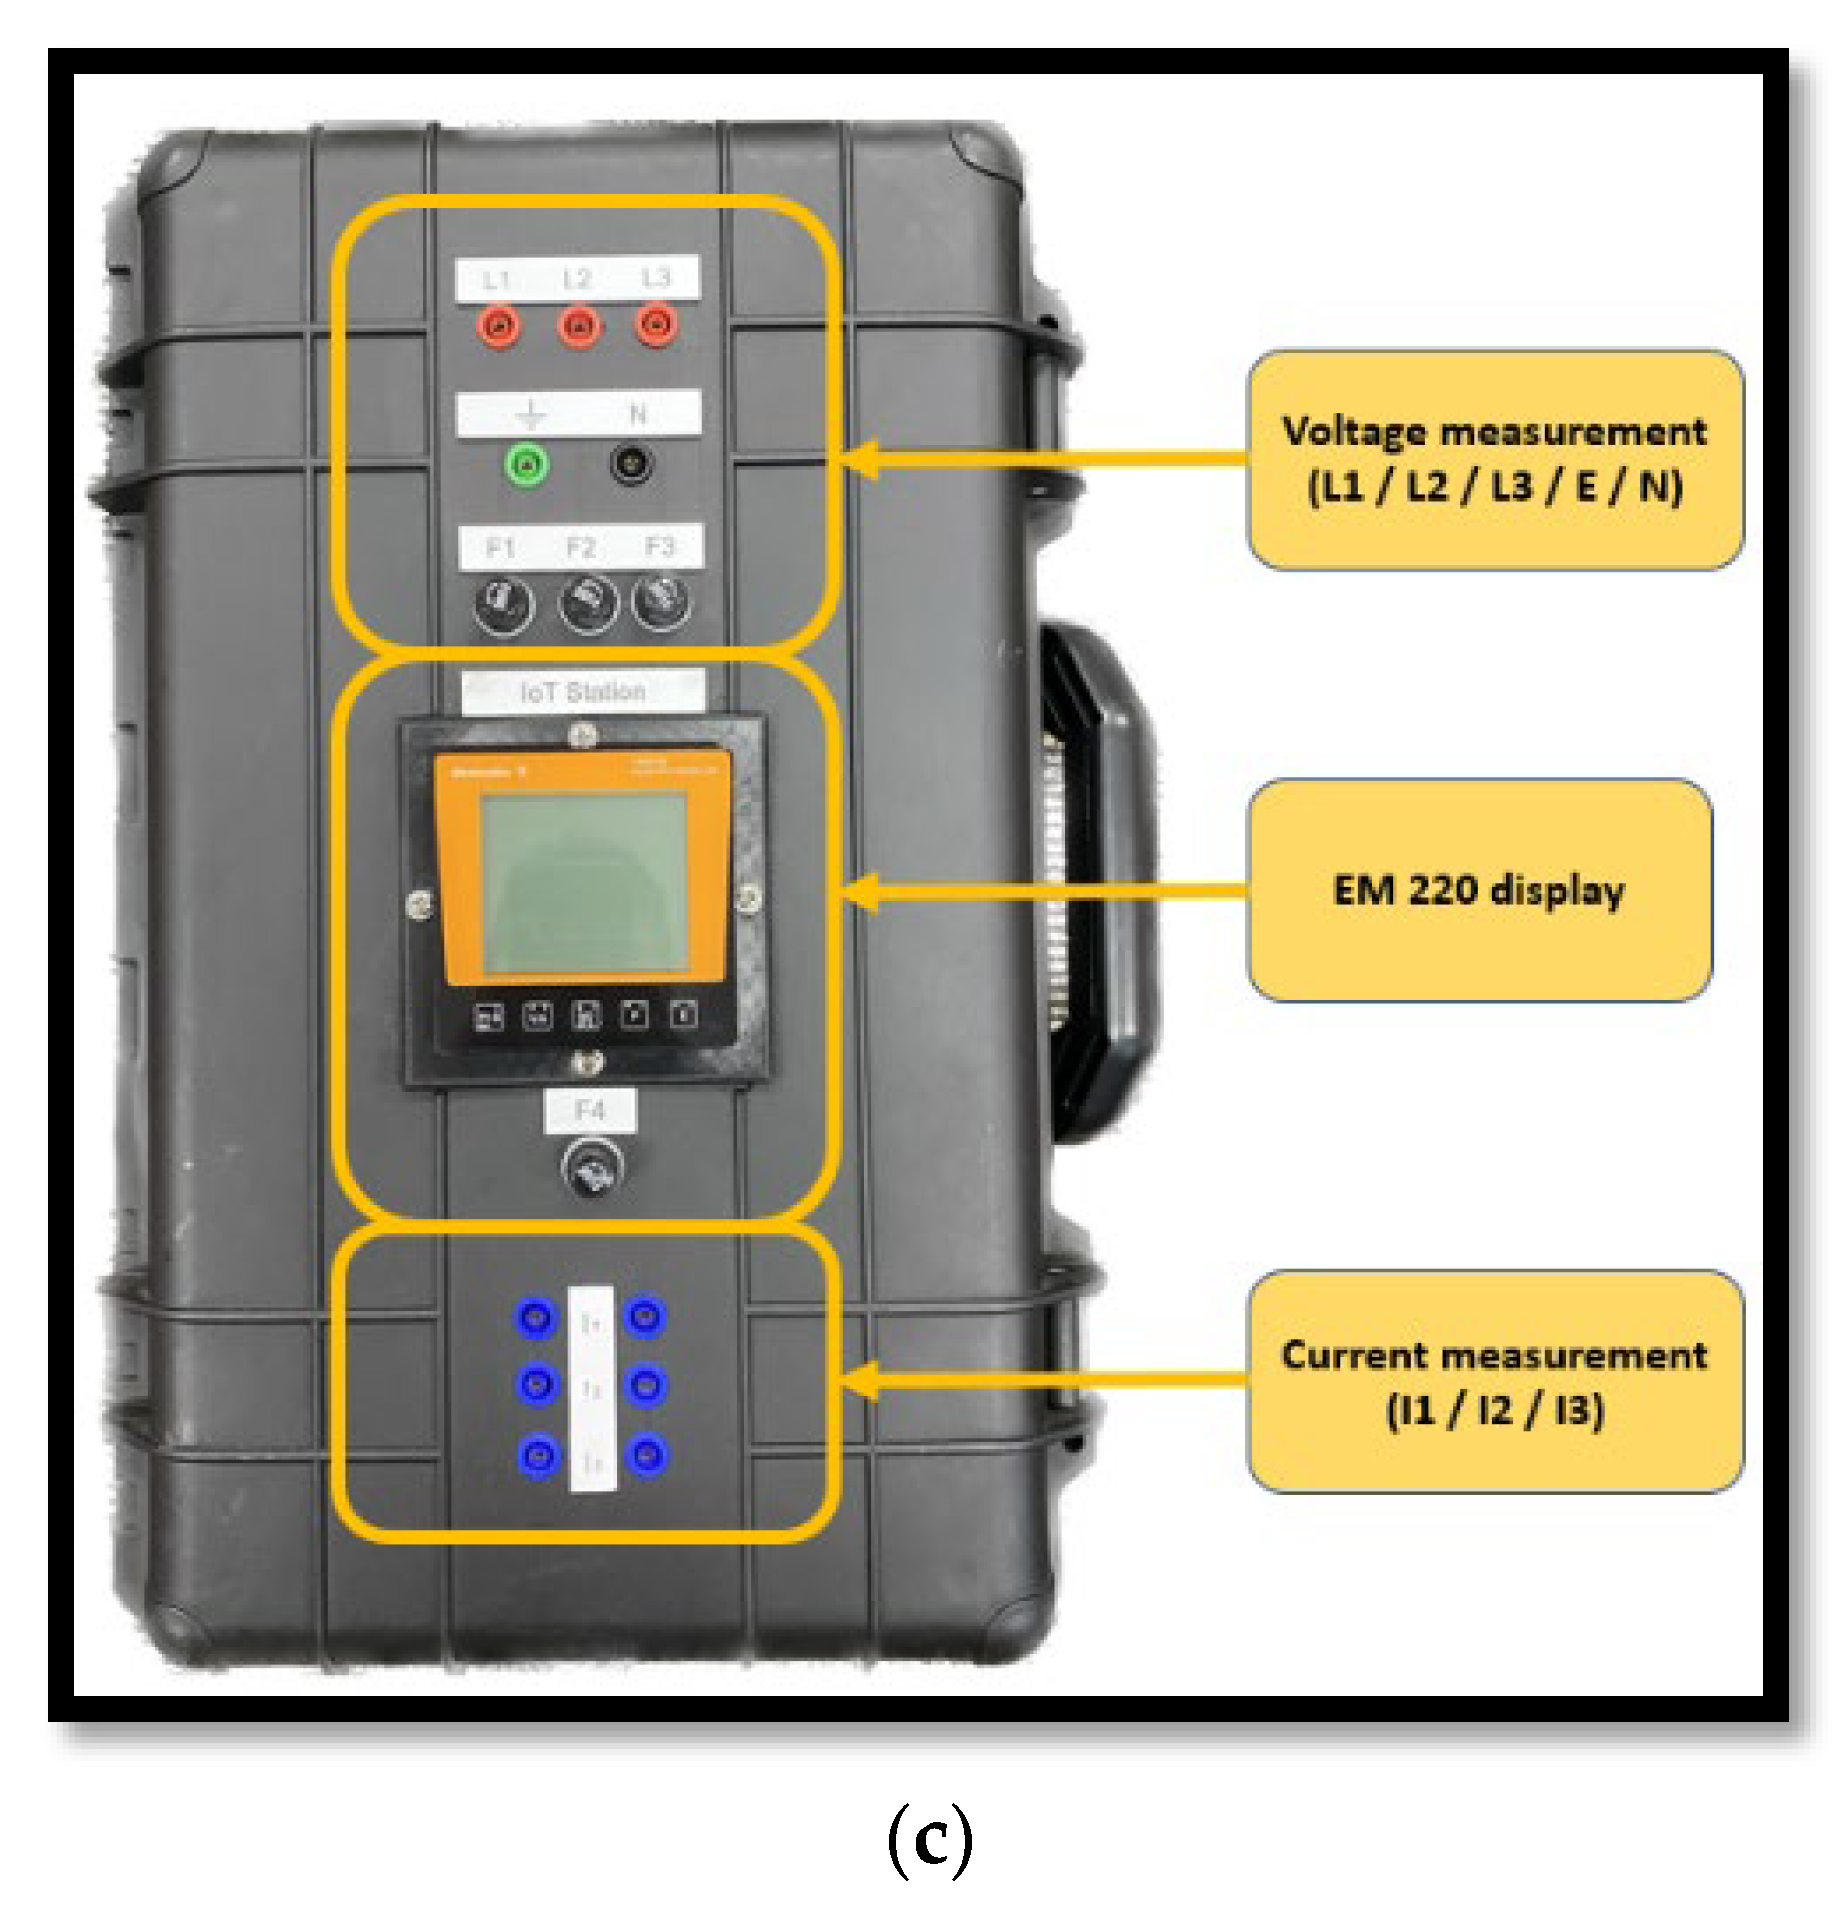
The EM block allows the data acquisition of the electrical characteristics of any system connected through the external interface depicted in
Figure 3. This block is essential for troubleshooting and commissioning since it allows the operator to analyze the electrical system. The hardware was adapted to have external overcurrent protection at every connection point and calibrated with a current transformer calibrated to a ratio of 100:1 ampere. The implementation of this block is executed by a meter directly connected to the desired section of the system that is to be analyzed.
The hardware adaptation undertaken on the EM block enables the portable IoT system to connect to a single or three-phase system, with line-to-line voltages up to 440 volts AC and line currents up to 500 amperes.
Macros pre-configured into the energy meter can detect Total Harmonic Distortion (THD), individual harmonic distortion of voltage and current up to the 63rd harmonic, line frequency, power factor, load characteristics, active, reactive, apparent power, phase sequence, and any fault related to the overall power quality of the system that is analyzed.
Inside the firmware of the energy meter, an algorithm is responsible for load predictability since the unit stores the occurrence of peak loads and attempts to map patterns with the date and time of those events. To communicate the data from the EM to the rest of the portable IoT station, a Modbus TCP/IP connection is utilized. There are dedicated registers to access the data logged into the unit, and based on that, there is no need for additional filtering or conditional code lines on the data exported by the EM 220.
4.4. Programmable Logic Controller (PLC)
The PLC block controls, converts, and manages all the other devices inside the IoT station. This block addresses dataflow and refresh rates issues on the portable IoT station, with an internal filter applied into its registers combined with an edge computing topology, combining all registers from the network into a single communication protocol.
All functions on the PLC are adjusted and customized depending on the level of integration desired. The PLC utilized in this project has configurable modules that can be attached to the system, enabling digital and analogue inputs and outputs. It also has a serial module to interface with any device using serial Recommended Standard (RS) 485 or RS232.
Typically, catastrophic fault conditions such as ground faults, grid islanding, system overcurrent, overvoltage and undervoltage will force the Power Conversion Unit (PCU) to send a signal with an external relay contact, indicating that a fault has occurred. The PLC configuration shown in this paper allows a total of 16 analogue inputs, four digital inputs, and four dedicated inputs for Resistance Temperature Detector (RTD).
In addition to the hardware customization, the PLC can communicate directly to an OPC-UA and MQTT server via an ethernet connection. This enables the publication of its global variables into a Supervisory Control and Data Acquisition (SCADA) system, or have its variables locally published to a Human Machine Interface (HMI). Referring to the portable IoT station, the PLC is connected via Modbus TCP/IP to the rest of the system. It uses 4G LTE internet to publish its global variables to an MQTT server. The 4G network is generated by a modem which establishes a direct connection to the MQTT server.
4.5. Additional Communication (ACOM)
The ACOM block allows the portable IoT station to initiate a direct interface with several communication protocols, enabling redundant communication lines to be implemented. This block is composed of gateways integrating several communication protocols into a single Modbus TCP network. One of the gateways is dedicated to the XanBus protocol, which is a communication protocol deployed by Schneider Electric. It serves in portable IoT station to interface Power Conversion Units (PCU), including inverters, rectifiers, Battery Management Systems (BMS) and Transformers.
The gateway used to establish XanBus communication uses Modbus TCP/IP to communicate with the rest of the portable IoT station network. The system layout allows any gateway to interact with the portable IoT station if a Modbus port is available in the gateway. To complement the network interface of the portable IoT station, a low-power, wide area networking protocol built on LoRa radio communication (LoRaWAN) gateway developed by Wattsense was incorporated into the system, converting the data from the LoRaWAN band to Modbus TCP/IP.
4.6. External Interface
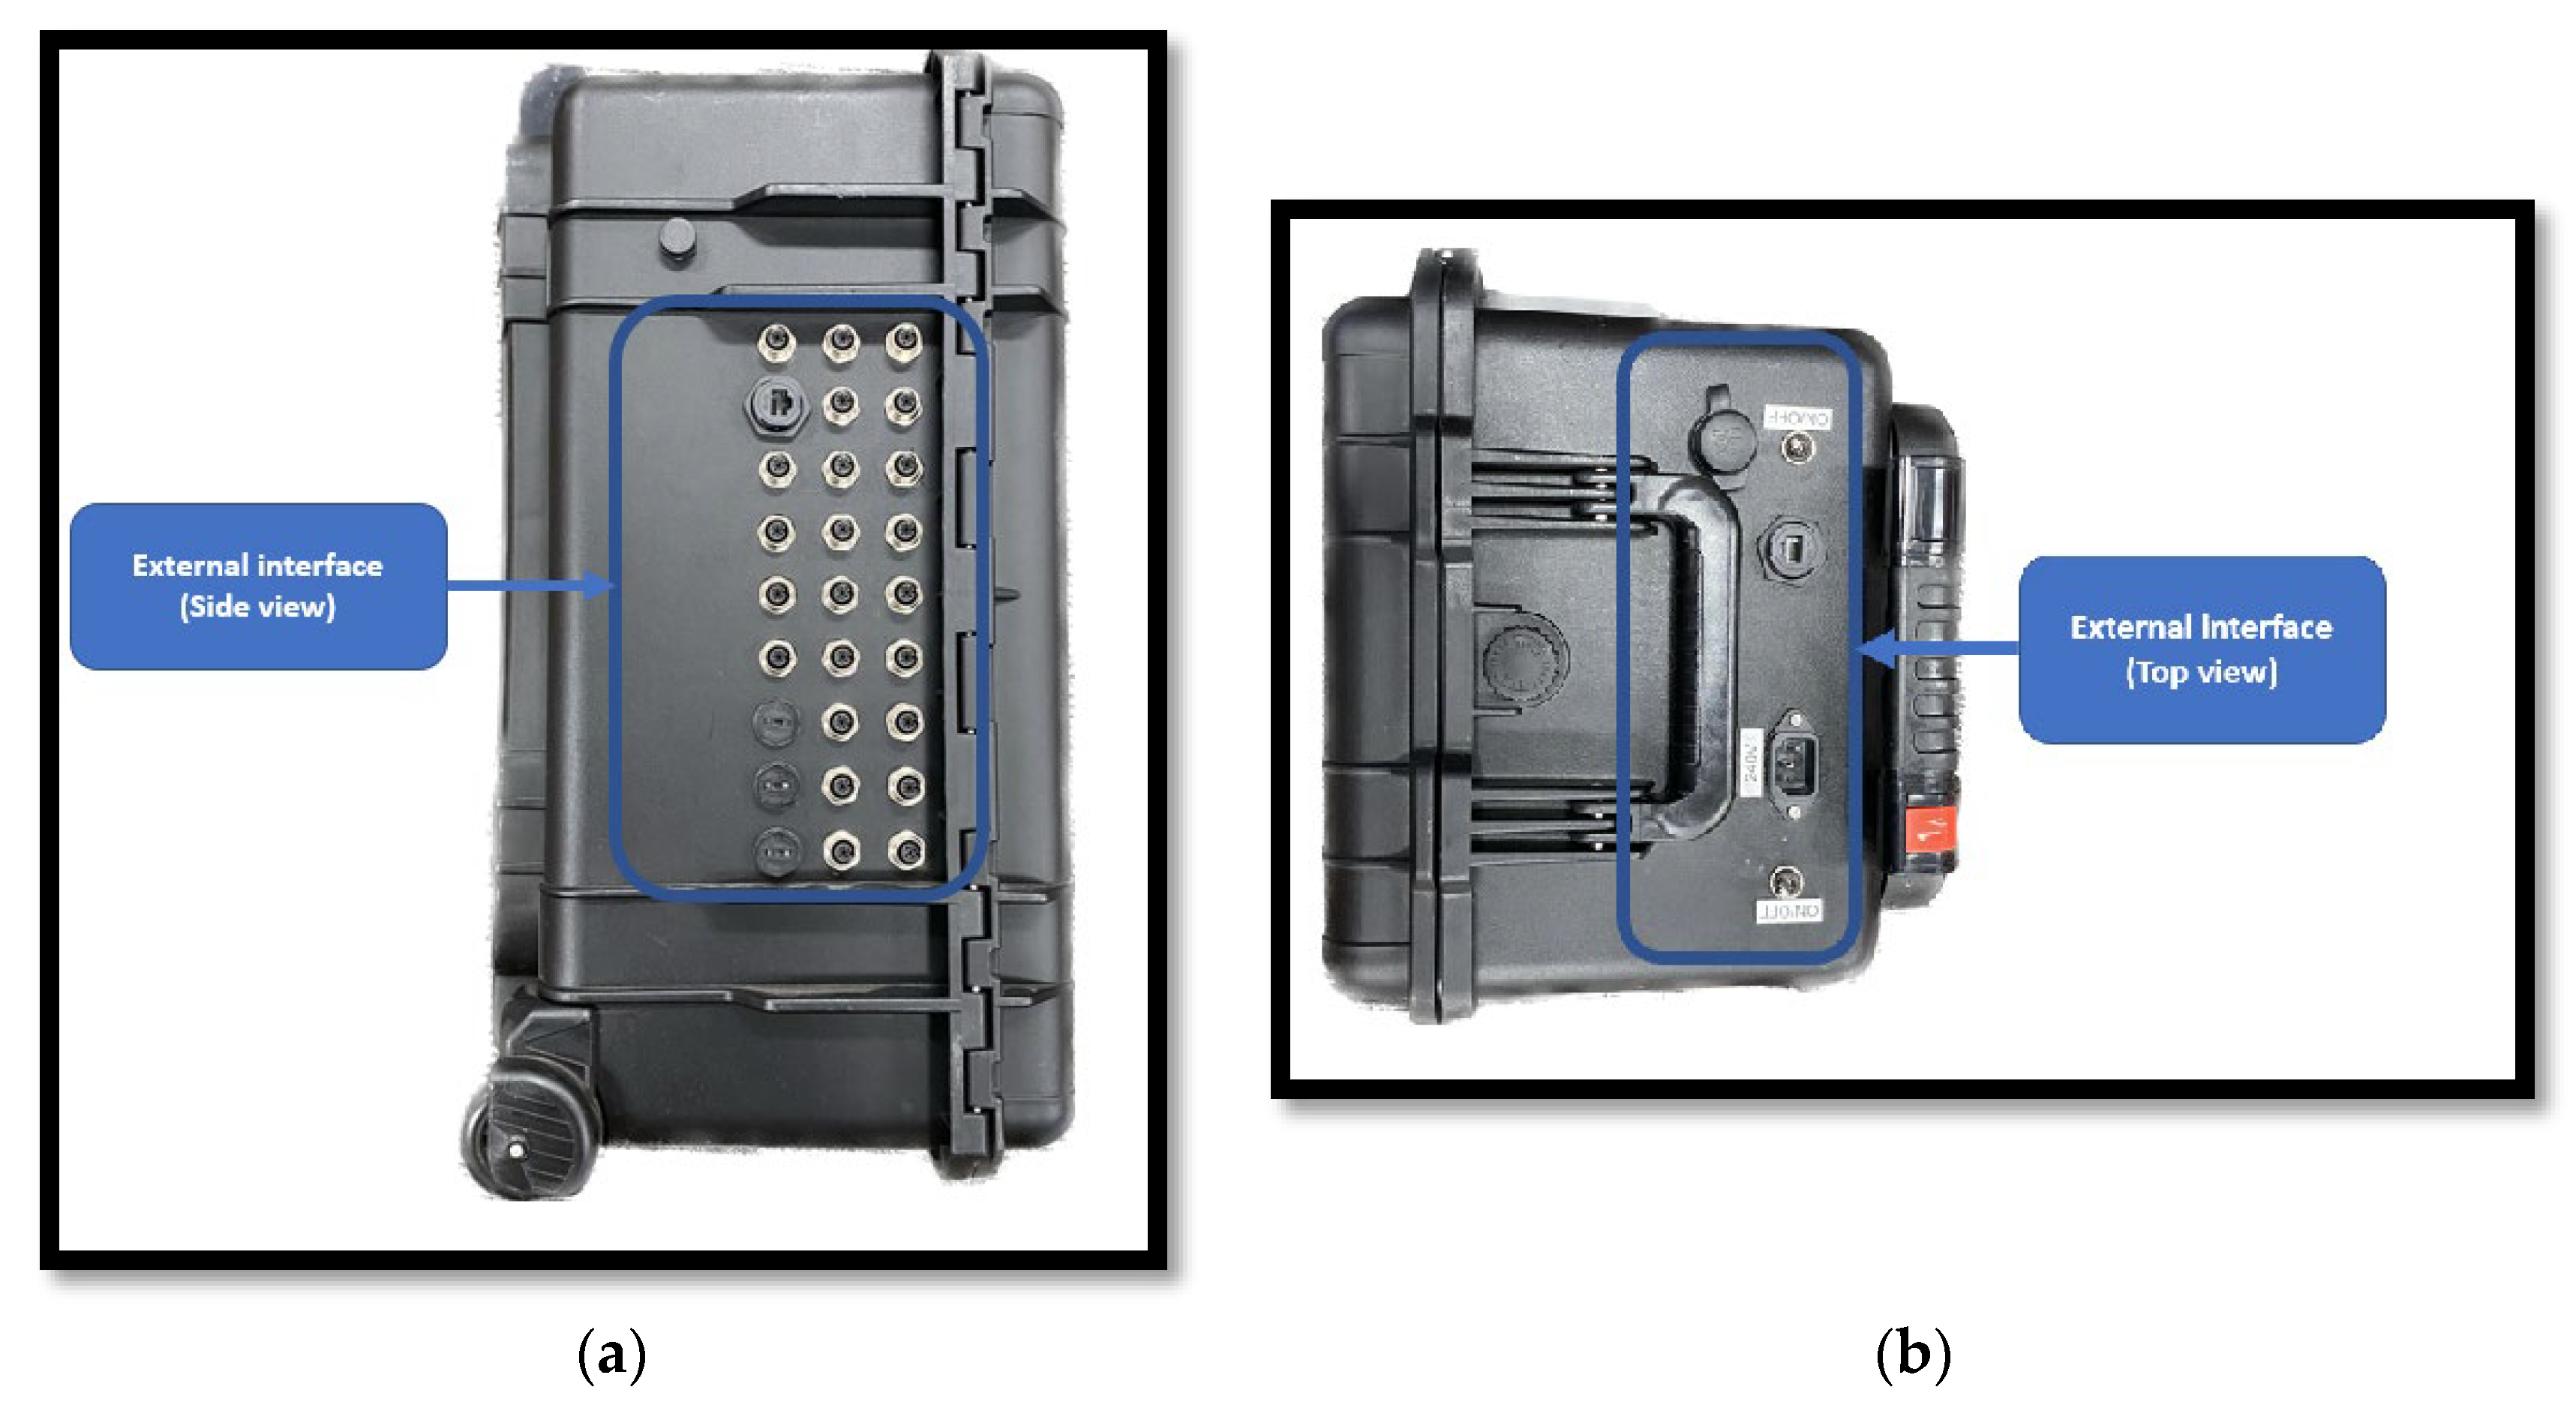
To integrate the portable IoT station with external systems a connection interface was developed. It assists the system operator with direct access to all ports required for the system integration, including USB, Ethernet, and 4-wire direct ports.
5. Considerations for Cyber Security
All communication devices used in the portable IoT Station comply with the following standards:
17) IEC 62443-1-1:2009- Industrial communication networks - Network and system security - Part 1-1: Terminology, concepts, and models.
18) IEC 62443-2-1:2010- Industrial communication networks - Network and system security - Part 2-1: Establishing an industrial automation and control system security program.
19) IEC 62443-3:2013- Industrial communication networks - Network and system security - Part 3-3: System security requirements and security levels
Each of these standards specify encrypt communication protocols and local host passwords, ensuring restricted access to the system no matter which communication bus is utilized.
6. System Topology
As stated previously, the objective of the portable IoT station is to combine multiple systems into a single communication bus following the principles of an edge computer. The system topology might vary depending on, firstly, the objective of the portable station and, secondly, the equipment required to connect to the unit.
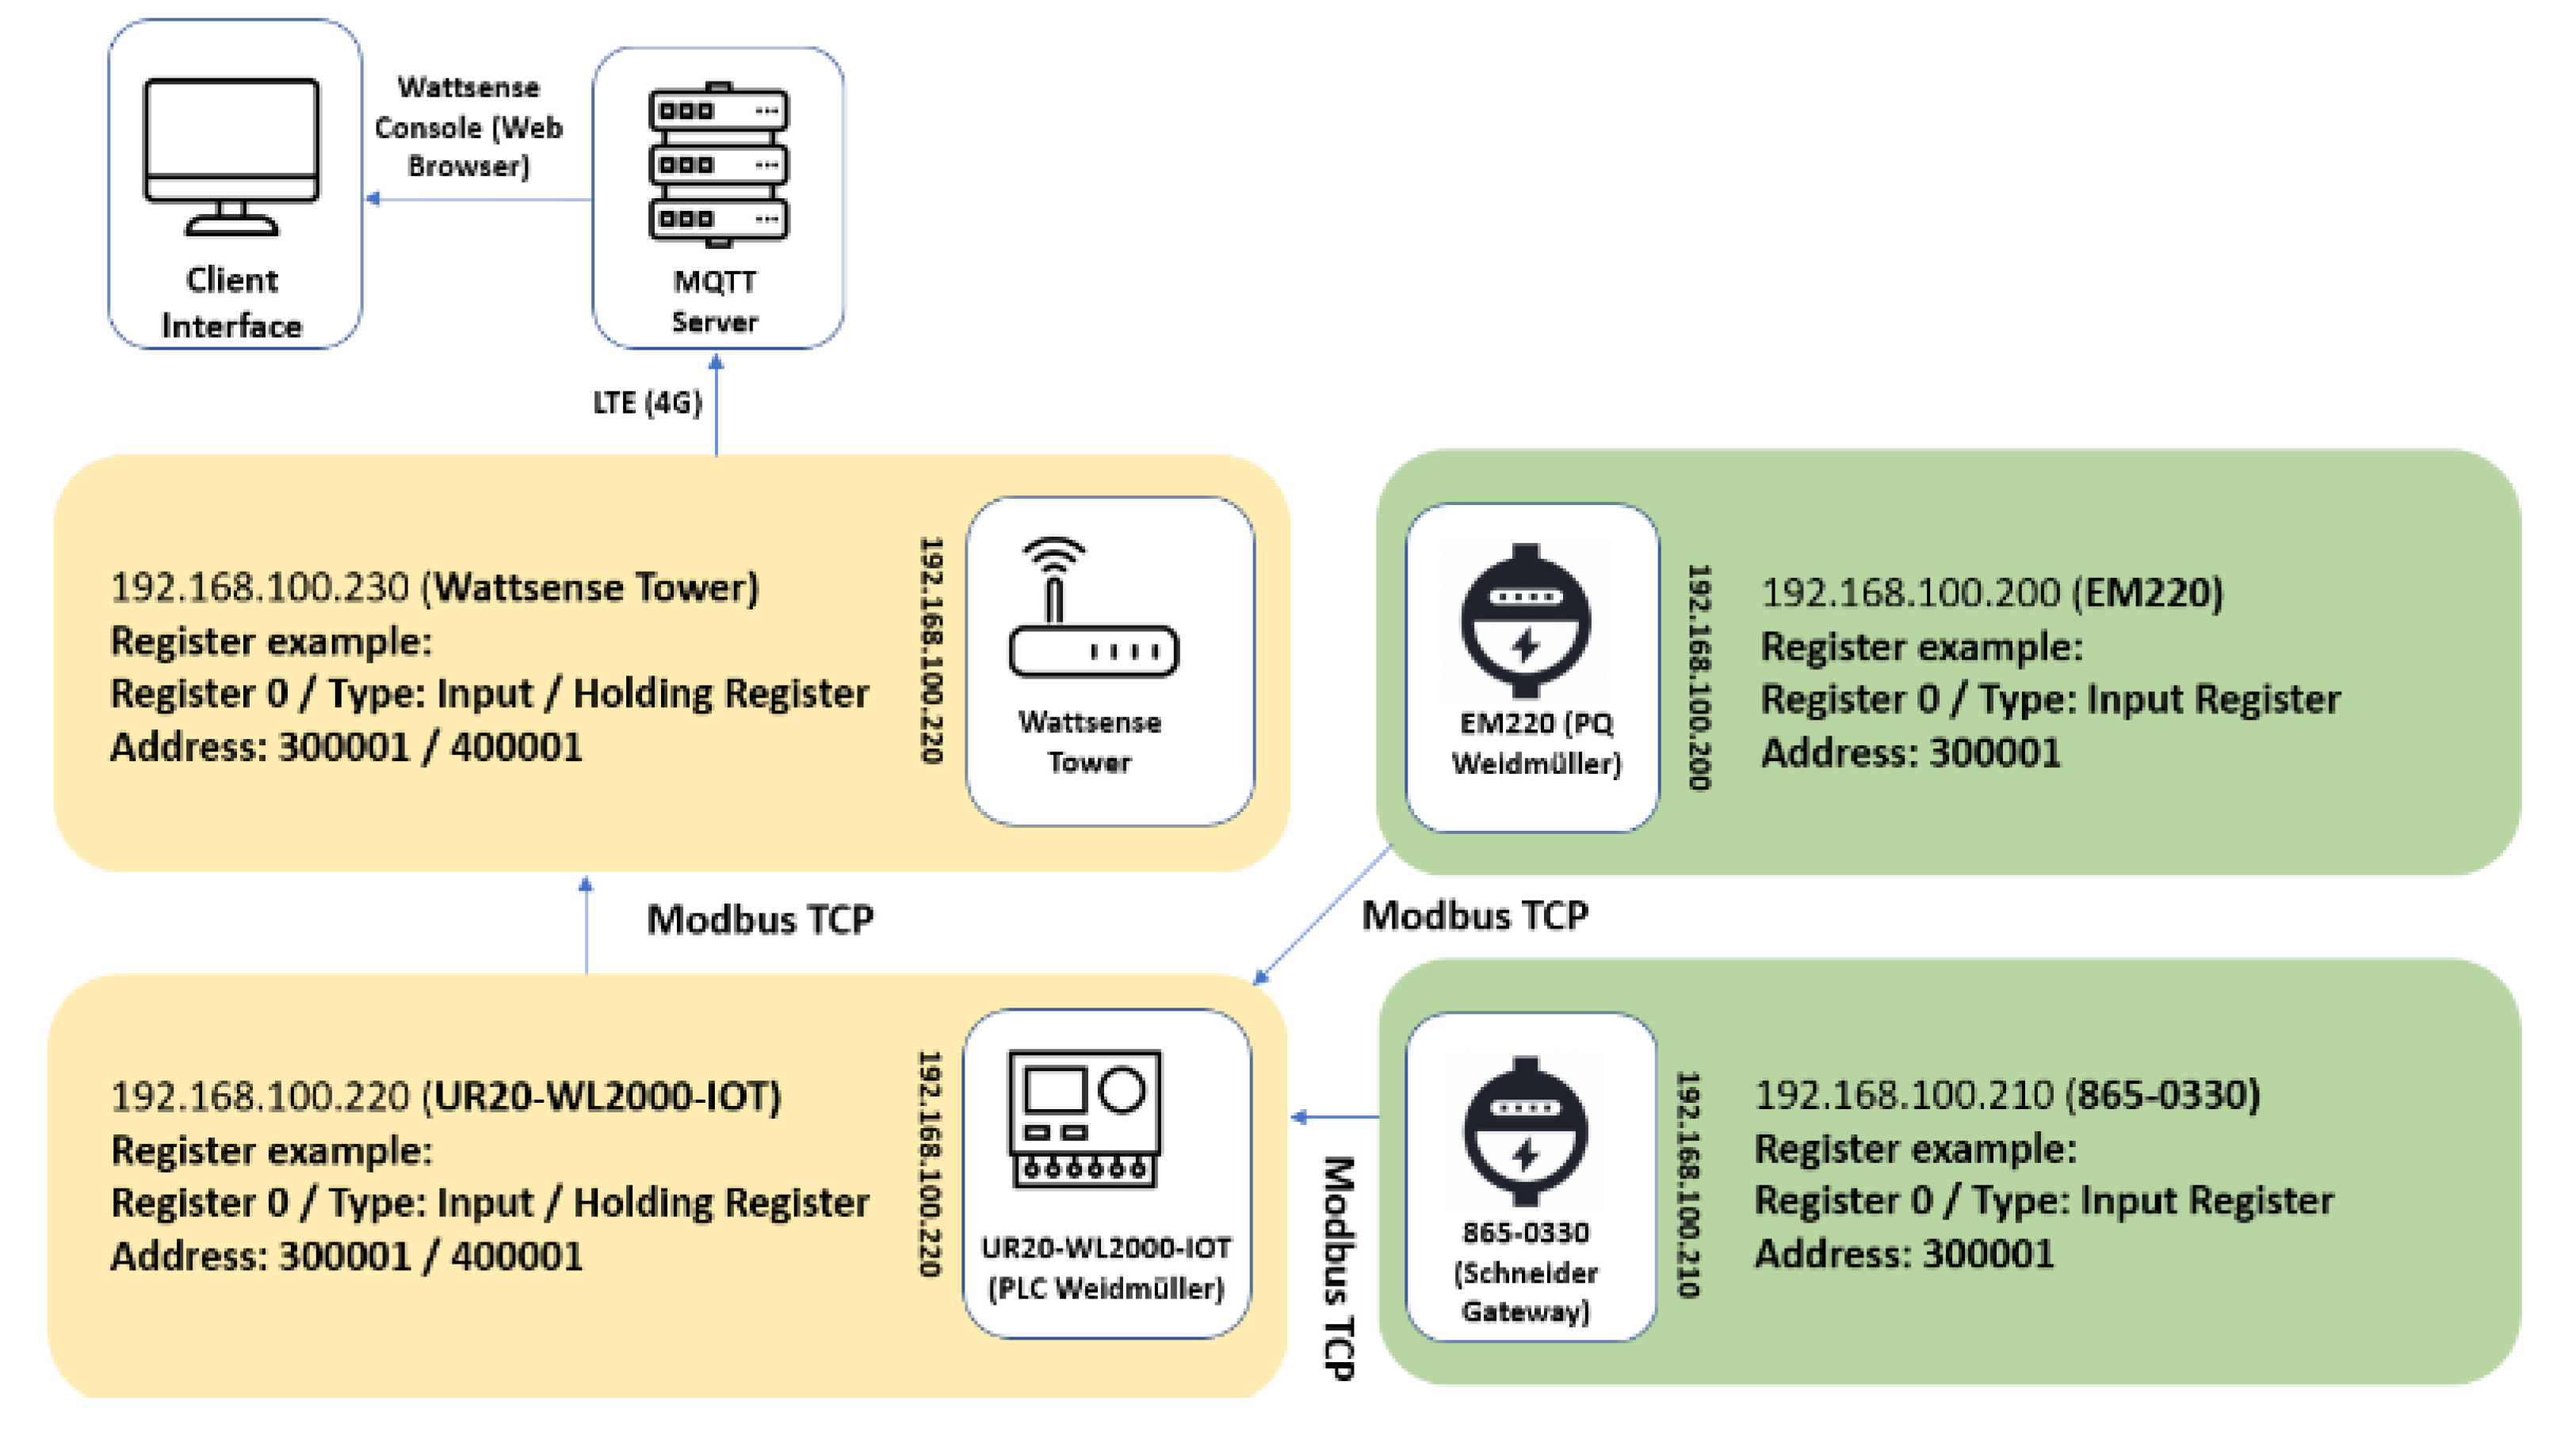
Figure 4 shows the system topology of the portable IoT station. In this topology, there are five systems in a single communication bus. Each variable addressed to a single register is converted from an Integer or Float point 32-bit hexadecimal defined by IEEE 754 Floating-Point Arithmetic protocol. It is published to a Modbus TCP server host and converted to a decimal value in the PLC interface.
Once the data gathered from the PLC through Modbus TCP is filtered, stored, scaled, and processed, it is published as a global variable in a configurable Modbus server. Subsequently, it is collected by the Wattsense server, published to an MQTT server through the 4G modem and displayed in a web browser interface. The web browser interface from Wattsense allows all registers to be displayed, published, and organized with real-time acquisition and dynamic interaction.
The usage of the PLC to centralize all registers available in the portable IoT station follows the principles of an edge computer. However, this approach can overload the hardware and firmware used on the PLC, resulting in long refresh rates. To address any system overload, the registers following a direct integer structure can bypass the edge device since this type of register can be published directly into the MQTT server, if no additional filter is required.
7. System Implementation
During the implementation of the portable IoT system, all Modbus RTU nodes using RS485 were established under 19200bps and even parity. All slave IDs for Modbus TCP/IP and RTU have been addressed from 1 to 247. Every register pulled and published in the Modbus TCP had the following structure:
Hold registers (4XXXX) set up as float and integer values, with read and write functions.
Inputs registers (3XXXX) are all set up as float values with read-only functions.
Inputs status (1XXXX) set up as binary values with read-only functions.
Coil status (0XXXX) set up as binary values with read and write functions.
Table 2 summarizes the main components used in the portable IoT station; it also provides the address list utilized in the Modbus TCP network.
Since the energy meter implemented into the portable IoT station accepts direct analogue inputs through voltage leads and current transformers, these values are converter and allocated to certain registers within the network. Having the ability to host a Modbus RTU node allows the energy meter (EM220) to compile multiple registers to the Modbus TCP network. Additional features such as digital inputs and output ports allow many possibilities for condition monitoring and system supervision. The diagram below illustrates the internal data process flow used in the PLC collected from the EM220.
The utilization of the Schneider gateway, also identified by the manufacturer as Insighthome gateway (865-0330), also allows additional registers relevant to troubleshooting or commissioning of a system, with the utilization of XanBus, Modbus TCP and Modbus RTU, it can collect fault codes, energy consumption and live status of the equipment connected. This unit also provides a web interface through a LAN or Wi-Fi connection. The advantage of XanBus over Modbus is the compatibility of the system with Schneider devices. All products manufactured by Schneider have a directory loaded into the gateway, so all the registers are promptly available in the gateway.
The PLC selected for the portable IoT station is the UR20-WL2000-IoT. This device has a Node-Red interface for implementing several pallets promptly available from an online database, as well as a native PLC language of function block and direct MQTT and OPC-UA server interface. Furthermore, it can host a Modbus TCP server to publish its global variables. The diagram below illustrates the internal process flow utilized in the PLC.
Using register four from the EM220 by requesting the register address 30005 requires a data conversion in Node-Red, which is a browser-based flow editing system developed and optimized for IoT applications. Each flow used in Node-Red is structured in pallets and nodes written in JavaScript.
The node utilized for the data acquisition is "Modbus Read", which is then connected to a "toFloat" node. Once the data is converted, a "msg.payload" and "iodata-out" node converts the data value to a global variable and displays the status of the data into a debug interface.
Once the register is published as a global variable, it can be adjusted, scaled, and calibrated with the inbuilt function block interface installed in the PLC. Additional processes are required to convert the global variable into an integer with pos-processing and then exported directly to an OPC-UA and MQTT server, or Modbus TCP/IP network.
The biggest advantage of using the UR20 is its modular capability. In this application, six analogue cards, one RTD card, one output relay card, one serial card and one digital output card were used. There are several cards available for this PLC. However, since the portable IoT station is optimized for power quality applications and system supervisory, having several analogue inputs allows multiple sensors to be connected to the PLC simultaneously.
The Wattsense gateway served the purpose of data visualization since it uses a web interface accessible through any device. All the registers collected, compiled, processed, and published into the Modbus TCP/IP network are accessible through the Wattsense tower. Despite the integration capabilities of the Wattsense tower, the interface does not make any data processing possible. Hence, there is the need for a PLC configured as an edge computer, filtering, processing, and publishing all the registers into a single Modbus TCP/IP network.
8. System Commissioning
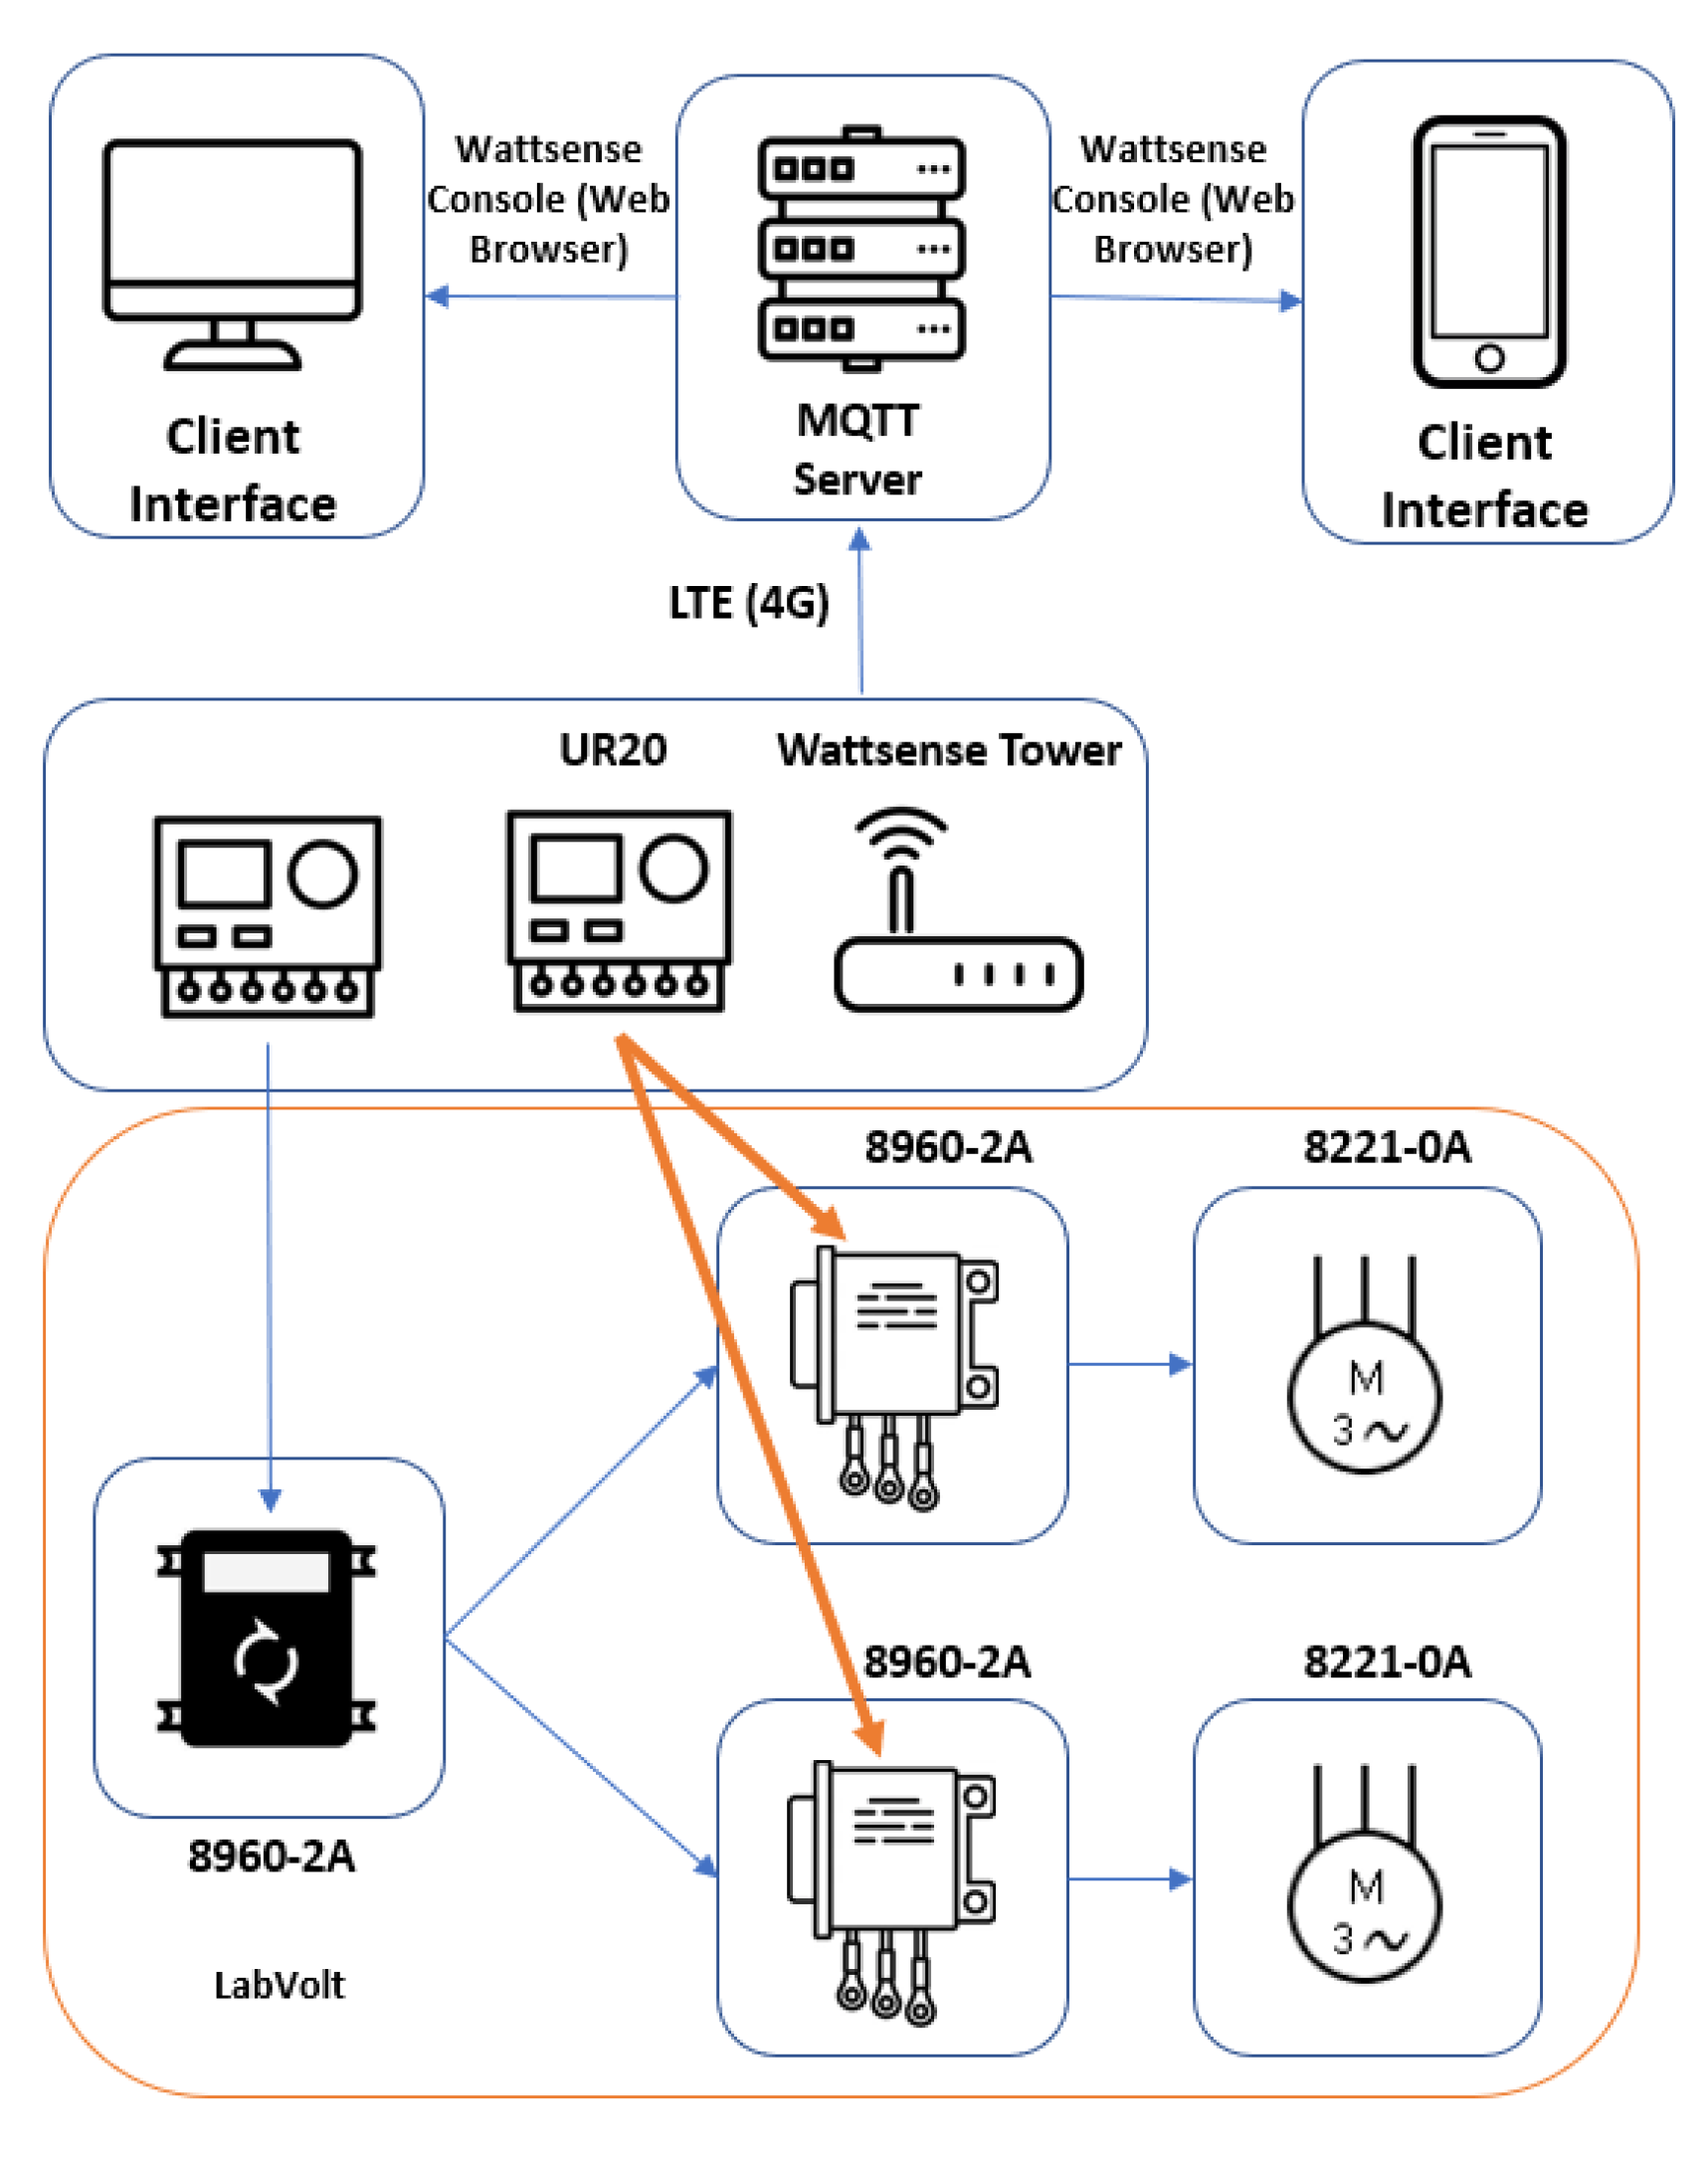
To simulate the commissioning process of the portable IoT station, two applications were created. Application "A" used remote data visualization, while Application "B" focused on local data visualization, the comparison between each application, shows the data band with limitations based on the refresh rate of each topology used.
Application A relies strictly on remote publication of the data acquired, using the 4G connection native on the Wattsense Tower to connect the system directly into a MQTT server, integrated into a webserver, allowing the data to be visualized through a user interface. Application B uses a local host approach with the Wi-Fi network and Modbus TCP interface native of the Schneider gateway and PLC. In this application a local LAN and USB (Serial) network is also deployed, interfacing the connection directly into the PCL, with its native visualization tool based on Node-Red.
8.1. Application A
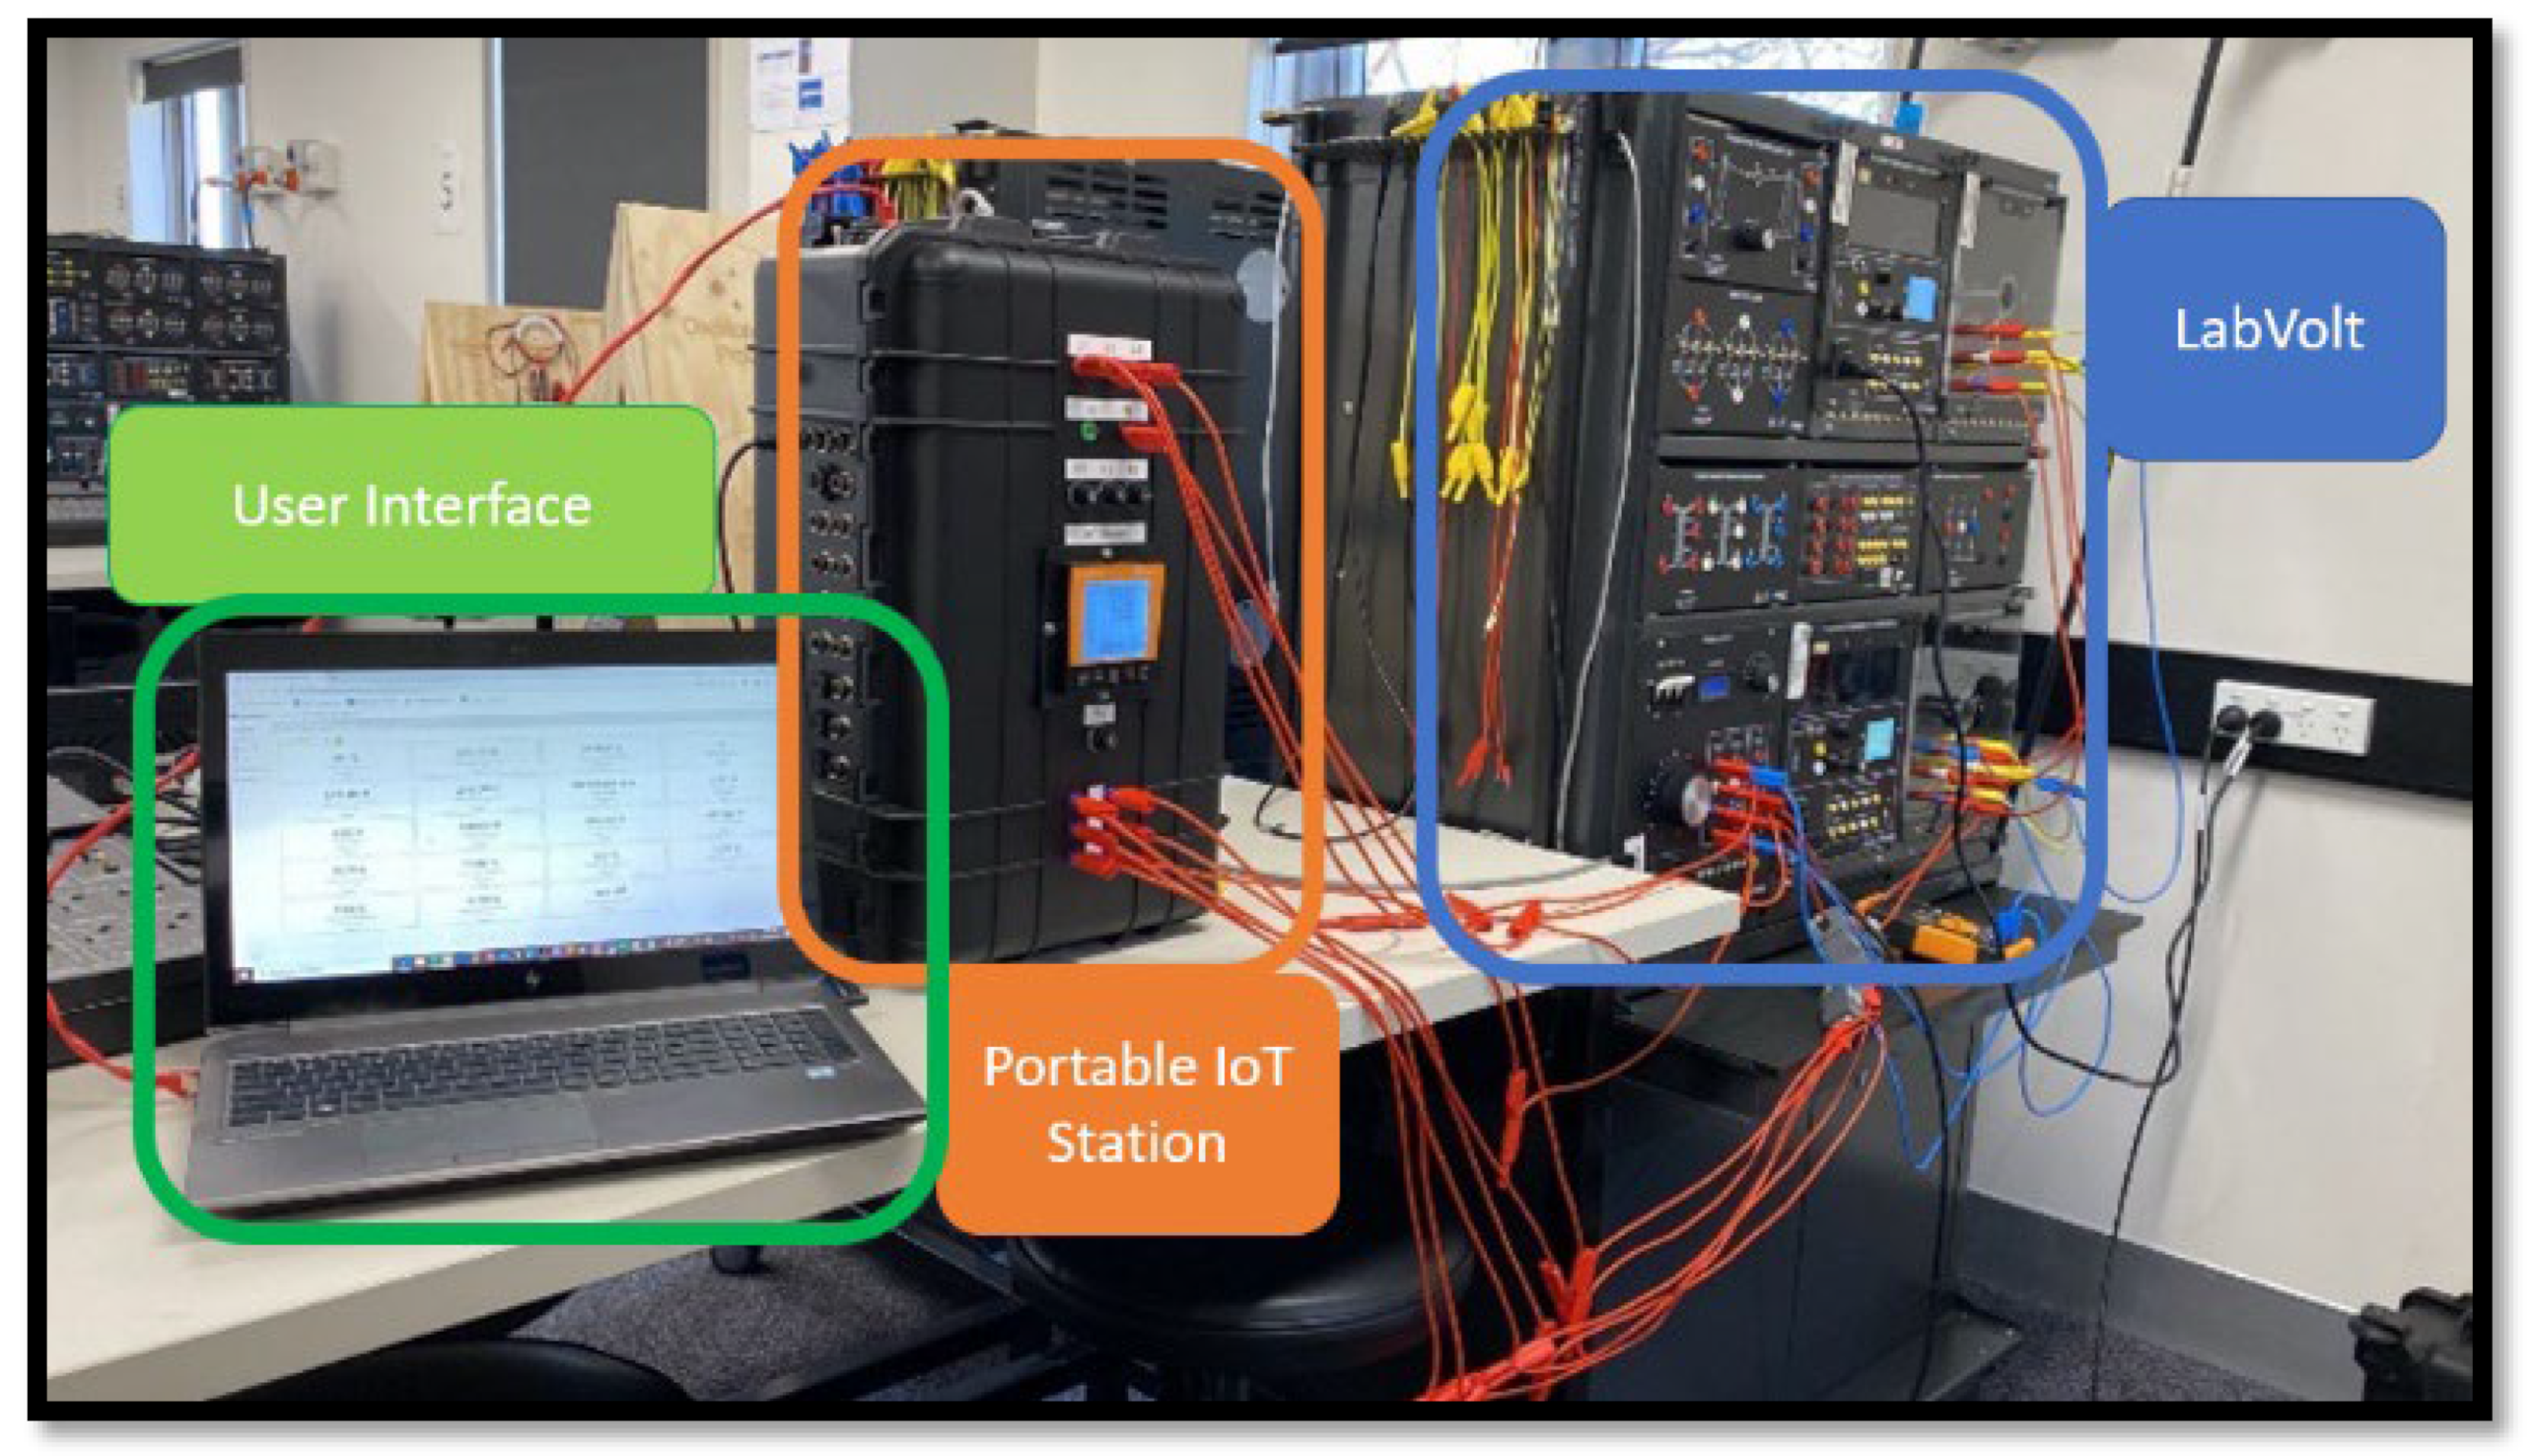
This application required a Fest Didactic product line with three different LabVolt modules. The PLC located inside the portable IoT station is responsible for communicating with the AC motor control module (8960-2A) and monitoring the system’s power quality with the EM220, which is connected to the source module (8821-2A). The power line is connected to a set of 3-phase AC motors coupled into the module (8221-0A). The diagram below represents the overall system set-up.
For this application, the following registers were defined and compiled into a single Modbus TCP address, following the same structure as depicted in
Figure 6.
The set-up utilized during Application A can be visualized in the figure below, which shows the LabVolt set-up connected to the portable IoT station.
Figure 8.
System configuration utilized during Application A.
Figure 8.
System configuration utilized during Application A.
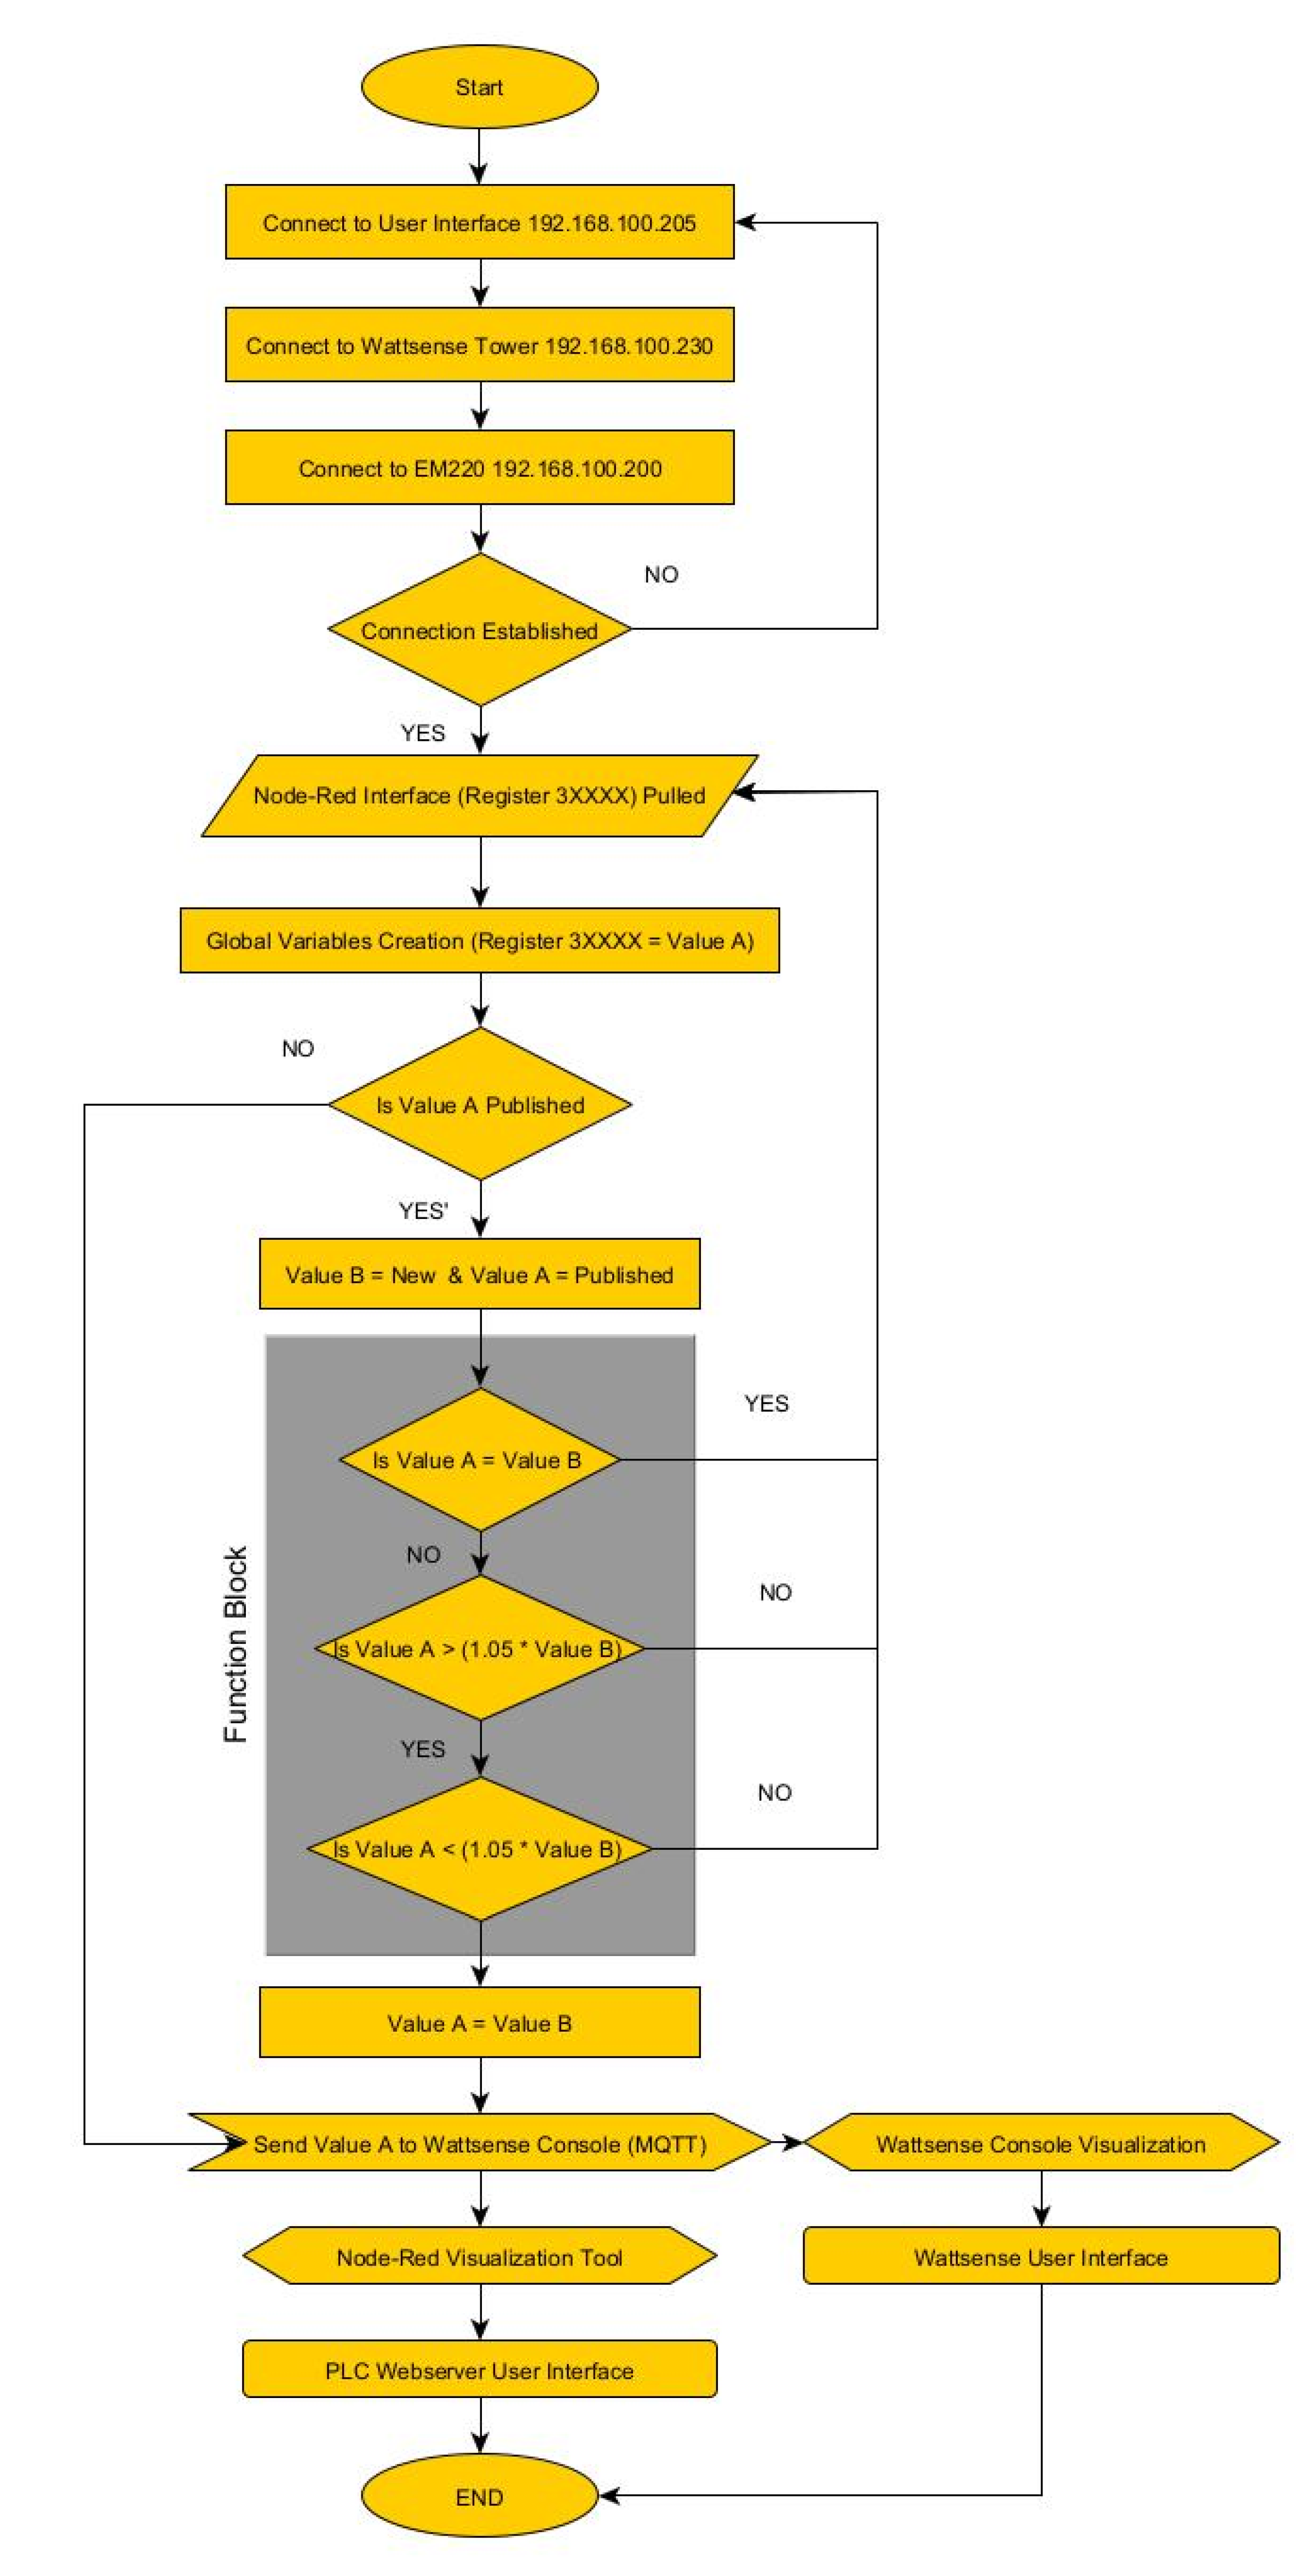
The flow charge shown below describes the process integrated into the PLC. External registers received through the Modbus TCP network are published into the Wattsense Console for data visualization. Additional steps can be added to integrate supervisory processes, such as actuator control or dedicated sensor visualization.
Despite having the data published into the Wattsense Console for visualization, all the registers are put into the Node-Red visualization tool. This assists the user to troubleshoot and verify the system time stamp.
Figure 9.
Process flow configured during Application A.
Figure 9.
Process flow configured during Application A.
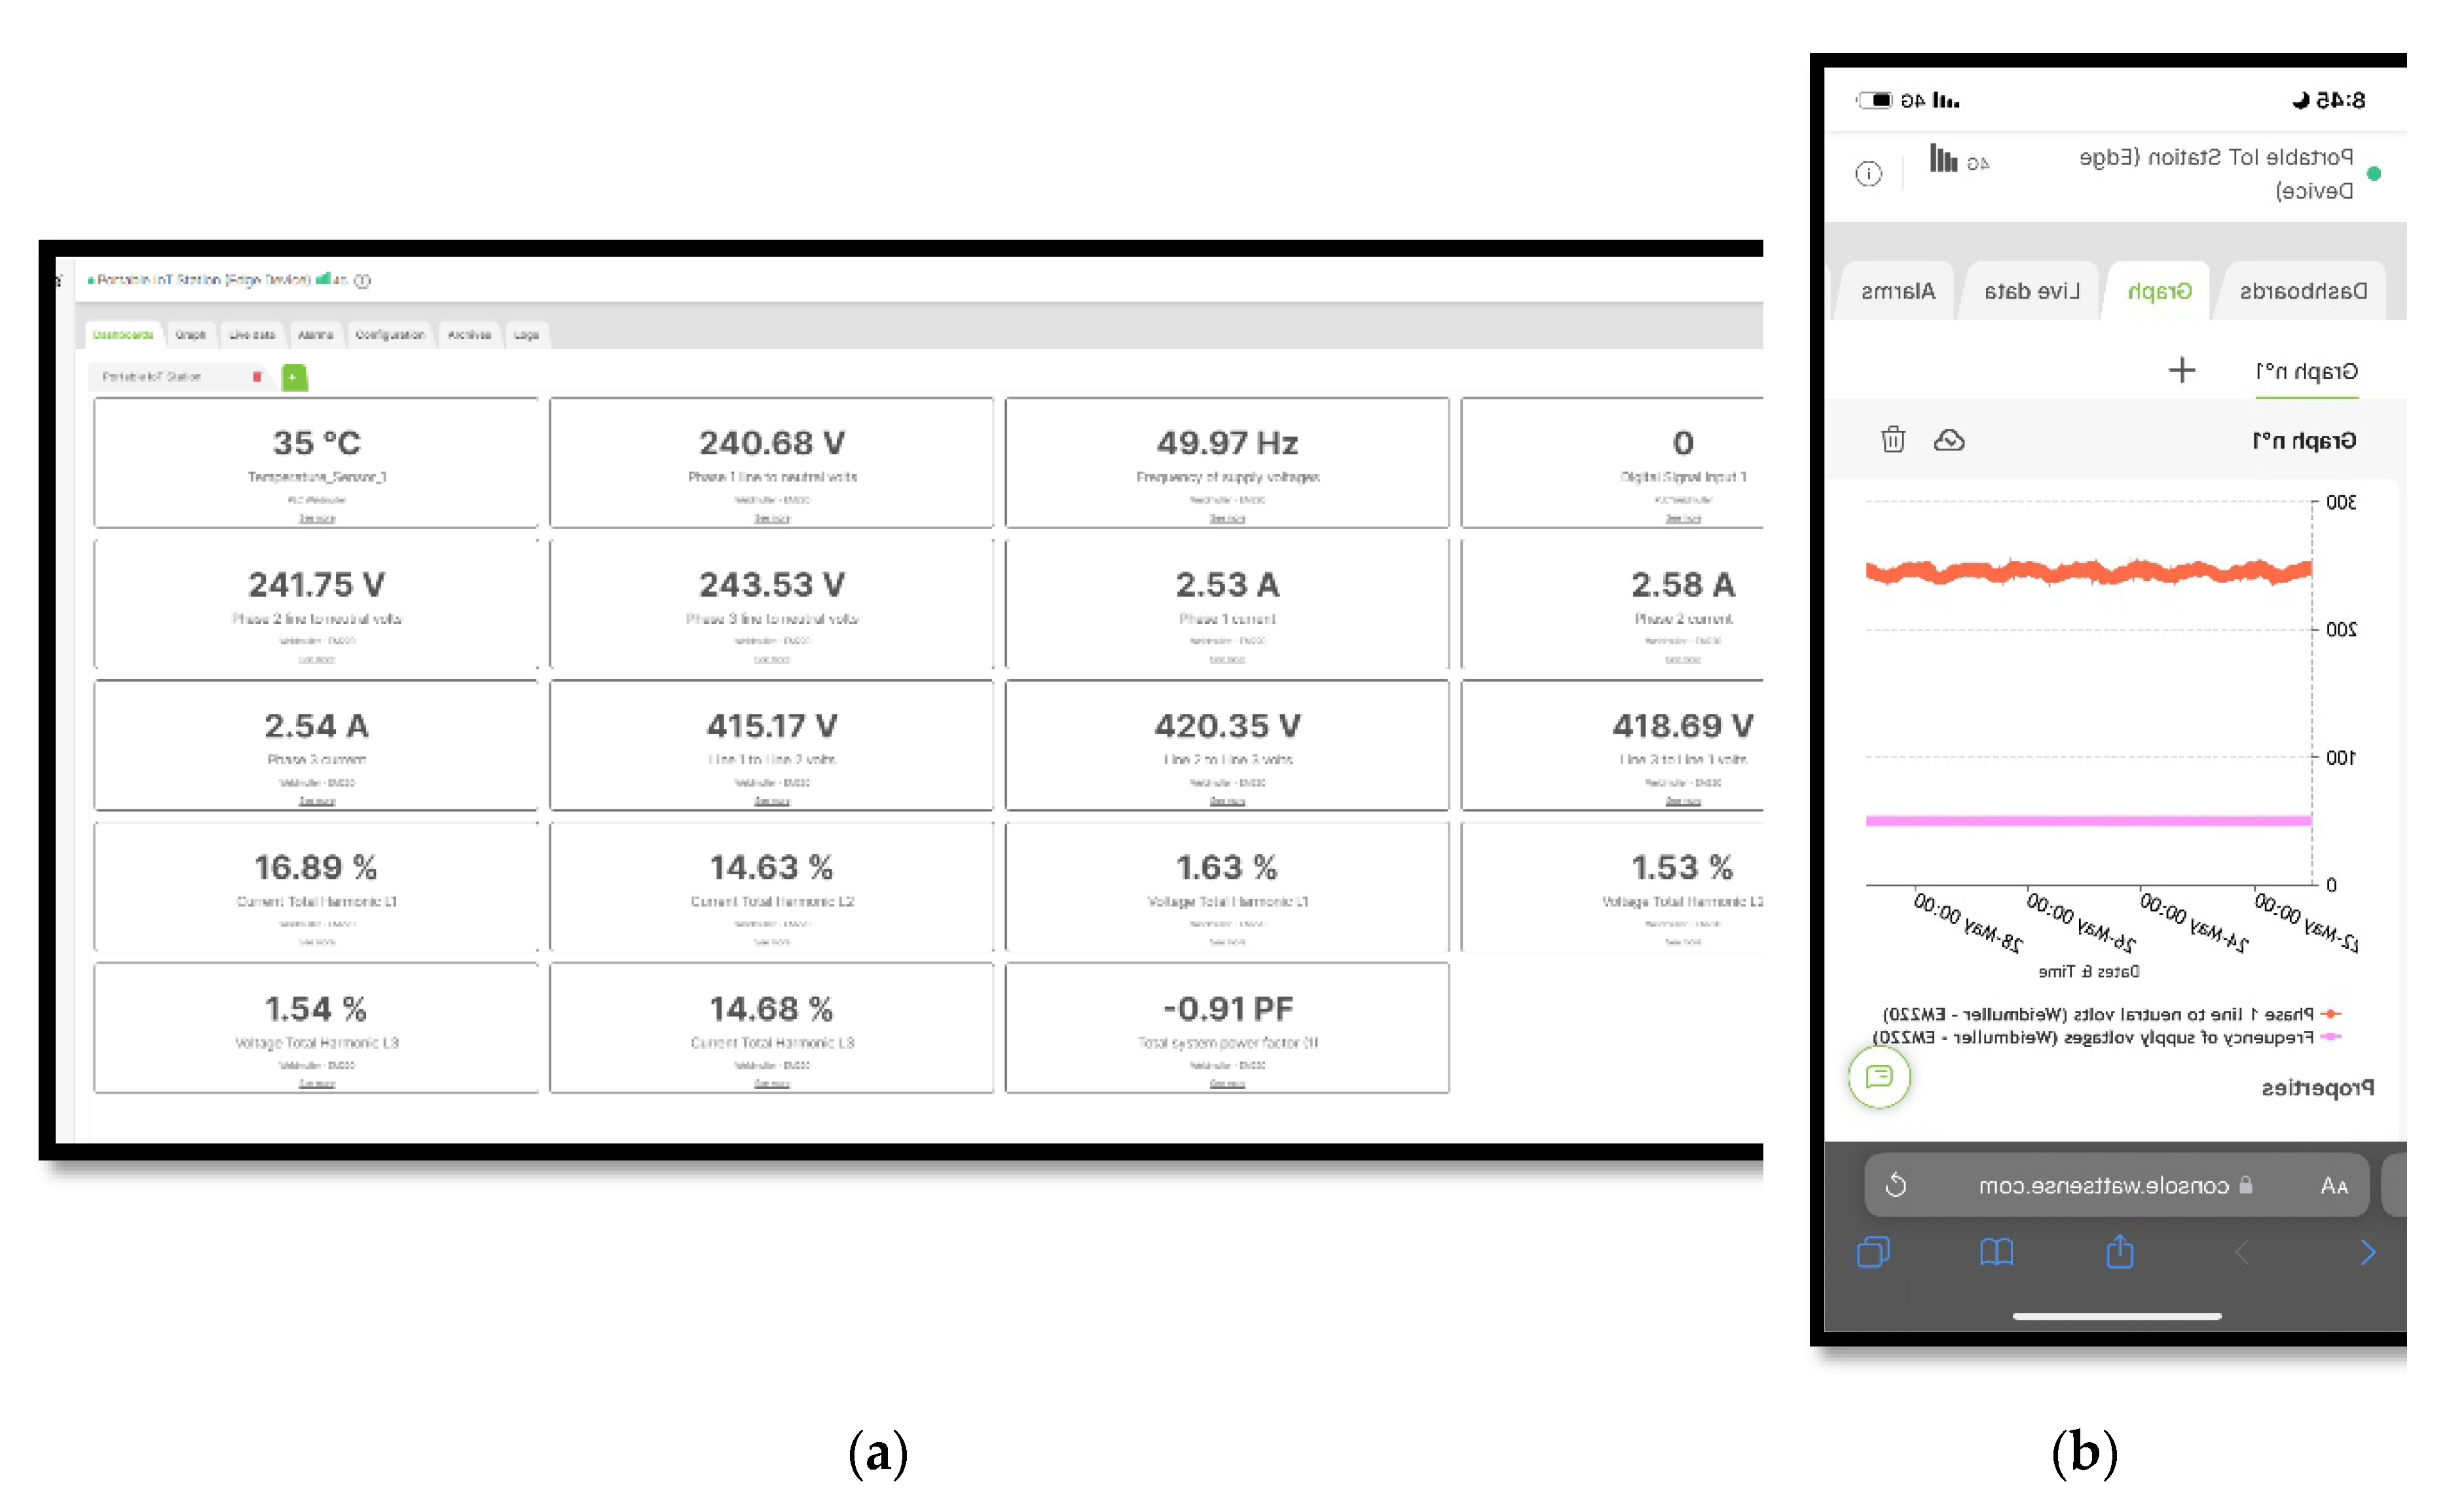
The following user interface was created on the Wattsense Console with the Web Interface integrated into the MQTT server.
Figure 10.
(a) The Wattsense console accessed through a computer; (b) the Wattsense console accessed through a smart phone.
Figure 10.
(a) The Wattsense console accessed through a computer; (b) the Wattsense console accessed through a smart phone.
In this application, all critical measurement and control features required to perform power quality analysis and load management were integrated with the EM220 and UR20. All data was processed and conditioned to be perfectly displayed through the Wattsense Dashboard.
The biggest advantage of the methodology used in this application is the wireless capability enabled by the Wattsense gateway. It only requires a 4G (LTE) connection to establish a network between the portable IoT station and the MQTT server. In this way any device to access the data acquired by the portable IoT station is allowed, without the need for proximity to the system. However, this approach results in delays on the data visualization.
8.2. Application B
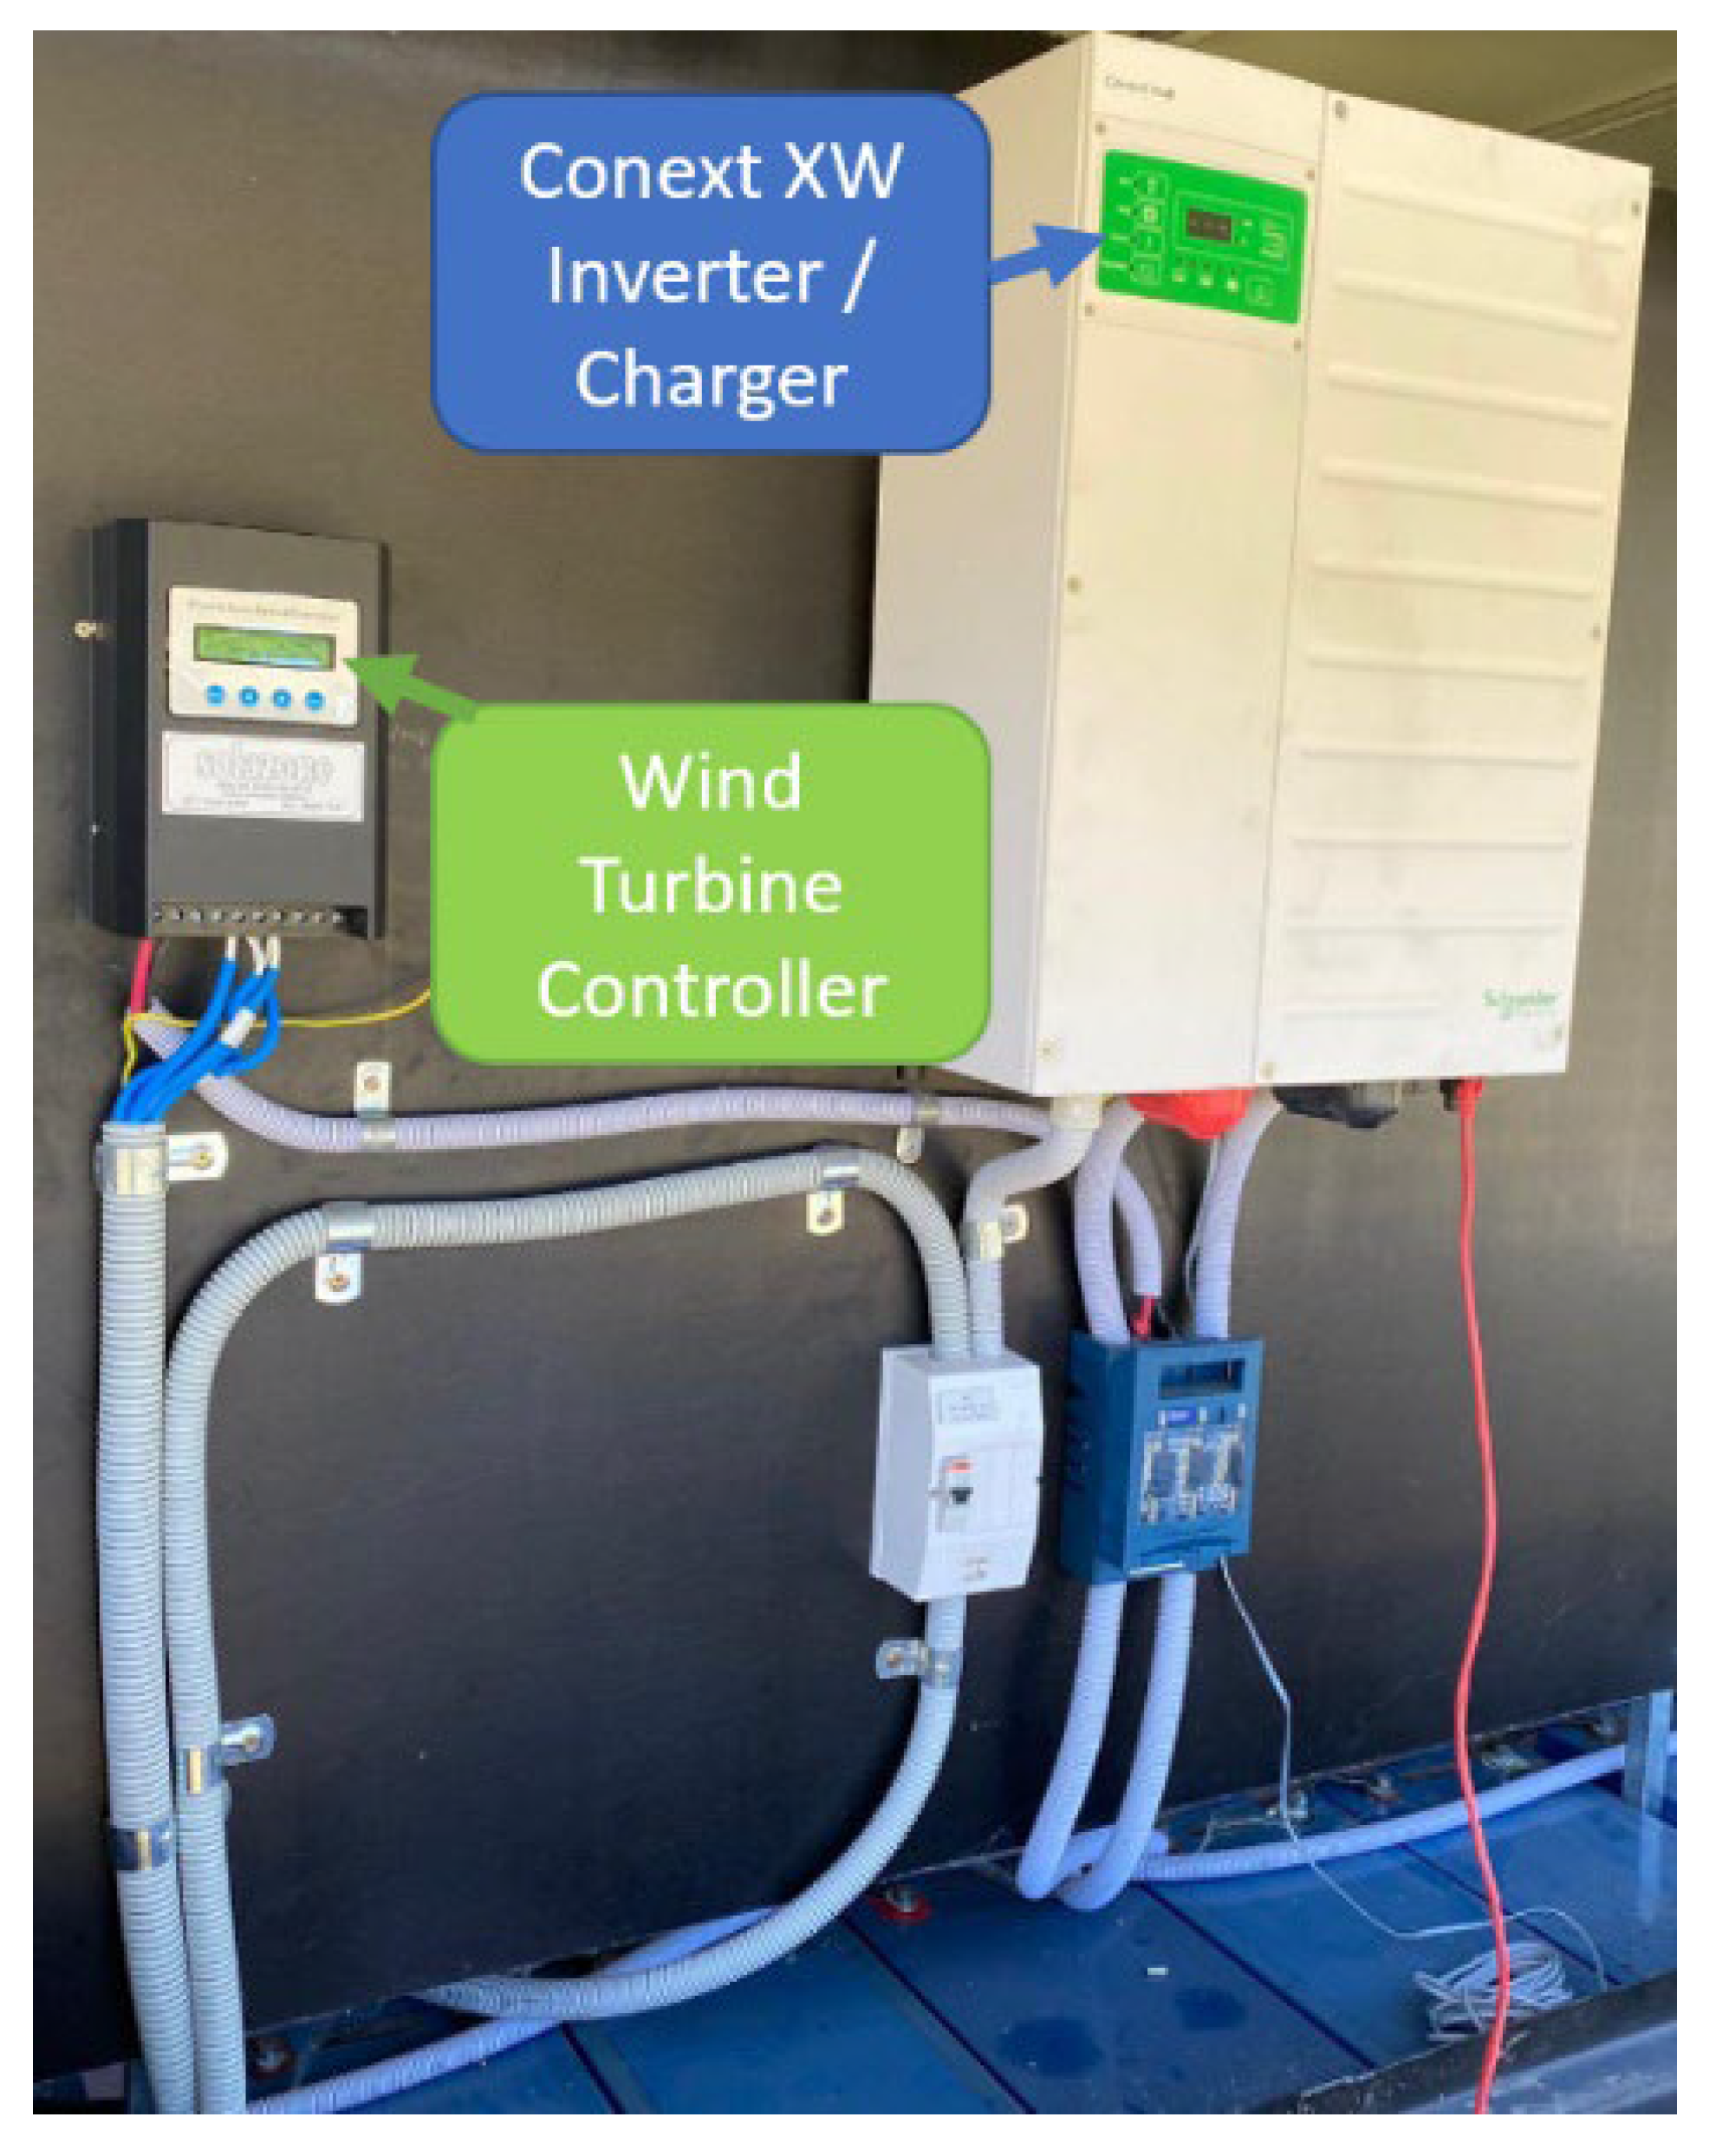
This application was executed with a simple HRES, which combined a solar installation, batteries, and a wind turbine at the same grid connection. The Schneider gateway (865-0330) was utilized. A hybrid inverter (Conext XW Inverter/Charger) is responsible for controlling the power output of the solar panels and operating the battery bank. The inverter was connected in parallel to the wind turbine controller.
The wind turbine controller used in the system did not have external communication. To address this issue, the EM220 was connected directly to the wind turbine output since the Conext XW could monitor and report the power output of the grid connection.
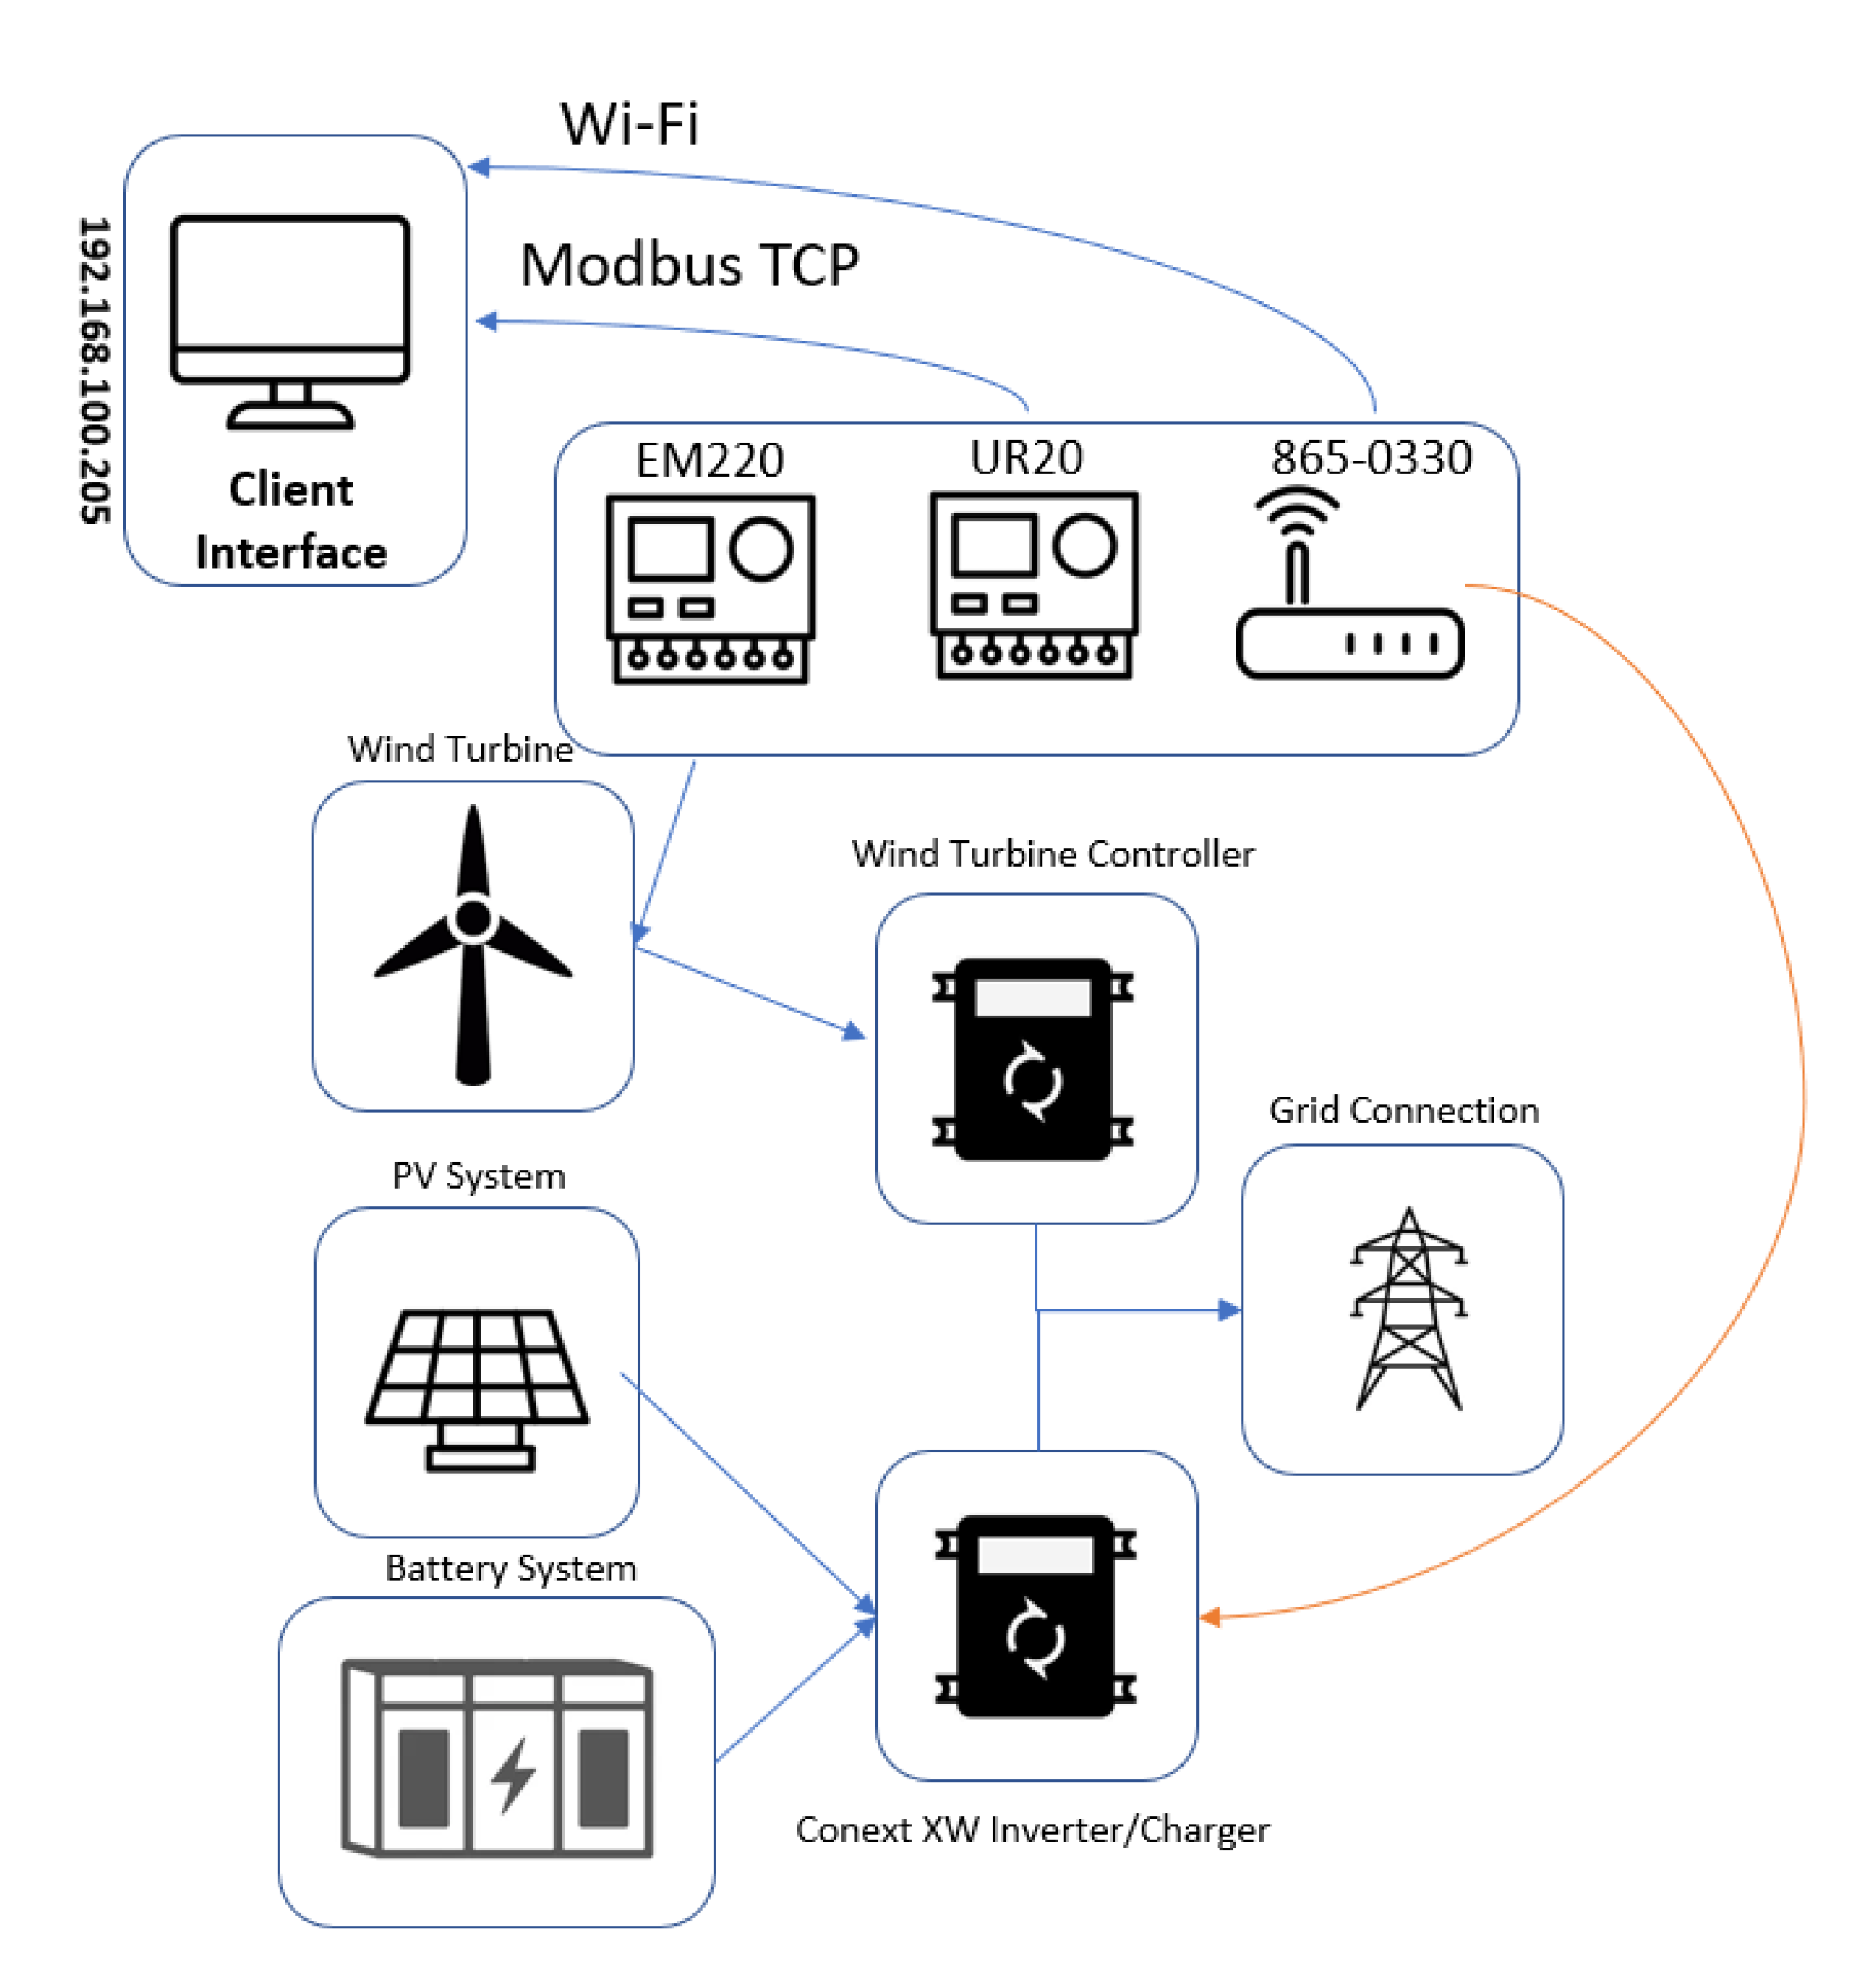
The communication between the Schneider gateway and the Conext XW Inverter/ Charger was established through XanBus. Consequently, all the registers from each device were automatically addressed and integrated. The figure below illustrates the system topology used during Application B.
Figure 11.
System topology applied during Application B.
Figure 11.
System topology applied during Application B.
The same registers listed in
Table 3 and
Table 4 were used from the EM220. and UR20. The following registers were implemented on the Schneider gateway to export the data received from the Conext XW.
The set-up utilized during Application B can be visualized in the figure below, which shows the Conext XW hybrid inverter. It was also connected to the wind turbine controller, the EM220 was connected to the junction box of the wind turbine, while the Conext XW was connected to the InsightHome gateway through a direct XanBus connection. With this process all devices could be visualized on the portable IoT Station.
Figure 12.
System configuration utilized during Application B.
Figure 12.
System configuration utilized during Application B.
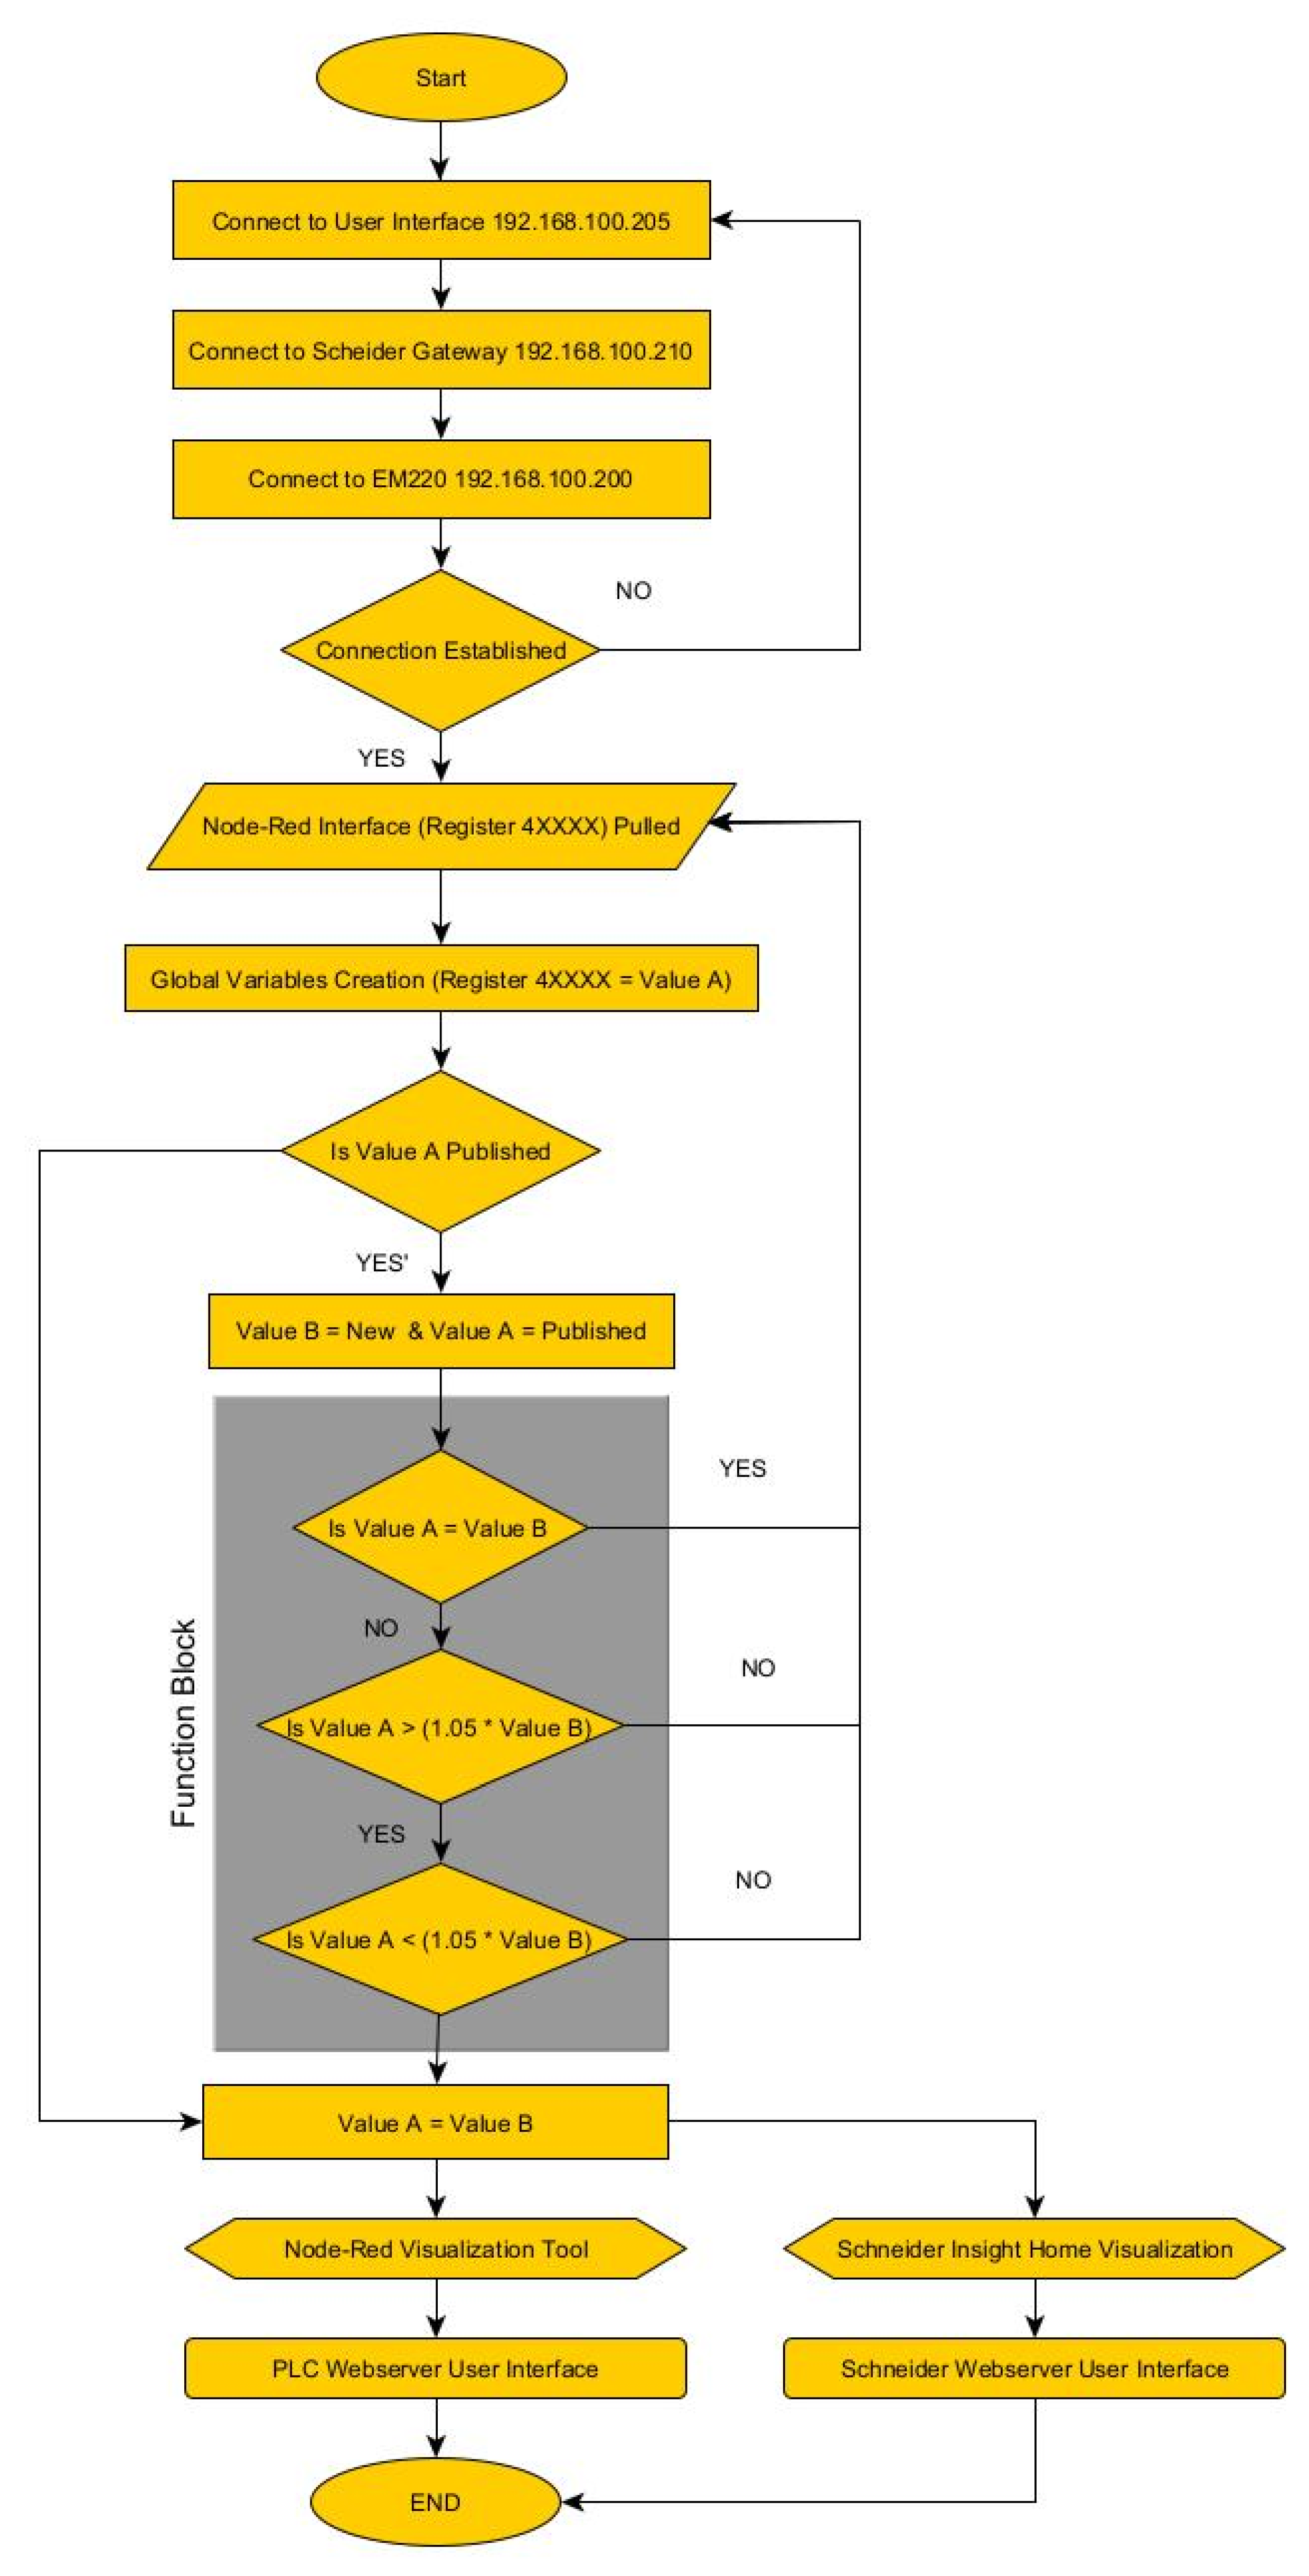
The process flow below shows how the registers are acquired from the inverter through the XanBus communication, which is transmitted by the Schneider gateway through Modbus TCP into the PLC.
Figure 13.
Process flow configured during Application B.
Figure 13.
Process flow configured during Application B.
The process flow below shows how the registers are acquired from the inverter through the XanBus communication, which is transmitted by the Schneider gateway through Modbus TCP into the PLC.
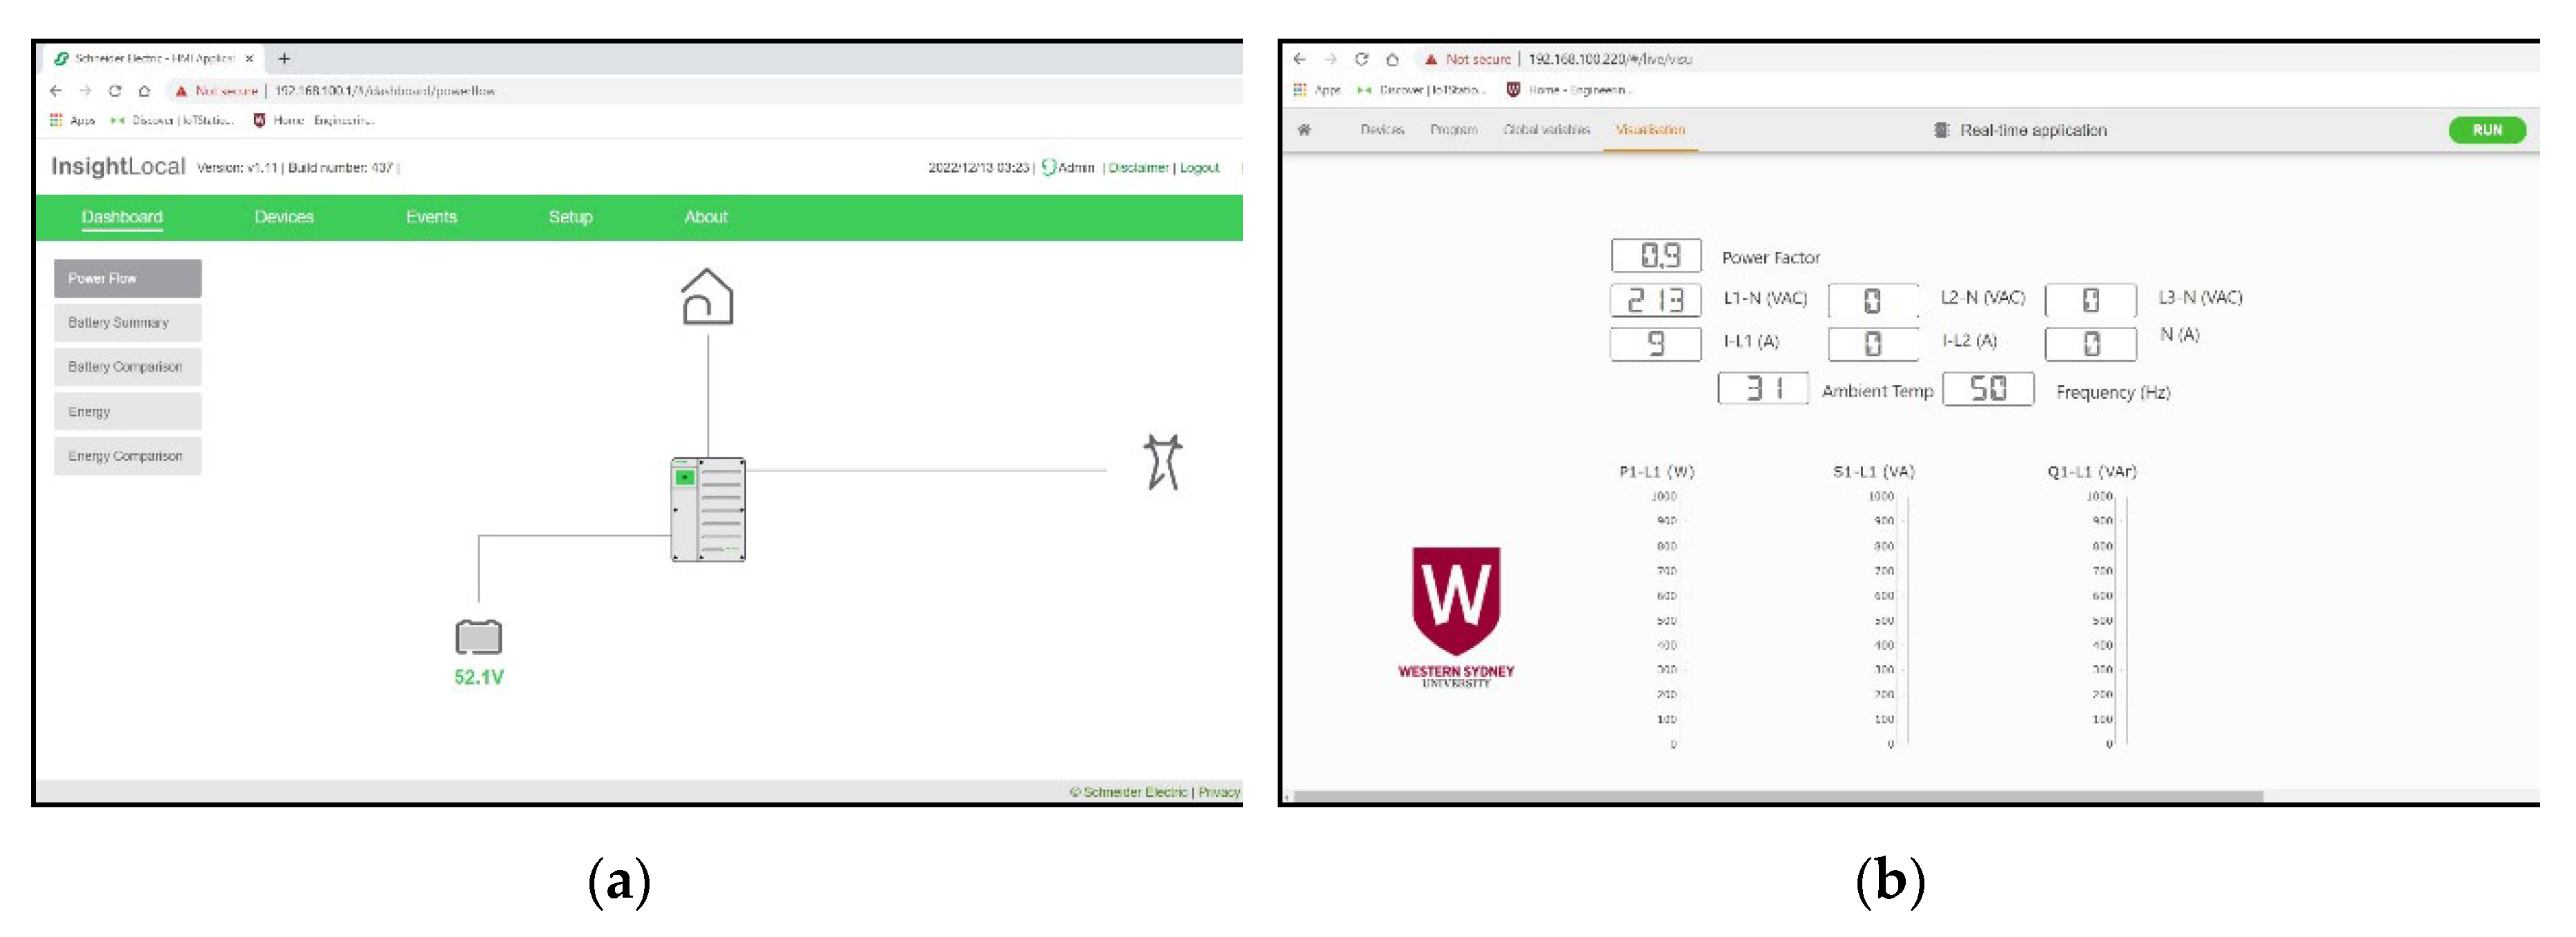
Figure 14.
(a) The direct interface from the Schneider gateway, which also illustrates the direct connection to the load, grid, and battery bank; (b) the visualization tool from the UR20, which summarizes the data input from the Schneider gateway and EM220.
Figure 14.
(a) The direct interface from the Schneider gateway, which also illustrates the direct connection to the load, grid, and battery bank; (b) the visualization tool from the UR20, which summarizes the data input from the Schneider gateway and EM220.
This application aims to demonstrate additional visualization tools available through the portable IoT station. The data approach utilized for the data publication through Modbus TCP/IP followed the edge computing topology, which ensures the required performance and data bandwidth.
The biggest advantage of this approach is the refresh rate of the system, despite the number of variables acquired this approach has a much better performance when compared to a remote methodology using a 4G (LTE) network, through Wattsense. This approach employed the portable IoT station as a local host, enabling the direct interface of the PLC and Schneider gateway into two distinct visualization tools. The data visualized had a high refresh rate, since it had minimum restriction on the data band. However, it required either a hardwired connection to the portable IoT station or close proximity to the Schneider gateway so that the Wi-Fi connection between the gateway and the computer was enabled.
9. Performance Results and System Optimization
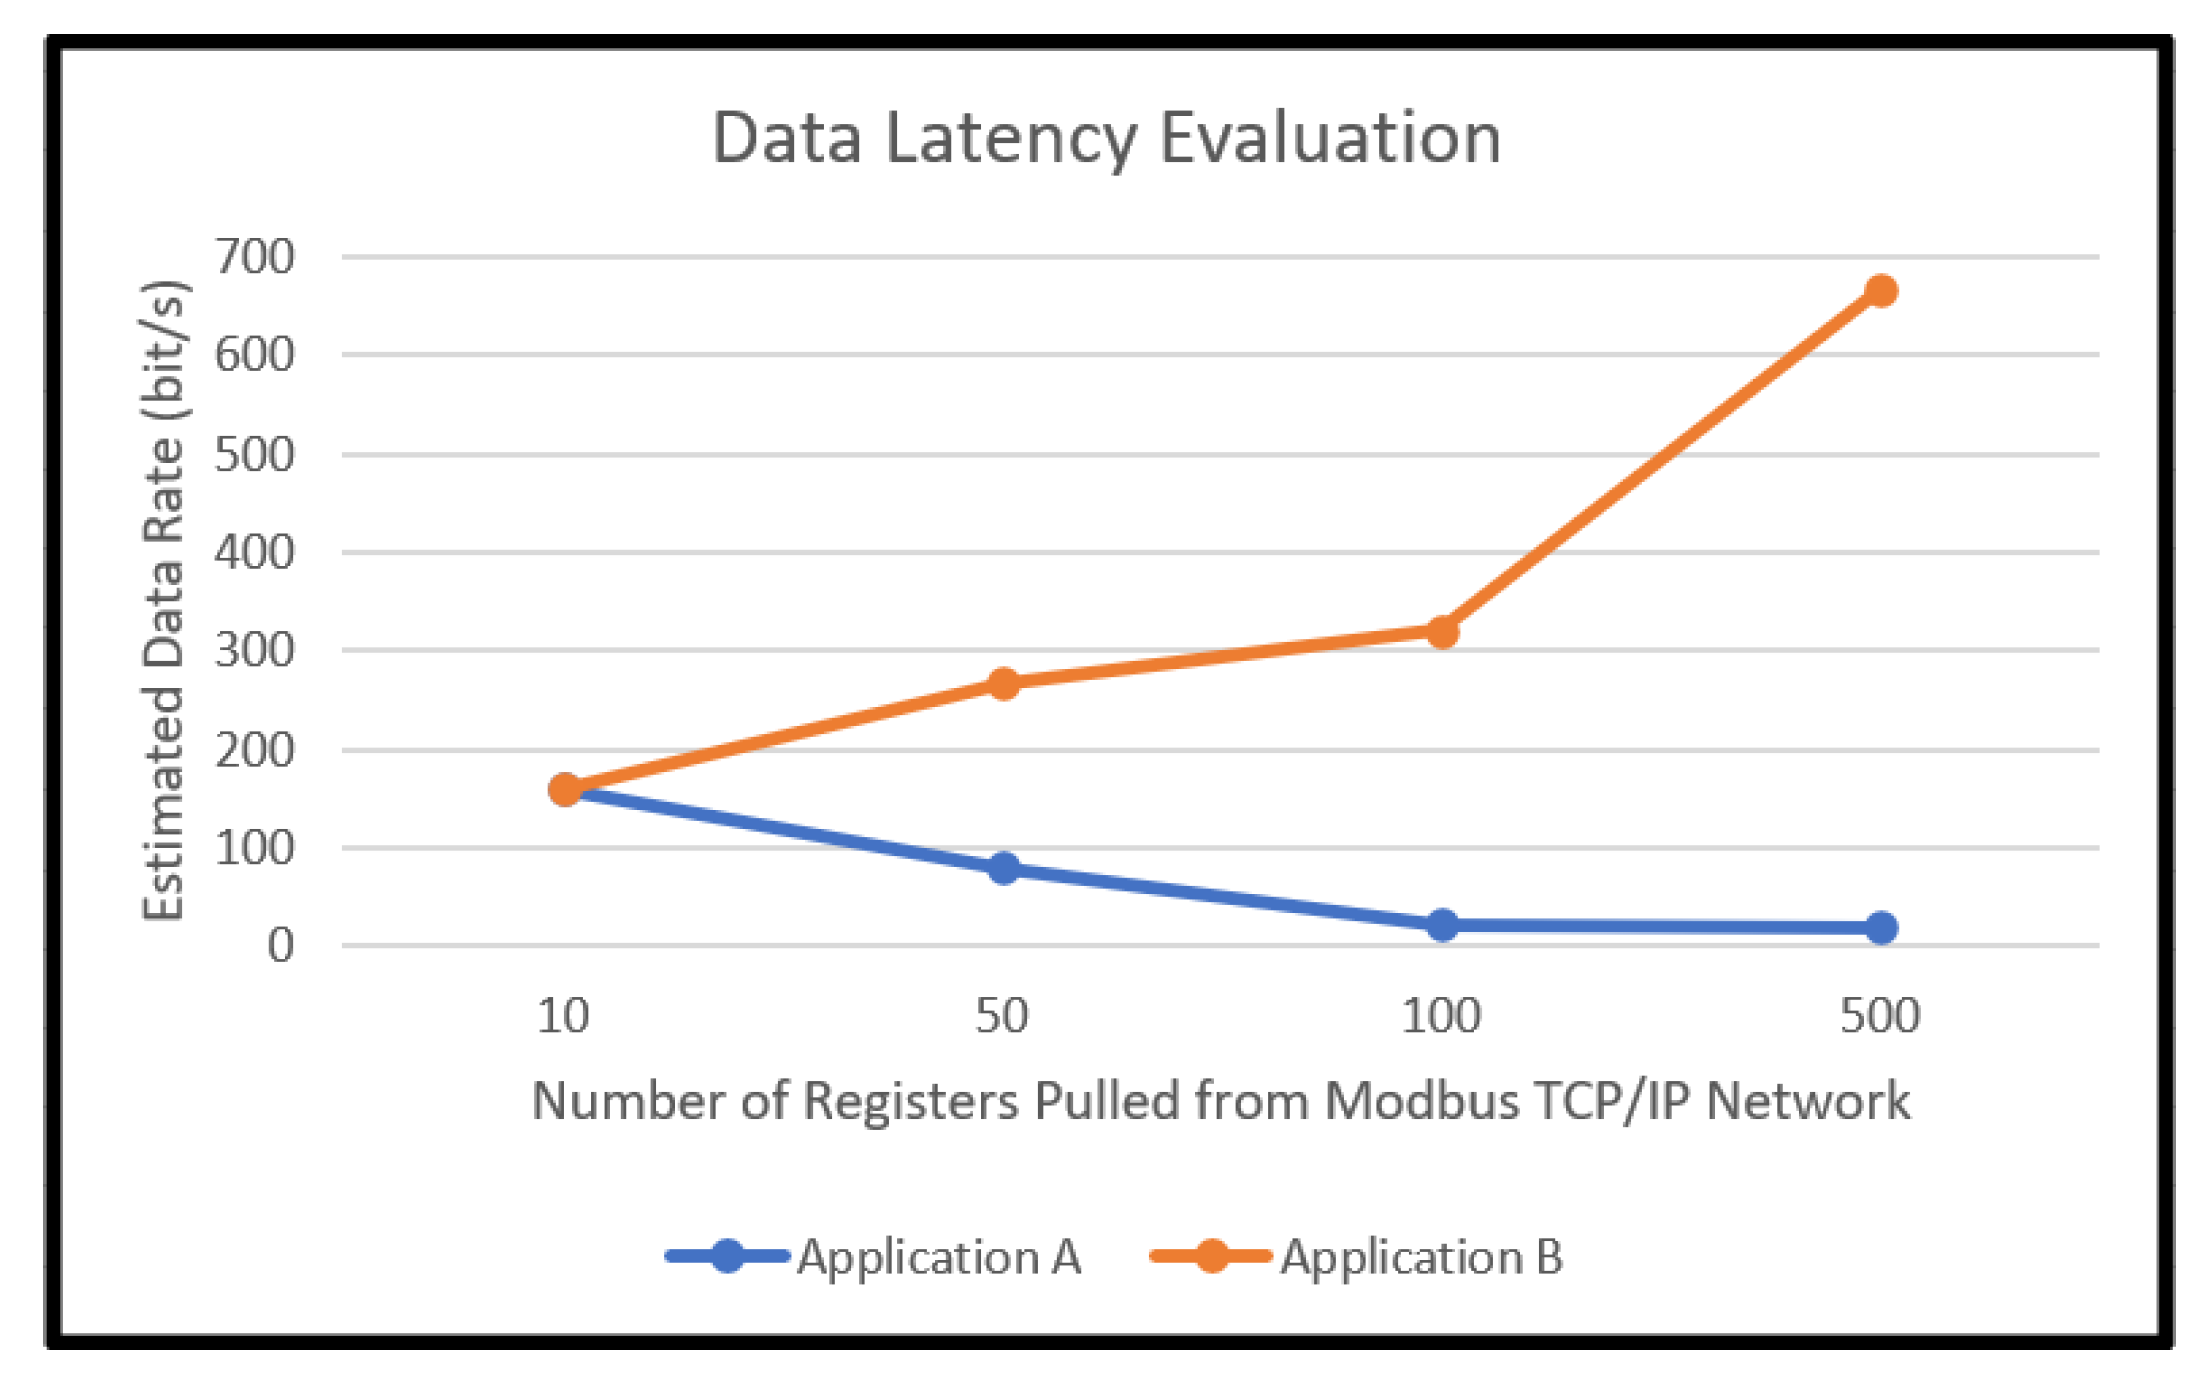
To analyze the performance of the portable IoT station, the overall refresh rate of the system was acquired. With this metric, the latency of the system was defined. This measurement served as base line for the optimization approach adopted in the PLC.
To examine the refresh rate, a set value of registers was pulled from the Node-Red interface, acquiring the desired register from the Modbus TCP/IP network. The debug function on Node-Red served to define the “start point”. To provide an accurate performance indication of the communication system, each test was repeated 3 times. To remove any additional variable, once a test scenario was acquired, a power cycle process would commence, resetting any existing buffer and cache memory which might impact the final results. The value displayed under the data latency evaluation is an average result of each repeated test.
The latency response is based on the standard size of a Modbus register of 16 bits. The direct connection with LAN and USB (Serial) was not evaluated; unfortunately no base line could be set for these communication lines. This is because the data transmission matches the data visualization used on the debug function of Node-Red.
Additional registers were pulled from the Modbus TCP/IP, such as date, time and operational hours logged on each device, allocated under Coil and Status registers. This approach allowed the system to be evaluated with up to 500 registers pulled from the network, increasing the data density of the system, showing its impact on the data rate.
| Application A |
| Number of Registers |
Number of Nodes |
Latency (seconds) |
Estimated System Response (bit/s) |
| 10 |
3 |
1 |
160 |
| 50 |
3 |
10 |
80 |
| 100 |
3 |
75 |
21 |
| 500 |
3 |
410 |
20 |
| Application B |
| Number of Registers |
Number of Nodes |
Latency (seconds) |
Estimated System Response (bit/s) |
| 10 |
3 |
1 |
160 |
| 50 |
3 |
3 |
267 |
| 100 |
3 |
5 |
320 |
| 500 |
3 |
12 |
667 |
It is relevant to mention that any data transferred from the Node-Red interface to the user interface under one second cannot be recorded, since the debugger requires at least one second to refresh. Based on this information, both applications recorded the same refresh rate when 10 registers are pulled from the Modbus TCP/IP network.
The refresh rate was defined as a period between the debug command on Node-Red and the updated value at the targeted interface. Both applications meet the expected performance requirements. Application B achieved a much higher data rate than Application A as shown in
Figure 15. However, it is noted that the data rate from Application A is sufficient for most IoT applications.
Either application requires at least a few seconds to update its user interface. This latency can cause the loss of several registers if the communication between the PLM and the target communication protocol is interrupted. To address this issue, an optimization technique will be applied to the PLC, by using an internal SD card available in the PLC as a buffer, where the register pulled from the Modbus network will be stored without any filtering or pre-processing.
This ensures instantaneous back-up of the data received in the PLC. This optimization technique allows the user to undertake further analysis on the data received if an error or failure occurs in the system within a period of 1 second. This technique was also utilized by Novianty et al. [
6], once the authors identified the latency of their system and the potential data loss caused by a connection lost between the gateway and the user interface.
10. Future Work
Additional algorithms can be added to the portable IoT station, allowing further investigations and performance evaluation of any industrial system, including HRES. Both applications presented in this paper are very limited and did not explore the full potential of the portable IoT station. This system must be connected into a large-scale battery or solar farm, to highlight its benefits during troubleshooting and performance acquisition. Having this system implemented in a large-scale installation, allowing more than 500 registers to be pulled from the Modbus TCP/IP network will likely lead to a review of further issues in latency and data storage.
Additional autonomy is required in the portable IoT station. During the system’s evaluation, it was identified that two hours of autonomy are not enough, since the starting time requires at least 5 to 10 minutes to establish a connection across all the nodes. However, it is not possible to implement a bigger battery module since the internal space on the case is limited. The best solution is to include a solar charger following a topology similar to that of the portable solar station built by Putra et al. [
17].
11. Conclusions
The portable IoT station will serve as a platform for data acquisition and synchronization, configured as an edge device. Its unique approach allows the station to be used as a tool to acquire and investigate the overall performance of the system connected. Since the portable IoT station is customizable, adjustments can be made to integrate new communication protocols and additional devices to perform specific tasks using Node-Red.
The IoT station can operate as a supervisory tool with multiple analogue and digital inputs using the existing hardware. Furthermore, it can serve as a control unit, capable of connecting and disconnecting systems from the electrical network. For this reason, it is an ideal solution for researching and developing new algorithms for power quality analysis and load management.
Despite the advantages of using the portable IoT station as a system integrating tool, there are limitations on the processing and publishing time required for each register. These limitations are caused by the data rate achieved between the Modbus TCP/ IP network and user visualization through a webserver using LTE, Wi-Fi or even Modbus TCP/ IP. On this basis, the portable IoT station should not be implemented in industrial systems which require a prompt response with a time stamp lower than 1 second. Applications installed at explosive atmospheres constitute an example of the system where the portable IoT station should not be implemented, despite having most of its components certified for that type of application.
The methodology utilized for the design and construction of the portable IoT station covers all technical challenges previously identified in portable IoT systems. Additional considerations were taken for components selection during the design stage, ensuring that the unit constructed is resilient under extreme weather conditions and against cyber-attacks.
Supplementary Materials
Not applicable.
Author Contributions
Conceptualization, M.T. and S.K.; methodology, M.T and A.H.; validation, M.T. and T.F.; supervision J.R. and M.N.; writing—original draft preparation, M.T. All authors have read and agreed to the published version of the manuscript.
Funding
This work was funded by the School of Engineering, Design and Built Environment, Western Sydney University (project code 20870.74954).
Institutional Review Board Statement
Not applicable.
Informed Consent Statement
Not applicable.
Data Availability Statement
All relevant data regarding the design and construction of a portable IoT station has been included in this paper.
Acknowledgments
The authors would like to thank Weidmüller Pty. Ltd. for providing the majority of the hardware implemented into the portable IoT station.
Conflicts of Interest
Author Mario Augusto Trape was employed by Weidmüller Pty. Ltd. The remaining authors declare that the research was conducted in the absence of any commercial or financial relationships that could be interpreted as a potential conflict of interest.
References
- N. B. Kamarozaman and A. H. Awang, "IOT COVID-19 Portable Health Monitoring System using Raspberry Pi, Node-Red and ThingSpeak," in 2021 IEEE Symposium on Wireless Technology & Applications (ISWTA), 17-17 Aug. 2021, pp. 107–112. [CrossRef]
- M. Sekiyama, B. K. Kim, S. Irie, and T. Tanikawa, "Sensor data processing based on the data log system using the portable IoT device and RT-Middleware," in 2015 12th International Conference on Ubiquitous Robots and Ambient Intelligence (URAI), 28-30 Oct. 2015, pp. 46–48. [CrossRef]
- T. Joseph et al., "Portable Gas Detection and Warning System for Olfactory Disabled People," in 2020 International Conference for Emerging Technology (INCET), 5-7 June 2020, pp. 1–5. [CrossRef]
- J. S. Botero-Valencia and J. Valencia-Aguirre, "Portable low-cost IoT hyperspectral acquisition device for indoor/outdoor applications," HardwareX, vol. 10, p. e00216, 2021/10/01/. [CrossRef]
- M. Trape, S. K. H. Shah, A. Hellany, M. Nagrial, and J. Rizk, "Portable IoT Solution for HRES Integration," in 2022 IEEE Sustainable Power and Energy Conference (iSPEC), 4-7 Dec. 2022, pp. 1–3. [CrossRef]
- Novianty, A. Ferdika, W. Sholihah, R. Siskandar, and I. P. Sari, "Design of Portable Weather Station Using MQTT Protocol," in 2019 2nd International Conference of Computer and Informatics Engineering (IC2IE), 10-11 Sept. 2019, pp. 199–202. [CrossRef]
- S. M. H. Anik, X. Gao, N. Meng, P. R. Agee, and A. P. McCoy, "A cost-effective, scalable, and portable IoT data infrastructure for indoor environment sensing," Journal of Building Engineering, vol. 49, p. 104027, 2022/05/15/. https://doi.org/10.1016/j.jobe.2022.104027. [8] "IEEE Standard for Floating-Point Arithmetic," <italic>IEEE Std 754-2019 (Revision of IEEE 754-2008), </italic>pp. 1–84, 2019. [CrossRef]
- G. Ambildhuke and B. Banik, "IoT based Portable Weather Station for Irrigation Management using Real-Time Parameters," International Journal of Advanced Computer Science and Applications, vol. 13, 01/01 2022. [CrossRef]
- D. K. Singh, H. Jerath, and P. Raja, "Low Cost IoT Enabled Weather Station," in 2020 International Conference on Computation, Automation and Knowledge Management (ICCAKM), 9-10 Jan. 2020, pp. 31–37. [CrossRef]
- M. Aashiq et al., "An IoT-based handheld environmental and air quality monitoring station," Acta IMEKO, vol. 12, pp. 1–9, 08/01 2023. [CrossRef]
- M. M. Hachisuca et al., "AgDataBox-IoT - application development for agrometeorological stations in smart," MethodsX, vol. 11, p. 102419, 2023/12/01/. [CrossRef]
- Dubey, Dhiraj, and A. K. Saini, "Development of an IoT-based portable Weather Station with parameter monitoring and notifications for precision farming," in 2023 16th International Conference on Sensing Technology (ICST), 17-20 Dec. 2023, pp. 1–6. [CrossRef]
- K. R. Gsangaya, S. S. H. Hajjaj, M. T. H. Sultan, and L. S. Hua, "Portable, wireless, and effective internet of things-based sensors for precision agriculture," International Journal of Environmental Science and Technology, vol. 17, no. 9, pp. 3901–3916, 2020/09/01. [CrossRef]
- K. Warnakulasooriya, Y. P. Jayasuriya, and B. Sudantha, "Generic IoT Framework for Environmental Sensing Researches: Portable IoT Enabled Weather Station," in 2018 International Conference on System Science and Engineering (ICSSE), 28-30 June 2018, pp. 1–5. [CrossRef]
- S. P. Mariadass, S. N. S. Al-Humairi, and R. J. Daud, "Design a Portable Solar Mobile System with an IoT Integration-based," in 2021 IEEE 12th Control and System Graduate Research Colloquium (ICSGRC), 7-7 Aug. 2021, pp. 40–45. [CrossRef]
- D. D. Putra, B. Syihabuddin, M. A. M. Jabbar, A. Irsal, A. Purwadi, and A. Munir, "Energy Management System with IoT Connectivity for Portable Solar Power Plant," in 2020 IEEE International Conference on Internet of Things and Intelligence System (IoTaIS), 27-28 Jan. 2021, pp. 56–59. [CrossRef]
- D. D. Putra, A. Irsal, M. A. M. r. Jabbar, A. Kurniadi, A. Purwadi, and A. Munir, "Development of Portable Solar Power Plant Equipped with IoT Connectability," in 2020 14th International Conference on Telecommunication Systems, Services, and Applications (TSSA, 4-5 Nov. 2020, pp. 1–4. [CrossRef]
|
Disclaimer/Publisher’s Note: The statements, opinions and data contained in all publications are solely those of the individual author(s) and contributor(s) and not of MDPI and/or the editor(s). MDPI and/or the editor(s) disclaim responsibility for any injury to people or property resulting from any ideas, methods, instructions or products referred to in the content. |
© 2024 by the authors. Licensee MDPI, Basel, Switzerland. This article is an open access article distributed under the terms and conditions of the Creative Commons Attribution (CC BY) license (http://creativecommons.org/licenses/by/4.0/).
