Preprint
Article

Immune-Inflammatory Response in Lifespan. What Role Does It Play in Extreme Longevity? A Sicilian Semi- and Supercentenarians Study

Altmetrics

Downloads

122

Views

61

Comments

0

A peer-reviewed article of this preprint also exists.

Submitted:

05 June 2024

Posted:

06 June 2024

You are already at the latest version

Alerts
Abstract
Studying models of healthy aging and exceptional longevity is crucial to understand a possible longevity signature as most of them show resistance to age-related diseases. In particular, semi- and supercentenarians are a highly selected group, having survived significant adversities, including the Spanish Flu and COVID-19 pandemics, indicating distinctive immune system characteristics. This paper analyse the inflammatory scores (INFLA-score, Systemic Inflammation Response Index (SIRI)) and Aging-Related Immune Phenotype (ARIP) indicators calculated from the dataset of the DESIGN project, including 249 participants aged 19-111 years, trying to understand the immune-inflammatory (IMFLAM) role to achieve longevity. Statistical analyses, including linear regression and one-way ANOVA, were performed to explore the correlations between these parameters and age. Both INFLA-score and SIRI showed a significant increase with age. However, no statistical difference is observed when analysing the values for semi- and supercentenarians with those for other age groups, whose values are similar to that of adults and less than younger centenariansRegarding ARIP values, it is noteworthy that when comparing the CD8 Naive/Effector scores between groups, no significant differences were observed between the semi- and supercentenarian group and the other groups. These results support the idea that the control of IMFLAM response can promote extreme longevity.
Keywords: 
Subject: Biology and Life Sciences  -   Aging
§ These two authors have contributed equally as first authors.

1. Introduction

Positive biology focuses on understanding the biological mechanisms that promote health and longevity. Instead of studying diseases and their causes, positive biology aims to uncover the biological factors that contribute to human resilience and optimal functioning, including biomarkers and processes. This approach is crucial in an aging world, which faces an increasing set of public health challenges [1,2].
In this context, examining models of healthy aging and exceptional longevity is of major importance. Among Long-Lived Individuals (LLIs, ≥90 years), centenarians (≥100 years), including semi-supercentenarians (105-109 years) and supercentenarians (≥110 years) are a focus of extensive research. Most of them are resistant to or manage age-related diseases such as cancer, diabetes, cardiovascular diseases, and stroke. Thus, they are categorised as survivors, escapers, or delayers [1,3].
However, it is essential to recognize that the rising number of centenarians is due to advancements in hygiene and sanitation, along with better lifestyles. As a result, contemporary and future centenarians will likely be less selectively unique compared to those from previous decades [4].
Today, semi- and supercentenarians represent a unique selective group, having endured two World Wars and numerous environmental and microbial adversities, including the Spanish flu and COVID-19 pandemics [5,6,7,8,9]. Therefore, it is plausible to infer that their immune systems exhibit remarkable traits that can provide insights into the mechanisms influencing the achievement of such extreme longevity [10,11].
This study aims to offer new insights into the immune-inflammatory (IMFLAM) characteristics of these extreme phenotypes by measuring the INFLA-score, which evaluates the synergistic effect of inflammatory markers [12], the Systemic Inflammation Response Index (SIRI), a composite marker derived from peripheral blood cell counts that reflects immune-inflammatory balance [13], and Aging-Related Immune Phenotype (ARIP) indicators, which provide a more comprehensive understanding of how T cell immunity is associated with health than individual T-cell subsets [14].

2. Materials and Methods

2.1. Study population

The dataset used for the calculation of the scores in this study, along with the raw data, was collected during the project "Discovery of Molecular and Genetic/Epigenetic Signatures Underlying Resistance to Age-Related Diseases and Comorbidities" (DESIGN, 20157ATSLF, funded by the Italian Ministry of Education, University, and Research), from June 2017 to March 2023. The detailed study design and protocols have been previously reported [11,15], in accordance with the Declaration of Helsinki and its amendments and approved by the Ethics Committee of Palermo University Hospital (Nutrition and Longevity, No. 032017). For the inflammatory analysis, a total of 249 participants (139 females; 110 males) aged between 19 and 111 years were included, except for the INFLA-score for two missing values (N= 247). For the immunological evaluation, a subset of 54 participants (28 females; 26 males) aged between 19 and 110 years were included. All recruited individuals were in healthy conditions, considering their age and the physiological deterioration of organs and systems, and they had not taken any immunomodulatory drugs in the last six months.

2.2. Inflammatory scores: INFLA-score and SIRI

The INFLA-score was computed using the parameters of White Blood Cells (WBC) count, Neutrophil-to-Lymphocyte ratio (NLR), platelet count, and C-Reactive Protein (CRP) values, according to Pounis et al., [12] (Supplementary methods in Supplementary Materials for the computation) and the SIRI was calculated according to Qi et al., (neutrophils x monocytes/lymphocytes) [13]. Leukocyte and inflammatory values were obtained as previously described [11,15]. To better understand trends across different age ranges, the entire cohort was divided into four age groups as follows: adults (N= 91 individuals; age range: 19.5-64.7 years); older adults (N= 76 individuals; age range: 65.0-89.3 years); LLIs (N= 69 individuals; age range: 90.5-104.7 years); and semi- and supercentenarians (N= 13 individuals; age range: 105.4-111.8 years).

2.3. Immunological scores: ARIP

The ARIP includes the CD4/CD8 ratio, CD4+ and CD8+ T Naïve cells, and the T Naïve (TN)/TM (TM = T Central Memory (TCM) + T Effector Memory (TEM) + Terminally Differentiated Effector Memory (TEMRA)) for both CD4+ and CD8+ T cells [14], calculated on a sub-cohort of 54 individuals [11]. To better understand trends across each age range, we divided our sub-cohort (N= 54) into the same four age groups indicated above: adults (N= 20 individuals); older adults (N= 15 individuals); LLIs (N= 11 individuals); and semi- and supercentenarians (N= 8 individuals).

2.4. Statistics

The correlation between the various parameters and age was examined using simple linear regression analysis. A one-way ANOVA test was used to compare data between the different age groups, applying Tukey's correction. For all statistical analyses, only p-values ≤0.05 were considered significant. Data were not analysed according to gender due to the disproportionate numbers between the two genders among the oldest centenarians (65% of LLIs and 92% of semi- and supercentenarians were women).

3. Results

Figure S1a,c,e,g shows the correlation between age and WBC, NLR, platelet count and CRP, and Figure S1b,d,f,h shows their comparisons between the different age groups. It is possible to note a statistically significant correlation between age and NLR (Figure S1c; R²= 0.066; p-value <0.0001) and between age and CRP (Figure S1g; R²= 0.064; p-value <0.0001). Conversely, the values relative to platelets seemed to decrease according to age and with a statistical significance (Figure S1e; R²= 0.036; p-value= 0.003). The comparison between age groups showed statistically significant differences, except for WBC (Figure S1b). In particular, statistically significant results were observed in the comparison between age groups for NLR, platelet count, and CRP (Figure S1d,f,h). For NLR, the values for adults and older individuals were significantly lower than those for LLIs (Figure S1d; p-values= 0.002 and 0.043, respectively) and for semi- and supercentenarians (Figure S1d; Table S1; p-values= 0.004 and 0.019, respectively). For platelet count, the only significant differences were observed between adults and LLIs (Figure S1f; Table S1; p-value= 0.044). For CRP (Figure S1h; Table S1), the values for adults and older individuals were significantly lower than those for LLIs (p-values <0.0001 and 0.009, respectively), while the values for semi- and supercentenarians were significantly lower than those for LLIs (p-value= 0.026). Figure 1a clearly shows an increase in the INFLA-score with age (R²= 0.043; p-value= 0.001) with a value range between -14 and +16, with a median value of -1. It is noteworthy that there is a meaningful heterogeneity, especially at extreme ages (Figure S2). Comparing the scores between age groups (Figure 1b; Table 1), there was a statistically significant difference between the adult and LLIs groups (p-value= 0.018). No significant differences were observed between the semi- and supercentenarian and the other groups (Figure 1b).
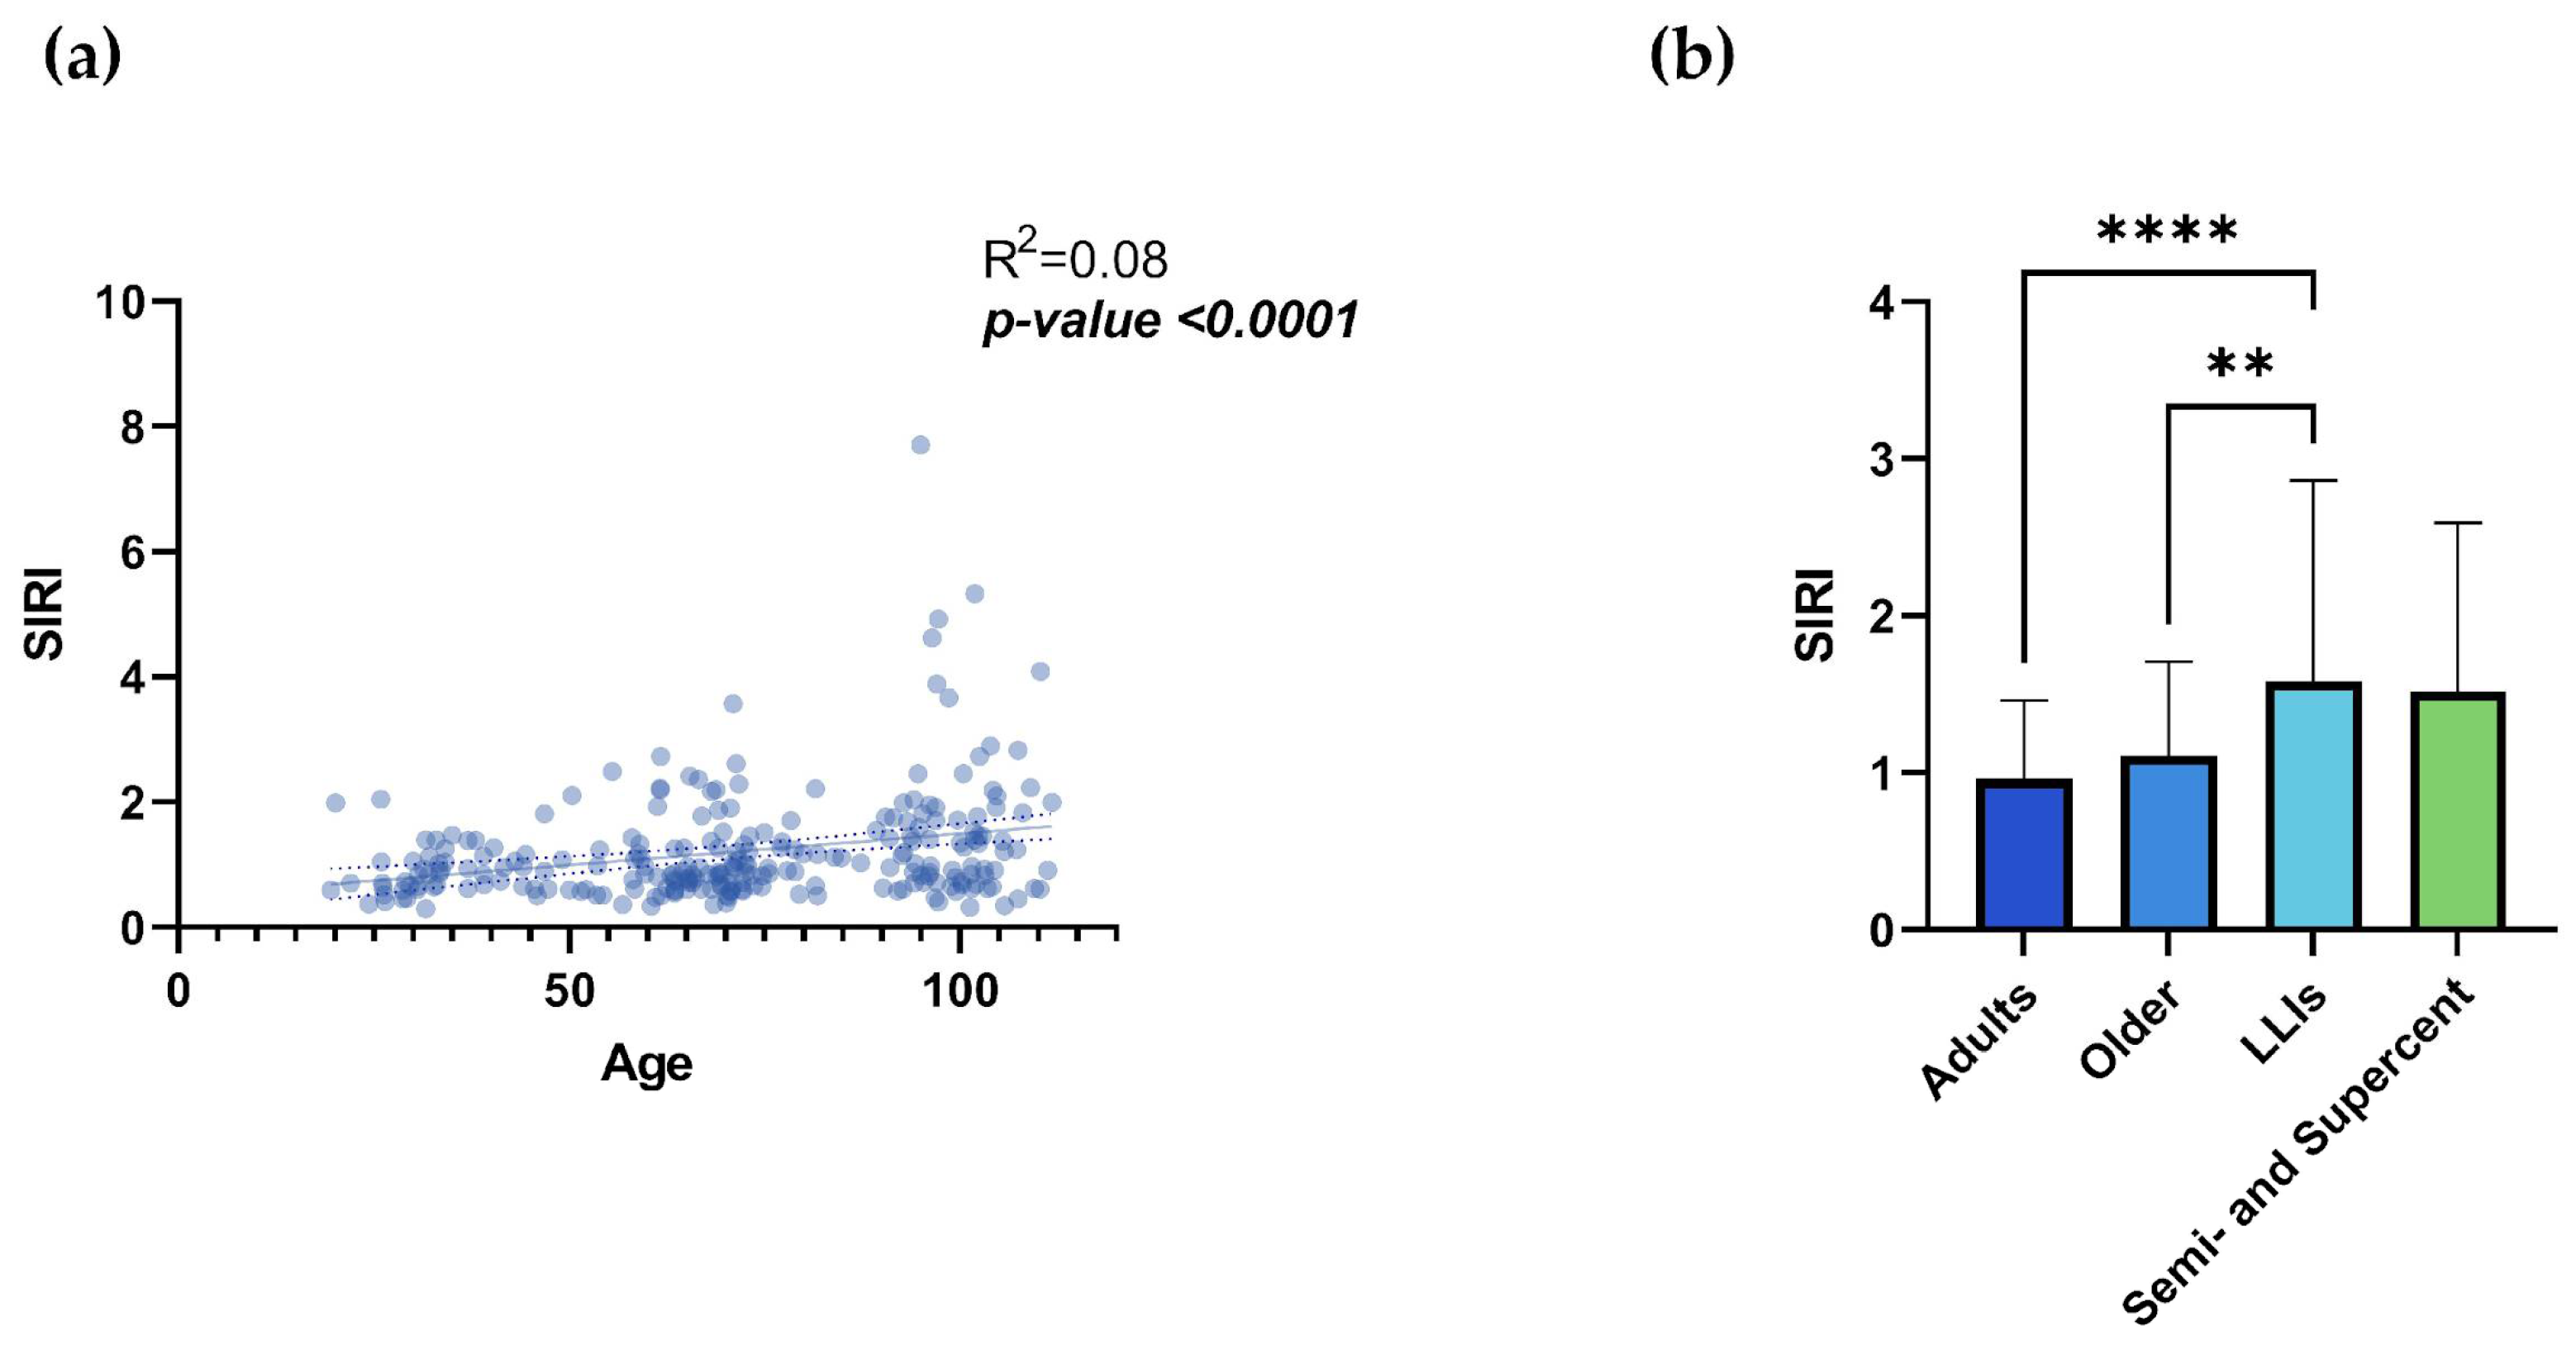
Regarding SIRI analysis, Figure S3a,c,e shows the correlation between age and leukocyte populations, and Figure S3b,d,f shows the leukocyte count in the different age groups. It is possible to note the positive and statistically significant correlation between age and monocyte count (Figure S3c; R²= 0.039; p-value= 0.002) and, conversely, the negative correlation between age and lymphocytes (Figure S3e; R²= 0.017; p-value= 0.042). The comparison between age groups did not show statistically significant differences for any of the leukocyte populations considered, except for monocyte values between the adult and LLIs groups (Figure S3d; Table S2; p-value= 0.011). However, considering the SIRI, simple linear regression shows a highly significant statistical correlation of this index with age and an increase of SIRI values according to age (Figure 2a; R²= 0.08; p-value <0.0001), although the big heterogeneity at extreme ages exists (Figure S4). Comparing the index between age groups, there was a statistically significant difference between the adult and LLIs groups (p-value <0.0001) and between the older and LLIs groups (p-value=0.005) (Figure 2b; Table 1). Interestingly, no significant differences were observed between the semi- and supercentenarian and the other groups (Figure 2b).
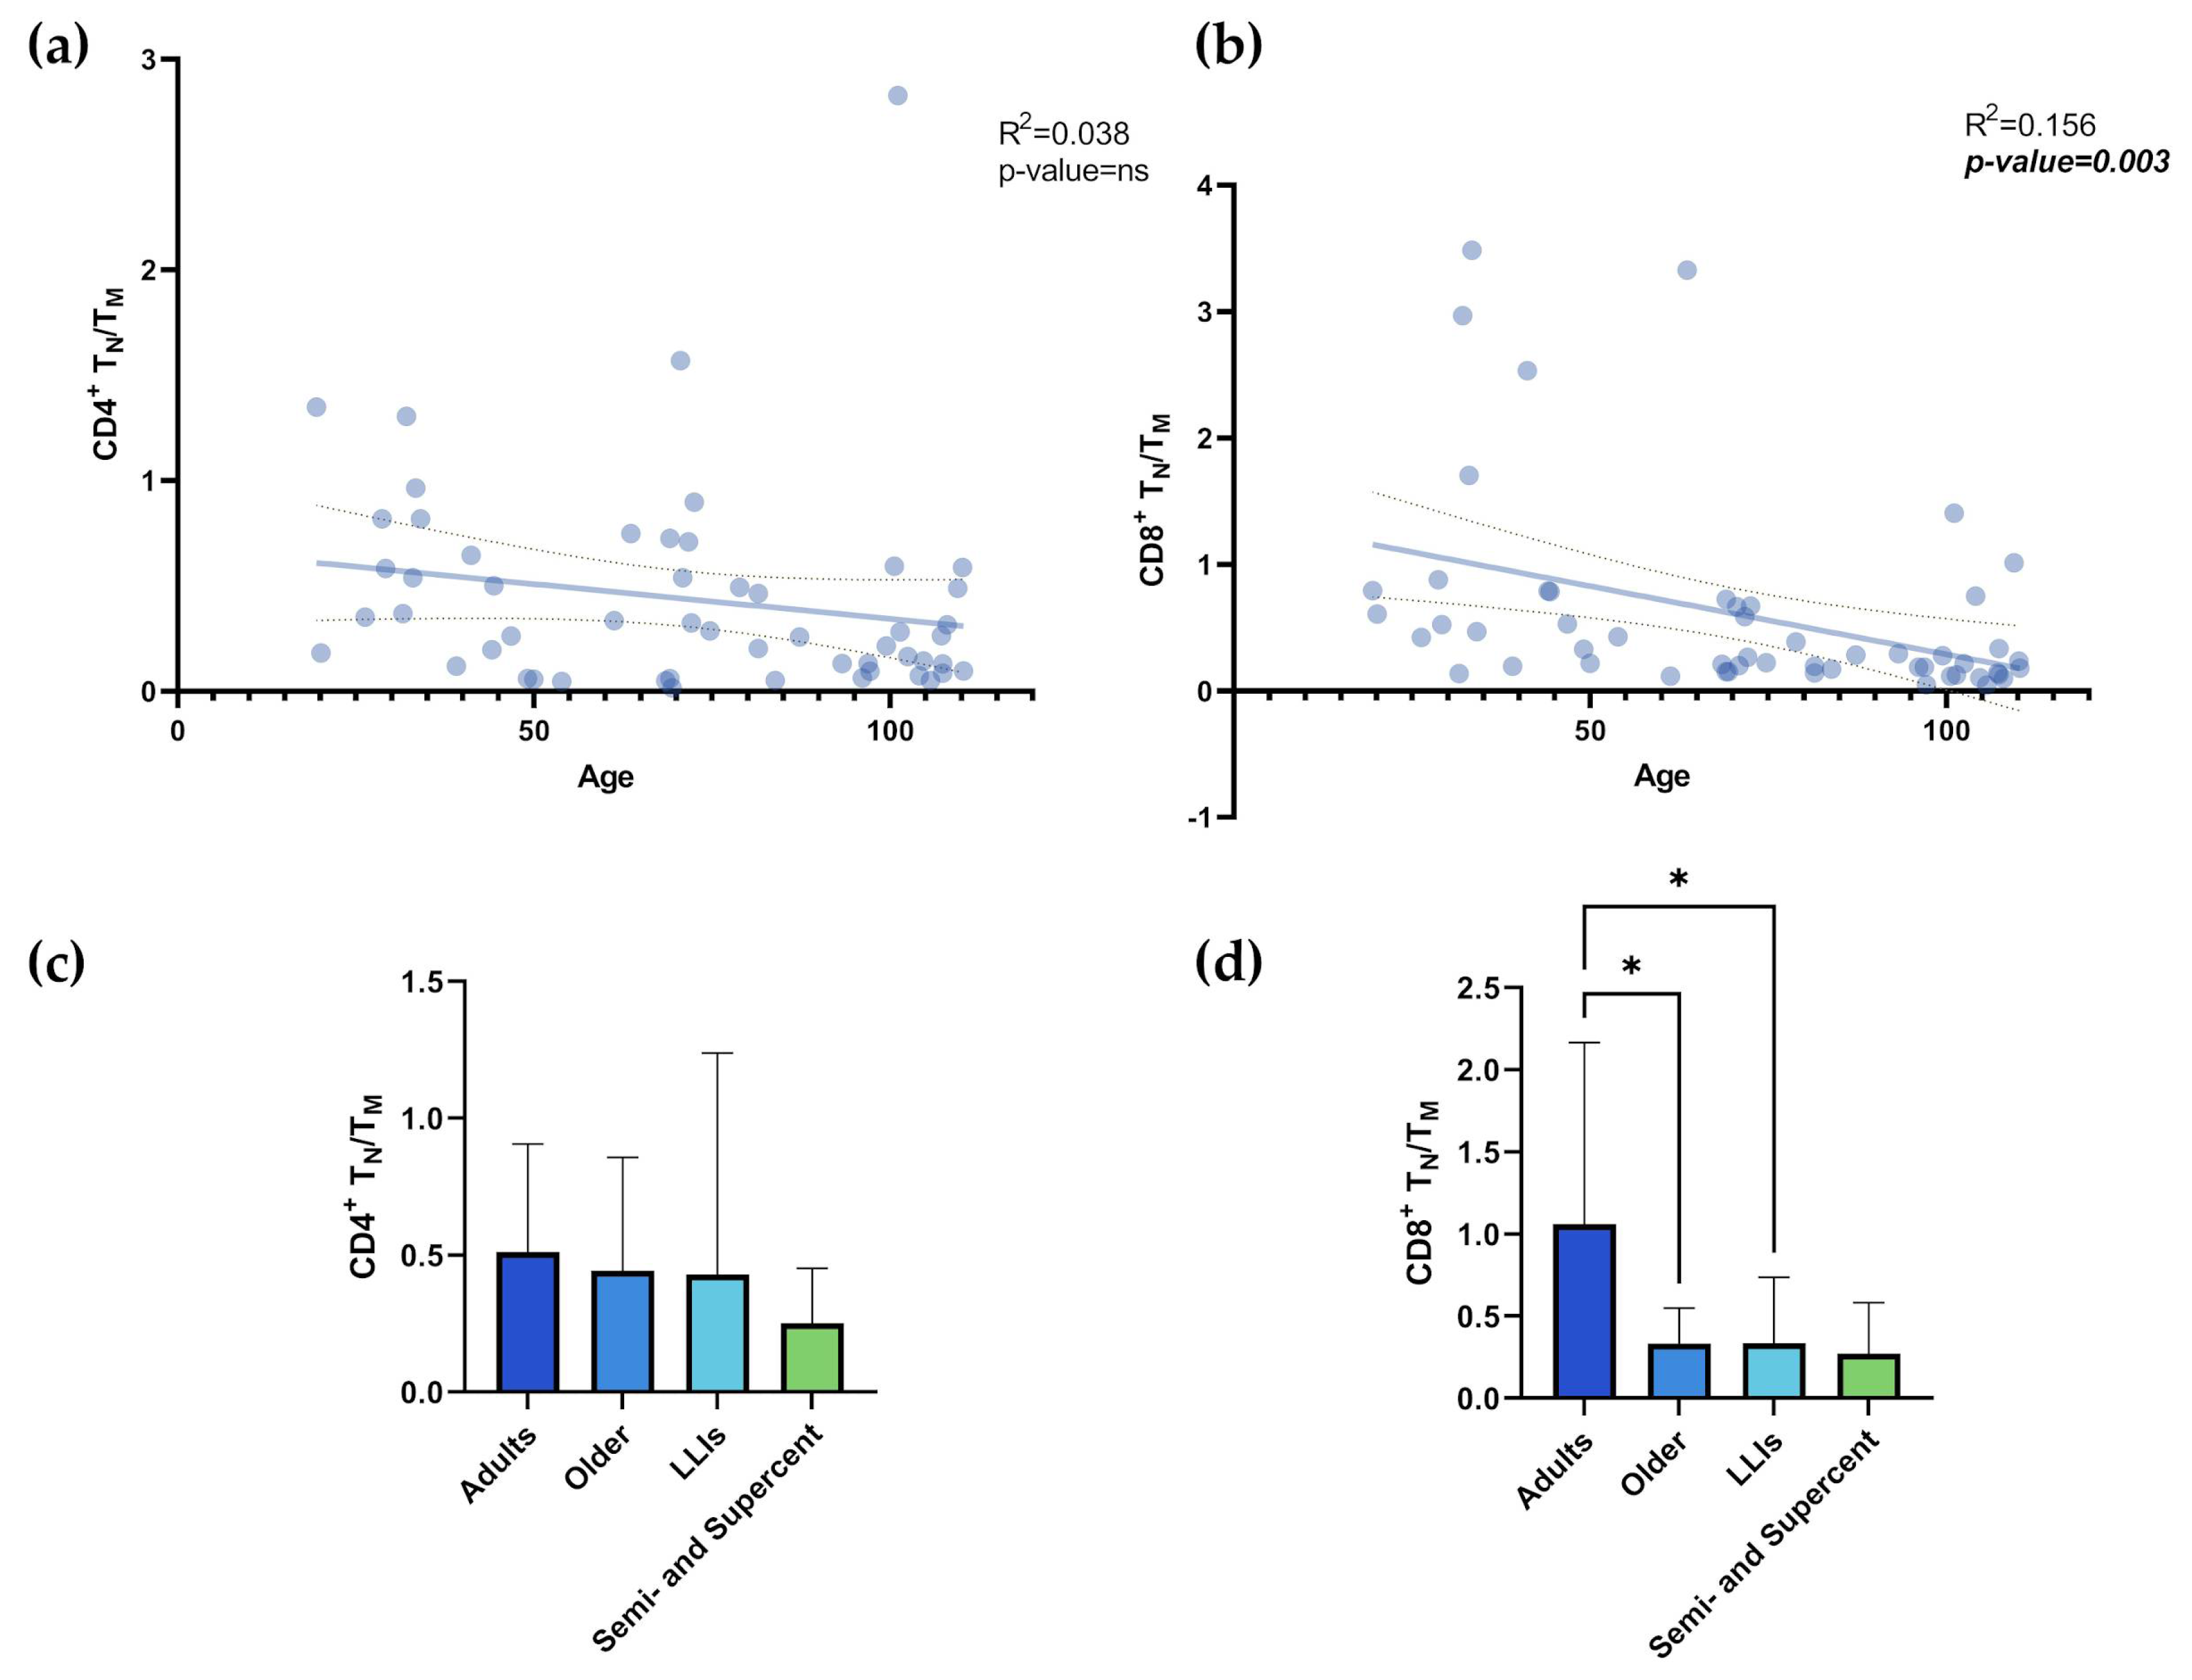
According to Ramasubramanian et al. [14], ARIP is represented by CD4+ and CD8+ naïve T cells, the CD4/CD8 ratio, and the CD4+ TN/TM and CD8+ TN/TM ratios. Figure S5a shows a significant decrease in CD4+ TN with age (R²= 0.094; p-value= 0.024) and a significant increase in CD4+ TM (R²= 0.095; p-value= 0.024). However, the comparison between age groups does not show statistically significant differences between the groups (Figure S5b,c). Figure S5d showed a significant decrease in CD8+ TN with age (R²= 0.24; p-value= 0.0002) and a significant increase in CD8+ TM (R²= 0.24; p-value= 0.0002). The comparison between age groups for CD8+ TN and TM showed statistically significant differences (Figure S5e,f). Adult values of CD8+ TN were significantly higher than those of older individuals (p-value=0.018), LLIs (p-value= 0.014), and semi- and supercentenarians (Figure S5e; Table S3; p-value= 0.013). Adult values of CD8+ TM were significantly lower than those of older individuals (p-value= 0.026), LLIs (p-value= 0.015), and semi- and supercentenarians (Figure S5f; Table S3; p-value= 0.013). Concerning the TN/TM cell ratio, no significant age-related correlation is found for the CD4+ TN/TM ratio (Figure 3a; R²= 0.038; p-value= ns, ), whereas a significant correlation with age was found for the CD8+ TN/TM ratio (Figure 3b; R²= 0.156; p-value= 0.003). Accordingly, the comparison between age groups does not show statistically significant differences for the CD4+ TN/TM ratio (Figure 3c), whereas, for the CD8+ TN/TM ratio (Figure 3d), the values for adults are significantly higher than those of older individuals and LLIs (Table 1; p-values= 0.024 and 0.048, respectively). Intriguingly, no significant differences are observed between the semi- and supercentenarians and the other groups (Figure 3d).

4. Discussion

Inflamm-aging, that is the chronic low-grade inflammation that occurs during aging, is characterized by increased systemic levels of pro-inflammatory mediators, resulting from a complex interaction of biological, genetic, and environmental factors. It has a significant impact on multiple body systems, contributing to the onset and progression of numerous age-related diseases and the general decline of health in older people. In addition, the inflammatory process is favoured by the decline of the immune system and, in turn, aggravates immune aging [16,17,18,19,20,21,22,23,24]. For all this reason, the identification of good markers to evaluate the systemic IMFLAM status is crucial. Because, sometimes, the single parameter doesn’t represent a good evaluation index of the effective systemic condition, the possibility of calculating scores, by putting together multiple markers, is more informative, ignoring the variability presented by differences in units, mean intakes, and biological actions, given by the analysis of the individual biomarkers.
The present study supports the idea that controlling IMFLAM responses can play a role in promoting extreme longevity [11,25,26,27,28]. The INFLA-score and SIRI, two composite indices summarising the effect of multiple inflammatory biomarkers, were calculated to measure the level of chronic inflammation [12,13]. However, a big heterogeneity in the index values was observed, especially among the semi- and supercentenarians and it is noteworthy that underlying parameters do not always show overlapping significance.
Integrating various inflammatory biomarkers, the INFLA-score captures the complexity of inflammation as a multifaceted process involving both plasmatic and cellular components [12]. It also provides a useful tool for large-scale epidemiological studies, summarising the variability of inflammation among different individuals. The higher the INFLA-score, the higher the low-grade inflammation, which is an independent risk factor for mortality, even in individuals without acute inflammation [12,29,30,31,32].
SIRI is a reliable prognostic marker in various diseases, helping to predict patient outcomes, survival rates, and disease progression [13]. It is obtained by integrating different aspects of the IMFLAM response through the combination of neutrophil, monocyte, and lymphocyte counts. In this way, SIRI provides a more comprehensive view of systemic inflammation compared to single markers, offering several advantages in both clinical and research settings [13,33,34,35,36].
As known, also different immunological parameters change during lifespan. The alterations in the adaptive immune system during the aging process contribute to an ARIP adatment [14]. A recent study analysed the associations of ARIP measures with chronological age, biological age, and multimorbidity outcomes in a large sample of the American population over 55 years old, but with a negligible percentage of centenarians and no semi- or supercentenarians (age (mean ± SE) 68.65 ± 0.26) [14]. The relationships between rising multimorbidity, mortality, and biological age suggested that CD4+ TN/TM and CD4+ T Naïve cells might serve as biomarkers for detecting individuals at greater risk of accelerated aging and related morbidities, as well as increased mortality [14]. This is supported by findings from the Multi-Ethnic Study of Atherosclerosis, which show that naïve and memory CD4+ T cells are linked to type II diabetes and subclinical atherosclerosis in a cross-sectional manner [37,38]. The CD8+ TN/TM ratio was then associated with a lower risk of cancer, heart disease, and diabetes and it was predictive of successful aging, as well as CD8+ T Naïve. Regarding another ARIP parameter, the CD4/CD8 ratio, it does not condition the rise of age-related diseases [14]. The only significant differences that are found in our work regarding the comparison between the various groups concerned the CD8+ T cells. However, in the study sample, multiple regression analysis showed that levels of CD8+ T Naïve, TEM, and TEMRA cells are more strongly correlated with the degree of cytomegalovirus seropositivity than with age (unpublished observations). Despite these reservations about the significance of the data, it is interesting to note that there are no significant differences in the values of the CD8+ TN/TM ratio between the groups of younger individuals and that of semi- and supercentenarians, with a great heterogeneity of values. As previously stated, this datum could be considered, on average, as an indicator of successful aging at least in semi- and supercentenarians.
On the other hand, recent studies of lymphocyte subsets in semi- and supercentenarians suggest that immune system aging changes should be considered as a specific adaptation that enables the oldest centenarians to successfully cope with a lifetime of antigenic challenges and achieve extreme longevity [11,25,26,27,28].

5. Conclusions

Our results extend and reinforce the idea that controlling IMFLAM responses plays a significant role in achieving extreme longevity. This does not exclude the involvement of other organs and systems. It should be noted that the innate immune system (inflammation) and the adaptive immune system (lymphocytes and antibodies) have been the subjects of more extensive and in-depth research compared to other systems and organs in the body, primarily due to their suitability for ex vivo studies. Additionally, it should be considered that an efficient immune system could be the effect of a well-functioning organism rather than its cause. Finally, the heterogeneity of values observed in semi- and supercentenarians should not be surprising because paraphrasing what evolutionary medicine teaches us about disease, there is no single model of aging: everyone ages in a unique way because their genotypes and exposomes are unique.

Supplementary Materials

The following supporting information can be downloaded at the website of this paper posted on Preprints.org, Supplementary methods: INFLA-score computation; Figure S1: The parameters of the INFLA-score; Figure S2: Semi- and Supercentenarians INFLA-score; Figure S3: The parameters of SIRI analysis; Figure S4: Semi- and Supercentenarians SIRI; Figure S5: The parameters of TN/TM; Table S1: INFLA-score parameters; Table S2: SIRI parameters; Table S3: TN-TM parameters.

Author Contributions

Conceptualization G.C and C.C.; methodology C.C., M.D.S., M.E.L., and S.M.; formal analysis A.C., M.E.L., S.M., and M.C.; investigation, G.A., R.C., M.D.S., M.E.L., C.C., and A.A; data curation G.A., A.C., and R.Z.; writing—original draft preparation, A.C. and C.C.; writing—review and editing, G.A., A.C., A.A., and C.C.; supervision M.C., S.M., C.C., and G.C.; funding acquisition, C.C., G.C. All authors have read and agreed to the published version of the manuscript”.

Funding

No funding

Institutional Review Board Statement

The Institutional Ethics Committee (“Paolo Giaccone”, University Hospital) approved the DESIGN study protocol (Nutrition and Longevity, No. 032017). The study was conducted in accordance with the Declaration of Helsinki and its amendments.

Informed Consent Statement

Informed consent was obtained from all participants and/or their offspring or caregivers.

Data Availability Statement

The data that support the findings of this study are available from the corresponding author, upon reasonable request.

Acknowledgments

We thank the I International Longevity Science Association directed by Dr. Damiano Galimberti for the financial support during the recruitment and Alessandro Delucchi for the identification of the semi- and supercentenarians by http://www.supercentenariditalia.it.

Conflicts of Interest

The authors declare no conflict of interest.

References

  1. Caruso, C.; Passarino, G.; Puca, A.; Scapagnini, G. "Positive biology": the centenarian lesson. Immun Ageing 2012, 9, 5. [Google Scholar] [CrossRef] [PubMed]
  2. Christensen, K.; Doblhammer, G.; Rau, R.; Vaupel, J.W. Ageing populations: the challenges ahead. Lancet 2009, 374, 1196–1208. [Google Scholar] [CrossRef] [PubMed]
  3. Evert, J.; Lawler, E.; Bogan, H.; Perls, T. Morbidity profiles of centenarians: survivors, delayers, and escapers. J Gerontol A Biol Sci Med Sci 2003, 58, 232–237. [Google Scholar] [CrossRef] [PubMed]
  4. Aiello, A.; Ligotti, M.E.; Cossarizza, A. Centenarian Offspring as a Model of Successful Ageing. In Centenarians, 1st ed.; Caruso, C., Ed.; Springer Cham: Switzerland, 2019. [Google Scholar]
  5. Accardi, G.; Aiello, A.; Aprile, S.; Caldarella, R.; Cammarata, G.; Carru, C.; Caruso, C.; Ciaccio, M.; Colomba, P.; Galimberti, D.; Gambino, C.M.; Davinelli, S.; De Vivo, I.; Ligotti, M.E.; Vasto, S.; Zinellu, A.; Candore, G. The Phenotypic Characterization of the Cammalleri Sisters, an Example of Exceptional Longevity. Rejuvenation Res 2020, 23, 476–484. [Google Scholar] [CrossRef] [PubMed]
  6. Caruso, C.; Accardi, G.; Aiello, A.; Calabrò, A.; Ligotti, M.E.; Candore, G. Centenarians born before 1919 are resistant to COVID-19. Aging Clin Exp Res 2023, 35, 217–220. [Google Scholar] [CrossRef]
  7. Caruso, C.; Marcon, G.; Accardi, G.; Aiello, A.; Calabrò, A.; Ligotti, M.E.; Tettamanti, M.; Franceschi, C.; Candore, G. Role of Sex and Age in Fatal Outcomes of COVID-19: Women and Older Centenarians Are More Resilient. Int J Mol Sci 2023, 24, 2638. [Google Scholar] [CrossRef]
  8. Poulain, M.; Chambre, D.; Pes, G.M. Centenarians exposed to the Spanish flu in their early life better survived to COVID-19. Aging (Albany NY) 2021, 13, 21855–21865. [Google Scholar] [CrossRef]
  9. Aoki, Y. The number of centenarians continues to increase during the COVID-19 pandemic in Japan. Geriatr Gerontol Int 2023, 23, 395–396. [Google Scholar] [CrossRef]
  10. de Castro, M.V.; Silva, M.V.R.; Naslavsky, M.S.; Scliar, M.O.; Nunes, K.; Passos-Bueno, M.R.; Castelli, E.C.; Magawa, J.Y.; Adami, F.L.; Moretti, A.I.S.; de Oliveira, V.L.; Boscardin, S.B.; Cunha-Neto, E.; Kalil, J.; Jouanguy, E.; Bastard, P.; Casanova, J.L.; Quiñones-Vega, M.; Sosa-Acosta, P.; Guedes, J.S.; de Almeida, N.P.; Nogueira, F.C.S.; Domont, G.B.; Santos, K.S.; Zatz, M. The oldest unvaccinated Covid-19 survivors in South America. Immun Ageing 2022, 19, 57. [Google Scholar] [CrossRef]
  11. Ligotti, M.E.; Accardi, G.; Aiello, A.; Aprile, S.; Calabrò, A.; Caldarella, R.; Caruso, C.; Ciaccio, M.; Corsale, A.M.; Dieli, F.; Di Simone, M.; Giammanco, G.M.; Mascarella, C.; Akbar, A.N.; Meraviglia, S.; Candore, G. Sicilian semi- and supercentenarians: Identification of age-related T cell immunophenotype to define longevity trait. Clin Exp Immunol 2023, 214, 61–78. [Google Scholar] [CrossRef]
  12. Pounis, G.; Bonaccio, M.; Di Castelnuovo, A.; Costanzo, S.; de Curtis, A.; Persichillo, M.; Sieri, S.; Donati, M.B.; Cerletti, C.; de Gaetano, G.; Iacoviello, L. Polyphenol intake is associated with low-grade inflammation, using a novel data analysis from the Moli-sani study. Thromb Haemost 2016, 115, 344–352. [Google Scholar] [CrossRef] [PubMed]
  13. Qi, Q.; Zhuang, L.; Shen, Y.; Geng, Y.; Yu, S.; Chen, H.; Liu, L.; Meng, Z.; Wang, P.; Chen, Z. A novel systemic inflammation response index (SIRI) for predicting the survival of patients with pancreatic cancer after chemotherapy. Cancer 2016, 122, 2158–2167. [Google Scholar] [CrossRef] [PubMed]
  14. Ramasubramanian, R.; Meier, H.C.S.; Vivek, S.; Klopack, E.; Crimmins, E.M.; Faul, J.; Nikolich-Žugich, J.; Thyagarajan, B. Evaluation of T-cell aging-related immune phenotypes in the context of biological aging and multimorbidity in the Health and Retirement Study. Immun Ageing 2022, 19, 33. [Google Scholar] [CrossRef]
  15. Aiello, A.; Accardi, G.; Aprile, S.; Caldarella, R.; Carru, C.; Ciaccio, M.; De Vivo, I.; Gambino, C.M.; Ligotti, M.E.; Vasto, S.; Zinellu, A.; Caruso, C.; Bono, F.; Candore, G. Age and Gender-related Variations of Molecular and Phenotypic Parameters in A Cohort of Sicilian Population: from Young to Centenarians. Aging Dis 2021, 12, 1773–1793. [Google Scholar] [CrossRef]
  16. Franceschi, C.; Bonafe, M.; Valensin, S.; Olivieri, F.; De Luca, M.; Ottaviani, E.; De Benedictis, G. Inflamm-aging: An evolutionary perspective on immunosenescence. Ann N Y Acad Sci 2000, 908, 244–254. [Google Scholar] [CrossRef]
  17. Nazmi, A.; Victora, C.G. Socioeconomic and racial/ethnic differentials of C-reactive protein levels: a systematic review of population-based studies. BMC Public Health 2007, 7, 212. [Google Scholar] [CrossRef]
  18. Incalcaterra, E.; Accardi, G.; Balistreri, C.R.; Caimi, G.; Candore, G.; Caruso, M.; Caruso, C. Pro-inflammatory genetic markers of atherosclerosis. Curr Atheroscler Rep, 2013, 15, 329. [Google Scholar] [CrossRef] [PubMed]
  19. Baccarelli, A.A.; Hales, N.; Burnett, R.T.; Jerrett, M.; Mix, C.; Dockery, D.W.; Pope, C.A. Particulate Air Pollution, Exceptional Aging, and Rates of Centenarians: A Nationwide Analysis of the United States, 1980-2010. Environ Health Perspect 2016, 124, 1744–1750. [Google Scholar] [CrossRef]
  20. Ferrucci, L.; Fabbri, E. Inflammageing: chronic inflammation in ageing, cardiovascular disease, and frailty. Nat Rev Cardiol 2018, 15, 505–522. [Google Scholar] [CrossRef]
  21. Fulop, T.; Larbi, A.; Dupuis, G.; Le Page, A.; Frost, E.H.; Cohen, A.A.; Witkowski, J.M.; Franceschi, C. Immunosenescence and Inflamm-Aging As Two Sides of the Same Coin: Friends or Foes? Front Immunol 2018, 8, 1960. [Google Scholar] [CrossRef]
  22. Yousefzadeh, M.J.; Flores, R.R.; Zhu, Y.; Schmiechen, Z.C.; Brooks, R.W.; Trussoni, C.E.; Cui, Y.; Angelini, L.; Lee, K.A.; McGowan, S.J.; Burrack, A.L.; Wang, D.; Dong, Q.; Lu, A.; Sano, T.; O'Kelly, R.D.; McGuckian, C.A.; Kato, J.I.; Bank, M.P.; Wade, E.A.; Pillai, S.P.S.; Klug, J.; Ladiges, W.C.; Burd, C.E.; Lewis, S.E.; La Russo, N.F.; Vo, N.V.; Wang, Y.; Kelley, E.E.; Huard, J.; Stromnes, I.M.; Robbins, P.D.; Niedernhofer, L.J. An aged immune system drives senescence and ageing of solid organs. Nature 2021, 594, 100–105. [Google Scholar] [CrossRef] [PubMed]
  23. Caruso, C.; Ligotti, M.E.; Accardi, G.; Aiello, A.; Candore, G. An immunologist’s guide to immunosenescence and its treatment. Expert Rev Clin Immunol 2022, 18, 961–981. [Google Scholar] [CrossRef] [PubMed]
  24. Zanini, G.; Selleri, V.; Lopez, D.S.; Malerba, M.; Nasi, M.; Mattioli, A.V.; Pinti, M. Mitochondrial DNA as inflammatory DAMP: a warning of an aging immune system? Biochem Soc Trans 2023, 51, 735–745. [Google Scholar] [CrossRef] [PubMed]
  25. Hashimoto, K.; Kouno, T.; Ikawa, T.; Hayatsu, N.; Miyajima, Y.; Yabukami, H.; Terooatea, T.; Sasaki, T.; Suzuki, T.; Valentine, M.; Pascarella, G.; Okazaki, Y.; Suzuki, H.; Shin, J.W.; Minoda, A.; Taniuchi, I.; Okano, H.; Arai, Y.; Hirose, N.; Carninci, P. . Single-cell transcriptomics reveals expansion of cytotoxic CD4 T cells in supercentenarians. Proc Natl Acad Sci 2019, 116, 24242–24251. [Google Scholar] [CrossRef] [PubMed]
  26. Karagiannis, T.T.; Dowrey, T.W.; Villacorta-Martin, C.; Montano, M.; Reed, E.; Belkina, A.C.; Andersen, S.L.; Perls, T.T.; Monti, S.; Murphy, G.J.; Sebastiani, P. Multi-modal profiling of peripheral blood cells across the human lifespan reveals distinct immune cell signatures of aging and longevity. EBioMedicine 2023, 90, 104514. [Google Scholar] [CrossRef] [PubMed]
  27. Ligotti, M.E.; Accardi, G.; Aiello, A.; Calabrò, A.; Caruso, C.; Corsale, A.M.; Dieli, F.; Di Simone, M.; Meraviglia, S.; Candore, G. Sicilian semi- and supercentenarians: Age-related NK cell immunophenotype and longevity trait definition. Transl Med UniSa 2023, 25, 11–15. [Google Scholar] [CrossRef] [PubMed]
  28. Ligotti, M.E.; Accardi, G.; Aiello, A.; Calabrò, A.; Caruso, C.; Corsale, A.M.; Dieli, F.; Di Simone, M.; Meraviglia, S.; Candore, G. Sicilian semi- and supercentenarians: Age-related Tγδ cell immunophenotype contributes to longevity trait definition. Clin Exp Immunol 2024, 216, 1–12. [Google Scholar] [CrossRef] [PubMed]
  29. Bonaccio, M.; Di Castelnuovo, A.; Pounis, G.; De Curtis, A.; Costanzo, S.; Persichillo, M.; Cerletti, C.; Donati, M.B.; de Gaetano, G.; Iacoviello, L. Moli-sani Study Investigators. A score of low-grade inflammation and risk of mortality: prospective findings from the Moli-sani study. Haematologica 2016, 101, 1434–1441. [Google Scholar] [CrossRef]
  30. Costanzo, S.; Magnacca, S.; Bonaccio, M.; Di Castelnuovo, A.; Piraino, A.; Cerletti, C.; de Gaetano, G.; Donati, M.B.; Iacoviello, L.; Moli-sani Study Investigators. Reduced pulmonary function, low-grade inflammation and increased risk of total and cardiovascular mortality in a general adult population: Prospective results from the Moli-sani study. Respir Med 2021, 184, 106441. [Google Scholar] [CrossRef]
  31. Mignogna, C.; Costanzo, S.; Di Castelnuovo, A.; Ruggiero, E.; Shivappa, N.; Hebert, J.R.; Esposito, S.; De Curtis, A.; Persichillo, M.; Cerletti, C.; Donati, M.B.; de Gaetano, G.; Iacoviello, L.; Bonaccio, M. Moli-sani Study Investigators. The inflammatory potential of the diet as a link between food processing and low-grade inflammation: An analysis on 21,315 participants to the Moli-sani study. Clin Nutr 2022, 41, 2226–2234. [Google Scholar] [CrossRef]
  32. Andreis, A.; Solano, A.; Balducci, M.; Picollo, C.; Ghigliotti, M.; Giordano, M.; Agosti, A.; Collini, V.; Anselmino, M.; De Ferrari, G.M.; Rinaldi, M.; Alunni, G.; Imazio, M. INFLA-score: A new diagnostic paradigm to identify pericarditis. Hellenic J Cardiol 2024, 21, S1109–9666. [Google Scholar] [CrossRef] [PubMed]
  33. Xie, J.; Guo, Z.; Zhu, Y.; Ma, M.; Jia, G. Peripheral blood inflammatory indexes in breast cancer: A review. Medicine (Baltimore) 2023, 102, e36315. [Google Scholar] [CrossRef] [PubMed]
  34. Han, J.; Yang, L.; Lou, Z.; Zhu, Y. Association between Systemic Immune-Inflammation Index and Systemic Inflammation Response Index and Outcomes of Acute Ischemic Stroke: A Systematic Review and Meta-Analysis. Ann Indian Acad Neurol 2023, 26, 655–662. [Google Scholar] [CrossRef] [PubMed]
  35. Jarmuzek, P.; Kozlowska, K.; Defort, P.; Kot, M.; Zembron-Lacny, A. Prognostic Values of Systemic Inflammatory Immunological Markers in Glioblastoma: A Systematic Review and Meta-Analysis. Cancers (Basel) 2023, 15, 3339. [Google Scholar] [CrossRef]
  36. Sahin, R.; Tanacan, A.; Serbetci, H.; Agaoglu, Z.; Karagoz, B.; Haksever, M.; Kara, O.; Şahin, D. The role of first-trimester NLR (neutrophil to lymphocyte ratio), systemic immune-inflammation index (SII), and, systemic immune-response index (SIRI) in the prediction of composite adverse outcomes in pregnant women with systemic lupus erythematosus. J Reprod Immunol 2023, 158, 103978. [Google Scholar] [CrossRef]
  37. Olson, N.C.; Doyle, M.F.; Jenny, N.S.; Huber, S.A.; Psaty, B.M.; Kronmal, R.A.; Tracy, R.P. Decreased naive and increased memory CD4(+) T cells are associated with subclinical atherosclerosis: the multi-ethnic study of atherosclerosis. PLoS One 2013, 8, e71498. [Google Scholar] [CrossRef]
  38. Olson, N.C.; Doyle, M.F.; de Boer, I.H.; Huber, S.A.; Jenny, N.S.; Kronmal, R.A.; Psaty, B.M.; Tracy, R.P. Associations of Circulating Lymphocyte Subpopulations with Type 2 Diabetes: Cross-Sectional Results from the Multi-Ethnic Study of Atherosclerosis (MESA). PLoS One 2015, 10, e0139962. [Google Scholar] [CrossRef]
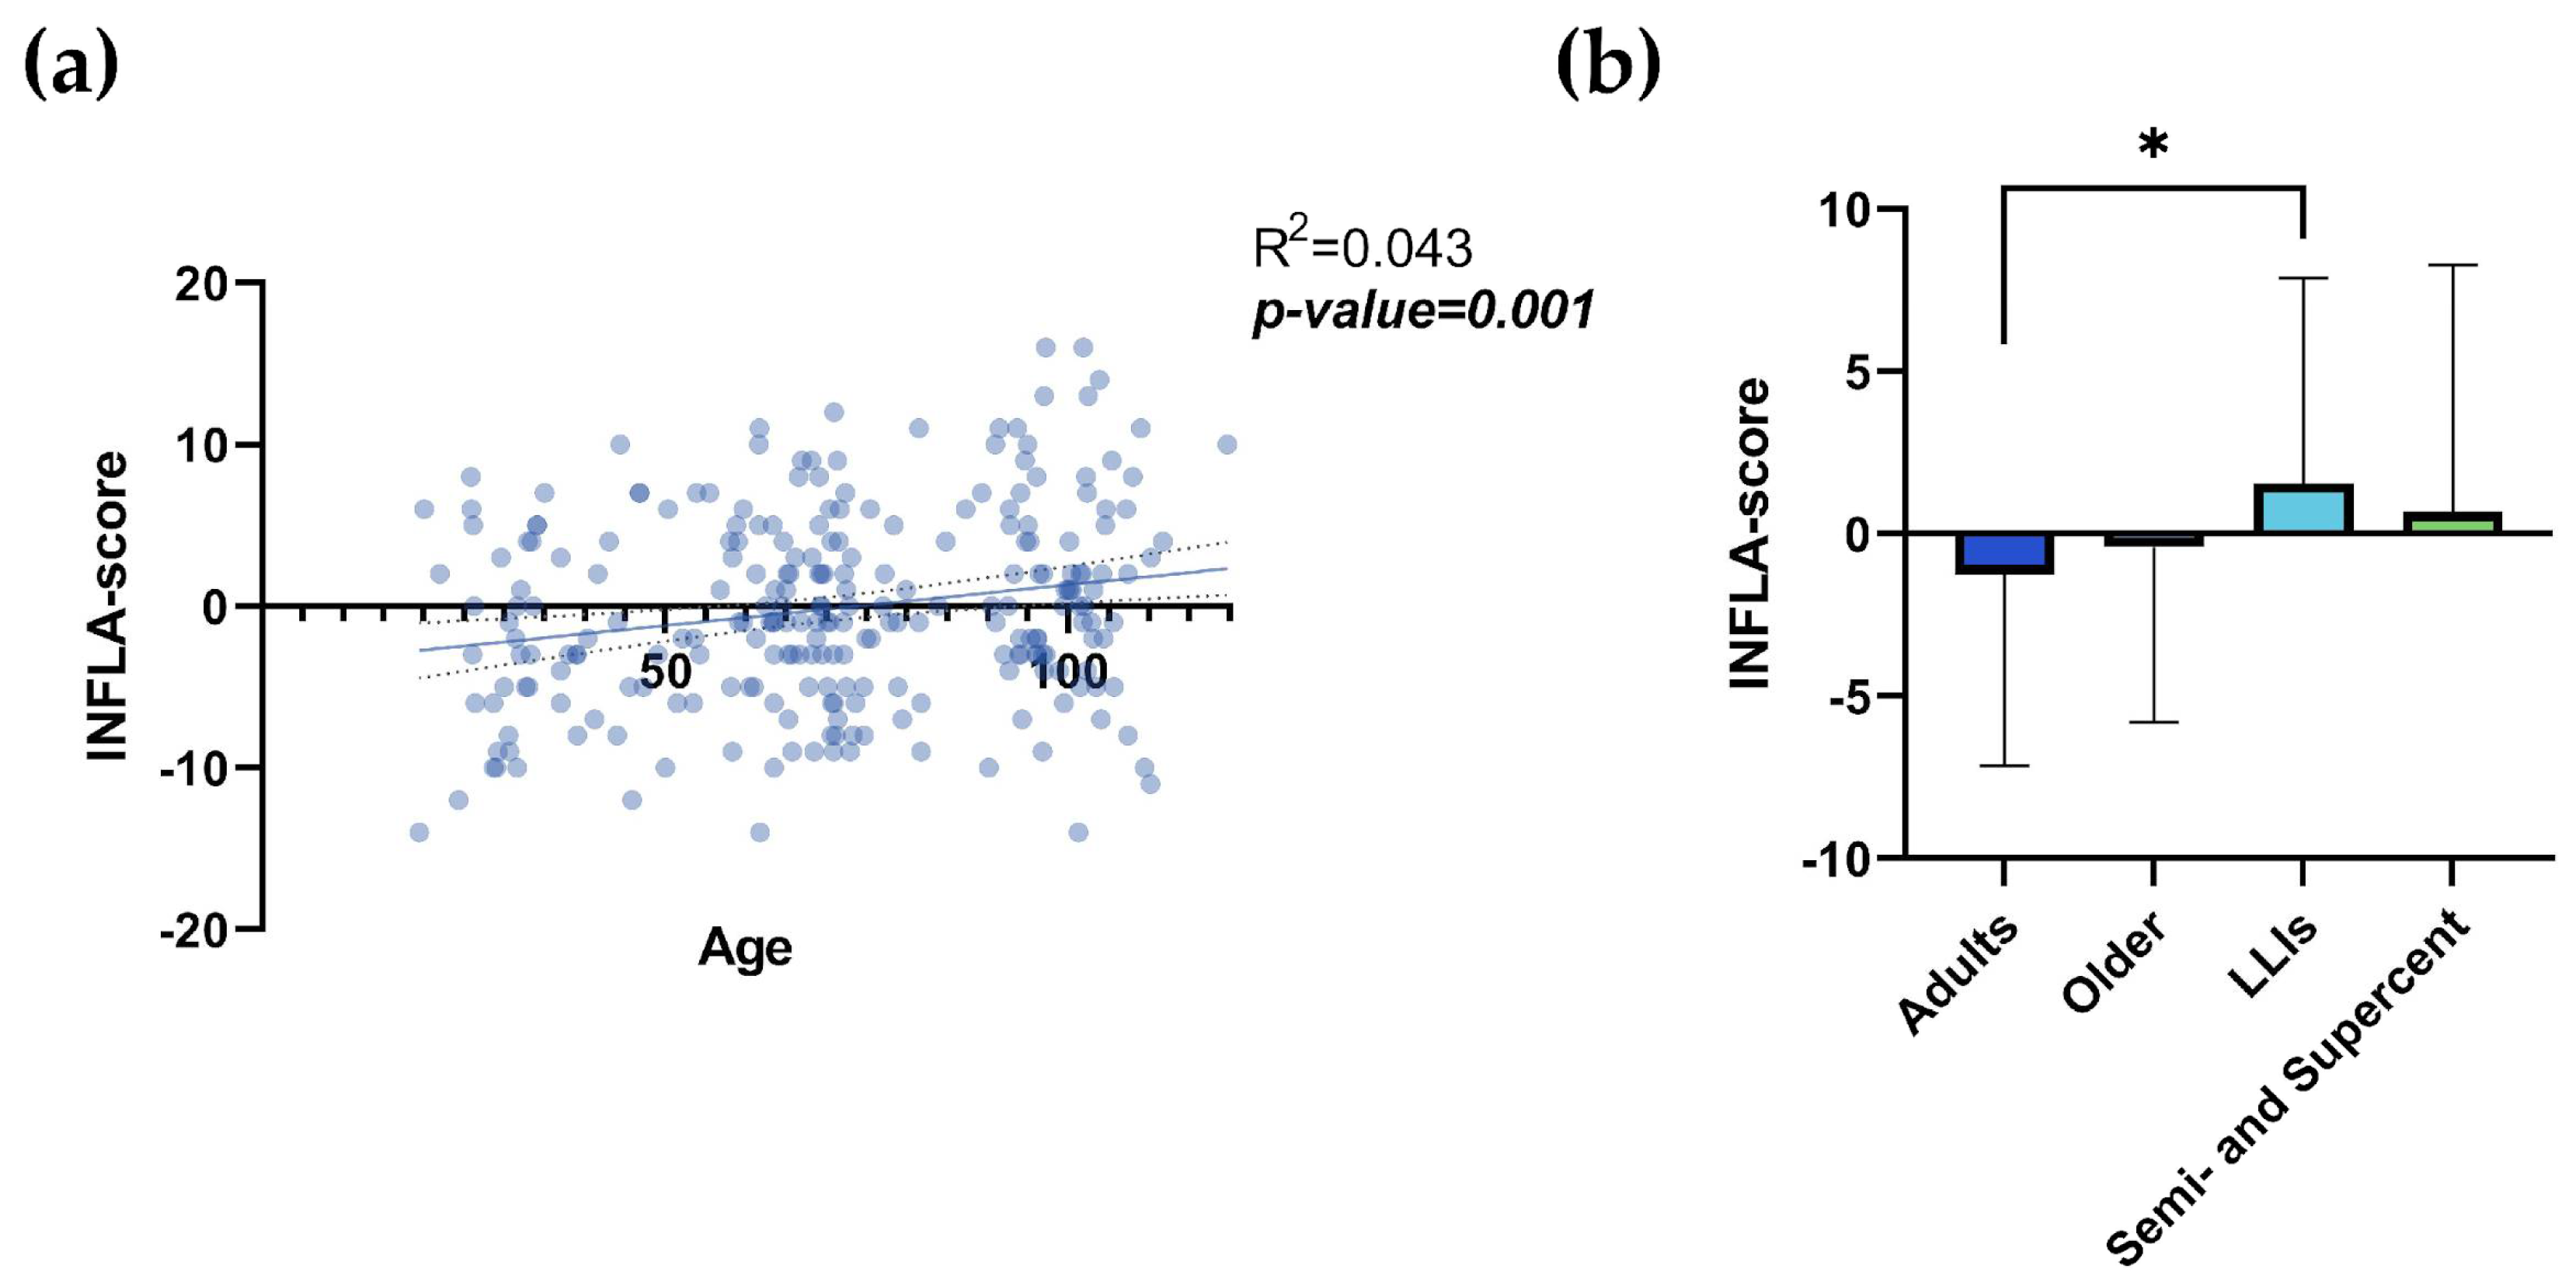
Figure 1. a,b. INFLA-score. Linear regression analysis shows the relationship between INFLA-score values and age (a) in N= 247 individuals. Each point represents data from a healthy donor. Column bar graphs show differences between the mean of the values of INFLA-score (b) from each aged group obtained by one-way ANOVA test. The coefficient of determination and p-values are shown on the graphs. *p-value ≤0.05; **p-value ≤0.01; ***p-value ≤0.001; ****p-value ≤0.0001; LLIs= Long-Lived Individuals; Semi- and Supercent= Semi- and Supercentenarians; R2= R squared; ns= not significant; p-value (bold and italic)= statistically significant. .
Preprints 108446 g001
Figure 2. a,b. SIRI. Linear regression analysis shows the relationship between SIRI values and age (a) in N= 249 individuals. Each point represents data from an individual healthy donor. Column bar graphs show differences between the mean of the values of SIRI (b) from each aged group obtained by one-way ANOVA test. The coefficient of determination and p-values are shown on the graphs. *p-value ≤0.05; **p-value ≤0.01; ***p-value ≤0.001; ****p-value ≤0.0001; SIRI= Systemic Inflammation Response Index; LLIs= Long-Lived Individuals; Semi- and Supercent= Semi- and Supercentenarians; R2= R squared; ns= not significant; p-value (bold and italic)= statistically significant. .
Preprints 108446 g002
Figure 3. a,b,c,d. TN/TM. Linear regression analysis shows the relationship between CD4+ TN/TM values (a), CD8+ TN/TM values (b) and age in N= 54 individuals. Each point represents data from an individual healthy donor. Column bar graphs show differences between the mean of the values of CD4+ TN/TM values (c), CD8+ TN/TM values (d) from each aged group obtained by one-way ANOVA test. The coefficient of determination and p-values are shown on the graphs. *p-value ≤0.05; ** p-value ≤0.01; ***p-value ≤0.001; ****p-value ≤0.0001; TN: T Naïve (CD45RA+CD27+); TM: TCM (CD45RA-CD27+) + TEM (CD45RA-CD27-) + TEMRA (CD45RA+CD27-); LLIs= Long-Lived Individuals; Semi- and Supercent= Semi- and Supercentenarians; R2= R squared; ns= not significant; p-value (bold and italic)= statistically significant. .
Preprints 108446 g003
Table 1. Immune-Inflammatory indexes and scores. Mean±SD of Immune-Inflammatory indexes and scores according to age groups.
Variable Adults
(N= 91)
Older
(N= 76)
LLIs
(N= 69)
Semi- and Supercentenarians
(N= 13)
Significant comparisons p-value
INFLA-score1 -1.253±5.891 -0.408±5.394 1.559±6.316 0.667±7.608 Adults vs LLIs 0.018
SIRI 0.963±0.5 1.107±0.6 1.583±1.28 1.519±1.073 Adults vs LLIs <0.0001
Older vs LLIs 0.005
Variable Adults
(N= 20)
Older
(N= 15)
LLIs
(N= 11)
Semi- and Supercentenarians
(N= 8)
Significant comparisons p-value
CD4+ TN/TM 0.512±0.393 0.443±0.415 0.429±0.809 0.252±0.2 None ns
CD8+ TN/TM 1.061±1.104 0.335±0.215 0.337±0.401 0.272±0.312 Adults vs Older 0.024
Adults vs LLIs 0.048
1The data from 2 individuals were missing, so 247 individuals, instead of 249, have been considered for the calculation. The range of INFLA-score values for the population considered was between -14 and +16, with median= -1. *SD: Standard Deviation; ns: not significant; SIRI: Systemic Inflammation Response Index; LLIs: Long-Lived Individuals; TN: T Naïve (CD45RA+CD27+); TM: TCM (CD45RA-CD27+) + TEM (CD45RA-CD27-) + TEMRA (CD45RA+CD27-). p-values obtained from the one-way ANOVA test are reported. p-values > 0.05 is not significant.
Disclaimer/Publisher’s Note: The statements, opinions and data contained in all publications are solely those of the individual author(s) and contributor(s) and not of MDPI and/or the editor(s). MDPI and/or the editor(s) disclaim responsibility for any injury to people or property resulting from any ideas, methods, instructions or products referred to in the content.
Copyright: This open access article is published under a Creative Commons CC BY 4.0 license, which permit the free download, distribution, and reuse, provided that the author and preprint are cited in any reuse.
Prerpints.org logo

Preprints.org is a free preprint server supported by MDPI in Basel, Switzerland.

Subscribe

© 2024 MDPI (Basel, Switzerland) unless otherwise stated