Preprint
Article

Analysis of Cooling Technologies in the Data Center Sector on the Basis of Patent Applications

Altmetrics

Downloads

109

Views

47

Comments

0

A peer-reviewed article of this preprint also exists.

Submitted:

04 June 2024

Posted:

07 June 2024

You are already at the latest version

Alerts
Abstract
The cooling of server components has been continuously developed over the past few years in order to meet the increasing cooling requirements of server component manufacturers such as for the processor chips. The growth in performance and power density increases the cooling demand. These requirements directly influence the energy consumption and performance of the hardware. To gain a better understanding of the historical evolution and possible future technology development paths in the field of data center cooling, a patent analysis method was used. The focus is on previous and current development priorities and possible research gaps within the server and computer room levels. The European patent database was selected as data source. To determine relevant patents, the search terms for various cooling technologies were developed iteratively. After the patent extraction for the period 2000 - 2023 (earliest priority year), the search results were classified and analysed. Most of the patents deal with air or liquid cooling. In the area of liquid cooling, the focus was on direct liquid cooling, followed by total liquid cooling. Since 2015 a technological shift from air to liquid cooling can be identified on the level of patent activities. In this context, the patent groups with focus on “constructional details for different types of electric apparatus” and “electrical digital data processing” have the largest share of patents. In addition, the technology focus of the TOP 10 patent applicants was in the field of liquid cooling. In conclusion from the patent analysis, it can be derived that liquid cooling will continue to gain in importance in the future and could also be combined with other approaches in the form of hybrid cooling. However air cooling may still be relevant, even if the main cooling load is handled by liquid-based approaches. At the same time, the optimisation potential for air cooling seems to have been largely exploited in comparison to liquid cooling, as can be seen from the falling number of the patent applications.
Keywords: 
Subject: Engineering  -   Mechanical Engineering

1. Introduction

Data centers form the infrastructural backbone for digitization. Without them, our increasingly interconnected world and the demand for communication services, storage and data processing would not be feasible [1]. Sufficient electrical power is required for their reliable and powerful operation. For 2021, the global data center electricity consumption was estimated at 220 to 320 TWh/a, or about 0.9 to 1.3 % of the world’s total electricity consumption [2,3,4,5]. Depending on the scenario for the upcoming development, the electrical demand may increase to up to 500 TWh/a by 2030 [6]. To evaluate how efficient a data center is in terms of energy use, the power usage effectiveness (PUE) factor has been established as key metrics [7]. The PUE describes the ratio of the total energy consumption of a data center to the consumption of the IT hardware [8]. From 2007 to 2022, the average PUE decreased globally from 2.50 to 1.55 — the ideal value is 1.0 [9]. This difference comes from the additional components required for reliable operation of the IT hardware, such as the power supply, cooling or lighting. Here, the energy demand of cooling can account for up to 50 % of the total additional energy demand [10,11]. To increase the energy efficiency of a data center, cooling technologies must be improved. This include for example the intensive use of free cooling and the switch from air- to liquid-based systems. In the first case, an external ambient medium (e. g. ambient air) is used as a heat sink without the need to operate an intermediate chiller. In the second case, liquid cooling can be used to increase the number of possible operating hours of free cooling by further increasing the waste heat temperature. This allows the energy-intensive operation of chillers to be increasingly avoided.
In addition to the increasing energy efficiency requirements, there is a trend towards more powerful hardware [12]. Especially, graphics processing units (GPU) and partially central processing units (CPU) with increasing thermal design power (TDP) create challenges in the development of suitable cooling solutions [12]. Its importance is amplified by the increasing demand for artificial intelligence (AI) applications. According to a study by GrandViewResearch, the annual growth rate in this area is expected to reach 37.3 % from 2023 to 2030 [13]. In addition, future next-gen server CPUs and GPUs are expected to consume up to 1000 W of power by 2025 [14]. Furthermore, the rising importance of waste heat utilisation and associated regulatory requirements are becoming increasingly important [15]. Addressing all of these challenges requires, in particular, an adaptation of cooling technology at the server component level.
Moreover to other studies Ebrahimi et al. [16] and Zhang et al. [17] have been reviewing and analysing data center cooling technologies. In order to identify the technical possibilities and their advantages and disadvantages, their energy implications and waste heat utilisation potential were also analysed. Zhang et al. used the keywords “data centre cooling” to find publications and patents between 2010 and 2019 for “data centers” and “telecommunication base station”. During this period, the number of publications rose from around 200 to 375, while patent applications remained relatively stable at around 400 patent applications per year. Huang [18] identified sections “Physics” (G) and “Mechanical Engineering” (F) in particular as key areas in his study of the cloud computing industry’s patent portfolio.
The aim is to identify possible research priorities and patent gaps as well as potential future market-available technologies that could address the current challenges, like increasing performance density and resulting cooling demand and waste heat quality and quantity. The focus of this paper is in the range between server and room cooling because it is much closer to the heat source - the servers - and changes at this point have a major impact on all subsequent cooling technologies. At the same time there is a reciprocal interdependence between the components and the system. Moreover, the patent offices, countries of origin and companies involved had been analysed. Through examining the level of patent activity by classification codes over a period of time, it is possible to gain insight into the the maturity of a technology along with patenting trends, indicating the decay and rise of technologies [19]. In order to achieve a better understanding of the past and current technology priorities in product development in the area of data center cooling, this is examined using the patent analysis method. In contrast to Zhang et al., a detailed technology-based analysis of patent applications over a period from 2000 to 2023 is to be carried out through a suitable and specific selection of keywords and a categorisation of the technologies.
Based on the technological development with increasing thermal design power of the CPU and GPU, it can be assumed that a change from air to liquid cooling can be observed in the area of patent applications over the years. Within this technology group, the share of direct liquid cooling should be greater than that of total liquid cooling. The background to this assumption is the longer history of direct liquid compared to total liquid cooling, which is partly based on the liquid cooling used for the mainframes. In addition, due to the great importance of the USA due to the large number of companies in the field of developers and manufacturers of server components and servers (INTEL, NVIDIA, AMD, DELL, HPE, etc.) as well as the home of the largest cloud providers (e. g. Google, AWS, etc.), the USA should have a special geographical role in patents in the field of data centre cooling.

2. Theoretical Background

2.1. Data Center Cooling Technology

Due to energy conservation, every kilowatt-hour of energy that enters a data center will mainly leave as heat. Electrical energy is required to operate the IT infrastructure, which is almost completely converted into thermal energy in the data center. All heat generated in the data center must then be removed using suitable cooling technologies to avoid the risk of the installed server hardware overheating. The cooling system consists of two subcomponents: 1) the cooling system in the data center room (room cooling) and 2) the cooling system outside the data center room (cooling infrastructure) [20]. Data center operators request high energy efficiency, low cost and high reliability [21].
In general, room cooling comprises of computer room air handlers (CRAH) or computer room air conditioners (CRAC) with a maximum cooling capacity of up to 12 kW per rack with cold aisles [22]. Here, the warm air is collected below the ceiling, cooled down via a heat exchanger and fed to the underground plenum and thus in front of the server racks via a fan [20]. From the CRAC or CRAH unit, heat is typically transferred to the cooling infrastructure via a liquid loop.
Room-level cooling can be further separated into rack-level and server-level cooling subsystems. In the case of rack-level cooling, higher energy efficiency can be achieved because the heat exchanger and also the liquid circuit are much closer to the IT equipment and the air pathways are shorter at the same time (indirect liquid cooling - ILC) [20,22]. This is enhanced by the higher specific heat capacity and the higher thermal conductivity of water compared to air [21]. In addition, heat can be transported more energy-efficiently by means of a water flow via pumps instead of an air flow via fans [20]. This cooling technology includes passive (maximum cooling capacity from 15 to 35 kW per rack) and active (maximum cooling capacity up to 55 kW per rack) rear door heat exchangers (RDHX) as well as in-row coolers (maximum cooling capacity up to 25 kW per rack or 50 kW per cooling unit) [22]. In contrast to passive RDHXs, active RDHXs have additional fans in the cooled rear wall to compensate for the pressure loss caused by the heat exchanger.
At the server level, air cooling is the most widespread and mature technology and is an elementary component of the technologies mentioned above. However, as soon as the power densities of the racks exceed the maximum cooling performance of traditional cooling technologies, another technology must be used - liquid cooling. These include direct liquid cooling (DLC) (e. g. cold plates) and total liquid cooling (TLC) (e. g. immersion cooling). In the first case, cold plates are installed on the most powerful and temperature-sensitive heat sources (e. g. CPU or GPU), through which a fluid flows that cools the hardware [20]. The liquid can be water or single- or two-phase coolant. The maximum transmittable heat flux is up to 170 W/cm2 for single-phase water-based cooling systems [23]. A rack-based cooling distribution unit has a cooling capacity between 80 and 200 kW per rack [24]. In contrast, air-based systems can dissipate up to 37 W/cm2 [25,26]. In the case of TLC, the servers immerse completely in a dielectric fluid in a customized cabinet [20]. Single and two-phase coolants can be used. Heat fluxes in excess of 275 W/cm2 can be achieved with two-phase immersion cooling [27]. With this technology, power densities of up to 250 kW per rack can be cooled [27,28].
The ratio of heat to liquid with cold plates is between 60 and 90 %, whereas with immersion cooling this value reaches almost 100 % [21]. For this reason, servers with cold plates have additional (air) cooling. In practice, combinations of these technologies can also be used — often called hybrid cooling (for example, direct and indirect liquid cooling [29]).
To prevent the processor temperature from reaching over 80 - 90 °C, the supply air temperature must be in the range of 20 - 30 °C for air cooling, while the supply water temperature can be in the range of 50 - 55 °C [21]. The typical design temperature rise across the rack is 15 K for air-cooled and 10 K for liquid-cooled systems [16]. In this regard, the American Society of Heating, Refrigerating and Air-Conditioning Engineers specifies inlet temperatures for air (5 … 45 °C) and liquid cooling (17 … > 45 °C) in its thermal guidelines depending on the application and additionally provides a recommendation for air cooling (18 … 27 °C) [30]. Systems with liquid cooling can be designed to supply a more precise and selective cooling, reducing hotspots and ensuring uniform temperature distribution throughout the server and racks [31]. This enables both the reliability of the IT infrastructure and the performance of the servers to be improved by operating them at optimum temperature conditions [31]. In contrast, air cooling can rather result in an inhomogeneous temperature distribution, for example due to internal rack recirculation or short-circuit flows between the cold and hot aisles, which facilitates hotspot occurrence [32]. For this reason, the temperature requirements for air cooling are also more restrictive than for liquid cooling. The higher water supply temperature and moderat temperatur rise enables higher outlet temperatures to be achieved with direct liquid cooling technologies. As a result, the energy-intensive use of chillers can be reduced and free cooling can be used more intensively. At the same time, waste heat utilisation options are increasing with higher heat quality.

2.2. Patents and Patent Analysis

The World Intellectual Property Organization (WIPO) defines a patent as “an exclusive right granted for an invention, which is a product or a process that provides, in general, a new way of doing something, or offers a new technical solution to a problem” [33]. Patents are granted from the patent office in which the patent is filed only for inventions that are new and non-obvious, consist of inventive steps, and have commercial application utility [34,35,36]. They are technical-legal documents in which the patent authors use a number of different words and phrases to explain the invention with the intention of maximizing the scope of the invention [34].
The worldwide most common classification systems are International Patent Classification (IPC), European Classification (ECLA) and United States Patents Classification (USPC) [19]. IPC classifies the patents into sections (A to H) with their section titles according to their technical fields [34,37]. For example, class F includes Mechanical Engineering; Lightning; Heating; Weapons; Blasting [37]. The sections belong to the highest level of the hierarchy of classification (first level). Each section consists of several classes (second level). The classes then divide into the subclasses (third level). The subclasses consists of groups which can be classified in main groups (fourth level) or in subgroups (lower level) [37].
A patent is structurally based on the following elements: Title page, description, figure description, list of reference signs, patent claims and figures. The title page contains standard metadata like the IPC classification, applicant, inventor, title, description and the application as well as the disclosure date. The disclosure date is the date on which a patent application was published in the patent database. Disclosure must take place no later than 18 months after the patent application. A patent application can be submitted in three ways: national, regional and international. The regional application can be registered, for example, via the European Patent Office (EPO) for selected member countries. Internationally, the patent application can be filed in the course of the PCT procedure at WIPO for all contracting states. These include all major industrialised nations such as the USA, Japan and Germany. [38]
Patents can be accessed via commercial and non-commercial patent databases. The database of commercial patent databases does not contain more patent entries than that of non-commercial patent databases [38]. In many cases, the commercial patent databases even follow behind the free patent databases of the patent offices [38]. In contrast, the commercial solutions offer a wider range of services such as edited description texts, more complex search options or extended visualisation tools [38]. The most relevant free databases are Espacenet (EPO) with more than 140 million patent documents from over 90 countries and PatentScope (WIPO) with more than 110 million patent documents from over 150 countries [34,39,40,41,42].
Both databases offer search functions for patent searches. Reasons for conducting a patent search may be: State-of-the-Art Patent, Freedom to Operate and Patent Portfolio Analysis, Commercial Intelligence/Competitior Analysis, Patentability, Validity and Infringement search [19,34,43,44,45,46]. The first variant can be used to give a comprehensive overview of a technical topic and is used for this paper [19,38].

3. Materials and Methods

Starting from a patent database, the procedure for a patent analysis consists of three steps. The first step is the pre-processing to retrieve the patents and convert them into structured data [45]. Afterwards, in the second step (processing), the contained structures are extracted [45]. Finally, the post-processing takes place with the analysis of the patents [45]. Chapter Section 3.3 discusses the parameters analysed in this study and the associated procedure. A distinction can be made between approaches with text mining or visualisation [45]. Using the tabular overview of the relevant patents that have been identified, the competitors, technology experts and technology fields can be extracted [19].

3.1. Patent Pre-Processing

In order to be able to retrieve and save the patents in the field of data center cooling, the following steps are carried out for this paper. First of all, the patent database used must be chosen. A modifiable filter function should be available, e.g. to filter by registration year or patent classes. It should additionally be possible to export the search results and analyse them with another tool. In addition, user-friendliness and, if needed, an application programming interface (API) for automated data capturing should be available. Moreover, the patent database must have a coverage of patents from the relevant nations worldwide. The European patent database Espacenet fulfils these requirements and was therefore selected for the following patent analysis.
A crucial step is to define the search terms. They are developed iteratively and are based on the initial selection of search terms forn the types of cooling technologies used in data centers. Then additional keywords extracted during the patent search are added and the search being repeated. The final list of keywords used for the analysis are listed in Table 1.
For the search, the selected and iteratively determined search terms must be combined with each other in a meaningful way and entered into the search mask. The search is further optimised by using suitable operators. These include boolean and proximity operators as well as wildcards, parentheses, nesting and phrases [34]. Both boolean operators and wildcards are used here. Wildcards (“?” or “*”) can be used to find similar terms, which can be used especially for the term “data center” (AE: data “center”, BE: data “centre”). This allows both spellings to be taken into account. The boolean operators are logical operators and are used to link more than two search terms. Espacenet offers “AND”, “OR” and “NOT”, whereby a logical multilevel combination between fields is also possible. All components of the possible search term variations must appear in one of the text fields “title” (ti), “abstract” (ab) or “description” (desc), whereby the term “data cent*” must appear in one of the text fields in each case [47]. Although the search logic for cooling fluids is included in the overview in Table 1, cooling fluids will not be analysed in the following due to the overlap with the other search terms and the focus on the cooling technologies and not the coolants used. In this way, the patent results can be limited to the patents that are likely to be more relevant for the cooling of data centers.
In addition to the search terms, the search output is reduced by selecting suitable filter criteria. This includes patent classes, countries (family), CPC1 assigning offices as well as the earliest publication date2 and priority date3. However, the priority date is not necessarily the same as the filing date and may be earlier [49,50]. The priority date is therefore used to obtain the earliest possible date of publication of a patent. The priority date period studied is from 2000 to 2023. In this way, the general long-term development on the one hand and the technology focus of the recent past on the other can be analysed. However, the number of patent applications to be determined in 2023 and, to a limited extent, until June 2022 are of limited completness, as the 18-month deadline for patent applications in these years is not met. For this reason, the results for the year 2023 are classified as preliminary.
The search is not restricted to specific IPC sections, countries or applicants in order to enable an open search approach. Filtering by country of origin is not intended, as these can be determined from the applicant and the publication number. In contrast, the results are filtered according to the assigning offices in order to be able to differentiate between the patent offices.

3.2. Patent Processing

The data of patents determined by pre-processing are edited further in the course of patent processing. The existing structured data is extracted and saved as a list by using the existing export function. The following data fields can be exported: title, inventors, applicants publication number, earliest priority, IPC, CPC, publication date, earliest publication and family number. The additional information must in turn be extracted from these data elements. This includes, for example, the country allocations for the applicants. In addition, the search terms and the patents are linked. All further analyses are based on this data. The data can then be further processed and analysed in the patent post-processing. In addition, the patent office classification is completed on the basis of the exported filter results.

3.3. Patent Post-Processing

a) Categorisation of patents
Patents contain a large amount of structured and unstructured information, for which in most cases the methods of text mining and visualization are used for processing [45]. Text mining is used for information exctraction from structured and unstructured text whereas visualization is required to visualise the patent information for analysing the results. Text mining is especially suitable for processing information from large amounts of data. However, the number of potentially relevant patents can be reduced by carefully selecting the search terms, especially if the subject area is more specialised. Due to the manageable number of patents, the patents are extraced and categorised manually and are then visualised in a suitable form.
Before an identified and extracted patent can be analysed in further detail, it must meet a number of criteria. It is possible that an extracted patent from the search results has no relationship with (server / rack / room) cooling in data centers. A patent must fulfil all of the following criteria to be considered relevant for this study:
  • Direct reference to cooling of data centers
    A patent must have a direct connection to data centers and their cooling system. Accordingly, the patent must cover technologies, systems or processes that have been developed for this purpose.
  • Heat extraction close to the heat source
    To ensure the distinction from the cooling infrastructure outside the computer room, a patent must deal with cooling systems whose cooling medium, heat exchangers if necessary and other required components are located inside the computer room. To achieve this, the solution should achieve heat removal as close as possible to the heat source on server, rack or at least room level.
  • Increasing innovation and efficiency in data center cooling technology
    In addition, the patents should contain new and innovative concepts that promise to address the problems of heat dissipation and the introduction of technological innovations. This also includes improvements in the efficiency of cooling systems.
The qualitative assignment is based on the title, abstract and if necessary the description or claims. In addition, patent applications can occur several times within one search term or in multiple search queries. In these cases, the oldest registered patent (priority year) for the most suitable search term is used for the further analysis. Depending on this classification, patents are classified as irrelevant if they are duplicates or do not fulfil the criterias.
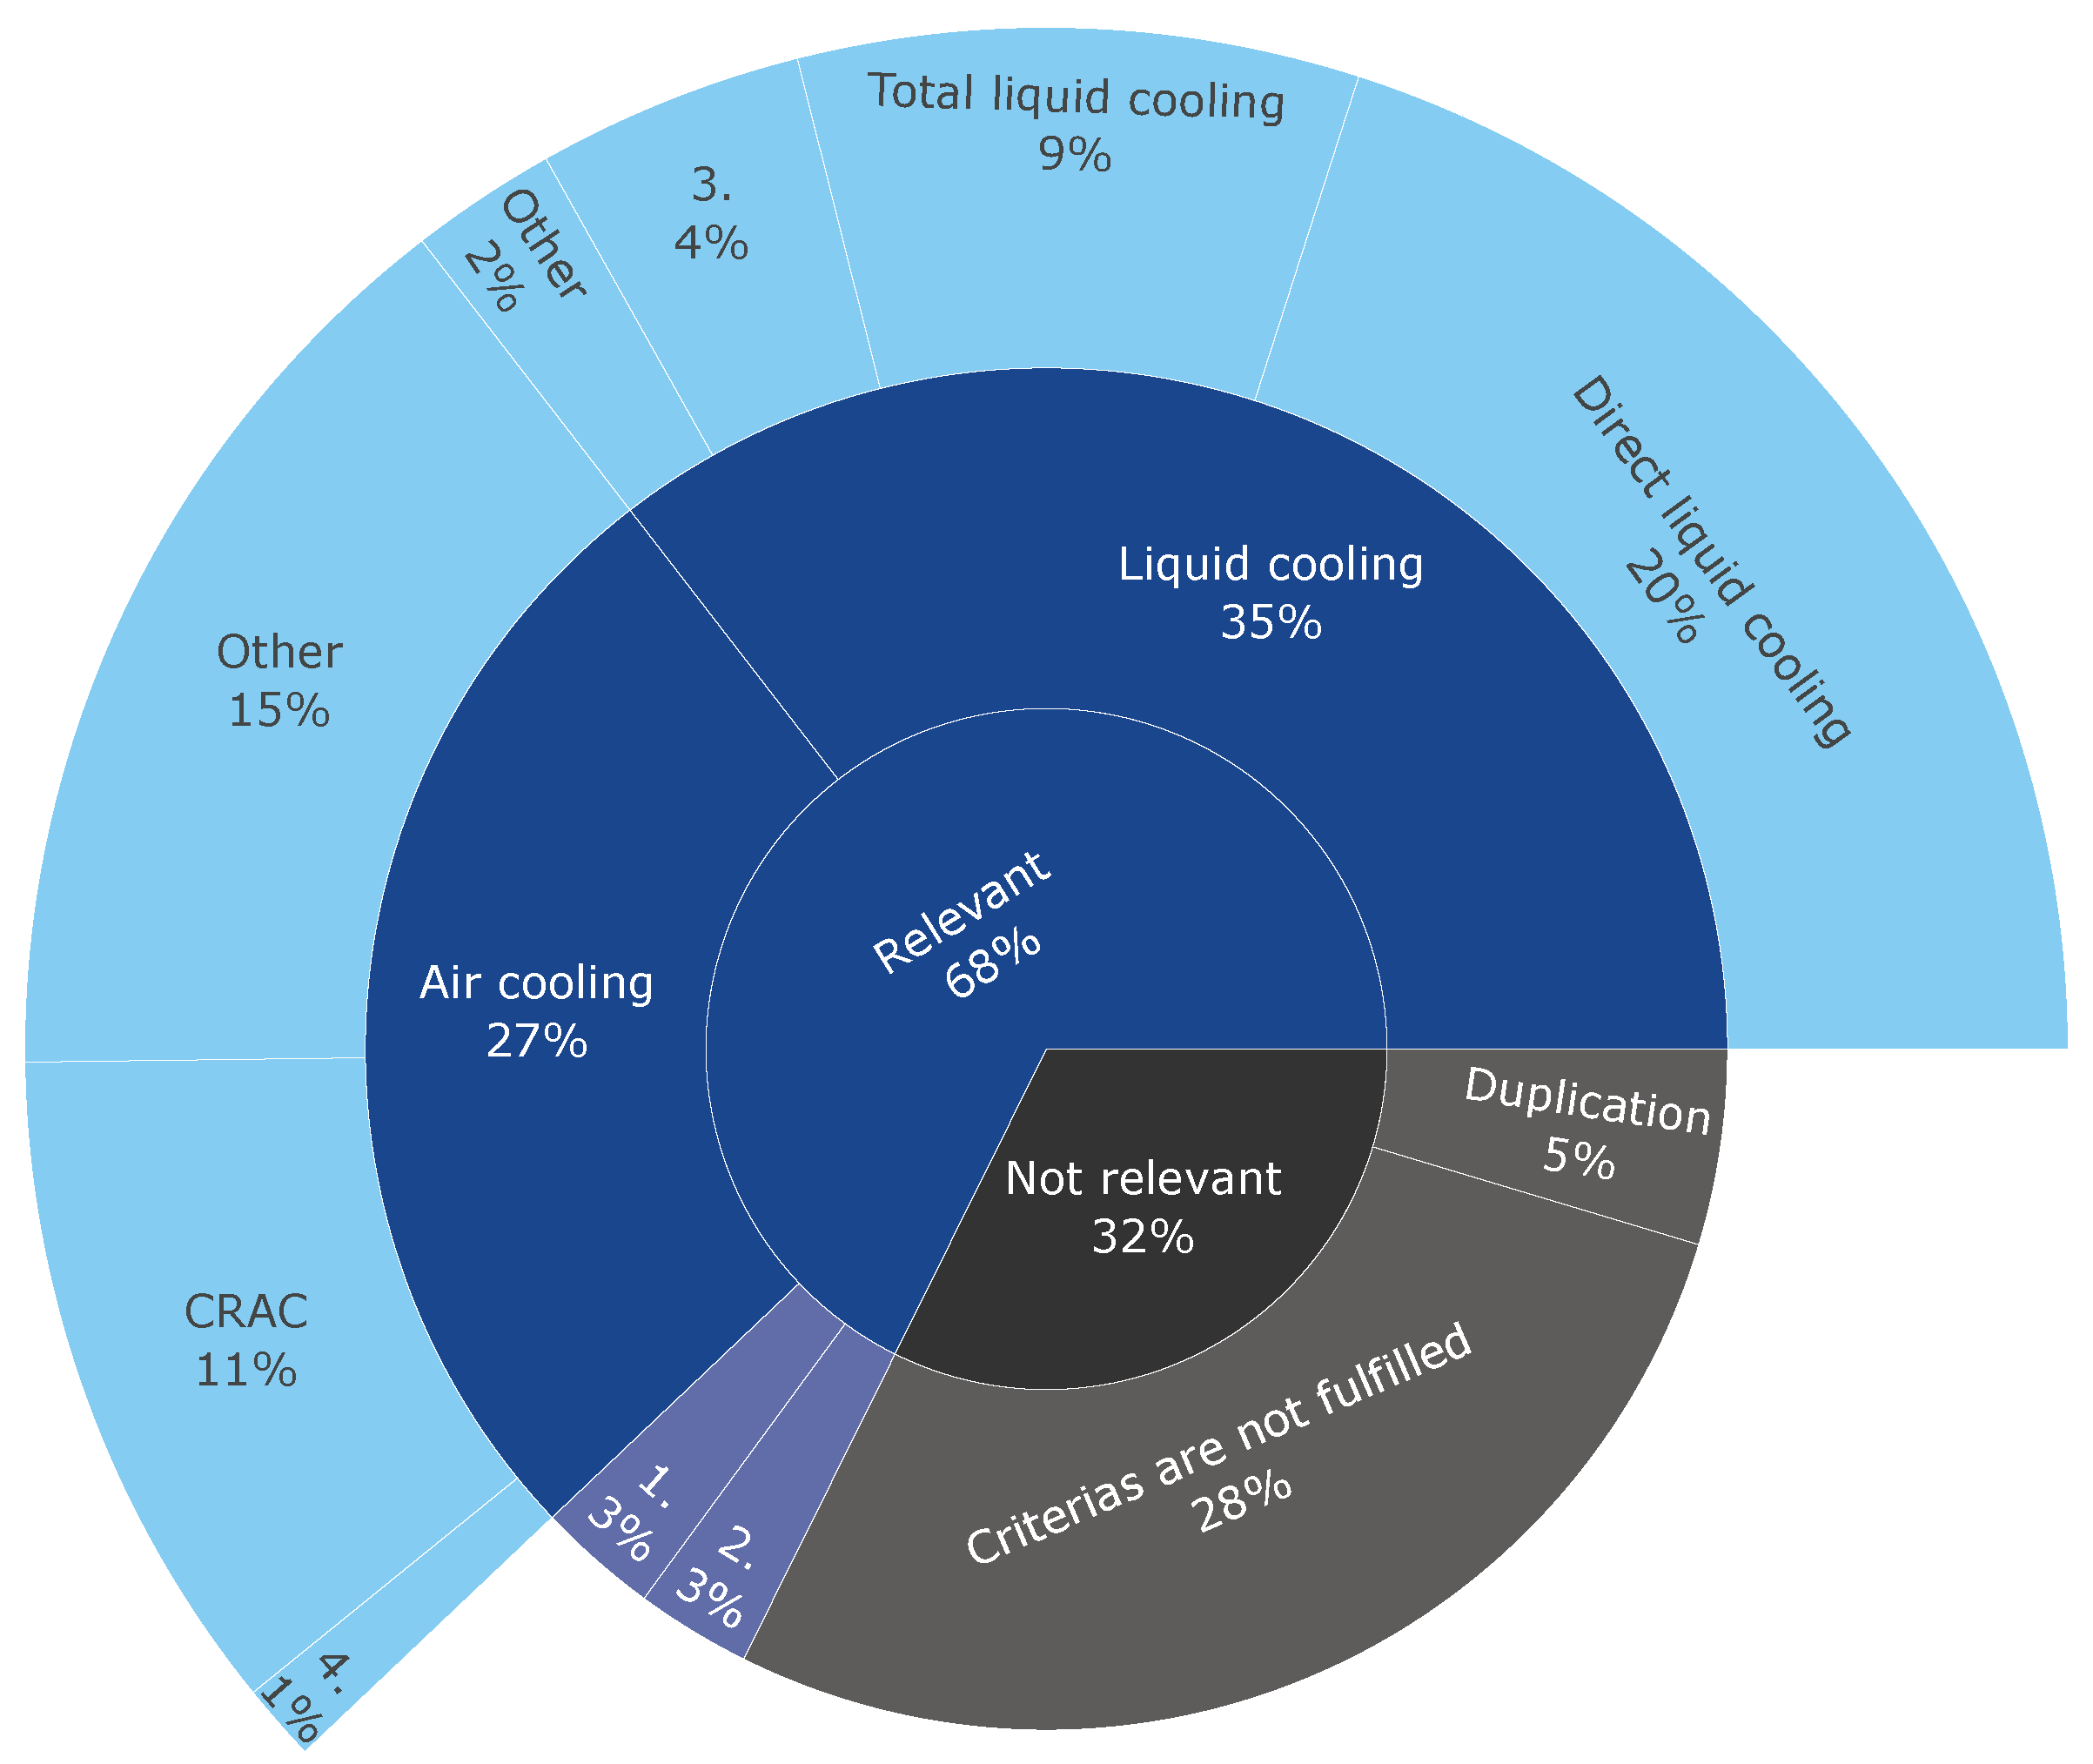
In addition, the patents categorised as relevant are assigned to one of these four cooling technologies: Air Cooling (AC), Liquid Cooling (ILC, DLC and TLC), Hybrid Cooling (HC) and Other. Hybrid cooling describes combination of air and liquid cooling or various liquid cooling systems, whereas other describes all technologies that cannot be further grouped. Further specifications are possible in up to two steps. The classification is determined qualitatively on the basis of the extracted text fields. An illustration can be found in Figure 1.
The year is extracted on the basis of the priority dates and also assigned to a three and five year period (e. g. 2015 - 2017, 2018 - 2020, 2021 - 2023; Total period: 2000 - 2023). The country of origin of the patent is determined either on the basis of the country code in the patent number or the patent applicant (e. g. CN is China). If a patent has more than one IPC class or applicant, these are extracted and checked for duplication.
b) Analysing the patents
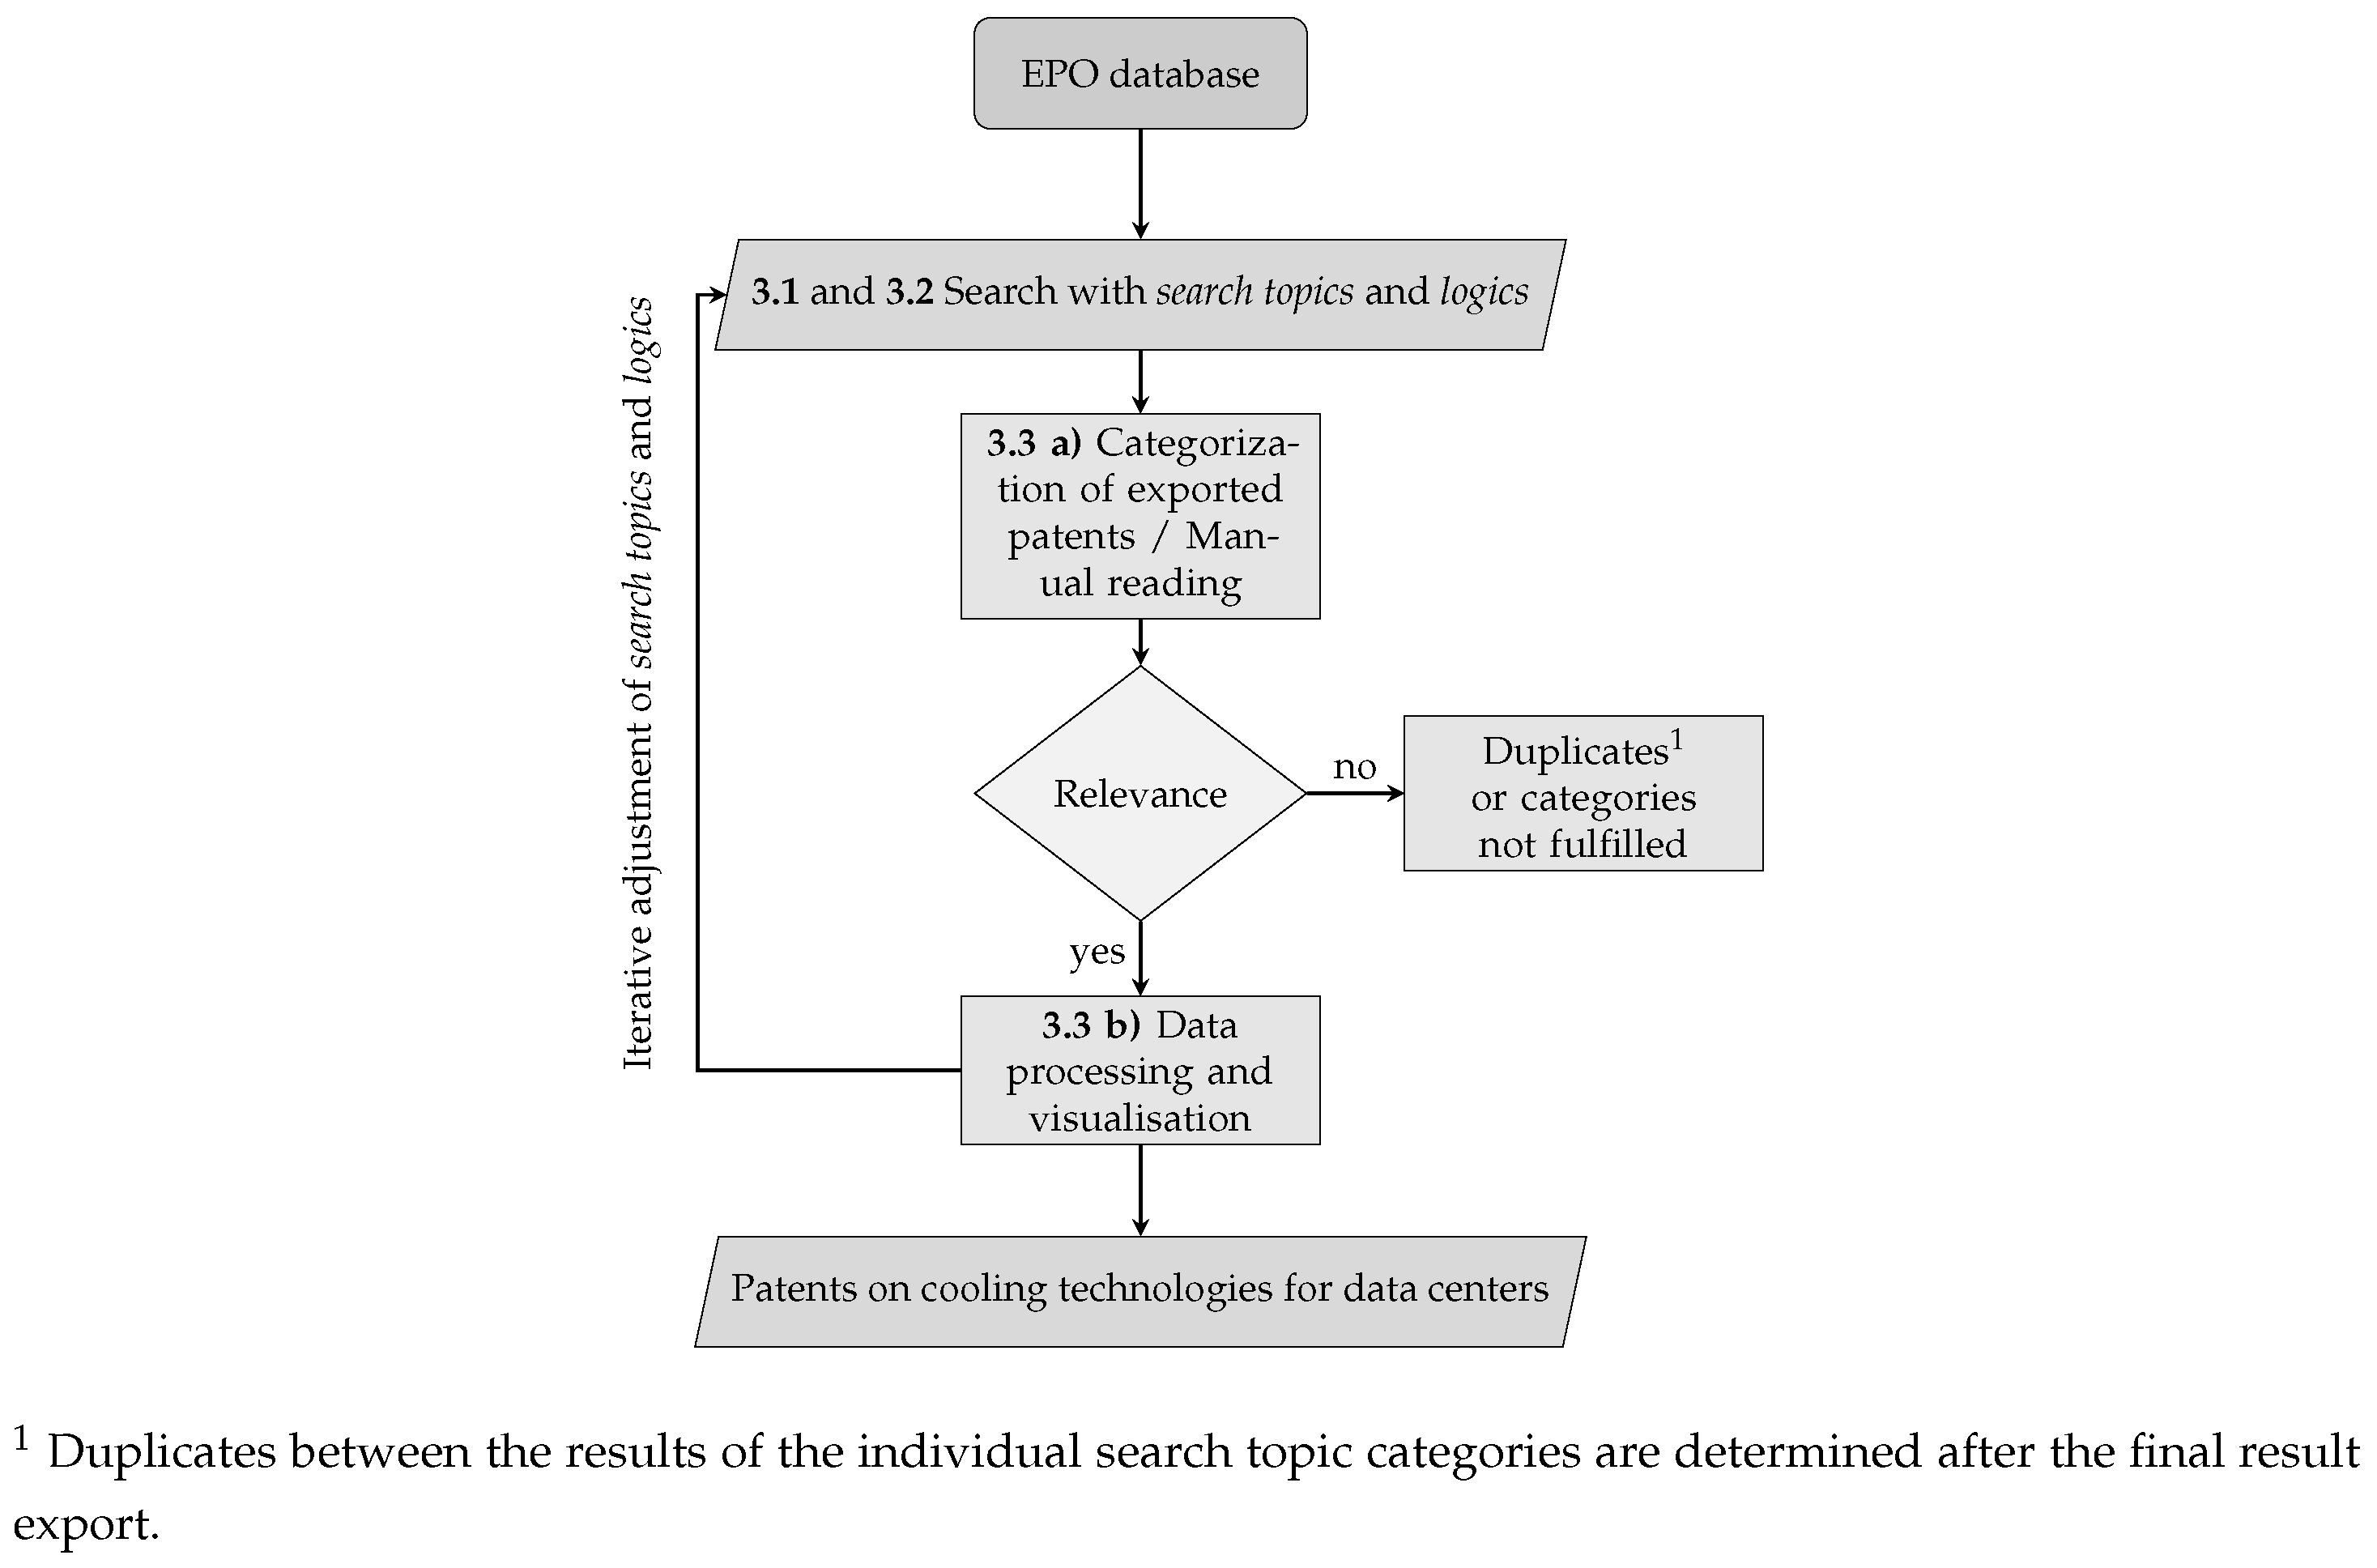
The first step in the qualitative analysis after the patent search is to categorise the patents in terms of their relevance on the basis of the predefined requirements (see Figure 2). This is done first within a search term and then in a summarised form.
The distribution of patents is then analysed according to their assigned category. On the one hand, this shows the proportion of relevant patents and, on the other, the distribution by technology. Based on Figure 1, a categorisation is made up to the fourth level. This is where the technology in the patent application can be further specified. On this basis, the patents categorised as relevant will be listed according to the frequency of patent applications by section and main group. This enables a determination of the mainly used sections as well as main groups and also alternative sections.
The regional distribution of patent application is then analysed. This takes place at the level of both the patent offices and the countries of origin on the basis of the applicants. In addition, the cooling technology classification is used as a further differentiating feature. In this way, the particularly relevant countries in the area of patent applications for data center cooling technologies and the distribution of the technological specialisations are to be determined.
A detailed analysis at the level of the main groups and subgroups is then carried out, taking the technologies into account. The Pareto analysis is used to determine the groups that occur most frequently in absolute terms. In addition, the cumulative share of the most frequent groups in the total number of patents is calculated. This allows the relevant groups to be identified and their importance to be determined. With regard to the subgroups, the share of the respective subgroup in the main group is also determined. Thus, the significance of the subgroup within the main group will be determined. It is limited to the 10 most frequently listed groups.
Analogue to the analysis of the country distribution, the most active organisations are specified from the perspective of patent applications. A differentiation is made according to the cooling technology. The aim is to identify not only the active organisations but also their technological centers of gravity. To classify the importance of cooling technologies in relation to the overall activities of an organisation, the number of relevant patents is compared with the total number of patent applications. With the resulting ratio the degree of specialisation can be evaluated.
In addition to the aggregated analysis of all patents, the annual patent application activities over the period under review are also investigated. In addition, a differentiation is made according to technology. This makes it possible to show the characteristics of patent applications in the field of cooling technology and the shares by technology over time.
Based on this, a technology focus analysis is carried out. For that purpose, the distribution of patent applications for the various cooling technologies will be aggregated for three periods of equal length. A change in the distribution may indicate a change in the future technology focus.

4. Analysis and Discussion of the Data

Table 2 lists the “simple search results” for the search terms from Table 1. As Espacenet is a family-based tool, not all retrieved patents are shown. Instead, only one of the family members selected by the system to represent the entire family is returned. Since a patent family is a collection of several patent applications covering the same or a similar technical field, it is sufficient to consider only one representative patent from this family [51]. Depending on the search terms, “all publication matchings” are listed in the second column. To classify the simple search results, the number of complete publication hits and their ratios have been identified. Depending on the search term, the simple family matches cover 44 to 82 % of all matches; the average is 60 %. To classify the patent applications, the last three entries include the number of patents for general search terms in the context of data centers and cooling. Within the data center, cooling technologies at the server, rack and room cooling levels covers less than 1 % of the patents in the period 2000 to 2023. Within cooling, the results of detailed search queries account for 34 %. Most patents were identified with the search terms “CRAC / CRAH” and “server cooling”, followed by “immersion” and “direct chip water cooling”. “GPU cooling” and “RDHX” had the fewest search results.
Table 3 expands the results from Table 2 with the number of patents classified as relevant and the difference resulting from the subsequent determination of duplicates between or within the search terms. In addition, the ratio of simple family matches to those classified as relevant was determined. Almost every search term is affected by overlapping duplicates. Consequently, 68 % of the results of the matches are considered relevant.
The small number of patent applications in the field of data center cooling indicates that no major application activities are being carried out in this area. The comparison between the general search term for data center cooling and the specific search terms shows that the levels of cooling investigated in this study only account for 34 %. The remaining patents presumably deal primarily with cooling in the cooling infrastructure. In addition, the search results for coolants show a wide range of applications. This ranges from server cooling to the fluid circuits of recoolers. For this reason, no detailed analysis was carried out.
The search terms that were more generic and had more common industry names tended to have more search hits. This can be seen in particular when looking at “CRAC / CRAH”, “RDHX” and “Rack Cooling”. While RDHX refers to a special technology that has only been in use for two decades, the term rack cooling is more general and also includes technologies that are similar to RDHX. The partial overlapping of general and specific search terms leads to a higher proportion of duplications between the search terms. Another search term for which this applies is "Server Cooling". In contrast, the search query for air cooling using "CRAC / CRAH" is both sufficiently precise and familiar in terms of the name of the technology.
The distribution of relevant and irrelevant patents is illustrated in Figure 3 with the addition of the classification according to Figure 1. The further classificatio in Figure 3 is also contained in Table A1 in the appendix. Within the “Not relevant” category, the required criteria in particular were not met. In the “Relevant" section, air (27 %) and liquid (35 %) cooling are the most typical mentioned technologies. Both hybrid cooling and others account only for 3 % of the total number of applications. In liquid cooling, direct cooling (20 %) is used before (9 %) and indirect cooling (4 %). Within these sub-categories, cold plates (17 %), immersion (8 %) respectively RDHX (2 %) are the most common technologies addressed in the patent applications. If a specification of the coolant was available, a fraction of two-phase coolants of 2 % could be determined for both the cooling plates and the immersion cooling. In the domain of air cooling, there is a distribution into CRAC (11 %), CRAH (5 %) and “Other” (15 %).
The further classification in Figure 3 revealed a relatively high proportion of patents (28 %) that did not fulfil the criteria required in Section 3.3. The non-fulfilment of the developed requirements for relevant patents is mainly due to the fact that the search syntax does not have any strict specifications regarding the order of search terms. Their share could have been reduced by using proximity operators. The proportion of duplicates, on the other hand, is relatively low, which indicates a low overall overlap of patents.
Within the relevant patents, air and liquid cooling are the most widespread technologies. Although there are also combinations of different technology approaches and other technologies, these do not account for a high proportion. Other technologies include, in particular, all approaches that utilise thermoelectric effects in any form (especially Seebeck and Peltier effect). Technologies based on thermoelectric effects have not yet been used to any substantial extent in the data center sector, which is why their patent numbers are low and have not progressed as far as the classic solutions. Hybrid cooling, on the other hand, is a relatively new approach. Their development has mainly taken place in the last decade (82 %; see Figure 5). Due to the increasing demands on cooling and the simultaneous advances in the various cooling solutions, a combination of these for targeted and customized heat dissipation was expedient. The combination of cold plates and immersion cooling is a particularly common approach. On the one hand, all waste heat is absorbed into a liquid and, on the other hand, the powerful and less temperature-sensitive components can be cooled in a controlled manner even at higher coolant inlet temperatures. Although other cooling technologies such as direct or indirect liquid cooling could also be regarded as hybrid cooling, the classification is still based on the patent title and the focus of the patent description.
Air cooling is primarily made up of CRAC systems and other approaches that cannot be classified further. Although CRAH systems can also be found, they only make up a minor fraction. In today’s data centers with an IT power of more than several hundred kilowatts, however, CRAH systems are increasingly the preferred choice [52]. A global market survey by VM Reports on the market shares of CRAC and CRAH across various applications revealed a slightly larger share for CRAH compared to CRAC [53].
Within liquid cooling, the focus is on cold plates (DLC) and immersion cooling (TLC). In most cases, these are not specified further. As the coolant is only explicitly emphasised in a few cases - in the case of two-phase cooling - it can be assumed that single-phase coolants are more likely to be preferred due to their easier and safer handling. The widespread use of DLC can in turn be attributed to the fact that the necessary structural changes to an air-cooled standard server are less than those required for TLC. In addition, the requirements for the coolant are not as high as for the TLC.
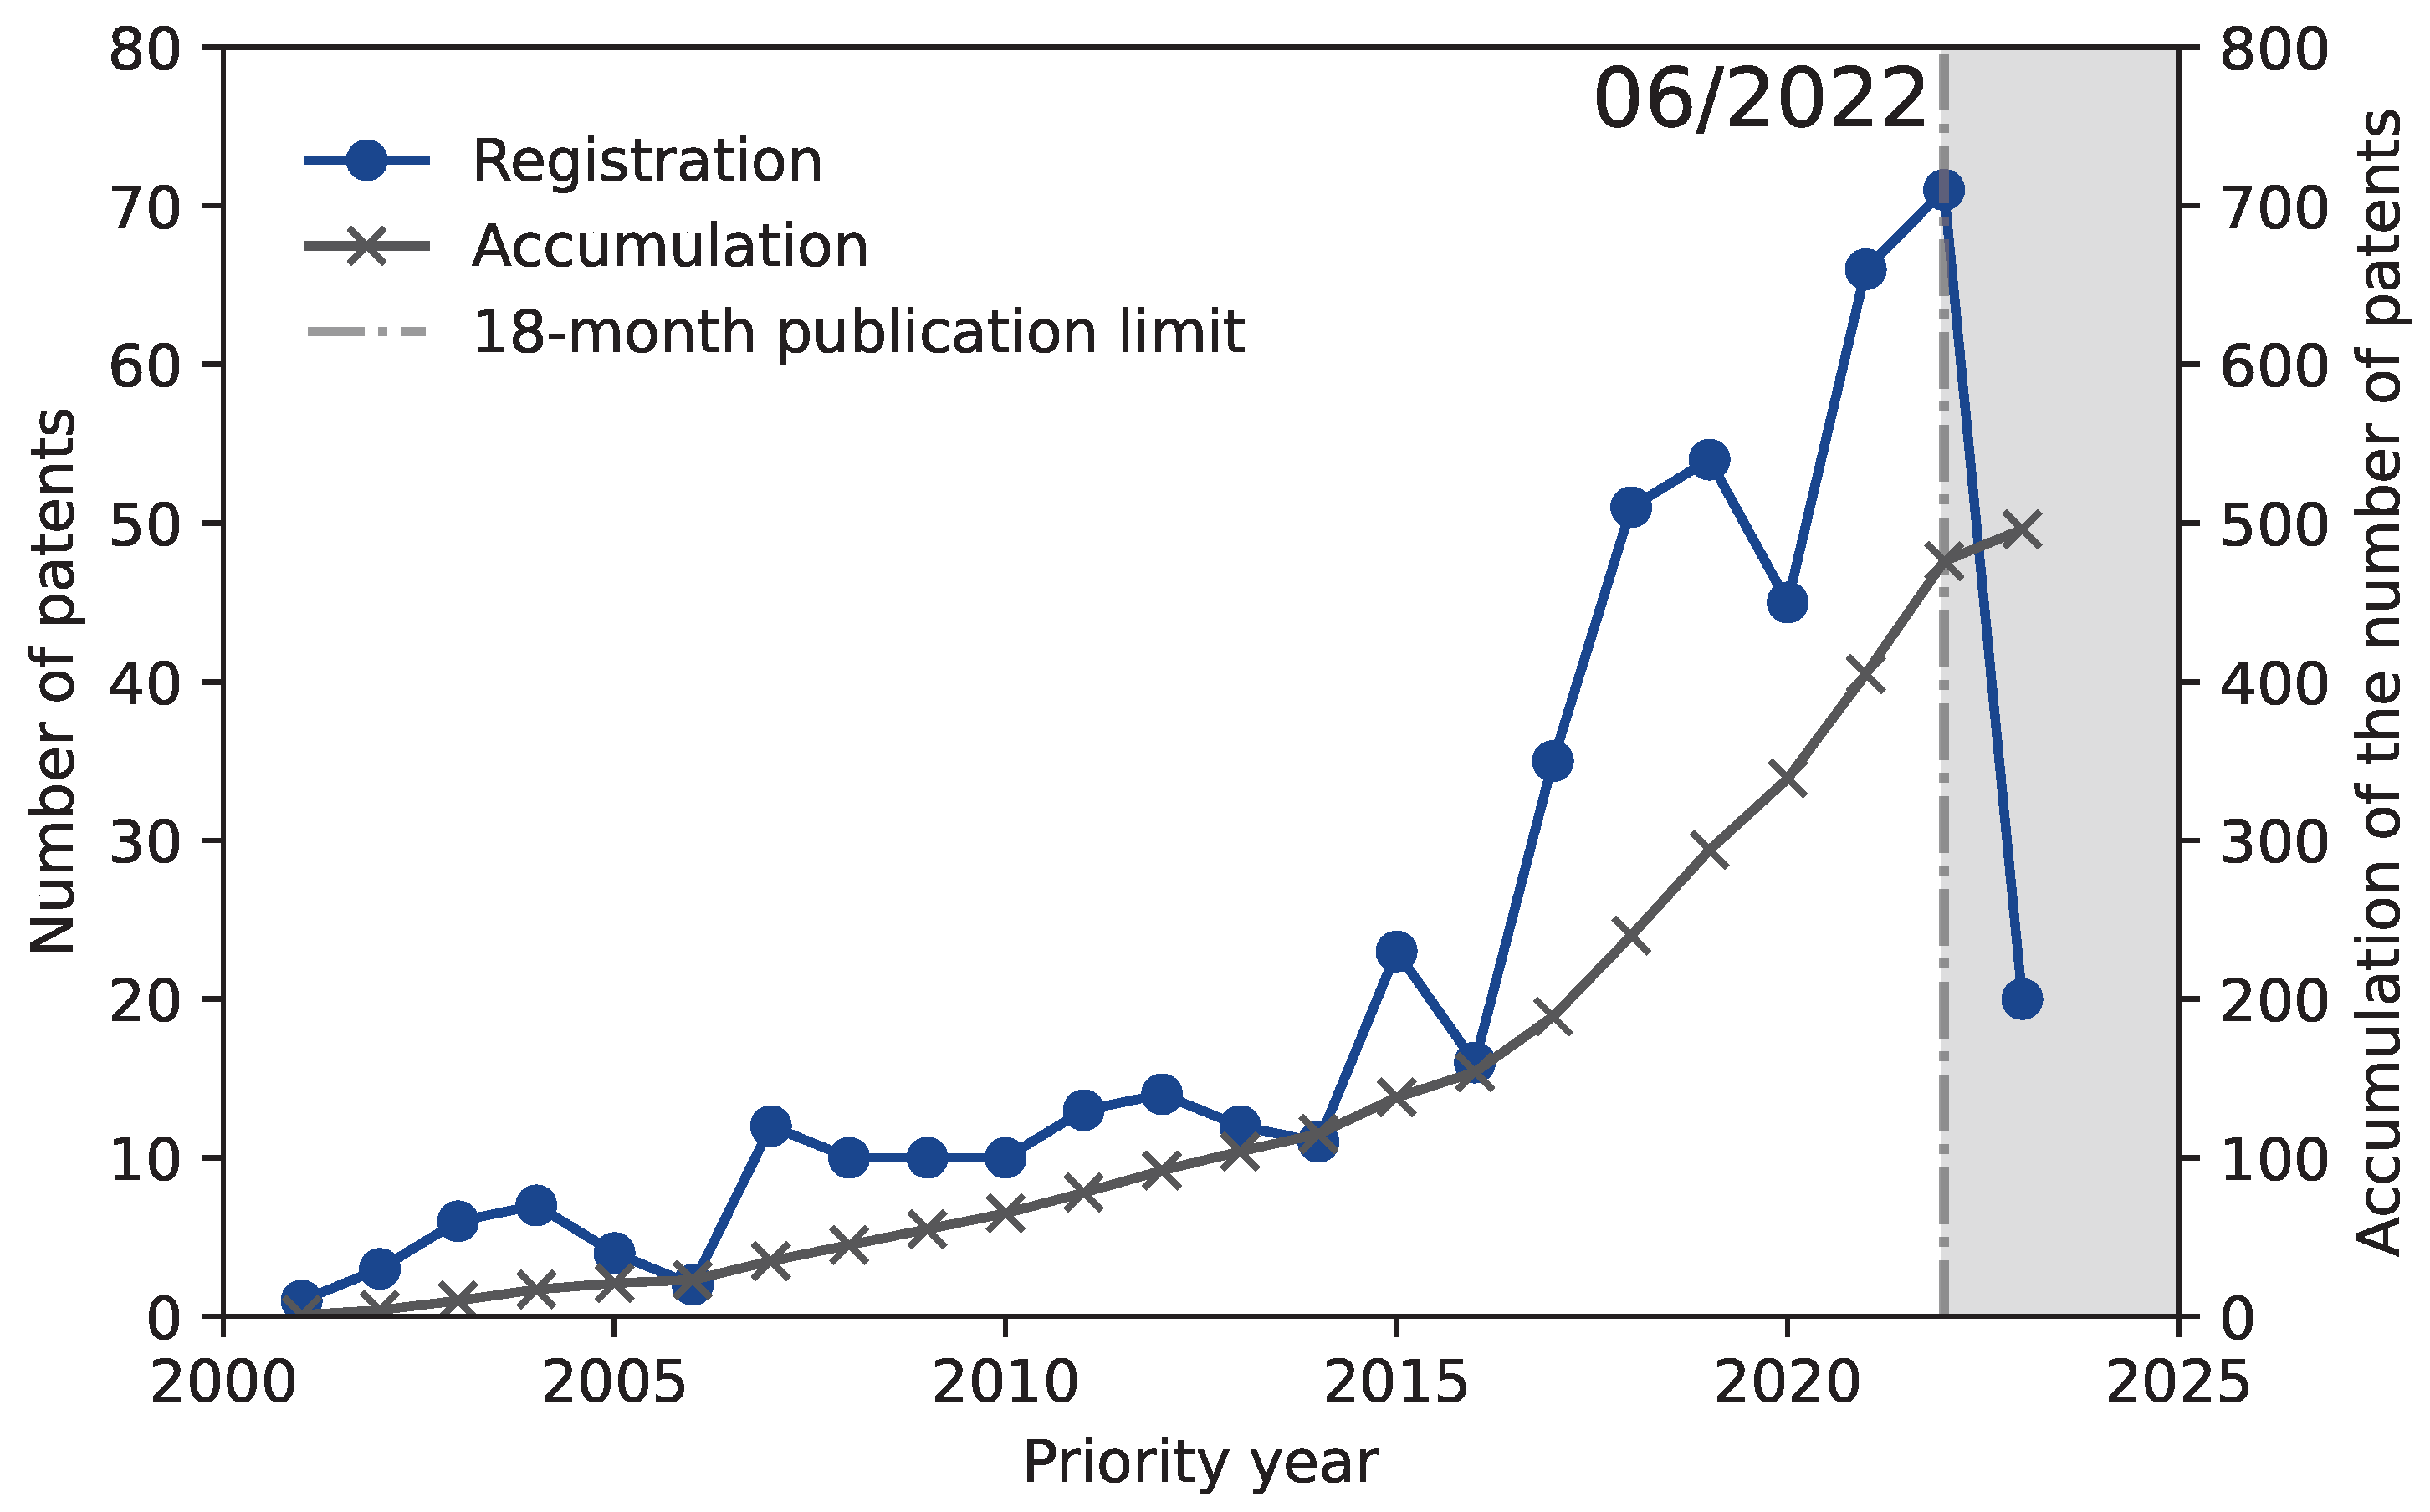
Figure 4 visualises the aggregated annual distribution of patent applications, taking into account the search terms from Table 1. In addition, these values are cumulated. Despite recurring deviations, the overall trend over the past 20 years shows an increase in the number of patent applications. There was a sharp increase from 2016 in particular. Both 2022 and 2023 have not yet exceeded the publication deadline, which means that it is likely that not all patents from those years are yet public.
The development of the annual patent application for cooling technologies for data centers reveals an increasing growth over the period under observation. This is mainly due to technical progress in the area of server hardware and increasing performance densities. This is compounded by the increasing demand for corresponding hardware solutions and the intense competition between manufacturers. In order to maintain this trend, further developments are required at server and rack cooling level. The increasing relevance of energy-intensive technologies such as AI is simultaneously causing significant growth boosts at chip level, which have an impact on cooling requirements.
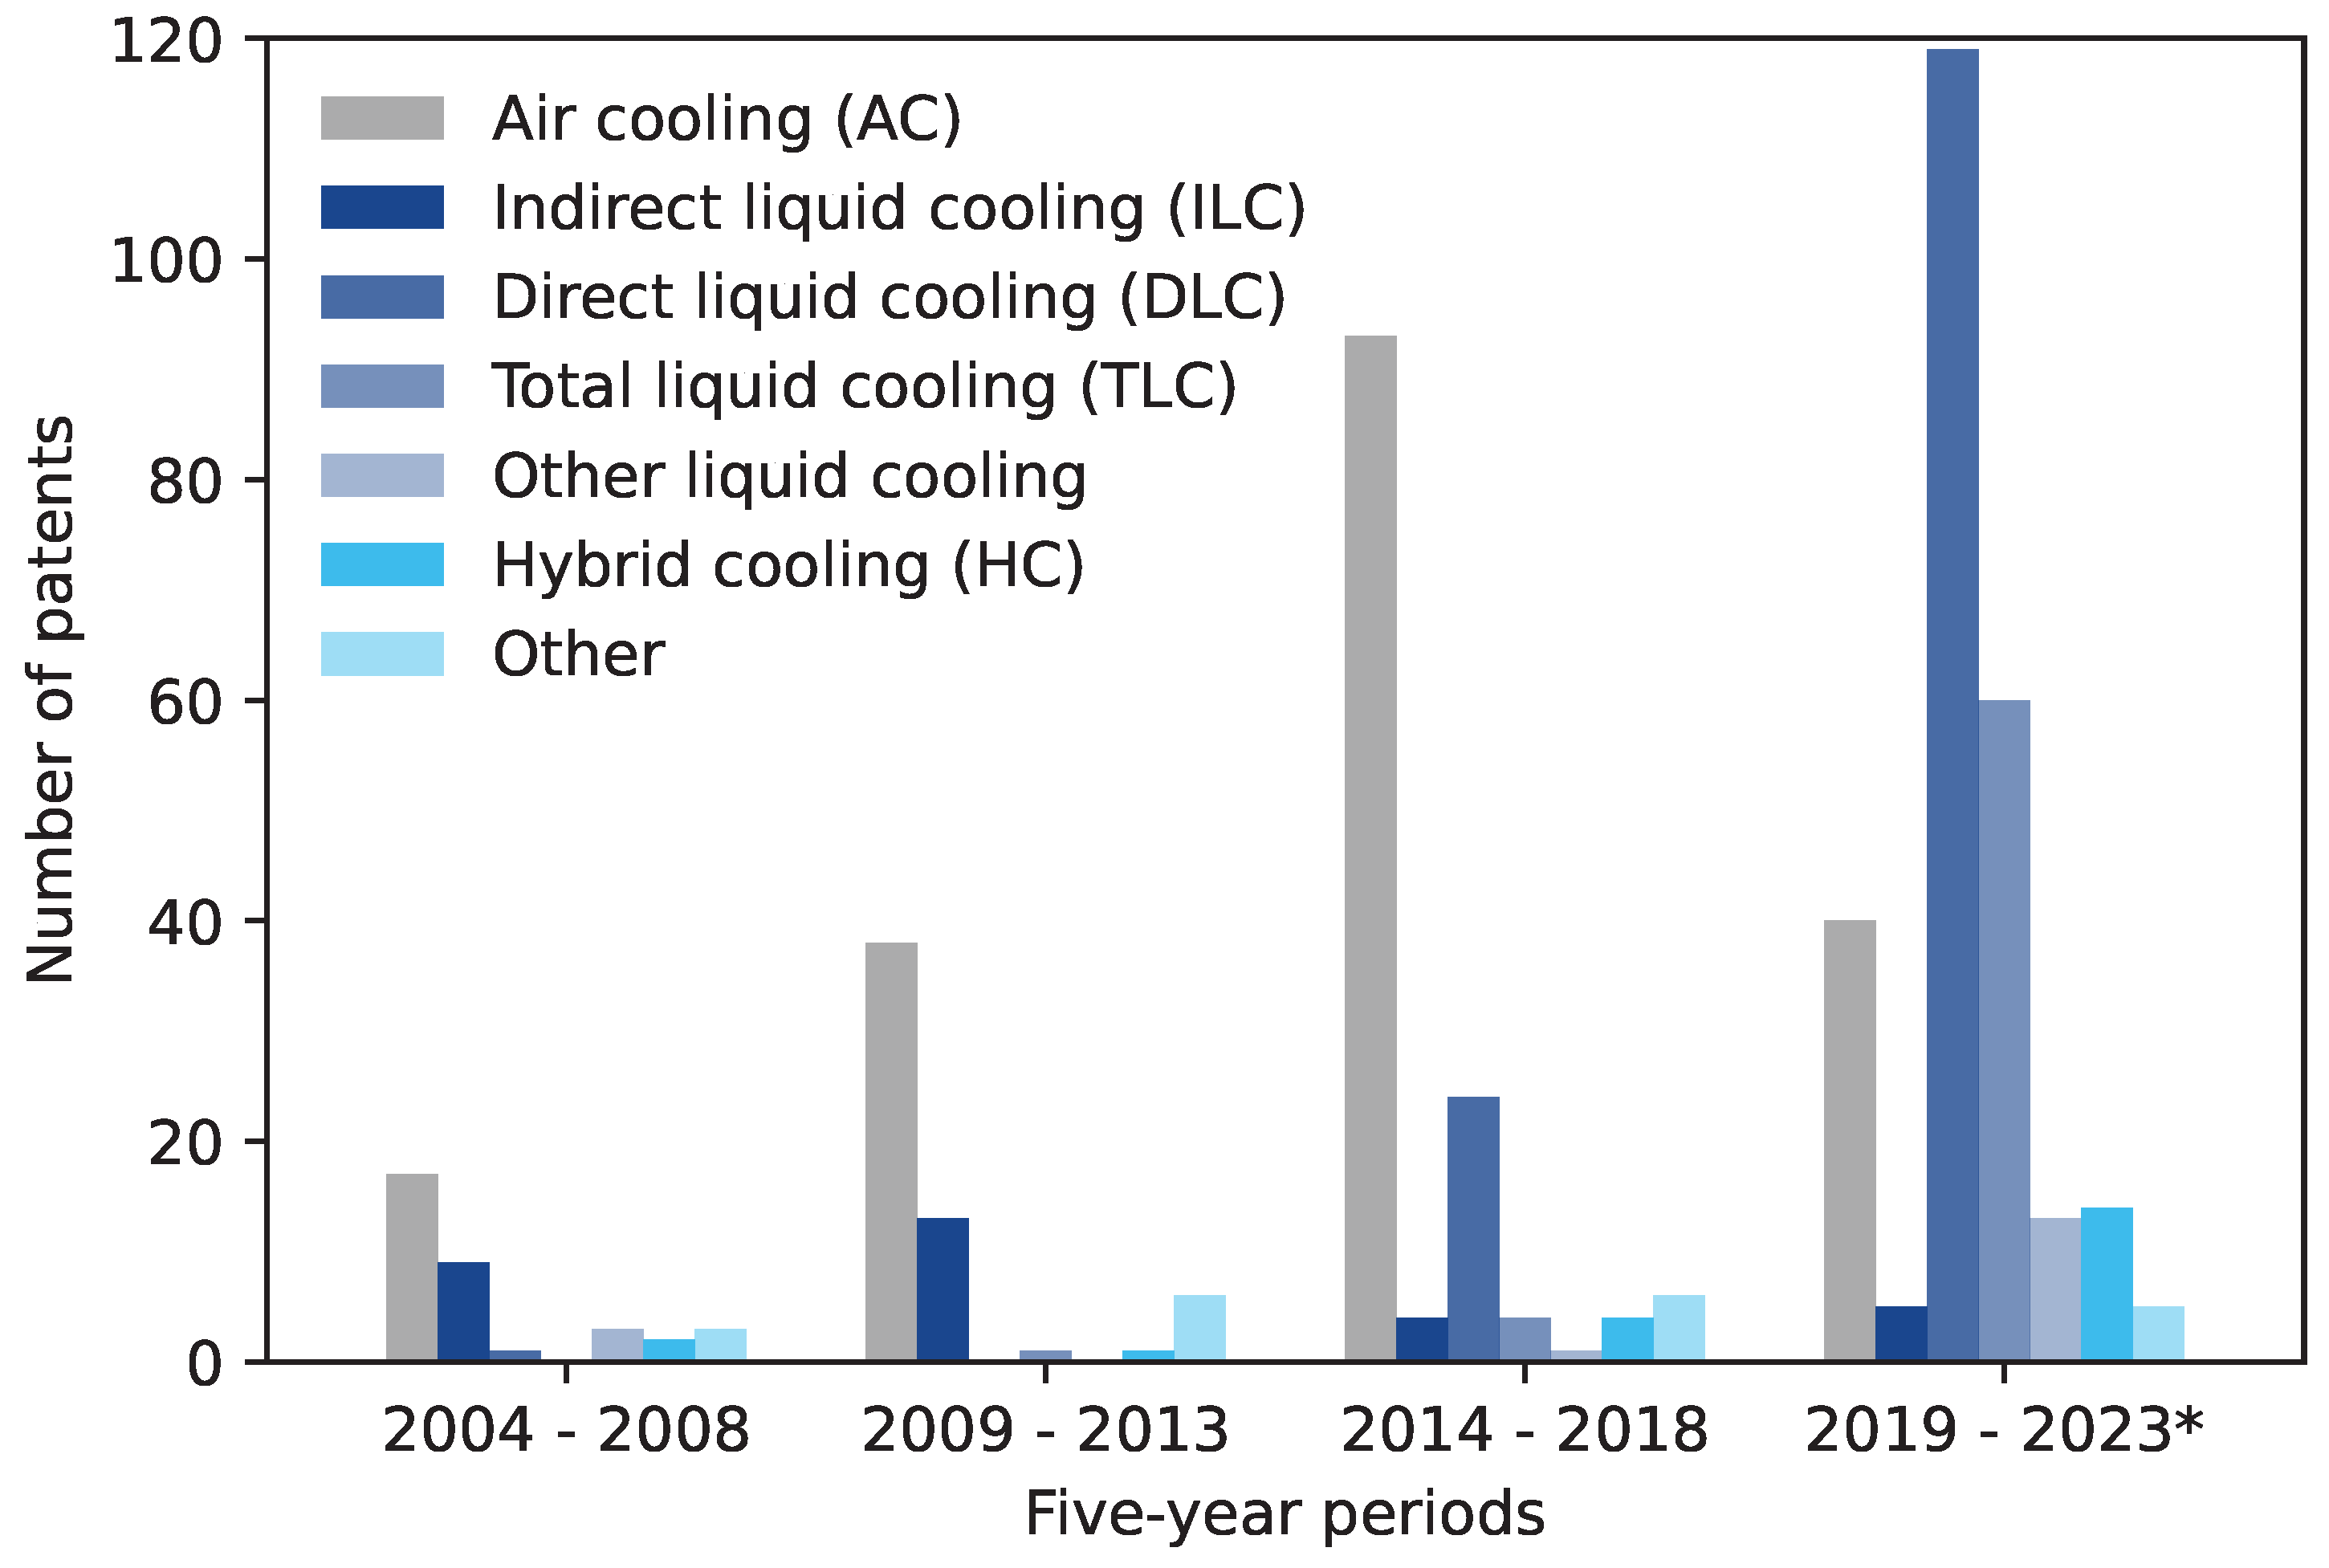
Based on Figure 4, Figure 5 breaks down the annual patent applications by technology with an additional aggregation in 5 annual periods from 2004 until 2023. Patents with air cooling rose steadily until 2018. Subsequently, application numbers fell by 57 % between the third and fourth period. All other technologies were at a low level in the comparison period and rarely exceeded a maximum of 20 % of the patent applications for air cooling. The two exceptions are indirect (1st and 2nd period) and direct (3rd) liquid cooling, which reached between 26 and 53 % of the applications of patents for air cooling. At the same time, the sum of the four liquid cooling technologies analysed was always below that of air cooling within the first three periods. It was only in the fourth period that both direct and total liquid cooling registered more patent applications than air cooling. Within liquid cooling, the focus in the first two periods was on indirect liquid cooling and in the last two periods on direct liquid cooling. Total liquid cooling, in turn, has increased significantly since 2014 in particular, whereby it was the second most common technology after direct liquid cooling in the fourth period. Indirect liquid cooling, by contrast, recorded a decline in patent applications from the third period onwards.
Figure 4. Historical development of relevant patents in the field of data center cooling (nP, relev. = 496); period: 2000 - 2023 (earliest priority year).
Preprints 108398 g004
Figure 5. Development over time of relevant patents in the field of data center cooling by cooling technology in five year periods (nP, relev. = 486); period: 2004 - 2023 (earliest priority year). * Not all relevant patents have presumably been published for 2023 and the second half of 2022.
Preprints 108398 g005
The technology change that is taking place is clearly highlighted in Figure 5. Since 2019, liquid cooling has accounted for the largest share of annual patent applications, replacing air cooling. In previous years, air cooling was sufficient for most applications and liquid cooling was generally not strictly necessary and more expensive. However, this has changed in recent years due to increased cooling demand as a result of technical developments to meet the performance requirements of the applications used on the server. Although the number of patent applications for air cooling has not fallen to zero, there is no longer any major potential for optimization here. It is a proven technology that has been developed and used for decades. Even if liquid cooling is becoming increasingly important, air cooling may be relevant. This applies in particular to hybrid cooling, which also uses air cooling to some extent, depending on the concept. In the case of direct liquid cooling, the remaining waste heat must be dissipated with a different technological approach (e. g. air cooling) due to a limited heat to water ratio. These types of concepts have only been specifically developed in recent years (since 2014).
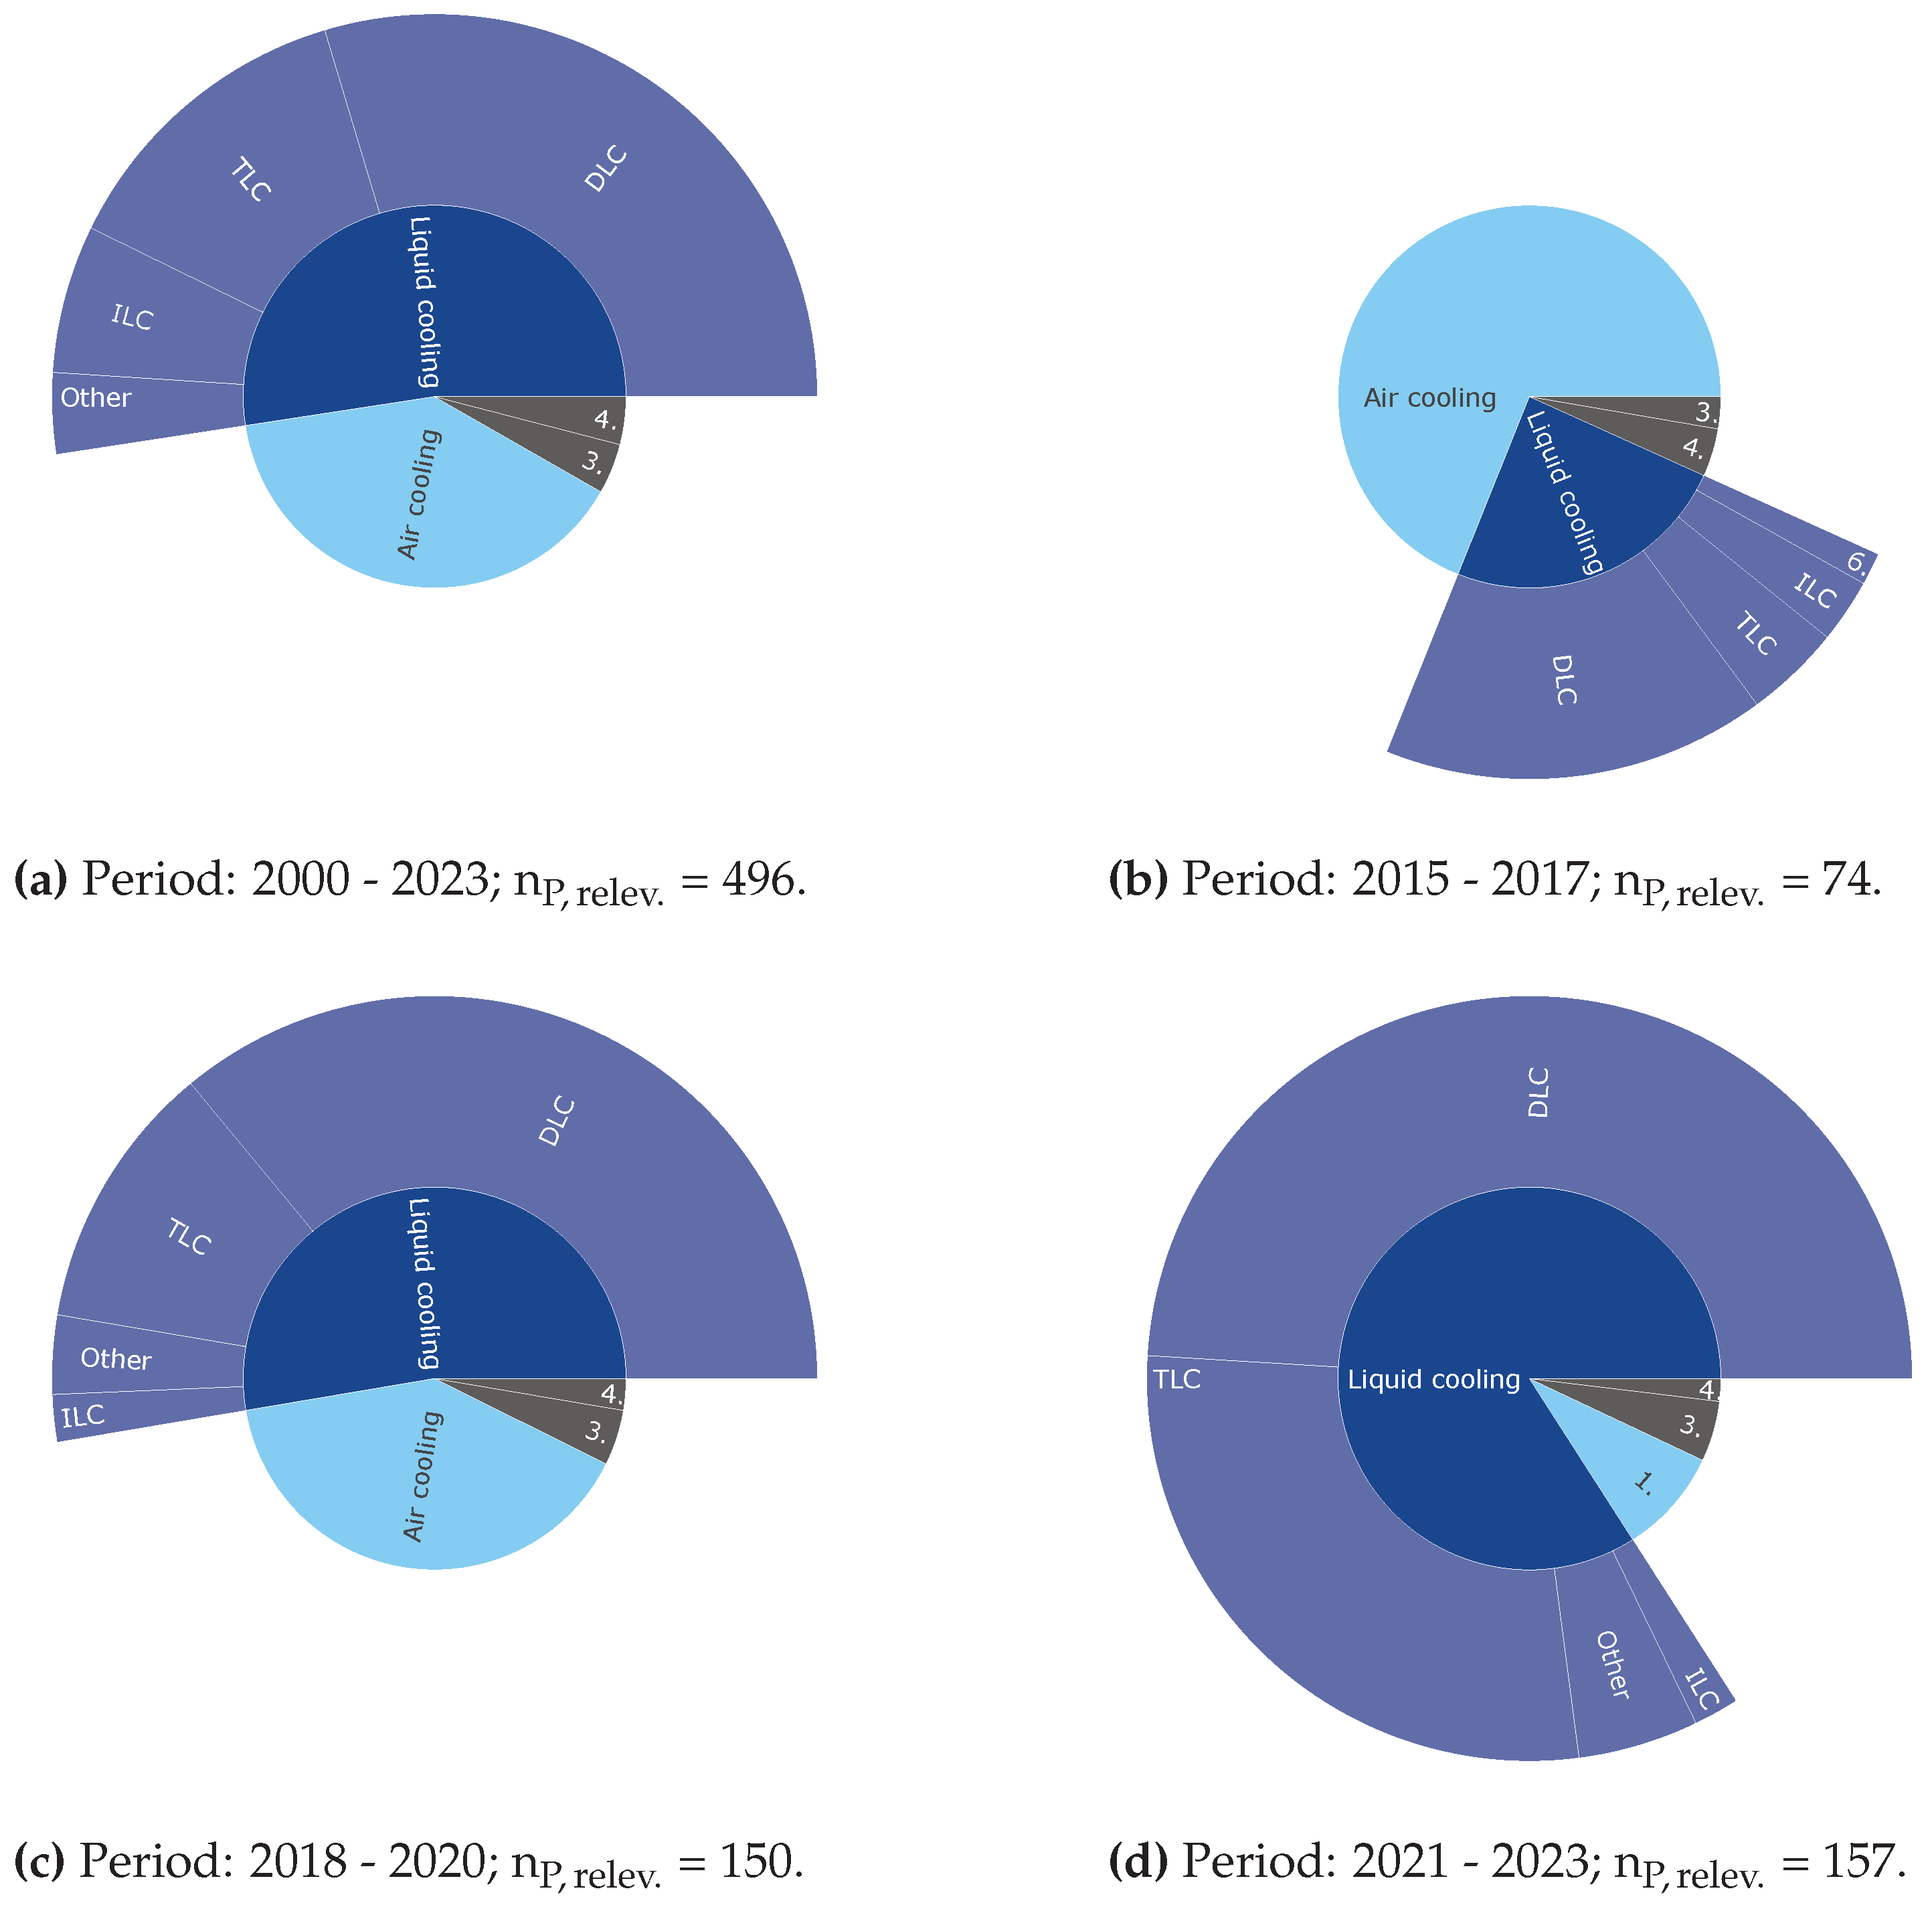
To illustrate the aggregated development over three equal periods from 2015 onwards to gain a better insight into technology breakdown in the recent past, the shares of the individual cooling technologies are shown in Figure 6b–d and in Table A2 in the appendix. Together, these cover 77 % of the relevant patents identified. In all three periods, the share of hybrid cooling and “Other” was less than 5 %. Over the three periods, the proportion of air cooling gradually decreased, while liquid cooling increased. Air cooling fell from 69 to 9 %, while liquid cooling increased from 24 to 84 %. Within liquid cooling, the focus was on direct liquid cooling. This accounted for at least 58 and up to 68 % of liquid cooling in all three periods. At the same time, the proportion of total cooling increased from 17 to 33 %.
The aggregated comparison of the technologies over three equal time periods compared to Figure 6a makes the general development especially visible. Today’s developments are dominated by liquid cooling in direct and total technologies for the reasons mentioned above.
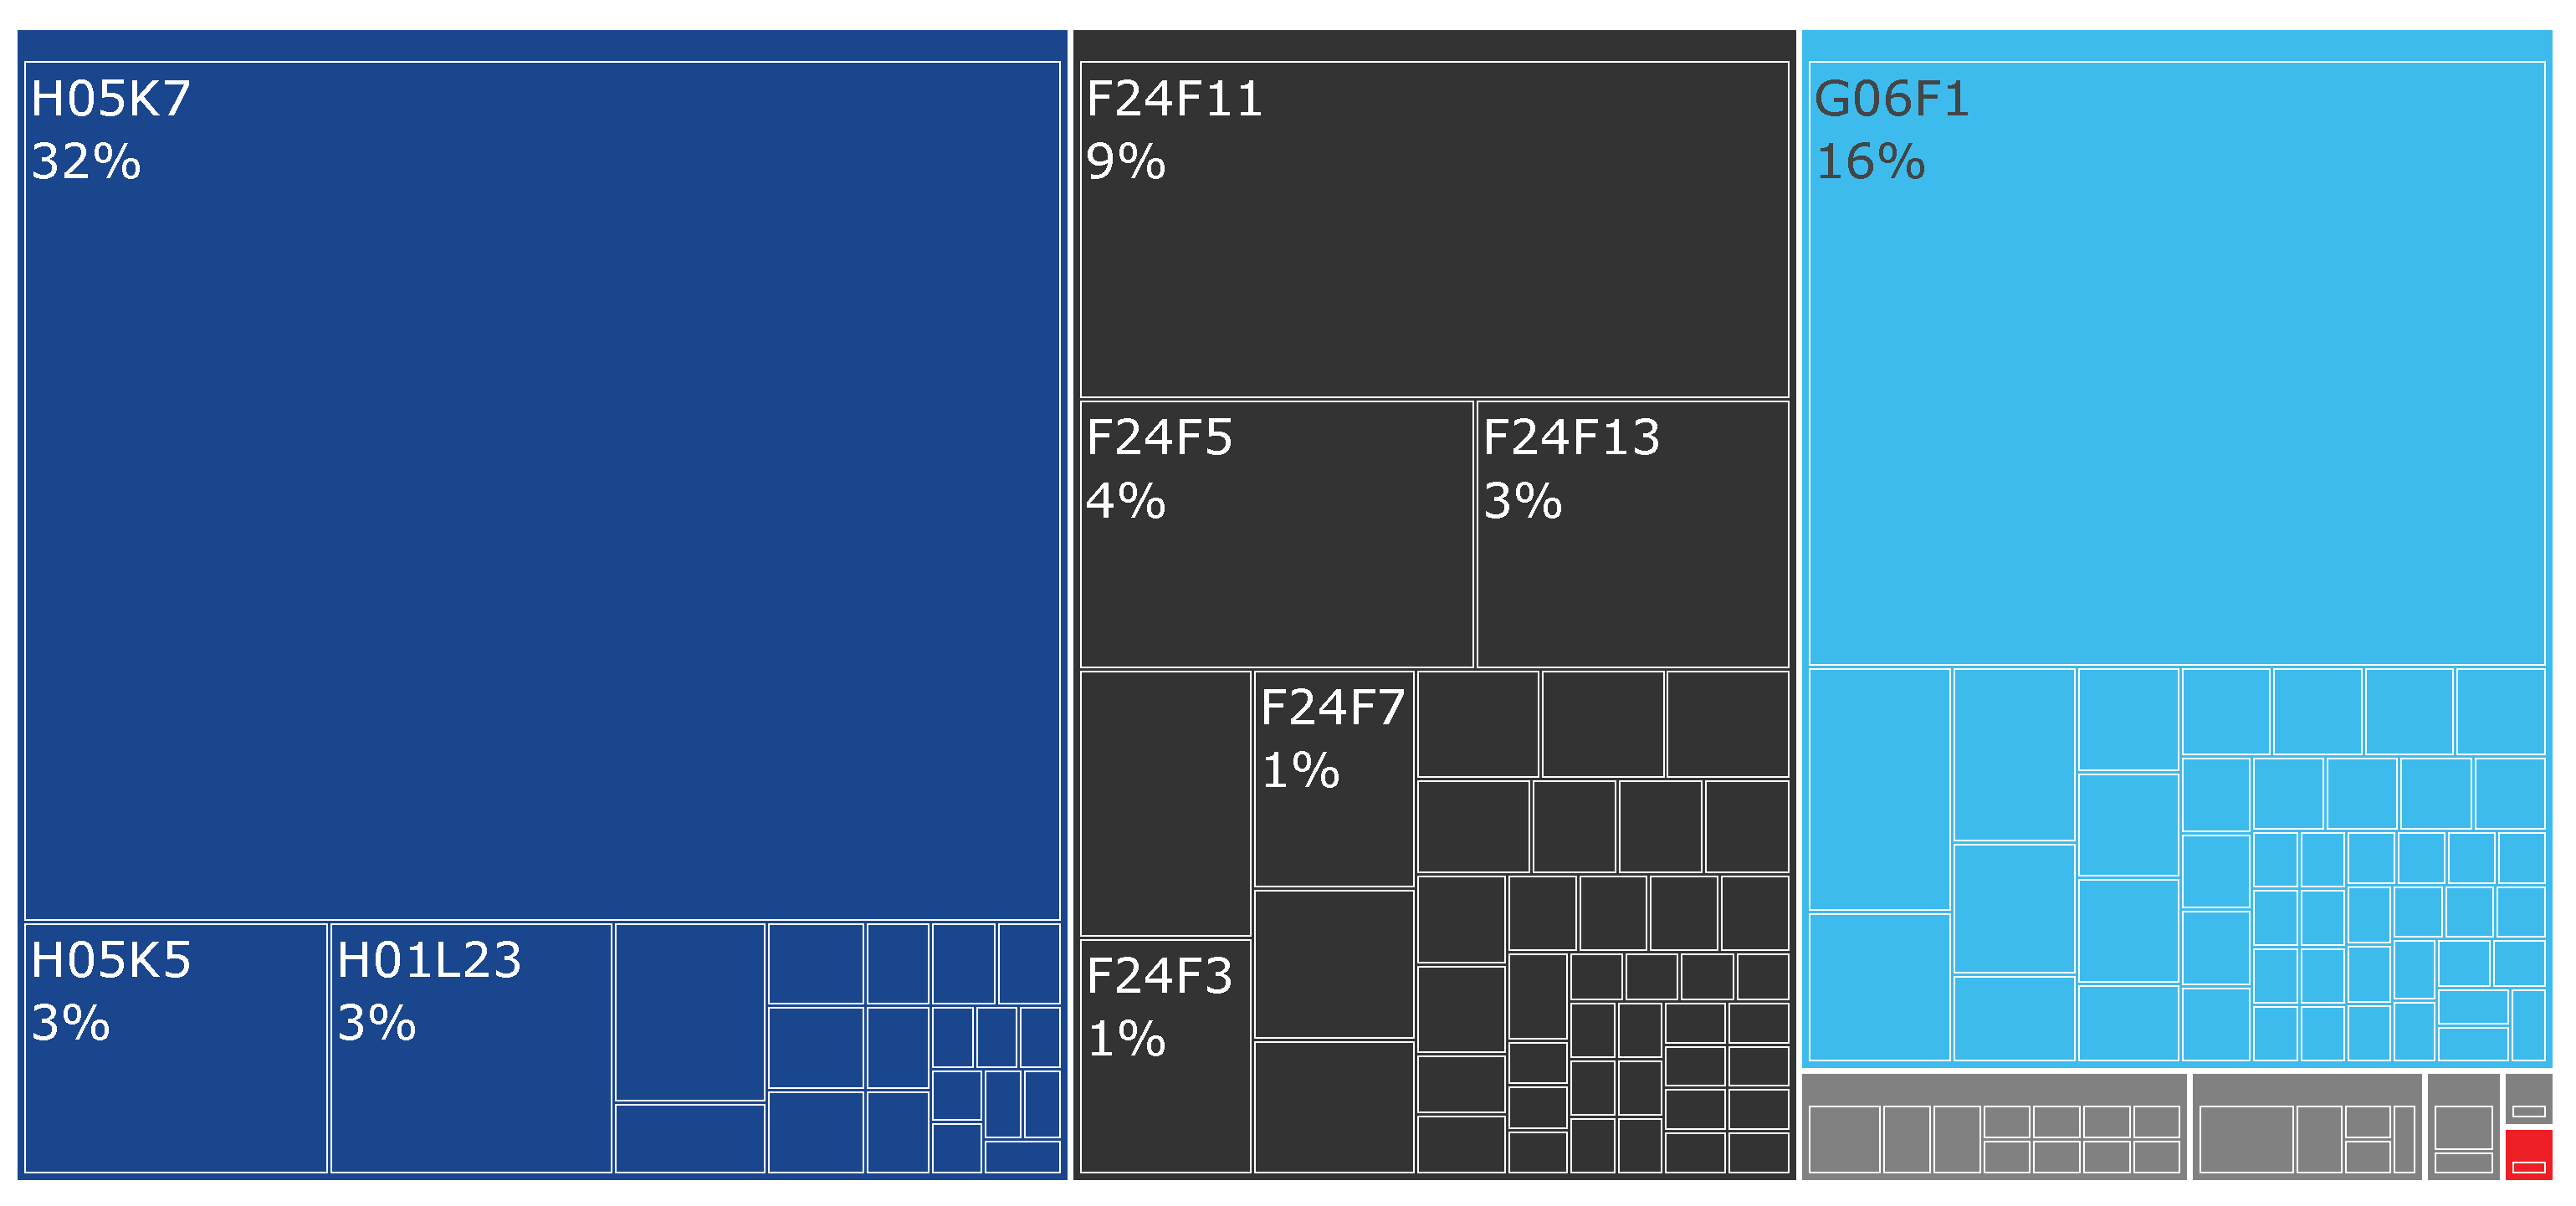
Figure 7 illustrates the hierarchical structures depending on the IPC section and main group of the patents in a treemap. The corresponding results are summarised in Table A3 in the appendix. The number of patents resulting from the main groups is higher than that determined in Table 3, as a patent can be assigned to several main groups. The three most common sections are in descending order: Electricity H (434), Mechanical engineering […] F (299) and Physics G (278) [37]. Within the three most common sections, the main groups H05K7 (32 %; Constructional details common to different types of electric apparatus […]), G06F1 (16 %; Details not covered by groups G06F 3/00-G06F 13/00 and G06F 21/00 […]) and F24F11 (9 %; Control or safety arrangements) are the most common main groups [54]. There are also sections Performing operations; Transporting B (15), Fixed constructions E (9), Chemistry; Metallurgy C (3), Human necessities A (1) and one patent that cannot be assigned as the corresponding text field is empty.
With regard to the distribution of patent classes there are large shares for H05K7 (32 %), G06F1 (16 %) and F24F11 (9 %). The first main group deals with constructive elements, the second with cooling and the third with control and safety elements. Apart from the superior subclass of the second main group, the issue of cooling is not central to the others. Their sections, in turn, are strongly represented. H, F and G are sections which, precisely because of their titles, could be assigned to the area of cooling data centers in advance. With the exception of section Textilies; Paper D, all other sections were present. On the one hand, other classes tended to be represented more frequently, on the other hand, the focus of section D was not on cooling technology. Nevertheless, the results are similar in both cases.
The absolute number of different IPC sections depending on the search term and cooling technology are specified in Table 4 and Table 5 respectively. All search terms are represented in sections F to H. Less than half of the search terms have patents in sections B and E. Within Section F, the largest share (58 %) is attributable to “CRAC / CRAH”. In section G, the allocation is more evenly balanced with focus on “CPU” (22 %) and “Server Cooling” (24 %). In section H with the highest number of patents, several search terms have a similarly high share. These include in particular “Immersion Cooling” (17 %), “Server Cooling” (16 %), “CRAC / CRAH” (16 %), “Direct Chip Cooling” (16 %) and “Rack Cooling” (14 %).
The distribution of the IPC sections according to cooling technology in Table 5 is similar to Table 4. Section F focuses on the area of air cooling (74 %), whereas liquid cooling predominates in sections G (51 %) and H (59 %). In both sections G and H, air cooling achieves a share of 34 %, in contrast to liquid cooling in section F with a share of 27 %. In terms of the various forms of liquid cooling, section H is the most occurring section. With regard to hybrid cooling, the focus is on sections F to H, with an even distribution. In the case of “Other” cooling technologies, sections F to H have also been used in particular. Within “Other”, Section G has the largest share of over 51 %.
As a result of the aggregation at cooling technology level, the technical focus of the sections can be determined in relevance to data centre cooling. To determine the reason for this breakdown, Figure 10 and Figure 12 visualises the composition of the TOP 10 main and subgroups in terms of cooling technology. In contrast, with regard to the “Other” cooling technologies, which primarily utilise the thermoelectric effect, which is a physical effect, it can be stated that there is the greatest overlap with Section G in terms of subject content.
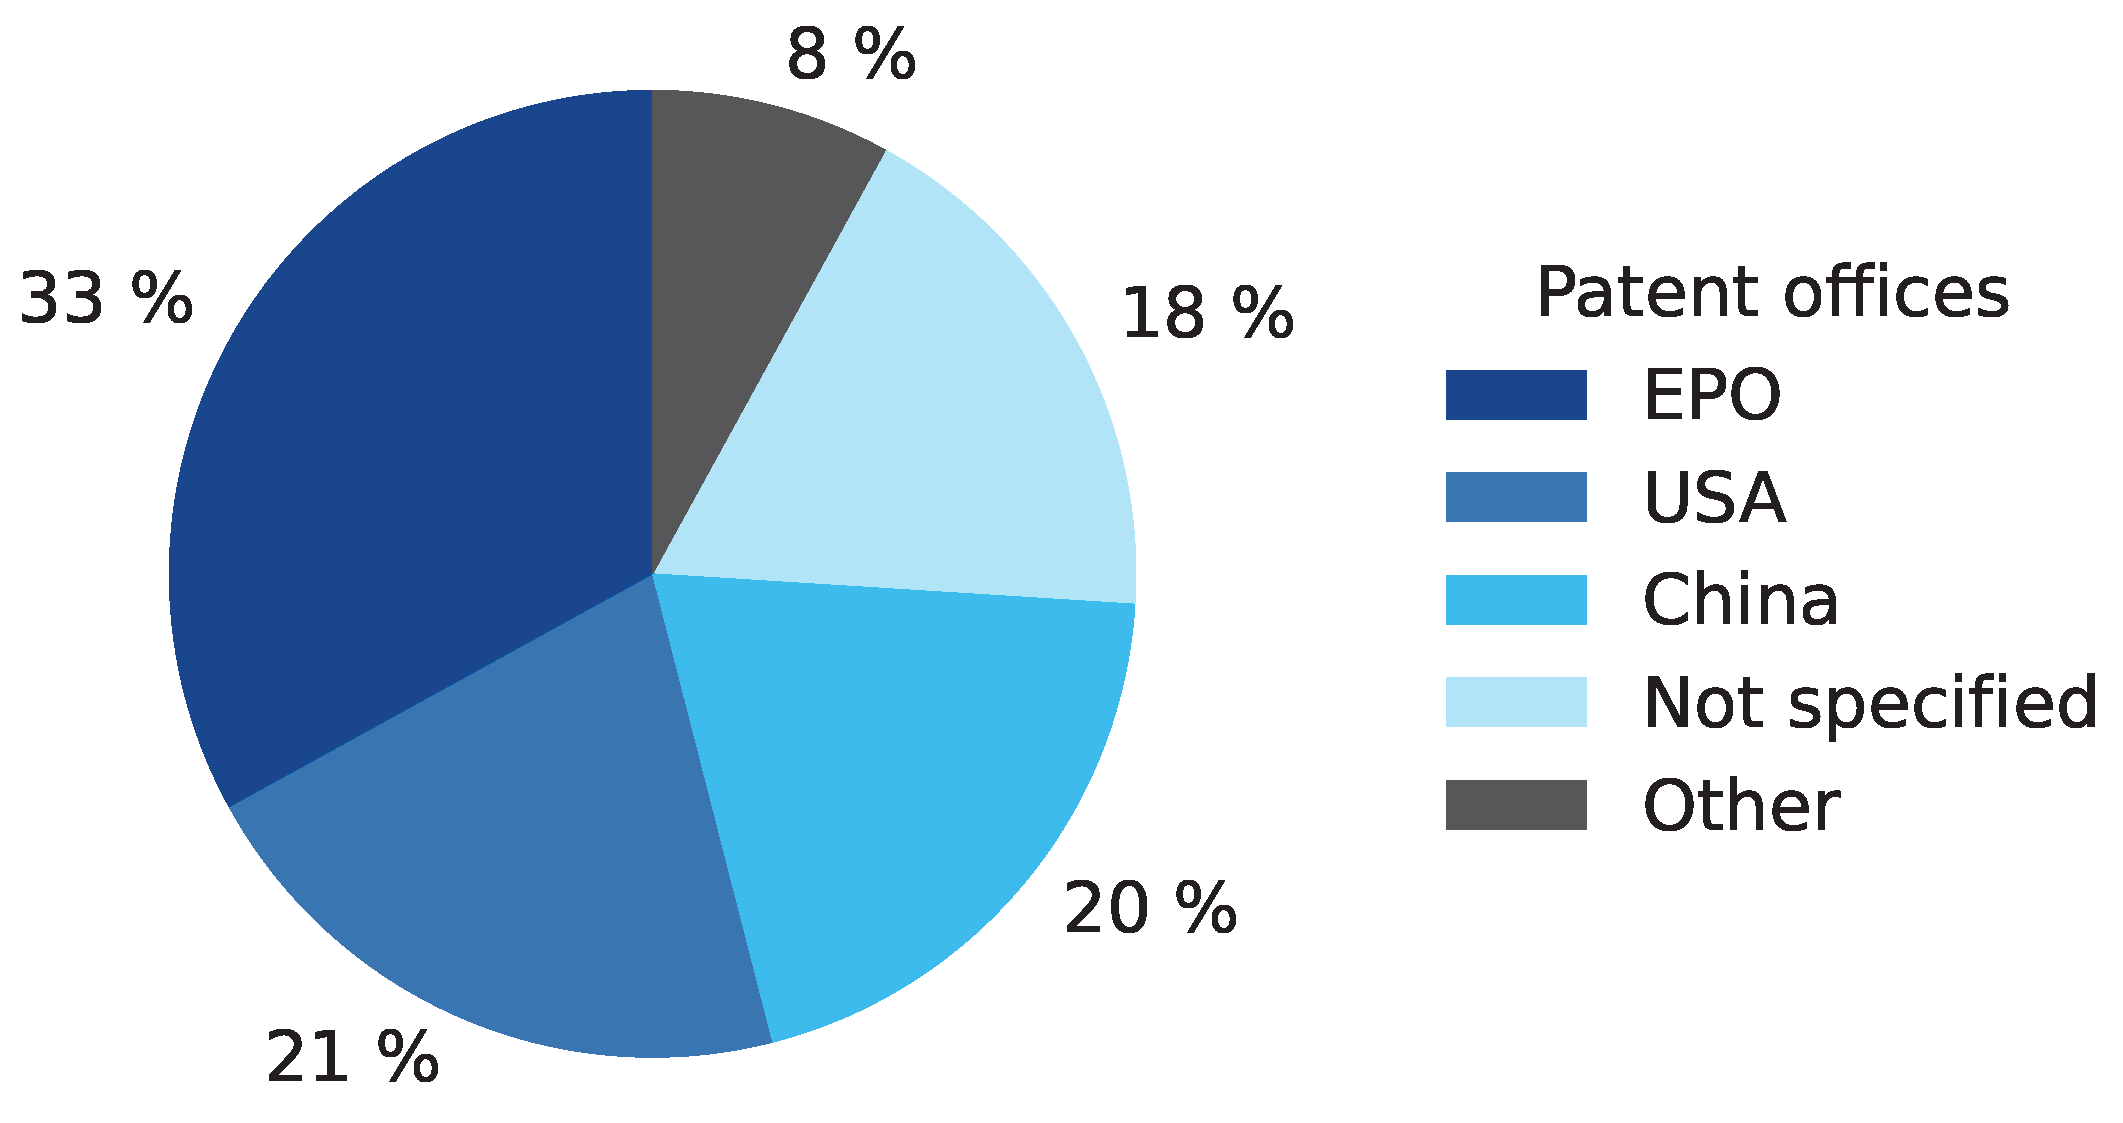
The regional distribution of patents is visualised in Figure 8 on the basis of the patent offices and in Figure 9 on the basis of the country code in the patent number or the applicant. The number of patents based on patent offices is higher, as a patent can be registered by several patent offices at the same time. The most patent applications were filed in Europe, the USA and China. 18 % of the patents could not be assigned to a patent office. 86 % of the patents affected can be related to China based on the applicant’s country of origin. In addition, 6 % could not be allocated in this way. However, taking into account the country code in the publication number, these patents could also be attributed to China. The remaining 8 % can be allocated to Japan, South Korea and Singapore on the basis of the applicants. Taking into account the country allocation for patents without direct indication of the patent office, it can be concluded that China probably has the most patent applications (37 %).
Figure 8. Distribution of all data center cooling patents by patent offices (nP, total = 733, nP, relev. = 496, nP, PO, relev. = 840); period: 2000 - 2023 (earliest priority year).
Preprints 108398 g008
Most of the so-called IP5, the 5 largest patent offices (China, Europe, Japan, Korea and USA), are represented in Figure 8. Together they process around 85 % of the world’s patent applications [55]. As a result of their economic and technological importance, this leads to a high proportion of patents being processed. In this case, they account for a combined share of 74 or 91 % with the uncertainty in the allocation of the patent office in cases “Not specified”. However, it should be considered that a patent can be registered simultaneously with several patent offices across the various patent classes it contains.
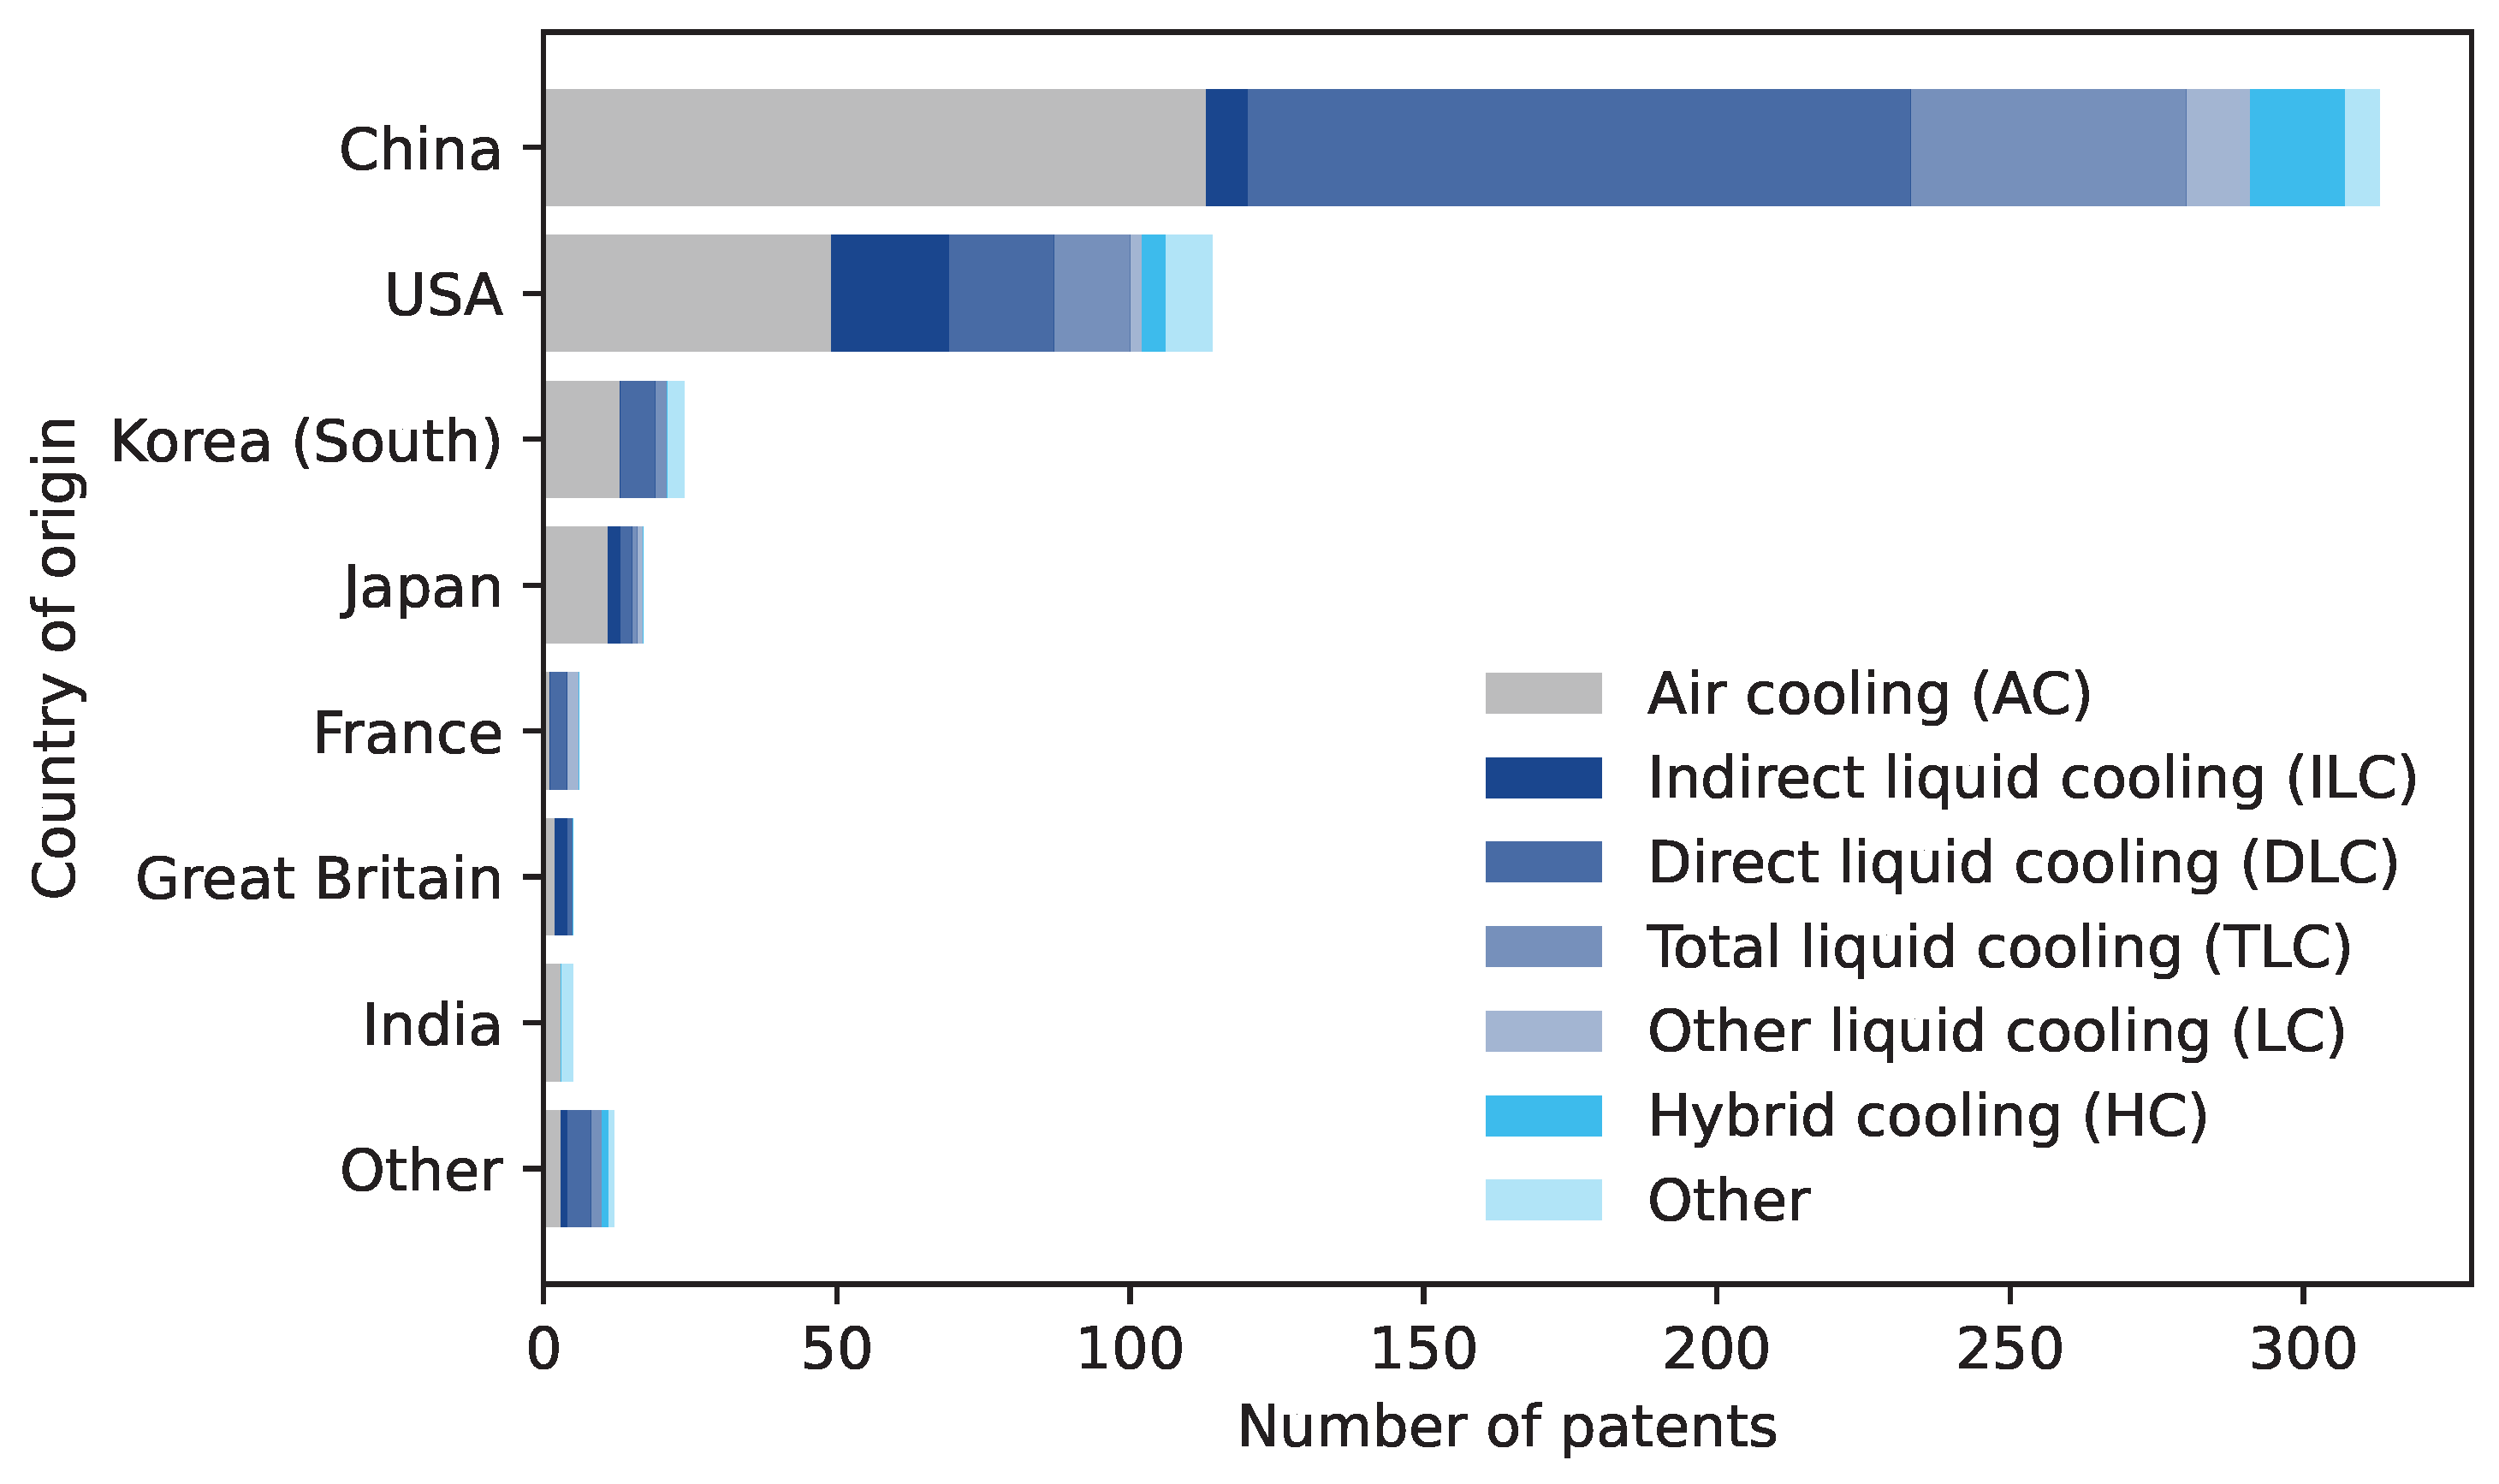
Figure 9. Distribution of patents by country of origin (nP, relev. = 496); period: 2000 - 2023 (earliest priority year).
Preprints 108398 g009
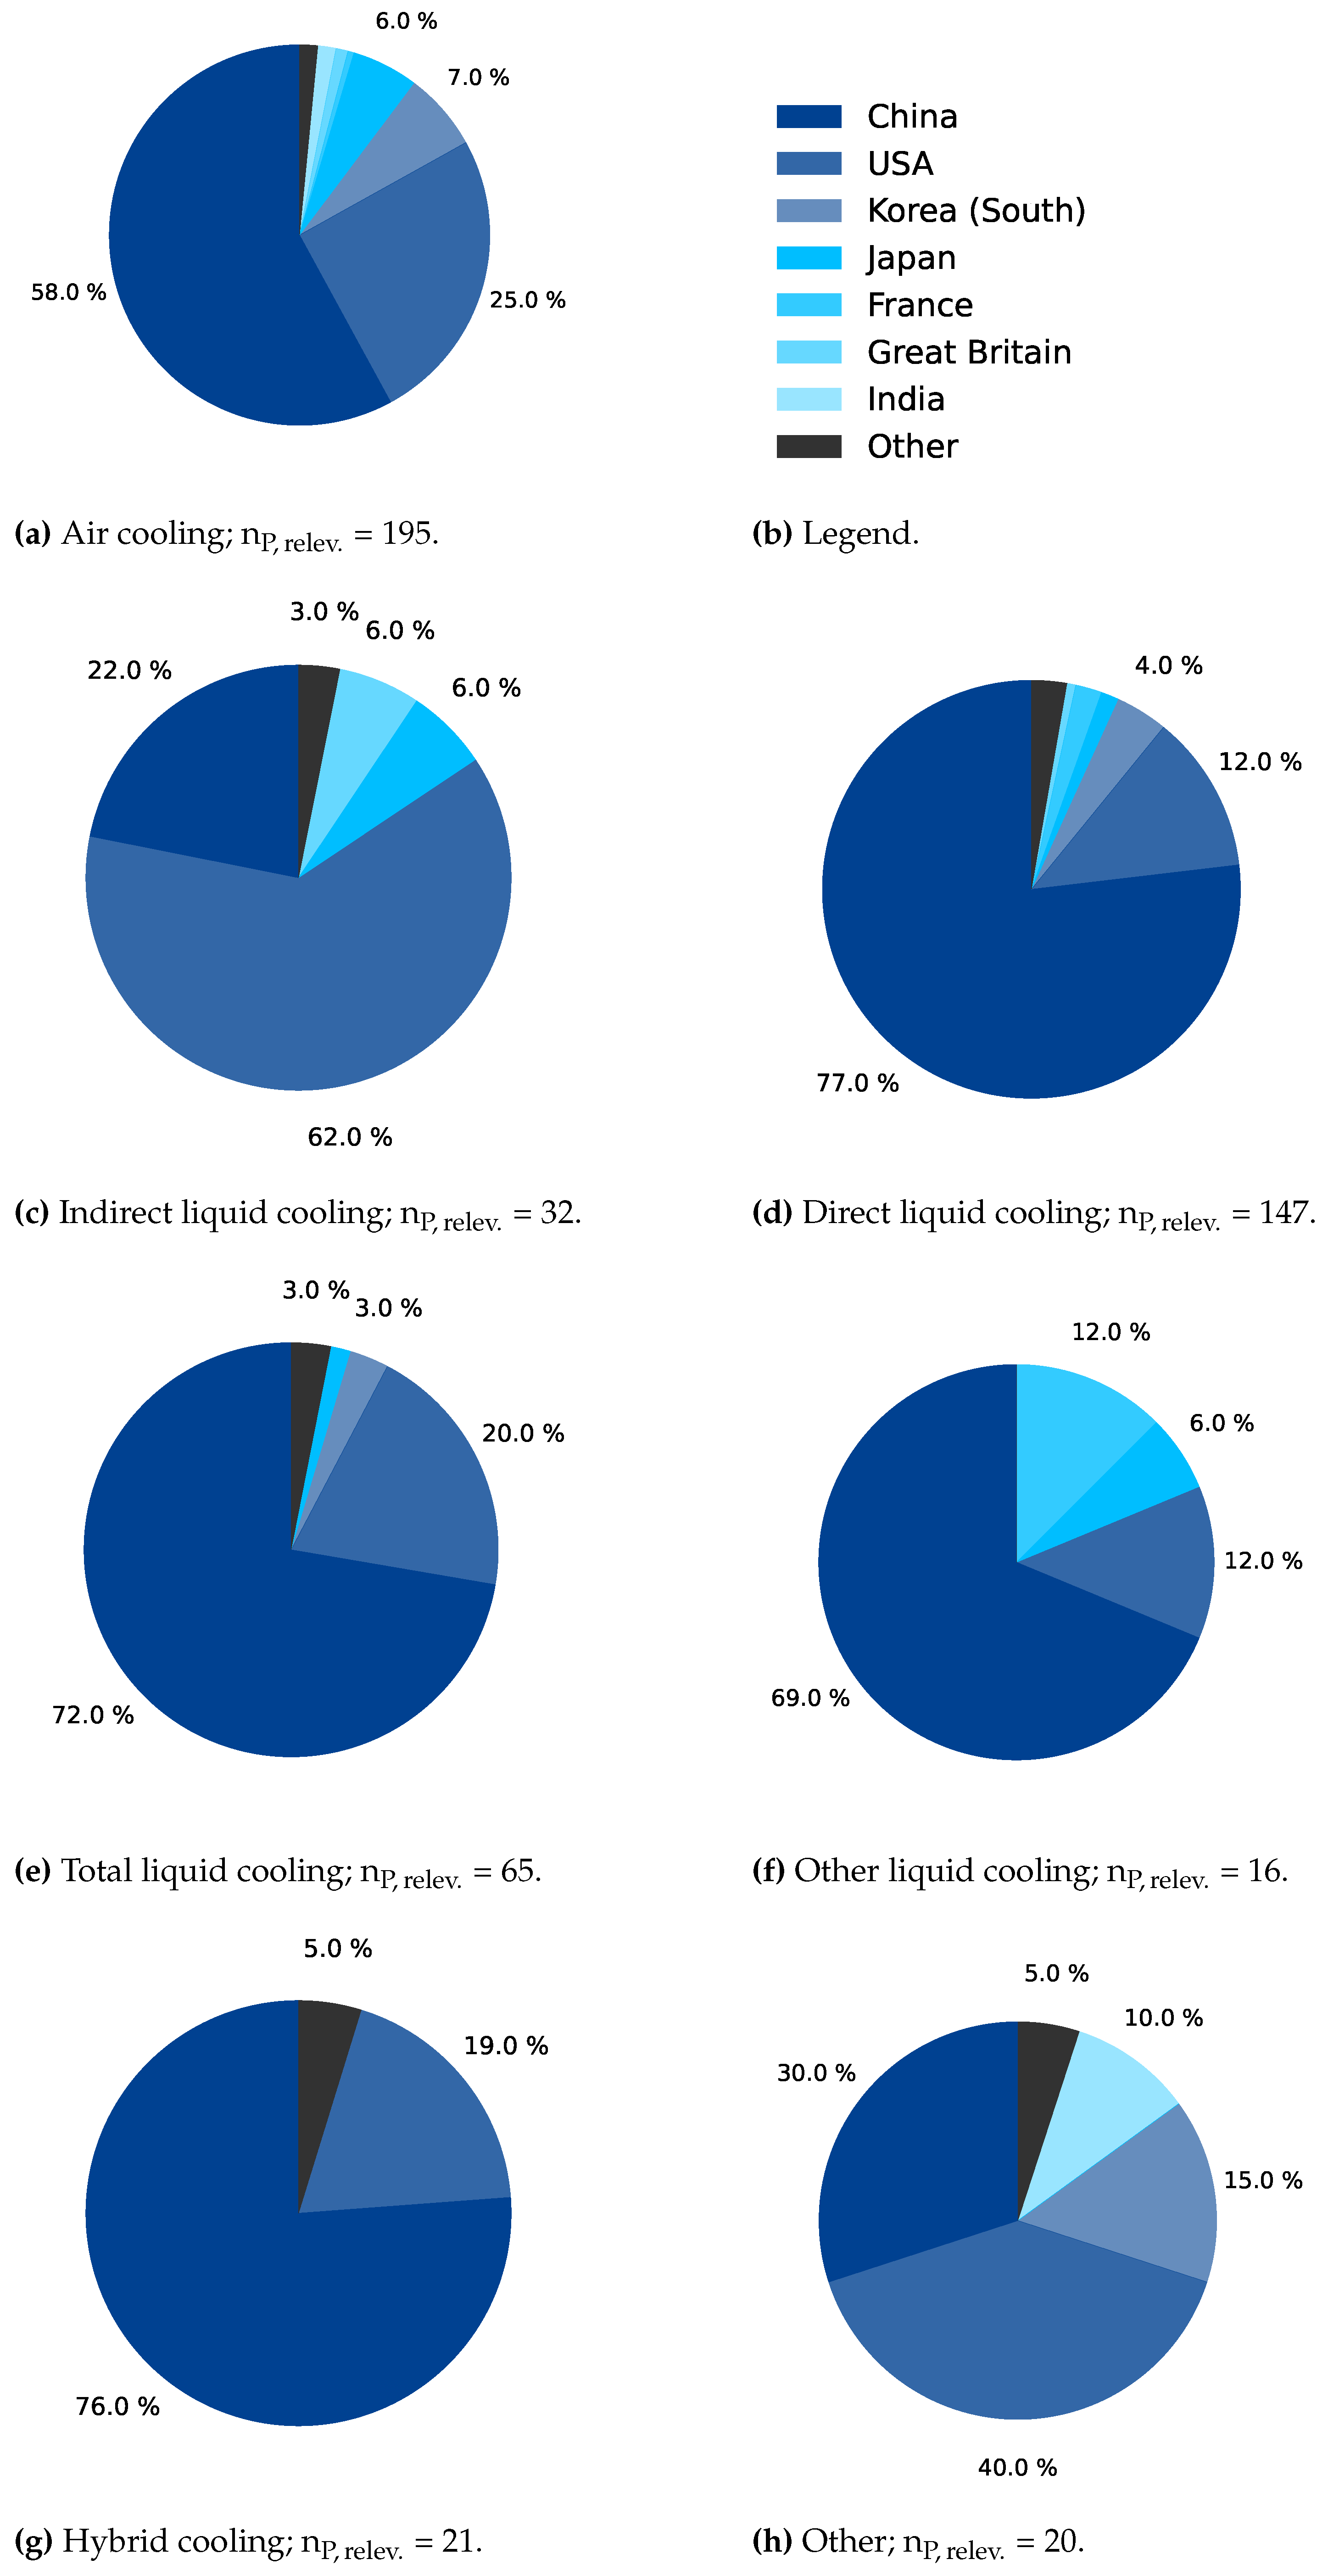
In terms of patent applications by country of origin, China (313) and the USA (114) reveal the highest level of activity. Their share of the total number of relevant patents in the area of data center cooling is 63 and 23 % respectively. The remaining countries together account for less than 14 %. Chinese patents have a share of 36 % for air cooling and of 57 % for liquid cooling. In the case of American patents, the distribution is more even — it is 43 % for air cooling and 46 % for liquid cooling. Within the liquid cooling category, the focus in China is on direct (63 %) and in the USA on indirect liquid cooling (38 %). Figure A1 in the appendix additionally presents a differentiation of the country distribution by cooling technology.
China and the USA are by far the most active countries. This also correlates very strongly with general patent applications [56]. France and Japan are also represented as part of the general TOP 5. This means that the general distribution of patent offices roughly corresponds to that of all patents. The high proportion of liquid cooling, both in China and the USA, is presumably due to the increasing importance of high-performance hardware and applications (AI, big data and cloud computing). A number of large providers of these services are represented in these two countries in particular, which also operate worldwide.
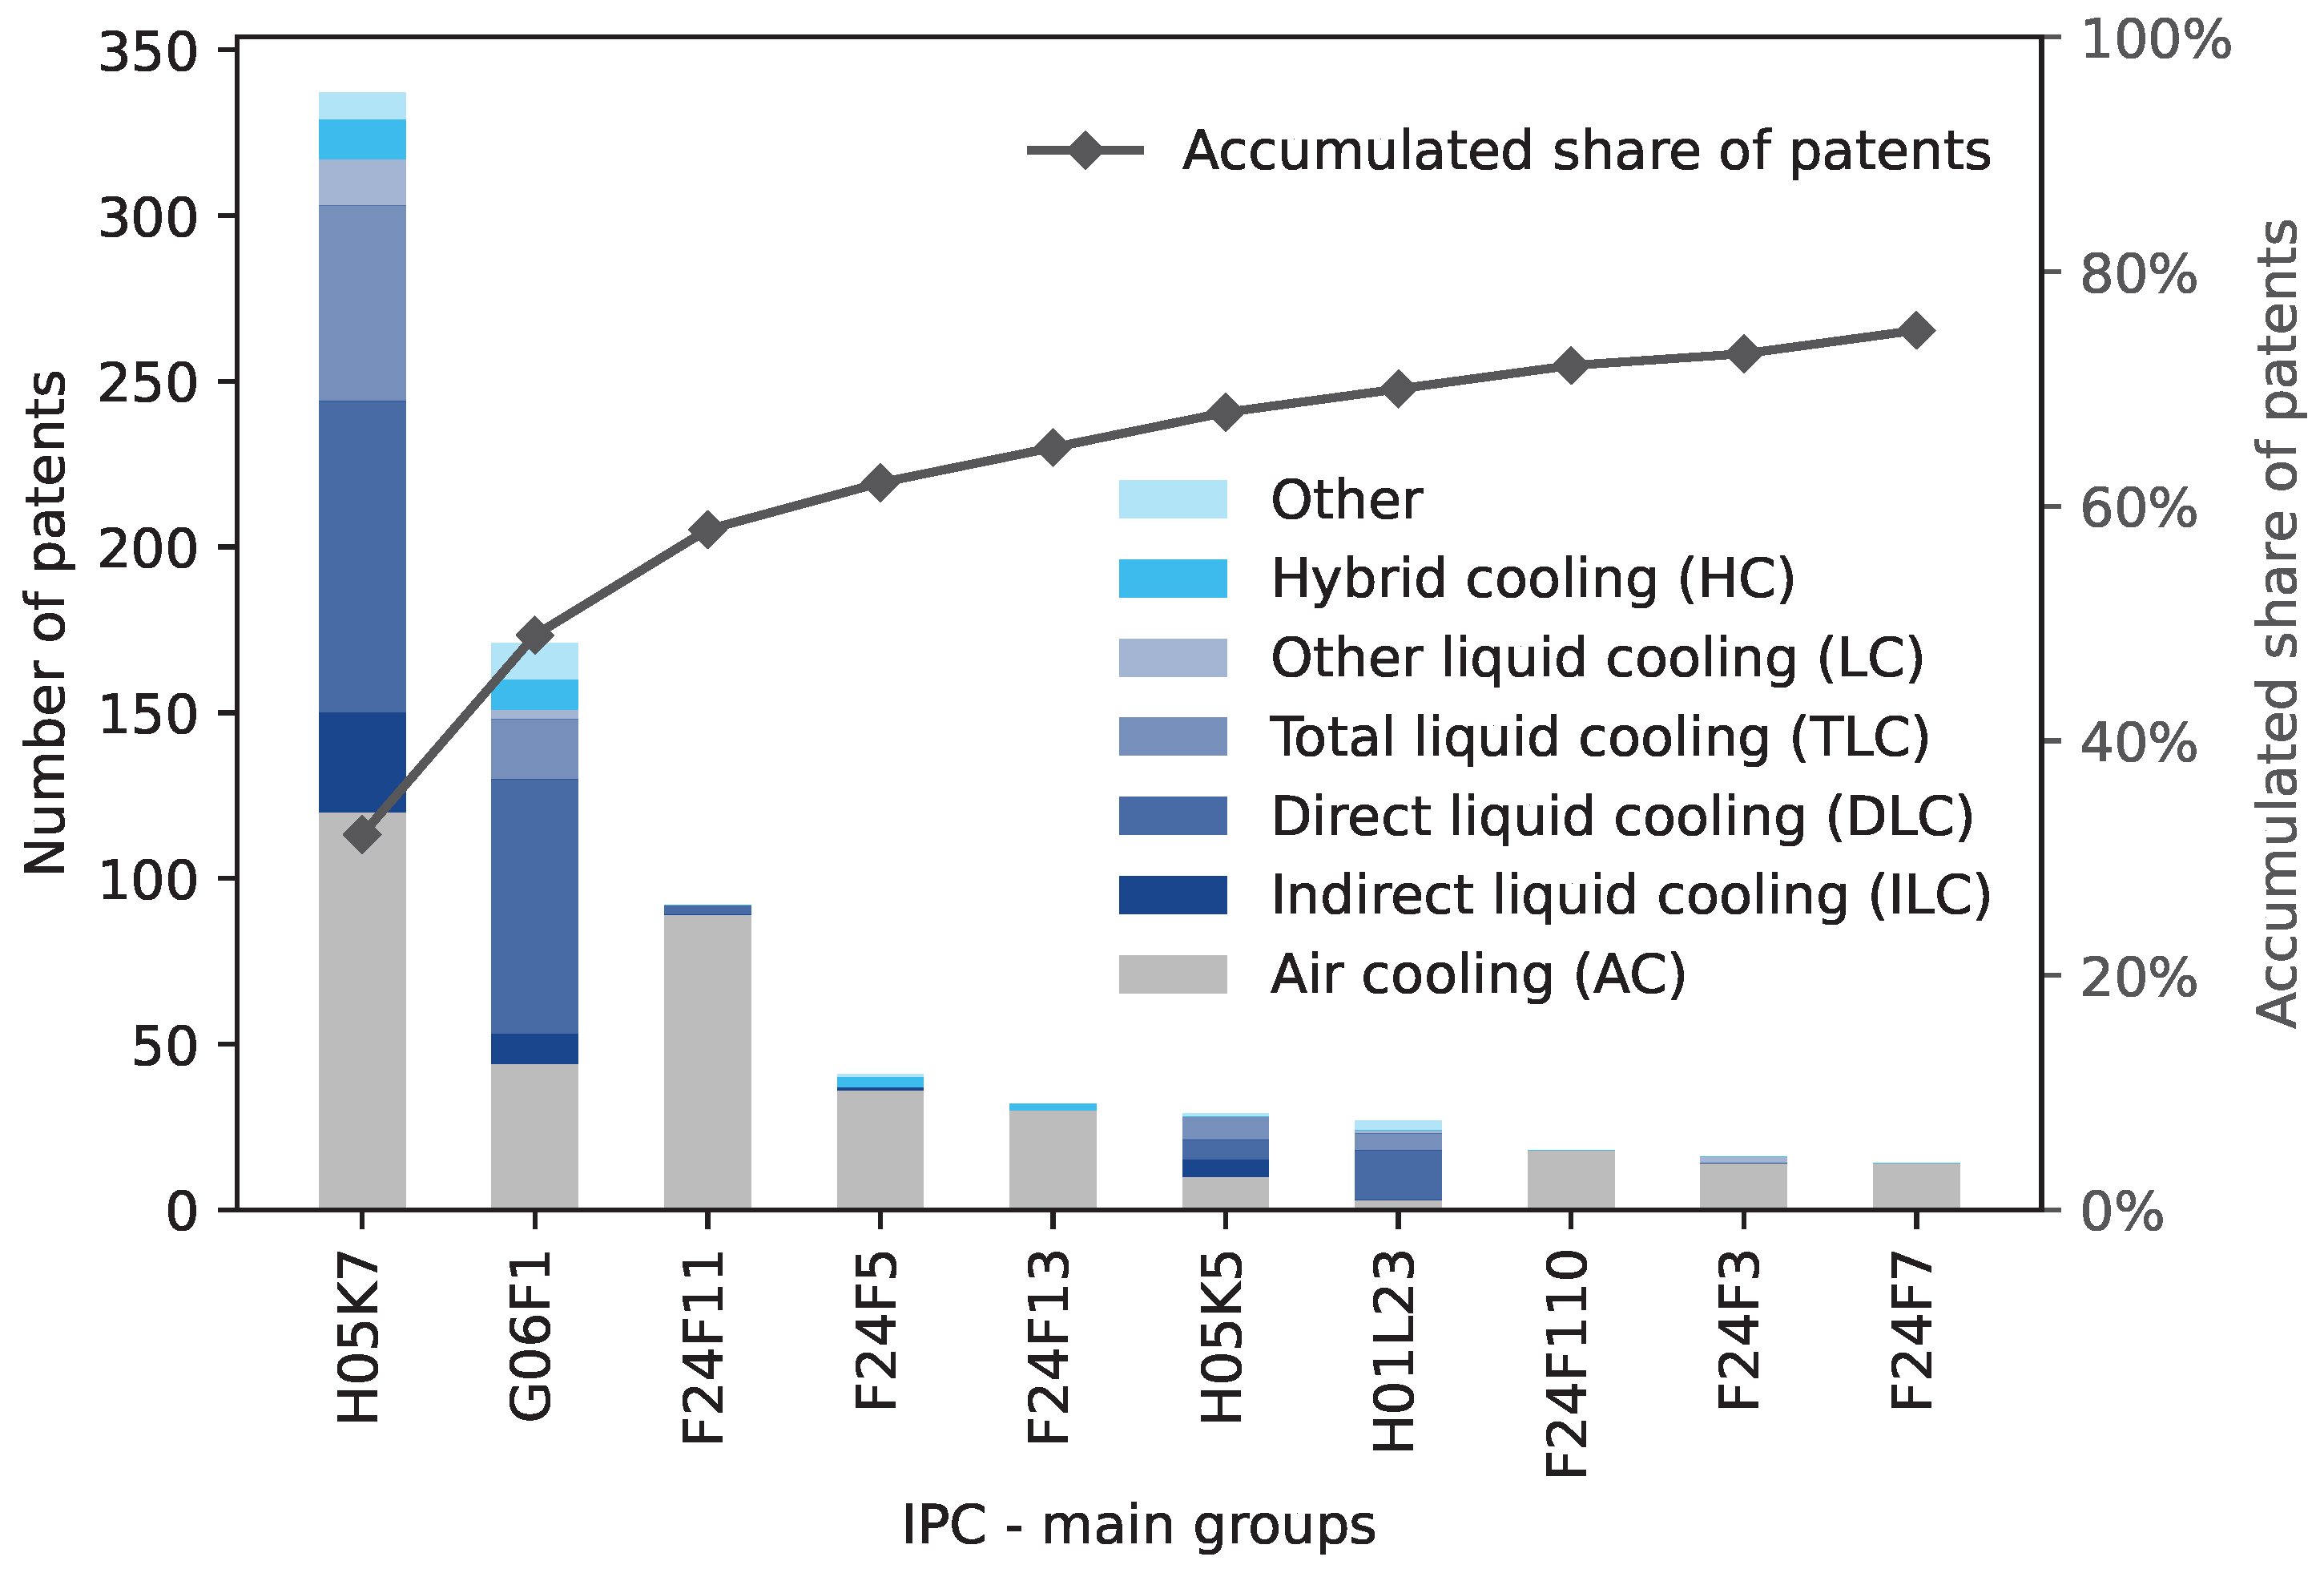
Figure 10 is showing the distribution of the 10 most often used IPC main classes in addition to Figure 7. The corresponding explanation of the main groups can be found in Table A4 in the appendix. A differentiation is furthermore made according to cooling technology. In addition, their cumulative share of all patents is included and amounts to 75 % of all main groups. The main groups H05K7 and G06F1 alone account for 49 % of all main groups. Most of the main groups are primarily characterised by air cooling, whereas H05K7, G06F1, H05K5 (Casings, cabinets or drawers for electric apparatus […]) and H01L23 (Details of semiconductor or other solid state devices […]) have a share of liquid cooling of between 58 and 78 % [54]. In these cases, the technology is characterised in the following descending order: direct, total and indirect liquid cooling. In the area of hybrid cooling and “Other”, H05K7 and G06F1 have the most patents.
Figure 10. Distribution of the 10 most common IPC main groups (nMG, relev. = 1040, nMG, relev., TOP 10 = 777); period: 2000 - 2023 (earliest priority year).
H05K7: Constructional details common to different types of electric apparatus […], G06F1: Details not covered by groups G06F 3/00-G06F 13/00 and G06F 21/00 […], F24F11: Control or safety arrangements, F24F5: Air-conditioning systems or apparatus not covered by group F24F 1/00 or F24F 3/00 [54].
Preprints 108398 g010
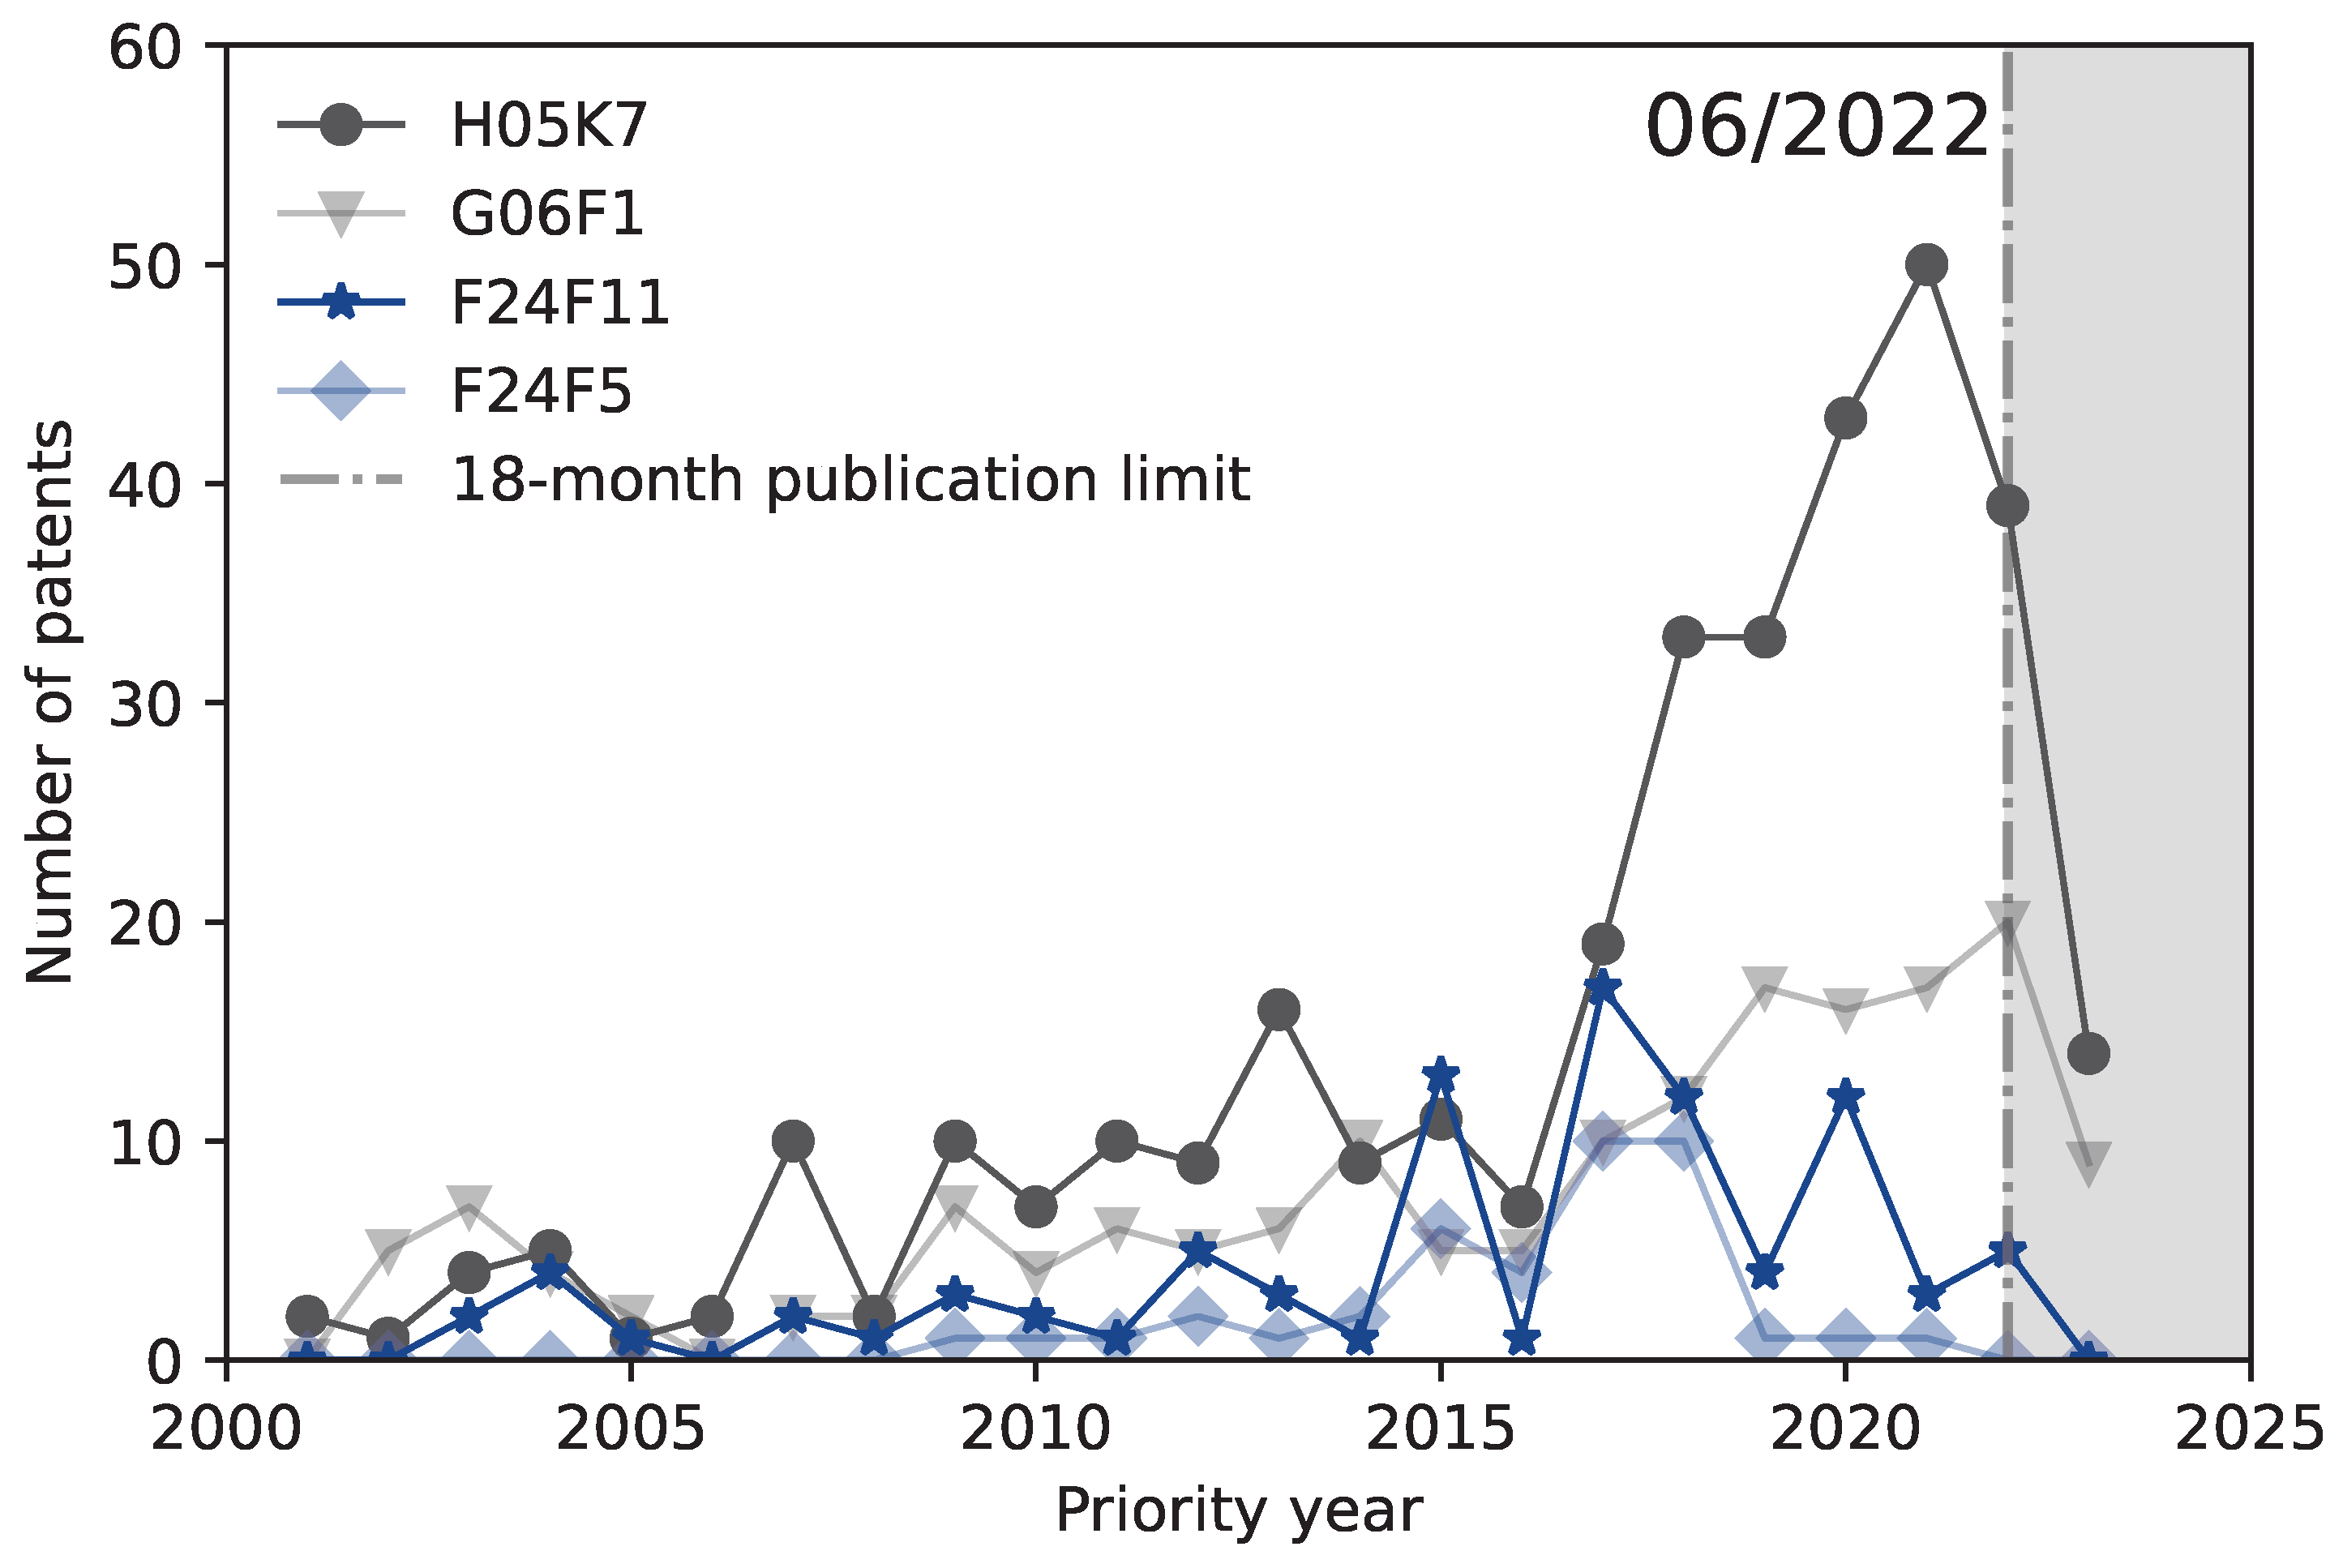
The development of patent applications over time for the four most common main groups is visualised in Figure 11. They account for 82 % of the TOP 10. In addition, the black dashed vertical line shows the 18-month limit for the completed publication of a patent. For all patents with an priority date before mid-June 2022, it is important to emphasise that not all patents have yet to be published. The result is that 49 and 70 % of all patent applications in the first two main groups are published before the 18-month-limit. This does not apply to patents from subclass F24F. Over the past 22 years, the ranking of the main groups has tended to remain the same. For the first time, more than 10 patent applications per year were achieved by H05K7 in 2007. Significant decreases can be seen in 2008 and 2010, especially for H05K7. In addition, the TOP 4 reveal a dip to almost zero in 2016. Thereafter, patent activity increases significantly, with subclass F24F remaining at a low level close to zero. In the years from 2019, a total of 285 patents were registered in the TOP 4, accounting for 44 % of all registrations since 2001.
The initial decline in patent applications is the result of the general global economic situation following the financial crisis in 2008. The subsequent sharp rise in H05K7 in particular can be explained by a significant increase in the proportion of liquid cooling in general (see Figure 5) and the high proportion of liquid cooling in this main group (see Figure 10). This is the result of the increasing need for liquid cooling for high-performance applications such as AI or complex simulation calculations and the trend towards further increases in the thermal design power (TDP) expectations of CPUs and GPUs. The main reason why the two main groups from the subclass F24F tend to rank behind the first two main groups at the end of the period under review is due to the significant proportion of air cooling (88 to 97 %). At the same time, the general trend showed a decrease in patent applications in the field of air cooling.
Figure 11. Development of patent applications over time for the four most predominant main groups (nMG, relev., TOP 4 = 641); period: 2000 - 2023 (earliest priority year).
Preprints 108398 g011
To illustrate the significance of the individual main groups of the TOP 10 and their occurrence in combination with other main groups, Table 6 presents their appearance independently of other main groups on the main diagonal. A main group is considered independent if a patent uses only one main group and this occurs once. The secondary diagonal in turn indicates the absolute frequency of cases in which two different TOP 10 main groups occur together in a patent. All other main groups as well as multiple occurrences of a TOP 10 main group in a patent are not taken into account.
With regard to the TOP 10 main groups, F24F5, F24F7, F24F11, G06F1, H05K5 and H05K7 were used individually. With the exception of H01L23, all other TOP 10 main groups are only used in combination with other TOP 10 main groups. The most common independent main groups are H05K7 (184), G06F1 (77) and F24F11 (10). With regard to a combination with other TOP 10 main groups, mainly H05K7 (8) as well as F24F3, F24F5 and F24F11 (7) are used. The most identified combinations are G06F1 / H05K7, F24F11 / H05K7 and F24F5 / F24F11 as well as F24F5 / F24F13.
The reason why certain main groups can occur independently is probably because they are sufficient to describe a cooling technology in terms of their content alone (see Table A4 in the appendix). The fact that the TOP 3 main groups in particular occur most often alone is due on the one hand to their significant importance for cooling technologies and their frequent appearance. In cases where there is a combination with other main groups, the main groups can complement each other. On the other hand, it would also be conceivable to integrate additional main groups in order to make it more difficult to find and clearly categorise them. Main group H01L23 deals with semiconductors and other fixed devices, which in contrast to the other TOP 10 main groups is very close to the actual server components and the original heat source and is less associated with the cooling of the corresponding components. For this reason, it probably does not occur in combination with the other TOP 10 main groups. In terms of combinations, there is a concentration in the area of section F. Three different main groups can be found here, which are characterised above all by their high proportion of air cooling. This makes them particularly suitable for combined use. In contrast, the main groups G06F1 / H05K7 are characterised above all by their high proportion of liquid cooling. These two main groups cover the area of computer architecture on the one hand and supporting superstructures on the other, which complement each other ideally with regard to liquid cooling. The combination of main groups F24F11 and H05K7, on the other hand, presumably contributes to the proportion of air cooling in main group H05K7.
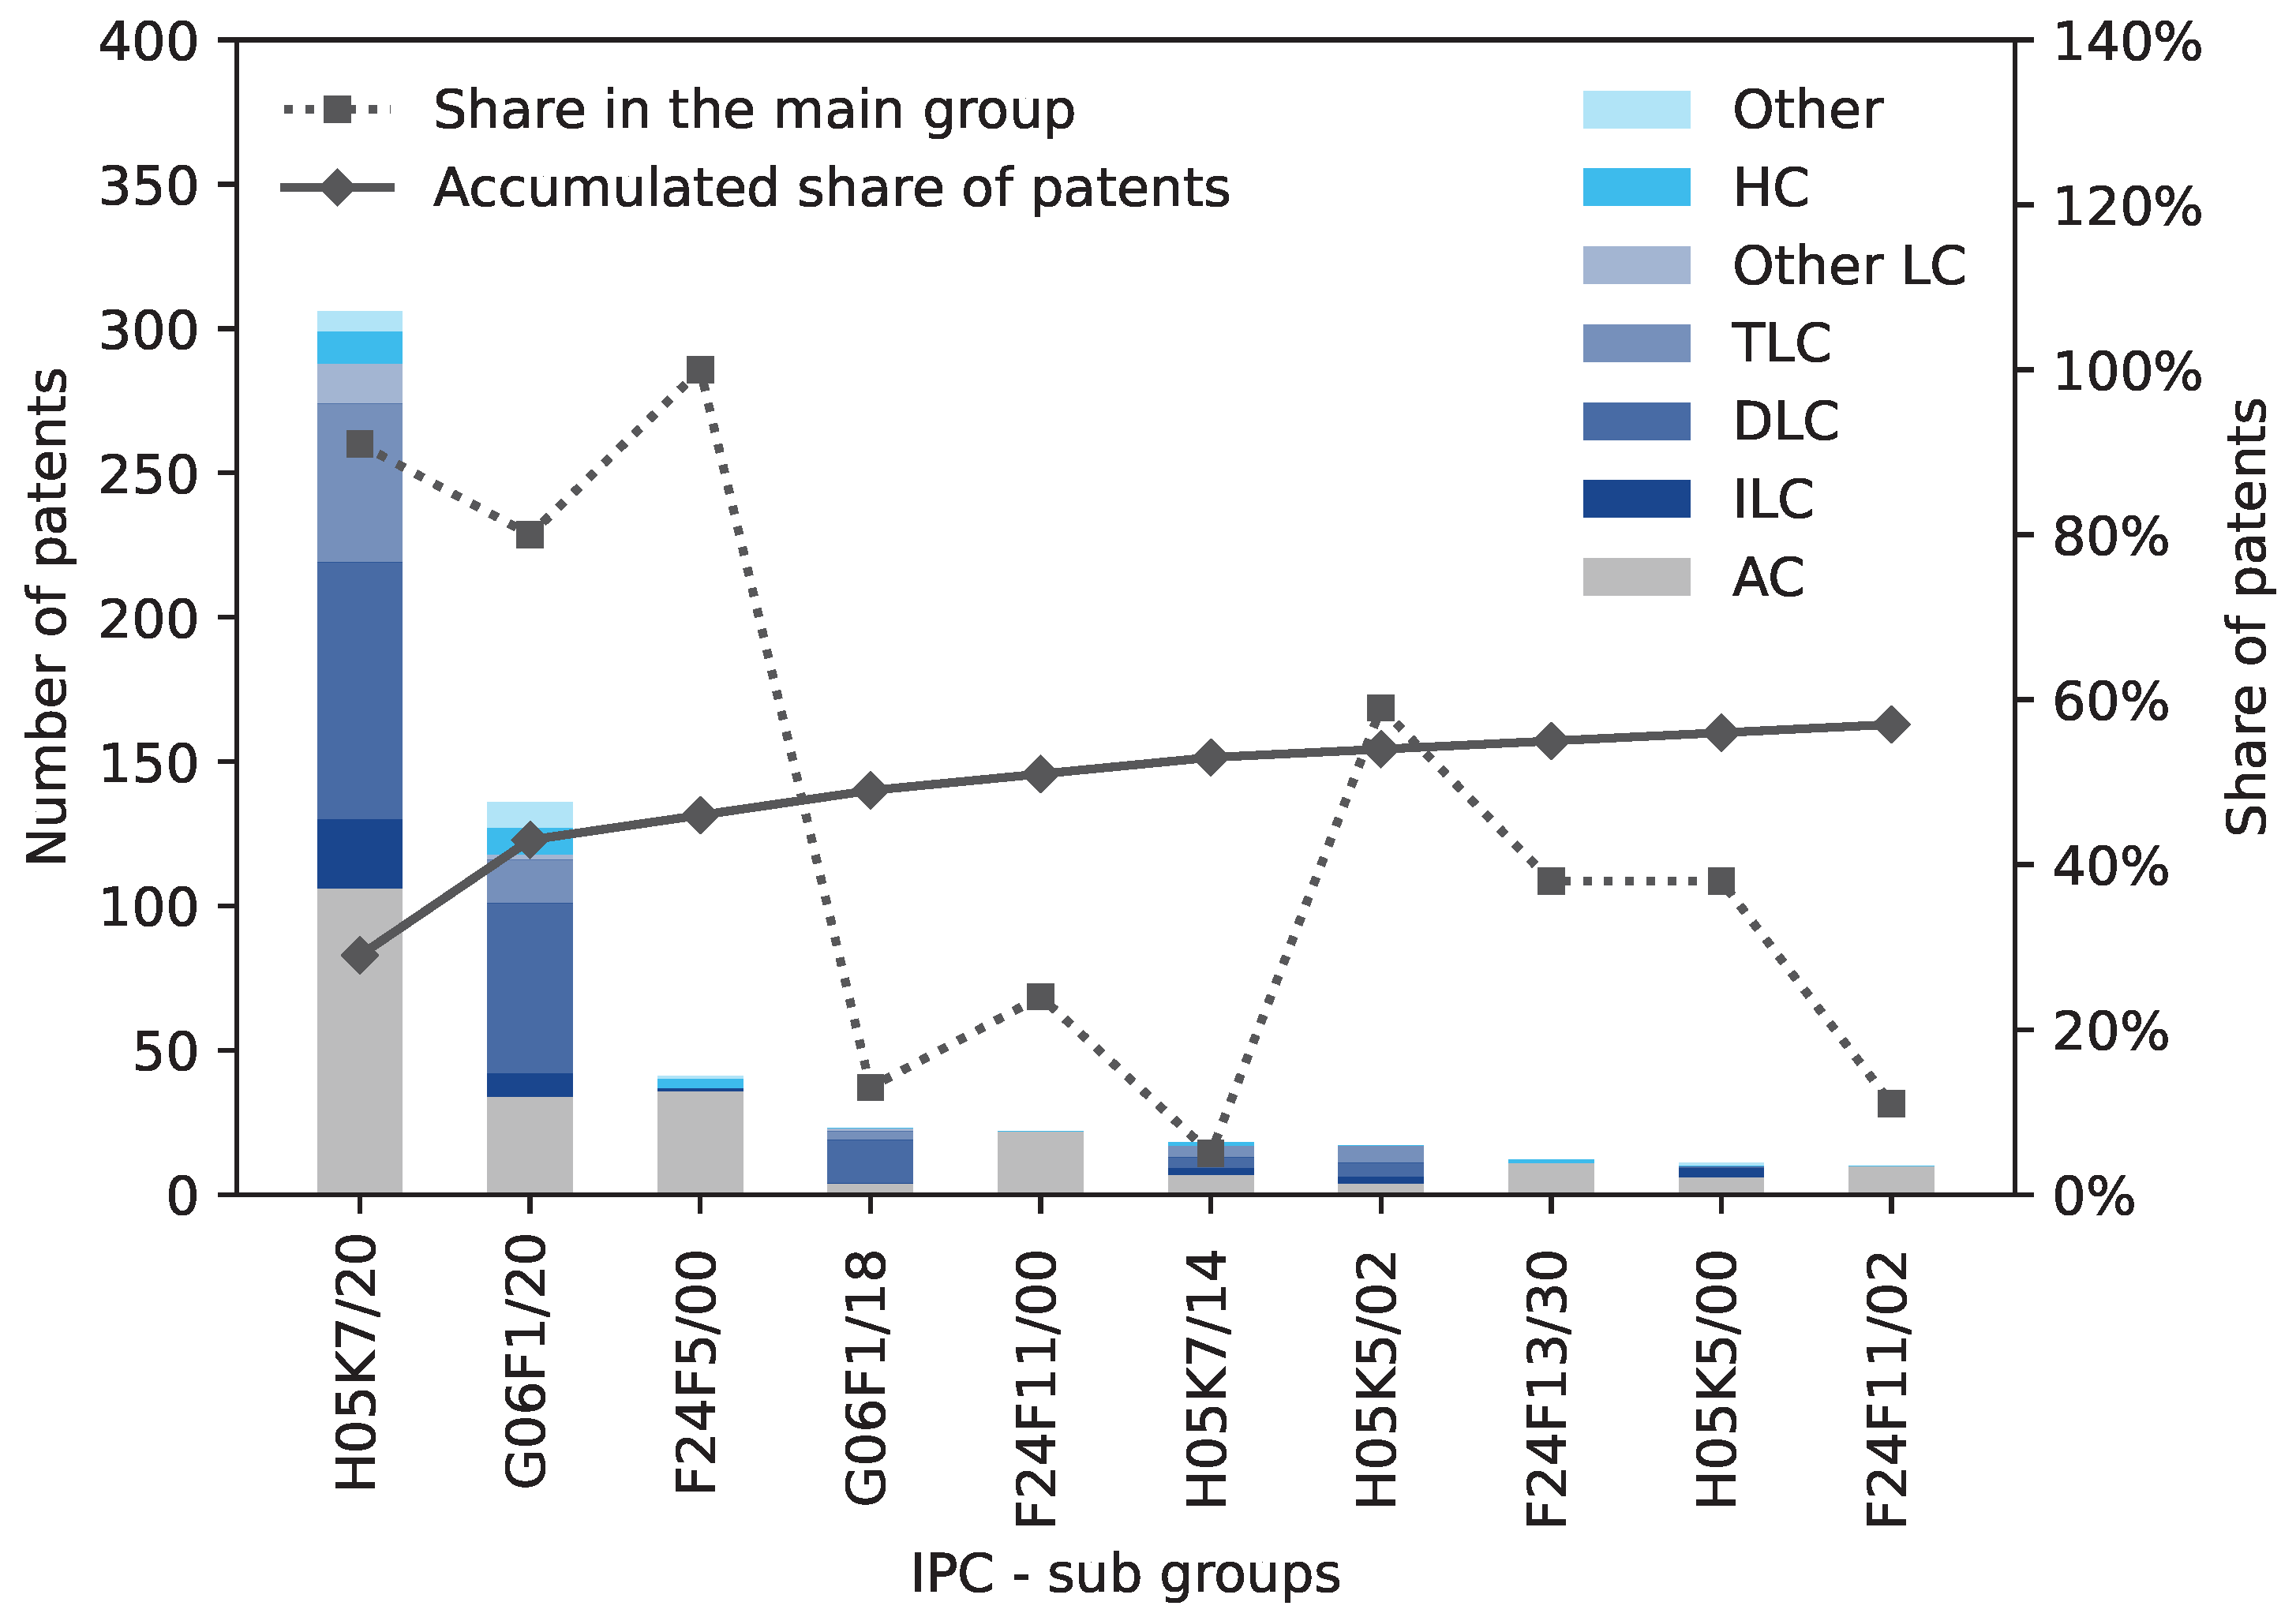
Figure 12 illustrates the distribution of the TOP 10 subgroups. The share of the sub group in the main group is also indicated. In this case, the TOP 10 represent 57 % of all patents in the sub group. The first three subgroups show a high degree of intersection with the main group - shares are in the range of 80 to 100 %. The subgroups, whose main groups also deal with cooling technologies other than air cooling, show a high proportion of liquid cooling. These include in particular H05K7/20, G06F1/20, G06F1/18, H05K7/14 and H05K5/00. The first two represent 43 % of the TOP 10 results and embody the majority of the patents in the TOP 10 subgroups.
All patents in the subclass F24F are predominantly composed of air cooling, which is due to their focus on air conditioning etc. In contrast the two most common main groups in particular account for a large proportion of liquid cooling (see Figure 10). The reason for this can be seen in the TOP 10 distribution of the subgroups in Figure 12. As subclass F24F is explicitly limited to cooling with the aid of air, air-based solutions are presumably primarily registered in this subclass. The subordinate frequency of the other subgroups from sections H and G is presumably due to the fact that they do not deal directly with direct cooling, but rather with the supporting technologies required for this. For example, H05K7/14 and H05K5/02 address “mounting supporting structure” and “casing details”.
It is therefore also possible the allocation of search terms and cooling technologies by section based on the technological distribution of cooling technologies in the TOP 10 main groups and subgroups (Table 4 and Table 5). Section F is dominated by main groups and subgroups, which are primarily technologies focussing on air cooling. In contrast, the main and subgroups of sections G and H have a high proportion of liquid cooling, but not exclusively.
Figure 12. Distribution of the 10 most common IPC sub groups (nSG relev. = 1040, nSG, relev., TOP 10 = 596); period: 2000 - 2023 (earliest priority year).
H05K7/20: … Modifications to facilitate cooling, ventilating, or heating, G06F1/20: … Cooling means, F24F5/00: Air-conditioning systems or apparatus not covered by group F24F 1/00 or F24F 3/00, G06F1/18: … Packaging or power distribution.
Preprints 108398 g012
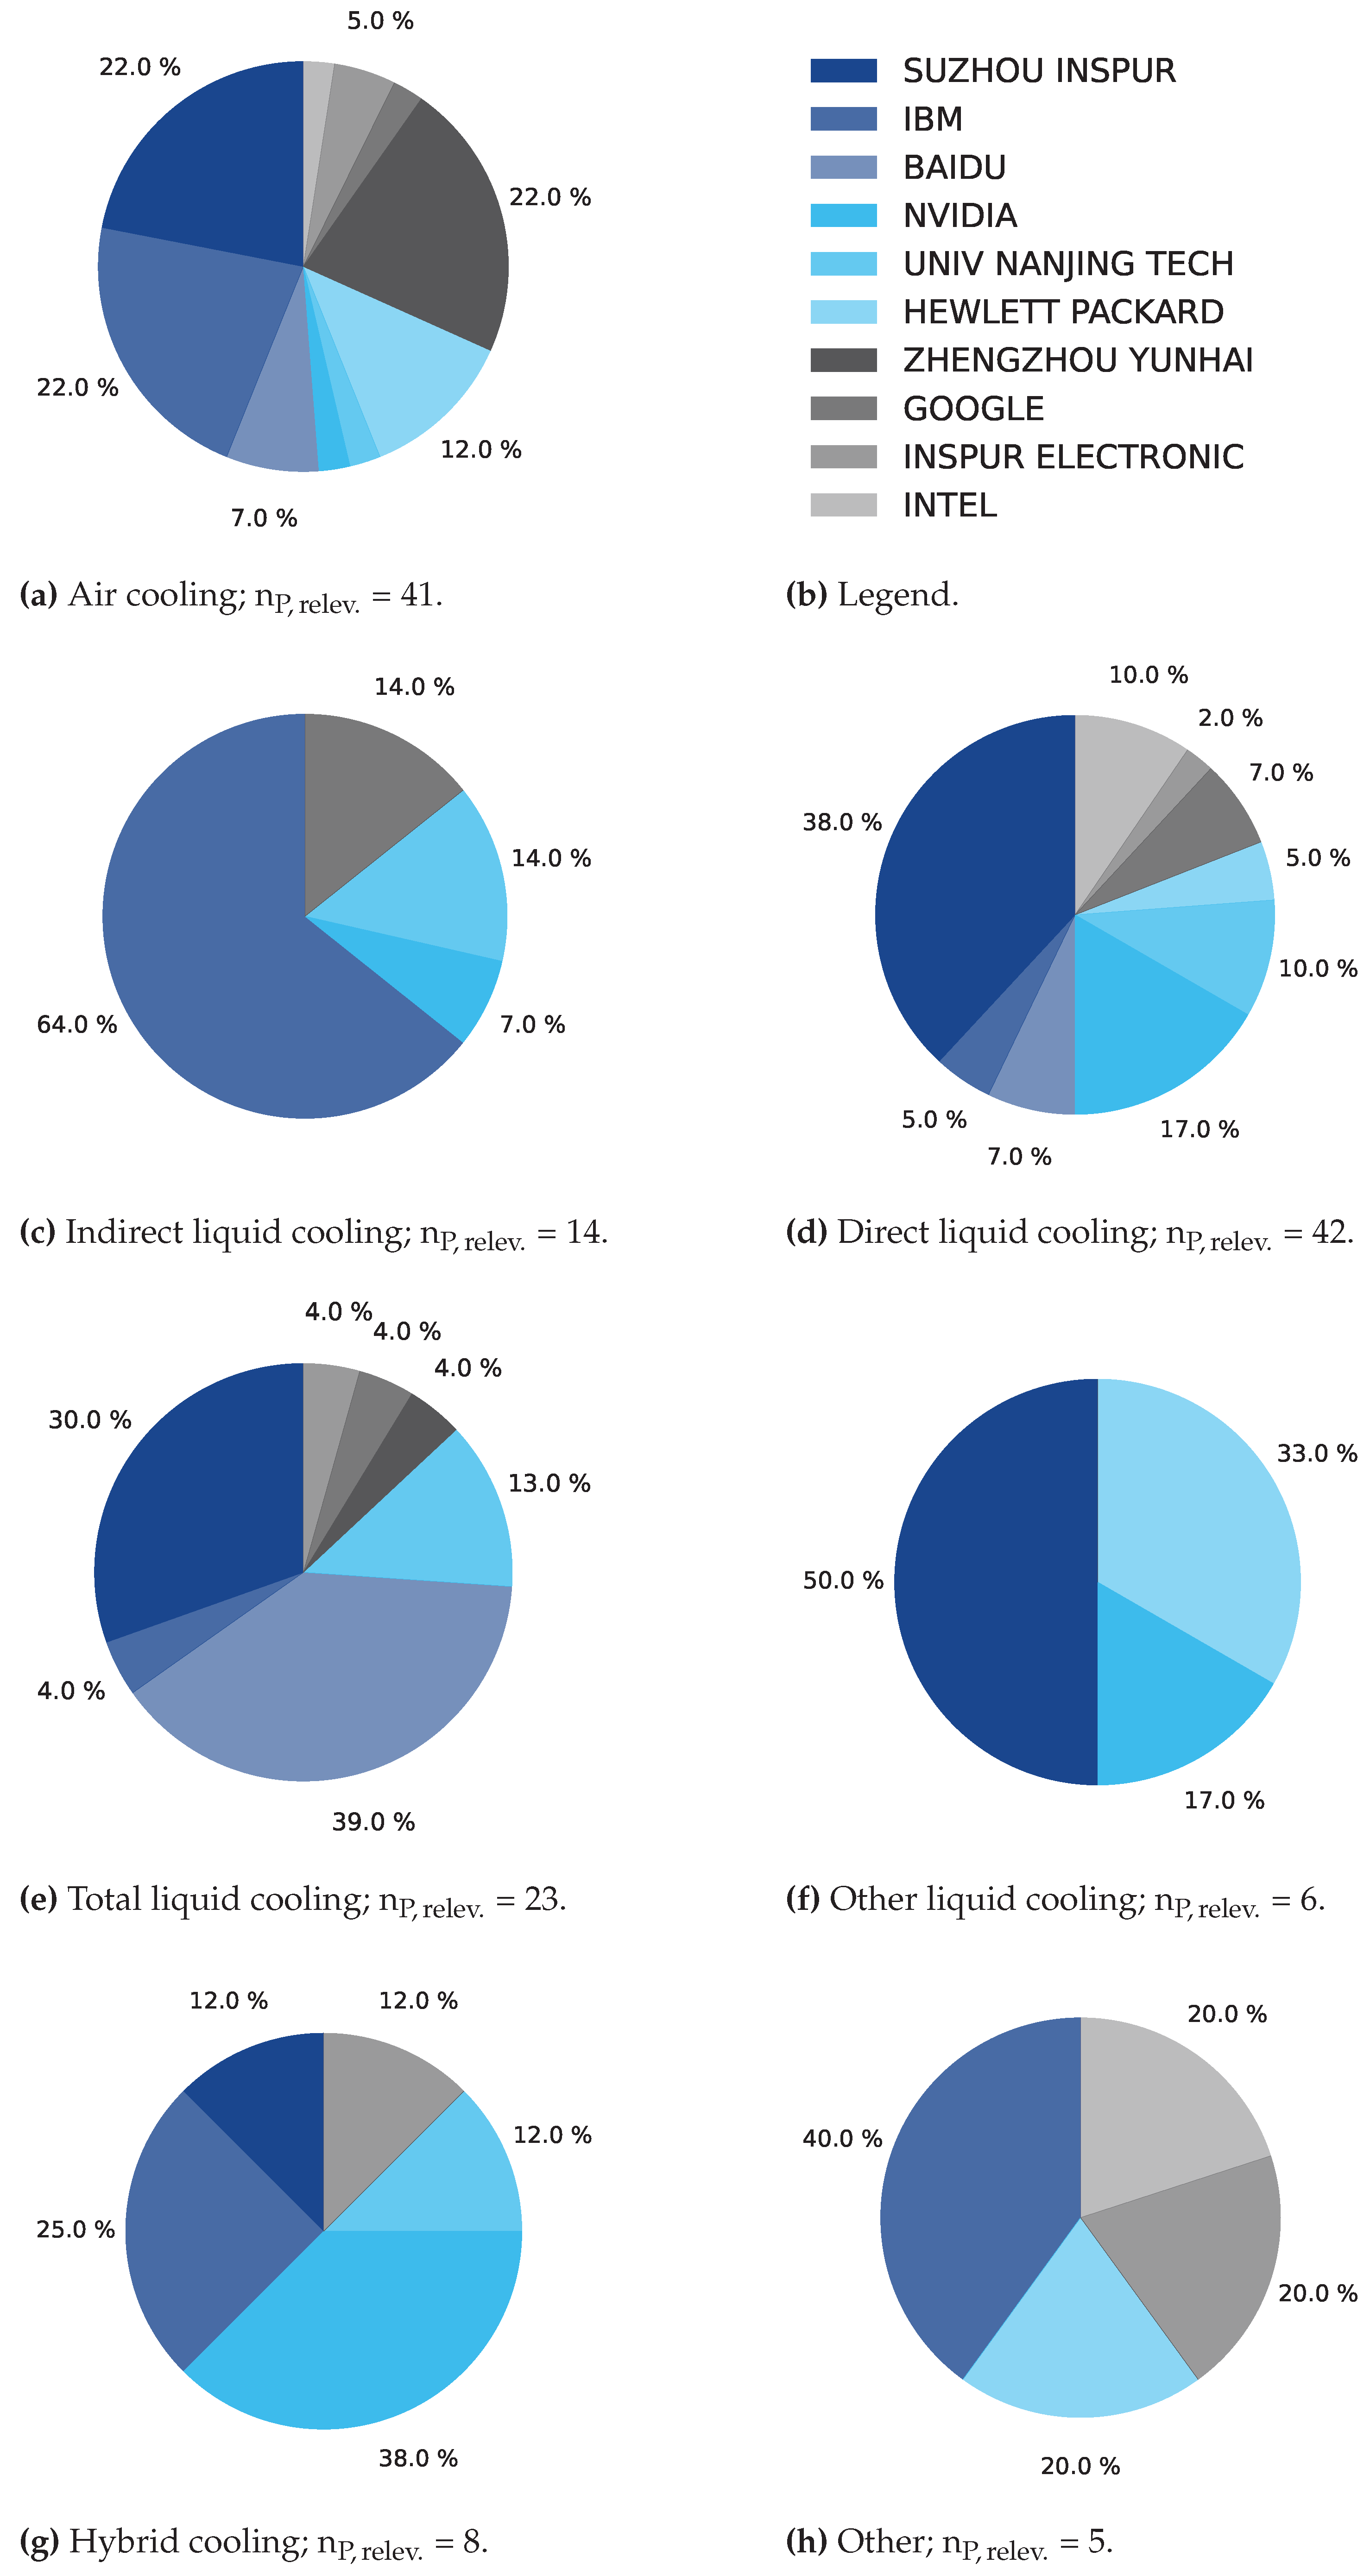
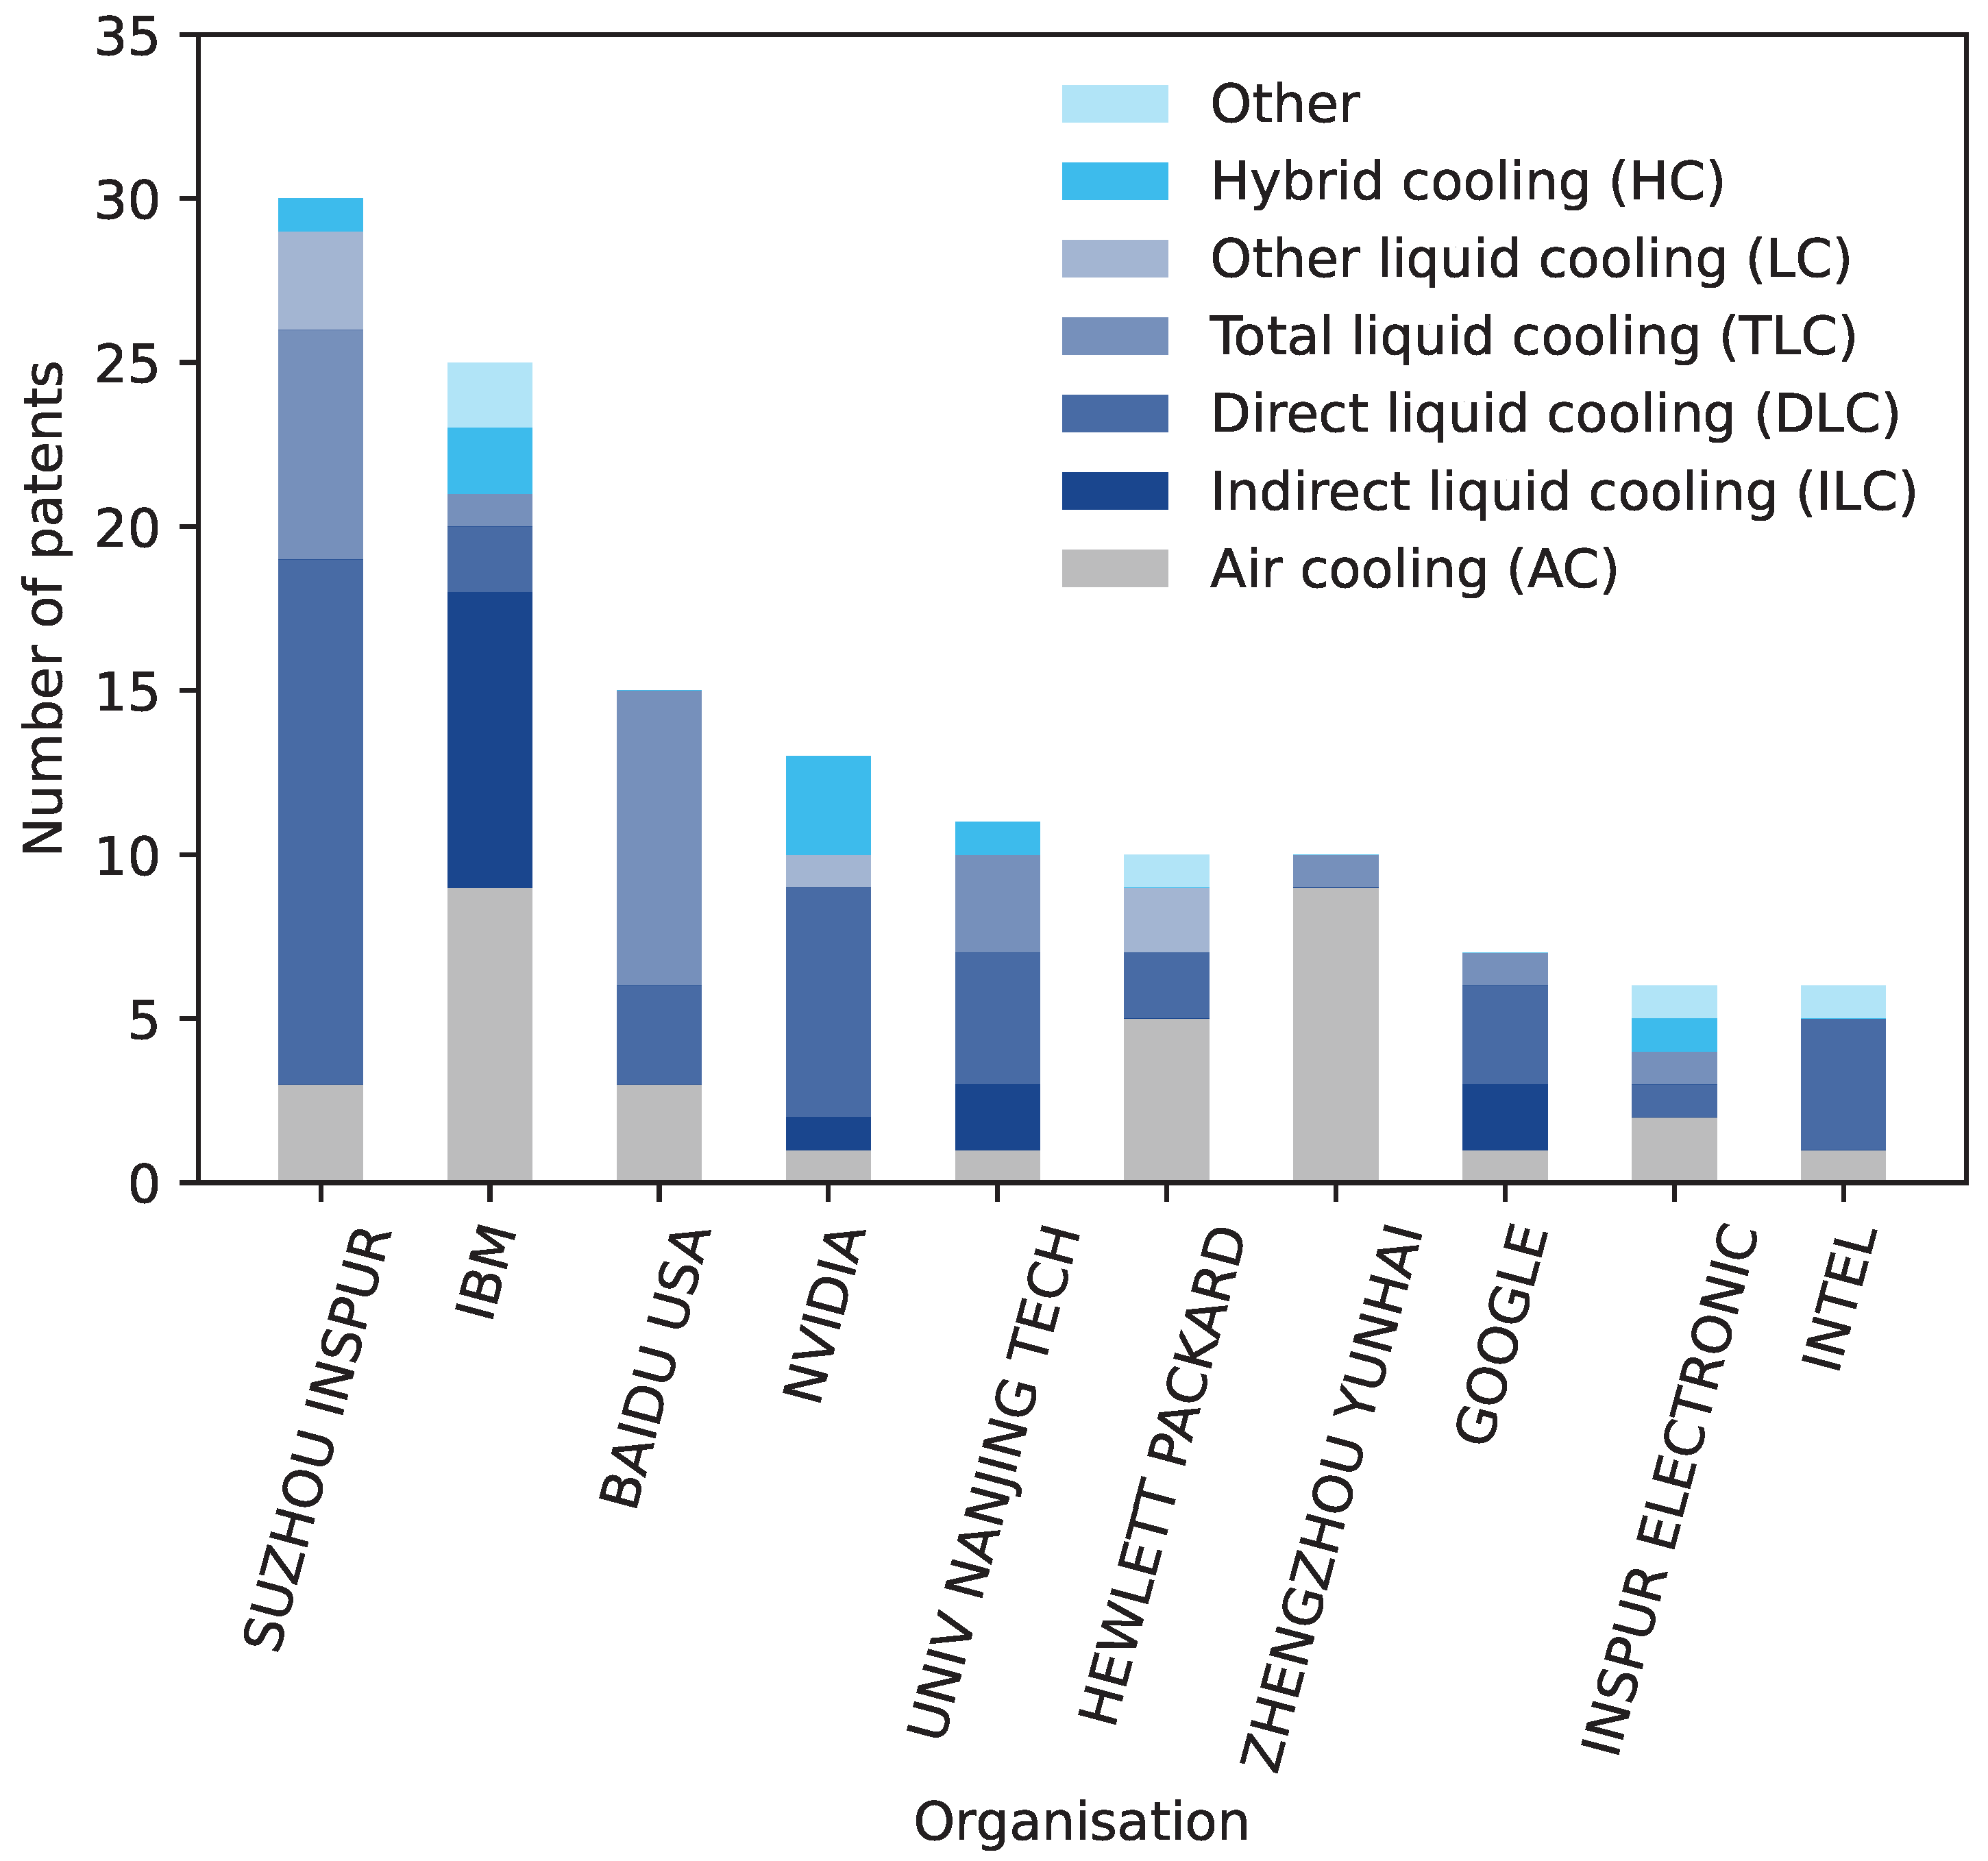
In addition to the countries of origin, it is also possible to differentiate according to the applicant’s organisation. The TOP 10 most frequently listed organisations, including the technology structure, are shown in Figure 13. The associated distribution by cooling technology is provided in Figure A2 in the appendix. The companies are from the USA or China, and the technological focus is mostly on liquid cooling. They account for 22 % of the patent activities of all identified companies. In terms of patents, NVIDIA, Univ. Nanjing Tech, Google and Intel in particular have a high proportion of different liquid cooling solutions. At IBM, on the other hand, the focus is on indirect liquid cooling using RDHX in addition to air cooling. With regard to direct liquid cooling, Suzhou Inspur has the largest share, whereas in total liquid cooling Baidu has the largest contribution. The chip manufacturers listed in the TOP 10, NVIDIA and Intel, have a high proportion of direct liquid cooling. In contrast to Intel and Nvidia, AMD is not listed at all in the patent results. Further globally active server manufacturer are Lenovo (5) and DELL (2).
The composition of the TOP 10 companies in Figure 13 shows a concentration of Chinese and American companies. It corresponds essentially to the country distribution in Figure 9. The “BECH-Index” analyzes the demand capacity for business-to-business information technology and related services worldwide [57]. The USA and China in particular are in the top two places, which explains their high demand for IT technologies. At the same time, this also results in a high concentration of companies in these countries that serve this demand. The high proportion of liquid cooling used by CPU and GPU manufacturers can be explained by the trend towards increasing TDPs, which can no longer be cooled reliably with air alone from a certain performance range. The fact that IBM in particular has the highest proportion of indirect liquid cooling results from its early activities and fundamental research in this area (see [58]). The search engine providers and hyperscalers also have a high proportion of liquid cooling. This is the result of their activities in the field of AI, which requires specialized high-performance hardware, which in turn reaches its limits with air cooling. Nevertheless, most of the applications that are run on the server are not computationally intensive programmes.
In order to be able to classify the patent activities of the TOP 10 organisations, Table 7 lists all their patent applications for the period 2013 - 2023. In contrast to the targeted search for patents in the field of data center cooling, the search period for the general search could not be extended beyond the year 2013. The ratio can be calculated on the basis of the two patent numbers, whereby these are given in per mille due to the different orders of magnitude. For the most part, the ratio is less than one per mille. This threshold is only exceeded by the following companies in descending order of ranking: Baidu (14.91 ‰), Suzhou Inspur (2.12 ‰), NVIDIA (4.78 ‰) and Inspur Electronic (1.21 ‰).
Baidu, Suzhou Inspur, NVIDIA and Inspur Electronic show the greatest degree of specialisation in the field of data center cooling based on their patent applications by exceeding the specified threshold value (> 1.00 ‰). There is no case in which companies have a specialization share in the percentage range, indicates that cooling is of minor importance for the business. The reason that Baidu in particular has such a high proportion of patents on cooling technologies compared to the company’s general activities, and that direct and total liquid cooling in particular accounts for the largest share, can be seen, among other things, in the content of its company reports [59,60,61]. The research and development of suitable cooling technologies for use in data centres is of great importance in this context, and the use of direct and total liquid cooling is already being tested extensively in data centres [61].

5. Conclusions and Outlook

The secure and appropriate cooling of a data center’s IT infrastructure at all times is of fundamental importance for its operation. At the same time, cooling can account for a large proportion of total energy consumption. The optimisation of this area in particular has contributed to a improvement of the power usage effectiveness (PUE). In addition to the further development of existing concepts such as air cooling, which is the current standard solution for server cooling, intensive research is being carried out into high-performance alternatives, such as liquid cooling. This study aims to investigate the development in the field of data centre cooling. Therefore the patent applications in various patent databases are a comprehensive source of data for determining research developments in this area.
This source of information has not yet been used systematically to investigate technological developments in the field of data center cooling technologies. As part of this study, the European Patent Office database was examined using Espacent. Suitable keywords and logics were used to determine relevant patents, which were iteratively optimised on the basis of the search results. The information obtained was then classified in order to visualise and analyzed the technological developments over the last two decades. The technological focus of the developments in the past as well as the future trend can be derived from this. In addition to categorisation by cooling technology, the countries of origin, patent offices, applicants and patent classes are included in the analysis. Furthermore, a differentiation was generally applied according to the cooling technology.
The patent analysis of data center cooling technologies at server / rack / IT room level revealed a trend towards an increase in the importance of liquid cooling due to a rising number of patent applications. In this context, the focus was primarily on the general classification of technological approaches for cooling data centres, such as direct or total liquid cooling. In addition, possible characteristics of the individual technology options were to be determined. They include, for example, the medium used as a coolant (water, single-phase or two-phase fluids, etc.).
The investigation carried out here revealed two things in particular. On the one hand, the number of patents registered in the field of liquid cooling has increased rapidly, especially in the last 10 years. In contrast, patent application activities in the field of air cooling declined in the same period. Despite the contrary trend, however, total annual patent applications of server cooling technologies increased. This highlights a trend switch in cooling technology, which also confirms the expectations made. Besides this, the research results confirm the assumption regarding the distribution of the various technological approaches within liquid cooling with direct liquid cooling as a key technologie. Total liquid cooling is a technological approach that faces a number of challenges. These include the different system design of the racks and the highly specialised cooling fluids, which can sometimes be hazardous to the environment. In both cases, the focus is primarly on single-phase coolants, while two-phase coolants make up a small part. Nevertheless, the proportion of total liquid cooling has increased significantly over the period under review, which is presumably due to the further development of cooling liquids. The area of two-phase coolants in combination with direct or total liquid cooling can be a technology of the future by utilising the enthalpy of vaporisation to increase the cooling capacity. Another approach could become increasingly important in the future - the combination of different cooling approaches in the form of hybrid cooling.
Even though hybrid cooling was rarely mentioned directly, most of the patents in the field of liquid cooling could be allocated to this area. Although the relative share has not changed much, the absolute number of patent applications has increased significantly (+600 % from the period 2004 - 2008 to 2019 - 2023). The great advantage of hybrid cooling is the targeted combination of the benefits of the different cooling approaches. If the TDP limit of 500 or 1000 W for CPU and / or GPU is exceeded in the future, liquid cooling must be used with more recent server setups. However, this limit does not apply to applications that do not require or have a high power density - air cooling is still sufficient here. In particular, the use of direct liquid cooling in combination with air or immersion cooling enables high-performance CPUs and GPUs to be cooled precisely, reliably and efficiently. In the coming years, the combination with air cooling, which is already a proven technology, can be suitable. These or modified forms of cooling can be further developed and optimised in the future.
On the other hand, the assumptions regarding the importance of the USA in patent applications in the area of data centre cooling were only partially confirmed. A significant proportion of patent applications are based on applications from companies from the USA or were filed at the US Patent Office. However, it turned out that the majority of patent applications were filed by Chinese organisations or at the Chinese Patent Office. As a result, the 10 most applicants identified only come from these two countries. In order to gain an up-to-date understanding of current developments, both regions should be observed in particular, as this is where most of the research activities based on patent applications can be observed.
This is in line with the general market situation, especially from the perspective of the most important component manufacturers and end users. The most important chip (INTEL, NVIDIA and AMD) and server manufacturers (HP, DELL, Cisco etc.) are located in the USA, while some of the largest data centre operators (Google, Baidu, etc.) also come from these two countries. Due to their great importance as suppliers and users of server hardware and the direct link to the issue of cooling, they will continue to play a major role in the coming years.
Furthermore, the most important sections according to the IPC for data centre cooling technologies were identified. These are in detail “Electricity” (42 %), “Mechanical Engineering” (29 %) and “Physics” (27 %), which is due to the high degree of similarity in content between the thematic focal points of the patents and cooling technology. Based on the patent analysis, we anticipate that these patent classes will continue to be the focus of patent applications in this field in the future. However, it also became apparent that “Mechanical Engineering” in particular has a special focus on air cooling, while the other two sections do not only contain technologies based on liquid cooling. Nevertheless, it can be assumed that all approaches based on coolants will continue to be found in “Electricity” and “Physics”.
This study was able to identify the most important applicants and patent classes as well as technologie developments in the area of data center cooling. On the basis of this study, past developments can be confirmed and possible future research priorities can be identified. At the same time, the relevant main groups and subgroups were identified depending on the cooling technology, which will support further research and investigations in this area.
The qualitative analysis of cooling technologies was carried out using the European patent database. Other “IP5” databases should be analysed to validate the results. In particular, the Chinese and American patent databases should be used to validate the results. In addition, the other patents that were identified with the more general search terms for coolant and cooling can be analysed in greater depth. Moreover, not only the simple family matches but the totality of all patent search results should be used for validation. However, this would probably lead to a misinterpretation of the results, especially if the entirety of a patent family were to unilaterally change the share of a technology. This study did not include a qualitative classification and a corresponding weighting of the results, which is why the patents identified could be categorised in future with regard to their technological significance and impact on the cooling of data centers.
The study uses patent analysis to investigate the historical evolution and potential future technology paths in the field of data center cooling, focusing on server and computer room levels, in order to meet the increasing cooling demands driven by higher performance and power density of components.
Author Contributions

Conceptualization, B.O.; methodology, B.O., P. R.; validation, B.O.; formal analysis, B.O.; investigation, B.O.; data curation, B.O.; writing—original draft preparation, B.O.; writing—review and editing, B.O., P.R. and P.M.W.; visualization, B.O.; supervision, P.R.; project administration, P.R.; funding acquisition, B.O., P.R. All authors have read and agreed to the published version of the manuscript.

Institutional Review Board Statement

Not applicable.

Informed Consent Statement

Not applicable.

Data Availability Statement

Dataset available on request from the authors.

Acknowledgments

This paper was written in the framework and support of the master’s student Elias Almojahed, who wrote his master’s thesis under the supervision of Benjamin Ott.

Conflicts of Interest

The authors declare no conflict of interest. The funders had no role in the design of the study, in the collection, analyses, or interpretation of data, in the writing of the manuscript, or in the decision to publish the results.

Nomenclature

Abbreviations

AC Air cooling
AE American English
AI Artificial Intelligence
API Application Programming Interface
BE British English
CN China
CPC Cooperative Patent Classification
CPU Central processing unit
CRAC Computer Room Air Conditioner
CRAH Computer Room Air Handler
DLC Direct Liquid Cooling
ECLA European Classification
EPO European Patent Office
GPU Graphics processing unit
HC Hybrid Cooling
ILC Indirect Liquid Cooling
IPC International Patent Classification
LC Liquid Cooling
MG Main Group
Organ Organisation
P Patent
PO Patent Office
PUE Power Usage Effectiveness
rel Relevant
RDHX Rear door heat exchanger
SG Sub Group
TDP Thermal Design Power
TLC Total Liquid Cooling
USA United States of America
USPC United States Patents Classification
WIPO World Intellectual Property Organization

Appendix A

Table A1 contains the distribution and number of patents in Figure 3. In Table A2 are additionally the distribution and number of patents from Figure 6. Table A3 contains the distribution and number of patents in Figure 7. The definitions associated with the main IPC groups can be found in [54]. Figure A1 includes the technological allocation of the country distribution for Figure 9. In Figure A2 the technological allocation of the TOP 10 applicants for Figure 13 are presented. The definitions of the main IPC groups with at least 10 patent applications in the field of data centre cooling are listed in Table A4.
Table A1. Additional data for Figure 3; period: 2000 - 2023 (earliest priority year).
Categorie Cooling technology Cooling technology specification Technology specification Patents
Duplicates1 34
Criterias are not fulfilled1 203
Air cooling CRAC 78
CRAH 9
Other 108
Liquid cooling Indirect liquid cooling RDHX 17
Other 14
Direct liquid cooling Cold plate Cold plate 85
Two phase2 16
Water2 12
Other 14
Other 20
Total liquid cooling Immersion cooling Immersion cooling 40
Two phase2 16
Other 6
Other 3
Other 17
Hybrid cooling 21
Other 20
1 Not relevant.
2 Listing of patents in which this classification occurs. In contrast to the other classifications, patents with supplementary classifications are also taken into account.
Table A2. Additional data for Figure 6; period: 2000 - 2023 (earliest priority year).
Cooling technology 2015 - 2017 2018 - 2020 2021 - 2023 2000 - 2023
Patents
Air cooling 51 60 14 195
Liquid cooling (ILC1) 2 3 3 31
Liquid cooling (DLC2) 12 54 77 147
Liquid cooling (TLC3) 3 17 44 65
Liquid cooling (Other) 1 5 8 17
Hybrid cooling 2 7 8 21
Other 3 4 3 20
1 ILC: Indirect Liquid Cooling. 2 DLC: Direct Liquid Cooling. 3 TLC: Total Liquid Cooling.
Table A3. Additional data for Figure 7; period: 2000 - 2023 (earliest priority year).
IPC section IPC main group Patents
A A61L2 1
B B01D46 3
B08B5, B23P15 2
B05B15, B05C1, B05C11, B05C13, B23P11, B25J19, B66C1, B66C13 1
C C23C14 2
C25D11 1
E E04F15 2
E04H5 4
E04B5, E05D15, E06B3 1
F F24F3 16
F24F5 41
F24F7 14
F24F11 92
F24F13 32
F24F110 18
F24F140 4
F25D23 8
F28D15 9
F24F1, F25B41, F28F9 5
F24D19, F25B39, F25D1, F25D17, F28D1 3
F04B49, F24H3, F25B49, F25D3, F28F7, F28F25, F28F27 2
F04D25, F04D27, F23N5, F24D3, F24D11, F24D17, F24F6, F24F12, F24J3, F25B1, F25B5, F25B15, F25B21, F25D31, F28B1, F28B7, F28C1, F28C3, F28D9, F28F1, F28F13 1
G G05B13 6
G05D23 13
G06F1 171
G05B15, G06F11 8
G06F19, G06F30, G06G7, G06Q10 4
G05B19, G06F9, G06F119, G06N3, G16Y40 3
G01K3, G01M1 G03G21, G05D27, G06F15, G06F17, G06F113, G06K9 2
G01K1, G01K7, G01K11, G01K13, G01M3, G01M10, G01M99, G01N25, G02B6, G05B17, G05B21, G05D3, G05D7, G05D13, G05D15, G05D16, G06F7, G06F8, G06F16, G06N20, G06Q50, G08B21, G16Y10, G16Y20, G16Y30 1
H H01L23 27
H01M10 10
H04L12 4
H05K5 29
H05K7 337
H01L25, H04L29, H01M50 3
H01L35, H02B1, H02G3, H04W4, H05K1 2
H01R24, H01R31, H02J7, H02J9, H02P27, H04L67, H04Q9, H04W84 1
Not specified N/A 1
Figure A1. Technological allocation of the country distribution; period: 2000 - 2023 (earliest priority year).
Preprints 108398 g0a1
Figure A2. Technological allocation of the TOP 10 applicants distribution; period: 2000 - 2023 (earliest priority year).
Preprints 108398 g0a2
Table A4. Definition of IPC main groups [54] with at least 10 patent applications in the field of data center cooling.
IPC section IPC main group Definition
F F24F3 Air-conditioning systems in which conditioned primary air is supplied from one or more central stations to distributing units in the rooms or spaces where it may receive secondary treatment; Apparatus specially designed for such systems (room units F24F 1/00).
F24F5 Air-conditioning systems or apparatus not covered by group F24F 1/00 or F24F 3/00.
F24F7 Ventilation.
F24F11 Control or safety arrangements.
F24F13 Details common to, or for air-conditioning, air-humidification, ventilation or use of air currents for screening.
F24F110 Control inputs relating to air properties.
G G05D23 Control of temperature (automatic switching arrangements for electric heating apparatus H05B 1/02).
G06F1 Details not covered by groups G06F 3/00-G06F 13/00 and G06F 21/00 (architectures of general purpose stored program computers G06F 15/76).
H H01L23 Details of semiconductor or other solid state devices (H01L 25/00 takes precedence).
H01M10 Secondary cells; Manufacture thereof.
H05K5 Casings, cabinets or drawers for electric apparatus.
H05K7 Constructional details common to different types of electric apparatus (casings, cabinets, drawers H05K 5/00).

References

  1. Lei, N.; Masanet, E.R. Global data center energy demand and strategies to conserve energy. In Data Center Handbook, 2nd ed. ed.; Geng, H., Ed.; John Wiley & Sons Incorporated, 2021; pp. 15–26.
  2. International Energy Agency. Data Centres and Data Transmission Networks. https://www.iea.org/energy-system/buildings/data-centres-and-data-transmission-networks, accessed on 2023-09-20.
  3. Masanet, E.; Shehabi, A.; Lei, N.; Smith, S.; Koomey, J. Recalibrating global data center energy-use estimates. Journal Article Research Support 2020, 367, 984–986. [Google Scholar] [CrossRef] [PubMed]
  4. Hintemann, R.; Hinterholzer, S. Data center boom in Germany continues 2022.
  5. Ott, B.; Radgen, P. Waste Heat Recovery From Data Centers For Decarbonization Of Heat Supply In District Heating Systems. In The 18th International Symposium on Discrict Heating and Cooling (DHC2023); IEA DHC., Ed.; 2024; pp. 15–22.
  6. Turek, D.; Radgen, P. Drivers for future data centre demand – historical trends and prospects for 2030 2021.
  7. Brochard, L.; Kamath, V.; Corbalán, J.; Holland, S.; Mittelbach, W.; Ott, M. Introduction. In Energy-Efficient Computing and Data Centers; Brochard, L.; Kamath, V.; Corbalán, J.; Holland, S.; Mittelbach, W.; Ott, M., Eds.; John Wiley & Sons Incorporated, 2019; pp. ix–xiii. [CrossRef]
  8. DIN EN 50600-4-2 (VDE 0801-600-4-2): 2019-08.
  9. Davis, J.; Bizo, D.; Lawrence, A.; Rogers, O.; Smolaks, M.; Simon, L.; Donnellan, D. Uptime Institute Global Data Center Survey 2022 2022.
  10. Song, Z.; Zhang, X.; Eriksson, C. Data Center Energy and Cost Saving Evaluation 2015. 75, 1255–1260. PII: S1876610215009467. [CrossRef]
  11. Kosik, B. Data Center Benchmark Metrics. In Data Center Handbook, 2nd ed. ed.; Geng, H., Ed.; John Wiley & Sons Incorporated, 2021; pp. 617–625.
  12. Malone, C.; Artman, P.; Wildstone, K. Coolant Temperatures for Next Generation IT and Durable Data Center Designs.
  13. GrandViewResearch. Artificial Intelligence Market Size 2023. Report ID: GVR-1-68038-955-5.
  14. Mujtaba, H. Gigabyte Server “Power Consumption” Roadmap Points To 600W CPUs & 700W GPUs By 2025. https://wccftech.com/gigabyte-server-power-consumption-roadmap-points-600w-cpus-700w-gpus-by-2025/, accessed on 2023-09-27.
  15. European Parliament and the Council of the European Union. Directive (EU) 2023/1791 of the European Parliament and of the Council of on energy efficiency and amending Regulation (EU) 2023/955 (recast). Available online: https://eur-lex.europa.eu/legal-content/EN/TXT/PDF/?uri=CELEX:32023L1791 (accessed on 21 September 2023).
  16. Ebrahimi, K.; Jones, G.F.; Fleischer, A.S. A review of data center cooling technology, operating conditions and the corresponding low-grade waste heat recovery opportunities 2014. 31, 622–638. PII: S1364032113008216. [CrossRef]
  17. Zhang, Y.; Zhao, Y.; Dai, S.; Nie, B.; Ma, H.; Li, J.; Miao, Q.; Jin, Y.; Tan, L.; Ding, Y. Cooling technologies for data centres and telecommunication base stations – A comprehensive review 2022. 334, 130280. PII: S0959652621044450. [CrossRef]
  18. Huang, J.Y. Patent portfolio analysis of the cloud computing industry 2016. 39, 45–64. PII: S0923474816300029. [CrossRef]
  19. Alberts, D.; Yang, C.B.; Fobare-DePonio, D.; Koubek, K.; Robins, S.; Rodgers, M.; Simmons, E.; DeMarco, D. Introduction to Patent Searching. In Current Challenges in Patent Information Retrieval; Lupu, M., Mayer, K., Kando, N., Trippe, A.J., Eds.; The Information Retrieval Series; Springer: Berlin/Heidelberg, Germany, 2017; Volume 37, pp. 3–45. [Google Scholar] [CrossRef]
  20. Huang, D.; Yang, C.; Li, B. Rack-Level Cooling and Server-Level Cooling. In Data Center Handbook, 2nd ed. ed.; Geng, H., Ed.; John Wiley & Sons Incorporated, 2021; pp. 227–237.
  21. Brochard, L.; Kamath, V.; Corbalán, J.; Holland, S.; Mittelbach, W.; Ott, M. Cooling the Data Center. In Energy-Efficient Computing and Data Centers; Brochard, L.; Kamath, V.; Corbalán, J.; Holland, S.; Mittelbach, W.; Ott, M., Eds.; John Wiley & Sons Incorporated, 2019; pp. 37–63.
  22. Dürr, B. IT-Räume und Rechenzentren planen und betreiben, 2nd ed.; Verlag Bau+Technik, 2018.
  23. Zhang, J.; He, W.; Guo, R.; Li, H.; Liu, S.; Wei, J.; Wang, Y. Optimal thermal management on server cooling system to achieve minimal energy consumption based on air-cooled chiller 2022. 8, 154–161. PII: S2352484722021746. [CrossRef]
  24. NEC Corporation. NEC Direct Liquid Cooling Technologies 2021.
  25. Saini, M.; Webb, R.L. Heat rejection limits of air cooled plane fin heat sinks for computer cooling 2003. 26, 71–79. [CrossRef]
  26. Liu, C.; Yu, H. Experimental Investigations on Heat Transfer Characteristics of Direct Contact Liquid Cooling for CPU 2022. 12, 913. [CrossRef]
  27. Kheirabadi, A.C.; Groulx, D. Cooling of server electronics: A design review of existing technology 2016. 105, 622–638. PII: S1359431116303490. [CrossRef]
  28. 3M. Two-Phase Immersion Cooling: A revolution in data centre efficiency 2018.
  29. Digitalisation World. Why Hybrid Cooling is the Future for Data Centres. https://digitalisationworld.com/blogs/57574/why-hybrid-cooling-is-the-future-for-data-centres, accessed on 2024-03-03.
  30. American Society of Heating, Refrigerating and Air-Conditioning Engineers. 2021 Equipment Thermal Guidelines for Data Processing Environments 2021.
  31. AMAX. A Comprehensive Guide to the Advantages of Datacenter Liquid Cooling. https://www.amax.com/a-comprehensive-guide-to-the-advantages-of-datacenter-liquid-cooling/, accessed on 2024-05-21.
  32. Jao, Y.C.; Zhang, Z.W.; Wang, C.C. Effect of uneven heat load on the airflow uniformity and thermal performance in a small-scale data center 2024. 242, 122525. PII: S1359431124001935. [CrossRef]
  33. World Intellectual Property Organization. Patents. Available online: https://www.wipo.int/patents/en/ (accessed on 3 October 2023).
  34. Mishra, B.; Bonde, G.V. Patent Searching. In Computer Aided Pharmaceutics and Drug Delivery; Saharan, V.A., Ed.; Springer Nature Singapore, 2022; pp. 473–503. [CrossRef]
  35. World Trade Organization. Intellectual property: protection and enforcement. https://www.wto.org/english/thewto_e/whatis_e/tif_e/agrm7_e.htm, accessed on 2023-10-03.
  36. European Patent Office. Guidelines for Examination in the European Patent Office. Available online: https://www.epo.org/en/legal/guidelines-epc/2023/g_i_1.html (accessed on 3 October 2023).
  37. World Intellectual Property Organization. Guide to the International Patent Classification 2023.
  38. Offenburger, O. Patent und Patentrecherche, 2. ed.; Springer Gabler, 2017.
  39. Krobath, G. Patentrecherche. In Patentrecht für Studierende der Naturwissenschaften; Krobath, G., Ed.; Springer Berlin Heidelberg, 2022; pp. 143–148. [CrossRef]
  40. European Patent Office. Espacenet - patent search. https://www.epo.org/en/searching-for-patents/technical/espacenet, accessed on 2023-10-03.
  41. World Intellectual Property Organization. National Collections - Data Coverage. https://patentscope.wipo.int/search/en/help/data_coverage.jsf, accessed on 2023-10-03.
  42. World Intellectual Property Organization. The PCT now has 157 Contracting States. https://www.wipo.int/pct/en/pct_contracting_states.html, accessed on 2023-10-03.
  43. Adams, S.R. Information Sources in Patents; Walter de Gruyter – K. G. Saur, 2005. [CrossRef]
  44. Bonino, D.; Ciaramella, A.; Corno, F. Review of the state-of-the-art in patent information and forthcoming evolutions in intelligent patent informatics 2010. 32, 30–38. PII: S0172219009000465. [CrossRef]
  45. Abbas, A.; Zhang, L.; Khan, S.U. A literature review on the state-of-the-art in patent analysis 2014. 37, 3–13. PII: S0172219013001634. [CrossRef]
  46. Reymond, D.; Quoniam, L. A new patent processing suite for academic and research purposes 2016. 47, 40–50. PII: S0172219016301132. [CrossRef]
  47. European Patent Office. Espacenet – pocket guide 2022.
  48. European Patent Office. Cooperative Patent Classification (CPC) 2024.
  49. Jank, A. Patent litigation – Manual and terminology 2019.
  50. Lens.org. Patent Filing Dates vs Priority Dates. https://support.lens.org/knowledge-base/filing-dates-vs-priority-dates/, accessed on 2023-12-08.
  51. European Patent Office. Patent families at the EPO 2017.
  52. arizton. Data Center Cooling Market - Global Outlook & Forecast 2023 - 2028. https://www.arizton.com/market-reports/data-center-cooling-market-2025, accessed on 2024-05-19.
  53. Verified Market Reports. Global CRAC and CRAH Units Market By Type (Computer Room Air Handler (CRAH), Computer Room Air Conditioner (CRAC)), By Application (Telecommunication, BFSI), By Geographic Scope And Forecast. https://www.verifiedmarketreports.com/product/crac-and-crah-units-market/, accessed on 2024-05-27.
  54. World Intellectual Property Organization. Classifications. https://www.wipo.int/classifications/ipc/en/ITsupport/Version20190101/transformations/ipc/20190101/en/htm/, accessed on 2024-02-28.
  55. European Patent Office. World’s five largest patent offices agree on joint task force for emerging technologies and AI. https://www.epo.org/en/news-events/news/worlds-five-largest-patent-offices-agree-joint-task-force-emerging-technologies, accessed on 2024-01-18.
  56. European Patent Office. Innovation stays strong: patent applications in Europe continue to grow in 2022. https://www.epo.org/en/news-events/press-centre/press-release/2023/403558, accessed on 2024-01-18.
  57. Bech, H.P. Searching for International Business Opportunities in a Risky World 2024.
  58. Ellsworth, M.J.; Campbell, L.A.; Simons, R.E.; Iyengar, M.K.; Schmidt, R.R.; Chu, R.C. The evolution of water cooling for IBM large server systems: Back to the future. In Proceedings of the 2008 11th Intersociety Conference on Thermal and Thermomechanical Phenomena in Electronic Systems; IEEE, 2008; pp. 266–274. [Google Scholar] [CrossRef]
  59. Baidu. Baidu Special Report on Low Carbon Development 2020. https://esg.baidu.com/Uploads/File/2023/12/15/Baidu%20Special%20Report%20on%20Low%20Carbon%20Development%202020.20231215161246.pdf, accessed on 2024-06-27.
  60. Baidu. Baidu 2021 Environmental, Social and Governance Report. https://esg.baidu.com/Uploads/File/2023/12/15/Baidu%202021%20Environmental,%20Social%20and%20Governance%20Report.20231215161335.pdf, accessed on 2024-06-27.
  61. Baidu. Baidu 2022 Environmental, Social and Governance Report. https://esg.baidu.com/Uploads/File/2023/12/15/Baidu_2022_ESG_Report.20231215155914.pdf, accessed on 2024-06-27.
1
CPC (Cooperative Patent Classification) is an extension of the IPC and managed by the EPO and the US Patent and Trademark Office [48].
2
“The filing date of a patent application is the date the patent application was filed with the patent office, i.e. the date on which that application was legally accepted by that patent office.” [49]
3
“The priority date is the first date of filing of a patent application.” [49]
Figure 1. Structure of the classification of cooling systems up to the third level. CRAC = Computer Room Air Conditioner, CRAH = Computer Room Air Handler.
Preprints 108398 g001
Figure 2. Structure of the classification, data processing and visualisation of patents on cooling technologies for data centers. EPO = European Patent Office.
Preprints 108398 g002
Figure 3. Distribution of the relevance of patents and the related cooling technology (nP, total = 733); period: 2000 - 2023 (earliest priority year). 1. Hybrid cooling; 2. Other; 3. Indirect liquid cooling; 4. CRAH.
Preprints 108398 g003
Figure 6. Distribution of technology sectors over three three-year periods (b - d) and the overall period analysed (a). 1. Air cooling; 2. Liquid cooling; 3. Hybrid cooling; 4. Other; 5. Indirect liquid cooling (ILC); 6. Other liquid cooling. DLC: Direct liquid cooling; TLC: Total liquid cooling.
Preprints 108398 g006
Figure 7. Distribution of relevant patents in the IPC sections and main groups (nP, relev. = 496, nP, MG, relev. = 1040); section B, E, C and A in grey, unassignable section in red; period: 2000 - 2023 (earliest priority year).
Preprints 108398 g007
Figure 13. Distribution of relevant patents across data center cooling technologies and organisations (nOrgan., relev. = 607, nOrgan., relev., TOP 10 = 133); period: 2000 - 2023 (earliest priority year).
Preprints 108398 g013
Table 1. Overview of the search terms used separately and the associated search logic1 of Espacenet.
Search topic Search logic (Espacenet)
Cooling Optimization Data Centers ti all "Cooling Optimization" AND ab all "data cent*"
CPU cooling (ti all "CPU cooling" OR ti all "central processing unit cooling") AND desc all "data cent*"
Computer Room Air Conditioning (CRAC) (ta all "CRAC data cent*" OR ta all "Computer Room Air Conditioning data cent*" OR ta all "CRAH data cent*" OR ta all "Computer Room Air Handler data cent*") OR ((ti all "CRAC" OR ti all "Computer Room Air Conditioning" OR ti all "CRAH" OR ti all "Computer Room Air Handler") AND ab all "data cent* cooling") OR (ti all "data cent* cooling" AND (ab all "CRAC" OR ab all "Computer Room Air Conditioning" OR ab all "CRAH" OR ab all "Computer Room Air Handler"))
Computer Room Air Handler (CRAH) Structure as for CRAC
Direct Chip Cooling ti all "cold plate cooling data cent*" OR (ti all "cold plate cooling" AND desc all "data cent*")
GPU cooling (ti all "GPU cooling" OR ti all "graphics processing unit cooling") AND desc all "data cent*"
Hybrid Cooling Systems ti all "Hybrid Cooling" AND ab all "data cent*"
Immersion cooling ta all "immersion cooling data cent*" OR (ti all "immersion cooling" AND ab all "data cent*") OR (ti all "data cent* cooling" AND ab all "immersion")
Modular Cooling Systems ti all "Modular Cooling" AND ab all "data cent*"
Rack-Level Cooling ti all "Rack Cooling" AND ab all "data cent*"
Rear Door Heat Exchanger ti all "Rear door heat exchanger" AND desc all "data cent*"
Server Cooling ti all "Server Cooling" AND ab all "data cent*"
Thermal Management Solutions ti all "Thermal Management" AND ab all "data cent*"
Cooling Fluid2 (ti all "coolant" OR ti all "Cooling agent" OR ti all "Refrigerant" OR ti all "cooling liquid" OR ti all "cooling medium" OR ti all "cooling fluid") AND ab all "data cent*"
1 Overview of the text sections used in the search logic and their function: ab: Abstract, desc: Description, ta: Title or abstract, ti: Title [47].
2 This is not part of the further analysis due to an overlap with the room cooling and cooling infrastructure.
Table 2. Number of search results for the different search topics; period: 2000 - 2023 (earliest priority year).
Search topic Simple families matchesa All publications matchesb Sharec
Cooling Optimization 17 30 57 %
CPU Cooling 72 92 78 %
CRAC / CRAH 151 206 73 %
Direct Chip Water Cooling 78 121 64 %
GPU Cooling 9 11 82 %
Hybrid Cooling 12 18 67 %
Immersion Cooling 88 119 74 %
Modular Cooling 49 109 45 %
Rack Cooling 62 141 44 %
RDHX 9 20 45 %
Server Cooling 119 255 47 %
Thermal Management 67 107 63 %
Sum 733 1,229 60 %
Data cent*1 266,400 387,585 69 %
Data cent* cooling2,3 2,188 3,543 62 %
Cooling Fluid 424 574 74 %
a Number of simple patent families matching the search criteria. One simple family can encompass many publications in different countries.
b Number of all patent publications matching the search criteria.
c The quotient of “simple patent families matches”a to “all patent publications matches”b.
1 Search logic: ab all "data cent*".
2 Search logic: ti all "Cooling" AND ab all "data cent*".
3 Share of "data cent* cooling" on "data cent*": 0.82 %a and 0.91 %b.
Table 3. Comparison of the number of patent applications classified as relevant compared to the search results; period: 2000 - 2023 (earliest priority year).
Search topic Simple families matches Relevant patents1 Share of relevant to machted patents2
Cooling Optimization 17 12 -2 71 % / 59 %
CPU Cooling 72 49 -1 68 % / 67 %
CRAC / CRAH 151 116 -5 77 % / 74 %
Direct Chip Cooling 78 70 -1 90 % / 88 %
GPU Cooling 9 7 -1 78 % / 67 %
Hybrid Cooling 12 7 -0 58 %
Immersion Cooling 88 62 -3 70 % / 67 %
Modular Cooling 49 32 -1 65 % / 63 %
Rack Cooling 62 55 -10 89 % / 73 %
RDHX 9 9 -0 100 %
Server Cooling 119 92 -10 77 % / 69 %
Thermal Management 67 18 -0 27 %
Sum 733 529 -34 72 % / 68 %
1 Subtrahend: Indicates the number of relevant patents that appear due to multiple results in the other search topics.
2 The second value refers to the final determination of the relevant patents after verification of the duplicates between the search topics.
Table 4. Distribution of relevant patents by search term and IPC section1; period: 2000 - 2023 (earliest priority year).
Search topic A B C D E F G H N2
Cooling Optimization 9 9 1 1
CPU Cooling 4 3 3 53 16
CRAC / CRAH 5 138 30 59
Direct Chip Cooling 4 10 33 58
GPU Cooling 1 5 4
Hybrid Cooling 4 2 5
Immersion Cooling 1 2 4 11 64
Modular Cooling 1 17 3 33
Rack Cooling 1 17 8 53
RDHX 1 4 5 6
Server Cooling 3 2 20 56 60
Thermal Management 11 21 15
Sum 1 14 3 0 9 238 236 374 1
1 The IPC sections of the first three entries of the patent classifications of a patent were used. In this analysis, a patent consisted of up to 12 patent classifications. The first three IPC classifications result in a total of 876 (56 %) entries, while a total of 1,562 patent classifications entries were found. 2 Patents that cannot be assigned to an IPC section.
Table 5. Distribution of relevant patents by cooling technology and IPC section1; period: 2000 - 2023 (earliest priority year).
Search topic A B C D E F G H N2
Air cooling 1 8 176 80 128
Liquid cooling 1 13 1 47 121 221
  Indirect liquid cooling 3 13 10 31
  Direct liquid cooling 8 1 18 85 110
  Total liquid cooling 1 2 6 21 69
Hybrid cooling 8 10 12
Other 3 7 25 13 1
Sum3 1 14 3 0 9 238 236 374 1
1 The IPC sections of the first three entries of the patent classifications of a patent were used. In this analysis, a patent consisted of up to 12 patent classifications. The first three IPC classifications result in a total of 876 (56 %) entries, while a total of 1,562 patent classifications entries were found. 2 Patents that cannot be assigned to an IPC section. 3 Not including the various types of liquid cooling technologies.
Table 6. The absolute number of cases in which the TOP 10 main groups appeared alone or in combination with another TOP 10 main group; period: 2000 - 2023 (earliest priority year).
F24F3 F24F5 F24F7 F24F11 F24F13 F24F110 G06F1 H01L23 H05K5 H05K7
F24F3 x 5 1 8 5 1 2 - - 4
F24F5 4 2 17 16 8 3 - - 9
F24F7 1 6 2 - 2 - - 5
F24F11 10 13 13 2 - - 17
F24F13 x 4 - - - 5
F24F110 x - - - 5
G06F1 77 - 3 47
H01L23 x - -
H05K5 2 16
H05K7 184
Table 7. Ratio of relevant patents to the total number of patents registered by the leading companies (nOrgan., relev., TOP 10 = 133; period: 2000 - 2023) (earliest priority year).
Applicant Relevant patents (Total: Air / Liquid) All patents1 Ratio of relevant to all patents2
Suzhou Inspur I. 30: 3 / 26 14,156 2.12 ‰
IBM 25: 9 / 12 46,473 0.54 ‰
Baidu USA 15: 3 / 12 1,006 14.91 ‰
NVIDIA 13: 1 / 9 2,721 4.78 ‰
Univ Nanjing Tech 11: 1 / 9 39,717 0.28 ‰
Hewlett Packard 10: 5 / 4 17,034 0.59 ‰
Zhengzhou Yunhai Inf. Tech 10: 9 / 1 11,603 0.86 ‰
Google 7: 1 / 6 14,554 0.48 ‰
Inspur Electronic I. 6: 2 / 2 4,955 1.21 ‰
INTEL 6: 1 / 4 26,463 0.23 ‰
1 Number of simple patent families matches with applicant as inventor or applicant within the priority year period 2013 - 2023.
2 This is the ratio of all patents classified as relevant in the field of cooling technology to all patent applications registered by the applicant in the period 2013 - 2023.
Disclaimer/Publisher’s Note: The statements, opinions and data contained in all publications are solely those of the individual author(s) and contributor(s) and not of MDPI and/or the editor(s). MDPI and/or the editor(s) disclaim responsibility for any injury to people or property resulting from any ideas, methods, instructions or products referred to in the content.
Copyright: This open access article is published under a Creative Commons CC BY 4.0 license, which permit the free download, distribution, and reuse, provided that the author and preprint are cited in any reuse.
Prerpints.org logo

Preprints.org is a free preprint server supported by MDPI in Basel, Switzerland.

Subscribe

© 2024 MDPI (Basel, Switzerland) unless otherwise stated