1. Introduction
Contemporary three-dimensional scanning methods, such as those outlined in [
1], enable the acquisition of highly accurate spatial measurements in the form of point cloud data sets. Point clouds offer advantages over mesh models for representing scanned environments. They capture all details without simplification or loss of geometric accuracy [
2], similar to raw measurements from laser scanning or photogrammetry. Point clouds are ideal for applications that require accurate measurements of built work, such as architecture, engineering, construction, and cultural heritage [
3]. They also avoid errors that can be introduced in mesh generation, such as excessive smoothing or poorly colored textures [
4]. In general, point cloud rendering is preferred when geometric accuracy and measurement precision are paramount, despite the higher processing requirements compared to lighter mesh models.
Many current scanning devices include cameras to provide color information in addition to geometry. It is also possible to capture point clouds with additional attributes, such as temperature, due to the development of novel sensors and the integration of complementary components into scanning pipelines, as demonstrated in [
5]. The integration of thermal data with 3D geometric models is an important area of research for advancing building information modeling (BIM). According to Ramon et al. [
6], thermal point clouds that combine temperature attributes with 3D coordinate data can provide a more complete digital representation of a building's thermal behavior. Incorporating thermal features into BIM can enhance energy modeling and simulations of building behavior compared to models based solely on visual geometry [
7,
8]. For existing buildings, thermal point clouds obtained by thermography and 3D scanning techniques enable in situ assessment of the thermal transmittance properties of the building envelope required for energy models [
9]. Thermal data can reveal insulation defects, air leakage, moisture ingress, and other anomalies that affect building energy consumption [
10]. The fusion of 3D thermography with traditional BIM geometry offers new opportunities to create smarter, semantically richer digital building models with direct applications for sustainability and energy efficiency.
Kurkela et al [
3] describe how measuring luminance distributions in indoor environments can provide valuable information on lighting quality, visual comfort, and aesthetics. By utilizing radiometric calibration techniques and high dynamic range (HDR) imaging, the intensity values recorded in the red, green, and blue channels of the laser scanner panoramic images can be converted into absolute luminance readings and projected onto the measured 3D point cloud [
3,
11].
Some surface properties obtained from identical scanner positions may vary over time, depending on the time of day or season of data acquisition. Therefore, a distinction can be made between static properties, such as three-dimensional coordinates, and dynamic properties, such as temperature, which are stored as time series. The analysis of static property values and the variation of certain dynamic properties over time can be useful in various fields, such as engineering, architecture, and physics.
However, advancements in 3D scanning technology have led to an increase in data throughput. Therefore, the use of multiple point cloud captures from the same location results in extremely large aggregate point sets for rendering, which presents computational performance challenges for real-time interactive visualization and exploration. It is necessary to handle and examine substantial volumes of information. To achieve real-time performance without sacrificing detail, advanced rendering techniques are necessary [
12,
13,
14,
15]. This challenge is particularly evident in virtual reality platforms, which have strict graphics processing requirements that necessitate optimization.
This paper presents a method for fusing information from multiple indoor building clouds that have been digitized at different points in time. The proposed method eliminates redundancy in spatial information and stores time-varying data at each point.
Additionally, a VR application has been developed to apply the optimization method. This application enables the representation and interaction with point clouds with additional acquired properties. The Unity engine was used to develop the application, as its usefulness for working with point clouds has been demonstrated by other authors [
16].
The article is structured as follows: section 2 explains the fusion method, starting by the acquisition of point cloud, continuing by the data processing and ends with the VR application development. All the features of such application are exposed in section 3. Finally, in section 4, the conclusions and work future perspectives are discussed.
2. Materials and Methods
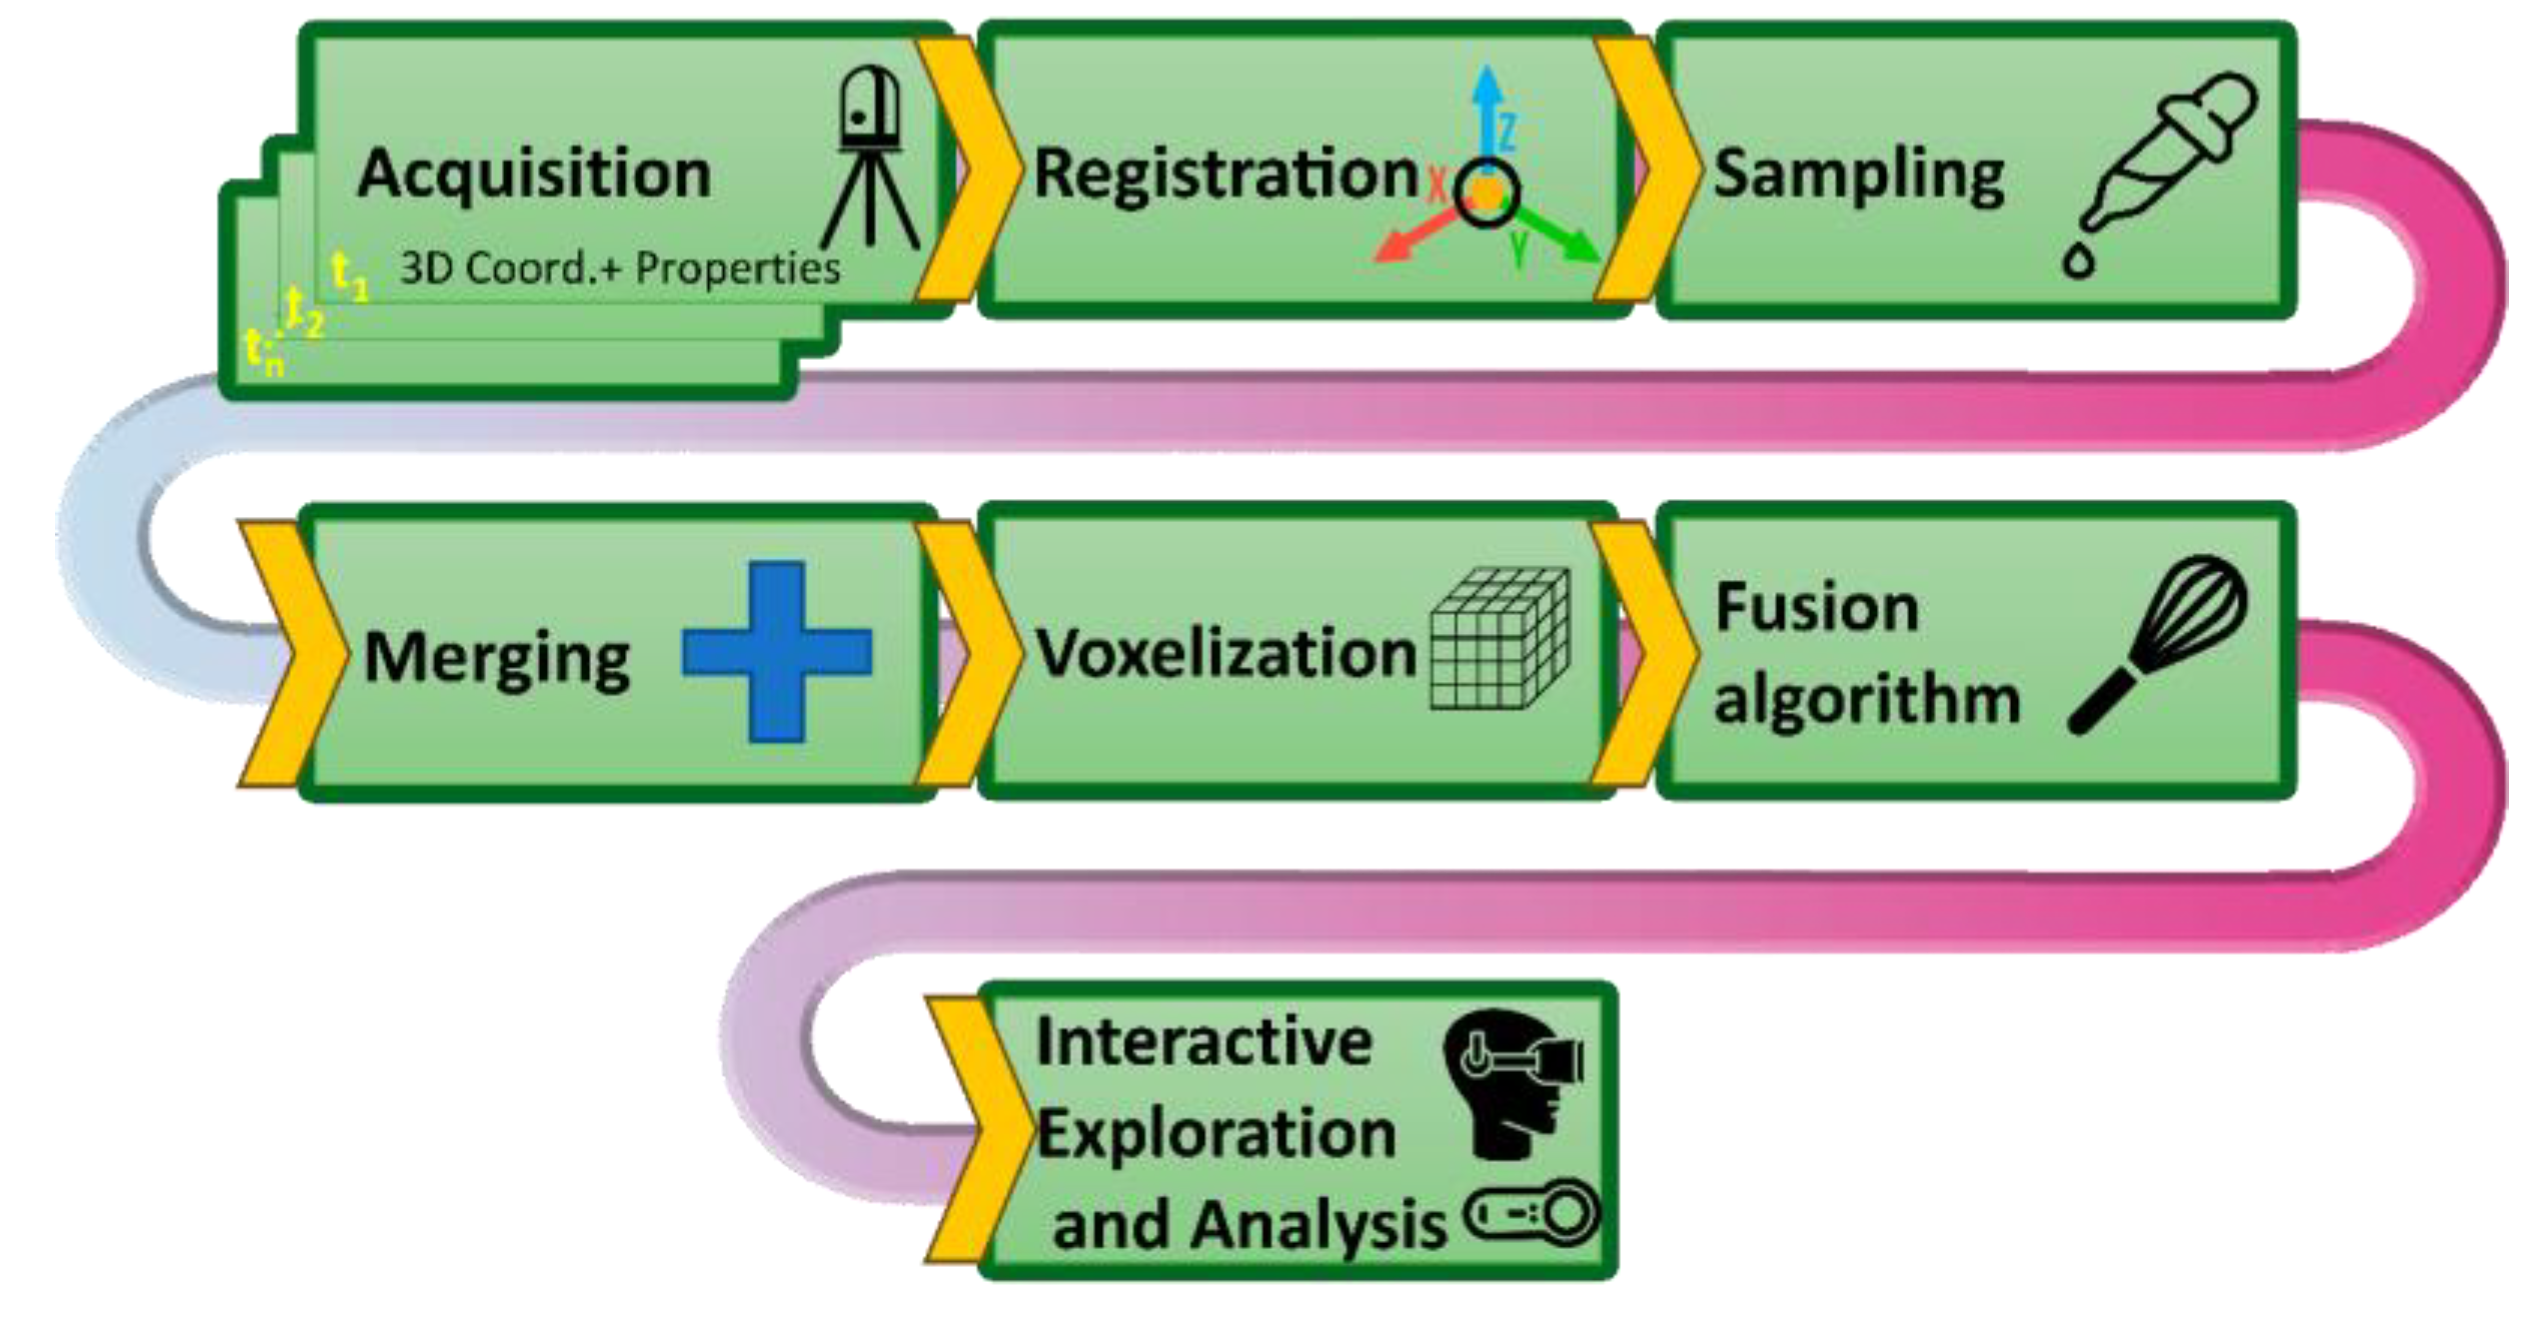
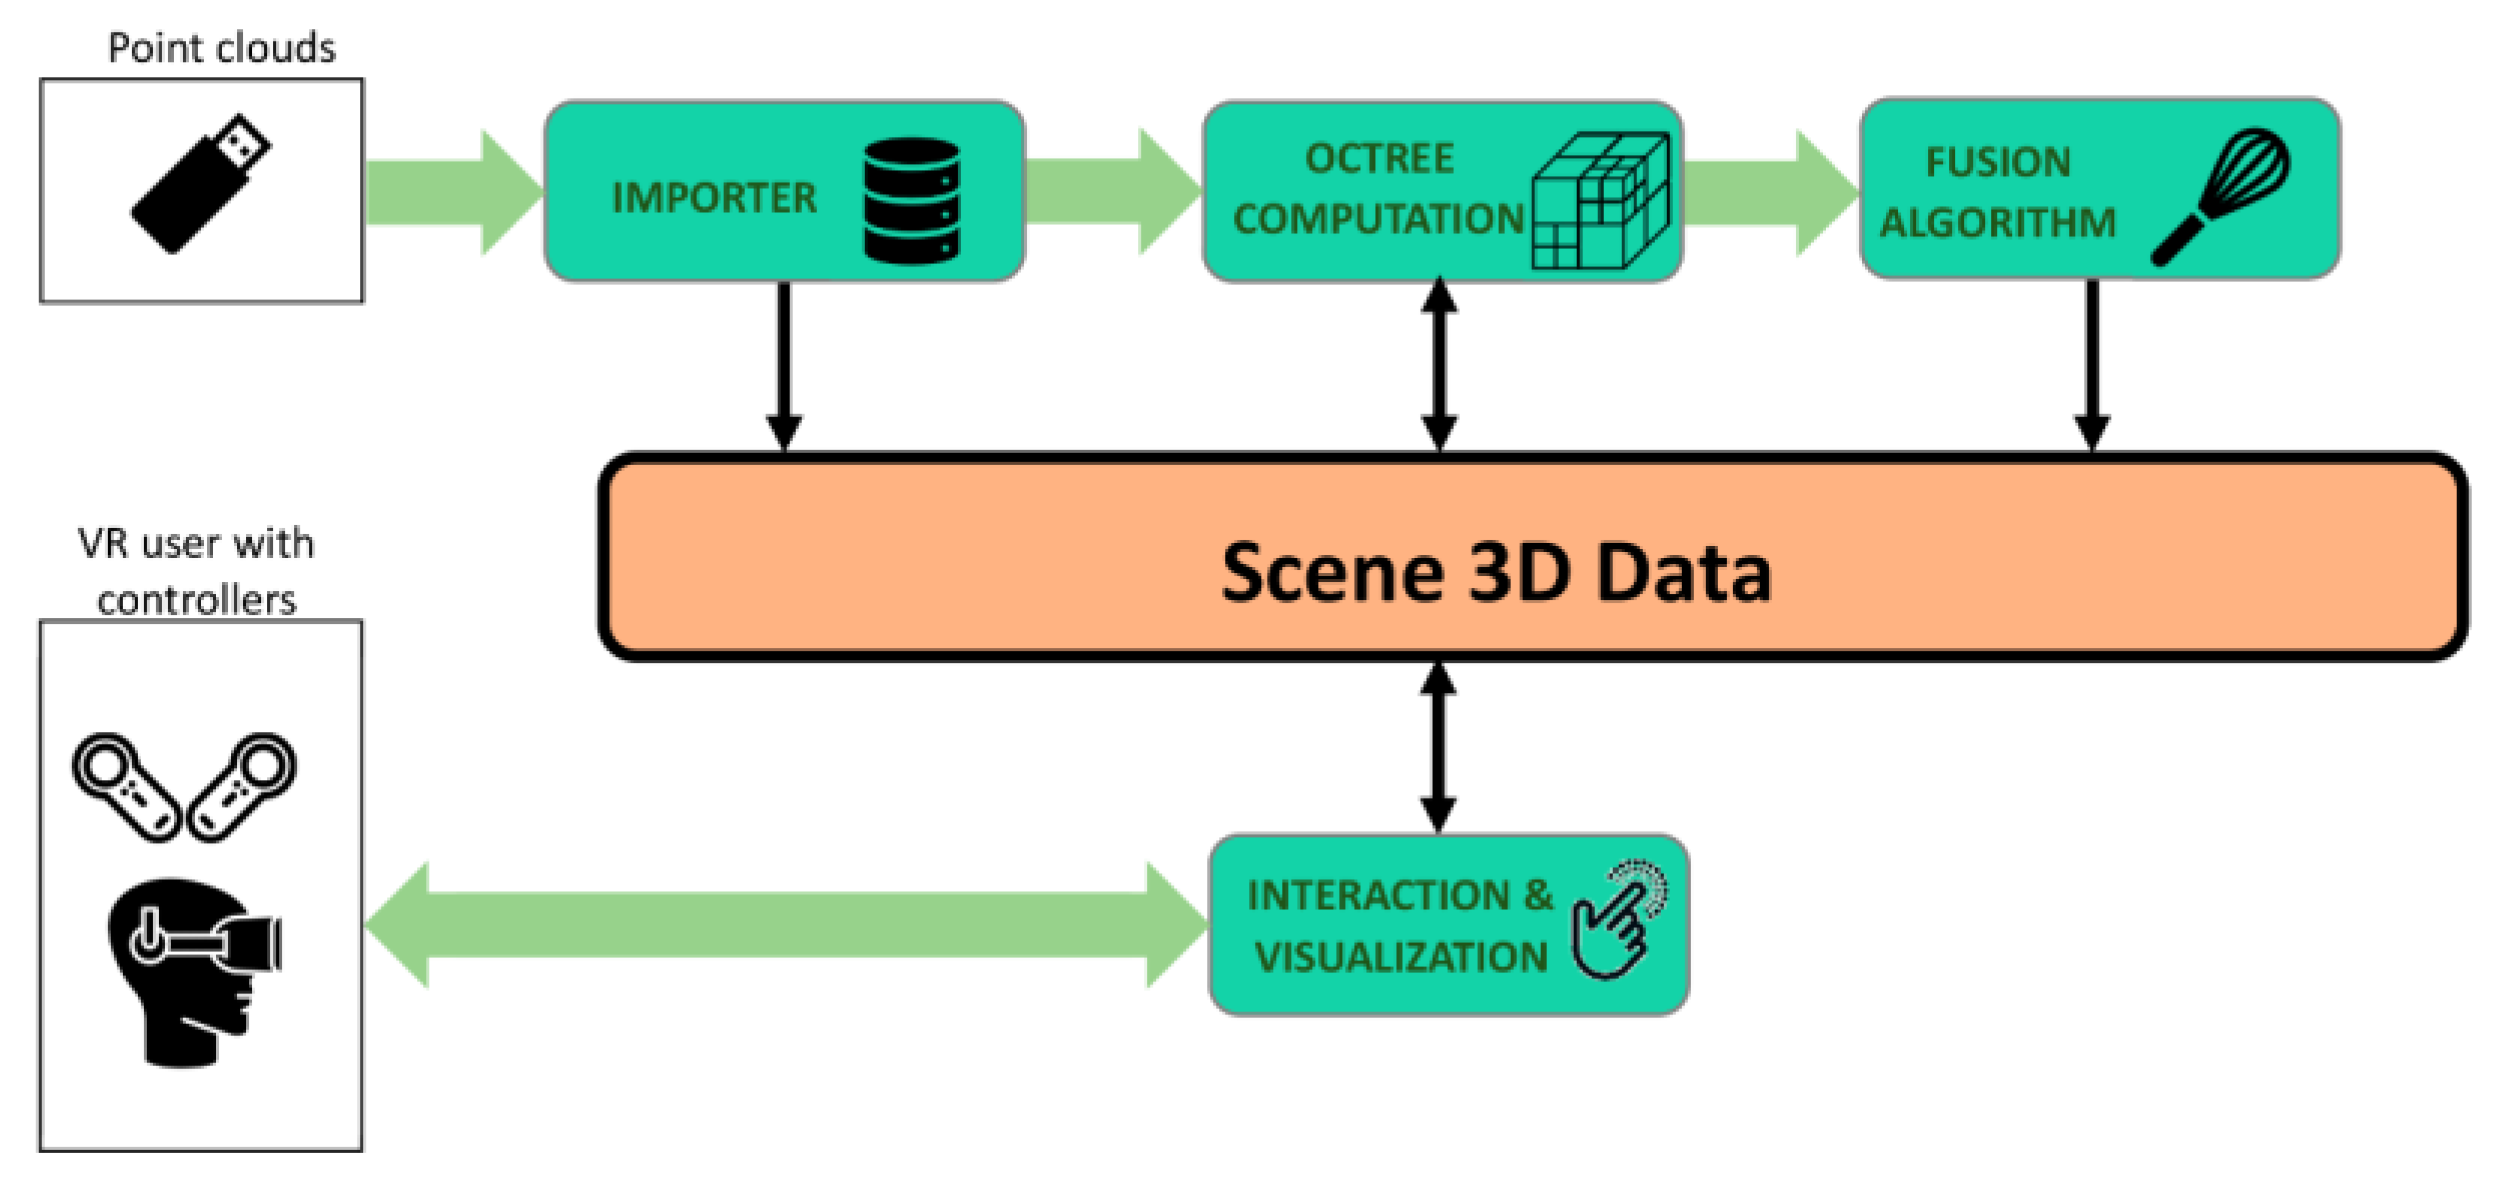
The method proposed can be divided into several distinguishable stages, from the acquisition process to the interactive exploration and analysis in the developed VR application. The data flow is adapted and transformed throughout all these stages.
Figure 1 displays a diagram in which all the stages that compose the method are sequentially ordered.
The proposed steps are described below.
2.1. Acquisition
The method presented in this paper can be applied to the general case where the surface of any environment is acquired at different time instants using capture devices that obtain a set of surface properties. The data acquisition device is strategically positioned to fully sample all regions of the environment's surface. This method generates point clouds, each linked to a specific time, consisting of points with 3D coordinates and associated property values at the time of capture.
Nowadays, acquisition equipment commonly obtains the color of each point using the RGBA color model, which has four associated values. Other properties may also be included depending on the capture equipment or data processing, such as:
Intensity: it offers information about the reflectance of target-surfaces.
Time: it registers the time when a point was acquired.
Confidence: it gives an idea of the precision with which a point has been captured.
Range: it stores the range or distance value, from the scanning laser, at which the point has been detected.
Temperature: it stores the temperature value at points.
Luminance: it is a photometric measure of the luminous intensity emitted or reflected from a surface per unit area in a given direction.
Properties values derived from the environment of each point: By analyzing the environment of each point or the complete point cloud, various properties can be obtained, such as curvature (which estimates the variation of the normal in the environment of a point), density (which is the ratio between the number of neighbors of each point and the distance between them, giving an idea of the distribution of the points along the cloud), and statistical values obtained from other properties (such as mean, median, and standard deviation).
The method, presented in this article, is valid for acquiring any of these properties, but for simplicity, this explanation will focus on point clouds composed of 3D coordinates, color, and temperature. Specifically, all examples in this work were acquired using a Leica BLK360 laser scanner, which adds thermal information to the point cloud.
In order to fully digitize each room, the scanning device must be positioned in various locations throughout the room until all surfaces are captured. This sequence of acquisitions, along with the repositioning of the scanner, constitutes the room scanning sequence. Although this scanning protocol may take several minutes in practice, it is conceptualized here as occurring at a discrete instant in time, denoted by consecutive integers (instant 1, instant 2, instant 3, etc.). Room scanning sequences occur at w distinct time intervals, either closely spaced (hours or days apart) or widely separated (months or seasons apart). Therefore, each room scanning sequence,
, can be denoted by:
where
are the point clouds captured at time instant
, at each of the
scanner locations that complete the room scanning sequence. It is important to note that although the same number of positions will normally be used to acquire the entire room, it is not necessary that each scan sequence be performed with the same scanner locations. Therefore, the number of such locations may also change between room scan sequences. Each of the acquired point clouds are denoted as follows:
where
correspond to the coordinates, color, and temperature of each of the
points that compose the cloud and can be represented as:
As for temperature, the above simplification of considering that all scans in a room scanning sequence belong to the same time instant is logical, since this property varies very slowly.
2.2. Registration and Sampling
After acquisition, the next step is registration, which involves aligning the scanned clouds. This process positions each cloud, , of a room scanning sequence so that they all share the same reference system.
Although the 3D scanner software provides assistance, this registration step requires the use of algorithms such as the classical 'Iterative Closest Point' [
17], ICP, or one of its variants [
18].
After this step, the initial set of point clouds undergoes a 3D coordinate transformation. As a result, each room scan sequence is transformed to
, since its point clouds are transformed to
. This transformation can be expressed as follows:
As expressed in equation , the point coordinates are transformed in the registration process, but the color and other properties remain unchanged. Note that the registration is applied on two levels: all the point clouds of a room scanning sequence are registered, and also each global point cloud of each scanning sequence is registered. Therefore, this process involves the registration of point clouds.
Given the high number of points generated by current digitalization devices, it is necessary to reduce the number of points in order to process them. This is done by sampling the registered point clouds, which results in a reduction of the number of points in all scanning sequences. This process is performed using an octree data structure to preserve geometric fidelity and fine detail when compressing massive point clouds.
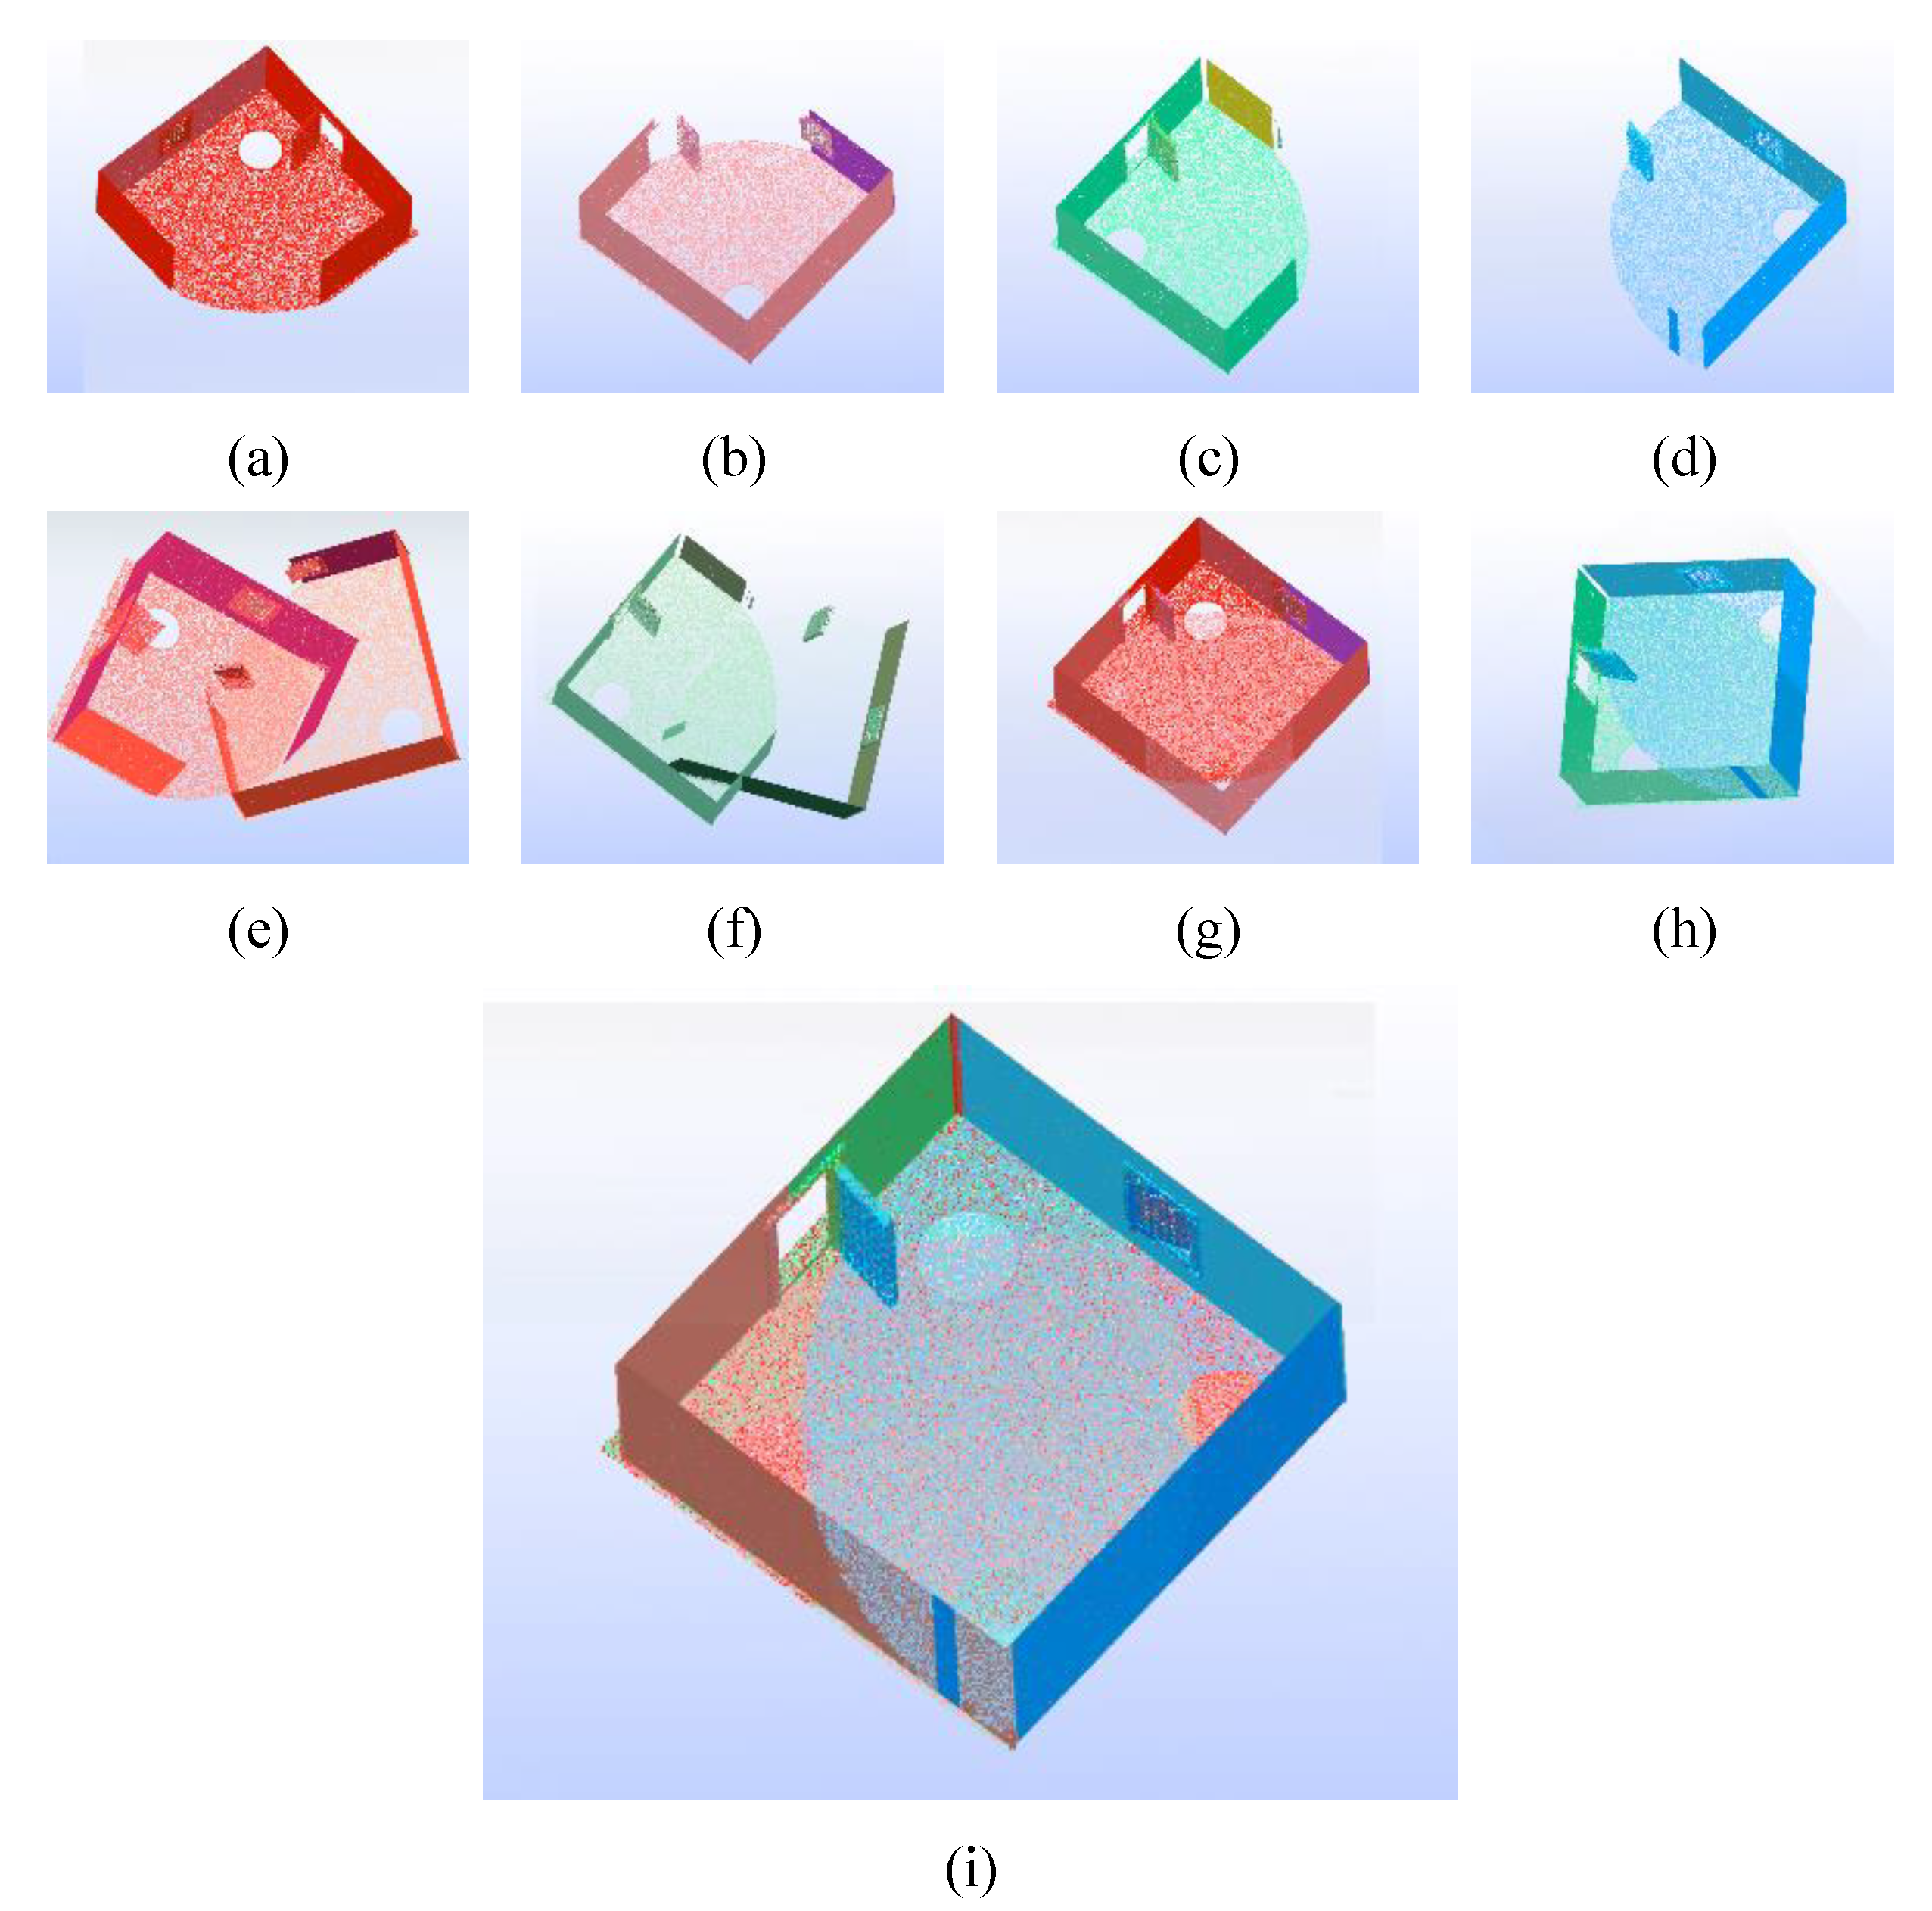
As an example,
Figure 2.a), 2.b), 2.c) and 2.d) show the raw clouds #1, #2, #3 and #4, respectively, which have been acquired at time instants
,
,
and
. In this example, we assume that
and
correspond to close moments of the same day, and
and
the same but of another day. In
Figure 2.e) and 2.f), the relative position of the cloud pairs #1−#2 and #3−#4 are shown. First, they must be aligned, recorded, and added two by two, resulting in the clouds shown in
Figure 2.g) and 2.h). Finally, these clouds must be registered and merged, the result of which is shown in
Figure 2.i).
2.3. Merging
After the registering step, all point clouds are merged to produce a unique point cloud of
points, that can be expressed as:
where
is a list of all the 3D coordinates of all points of the point clouds
, obtained in all the room scanning sequences at every position of the scanner. In addition to the 3D coordinates the
value is also added. This value is the instant associated with the room scanning sequence to which the point belongs. As mentioned before, the instants are represented by consecutive integer numbers which represent the chronological order in which room scanning sequences were carried out.
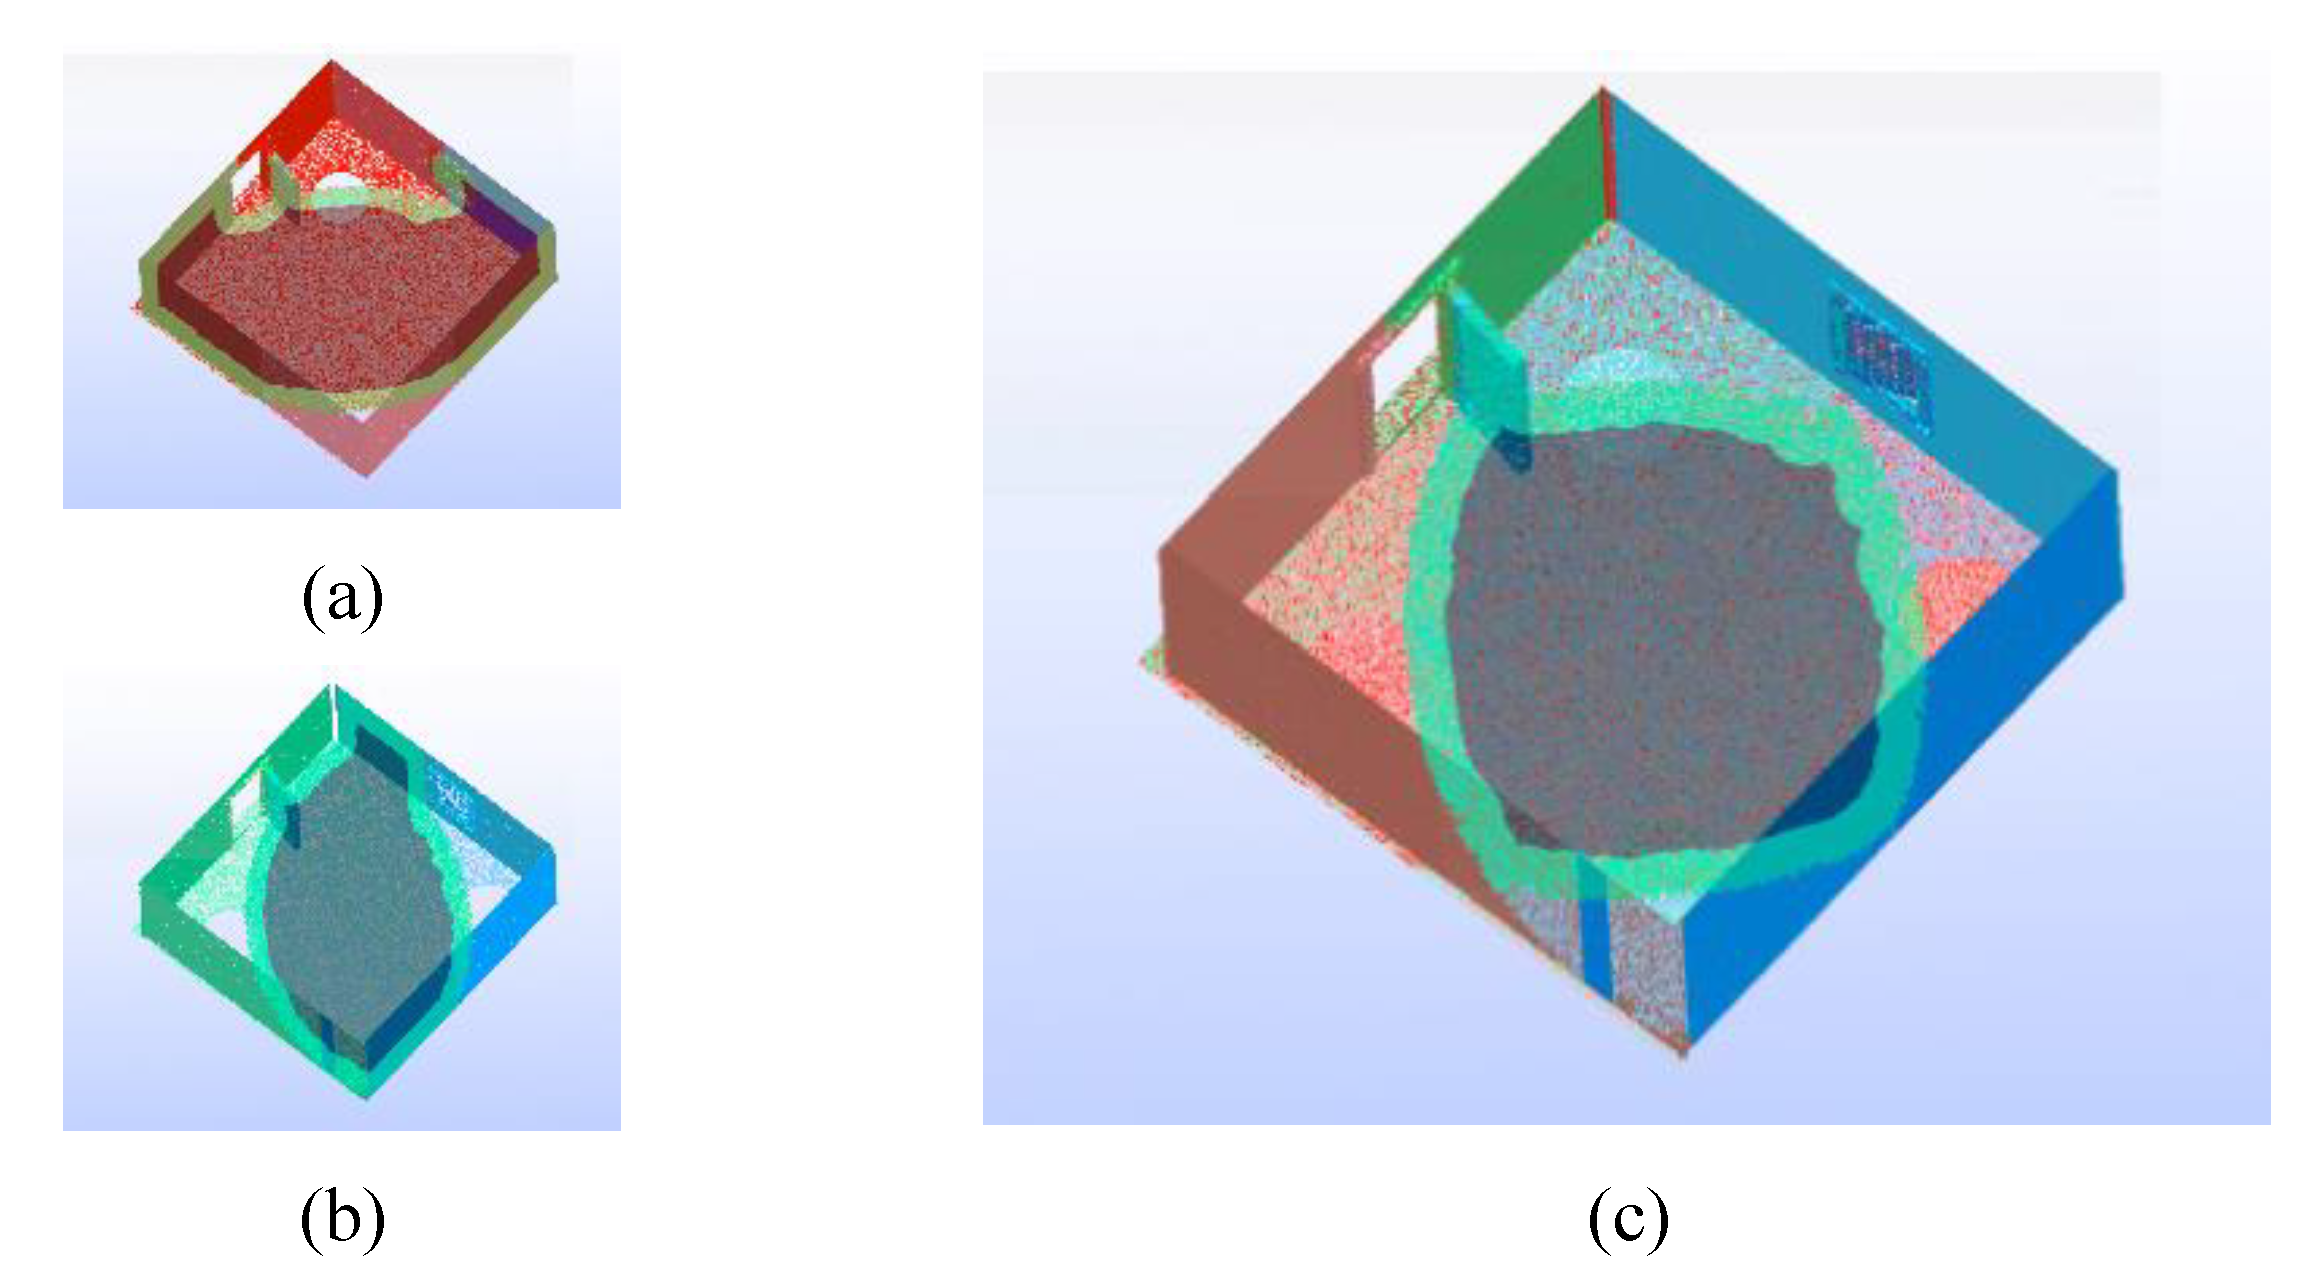
Several zones with different density can be distinguished in
. Thus, on the one hand, some zones contain only points corresponding to a single 3D capture and, on the other hand, zones where two or more-point clouds overlap. The overlapping zone between cloud pairs #1-#2 and #3-#4, respectively, is highlighted in
Figure 3.a and 3.b. The four overlapping clouds are shown in
Figure 3.c.
The resulting cloud, , contains an excessive number of points and with a variable density. Regarding the analysis and visualization applications, such number of points are not useful. For this purpose, a fusion algorithm is implemented, which is explained in the next section.
2.4. Voxelization and Fusion Algorithm
The fusion algorithm aims, on the one hand, to reduce the number of points, which is essential for the real-time representation in VR and, on the other hand, to generate a more uniform point cloud, a feature that is valuable for visual exploration. It should be noted that the algorithm must allow the analysis of the evolution of the point properties over time.
The fusion algorithm starts with the merged cloud obtained after the merging step (
Figure 3.c). It should be remembered that this cloud basically consists of a list of
(3D coordinates of each point),
(its colour),
(a property value- temperature) and a
instant value associated to each of them. This algorithm aims to generate a uniform point cloud, common to all the instants, whose points have a property value associated to such instants.
To achieve this, the first step is the voxelization of the point cloud, so that the points occupying the same voxel are eventually replaced by a point at the center of gravity of the voxel. This is a simplification because the points that are within the same voxel are replaced by a unique 3D point. This process can be expressed as:
where the merged cloud
is replaced by the voxelized cloud
. The expression in (8) does not imply a univocal correspondence between the
points of
and the
points of
, which entails that generally the number of points of both point clouds will be different.
is composed by
points whose coordinates, called
, correspond to the center of gravity of the g points inside a voxel; whose colors, called
, correspond to the average of the colors in the voxel and whose property values along time are
. Thus,
is also the number of voxels occupied by points.
The voxelization process is optimized by using an octree. That is, an octree is created with the input parameter of the size of the deepest, or smaller, octree node. At the end, the merged cloud is inside a grid composed by a grid of voxels whose sizes are equal to this node size.
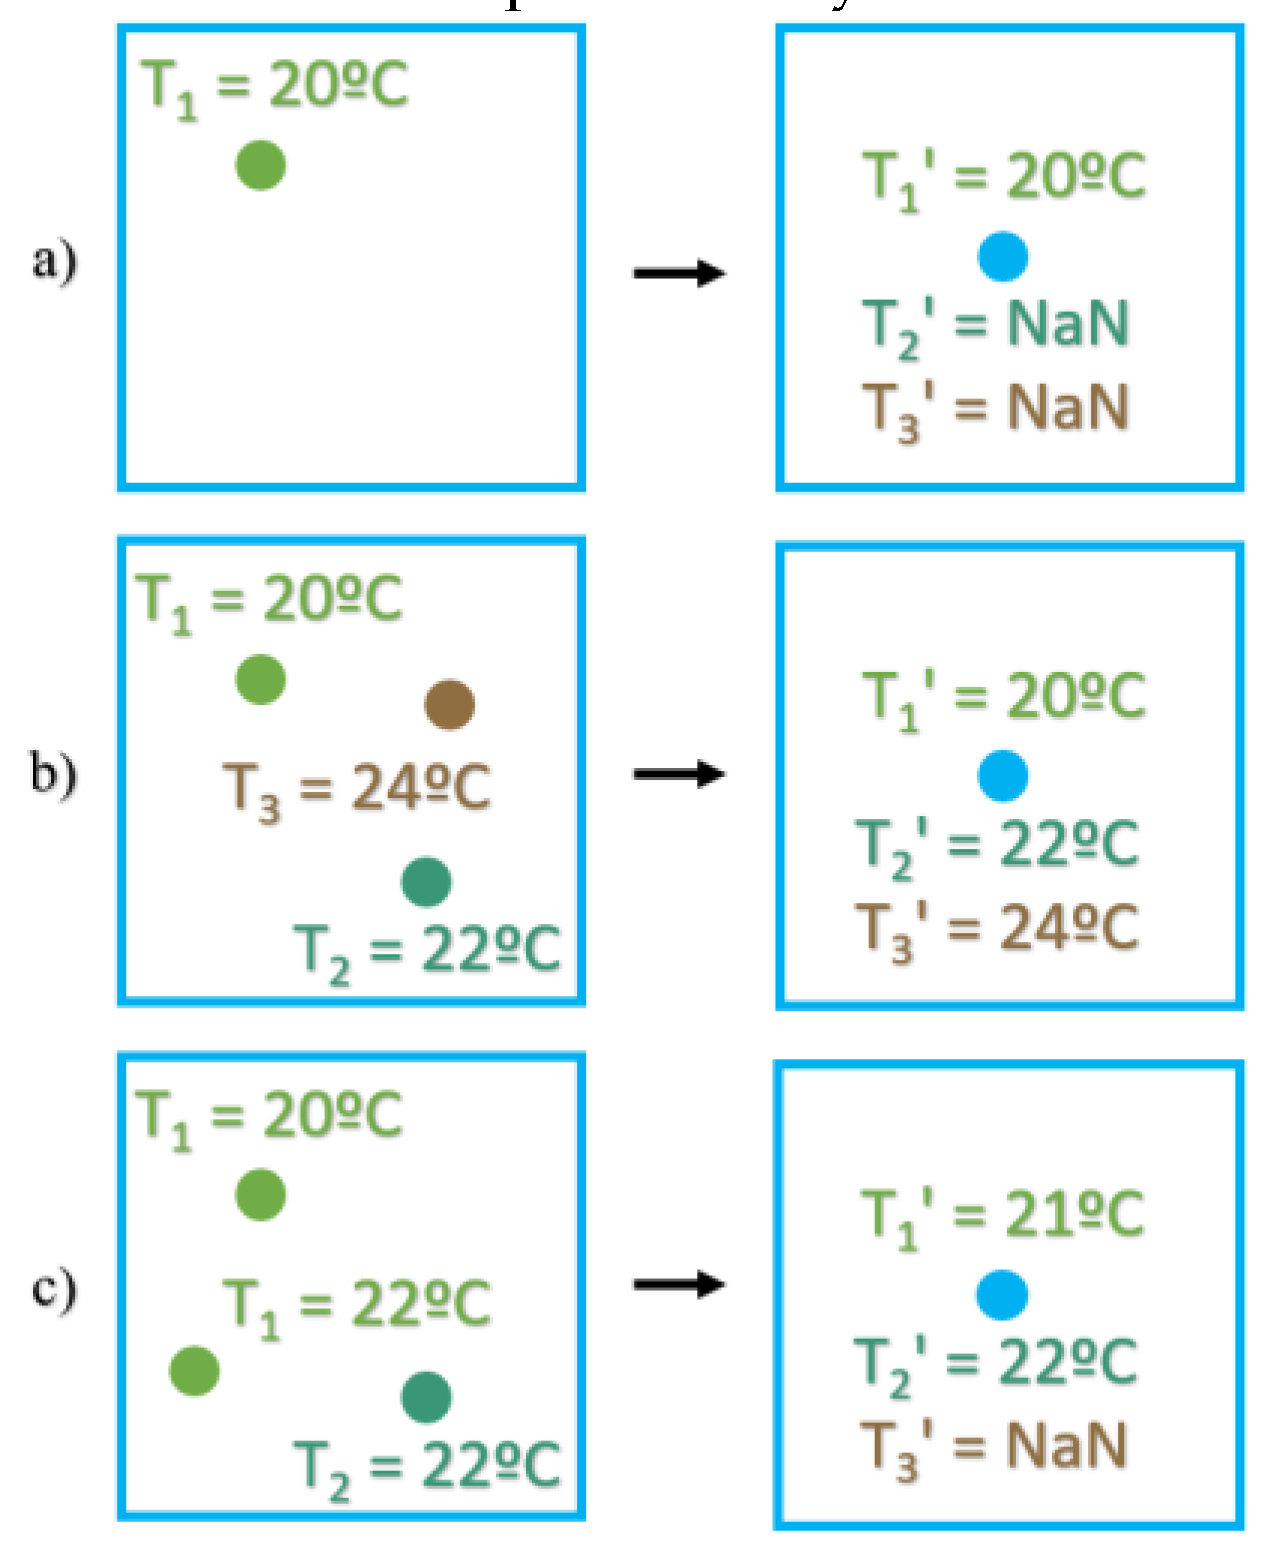
Regarding the property value assignment depending on the acquisition instant, it must be analyzed how to proceed. The following situations can occur:
A single point
of the merged cloud,
acquired at instant
is inside the voxel
. This point is substituted by the point
whose property values are assigned a
except for the property value of
. This can be expressed as:
A set of points
of the merged cloud,
where each of them were acquired at each of the acquisition instants,
, are inside the voxel
. The property’s values of such points are directly assigned to
. This can be expressed as:
Several points
of the merged cloud,
, of one or more of the acquisition instants,
,…, are inside the voxel
. The value property for a specific instant, i.e.,
, is obtained from the average value of such property for all the points acquired in
that lie inside the voxel. If no point is found for a instant
, a
value is assigned to the property value
. This can be expressed as:
Figure 4 summarizes all situations describes above when the measured property is temperature in ˚C. The different acquisition instants are represented by colors.
One of the most salient parameters in the fusion process is voxel size. Larger voxel dimensions yield lower resulting point cloud densities, but each point assimilates thermal data from more time instants because the likelihood of encapsulating points from different scans increases, integrating information across more time instants. In addition, larger voxels reduce the resolution of the representation relative to the source clouds, resulting in loss of data or information. Conversely, smaller voxels result in higher point counts which could hinder real-time visualization and survey. This issue depends on the computing hardware utilized. Consequently, an optimal balance must be achieved in order to generate a model with adequate information for proper visualization, to remove redundant data, and to form a manageable point cloud for real-time operation. Voxel size selection balances these competing factors. Voxelization is a common practice in point cloud optimization, as applied for example in [
19,
20].
3. Virtual Reality Application
The goal of the developed VR application is to interactively explore the point cloud, allowing the user to access all the temporal thermal information associated with the points, in an intuitive and visual way, using a color scale representation.
The application addressed in this paper has been developed using the Unity 3D engine and is available to be downloaded in a GitHub repository [
21].
Most of these engines focus on the use of 3D models defined by meshes and do not natively support point clouds. Therefore, one of the fundamental steps is the implementation of a module to overcome this drawback. The developed module is based on [
22] and extends some of its features.
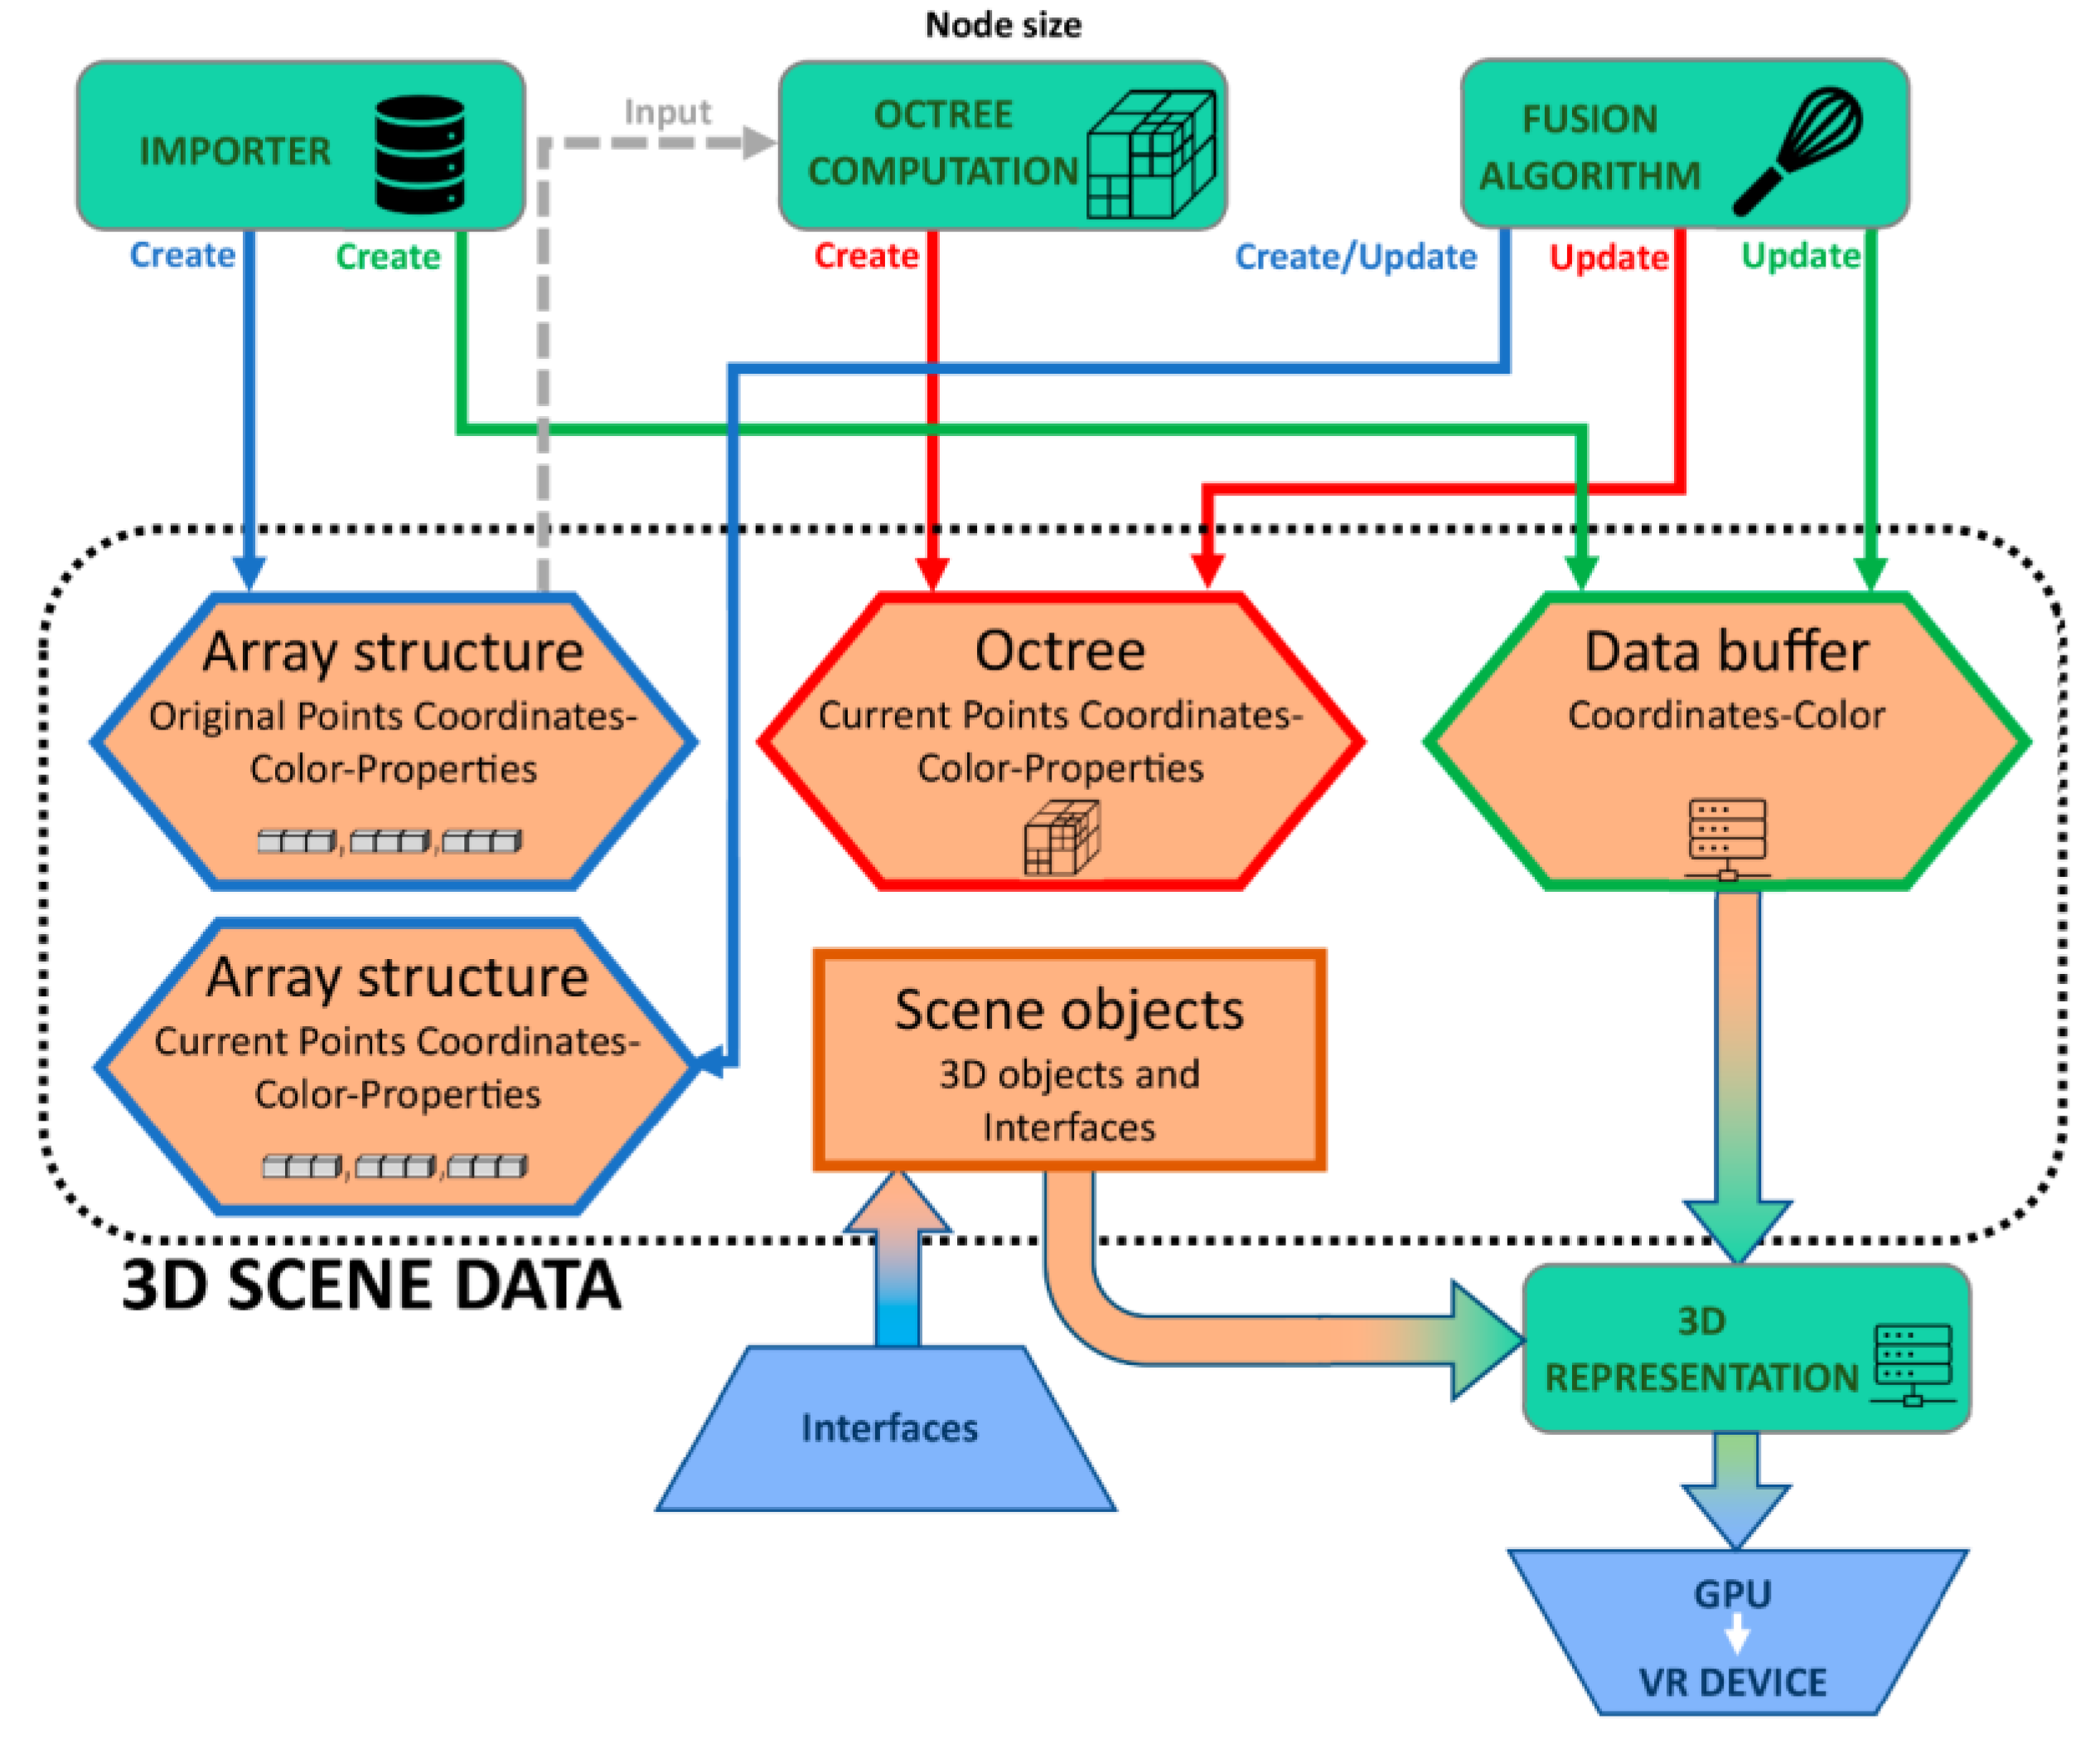
The final application is structured according to the scheme shown in
Figure 5., where the 3D scene data is the main element around which orbit different modules and blocks that create, manage, extract, and interact with such data. These modules are: ‘Importer’, ‘Octree computation’, ‘Fusion algorithm’ and ‘3D representation’, and those blocks are: ‘Interfaces’ and ‘GPU/VR Device’.
The input data for the application are the acquired point clouds for which the thermal information is going to be analyzed and explored. These data are read and stored in the scene 3D data, in the first module of the application: the importer. Then, in the second module, an octree is computed and stored with such data. Finally, in the third module the fusion algorithm, explained in section 2.4, is applied and the scene 3D data is updated. This algorithm reduces the number of points of the initial read data and produces a uniform point cloud, where each point has a value associated with the K properties.
The 3D representation is handled by the Unity 3D engine when using 3D meshes. In the case of point clouds, Unity cannot display them natively. Therefore, a special module must be inserted to render point clouds by using special shaders. This module streams the 3D information of the point cloud to the GPU in a specific format.
As a result, the user can observe the 3D data on the VR device’s screens. He/she can interact with the application by using the VR controllers. Some interfaces have been designed to connect the user experience with the 3D data of the scene.
In the next subsections, some elements of the scheme shown above is explained in more detail: the input data, the 3D scene data along its representation, and the interfaces.
3.1. Input Data
Specifically, the input data are given in a single point cloud resulting from the merging, voxelization and fusion of different room scanning sequences. The point clouds of such sequences contain the coordinates, color and temperature of the acquired points and have been previously registered in a common reference system.
These mentioned processes of merging, voxelization and fusion are performed using a C# script that we have developed to prepare the point clouds for the VR application and that is available in [
23]. As a result, the script generates a single point cloud in which each point stores the
-values of the temperature corresponding to each of the scanning sequences.
The file format chosen to store this enriched cloud is the PLY, because this format allows to associate as many scalar properties as desired to each of the points in the cloud, apart from the usual 3D coordinates and colors. Moreover, the PLY is encoded in binary for more compact storage and faster saving and loading.
3.2. 3D Scene Data
The core of the developed application is the 3D scene data whose components are point clouds and 3D objects. Point cloud manipulation and rendering use three different data structures, while 3D objects use the Unity engine's inherent 'game object' elements for management and visualization.
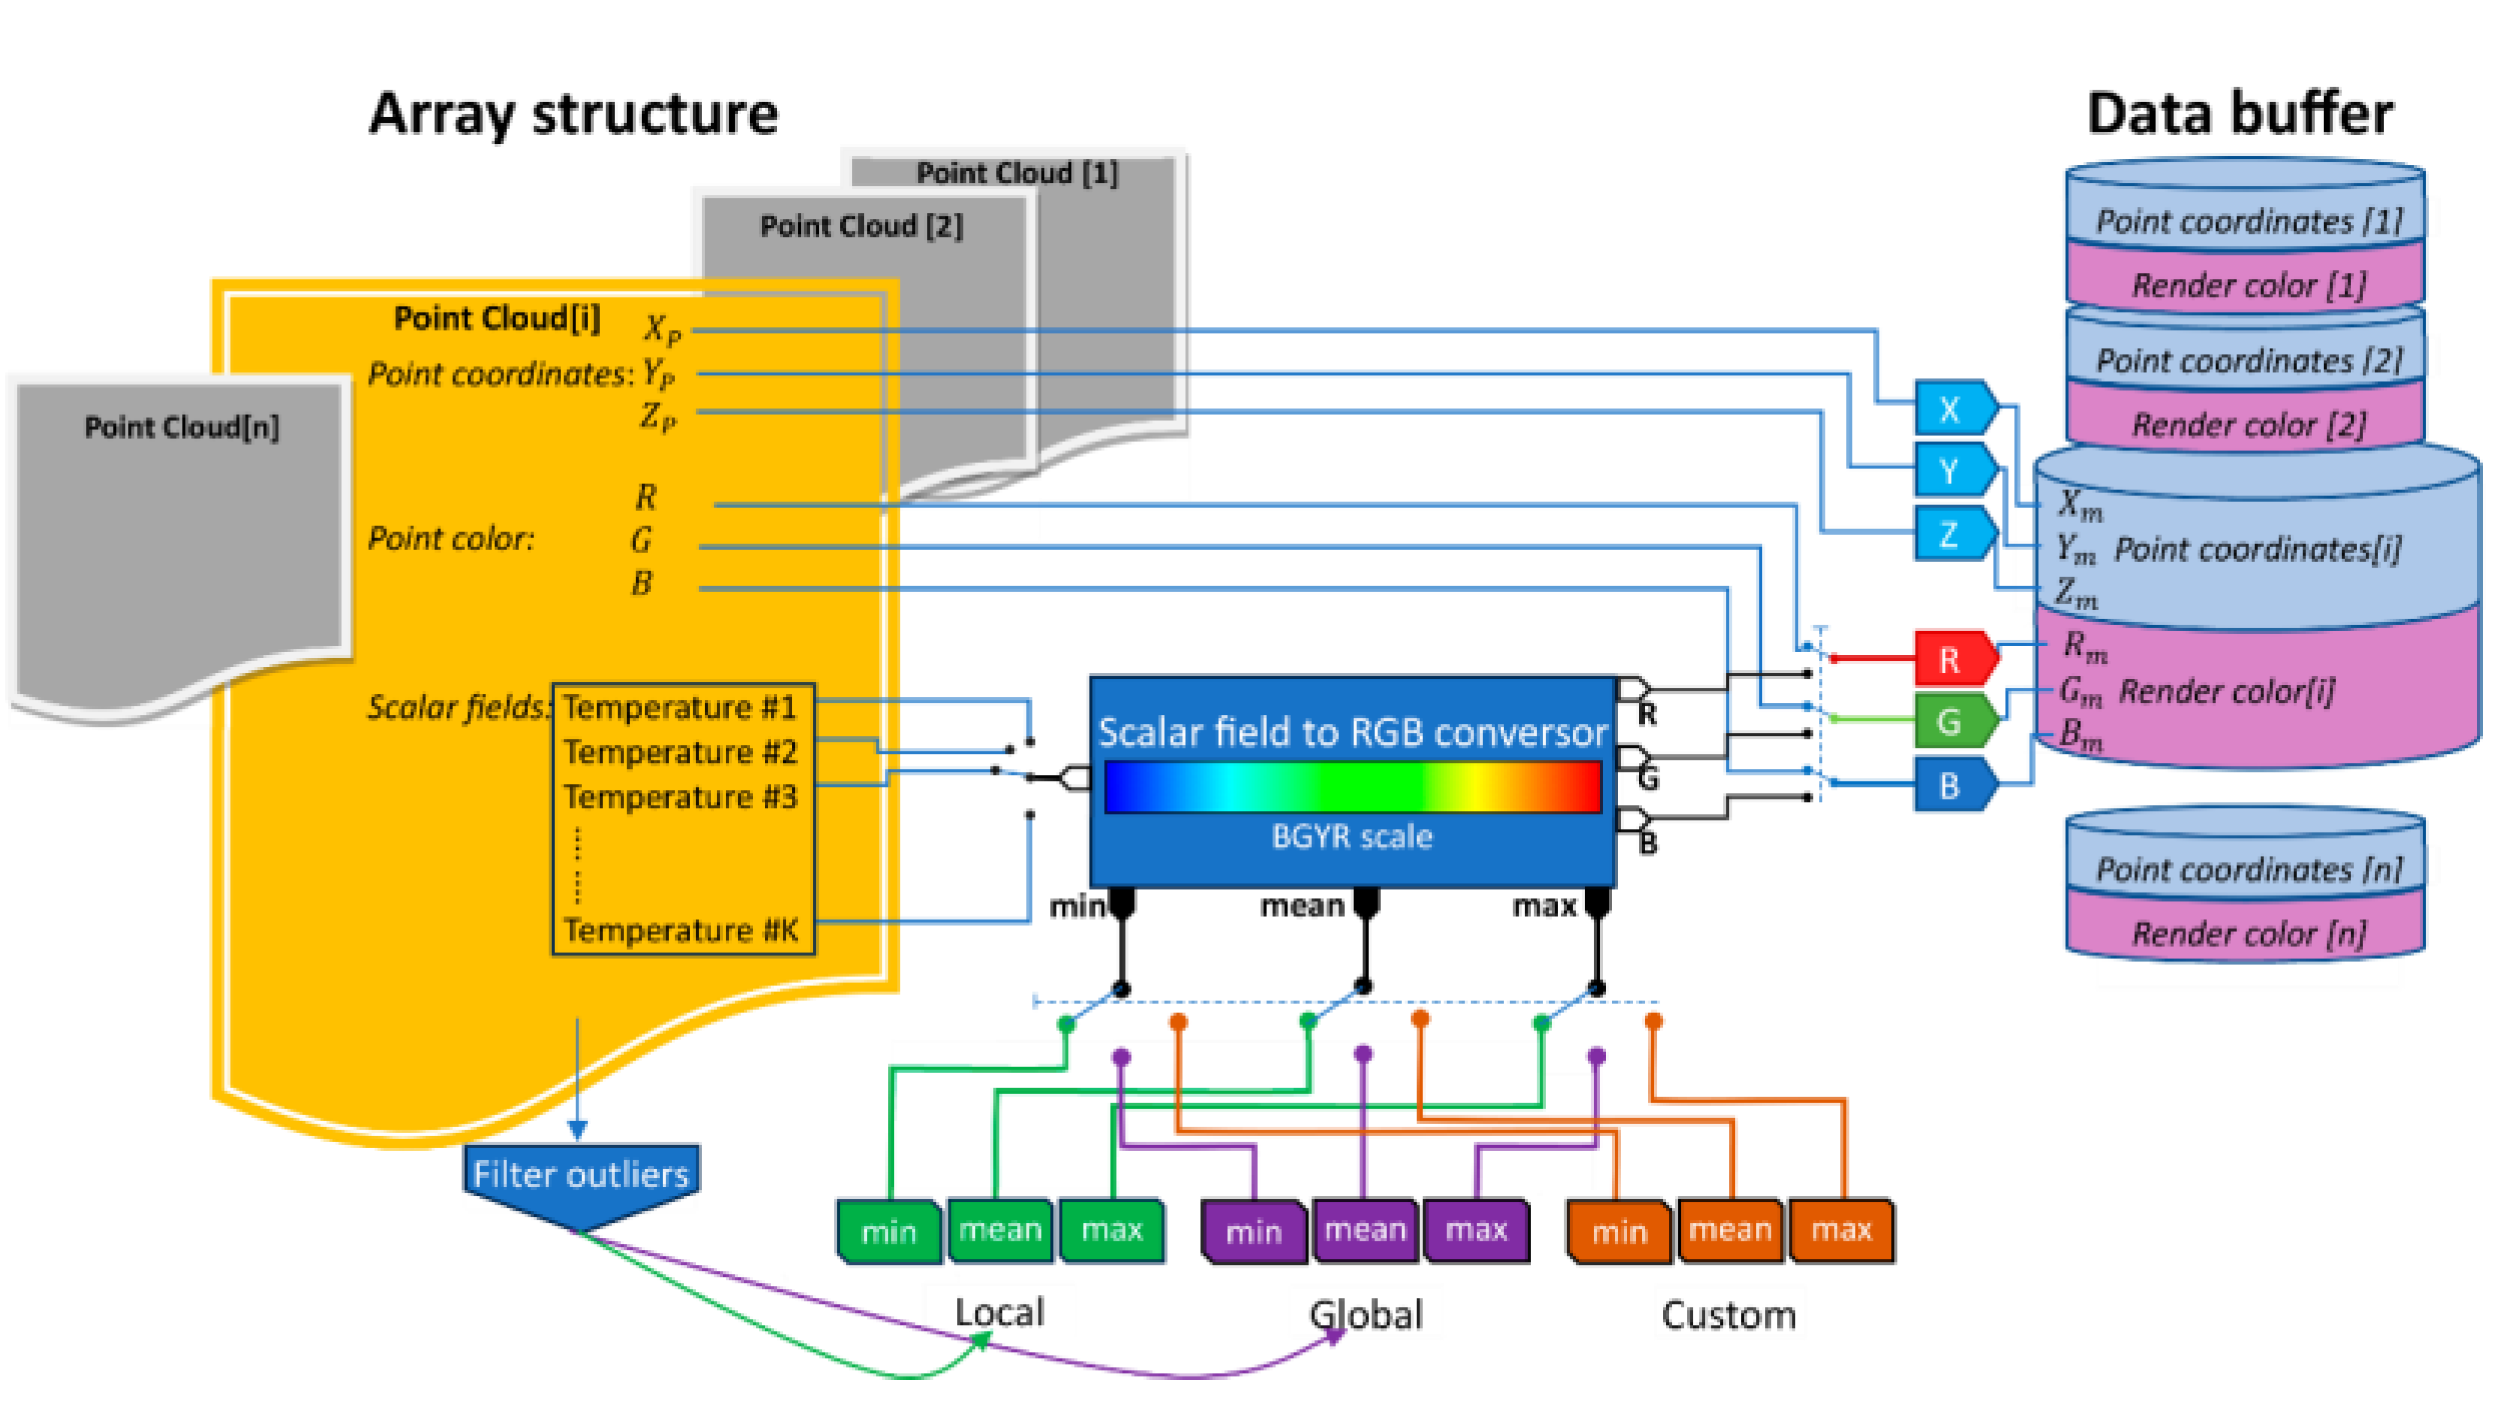
Figure 6 schematizes the composition of the 3D scene data to be managed in the application, where the structures associated with point clouds are represented by hexagons and the rest of the 3D elements (interfaces, 3D meshes…) are represented by a rectangle. A more detailed explanation of the elements of this scheme is given in the following subsections.
3.2.1. Array Structure
The array structure is the storage in memory of all the data to be used in the application related to the point cloud. Regarding the composition of this element, a structure is defined, let's call it
, which contains the data associated with each point in the point cloud, and then an array of these structures,
, is created in which to store the
points in the cloud. Specifically, each
element is composed of a 3D vector containing the
coordinates of each point, a vector containing the RGB components of the color associated with each point and,
scalar values corresponding to the temperature values of the
acquisition instants. The composition of an array structure is schematized in
Figure 7, on the left.
Specifically, two array structures must be created in the application. First, when the importer block reads the PLY file, it stores the data in one of the array structures, which is intended to preserve all the original data read from the input file. Then, since the number of points changes each time the point cloud resolution is changed, the other array structure is responsible for storing the current ‘version’ of the point cloud used in the application.
Therefore, if the resolution of the cloud to be represented is changed in the application, the octree is recalculated with a new node size and the fusion algorithm is applied. To do this, the structure with the original data is used as the basis for generating a new 3D representation of the cloud, and after the fusion algorithm is executed, the array structure is updated with the current version of the cloud.
3.2.2. Octree
The octree is initially created after the importer has read the PLY file. The elements stored in this tree structure are the points defined by the structure described in the previous section. The main parameter to create the octree is the minimum node size κ, i.e. the size of the node from which no further subdivisions are made in the octree. This size is obtained as a function of the number of points in the cloud, ζ; of the dimensions of the bounding box, width (), length () and height (), that contains it and of the number of points
which is set as the maximum that can be contained in the node of minimum size. In this way, the following relationship is obtained:
Since in the linear octree structure it is verified:
where
is the level of subdivision of the octree and η is the number of nodes you have at that level. The subdivision level
to implement to achieve a node size κ can be obtained as follows:
Considering
,
can also be obtained as follows:
Thus, the octree creation process is conditioned by the choice of the number of levels to be computed. This number is set either according to the minimum size of the node to be obtained or according to the maximum number of points to be contained in the smallest node of the octree, using the equations and , respectively.
The octree has two functions in the developed application. The first one is to serve as a voxel grid to perform the fusion algorithm mentioned above, since the smallest nodes of the octree form the voxel grid that is used in such algorithm. This is done after the first import of the data and each time the user increases or decreases the number of points to be displayed, after changing the node size of the octree. The number of points of the cloud to be displayed can be approximately obtained by the equations to .
The second function of the octree is to allow faster searches within the point cloud information, which is of great importance considering the large amount of data that point clouds obtained by laser scanners usually contain together with the corresponding K-property values.
3.2.3. Data Buffer
As mentioned above, many real-time engines such as Unity do not natively integrate a point cloud rendering method. Our proposal extends the work of [
22] to add the feature of 3D colored point cloud representation of additional property values,.
One of the main steps to achieve a point cloud representation is the data transfer to the shader, i.e. a program running on the graphic card (GPU). This transfer is carried out by means of a data buffer, or computer buffer, which contains the 3D coordinates and the color (RGB) of the points to be represented.
A mechanism must be implemented to transform the data from the array structure to the data buffer which is schematized in
Figure 7. Regarding the coordinates, no conversion is required, so they are literally copied into the buffer. As for the color, it depends on what information the user wants to visualize. By default, the original RGB color array is copied to the buffer. However, if one of the scalar fields,
, is to be displayed graphically, a conversion to a specific scale color is required. Each scalar value must be converted to an RGB vector. Specifically, a Blue-Green-Yellow-Red (BGYR) color scale was used, as shown in
Figure 7. The maximum and minimum values,
and
, of the scalar field are assigned a pure red color
and a pure blue color (R:0, G:0, B:255), respectively. The mean value,
, is assigned a pure green color
. The intermediate values are generated by varying the color components linearly, depending on whether the scalar value is in the first half (between min and mean) or whether it is in the second half (between mean and max). Formally, the following color-ramp mapping function is applied to each property value
to obtain its color:
where:
Before selecting the maximum and minimum values, it is advisable to determine whether there are outliers in the measurements. These values can be determined globally, if the scalar fields represent the value of the same property at different instants, or locally or independently for each of the scalar fields, if they represent properties of a different nature. In both cases, the scalar field values must be sorted in ascending order, either from the complete set of scalar field values for all instants in the first case, or from each of the scalar fields separately in the second case. The mean value of the data set,
, is then obtained. Afterwards, the data set is divided in half by finding the center of the data. If you have an odd number of data, you choose exactly the middle number as the middle element. On the other hand, if you have an even number, the midpoint will be between the two middle numbers. That is, in this case the center of the data is the mean of the two central values. For each of the two halves of the data set, lower and upper, the mean values
y
, respectively, are calculated. The value of the interquartile range is:
Lower and upper outliers,
and
, are those values that satisfy the following:
Those values are not considered to compute the maximum and minimum, globally, or locally, of the scalar fields.
3.3. Application Features
The following subsection describes the features that have been included in the developed VR application, so that the result can be useful for exploration and analysis of point clouds with properties.
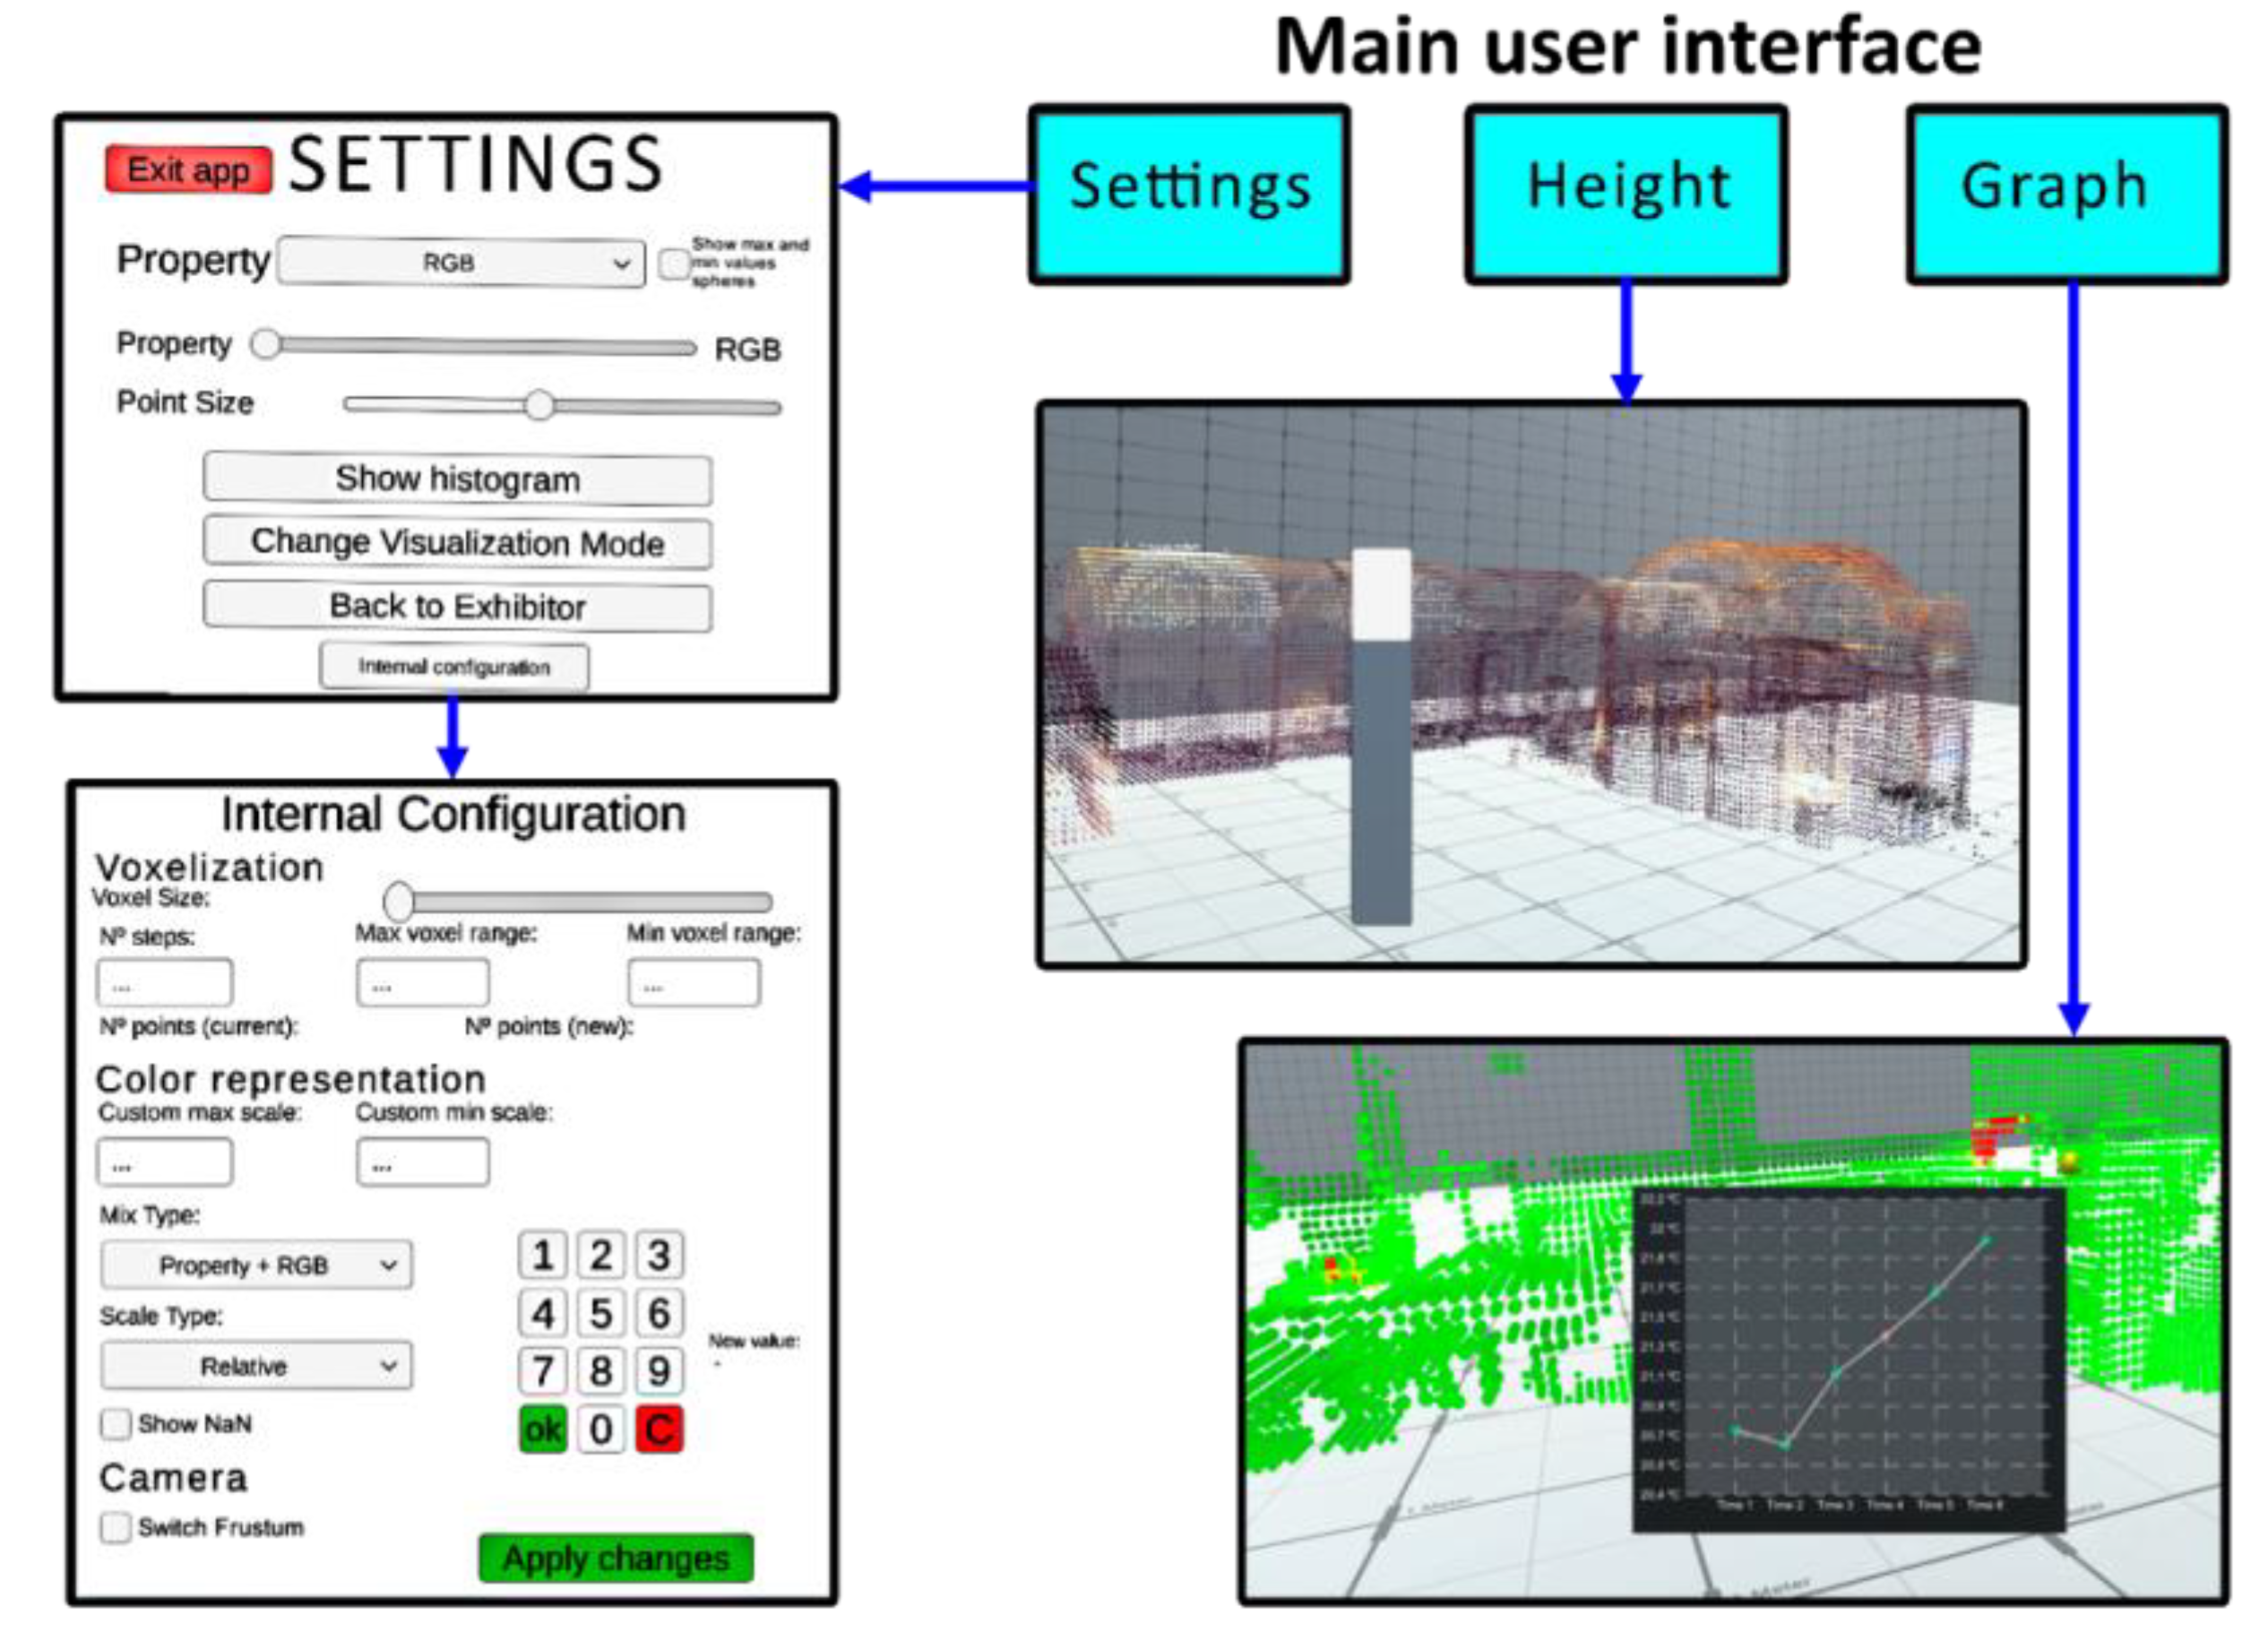
In order to modify or visualize some of the parameters of these features, five interfaces have been designed, which are shown in
Figure 8: Main user interface, Settings interface, Internal Configuration interface, Height Setting, Graphical Representation. All of them are accessible with the VR controllers, following the paths schematized in such Figure.
The next subsections explain in detail the different parameters to be adjusted.
3.3.1. Number of Point Customization
The point clouds obtained with of current acquisition devices contain a high number of points, a number that increases as the digitized area increases, such as the number of rooms, floors of a building, etc. Although it has already been mentioned that in the developed application reduction and homogenization of the point cloud is applied, the resulting number of points is high. The real-time representation of these data is highly conditioned by the hardware of the device in which the application is executed. The application includes the possibility of modifying the number of points to be displayed in real time within certain limits. With the slider, shown in the Internal configuration interface (
Figure 8), the user selects the new voxel size to recompute the points in the cloud. After selecting the new value, a text with the estimated new number of points is presented, so that the user can decide whether to apply such a new value. This involves a recomputation of the octree followed by a re-run of the fusion algorithm, as shown in the
Figure 5.
On the other hand, to optimize the real-time representation the computation of the camera frustum can be forced with the checkbox of the Internal Configuration interface (
Figure 8). In this mode, when the camera moves (the user with the VR headset) the points inside the camera frustum are marked and only these points are inserted into the data buffer to be rendered. This improves performance, although in some cases there may be some missing information in the periphery of the image. This is especially useful when more than one cloud is imported into the scene.
3.3.2. Point Size
When displaying point clouds, the lack of surface information and the lack of occlusion between the elements that make up the model means that the user can "see through", e.g., in a model of a building, the user can see through the walls into the other rooms of the building, causing some confusion when exploring the point clouds.
One way to improve this aspect is to force an increase in the occlusion of the model elements, which can be achieved by increasing the size of the points.
The possibility to modify the size of the point by means of a slider bar has been added to the settings interface (
Figure 8). If
is the average distance between neighboring points in the cloud, the point size can be varied between
and
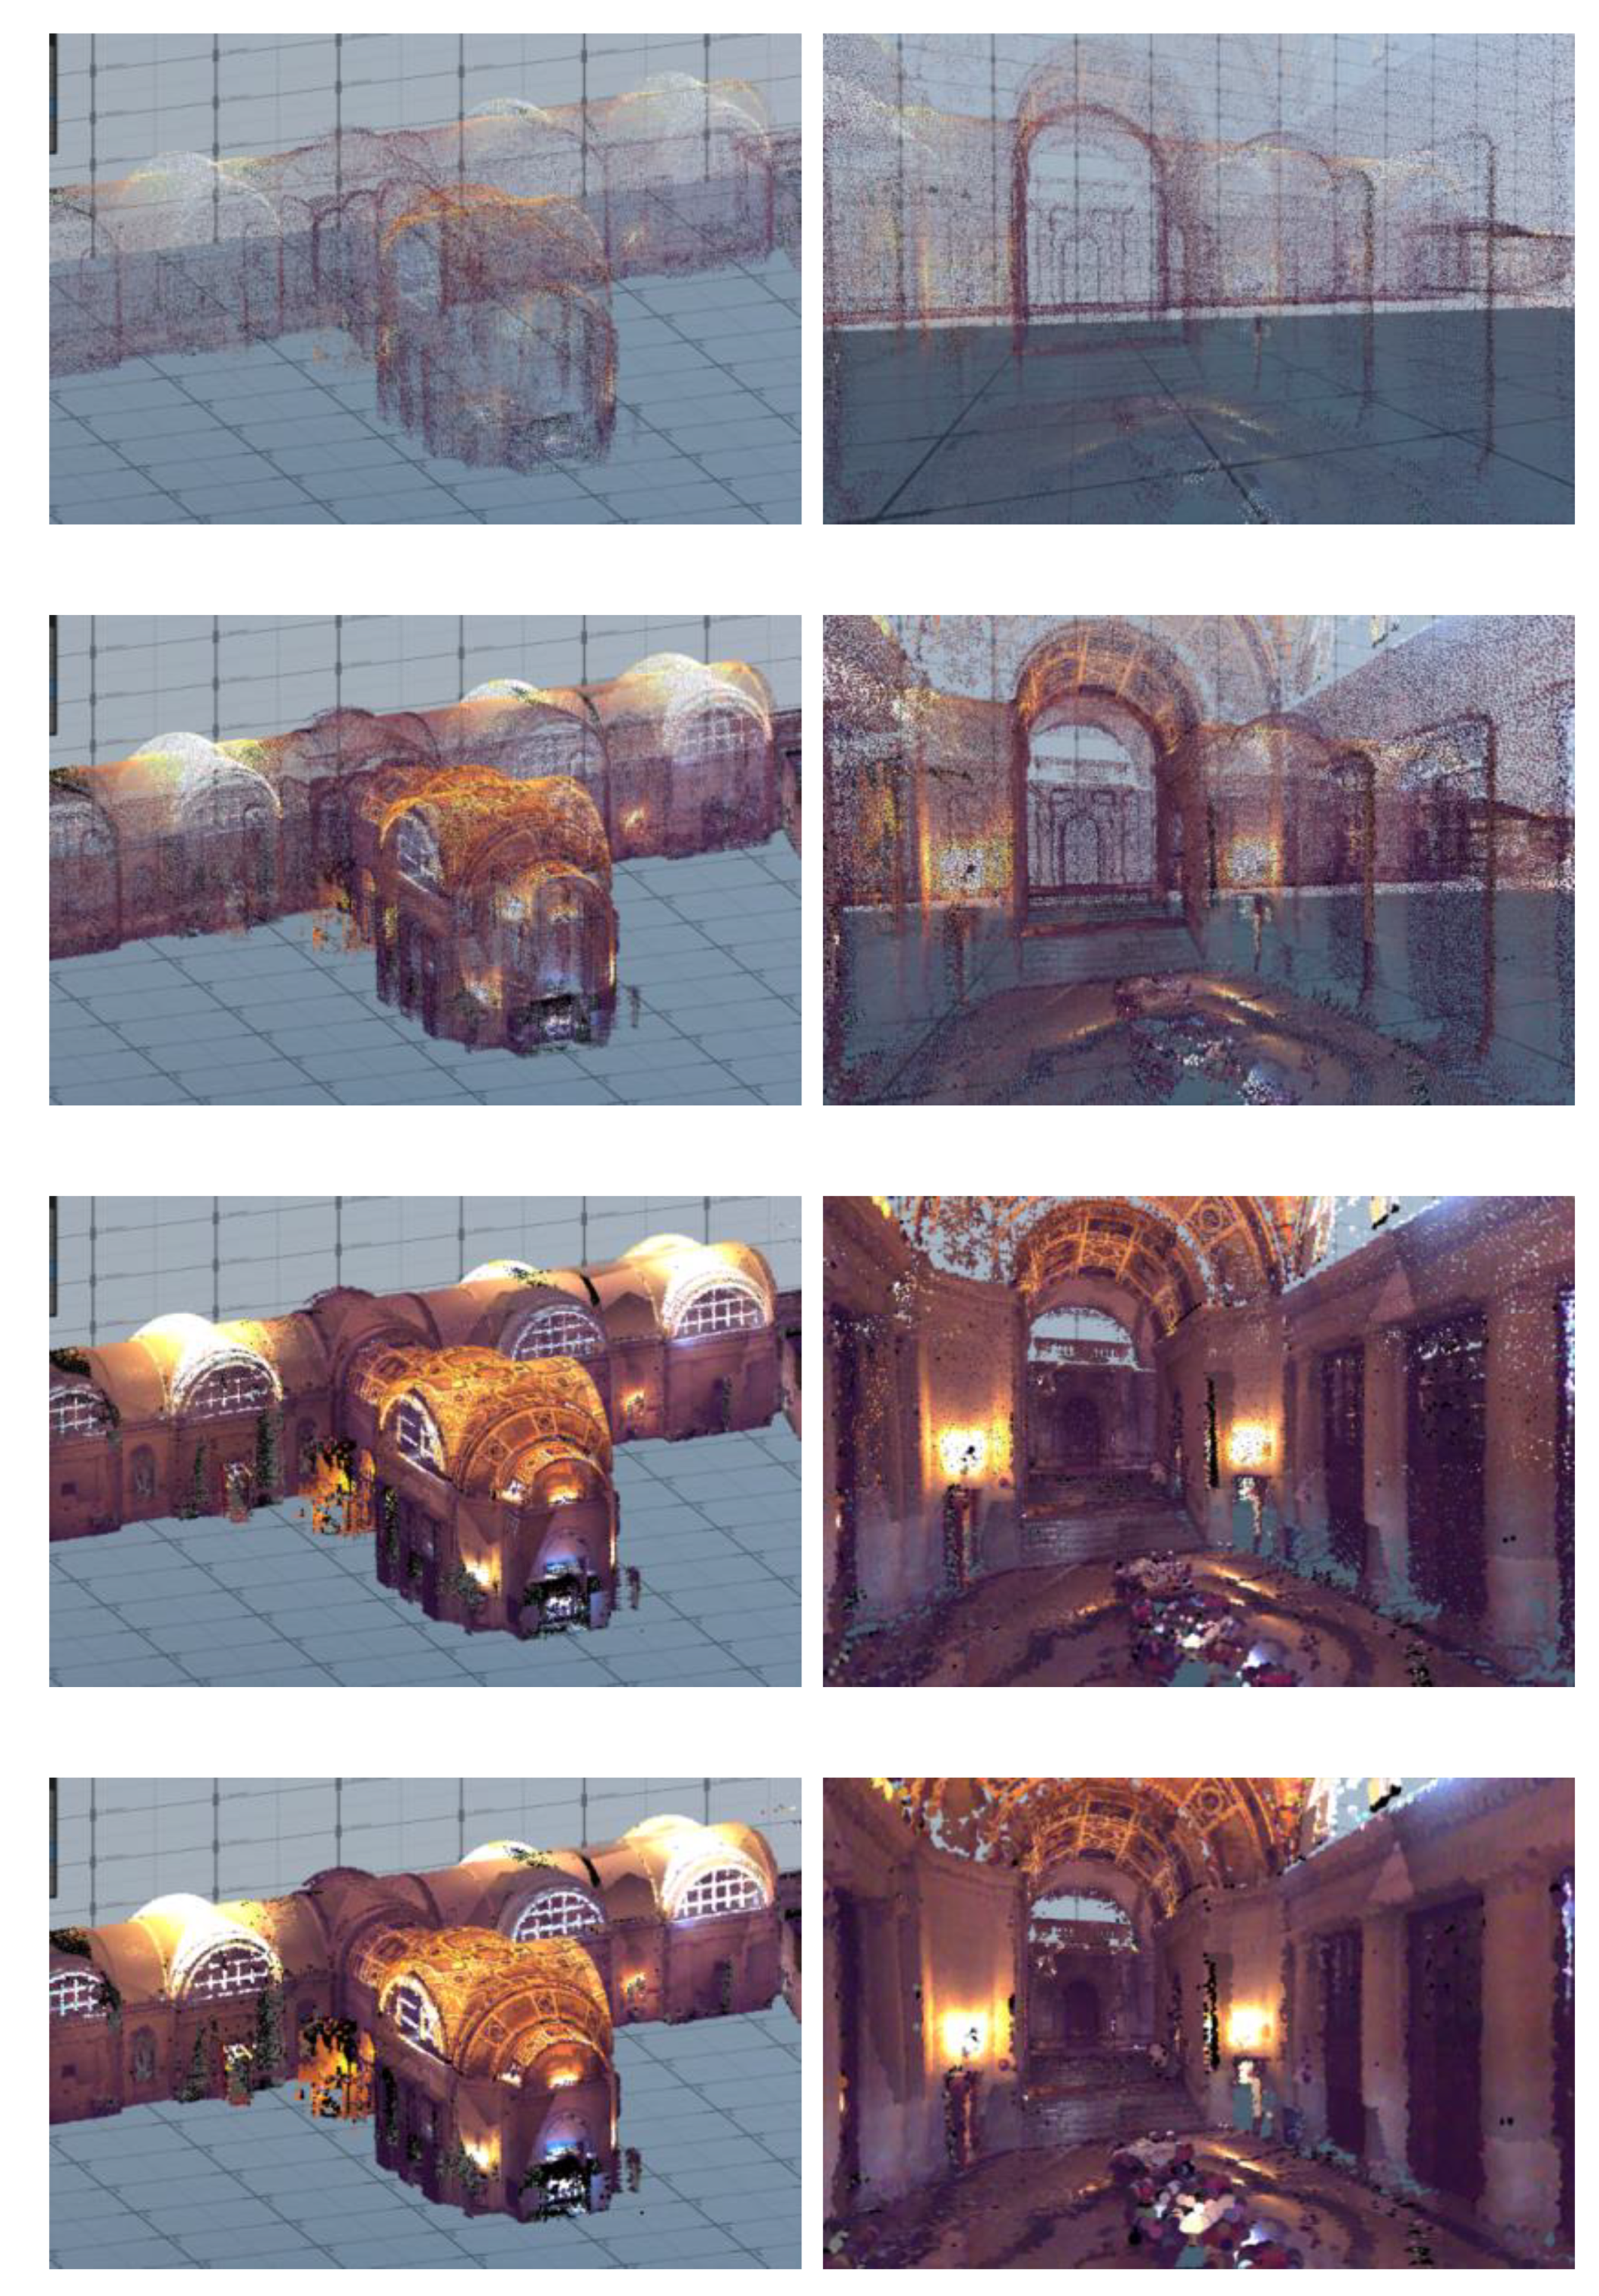
. Some examples of point sizes for the point cloud of a building are shown in
Figure 9.
3.3.3. Property Color Visualization
When a property is selected in the Settings interface, the scale conversion discussed in the 'Data buffer' section is applied. This conversion is conditioned on the maximum, average and minimum values of each scalar field. The user has three options: calculate a global maximum and minimum for all the scalar fields, calculate the local maximum and minimum for each scalar field or enter both values manually. These options are accessible in the ‘Color representation’ section of the Internal Configuration interface of the VR application (
Figure 8).
After the user selects the maximum and minimum of the scalar field to be displayed, the coordinates and the corresponding scalar field, converted to the RGB space, of each point are inserted into the data buffer.
As explained in section 3.2, it is possible to display both the actual color or texture information, if the cloud contains it, and the variation of property values on the BGYR scale. Unless a very simple model is being scanned, such as a single room in a building, displaying the properties on such a color scale can lead to the confusion mentioned above. Here, it is helpful to include texture information mixed with the BGYR scale. In this way, the user can perceive both the color variation associated with the variation of the property value and the actual colors of the elements, which helps the user to identify familiar areas (doors, windows, furniture, tiles...) and to have reference points during exploration.
To perform this blending, the user is offered two options. The first one applies the proposal of [
24] and performs the weighted mixing between the property value and the grayscale conversion of the color or texture of the point cloud. Specifically, the resulting color of each point,
, in the proposed new scale is:
where
,
and
are obtained from equations (12) to (15), γ is a factor between 0 and 1 that allows the brightness to be adjusted,
is the function that converts the original color
to grayscale, and w(t) is the following weighted function:
The other offered option is to mix the property value with the color or texture of the point cloud. In this case, the resulting color of each point,
, in the proposed new scale is:
where
,
and
are obtained from equations (12) through (15), and
is a mixing factor between 0 and 1.
A slider bar is included in the interface for the user to adjust both and , to the value that provides the best visualization of the mixture.
An example of these two mixture types for the property visualization is shown in
Figure 11. On the left, the property values (converted to BGYR scale) blended with the grayscaled values of the original RGB colors of the cloud are represented, with different values of γ: 0, 0.3, 0.6 and 1. On the right, the property values (converted to BGYR scale) blended with the original RGB colors of the cloud are shown, with different values of Ε: 0, 0.3, 0.6 and 1.
3.3.4. Analyzing Property Values
The developed application allows the reading of PLY point cloud files with up to scalar fields. As mentioned before, these can consist of values of different properties (color, intensity, luminance, temperature, ...) or the value of a single property captured at different instants. From the application interface, the user can toggle between displaying the original cloud color and the scalar fields using a dropdown.
Once one of the properties is selected, a histogram representation of the values of that property, with 8 equal-width intervals between the maximum and minimum of the property can be activated, from the Settings interface (
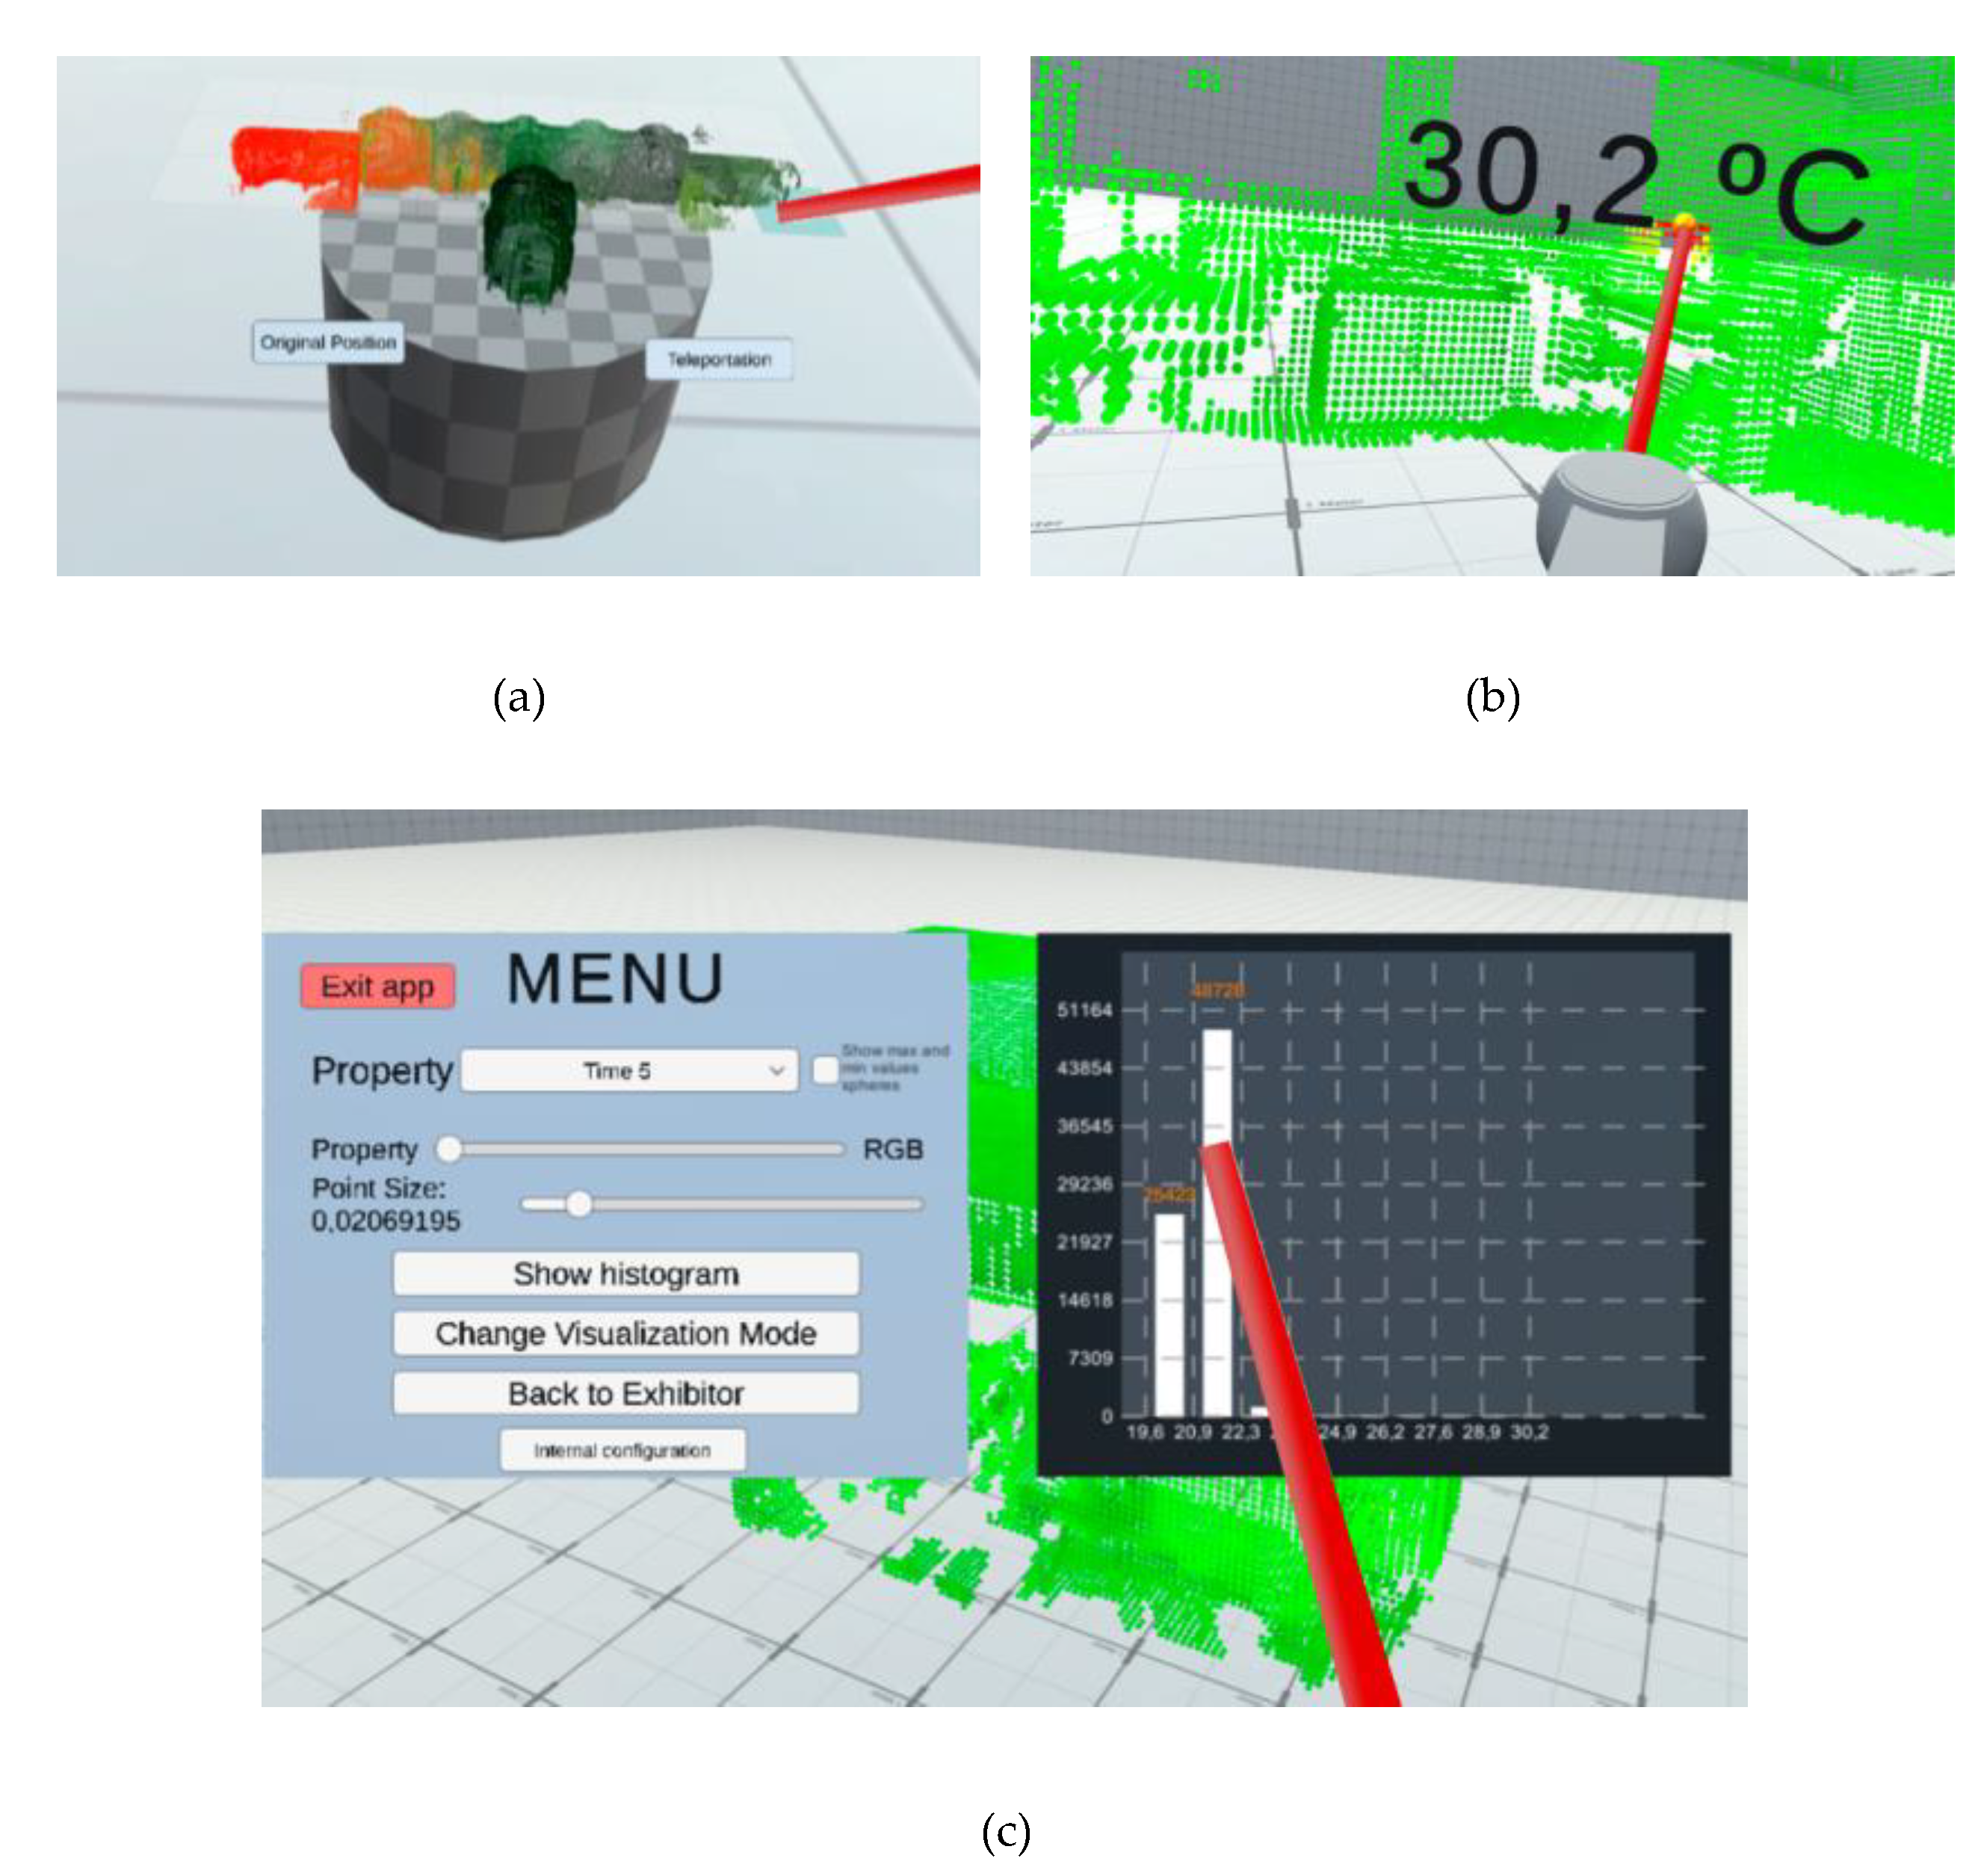
Figure 8). As the user interacts with each bar of the histogram using the VR controller, the number of points within that bar is displayed, as shown in
Figure 12.c. This option can be useful to adjust the maximum and minimum of the color scale, which was explained in ‘Property color visualization’ section.
In the case that the cloud contains the value of a property, acquired at different instants, it may be interesting to study its evolution over time. For this purpose, the interface offers the possibility to activate the visualization of the time graph. This also activates a virtual stick on one of the VR controllers. When one of the points is touched, a floating graph with the time evolution of the property value at that point is displayed.
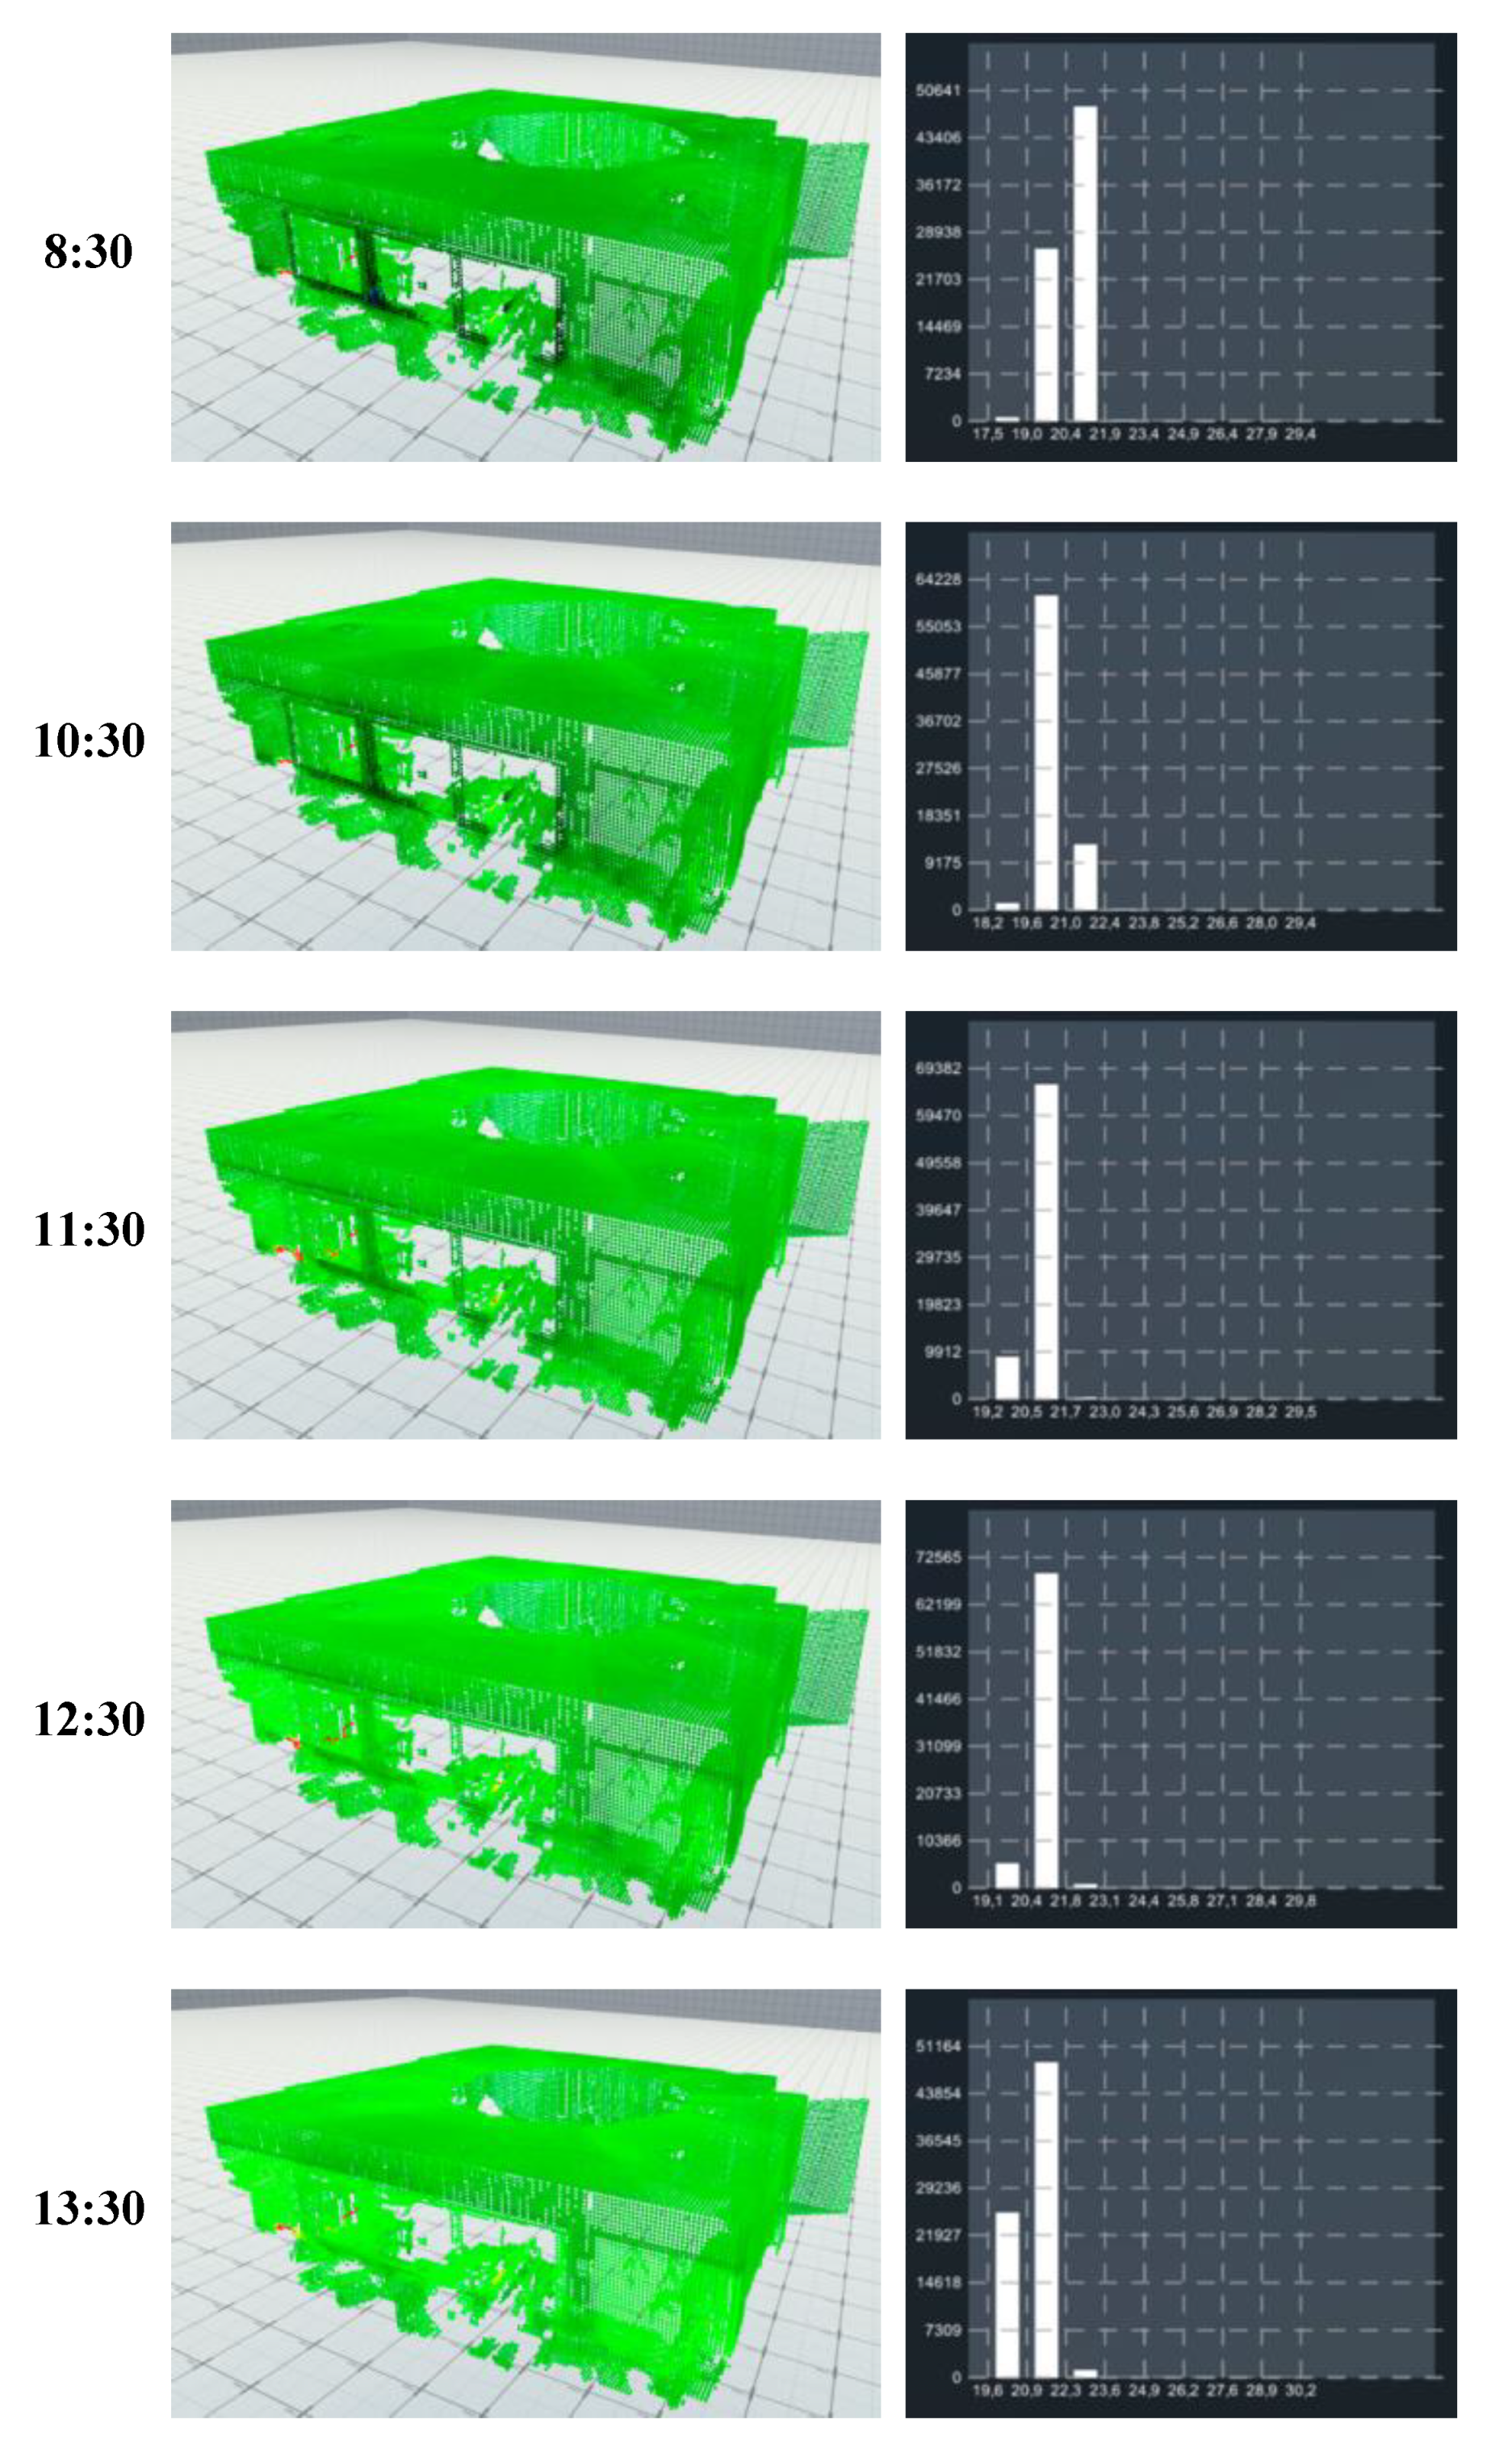
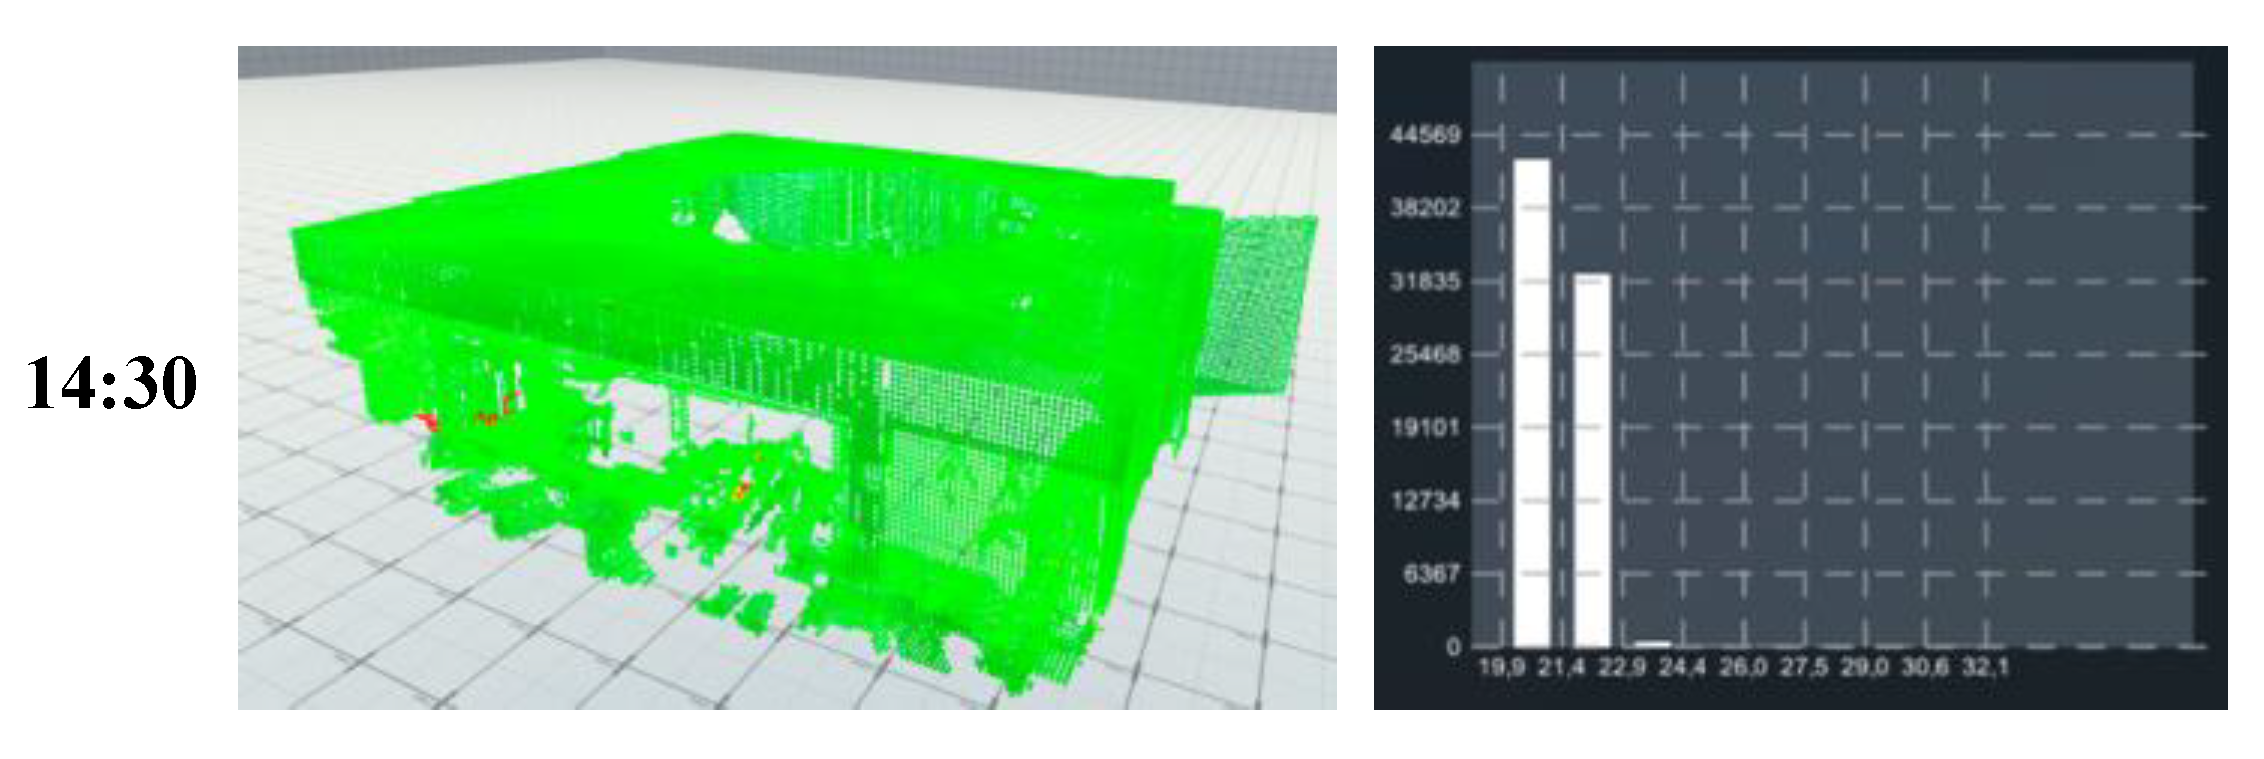
An example of temperature measurement for the interior of a building at different times with the corresponding histograms plots is represented in
Figure 12. The time graph for one of the points of such building is shown in
Figure 8.
On the other hand, when the user activates the display of a property, a virtual stick is activated on one of the VR controllers, allowing the user to probe the value of the property at each point. This is done by selecting a point with the virtual stick and a floating text informs about the value of the property, as shown in
Figure 11.b.
Another feature available in the interface is the possibility to activate the display of a red sphere and a blue sphere, at the points where the property value is maximum and minimum respectively.
Finally, regarding the property values, in section 2.4, the situation of points with no value for a property was considered. In this case, a NaN value is assigned to such property. When displaying properties with NaN values assigned in some points, a neutral gray color is applied to them. However, the user can disable the visualization of points with NaN values via the interface, using the checkbox in the ‘Color representation’ section of the Internal configuration interface (
Figure 8).
3.3.5. Point Cloud Exploration
The virtual scene into which the point cloud is inserted, basically consists of a box with a texture of a 1-meter grid in both directions, which serves as a spatial reference for navigation. The user’s locomotion within the scene uses the conventional VR technique of teleportation, which allows ground-constrained motion within the reference box. The user-adjustable height parameter for teleportation is set via a slider in the main menu (
Figure 8).
An additional miniature exploration mode provides a scaled rendering of the entire cloud on a cylindrical base that acts as an examination table (
Figure 11.a). This provides the user with complete view of the cloud, which can be useful for global surveys of property variations throughout a building. In addition, the user can select a location on the miniaturized cloud and then teleport and resume inspection of the full-scale point cloud.
4. Discussion
This paper presents a methodology for the fusion of multiple point clouds acquired from random locations and at different instants, resulting in point clouds enriched with static and dynamic properties that can vary over time. The proposed approach first registers and merges the different point clouds into a single set of aggregated points. Then, voxel-based fusion is applied to reduce the point density while preserving information about the evolution of properties through temporal aggregation. This optimization balances competing factors such as model detail and real-time interactivity. The fused point cloud, which combines spatial and temporal information, is used in a VR application developed for interactive visualization, exploration, and analysis, which is publicly available at the URL mentioned in
Section 3.
The VR system allows intuitive interaction with the enriched point clouds. Although real-time point clouds can be represented in Unity in a way that is not easily accessible, there are no alternatives like this one where the users can explore 3D geometry merged with time-varying thermal attributes through a color map overlay. Interactive interfaces facilitate the analysis of graphical temperature trends at points and the generation of histograms to study value distributions. The application highlights the potential of VR as a tool for point cloud inspection when enriched with multifaceted data such as thermal properties.
It is necessary to remember here that although the application has been focused on the use of temperature values, it is easily scalable to accept other properties that have been acquired (time, luminance...).
The fact of orienting the application to the use of the temperature variable has been due to the need to create an application focused on the improvement of predictive maintenance tasks as well as the energy optimization of existing buildings.
However, it is important to recognize the inherent limitations of this approach. The reliance on hardware for real-time visualization and the management of large volumes of data are challenges that require up-front usage analysis for each building in which it is intended to be used. Data obtained from 3D scanners contain a large volume of points. In the proposed methodology, a prior registration of these point clouds is required, so that they can be introduced into the virtual reality application. The result provided by the point cloud fusion algorithm will be affected by the accuracy with which such registration has been performed. In addition, although the application includes functionalities to vary the representation resolution, it is necessary that the initial cloud has a previous reduction applied so that the application can manage its loading.
On the other hand, the accuracy of the representation of thermal properties is conditioned by the quality of the input data, which underlines the importance of calibration and validation of the capturing devices. It has been found that the Leica BLK360 sensor does not provide consistency of measurements over measurements taken at close time instants.
There is considerable potential for extending this research. The exploration of more advanced data compression techniques, improved fusion algorithms, and the integration of new properties into point clouds are areas of planned activity. These advances could facilitate the adoption of these technologies in a wider range of applications, from cultural heritage preservation to urban planning.
Specifically, our future work includes improving the fusion methodology to include more complex spatiotemporal alignments and aggregations and improving the VR software by incorporating automatic anomaly detection based on property analysis, implementing collaborative multi-user interaction, and deploying it on additional VR platforms, such as standalone, where resource optimization is a critical factor.
Overall, this research demonstrates a proof-of-concept for merging point clouds from different instants into unified models that can uncover hidden temporal patterns in spatial point data. The proposed techniques help advance the use of point clouds for building modeling, energy efficiency, and other applications that require characterization of dynamic behavior.
Author Contributions
For research articles with several authors, a short paragraph specifying their individual contributions must be provided. The following statements should be used “Conceptualization, E.P.; methodology, E.P.; software, E.P. and A.E.; validation, S.S.; formal analysis, P.M. and S.S.; investigation, E.P. and P.M.; resources, S.S. and A.E.; data curation, A.E.; writing—original draft preparation, E.P. P.M. and S.S.; writing—review and editing, P.M. and S.S.; visualization, E.P. and P.M.; supervision, S.S. and E.P.; project administration, P.M.; funding acquisition, P.M. All authors have read and agreed to the published version of the manuscript.
Funding
This research was funded by the Agencia Estatal de Innovación (Ministerio de Ciencia. Innovación y Universidades) under Grant PID2019-108271RBC32/AEI/10.13039/501100011033; and the Consejería de Economía, Ciencia y Agenda Digital (Junta de Extremadura) under Grant IB20172.
Data Availability Statement
Acknowledgments
The authors gratefully acknowledge the technical support and the dataset provided by the members of 3D Visual Computing & Robotics Lab of Universidad de Castilla-La Mancha, headed by Prof. Antonio Adan. They also acknowledge the initial steps taken by the Master student Samuel Punzón Agudo in developing this proof of concept.
Conflicts of Interest
The authors declare no conflicts of interest. The funders had no role in the design of the study; in the collection, analyses, or interpretation of data; in the writing of the manuscript; or in the decision to publish the results.
References
- Raj, T.; Hashim, F.H.; Huddin, A.B.; Ibrahim, M.F.; Hussain, A. A Survey on LiDAR Scanning Mechanisms. Electronics 2020, 9, 741. [Google Scholar] [CrossRef]
- Otepka, J.; Ghuffar, S.; Waldhauser, C.; Hochreiter, R.; Pfeifer, N. Georeferenced Point Clouds: A Survey of Features and Point Cloud Management. ISPRS Int. J. Geo-Information 2013, 2, 1038–1065. [Google Scholar] [CrossRef]
- Kurkela, M.; Maksimainen, M.; Julin, A.; Rantanen, T.; Virtanen, J.-P.; Hyyppä, J.; Vaaja, M.T.; Hyyppä, H. Utilizing a Terrestrial Laser Scanner for 3D Luminance Measurement of Indoor Environments. J. Imaging 2021, 7, 85. [Google Scholar] [CrossRef] [PubMed]
- Gobbetti, E.; Marton, F. Layered point clouds: a simple and efficient multiresolution structure for distributing and rendering gigantic point-sampled models. Comput. Graph. 2004, 28, 815–826. [Google Scholar] [CrossRef]
- Adán, A.; Quintana, B.; García Aguilar, J.; Pérez, V.; Castilla, F.J. Towards the Use of 3D Thermal Models in Constructions. Sustainability 2020, 12, 8521. [Google Scholar] [CrossRef]
- Ramón, A.; Adán, A.; Javier Castilla, F. Thermal point clouds of buildings: A review. Energy Build. 2022, 274, 112425. [Google Scholar] [CrossRef]
- Wang, C.; Cho, Y.K.; Kim, C. Automatic BIM component extraction from point clouds of existing buildings for sustainability applications. Autom. Constr. 2015, 56, 1–13. [Google Scholar] [CrossRef]
- Otero, R.; Frías, E.; Lagüela, S.; Arias, P. Automatic gbXML Modeling from LiDAR Data for Energy Studies. Remote Sens. 2020, 12, 2679. [Google Scholar] [CrossRef]
- Ham, Y.; Golparvar-Fard, M. Mapping actual thermal properties to building elements in gbXML-based BIM for reliable building energy performance modeling. Autom. Constr. 2015, 49, 214–224. [Google Scholar] [CrossRef]
- Fox, M.; Coley, D.; Goodhew, S.; de Wilde, P. Thermography methodologies for detecting energy related building defects. Renew. Sustain. Energy Rev. 2014, 40, 296–310. [Google Scholar] [CrossRef]
- Rodríguez-Gonzálvez, P.; Jiménez Fernández-Palacios, B.; Muñoz-Nieto, Á.; Arias-Sanchez, P.; Gonzalez-Aguilera, D. Mobile LiDAR System: New Possibilities for the Documentation and Dissemination of Large Cultural Heritage Sites. Remote Sens. 2017, 9, 189. [Google Scholar] [CrossRef]
- Szymon Rusinkiewicz and Marc Levoy. 2000. QSplat: a multiresolution point rendering system for large meshes. In Proceedings of the 27th annual conference on Computer graphics and interactive techniques (SIGGRAPH '00). ACM Press/Addison-Wesley Publishing Co., USA, 343–352. [CrossRef]
- Mario Botsch and Leif Kobbelt. 2003. High-Quality Point-Based Rendering on Modern GPUs. In Proceedings of the 11th Pacific Conference on Computer Graphics and Applications (PG '03). IEEE Computer Society, USA, 335.
- Schütz, Markus. Potree: Rendering large point clouds in web browsers" Technische Universität Wien, 2016, Vienna.
- Casado-Coscolla, A.; Sanchez-Belenguer, C.; Wolfart, E.; Sequeira, V. Rendering massive indoor point clouds in virtual reality. Virtual Real. 2023. [CrossRef]
- Virtanen, J.-P.; Daniel, S.; Turppa, T.; Zhu, L.; Julin, A.; Hyyppä, H.; Hyyppä, J. Interactive dense point clouds in a game engine. ISPRS J. Photogramm. Remote Sens. 2020, 163, 375–389. [Google Scholar] [CrossRef]
- Besl, P.J.; McKay, N.D. A method for registration of 3-D shapes. IEEE Trans. Pattern Anal. Mach. Intell. 1992, 14, 239–256. [Google Scholar] [CrossRef]
- Pomerleau, F.; Colas, F.; Siegwart, R.; Magnenat, S. Comparing ICP variants on real-world data sets. Auton. Robots 2013, 34, 133–148. [Google Scholar] [CrossRef]
- Özbay, E.; Çinar, A. A voxelize structured refinement method for registration of point clouds from Kinect sensors. Eng. Sci. Technol. an Int. J. 2019, 22, 555–568. [Google Scholar] [CrossRef]
- Quan, S.; Ma, J.; Hu, F.; Fang, B.; Ma, T. Local voxelized structure for 3D binary feature representation and robust registration of point clouds from low-cost sensors. Inf. Sci. (Ny). 2018, 444, 153–171. [Google Scholar] [CrossRef]
- “VR Point Cloud Analysis.” 3DCOVIM, [Online]. Available: https://github.com/3dcovim/VR-Point-Cloud-Analysis.
- Takahashi, K. keijiro/Pcx: Point cloud importer & renderer for Unity 2021, [Online]. Available: https://github.com/keijiro/Pcx.
- 3DCOVIM, “Point Cloud Fusion Script C#.” [Online]. Available: https://github.com/3dcovim/Point-Cloud-Fusion-Script-C-.
- Javadnejad, F.; Gillins, D.T.; Parrish, C.E.; Slocum, R.K. A photogrammetric approach to fusing natural colour and thermal infrared UAS imagery in 3D point cloud generation. Int. J. Remote Sens. 2020, 41, 211–237. [Google Scholar] [CrossRef]
Figure 1.
Diagram summarizing the set of steps that make up the proposed method.
Figure 1.
Diagram summarizing the set of steps that make up the proposed method.
Figure 2.
a) Raw cloud #1. b) Raw cloud #2. c) Raw cloud #3. d) Raw cloud #4. e) Raw clouds #1 and #2. f) Raw clouds #3 and #4. g) Registered clouds #1 and #2. h) Registered clouds #3 and #4. i) Registered clouds #1, #2, #3, #3 and #4.
Figure 2.
a) Raw cloud #1. b) Raw cloud #2. c) Raw cloud #3. d) Raw cloud #4. e) Raw clouds #1 and #2. f) Raw clouds #3 and #4. g) Registered clouds #1 and #2. h) Registered clouds #3 and #4. i) Registered clouds #1, #2, #3, #3 and #4.
Figure 3.
Overlap, highlighted with shading between the different registered clouds: a) #1 and #2; b) #3 and #4 c) #1, #2, #3 and #4.
Figure 3.
Overlap, highlighted with shading between the different registered clouds: a) #1 and #2; b) #3 and #4 c) #1, #2, #3 and #4.
Figure 4.
a) Point merging when no data is present in any of the clouds. b) Point merging with information from all clouds. c) Point merging using the mean value when more than one point is present in any of the clouds.
Figure 4.
a) Point merging when no data is present in any of the clouds. b) Point merging with information from all clouds. c) Point merging using the mean value when more than one point is present in any of the clouds.
Figure 5.
VR application scheme where: the Importer module reads the point clouds files; the Octree Computation and Fusion Algorithm modules are executed consecutively each time the data resolution is modified, including the first time, after the import and; the Interaction and Visualization is in charge of sending the real time view of the scene to the Virtual Reality user, and receives the commands issued by the user to interact with the 3D scene.
Figure 6.
Types of data that compose the 3D scene data.
Figure 6.
Types of data that compose the 3D scene data.
Figure 7.
Array structure to data buffer conversion. Point coordinates and colors are inserted into the data buffer without any transformation. Scalar fields are converted to the Blue-Green-Yellow-Red RGB scale, in terms of their maximum, mean and minimum values..
Figure 7.
Array structure to data buffer conversion. Point coordinates and colors are inserted into the data buffer without any transformation. Scalar fields are converted to the Blue-Green-Yellow-Red RGB scale, in terms of their maximum, mean and minimum values..
Figure 8.
Interfaces included in the VR application: Main user interface (Settings, Height and Graph buttons); Settings; Internal Configuration.
Figure 8.
Interfaces included in the VR application: Main user interface (Settings, Height and Graph buttons); Settings; Internal Configuration.
Figure 9.
Point size variation in a building point cloud. From top to bottom: 0.01, 0,02, 0,04 and 0,08 m in an external (left) and internal (right) view of the building.
Figure 9.
Point size variation in a building point cloud. From top to bottom: 0.01, 0,02, 0,04 and 0,08 m in an external (left) and internal (right) view of the building.
Figure 10.
Two mix types for the property visualization. On the left, property value (converted to BGYR scale) + grayscaled values of the original RGB colors of the cloud. From top to bottom, different values of γ were applied (0, 0.3, 0.6 and 1). On the right, property value (converted to BGYR scale) + original RGB colors of the cloud. From top to bottom, different values of were applied (0, 0.3, 0.6 and 1).
Figure 11.
(a) Exploration and analysis of a point cloud miniature. The user can select the point to be transported to.; (b) Survey of temperature mode to obtain the specific value of a property at any point. (c) Activation of histogram for a property and interaction over the bars to show the number of points lying on an interval.
Figure 12.
Example of temperature acquisition for the interior of a building at different times with the corresponding histograms representations.
Figure 12.
Example of temperature acquisition for the interior of a building at different times with the corresponding histograms representations.
|
Disclaimer/Publisher’s Note: The statements, opinions and data contained in all publications are solely those of the individual author(s) and contributor(s) and not of MDPI and/or the editor(s). MDPI and/or the editor(s) disclaim responsibility for any injury to people or property resulting from any ideas, methods, instructions or products referred to in the content. |
© 2024 by the authors. Licensee MDPI, Basel, Switzerland. This article is an open access article distributed under the terms and conditions of the Creative Commons Attribution (CC BY) license (http://creativecommons.org/licenses/by/4.0/).

