1. Introduction
Hercules X-1 (Her X-1) is a persistent X-ray binary pulsar, with considerable interest because its pulsations and near edge-on inclination have allowed precise determination of binary parameters. Another reason for interest in this system is its regular 35-day cycle caused by its precessing accretion disk ([
1] and references therein). The binary consists of a neutron star (Her X-1) and its stellar companion (HZ Her) with masses ∼1.5
and ∼2.2
, respectively [
2,
3].
The X-ray binary system Her X-1/HZ Her radiates in optical, ultraviolet, EUV and X-ray bands. Ref. [
4] showed that systematic variations of the 1.7 d optical lightcurve of HZ Her gave strong evidence for a Roche-lobe filling precessing accretion disk. EUV emission comes from the inner disk and from the irradiated surface of the companion star [
5]. Hard X-rays (
keV) are created by accretion of matter onto the polar cap [
6,
7] of rotating neutron star. The phase shift of the soft X-ray pulsations was identified with reprocessing in the inner disk [
8]. The 35-day cycle in X-ray and optical flux are caused by a precessing accretion disk [
9,
10] which also causes the 35-day cycle in pulse shape variations [
1]. This 35-day cycle and accretion disk have been modelled by [
11,
12,
13,
14]. The neutron star is directly visible during MH State and, for a short time, during SH State but not during LS. Absorption dips [
15], also called dips, were shown to be caused by the accretion stream [
16]. A study of X-ray eclipses observed by Rossi X-ray Timing Explorer (RXTE) confirmed the presence of the scattering corona in the system [
17]. Thus Her X-1 exhibits complex behaviours which can be understood in terms of the geometry of the binary, the accretion disk, the accretion stream and the larger scale corona in the system.
AstroSat [
18] has four co-pointed science instruments that provide simultaneous coverage over a wide energy range. The bands are near and far ultraviolet (NUV and FUV) with the UVIT instrument, and soft through hard X-rays with the SXT, LAXPC and CZTI instruments. SXT covers the energy ranges ∼0.3-8 keV and is described in [
19]. LAXPC is sensitive to the 3-100 keV band and CZTI is a coded mask imager in the 25-150 keV band.
Here we analyze AstroSat SXT observations of Her X-1. The goals are to study the X-ray spectral changes of Her X-1 over the 35-day cycle in its various states; and to measure spectral changes in eclipses and in dips with 35-day phase. In
Section 2 and
Section 2.1, we describe the observations and lightcurves, which are used to select data for spectral analysis. In
Section 2.2, we analyze the spectrum of Her X-1 during MH, SH, LS, eclipse and dips and give the main results in
Section 3. We discuss our results and compare with previous work in
Section 4.
2. Data and Analysis
Her X-1 was observed in multiple observing sessions with the AstroSat SXT in PC mode, with a time resolution of 2.3775 seconds. The observations were carried out for the program of one of the authors (D.L.) as Astrosat proposal numbers A07_ 113, T03_197, A10_005 and A12_004. The observation dates were February 21-24, 2020 for A07_ 113, April 28-30, 2020 for T03_197, September 17-21, 2021 for A10_005 and February 26 - March 1, 2023 for A12_004.
The resulting data was downloaded from the AstroSat Data Archive (website http:// astrosat-ssc.iucaa.in/data_and_analysis), We used the LEVL2 data for our analysis, which has been generated by the AstroSat Team from LEVL1 data with the software pipeline ’sxtpipeline’. This pipeline removes bad events, updates good time intervals (GTIs) and headers, and generates clean, filtered event files which can be used for analysis with standard HEASoft tools (website
https://heasarc.gsfc.nasa.gov/docs/software.html). To select source events, a source region was chosen as a circle of 15 arcmin radius centred on Her X-1.
Each observation included several event files, with each file corresponding to an orbit of the satellite around the Earth. These event files may contain multiple records of events which need to be identified and rejected, then the different orbits need to be merged. This was done using the SXTMerger tool. The tool reads the LEVL2 event lists, bad pixel lists and the GTIs from the event files of different orbits, checks for overlapping event data, and retains only unique events and merges the event lists.
Since the target source and the satellite are in non-inertial (accelerating) frames, the arrival times of the source photons at the detector need to be corrected to an common reference frame where both the emitter and receiver are placed in inertial frames. Additionally, there are relativistic effects due to the motion of the receiver in gravitational fields, which also need to be accounted for. Barycentric correction uses the satellite orbit ephemeris and the position of the target (RA, Dec) and modifies the photon arrival times by placing the satellite at the Solar System’s barycenter. This was carried out by passing the merged event files and the SXT orbit files to the AstroSat Barycentric Correction Code.
2.1. Lightcurve Analysis
To make lightcurves, we used the HEASoft tool Xselect to select the energy ranges, set the time bin size and extract counts for each time bin. The time bin size was set to 38.04 seconds (16 times the time resolution of the PC mode). We selected the energy range of 0.3-8 keV (PI channels 30-799) to create SXT full energy range lightcurves. Lightcurves were also extracted for the energy ranges 0.3-2 keV (PI channels 30-199), 2-4 keV (PI channels 200-399) and 4-8 keV (PI channels 400-799) and used to calculate softness ratios vs. time.
The orbit number (integer plus fraction) of Her X-1 at a given time in MJD is given by:
where
is taken as the reference time (orbital phase 0 for orbit number 0), and
is the average orbital period between T0 and MJD(t), given by
Here, P(T0) = 1.700167590 d is the orbital period at the reference time, and the period at MJD(t) is given by
The period derivative is taken to be constant with value days/day. The orbital phase is the fractional part of .
The HEASoft FITS viewer tool FV was used to add columns for MJD, orbit number and orbital phase (integer and fractional part of ) to each lightcurve file produced by Xselect. The MJD corresponding to each time stamp t (in seconds) was calculated using MJD(t) = t/86400+MJDref, where MJDref = 55197 is the day from which all Astrosat SXT times t are measured.
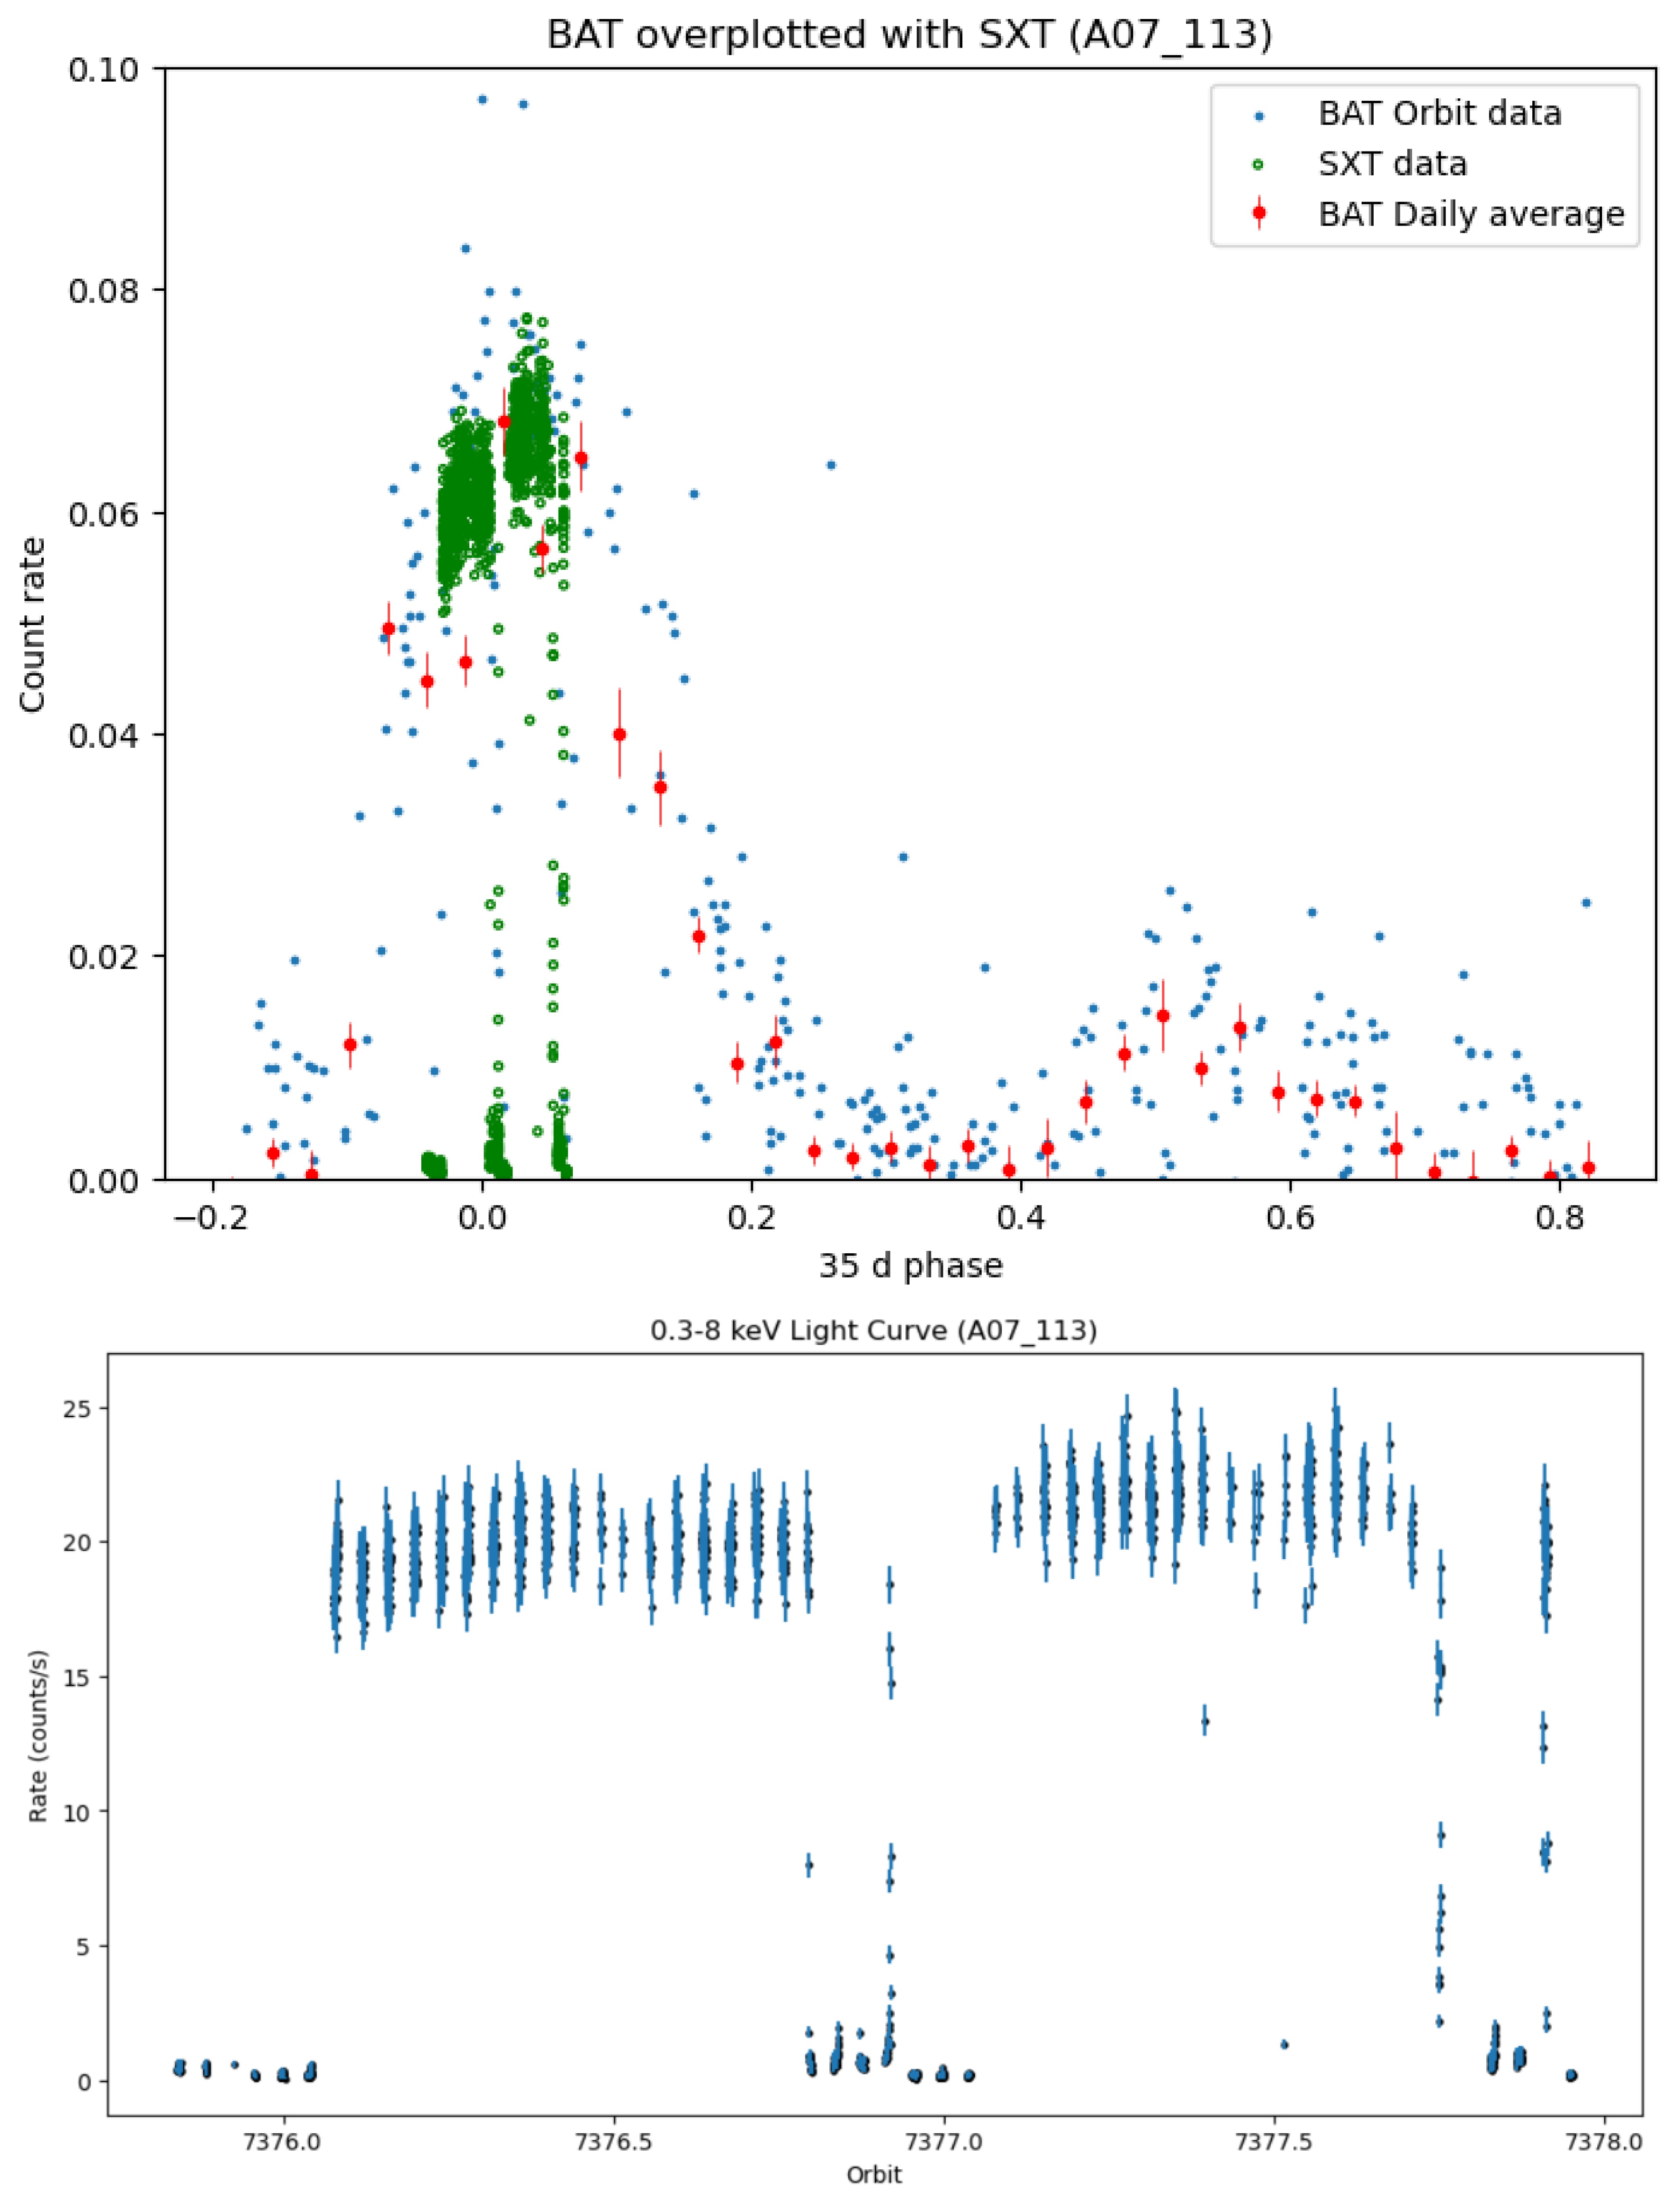
Figure 1 show the SXT 0.3-8 keV band lightcurve for the A07_113 observation vs. 35 day phase, which was determined from the Swift/BAT observations. Here we use the definition of 35-day phase 0 from [
20], which is the peak of the 35-day cycle. The top panel shows the Swift/BAT lightcurve for the same 35-day cycle as the SXT A07_113 data, which is scaled by a constant to match the BAT countrate. The Swift/BAT individual measurements ("Orbit" data) are shown in blue and the Swift/BAT daily averages are shown in red. The bottom panel shows the SXT data vs. orbit number at higher time resolution unscaled (at the original countrate scale). The eclipses are clearly visible each orbit between orbital phases of 0.93 and 0.07. The countrate decreases prior to orbital phase 0.93 are pre-eclipse dips, which was verified using the softness ratios.
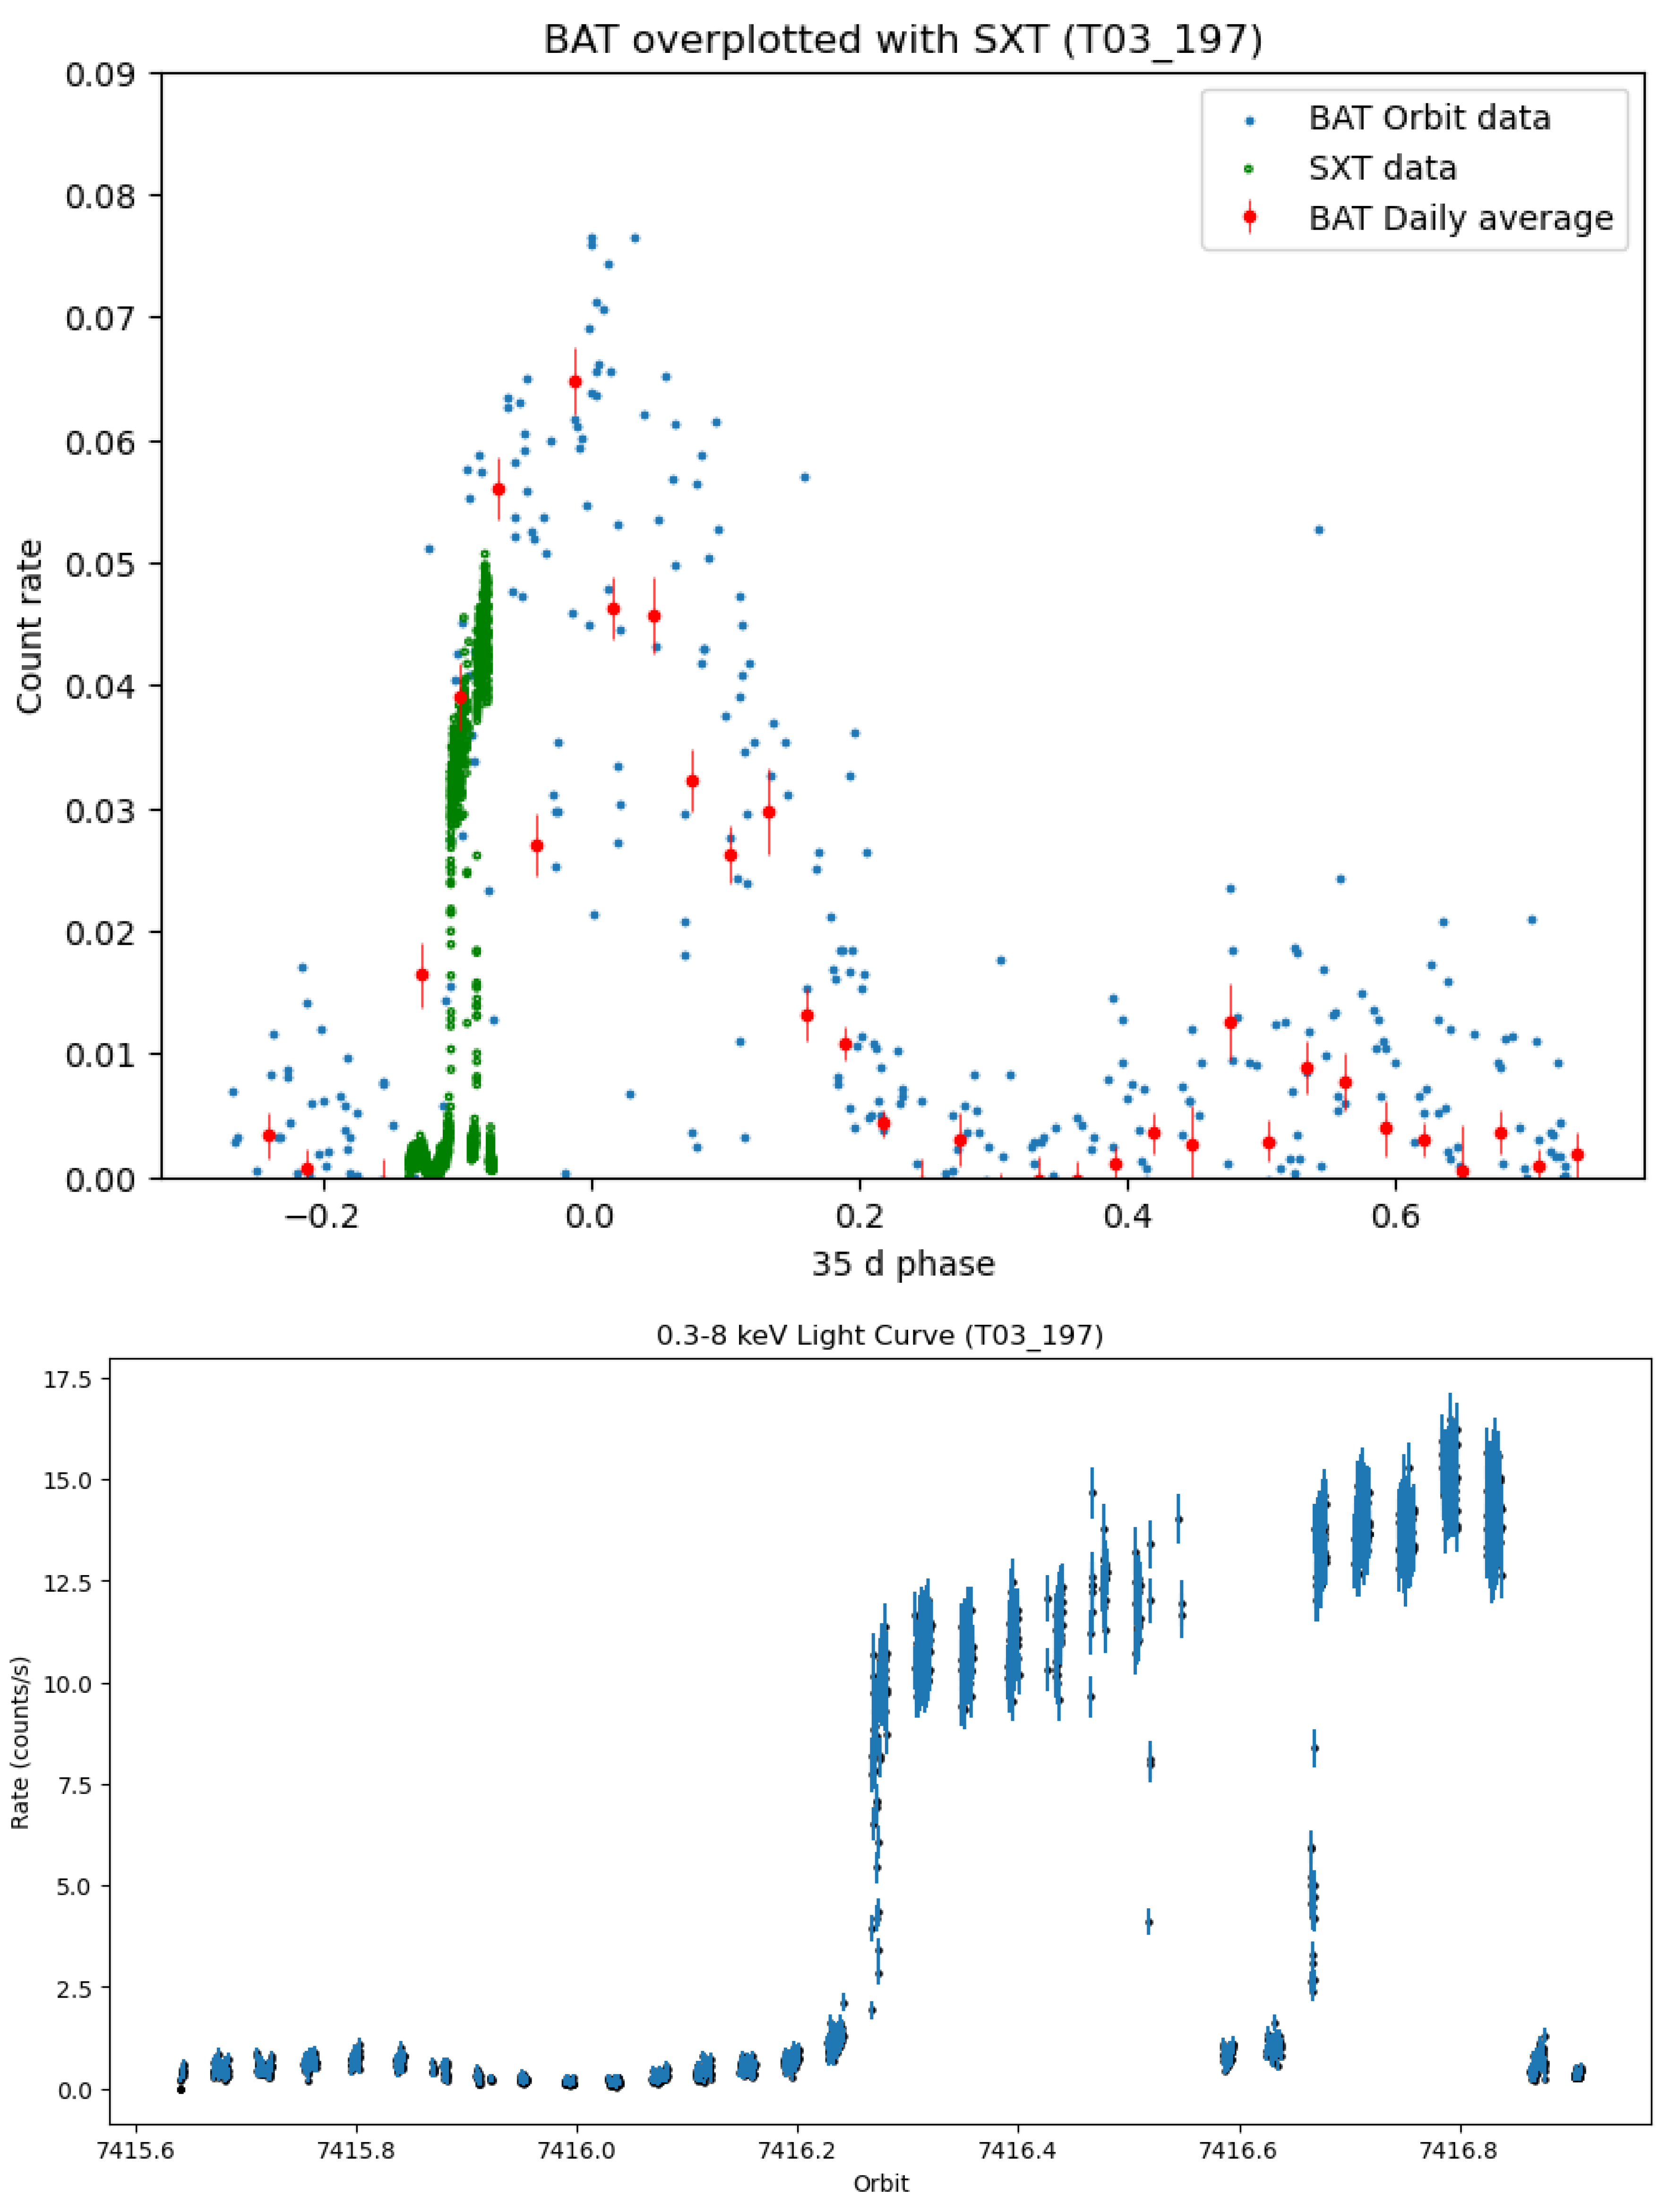
Figure 2,
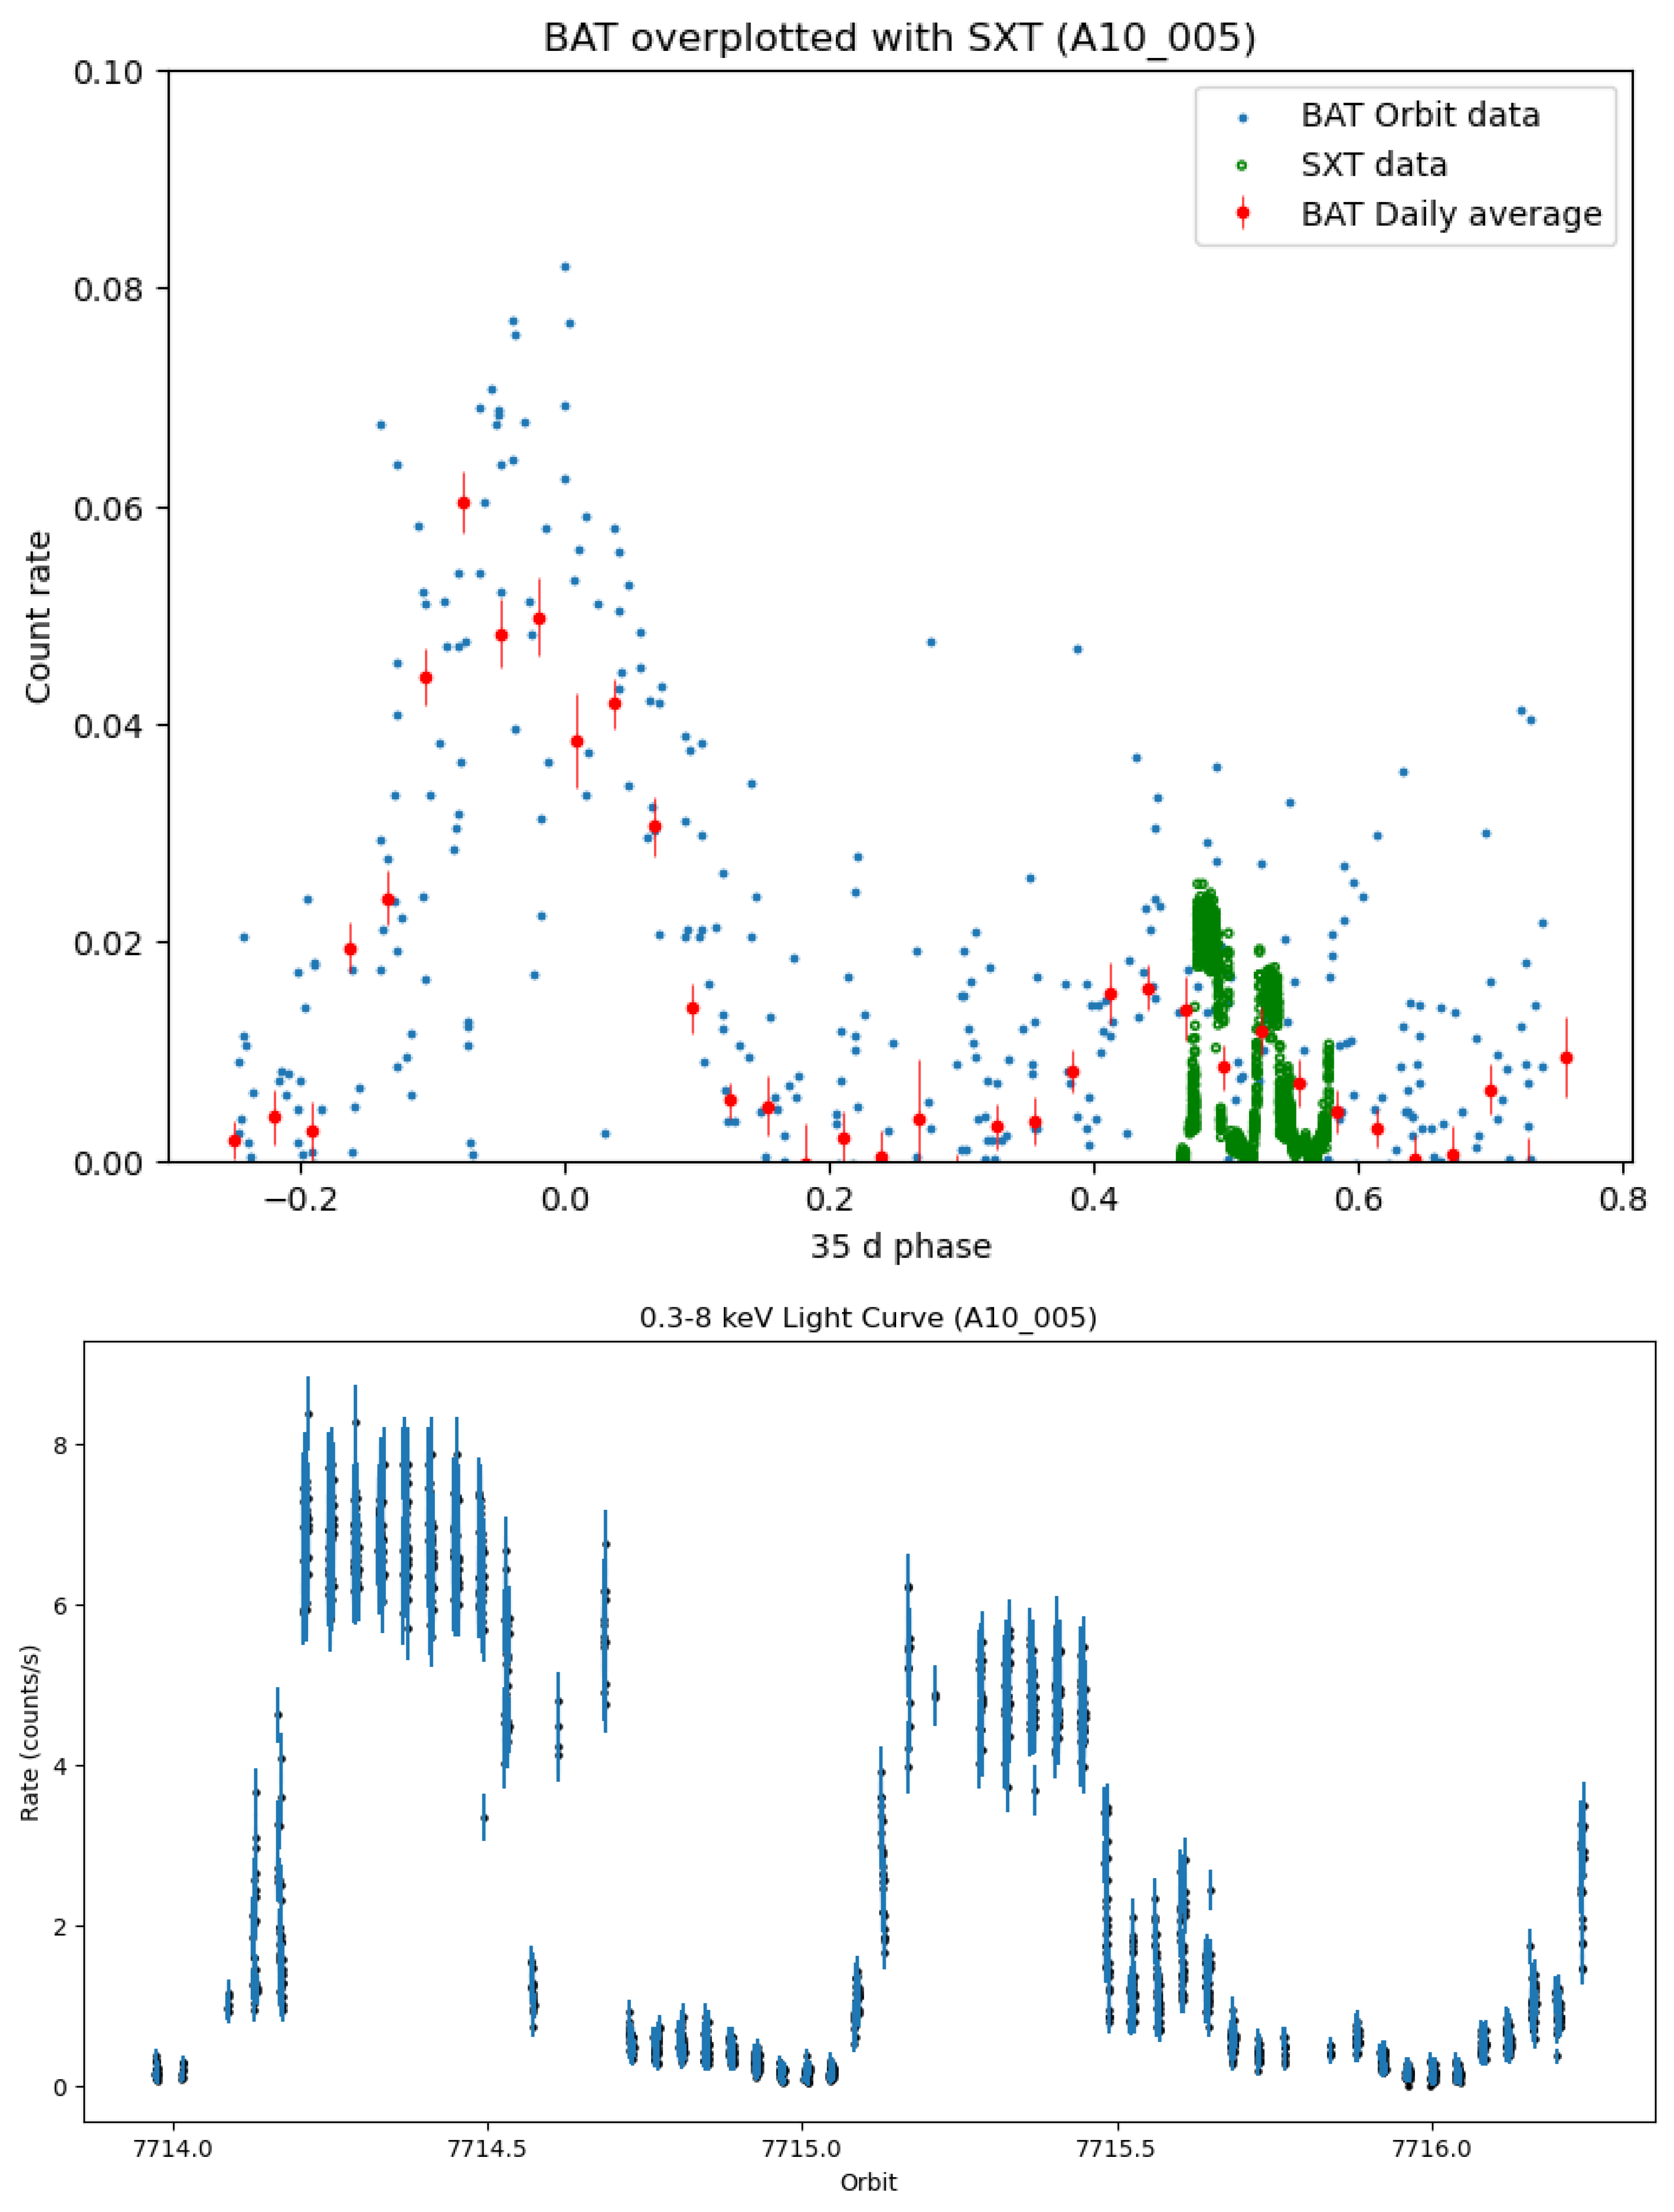
Figure 3 and
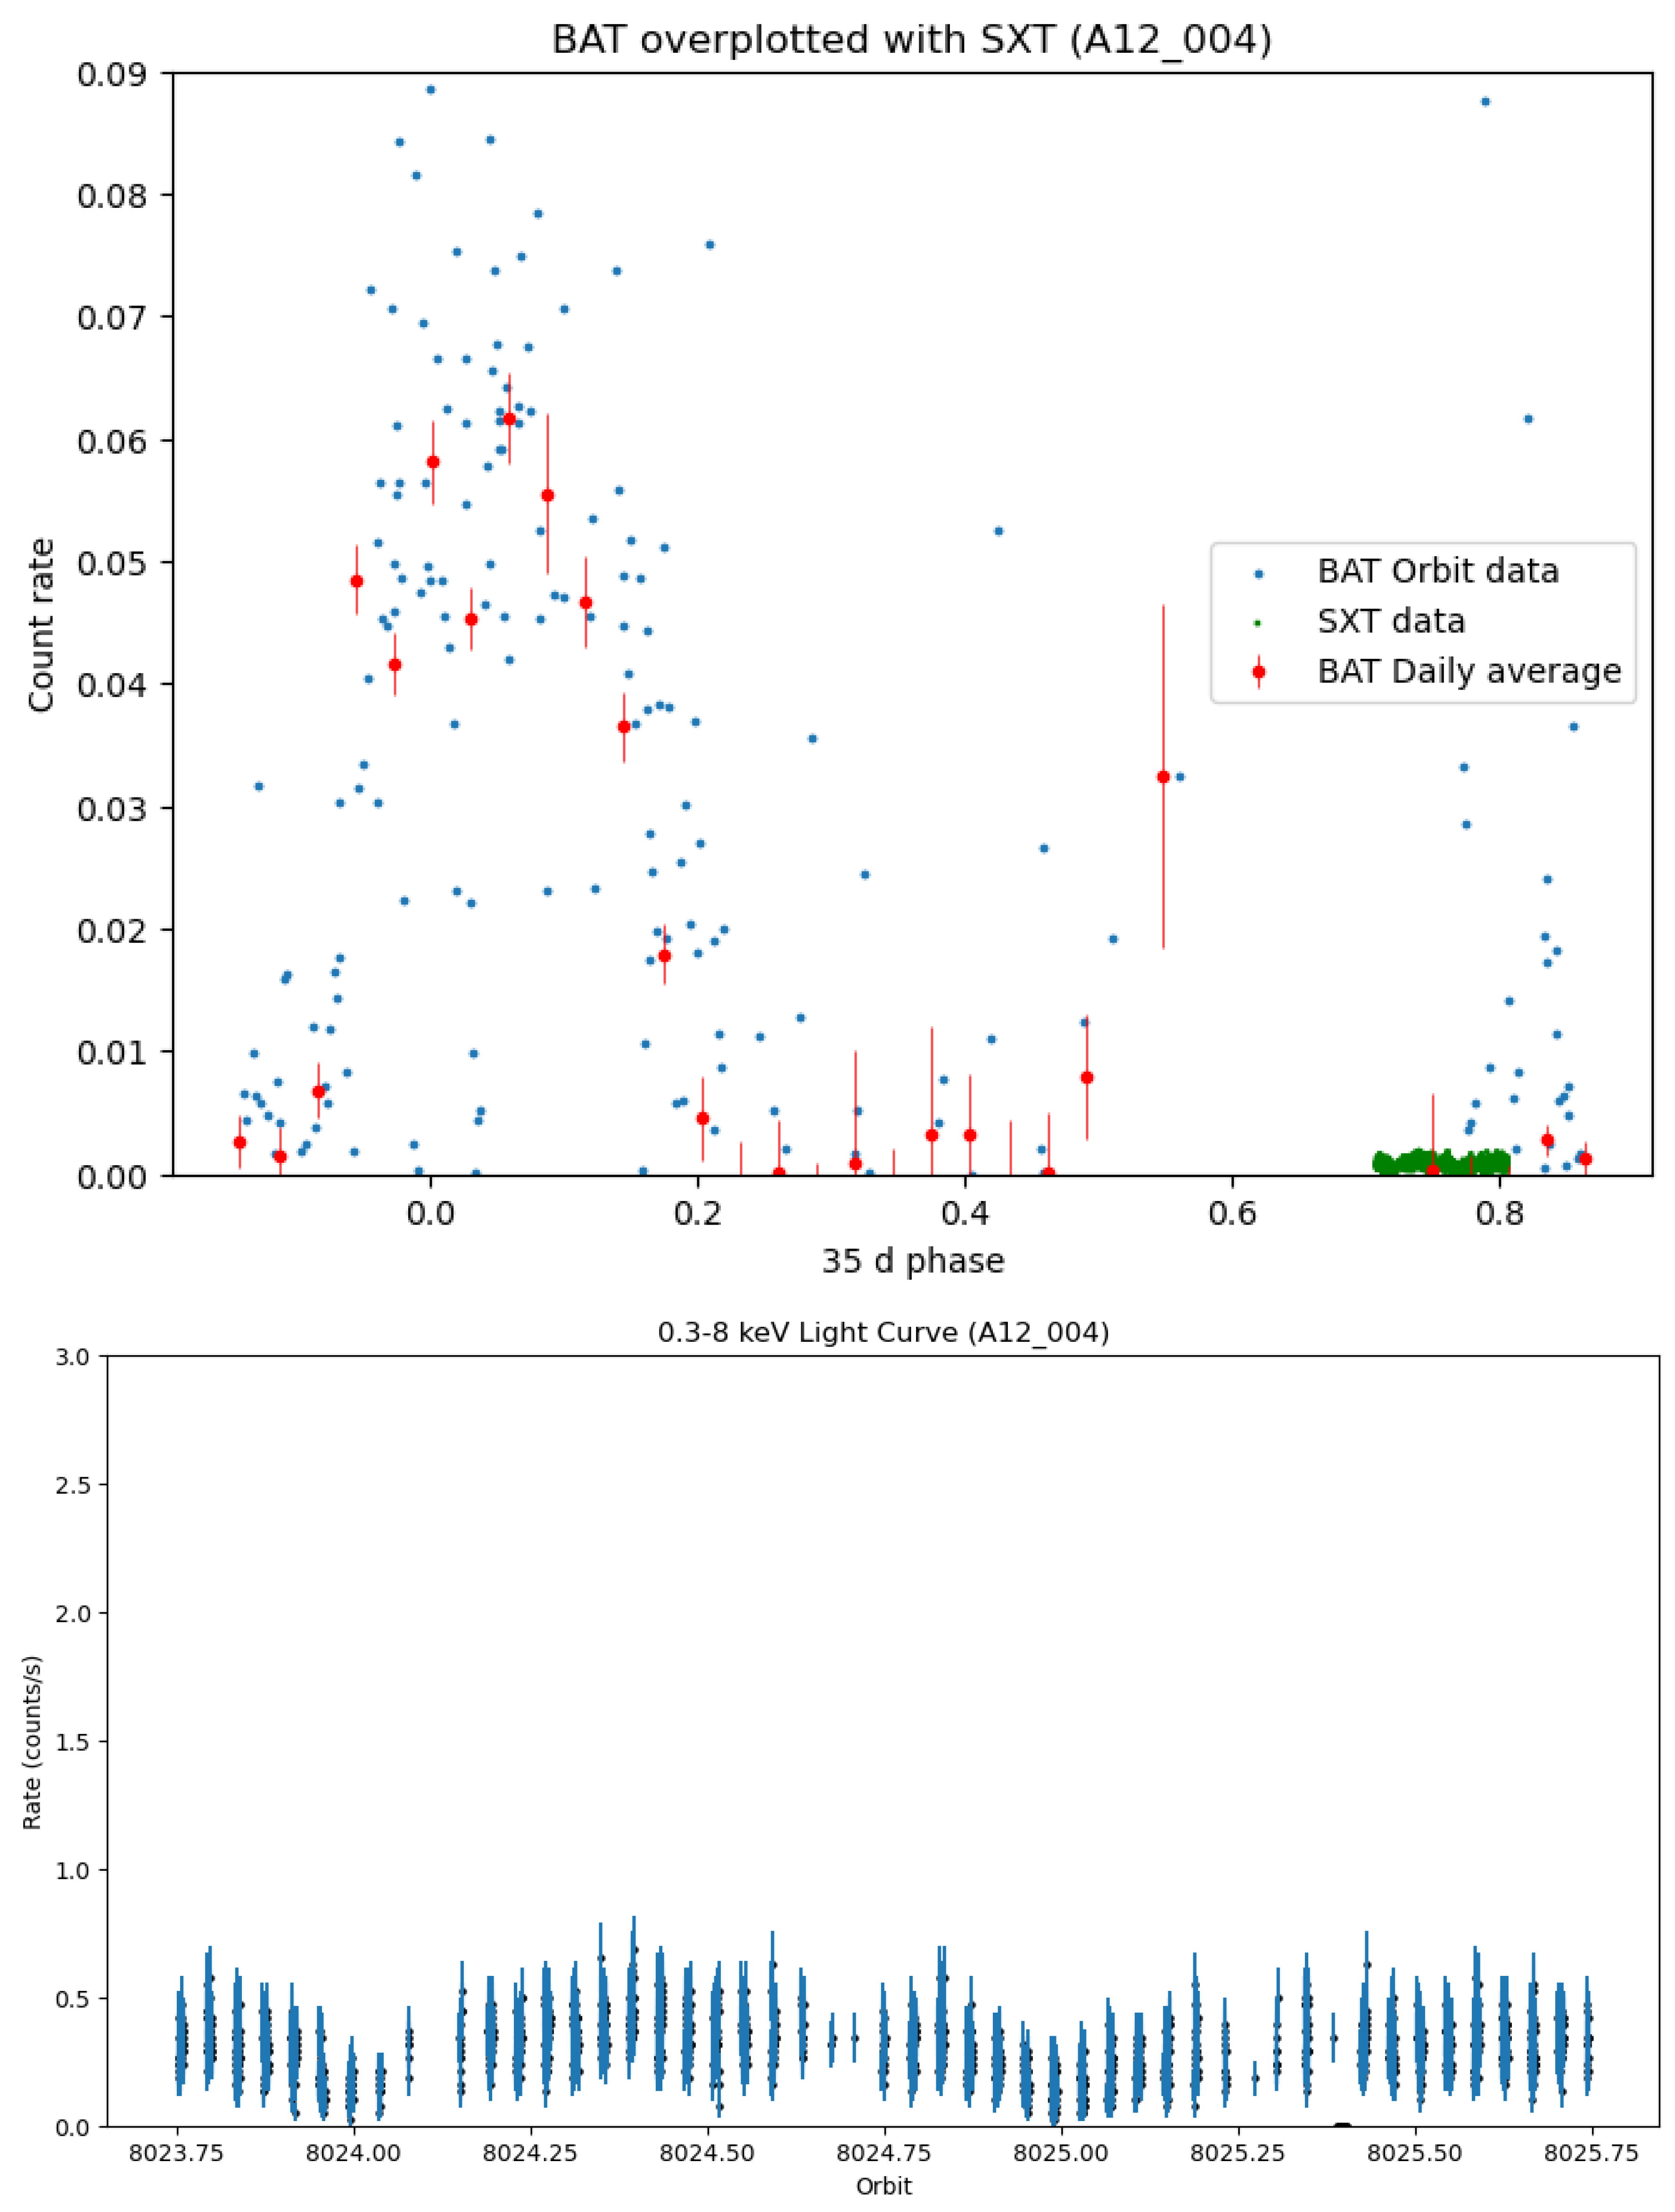
Figure 4 show the Swift/BAT and SXT lightcurves for the T03_197, A10_005 and A12_004 observations, respectively.
The goal of the observations was to cover the different states of the 35-day cycle and to measure eclipses in the different states. One determination of 35-day phase intervals for the different states is by [
21] (their Table 2) using long-term observations of Her X-1 by Swift/BAT and MAXI instruments. Another was carried out using RXTE/PCA observations [
22] (their Table 3), with higher sensitivity but less phase coverage. It is noted here that the peak of MH defined by peak countrate (used by [
22]) is uncertain because the countrate is nearly constant at the peak (their Fig. 3), such that peak could have been defined anywhere between 35-day phase ≃0.92 and 1.0, i.e. earlier by ≃0.00 to 0.08 in 35-day phase. The peak of the cross-correlation function (used by [
21]) is well-defined, thus we recommend here that values in Table 3 of [
22] be adjusted. The lightcurves from Astrosat/SXT and Swift/BAT for the current data set show good agreement with the state intervals of [
21] thus we use those intervals. This also indicates that the values in Table 3 of [
22] should be shifted earlier by 0.07 to 0.08.
The A07_113 observation covers the peak of the 35-day cycle and includes 2 eclipses and part of a third eclipse (seen in the bottom panel of
Figure 1); the T03_197 observations covers end of Low State 2 and Turn-on to MH state with one eclipse (bottom panel of
Figure 2); the A10_005 observation covers the declining part of Short High state with 3 eclipses (bottom panel of
Figure 3); and the A12_004 observation covers the middle part of Low State 2 with 2 eclipses (bottom panel of
Figure 4). Thus the goal was largely achieved.
2.2. X-ray Spectrum Analysis
The goals are to study the spectral changes of Her X-1 over the 35-day cycle and to analyse the spectrum of eclipses and search for possible changes over the 35-day cycle. As shown by the lightcurves for the four data sets above, Her X-1 was observed in the different states of the 35-day cycle: turn-on and rise to MH (T03_197), MH (A07_113), SH (A10_005) and LS (A12_004 and part of T03_197). Eclipses were observed in each state, and dips, which occur commonly [
23,
24], were observed in the states except for LS, which is too faint for detection of dips.
Thus we use the light curves to choose data intervals for constructing spectra. Spectra were constructed for each state outside of eclipse or dip, and separate spectra were constructed for eclipses and for dips. Eclipses are defined by the companion blocking the X-rays from the neutron star, which is essentially a point source, and occur for the orbital phase interval 0.935 to 1.0 and 0.0 to 0.065, or for Orbit number the same plus any integer. Dips are defined as drops in count rate that show cold matter absorption, and are not detectable during eclipses or LS when the count rate is very low. The cold matter absorption in MH or SH shows up as a drop count rate and in softness ratio. Here we defined softness ratio by the 0.3-2 keV count rate divided by the 2-4 keV count rate. The softness ratio decreases during dips because the photoelectric absorption cross-section in higher for lower X-ray energies, so that absorption reduces the 0.3-2 keV count rate more than the 2-4 keV count rate.
E.g. for SH, first the eclipse data were selected based on orbital phase, then dip data were selected based on drop in count rate (in this case below 5 c/s for orbit 7714 and below 3.8 c/s for orbit 7715). Finally, the normal (no eclipse, no dip) SH spectra were selected to be the remaining higher count rate intervals.
The details of the data selections for the four observations are given in
Table 1. A07_113 and T03_197 were divided into 8 intervals each, A10_005 into 14 intervals and A12_004 into 5 intervals. For most cases the data intervals include times when the source s blocked from view by Astrosat by the Earth or by other constraints. This means there are data gaps for most intervals resulting in net exposure times significantly less that the durations of the intervals. For each interval, spectra were constructed using the interval start and stop times. The most recent SXT background spectra and response matrices were obtained from the Science Support Cell website. All spectra were binned in energy to give a minimum of 10 counts (net) per energy bin. For spectral fitting a systematic error of 2% and energy range of 0.5 to 7.0 keV (recommended by the SXT analysis support team) were used.
The resulting SXT spectra for the 35 intervals were fit by model spectra using the XSPEC software (
https://heasarc.gsfc.nasa.gov/docs/software.html). We started by fitting the spectrum with the best statistics (largest number of counts), which is
. A number of different spectral models were tested, and we verified that the best fit model was nearly the same as the model found by [
25]. The adopted XSPEC model is:
I.e. the model has four emission components: a powerlaw (PL, with parameters norm and index ) representing the emission from the neutron star; a blackbody (bbodyrad or BB, parameters norm and kT) representing reprocessed emission from the inner edge of the accretion disk; a gaussian centered near 1 keV (parameters norm, line energy and line-width) representing the emission from the Fe L line complex and a gaussian centered near 6.4 keV (parameters norm, line energy and line-width) representing Fe K line emission. The emission components are subject to partial covering absorption (pcfabs, parameters column density, , and covering factor, ).
Because the signal-to-noise ratio for the other spectra is lower than for , not all parameters could be constrained for the other spectra. The general procedure is to fix some parameter if the spectral fit for a given spectrum could not constrain that parameter. The value that it was fixed at was determined from the MH spectral fit () which could constrain the parameter.
The 1 keV linewidth was keV for . The other MH and SH spectra were consistent with this value (no increase in compared to fits with free linewidth), so it was fixed at 0.17 keV for the other spectra. The 1 keV line energy was keV for . The other MH and SH spectra were consistent with this value within errors. For spectra for other than MH and SH the 1 keV line energy was not constrained, and fixed at 0.92 keV. For eclipses the 1 keV line norm was consistent with 0, so the 1 keV line was omitted for eclipse spectra fits. The 6.4 keV Fe line energy was only constrained for with value keV. For other spectra, the 6.4 keV line energy was fixed at 6.43 keV. Fits including the 6.4 keV showed that it not detectable (norm more than 1 different than 0) except for one other MH spectrum (). Thus Fe K line was omitted from the spectral fits excepting the above two MH spectra.
Table 2 gives the list of free and fixed parameters for spectral fits for MH, SH, dip, LS and eclipse. MH turn-on and MH rise spectra were fit with the same model as the MH spectrum listed. Table 2 also gives the best-fit spectral parameters and their errors for
and for example spectra for the other spectral states.
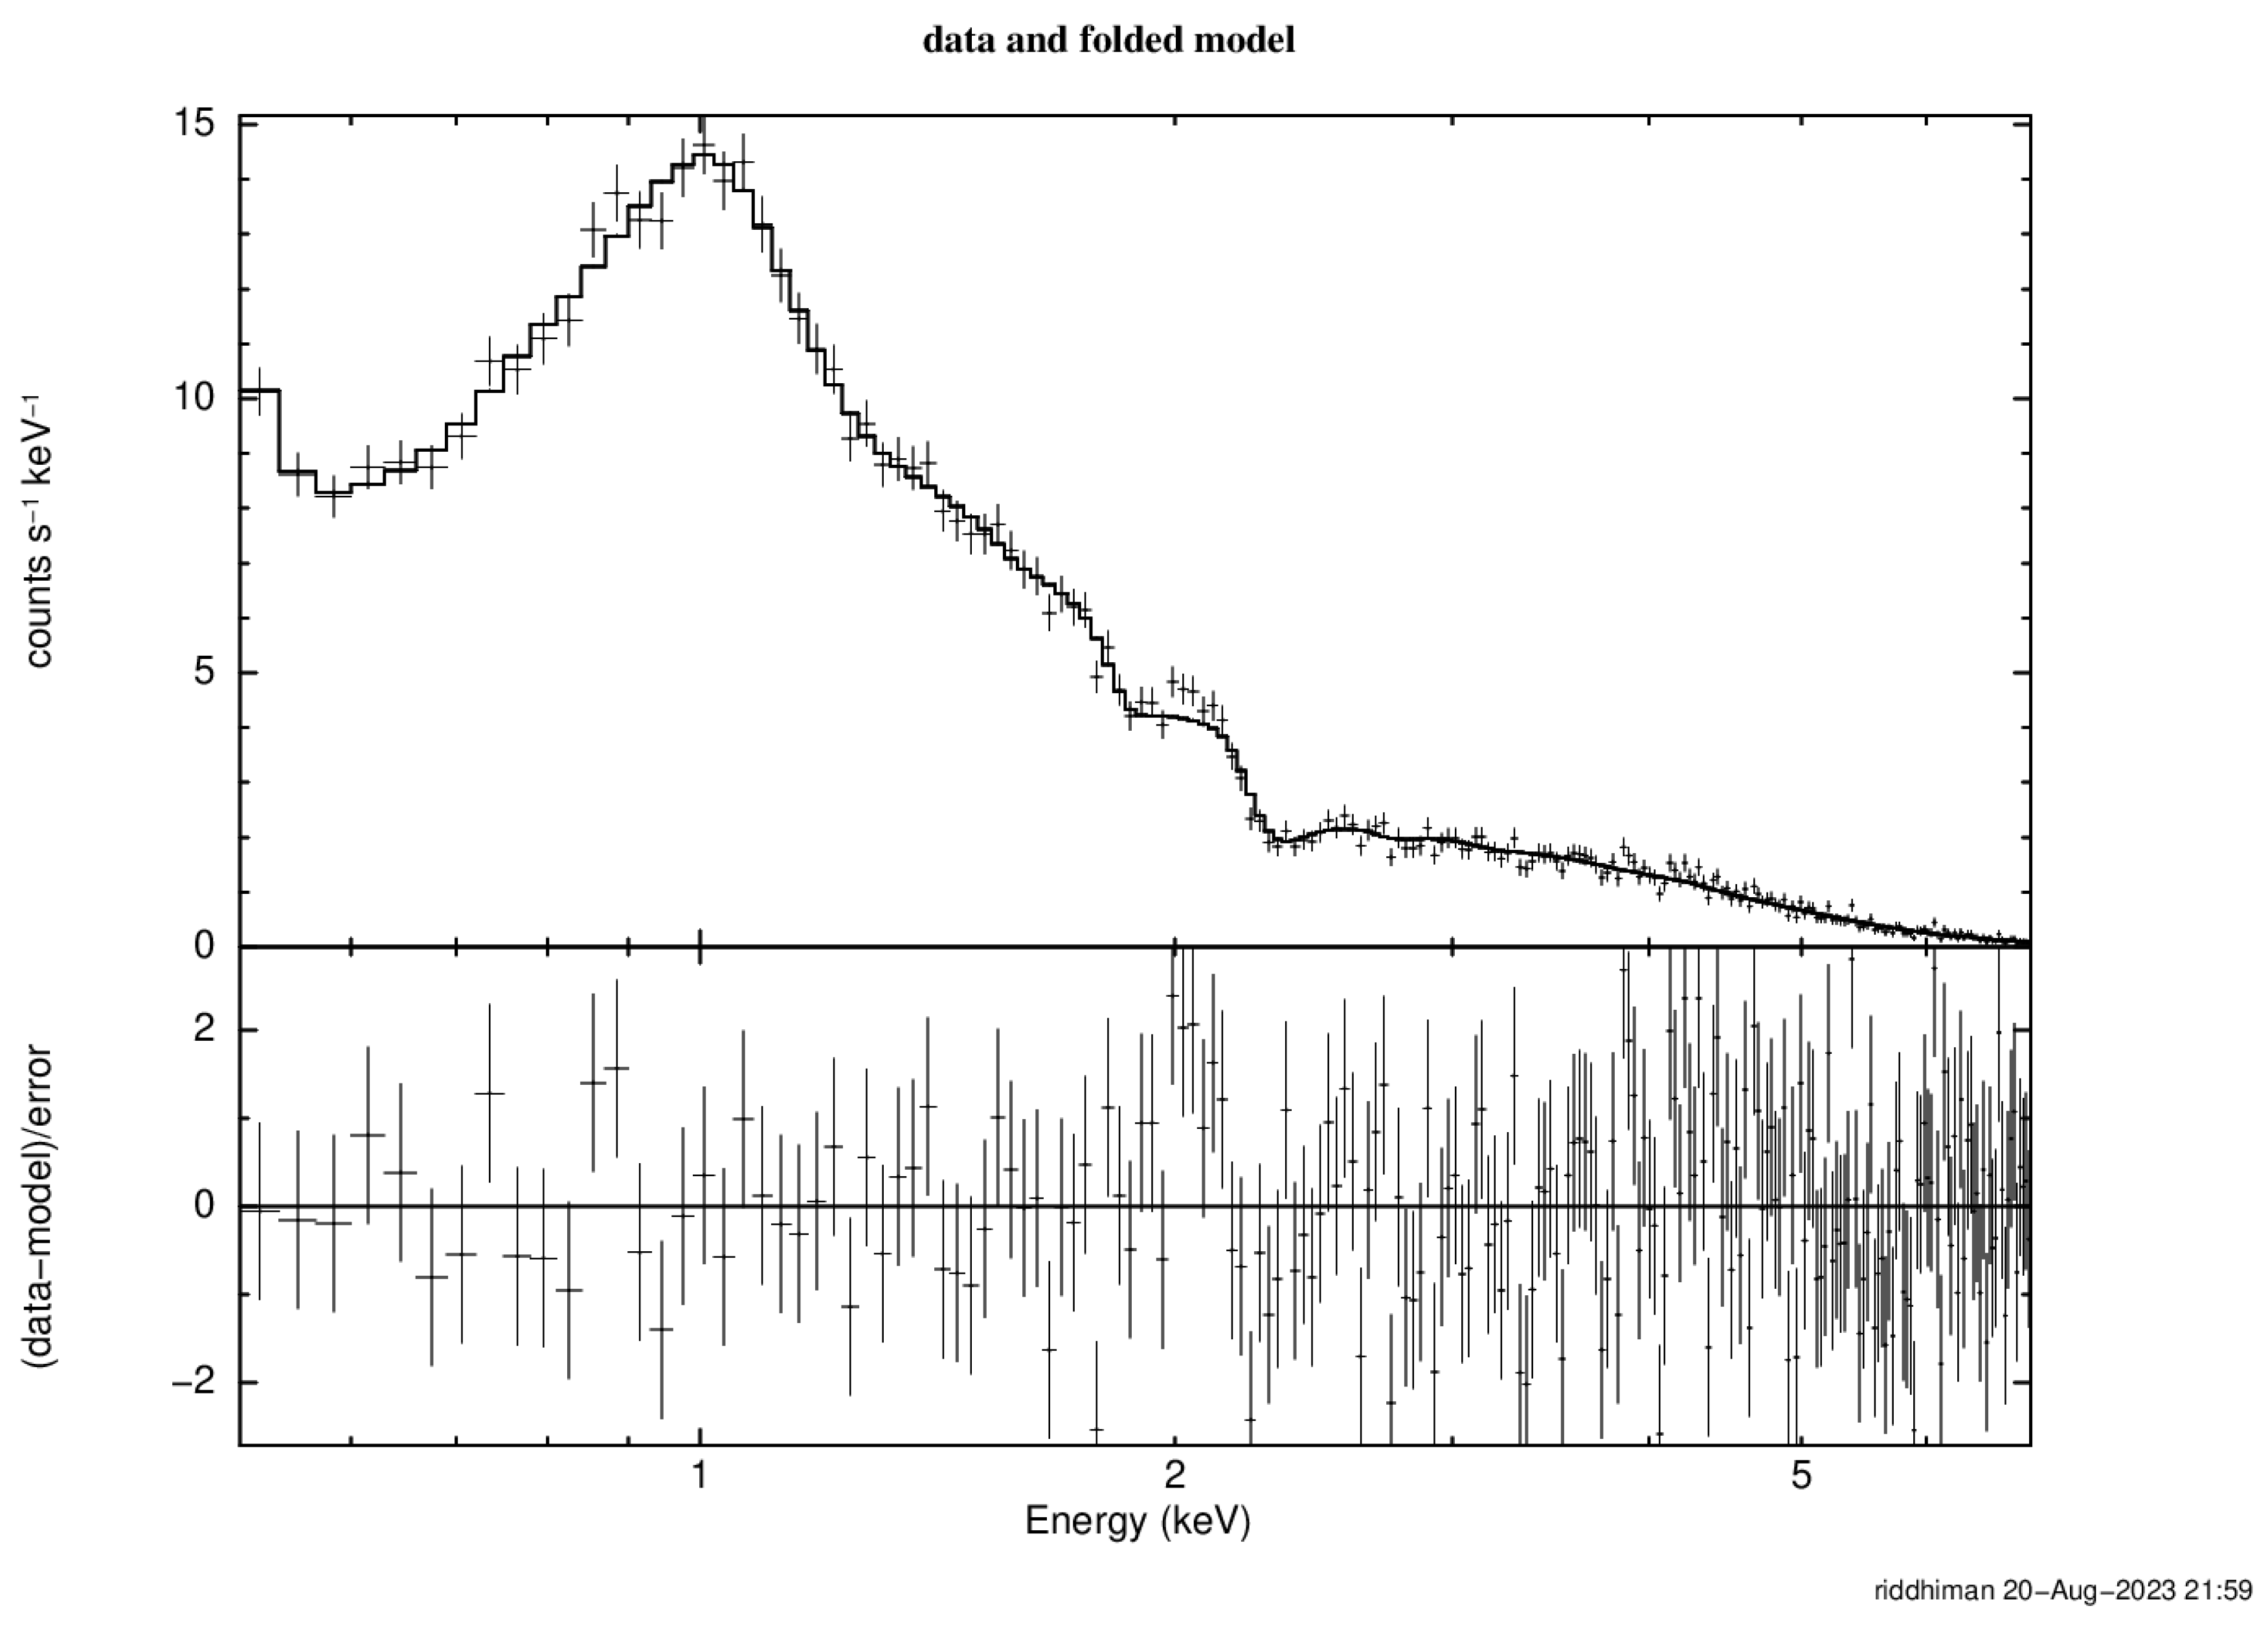
Figure 5 shows the observed spectrum for
and its best-fit spectral model.
3. Results
There are 5 spectra during normal MH, 3 from A07_113 and 2 from T03_197. Normal here means that they are not during eclipse nor contain significant dips. The spectra during MH turn-on and MH rise from T03_197 are fit with the same model as for MH. There are 3 spectra during normal SH from A10_005; and 4 spectra during normal LS, 1 from T03_197 and 3 from A12_004. There are 12 dip spectra, 4 during MH (from A07_113 and T03_097) and 8 during SH. The eclipse spectra are during MH turn-on, MH, SH and LS.
The powerlaw is the dominant contributing factor for all 35-day states, for dip and for eclipse.
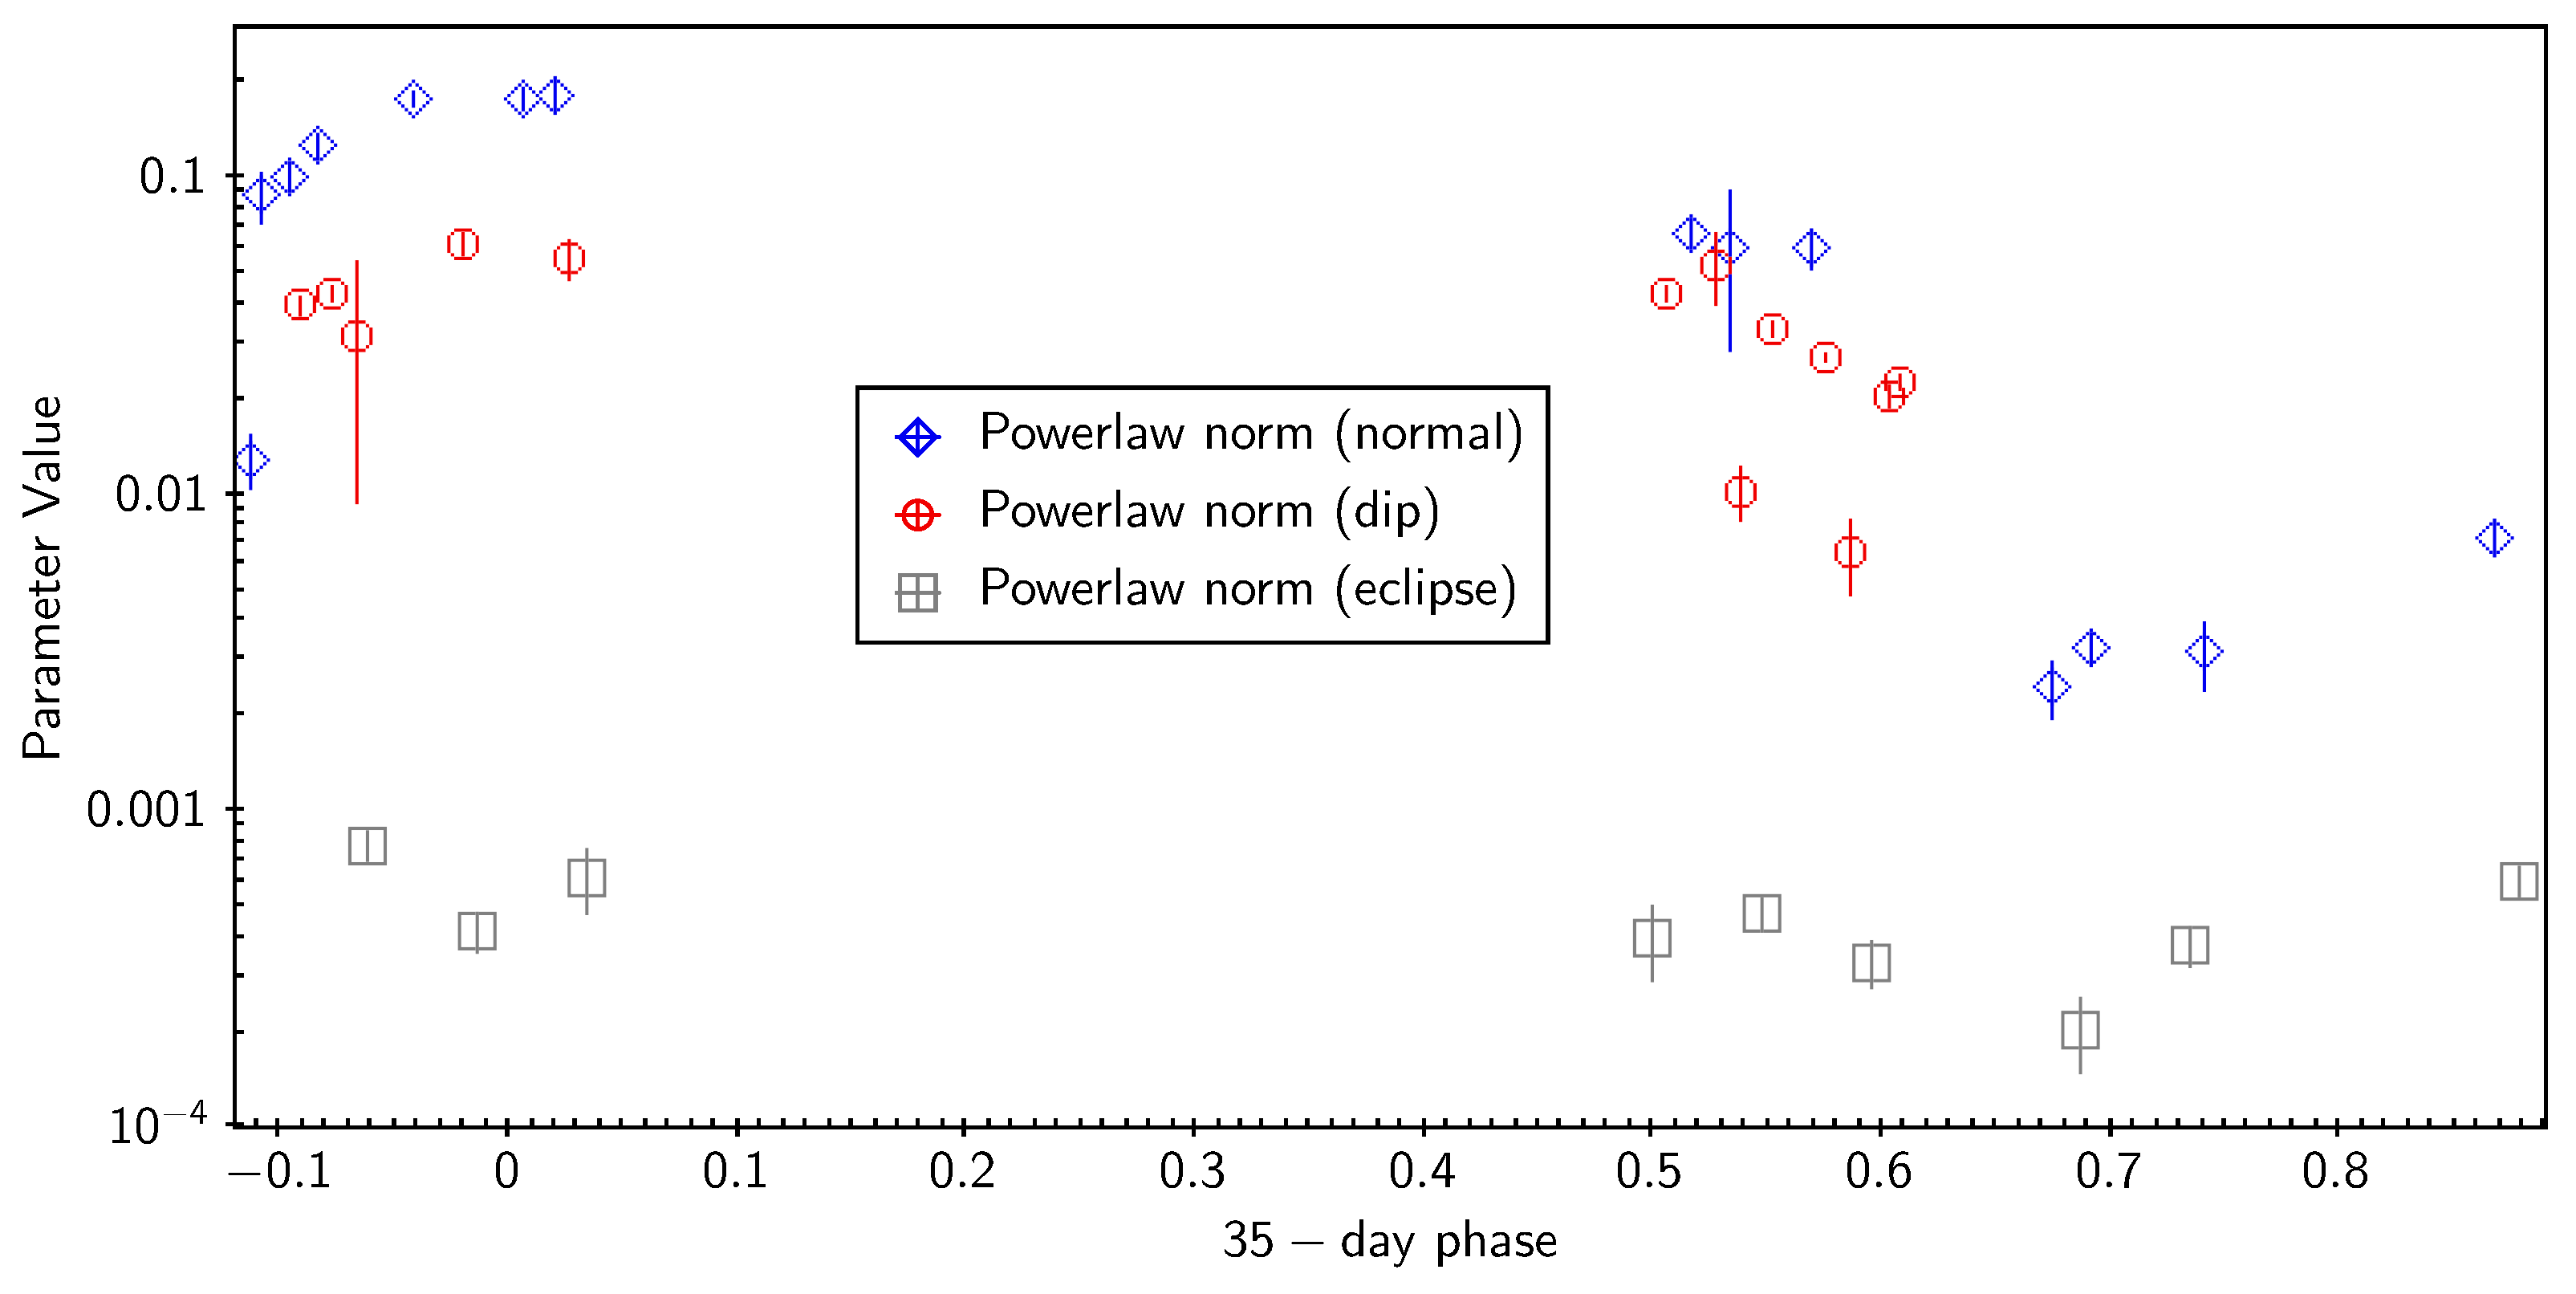
Figure 6 shows the powerlaw norm during normal (no dip, no eclipse) states and during dips vs. 35-day phase. The powerlaw norm times (1-
) has a shape similar to the 0.3-8 keV count rate (top panels of
Figure 1 to 4). The powerlaw index is consistent with a constant for states (MH turn-on, MH rise, MH and SH) for which it can be measured, with a value of 0.95
.
The partial covering absorber has parameters column density and covering factor.
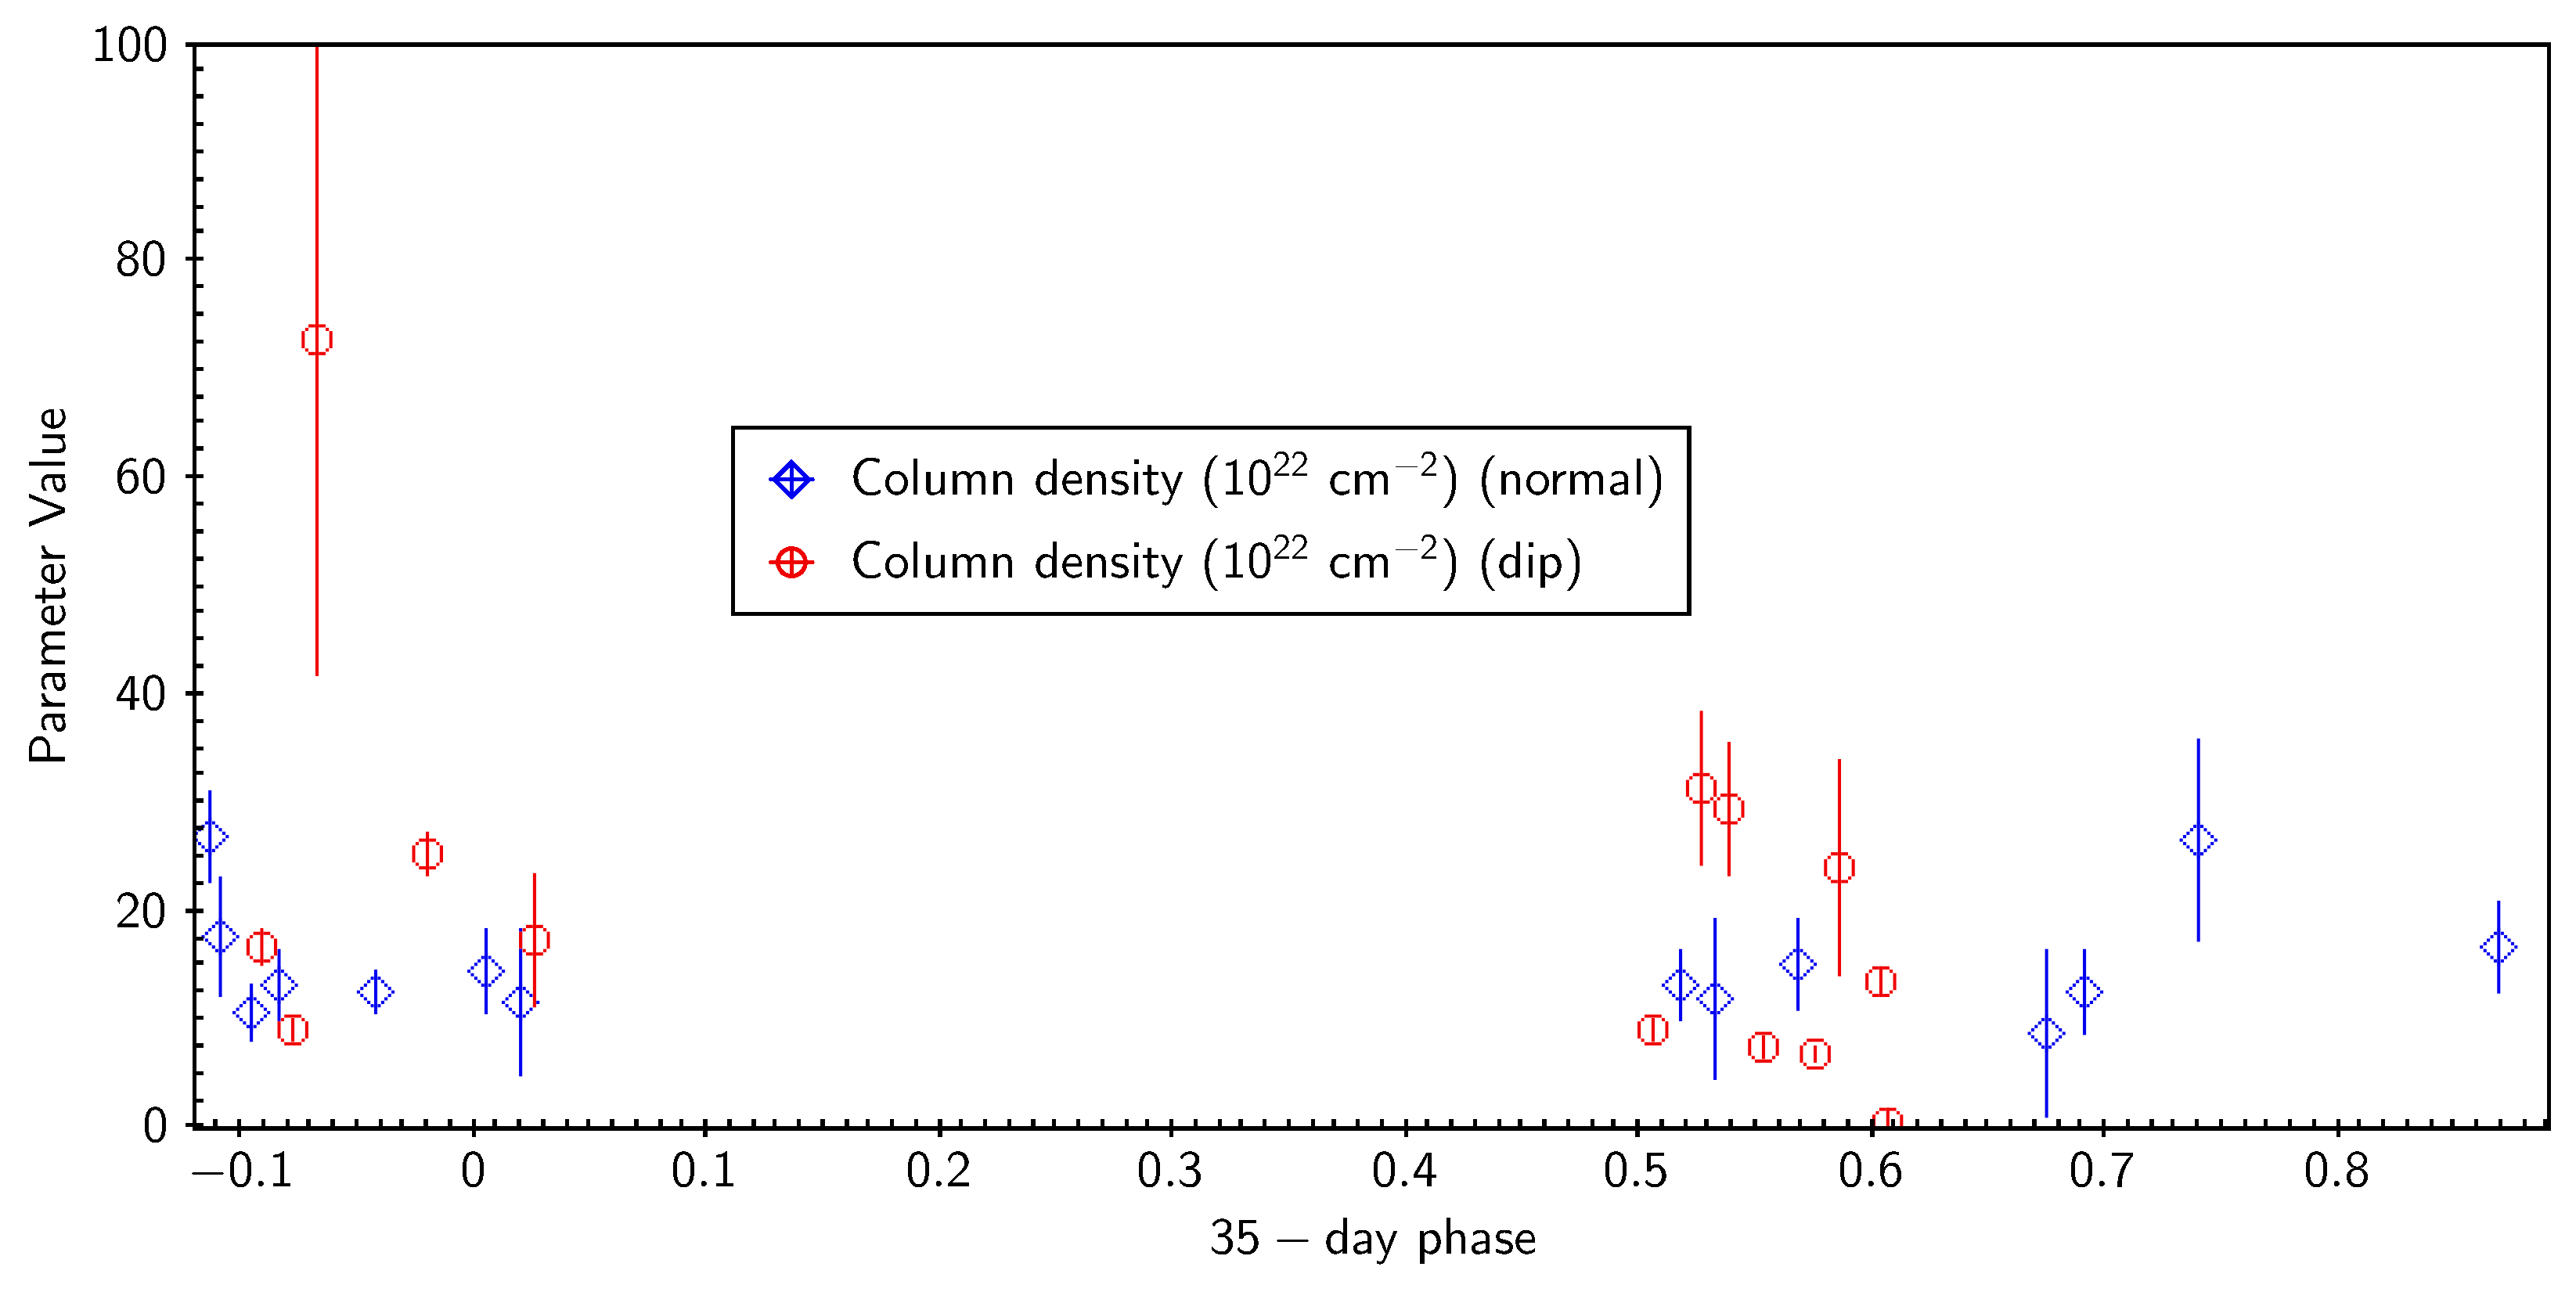
Figure 7 shows and column density vs. 35-day phase, with MH turn-on, MH rise, MH, SH and LS2. There were no observations during LS1 which is the LS between MH and SH. The column density is roughly constant value vs. 35-day phase with a value of
cm
, but with a small increase to
cm
at MH turn-on and during dips. During eclipse the signal-to-noise was not enough to detect any column density above 0, so neither column density nor covering factor was included in the spectral fits.
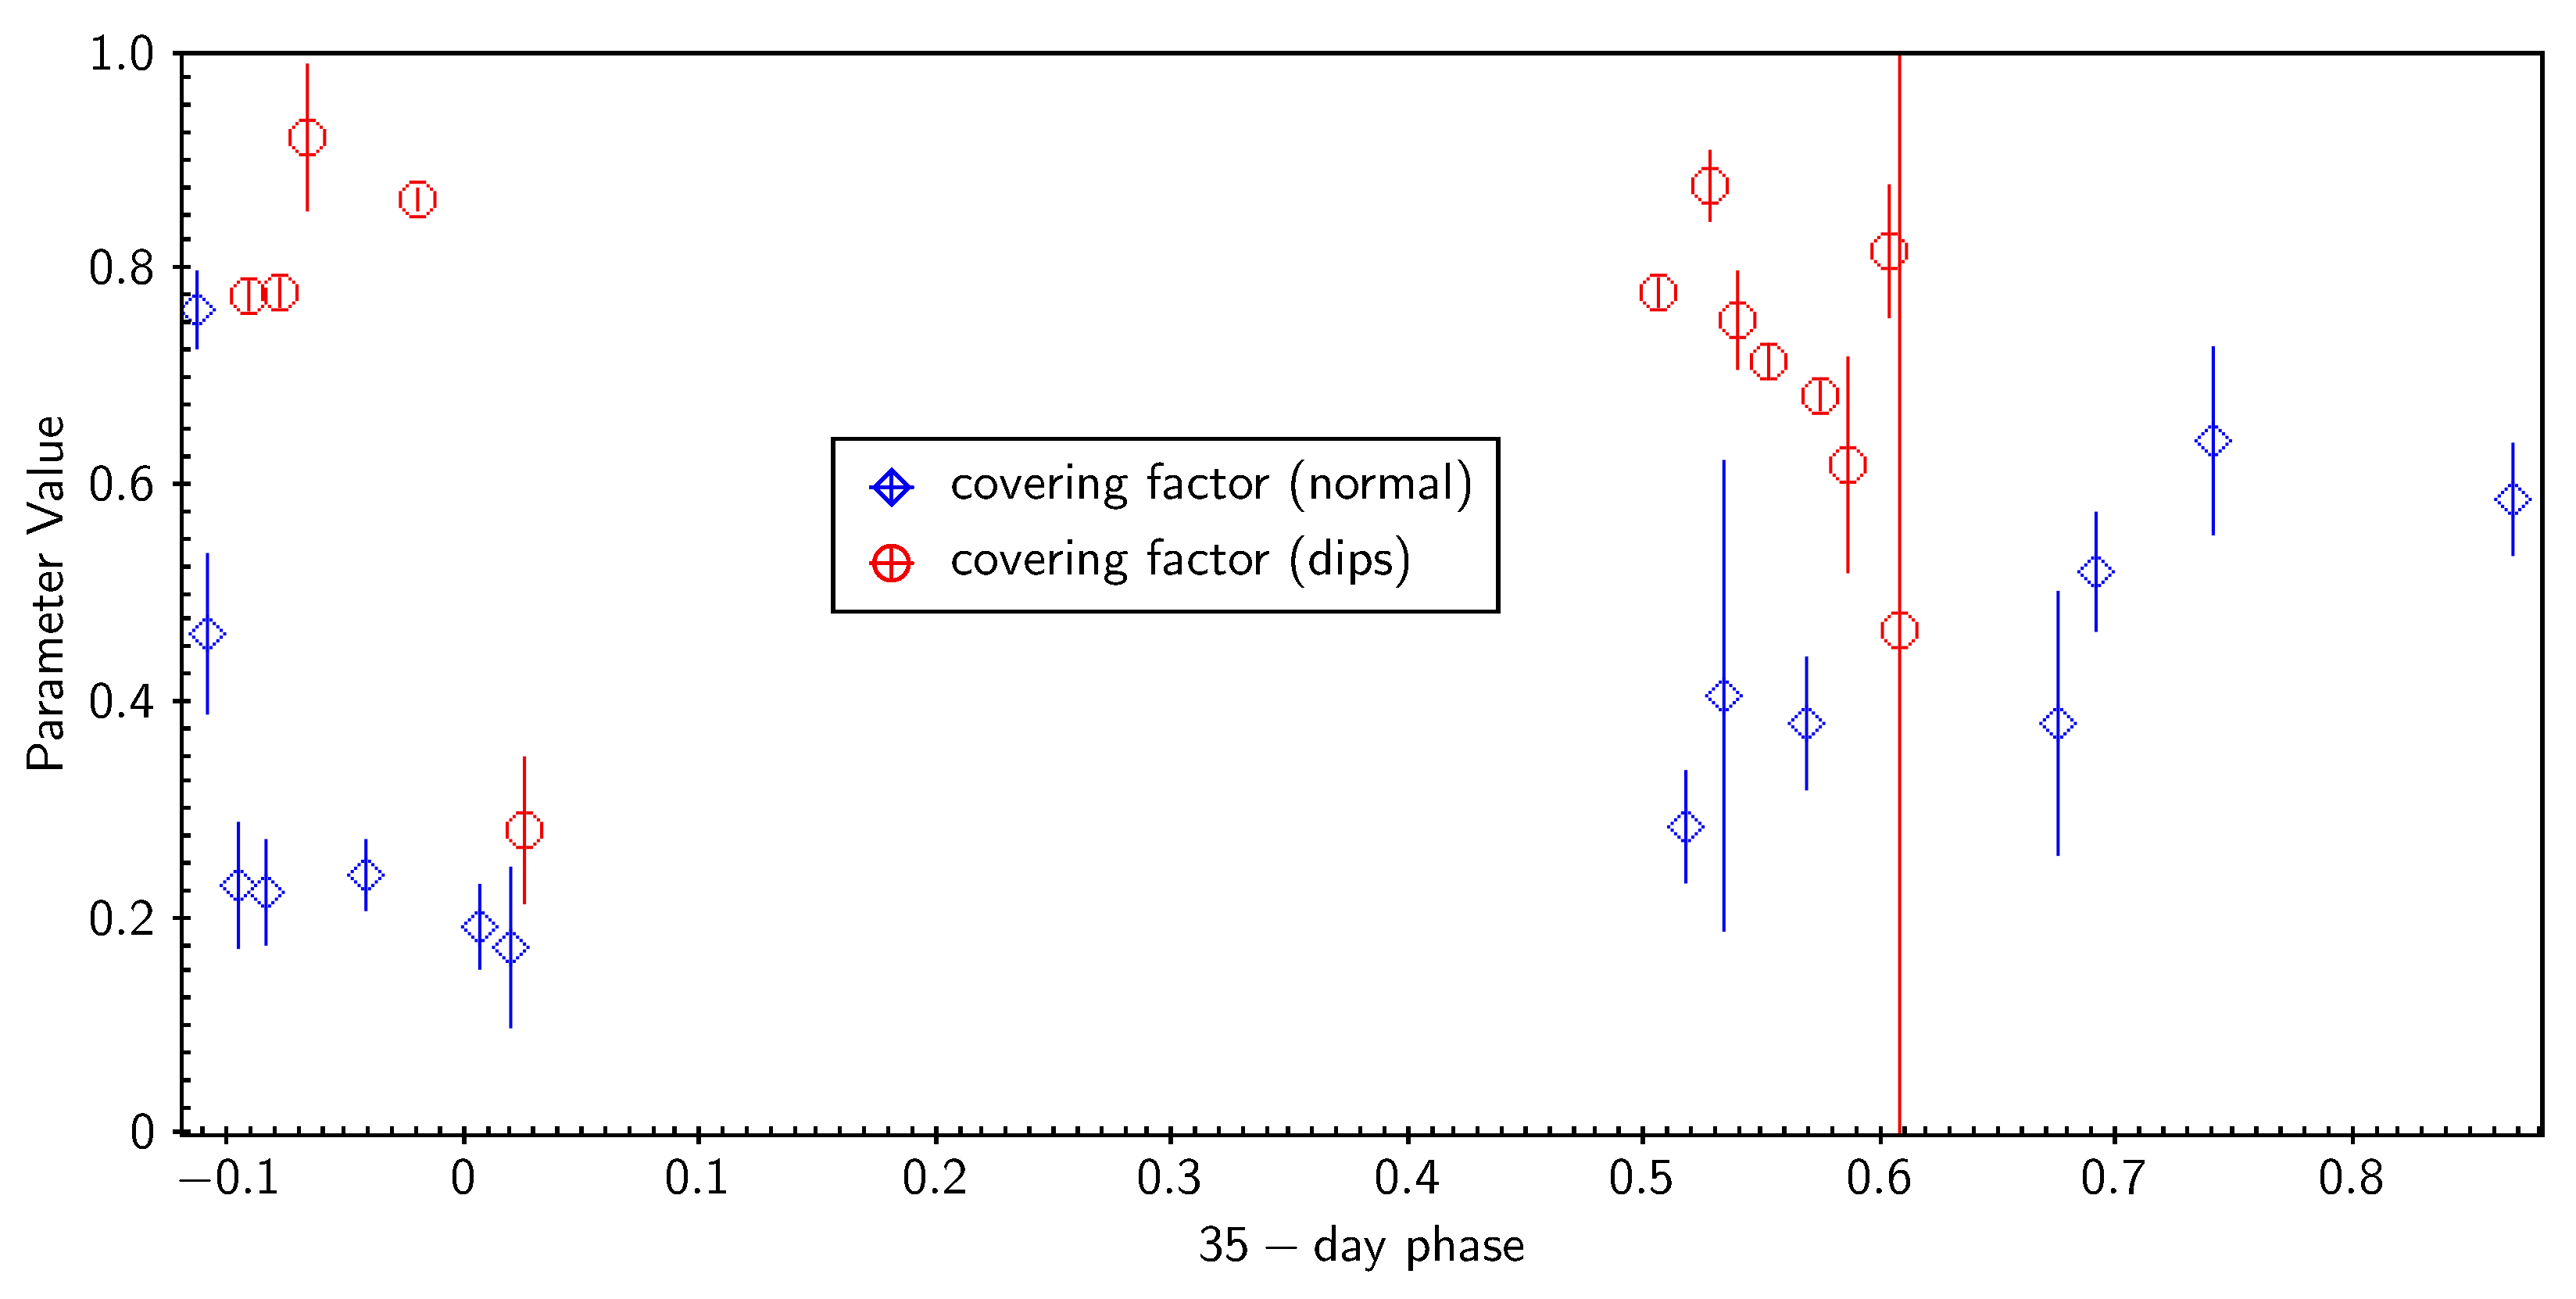
The covering factor,
, shown in
Figure 8, has a value of ≃0.2 during normal MH, but is higher during MH turn-on (≃0.75) and MH rise (≃0.5). During normal SH
0.35 and during LS
.
is variable during dips with values as high as 0.9. Previous work has shown high and variable
during dips [
23,
29].
The next most significant component in the spectral fits is the blackbody component with parameters norm and kT. The norm is defined as the area of the blackbody in km
if the source was placed at distance of 10 kpc
1. The blackbody norm, shown in
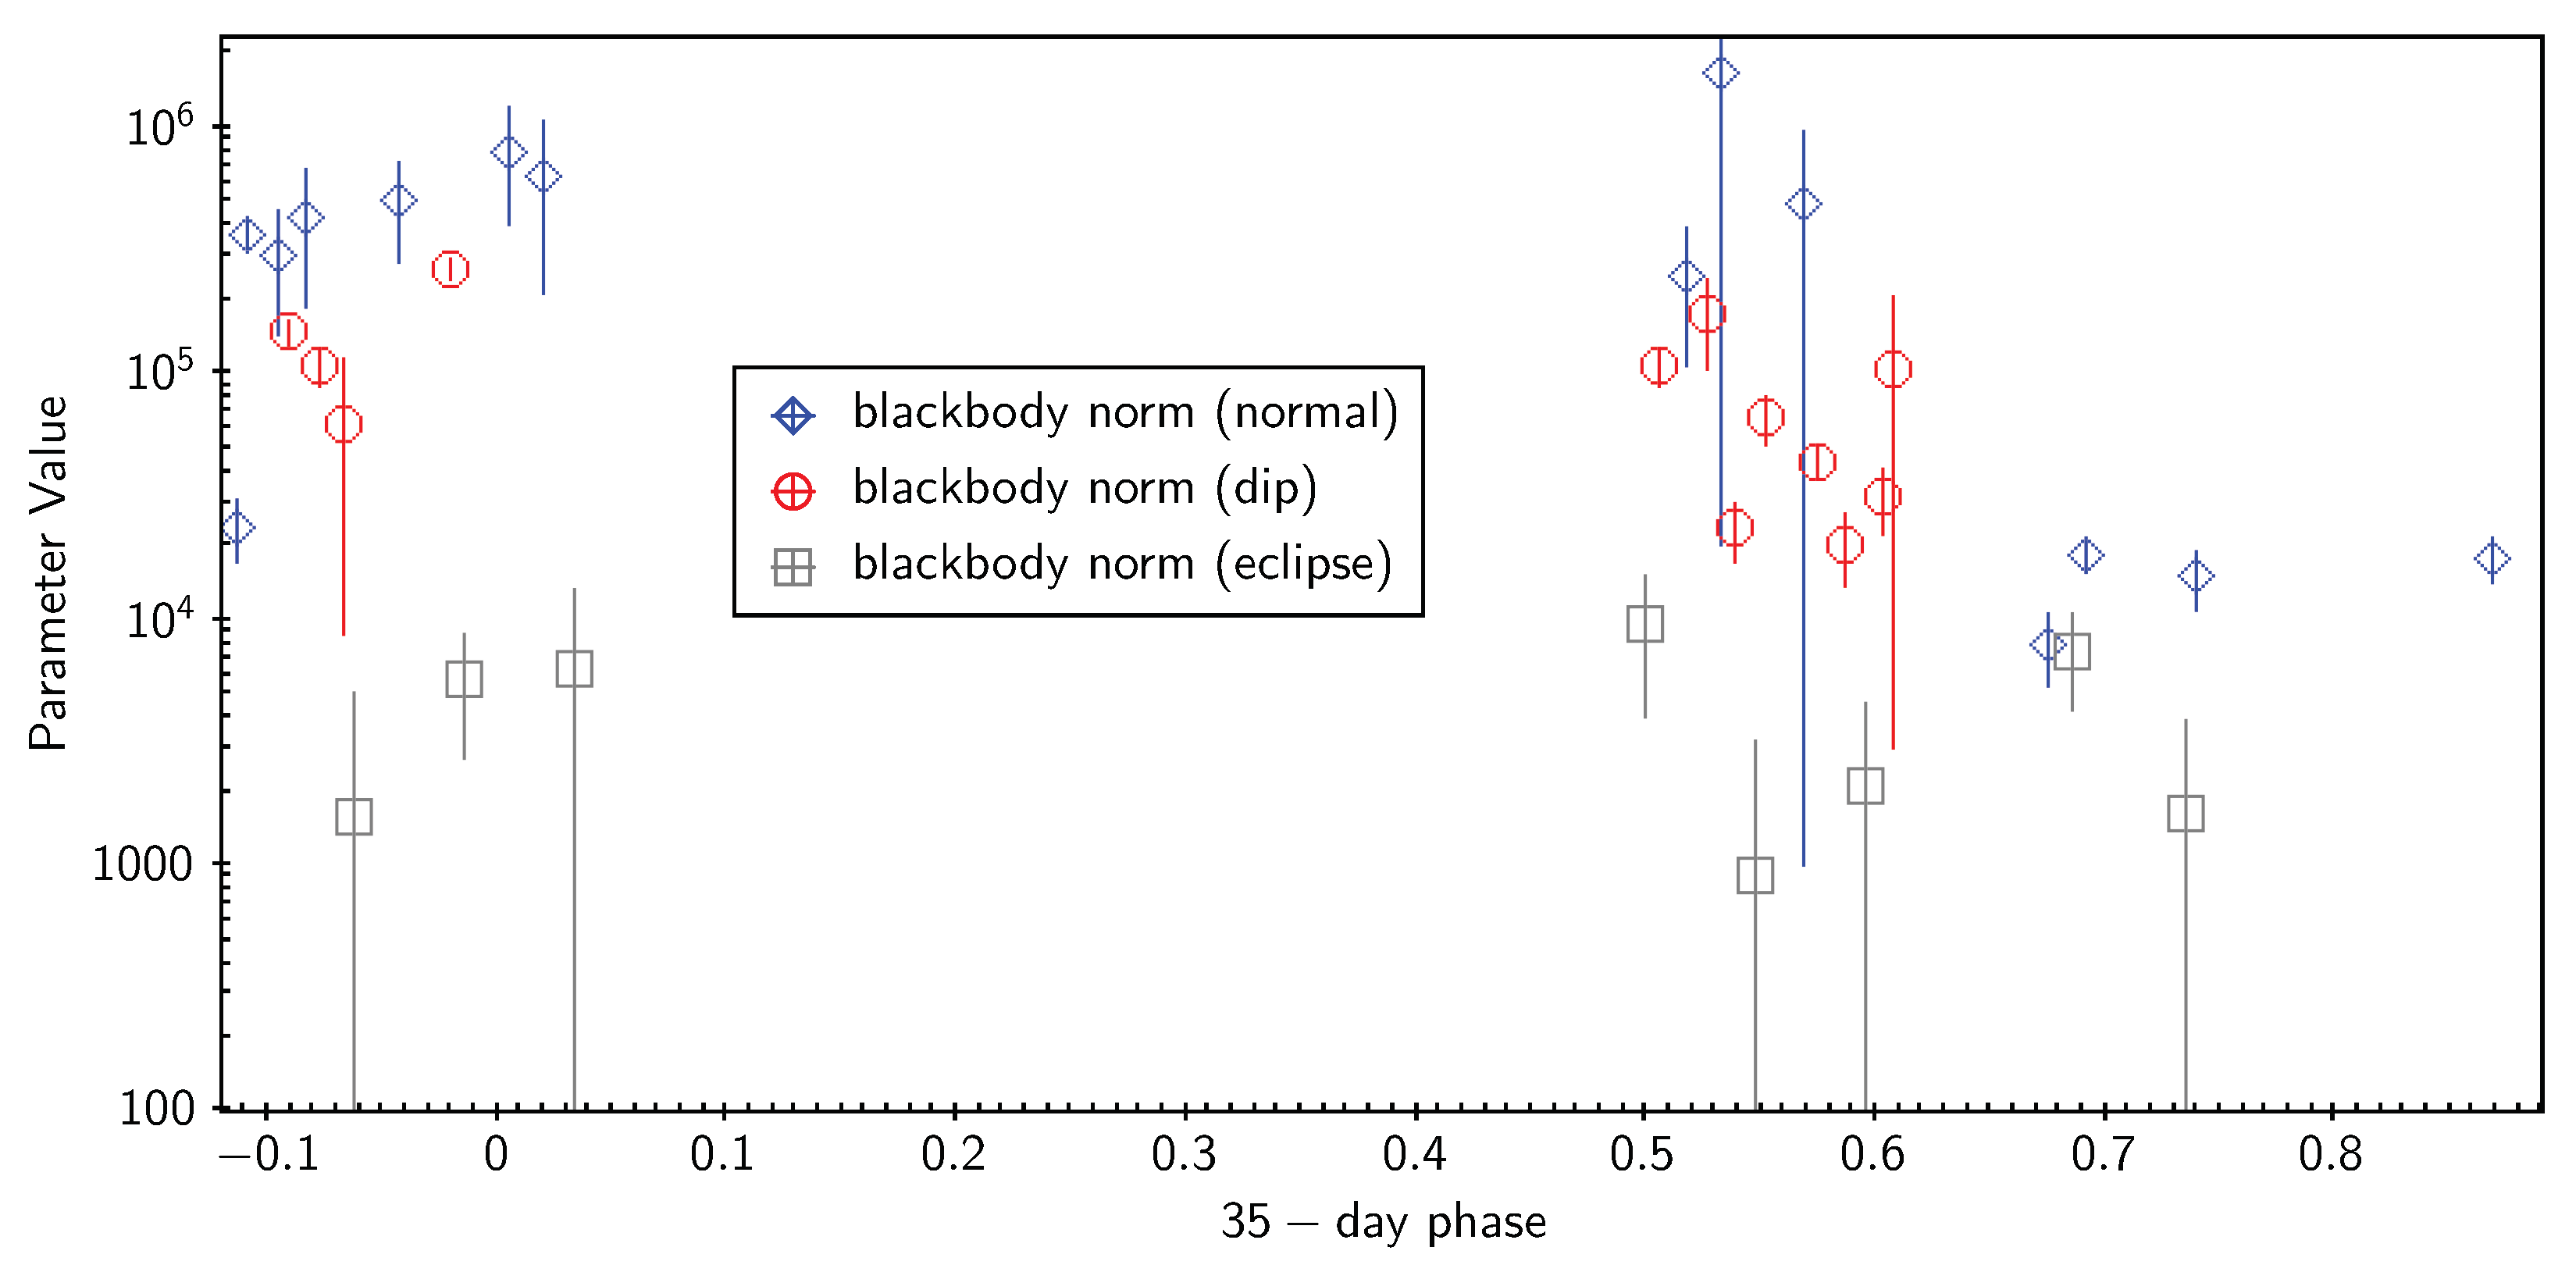
Figure 9, is consistent with a value of
(
km
) during normal MH and SH states. During dip, the norm drops to values of
to
(
to
km
). During normal LS, the norm is smaller with values of
to
(
to
km
). The norm is lowest during eclipse with similar values for MH, SH and LS eclipse of
(
km
) .
After the blackbody, the next most significant component in the spectral fits is the 1 keV line, with parameters norm, center energy and width. The 1 keV line could not be detected during dip, LS or eclipse. The keV line width was consistent with a constant value for the normal MH and SH fits, with a value of 0.17 keV. The keV line center energy and keV line norm are shown in
Figure 10. The line energy is consistent with a constant value of 0.92
keV. The line norm shape vs. 35-day phase is similar that of the powerlaw norm: the keV line norm divided by powerlaw norm is consistent with a constant value of
during normal MH and SH and with a smaller value of
during normal LS.
The least significant component of the spectral model was the 6.4 keV Fe line. The 6.4 keV line was detected only during two of the MH spectra with highest signal-to-noise, and . For these two spectra the line norm was and , respectively. The 6.4 keV line center energy was measured only for with value keV.
4. Discussion
4.1. Lightcurve of Her X-1
The four observing sessions of Her X-1 with Astrosat SXT covered the different states of Her X-1: MH with A07_113; MH turn-on and MH rise with T03_197; SH with A10_005 and LS with A12_004. The known features of the 35-day cycle were observed, as illustrated by the agreement between the low signal-to-noise Swift/BAT monitoring observation and the SXT high sensitivity observations, and shown in
Figure 1 to
Figure 4.
The X-ray lightcurve of Her X-1 has been observed many times for short periods (10’s of ks) many times previously, usually during peak of MH in order to obtain high count rate to constrain the spectrum of emission from the neutron star. Longer duration observations have usually been restricted to lower sensitivity instruments such as RXTE’s All Sky Monitor (ASM) or Swift’s BAT or MAXI. The signal-to-noise of these instruments is low (e.g. as illustrated by the BAT Daily average lightcurves given in the top panels of Figs.
Figure 1 to
Figure 4 here), but these observations have given highly useful measurements of the 35-day cycle of Her X-1 ([
21] and references therein).
A comparable measurement of the lightcurve of Her X-1 with similar sensitivity has been made using archival measurements with RXTE PCA over a ∼15-year period [
22]. The spectral resolution of those observations was lower that of the current data, so that the current Astrosat SXT observations give a better picture of spectral changes over the 35-day cycle.
4.2. Spectrum of Her X-1
The X-ray spectrum of Her X-1 over a full range of 35-day states, including dips and eclipses has not been measured before. This study is the first to do so, and to do it with the same instrument so cross-calibration of different instruments is not a problem here. A summary of the spectral changes is given here and compared to previous work in the next section.
One result seen for the first time is that the powerlaw normalization does not vary much from eclipse to eclipse over 35-day phase (
Figure 6). This can be explained because the entire accretion disk is covered by the companion star during eclipse, so the flux that is observed is only the flux scattered by the corona or extended wind [
17] at scales larger than than of the companion radius of
cm. This result implies that the scattering corona does not change with 35-day phase.
The column density has been measured as a function of 35-day phase for the first time, in normal states and in dips. The column density during dips is is similar to that outside dips (
Figure 7). During LS the column density is consistent with the values seen during MH and SH (
cm
). Instead the main factor distinguishing dip spectra from non-dip spectra is covering factor
: it is significantly larger for dips (
Figure 8). Outside of dips,
has a clear pattern: a decrease during MH turn-on from ∼0.8 and during MH rise to a low value of 0.2 during MH, then a slow increase during SH (to ∼0.4 and during LS2 (to ∼0.6). Accretion disk models for Her X-1 will have to be adjusted to be consistent with this new result.
For the first time we compare the blackbody norm between MH, SH and LS (
Figure 9). For MH it is constant, even during MH turn-on and MH rise, which can be explained if the blackbody is extended significantly more than the main source of the X-rays (the approximately-powerlaw emission from accretion column on the neutron star).
The turn-on of MH is measured here to occur over ∼0.1 orbit (∼4 hours), and rise of MH to occur more rapidly, over ∼0.01 orbit (∼20 minutes). The turn-on and rise are caused [
1] by uncovering by the outer edge of the accretion disk at distance of
cm from the neutron star. Given the outer edge rotates with 35-day period, the outer edge crosses the line-of-sight to the neutron star with velocity ∼2.0 km/s. For an expected emission region size of 1 km on the neutron star, the time of uncovering by a sharp outer disk edge is ∼0.5 s. Because the turn-on and rise times are much longer, this implies the outer edge of the disk is not sharp but has an atmosphere, as shown previously by [
13].
The blackbody component has an area of
km
during MH and SH. This is consistent with the inner edge of the accretion disk, which would be heated by X-rays from the neutron star. The inner edge is located at
400 km from the neutron star [
1] and with height
[
13]. This yields an estimated projected area of
km
, of which ∼1/2 or more will be occulted by outer parts of the disk depending on 35-day phase [
13]. The blackbody area drops significantly from MH and SH normal values during dips. The drop is consistent with the decrease caused by increased covering factor
, i.e. by the factor of (1-
).
In addition to the X-rays emitted with blackbody spectrum by the inner edge of the disk there is an expected component of scattered blackbody emission from the corona [
17], with contribution of ∼1% of that from the inner disk edge. The blackbody area observed during eclipses has values ∼1500 km
, consistent with the expected scatterered amount. During LS, the blackbody norm is approximately ∼4000 - 7000 km
. During LS the inner disk is blocked from view by the outer disk [
13], but the outer part of the disk blocks much less of the inner corona than that blocked by the companion star, so the the scattered amplitude should be higher than during eclipse, as observed.
The 1 keV line energy is constant with 35-day phase (
Figure 10). The 1 keV line norm has similar behaviour to the powerlaw norm, in particular the ratio of 1 keV line norm to powerlaw norm varies only a small amount (see
Section 3, ∼0.4 for MH and SH and ∼0.15 for LS and eclipse). This is a clear indication that the 1 keV line emission region is compact, like the powerlaw emission region from the neutron star.
4.3. Comparison with Previous Work
Individual spectra have been studied during MH and SH several times with instruments with good resolution, including the Suzaku spectrum during MH [
26] and a joint NuSTAR plus Suzaku observation [
27]. The broad-band MH spectrum of Her X-1 [
28] is generally fit with a powerlaw with high energy cutoff at ∼20 keV, a low energy excess fit by a blackbody with kT≃0.1 keV, a broad Gaussian line feature around 1 keV, a fluorescent 6.4 keV iron line and a cyclotron absorption feature near 40 keV.
Those observations were sensitive to the high energy part of the spectrum (well above 30 keV), whereas Astrosat SXT measures the 0.5 to 7 keV part. Thus the powerlaw with cutoff and cyclotron absorption feature appears as a simple powerlaw to SXT, and the undetectable components (cutoff and cyclotron feature) were not included in the spectral model for SXT.
The X-ray spectral fits to Her X-1 require a partial-covering absorber, as first shown for MH spectra during dip and non-dip by [
23] and [
24]. We fit the absorption for Her X-1 with a partial covering neutral absorber (pcfabs in XSPEC). In comparison [
25] found a partially ionized partial covering neutral absorber (zxipcf in XSPEC) produced a better fit during MH with
significance (
). We compared the pcfabs model with the zxipcf model for the spectrum with highest signal-to-noise (
) and found that pcfabs provided essentially the same fit (
compared to zxipcf), but has one less parameter. The key difference between the spectral fits is in this work and in [
25] is that we use the new and significantly improved calibration and background subtraction for the SXT released by the Astrosat SXT support team. Thus we conclude there is no preference for a partially ionized absorber for Her X-1, and adopt the pcfabs absorber model for Her X-1.
The current work is the first comprehensive studies of the spectral changes with an instrument with good spectral resolution with 35-day phase for Her X-1. The spectrum evolution during MH was studied previously by [
30] and during SH by [
31] with the RXTE Proportional Counter Array (PCA) instrument over the energy range 2.5 to 30 keV. PCA has lower spectral resolution than SXT and is sensitive to a different part of the spectrum, thus is sensitive to the powerlaw and 6.4 keV iron line, but not sensitive to 0.1 keV blackbody and the 1 keV line components and not as sensitive as SXT to the partial covering absorption parameters. The covering fraction during MH from [
30] was consistently ∼0.2 during MH, and during SH from [
31] varied in the range ∼0.3-0.5 during SH and
during LS. These results are in agreement with the current results (
Figure 8). The column densities from [
30] and [
31] are also in agreement with the current results (
Figure 7) for MH and SH.
5. Summary and Conclusion
We have carried out a study of the spectral changes of Her X-1 over its 35-day cycle, including several eclipses, using 0.5- 7 keV band spectra observed by the Astrosat SXT instrument. This is the first comprehensive study of how the soft (0.5-7 keV) X-ray spectrum of Her X-1 changes with the 35-day accretion disk rotation period and how eclipses change with 35-day phase. The main new results here are:
The powerlaw normalization is nearly constant during eclipses at all 35-day phases. This means that the scattering corona in Her X-1 is not variable with 35-day phase.
The column density for dips and outside dips is the same. Dips have a significant increase in covering fraction compared to non-dip times.
The blackbody normalization, which measures the visible area of the blackbody component originating from the hot inner edge of the accretion disk, is constant during MH and SH states. During dips it is smaller by a factor of ∼2-3. During LS and during eclipses there are only small residual components of ∼4% (for LS) and ∼1% (for eclipses), which is emission scattered by the part of the corona larger which is larger than the accretion disk (for LS) or larger than the companion star (for eclipses).
The 1 keV line component varies in similar manner to the powerlaw normalization. This implies that the 1 keV component originates in a small region. This region is smaller than the inner edge of the accretion disk where the blackbody component originates, and is likely located along the magnetospheric flow of matter from the inner edge of the accretion disk onto the neutron star.
Author Contributions
Conceptualization, D.L; methodology, D.L.; data processing, R.S. and D.L.; lightcurve analysis D.L. and R.S., spectrum analysis, D.L. and R.S.; writing, D.L.; graphics, D.L.; supervision, D.L. All authors have read and agreed to the published version of the manuscript.
Funding
This research was funded by The Canadian Space Agency grant number 10039773 by award of support in the form of a MITACS Globalink Research Internship.
Institutional Review Board Statement
Not applicable.
Conflicts of Interest
The authors declare no conflicts of interest. The funders had no role in the design of the study; in the collection, analyses, or interpretation of data; in the writing of the manuscript; or in the decision to publish the results’.
Abbreviations
The following abbreviations are used in this manuscript:
| Her X-1 |
Hercules X-1 |
| SXT |
Soft X-ray Telescope |
| MH |
Main High |
| SH |
Short High |
| LS |
Low State |
| BAT |
Burst Alert Telescope |
| RXTE |
Rossi X-ray Timing Explorer |
| NUV |
near ultraviolet |
| FUV |
far ultraviolet |
| LAXPC |
Large Area X-ray Proportional Counter |
| CZTI |
Cadmium Zinc Telluride Imager |
| PC |
Photon Counting |
| MJD |
Modified Julian Date |
| MAXI |
Monitor for All sky X-ray Instrument |
| PL |
powerlaw model in XSPEC |
| BB |
bbodyrad model in XSPEC |
| ASM |
All Sky Monitor |
| PCA |
Proportional Counter Array |
| NuSTAR |
Nuclear Spectroscopic Telescope Array |
References
- Scott, D. , Leahy, D. & Wilson, R. The 35 Day Evolution of the Hercules X-1 Pulse Profile: Evidence for a Resolved Inner Disk Occultation of the Neutron Star. ApJ 2000, 539, 392S. [Google Scholar]
- Reynolds, A. , Quaintrell, H. , Still, M., Roche, P., Chakrabarty, D. & Levine, S. A new mass estimate for Hercules X-1 Monthly Notices of the Royal Astronomical Society 1997, 288, 43–52. [Google Scholar]
- Leahy, D. & Abdallah, M. HZ Her: Stellar Radius from X-Ray Eclipse Observations, Evolutionary State, and a New Distance. ApJ 2014, 793, 79. [Google Scholar]
- Gerend, D. , & Boynton, P. Optical clues to the nature of Hercules X-1 / HZ Herculis. ApJ 1976, 209, 652. [Google Scholar]
- Leahy, D. A. , & Marshall, H., Extreme-Ultraviolet Explorer Observations of Hercules X-1 at the End of the Short High State. ApJ 1999, 521, 328. [Google Scholar]
- Leahy, D. A. , An accretion column model for the accreting pulsar Her X-1. Monthly Notices of the Royal Astronomical Society 2004, 348, 932–936. [Google Scholar] [CrossRef]
- Becker, P. & Wolff, M., Thermal and Bulk Comptonization in Accretion-powered X-Ray Pulsars. ApJ 2007, 654, 435–457. [Google Scholar]
- McCray, R. , Shull, M., Boynton, P., Deeter, J., Holt, S., White, N. Einstein Observatory pulse-phase spectroscopy of HER X-1. ApJ 1982, 262, 301. [Google Scholar] [CrossRef]
- Petterson, J. Hercules X-1: a neutron star with a twisted accretion disk? ApJ 1975, 201, L61–L64. [Google Scholar] [CrossRef]
- Gerend, D. & Boynton, P. Optical clues to the nature of Hercules X-1 / HZ Herculis. ApJ 1976, 209, 562–573. [Google Scholar]
- Shakura, N. , Ketsaris, N., Prokhorov, M. & Postnov, K. RXTE highlights of the 34.85-day cycle of HER X-1. Monthly Notices of the Royal Astronomical Society 1998, 300, 992–998. [Google Scholar]
- Scott, D. & Leahy, D. Rossi X-Ray Timing Explorer All-Sky Monitor Observations of the 35 Day Cycle of Hercules X-1. ApJ 1999, 510, 974–985. [Google Scholar]
- Leahy, D. Modelling RXTE/ASM observations of the 35-d cycle in Her X-1. Monthly Notices of the Royal Astronomical Society 2002, 334, 847–854. [Google Scholar] [CrossRef]
- Leahy, D. , Postma, J. & Chen, Y. AstroSat UVIT Observations of Her X-1. ApJ 2020, 889, 131. [Google Scholar]
- Crosa, L. & Boynton, P. Periodic mass transfer in HER X-1/ HZ Her. ApJ 1980, 235, 999–1015. [Google Scholar]
- Igna, C. D. , & Leahy, D. A. Light-curve dip production through accretion stream-accretion disc impact in the HZ Her/Her X-1 binary star system. Monthly Notices of the Royal Astronomical Society 2012, 425, 8. [Google Scholar]
- Leahy, D. Hercules X-1: Using Eclipse to Measure the X-Ray Corona. ApJ 2015, 800, 32. [Google Scholar] [CrossRef]
- Singh, K.P. , Tandon, S.N., Agrawal, P.C. et al. ASTROSAT mission. SPIE Conference Series, 2014, 9144, 91441S. [Google Scholar]
- Singh, K. P. , Stewart, G. C., Westergaard, N. J. et al. Soft X-ray Focusing Telescope Aboard AstroSat: Design, Characteristics and Performance. Journal of Astrophysics and Astronomy 2017, 38, 29. [Google Scholar] [CrossRef]
- Leahy, D. & Wang, Y. Swift/BAT and RXTE/ASM Observations of the 35 day X-Ray Cycle of Hercules X-1. ApJ 2020, 902, 146. [Google Scholar]
- Leahy, D. & Wang, Y. The 35-Day Cycle of Hercules X-1 in Multiple Energy Bands from MAXI and Swift/BAT Monitoring. Universe 2021, 7, 160. [Google Scholar]
- Leahy, D. & Gonzalez-Enriquez, S. The RXTE/PCA 35-Day X-Ray Lightcurve of Hercules X-1. International Journal of Astronomy and Astrophysics 2023, 13, 172–194. [Google Scholar]
- Choi, C. , Nagase, F., Makino, F., Dotani, T. & Min, K. An X-Ray Spectroscopic Study of the Pre-Eclipse Dips of Hercules X-1. ApJ 1994, 422, 799. [Google Scholar]
- Leahy, D. , Yoshida, A., & Matsuoka, M. Spectral Evolution during Pre-Eclipse Dips in Hercules X-1. ApJ 1994, 434, 341. [Google Scholar]
- Leahy, D. & Chen, Y. AstroSat SXT Observations of Her X-1. ApJ 2019, 871, 152. [Google Scholar]
- Asami, F. , Enoto, T. , Iwakiri, W., Yamada, S., Tamagawa, T., Mihara, T., Nagase, F. Broad-band spectroscopy of Hercules X-1 with SuzakuPublications of the Astronomical Society of Japan 2014, 66, 44. [Google Scholar]
- Fürst, F. , Grefenstette, B. W., Staubert, R., et al. The Smooth Cyclotron Line in Her X-1 as Seen with Nuclear Spectroscopic Telescope Array. ApJ 2013, 799, 69. [Google Scholar] [CrossRef]
- Dal Fiume, D. , Orlandini, M., Cusumano, G., et al. The broad-band (0.1-200 keV) spectrum of HER X-1 observed with BeppoSAX. Astronomy and Astrophysics 1998, 329, L41. [Google Scholar]
- Leahy, D. GINGA observations of absorption dips in Hercules X-1. Monthly Notices of the Royal Astronomical Society 1997, 287, 622–628. [Google Scholar] [CrossRef]
- Leahy, D. & Abdallah, M. Spectral Evolution of Hercules X-1 over Main High State from RXTE/PCA Observations. Journal of High Energy Physics, Gravitation and Cosmology 2022, 8, 896–918. [Google Scholar]
- Abdallah, M. & Leahy, D. M. Spectral signature of atmospheric reflection in Hercules X-1/HZ Hercules during low and short high states. Monthly Notices of the Royal Astronomical Society 2015, 453, 4222–4231. [Google Scholar]
| 1 |
Because Her X-1 has a distance of 6.1 kpc [ 3], the norm has to be multiplied by a factor of 0.372 to give area in km . |
Figure 1.
Astrosat/SXT A07_113 full energy band (0.3- 8 keV) lightcurve (count rate vs. 35-day phase) of Her X-1 (green points) during MH State. For comparison the data for one full 35-day cycle from Swift/BAT is plotted, with daily-average data in red, with error bars, and orbit data in blue. Bottom panel: the Astrosat/SXT A07_113 0.3- 8 keV lightcurve (count rate vs. orbit number) shown at higher time resolution with error bars. Mid-eclipse occurs at integer values of orbit number (7376, 7377 and 7378).
Figure 2.
Top panel: Astrosat/SXT T03_197 full energy band (0.3- 8 keV) lightcurve (count rate vs. 35-day phase) of Her X-1 (green points) during Turn-On. For comparison the data for one full 35-day cycle from Swift/BAT is plotted, with daily-average data in red, with error bars, and orbit data in blue. Bottom panel: the Astrosat/SXT T03_197 0.3- 8 keV lightcurve (count rate vs. orbit number) shown at higher time resolution with error bars. Mid-eclipse occurs at integer values of orbit number (7416).
Figure 3.
Astrosat/SXT A10_005 full energy band (0.3- 8 keV) lightcurve (count rate vs. 35-day phase) of Her X-1 (green points) during Short High State. For comparison the data for one full 35-day cycle from Swift/BAT is plotted, with daily-average data in red, with error bars, and orbit data in blue. Bottom panel: the Astrosat/SXT A10_005 0.3- 8 keV lightcurve (count rate vs. orbit number) shown at higher time resolution with error bars. Mid-eclipse occurs at integer values of orbit number (7714, 7715 and 7716).
Figure 4.
Astrosat/SXT A12_004 full energy band (0.3- 8 keV) lightcurve (count rate vs. 35-day phase) of Her X-1 (green points) during Low State 2. For comparison the data for one full 35-day cycle from Swift/BAT is plotted, with daily-average data in red, with error bars, and orbit data in blue. Bottom panel: the Astrosat/SXT A12_004 0.3- 8 keV lightcurve (count rate vs. orbit number) shown at higher time resolution with error bars. Mid-eclipse occurs at integer values of orbit number (8024 and 8025).
Figure 5.
Top panel: Example Her X-1 SXT spectrum (plus shaped symbols) and its best-fit model (solid line); lower panel: fit residuals. The spectrum is , see text for model description. The residuals at 2 keV are a SXT instrument feature.
Figure 5.
Top panel: Example Her X-1 SXT spectrum (plus shaped symbols) and its best-fit model (solid line); lower panel: fit residuals. The spectrum is , see text for model description. The residuals at 2 keV are a SXT instrument feature.
Figure 6.
Powerlaw norm vs. 35-day phase during normal (no dip, no eclipse) states (blue symbols), during dip (red symbols) and during eclipse (grey symbols), shown on a log scale. 35-day phase 0 is defined as peak of MH.
Figure 6.
Powerlaw norm vs. 35-day phase during normal (no dip, no eclipse) states (blue symbols), during dip (red symbols) and during eclipse (grey symbols), shown on a log scale. 35-day phase 0 is defined as peak of MH.
Figure 7.
Column density vs. 35-day phase for normal states (blue symbols) and during dip (red symbols). It was not detectable during eclipses.
Figure 7.
Column density vs. 35-day phase for normal states (blue symbols) and during dip (red symbols). It was not detectable during eclipses.
Figure 8.
The covering factor vs. 35-day phase for normal (blue symbols) and during dip (red symbols). It was not detectable during eclipses.
Figure 8.
The covering factor vs. 35-day phase for normal (blue symbols) and during dip (red symbols). It was not detectable during eclipses.
Figure 9.
Blackbody norm vs. 35-day phase for normal states (blue symbols), during dip (red symbols) and during eclipse (grey symbols), shown on a log scale.
Figure 9.
Blackbody norm vs. 35-day phase for normal states (blue symbols), during dip (red symbols) and during eclipse (grey symbols), shown on a log scale.
Figure 10.
1 keV line norm (blue symbols) and keV line center energy (red symbols) vs. 35-day phase for normal states (no dip, no eclipse). The keV line energy could not be measured during LS (35-day phase 0.65-0.9). The 1 keV line was not detected during eclipses.
Figure 10.
1 keV line norm (blue symbols) and keV line center energy (red symbols) vs. 35-day phase for normal states (no dip, no eclipse). The keV line energy could not be measured during LS (35-day phase 0.65-0.9). The 1 keV line was not detected during eclipses.
Table 1.
Data selection for spectra.
Table 1.
Data selection for spectra.
| Observation |
Name |
MJD start |
Duration(s) |
Exposure(s) |
|
A07_113: |
|
|
|
| |
|
5.890003284E+04 |
1.262E+04 |
1.524E+03 |
| |
|
5.890023116E+04 |
1.303E+04 |
2.912E+03 |
| |
|
5.890043410E+04 |
1.057E+05 |
2.123E+04 |
| |
|
5.890165747E+04 |
1.841E+04 |
4.964E+03 |
| |
|
5.890192234E+04 |
1.306E+04 |
3.259E+03 |
| |
|
5.890213748E+04 |
4.662E+04 |
9.541E+03 |
| |
|
5.890300361E+04 |
1.814E+04 |
2.513E+03 |
| |
|
5.890361353E+04 |
8.702E+02 |
8.702E+02 |
|
T03_197: |
|
|
|
| |
|
5.896769825E+04 |
4.161E+04 |
1.106E+04 |
| |
|
5.896822291E+04 |
1.348E+04 |
4.027E+03 |
| |
|
5.896842591E+04 |
2.551E+04 |
1.064E+04 |
| |
|
5.896876420E+04 |
1.224E+03 |
1.224E+03 |
| |
|
5.896877837E+04 |
4.054E+04 |
9.886E+03 |
| |
|
5.896924762E+04 |
1.733E+04 |
4.118E+03 |
| |
|
5.896944823E+04 |
2.487E+04 |
1.000E+04 |
| |
|
5.896977908E+04 |
6.897E+03 |
3.179E+03 |
|
A10_005: |
|
|
|
| |
|
5.947491474E+04 |
6.597E+03 |
1.079E+03 |
| |
|
5.947511075E+04 |
1.304E+04 |
2.606E+03 |
| |
|
5.947531371E+04 |
4.810E+04 |
1.182E+04 |
| |
|
5.947593065E+04 |
6.443E+02 |
6.443E+02 |
| |
|
5.947600323E+04 |
1.110E+04 |
7.489E+02 |
| |
|
5.947619319E+04 |
3.056E+04 |
7.898E+03 |
| |
|
5.947659910E+04 |
1.302E+04 |
3.997E+03 |
| |
|
5.947680205E+04 |
7.177E+03 |
2.294E+03 |
| |
|
5.947694658E+04 |
4.144E+04 |
6.728E+03 |
| |
|
5.947747858E+04 |
2.470E+04 |
6.605E+03 |
| |
|
5.947781735E+04 |
3.634E+04 |
5.161E+03 |
| |
|
5.947829039E+04 |
1.300E+04 |
3.930E+03 |
| |
|
5.947849334E+04 |
1.884E+04 |
5.233E+03 |
| |
|
5.947876395E+04 |
7.774E+02 |
7.774E+02 |
|
A12_004: |
|
|
|
| |
|
6.000159288E+04 |
2.473E+04 |
6.811E+03 |
| |
|
6.000193090E+04 |
1.305E+04 |
3.138E+03 |
| |
|
6.000214675E+04 |
1.229E+05 |
2.270E+04 |
| |
|
6.000362104E+04 |
1.760E+04 |
4.294E+03 |
| |
|
6.000382471E+04 |
9.995E+04 |
2.117E+04 |
Table 2.
SXT Spectrum Models for the 35-day States.
Table 2.
SXT Spectrum Models for the 35-day States.
| State/ Example |
( cm
|
covering factor,
|
PL norm |
PL
|
1 keV line norm |
BB norm |
BB kT (keV) |
Fe K line norm |
| MH |
free |
free |
free |
free |
free |
free |
free |
free |
|
|
|
|
|
|
|
|
|
| SH |
free |
free |
free |
free |
free |
free |
free |
omitted |
|
|
|
|
|
|
|
|
|
| LS |
free |
free |
free |
fixed |
free |
free |
fixed |
omitted |
|
|
|
|
0.95 |
|
|
0.10 |
|
| dip |
free |
free |
free |
fixed |
free |
free |
fixed |
omitted |
|
|
|
|
0.95 |
|
|
0.10 |
|
| eclipse |
fixed |
fixed |
free |
fixed |
omitted |
free |
fixed |
omitted |
|
13 |
0.24 |
|
0.95 |
|
|
0.10 |
|
|
Disclaimer/Publisher’s Note: The statements, opinions and data contained in all publications are solely those of the individual author(s) and contributor(s) and not of MDPI and/or the editor(s). MDPI and/or the editor(s) disclaim responsibility for any injury to people or property resulting from any ideas, methods, instructions or products referred to in the content. |
© 2024 by the authors. Licensee MDPI, Basel, Switzerland. This article is an open access article distributed under the terms and conditions of the Creative Commons Attribution (CC BY) license (https://creativecommons.org/licenses/by/4.0/).
