Submitted:
06 June 2024
Posted:
07 June 2024
You are already at the latest version
Abstract
Keywords:
1. Introduction
2. Materials and Methods
2.1. Composting Procedure
2.2. Characterisation
2.3. Spectrometry Analysis
2.4. Samples
3. Results and Discussion
3.1. Biodegradation and Composting
3.2. Maturity
3.3. Spectroscopy and Thermal Analysis
4. Discussions and Conclusions
Author Contributions
Funding
Acknowledgments
Conflicts of Interest
References
- Textiles, Clothing, Leather and Footwear Industries Available online: https://single-market-economy.ec.europa.eu/sectors/textiles-ecosystem_en (accessed on 16 January 2024).
- Textiles Strategy - European Commission Available online: https://environment.ec.europa.eu/strategy/textiles-strategy_en (accessed on 3 April 2024).
- Leather Industry Insight — Pergamena Available online: https://www.pergamena.net/blog/v3piynz4zg9ysubox7b1r3zszwrfx8 (accessed on 7 March 2024).
- Qiang, T.; Chen, L.; Zhang, Q.; Liu, X. A Sustainable and Cleaner Speedy Tanning System Based on Condensed Tannins Catalyzed by Laccase. Journal of Cleaner Production 2018, 197, 1117–1123. [CrossRef]
- Wise, W.R.; Davis, S.J.; Hendriksen, W.E.; Behr, D.J.A. von; Prabakar, S.; Zhang, Y. Zeolites as Sustainable Alternatives to Traditional Tanning Chemistries. Green Chem. 2023, 25, 4260–4270. [CrossRef]
- Beghetto, V.; Agostinis, L.; Gatto, V.; Samiolo, R.; Scrivanti, A. Sustainable Use of 4-(4,6-Dimethoxy-1,3,5-Triazin-2-Yl)-4-Methylmorpholinium Chloride as Metal Free Tanning Agent. Journal of Cleaner Production 2019, 220, 864–872. [CrossRef]
- Lуpskyі, T.; Pervaia, N.; Okhmat, O.; Mokrousova, O.; Babych, А. Determining Patterns in the Use of Finishing Formulations for Trimming the Crust Leather. Eastern-European Journal of Enterprise Technologies 2021, 1, 57–63. [CrossRef]
- Ollé, L.; Frías, A.; Sorolla, S.; Cuadros, R.; Bacardit, A. Study of the Impact on Occupational Health of the Use of Polyaziridine in Leather Finishing Compared with a New Epoxy Acrylic Self-Crosslinking Polymer. Progress in Organic Coatings 2021, 154, 106162. [CrossRef]
- IPCC, 2019: Summary for Policymakers. In: Climate Change and Land: An IPCC Special Report on Climate Change, Desertification, Land Degradation, Sustainable Land Management, Food Security, and Greenhouse Gas Fluxes in Terrestrial Ecosystems;
- Kijchavengkul, T.; Auras, R. Compostability of Polymers. Polymer International 2008, 57, 793–804. [CrossRef]
- Onyuka, A.; Bates, M.; Attenburrow, G.; Covington, A.; Antunes, P. Parameters for Composting Tannery Hair Waste. Journal- American Leather Chemists Association 2012, 107, 159–166.
- The Application of FT-IR Spectroscopy in Waste Management | IntechOpen Available online: https://www.intechopen.com/chapters/14634 (accessed on 29 May 2024).
- Torres-Climent, A.; Gomis, P.; Martín-Mata, J.; Bustamante, M.A.; Marhuenda-Egea, F.C.; Pérez-Murcia, M.D.; Pérez-Espinosa, A.; Paredes, C.; Moral, R. Chemical, Thermal and Spectroscopic Methods to Assess Biodegradation of Winery-Distillery Wastes during Composting. PLOS ONE 2015, 10, e0138925. [CrossRef]
- Smidt, E.; Tintner, J.; Klemm, S.; Scholz, U. FT-IR Spectral and Thermal Characterization of Ancient Charcoals - A Tool to Support Archeological and Historical Data Interpretation. Quaternary International 2017, 457, 43–49. [CrossRef]
- Wilkie, C.A. TGA/FTIR: An Extremely Useful Technique for Studying Polymer Degradation. Polymer Degradation and Stability 1999, 66, 301–306. [CrossRef]
- Almeida, E.; Balmayore, M.; Santos, T. Some Relevant Aspects of the Use of FTIR Associated Techniques in the Study of Surfaces and Coatings. Progress in Organic Coatings 2002, 44, 233–242. [CrossRef]
- Bhargava, R.; Wang, S.-Q.; Koenig, J.L. FTIR Microspectroscopy of PolymericSystems. In Liquid Chromatography / FTIR Microspectroscopy / MicrowaveAssisted Synthesis; Springer: Berlin, Heidelberg, 2003; pp. 137–191 ISBN 978-3-540-36432-0.
- Stefanidis, S.D.; Kalogiannis, K.G.; Iliopoulou, E.F.; Michailof, C.M.; Pilavachi, P.A.; Lappas, A.A. A Study of Lignocellulosic Biomass Pyrolysis via the Pyrolysis of Cellulose, Hemicellulose and Lignin. Journal of Analytical and Applied Pyrolysis 2014, 105, 143–150. [CrossRef]
- Narayanan, P.; Janardhanan, S. An Approach towards Identification of Leather from Leather-like Polymeric Material Using FTIR-ATR Technique. Collagen and Leather 2024, 6. [CrossRef]
- Muñoz, M.; Gomez-rico, M.F.; Font, R. Use of Thermogravimetry for Single Characterisation of Samples of the Composting Process from Sewage Sludge. Journal of Analytical and Applied Pyrolysis 2013, 103, 261–267. [CrossRef]
- Pielichowska, K.; Nowicka, K. Analysis of Nanomaterials and Nanocomposites by Thermoanalytical Methods. Thermochimica Acta 2019, 675, 140–163. [CrossRef]
- Conte, P.; Spaccini, R.; Piccolo, A. State of the Art of CPMAS 13C-NMR Spectroscopy Applied to Natural Organic Matter. Progress in Nuclear Magnetic Resonance Spectroscopy 2004, 44, 215–223. [CrossRef]
- Baldock, J.; Oades, J.; Nelson, P.; Skene, T.; Golchin, A.; Clarke, P. Assessing the Extent of Decomposition of Natural Organic Materials Using Solid-State 13C NMR Spectroscopy. Australian Journal of Soil Research - AUST J SOIL RES 1997, 35. [CrossRef]
- Yamazawa, A.; Iikura, T.; Shino, A.; Date, Y.; Kikuchi, J. Solid-, Solution-, and Gas-State NMR Monitoring of C-13-Cellulose Degradation in an Anaerobic Microbial Ecosystem. Molecules (Basel, Switzerland) 2013, 18, 9021–9033. [CrossRef]
- Mao, J.; Cao, X.; Olk, D.; Chu, W.; Schmidt-Rohr, K. Advanced Solid-State NMR Spectroscopy of Natural Organic Matter. Progress in Nuclear Magnetic Resonance Spectroscopy 2017, 100. [CrossRef]
- Spin Dynamics: Basics of Nuclear Magnetic Resonance, 2nd Edition | Wiley Available online: https://www.wiley.com/en-es/Spin+Dynamics%3A+Basics+of+Nuclear+Magnetic+Resonance%2C+2nd+Edition-p-9780470511176 (accessed on 29 May 2024).
- Pagga, U.; Beimborn, D.B.; Boelens, J.; De Wilde, B. Determination of the Aerobic Biodegradability of Polymeric Material in a Laboratory Controlled Composting Test. Chemosphere 1995, 31, 4475–4487. [CrossRef]
- Vico, A.; Pérez-Murcia, M.D.; Bustamante, M.A.; Agulló, E.; Marhuenda-Egea, F.C.; Sáez, J.A.; Paredes, C.; Pérez-Espinosa, A.; Moral, R. Valorization of Date Palm (Phoenix Dactylifera L.) Pruning Biomass by Co-Composting with Urban and Agri-Food Sludge. Journal of Environmental Management 2018, 226, 408–415. [CrossRef]
- Zucconi, F.; Pera, A.; Forte, M.; Bertoldi, M. Evaluating Toxicity of Immature Compost. Biocycle 1981.
- OECD Test No. 208: Terrestrial Plant Test: Seedling Emergence and Seedling Growth Test; Organisation for Economic Co-operation and Development: Paris, 2006;
- Martín-Mata, J.; Lahoz-Ramos, C.; Bustamante, M.A.; Marhuenda-Egea, F.C.; Moral, R.; Santos, A.; Sáez, J.A.; Bernal, M.P. Thermal and Spectroscopic Analysis of Organic Matter Degradation and Humification during Composting of Pig Slurry in Different Scenarios. Environ Sci Pollut Res 2016, 23, 17357–17369. [CrossRef]
- Wilson, M. NMR Techniques and Applications in Geochemistry and Soil Chemistry. 1987, 1987.
- Nelson, P.; Baldock, J. Estimating the Molecular Composition of a Diverse Range of Natural Organic Materials from Solid-State 13C NMR and Elemental Analyses. Biogeochemistry 2005, 72, 1–34. [CrossRef]
- Huang, Y.; Chen, Y.; Huang, H.; Lin, J.; Yan, M.; Guo, C.; Xiao, X. A Technology to Reduce Ammonia Emission via Controllingproteolytic Bacterial Community and Physicochemical Properties 2023.
- Xiang, E.; Moran, C.S.; Ivanovski, S.; Abdal-hay, A. Nanosurface Texturing for Enhancing the Antibacterial Effect of Biodegradable Metal Zinc: Surface Modifications. Nanomaterials 2023, 13, 2022. [CrossRef]
- Zucconi, F.; Monaco, A.; Forte, M. Phytotoxins during the Stabilization of Organic Matter.; 1985.
- Evaluating Phytotoxicity of Pig Manure from the Pig-on-Litter System Available online: https://deepblue.lib.umich.edu/handle/2027.42/191304 (accessed on 16 May 2024).
- Emino, E.R.; Warman, P.R. Biological Assay for Compost Quality. Compost Science & Utilization 2004, 12, 342–348. [CrossRef]
- Varnero M, M.T.; Rojas A, C.; Orellana R, R. ÍNDICES DE FITOTOXICIDAD EN RESIDUOS ORGÁNICOS DURANTE EL COMPOSTAJE. Revista de la ciencia del suelo y nutrición vegetal 2007, 7, 28–37. [CrossRef]
- Bělonožníková, K.; Černý, M.; Hýsková, V.; Synková, H.; Valcke, R.; Hodek, O.; Křížek, T.; Kavan, D.; Vaňková, R.; Dobrev, P.; et al. Casein as Protein and Hydrolysate: Biostimulant or Nitrogen Source for Nicotiana Tabacum Plants Grown in Vitro? Physiologia Plantarum 2023, 175, e13973. [CrossRef]
- Kaufhold, S.; Reese, A.; Schwiebacher, W.; Dohrmann, R.; Grathoff, G.H.; Warr, L.N.; Halisch, M.; Müller, C.; Schwarz-Schampera, U.; Ufer, K. Porosity and Distribution of Water in Perlite from the Island of Milos, Greece. SpringerPlus 2014, 3, 598. [CrossRef]
- Saufi, H.; el Alouani, M.; Alehyen, S.; el Achouri, M.; Jilali, A.; Taibi, M. Photocatalytic Degradation of Methylene Blue from Aqueous Medium onto Perlite-Based Geopolymer. International Journal of Chemical Engineering 2020, 2020, 1–7. [CrossRef]
- Bohacz, J. Changes in Mineral Forms of Nitrogen and Sulfur and Enzymatic Activities during Composting of Lignocellulosic Waste and Chicken Feathers. Environ Sci Pollut Res 2019, 26, 10333–10342. [CrossRef]
- Prochoń, M.; Marzec, A.; Szadkowski, B. Preparation and Characterization of New Environmentally Friendly Starch-Cellulose Materials Modified with Casein or Gelatin for Agricultural Applications. Materials 2019, 12, 1684. [CrossRef]
- De Gregorio, E.; Miliani, F.M.; Vivaldi, F.M.; Calisi, N.; Poma, N.; Tavanti, A.; Duce, C.; Nardella, F.; Legnaioli, S.; Carota, A.G.; et al. A Casein-Based Biodegradable and Sustainable Capacitive Sensor. Materials Chemistry and Physics 2024, 314, 128888. [CrossRef]
- Blaya, J.; Marhuenda, F.C.; Pascual, J.A.; Ros, M. Microbiota Characterization of Compost Using Omics Approaches Opens New Perspectives for Phytophthora Root Rot Control. PLOS ONE 2016, 11, e0158048. [CrossRef]
- Cerda, A.; Artola, A.; Font, X.; Barrena, R.; Gea, T.; Sánchez, A. Composting of Food Wastes: Status and Challenges. Bioresource Technology 2018, 248, 57–67. [CrossRef]
- Numata, K.; Asano, A.; Nakazawa, Y. Solid-State and Time Domain NMR to Elucidate Degradation Behavior of Thermally Aged Poly (Urea-Urethane). Polymer Degradation and Stability 2020, 172, 109052. [CrossRef]
- Li, J.; Chen, H. Biodegradation of Whey Protein-Based Edible Films. Journal of Polymers and the Environment 2000, 8, 135–143. [CrossRef]
- Auer, N.; Hedger, J.N.; Evans, C.S. Degradation of Nitrocellulose by Fungi. Biodegradation 2005, 16, 229–236. [CrossRef]
- Erdal, N.B.; Hakkarainen, M. Degradation of Cellulose Derivatives in Laboratory, Man-Made, and Natural Environments. Biomacromolecules 2022, 23, 2713–2729. [CrossRef]
- Roper, M. The Isolation and Characterisation of Bacteria with the Potential to Degrade Waxes That Cause Water Repellency in Sandy Soils. Australian Journal of Soil Research - AUST J SOIL RES 2004, 42. [CrossRef]
- Zafar, U.; Nzeram, P.; Langarica Fuentes, A.; Houlden, A.; Heyworth, A.; Saiani, A.; Robson, G. Biodegradation of Polyester Polyurethane during Commercial Composting and Analysis of Associated Fungal Communities. Bioresource technology 2014, 158. [CrossRef]
- Pfohl, P.; Bahl, D.; Rückel, M.; Wagner, M.; Meyer, L.; Bolduan, P.; Battagliarin, G.; Hüffer, T.; Zumstein, M.; Hofmann, T.; et al. Effect of Polymer Properties on the Biodegradation of Polyurethane Microplastics. Environ. Sci. Technol. 2022, 56, 16873–16884. [CrossRef]
- Kim, Y.D.; Kim, S.C. Effect of Chemical Structure on the Biodegradation of Polyurethanes under Composting Conditions. Polymer Degradation and Stability 1998, 62, 343–352. [CrossRef]
- Krasowska, K.; Janik, H.; Gradys, A.; Rutkowska, M. Degradation of Polyurethanes in Compost under Natural Conditions. Journal of Applied Polymer Science 2012, 125, 4252–4260. [CrossRef]
- Almeida, E.; Almeida, E.; Santos, M. E. Almeida, M. Balmayore e T. Santos, “Some Relevant Aspects of the Use of FTIR Associated Techniques in the Study of Surfaces and Coatings”, Prog. Org. Coat., Submetido Para Publicação (2002). Progress in Organic Coatings 2002, 44. [CrossRef]
- Hernandez, A.-B.; Ferrasse, J.-H.; Akkache, S.; Roche, N. Thermochemical Conversion of Sewage Sludge by TGA-FTIR Analysis: Influence of Mineral Matter Added. Drying Technology 2015, 33, 1318–1326. [CrossRef]
- Tosin, M.; Degli-Innocenti, F.; Bastioli, C. Detection of a Toxic Product Released by a Polyurethane-Containing Film Using a Composting Test Method Based on a Mineral Bed. Journal of Polymers and the Environment 1998, 6, 79–90. [CrossRef]
- Vaverková, M.; Adamcová, D.; Hermanová, S.; Voběrková, S. Ecotoxicity of Composts Containing Aliphatic-Aromatic Copolyesters. Pol. J. Environ. Stud. 2015, 24, 1497–1505. [CrossRef]
- Aylaj, M.; Adani, F. The Evolution of Compost Phytotoxicity during Municipal Waste and Poultry Manure Composting. J. Ecol. Eng. 2023, 24, 281–293. [CrossRef]
- Kapanen, A. Ecotoxicity Assessment of Biodegradable Plastics and Sewage Sludge in Compost and in Soil.; November 16 2012.
- Zuriaga-Agustí, E.; Galiana-Aleixandre, M.V.; Bes-Piá, A.; Mendoza-Roca, J.A.; Risueño-Puchades, V.; Segarra, V. Pollution Reduction in an Eco-Friendly Chrome-Free Tanning and Evaluation of the Biodegradation by Composting of the Tanned Leather Wastes. Journal of Cleaner Production 2015, 87, 874–881. [CrossRef]
- Sardroudi, N.P.; Sorolla, S.; Casas, C.; Bacardit, A. A Study of the Composting Capacity of Different Kinds of Leathers, Leatherette and Alternative Materials. Sustainability 2024, 16, 2324. [CrossRef]
- Constantinescu, R.R.; Deselnicu, V.; Crudu, M.; Macovescu, G.; Albu, L. Comparative Study Regarding Leather Biodegradability. LFJ 2015, 15, 73–84. [CrossRef]
- Hashem, Md.A.; Hasan, M.; Hasan, Md.A.; Sahen, Md.S.; Payel, S.; Mizan, A.; Nur-A-Tomal, Md.S. Composting of Limed Fleshings Generated in a Tannery: Sustainable Waste Management. Environ Sci Pollut Res 2023, 30, 39029–39041. [CrossRef]
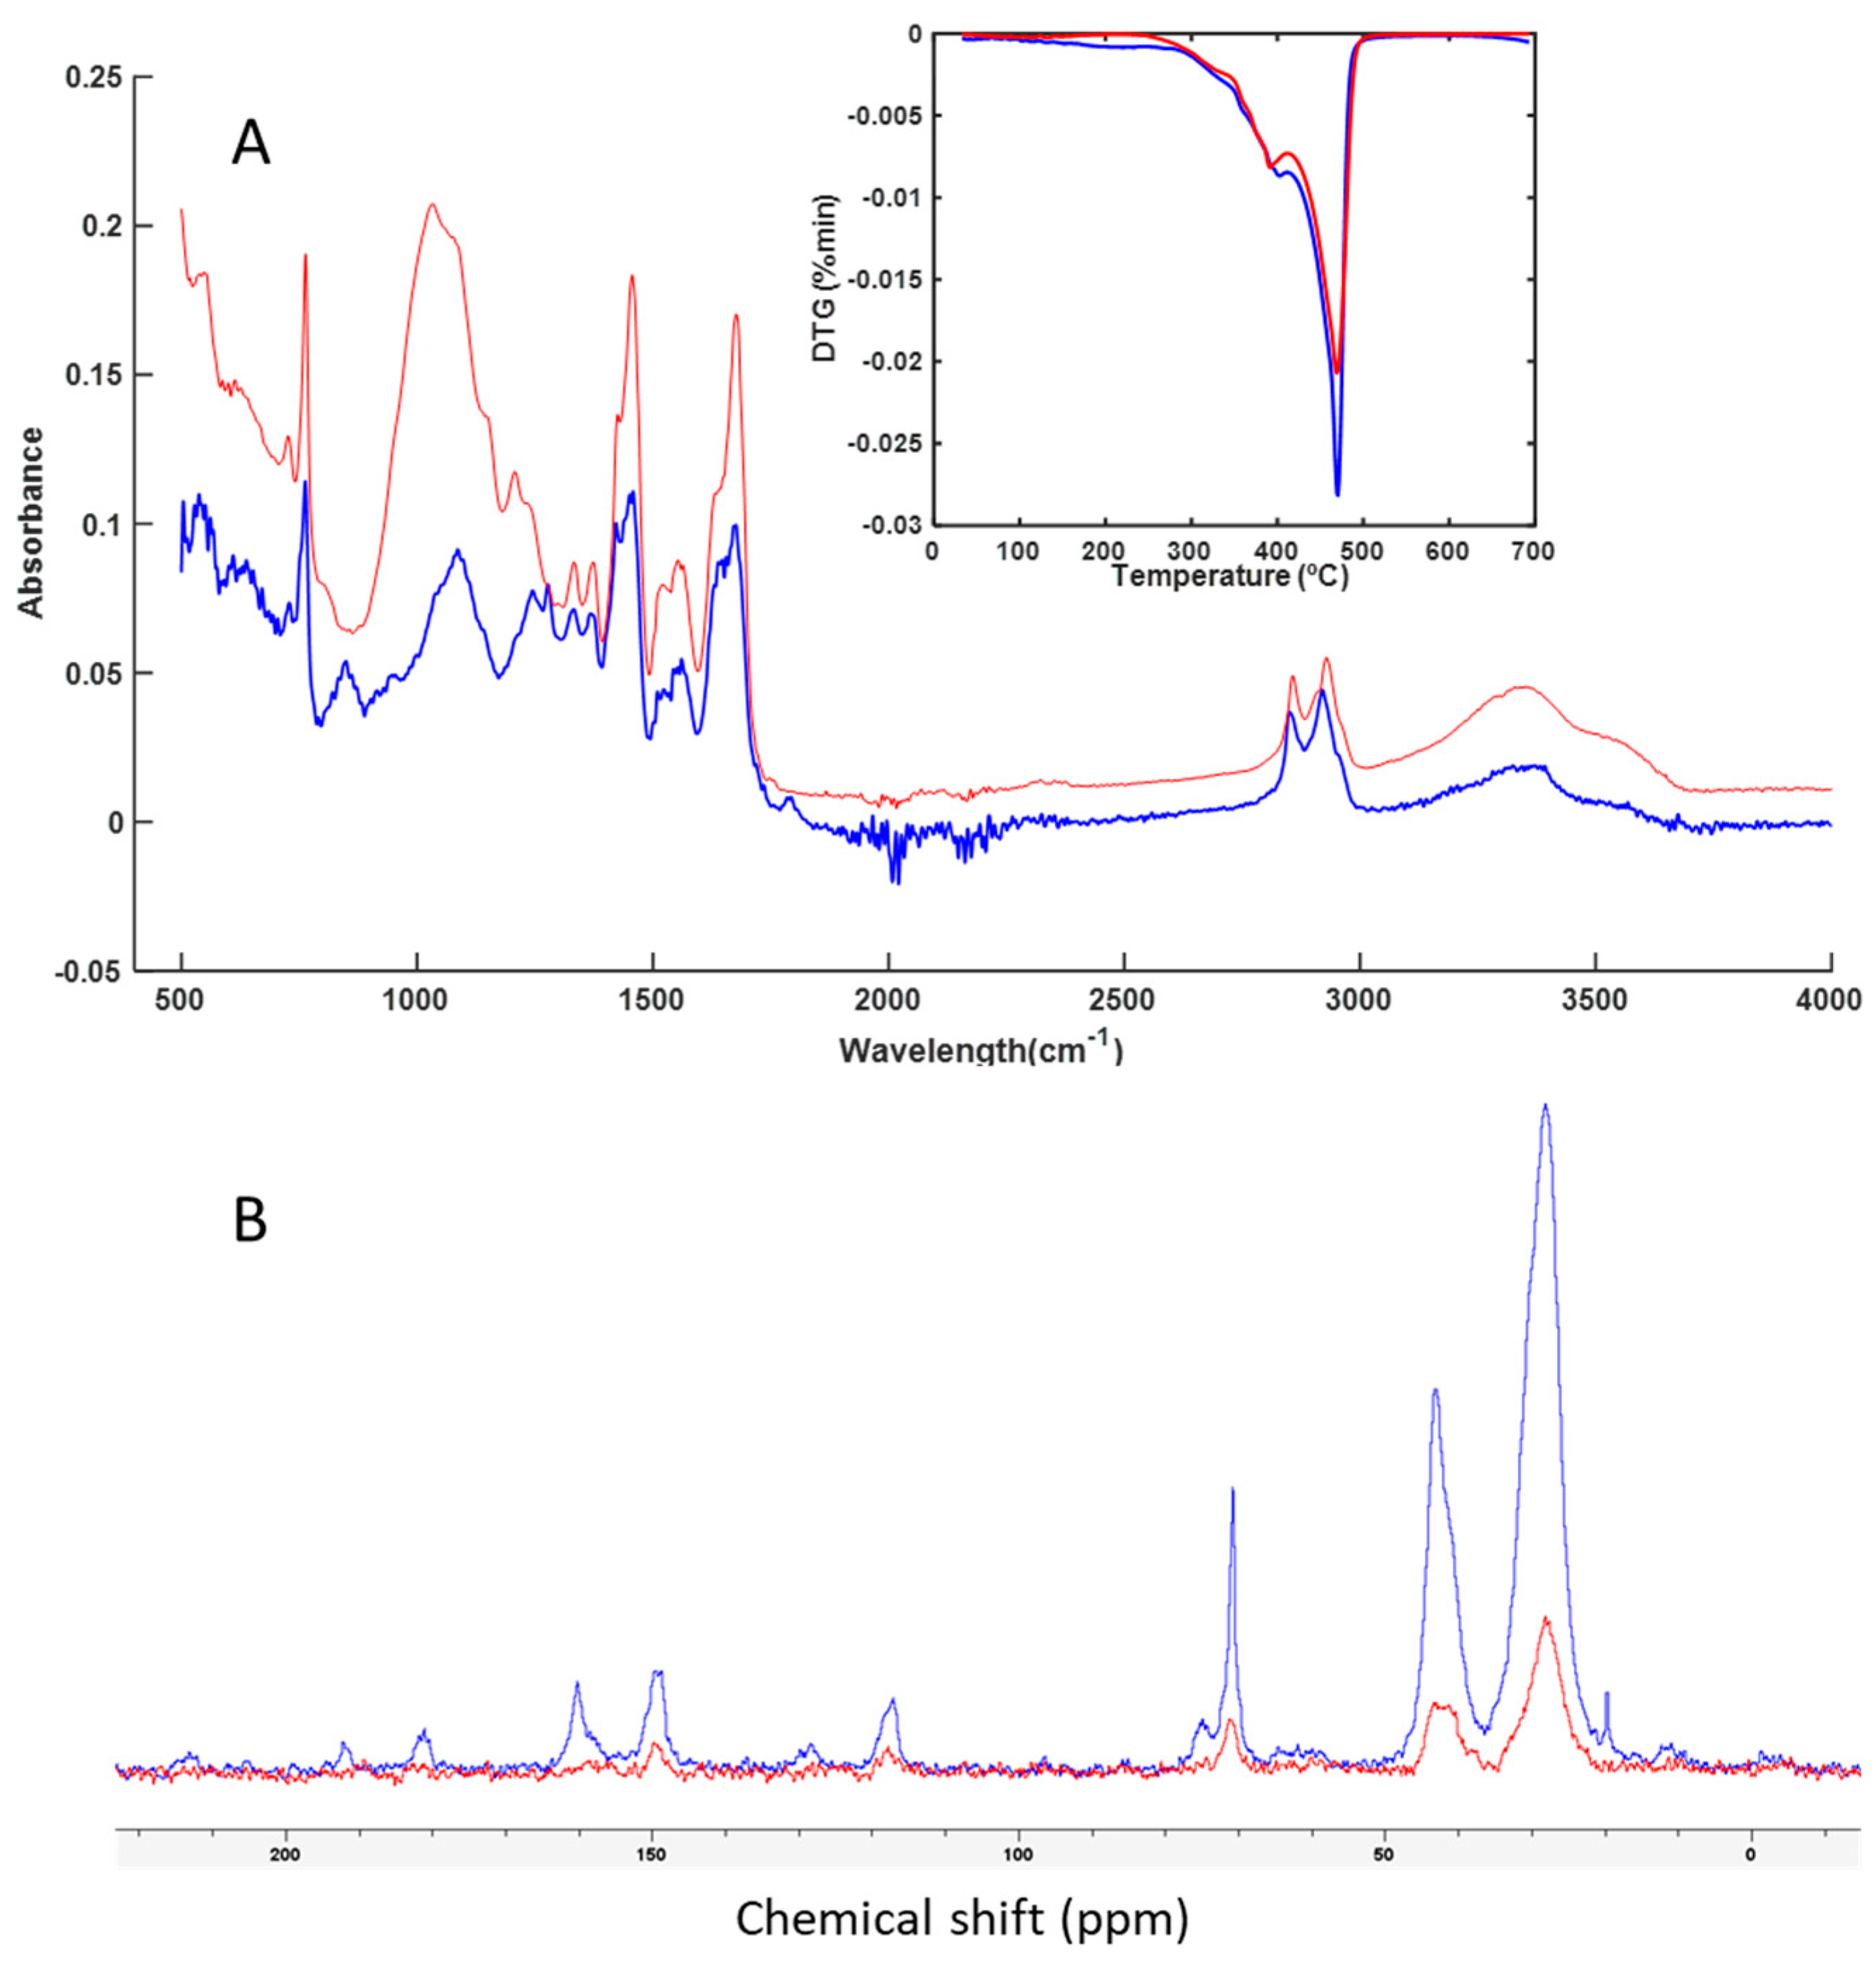
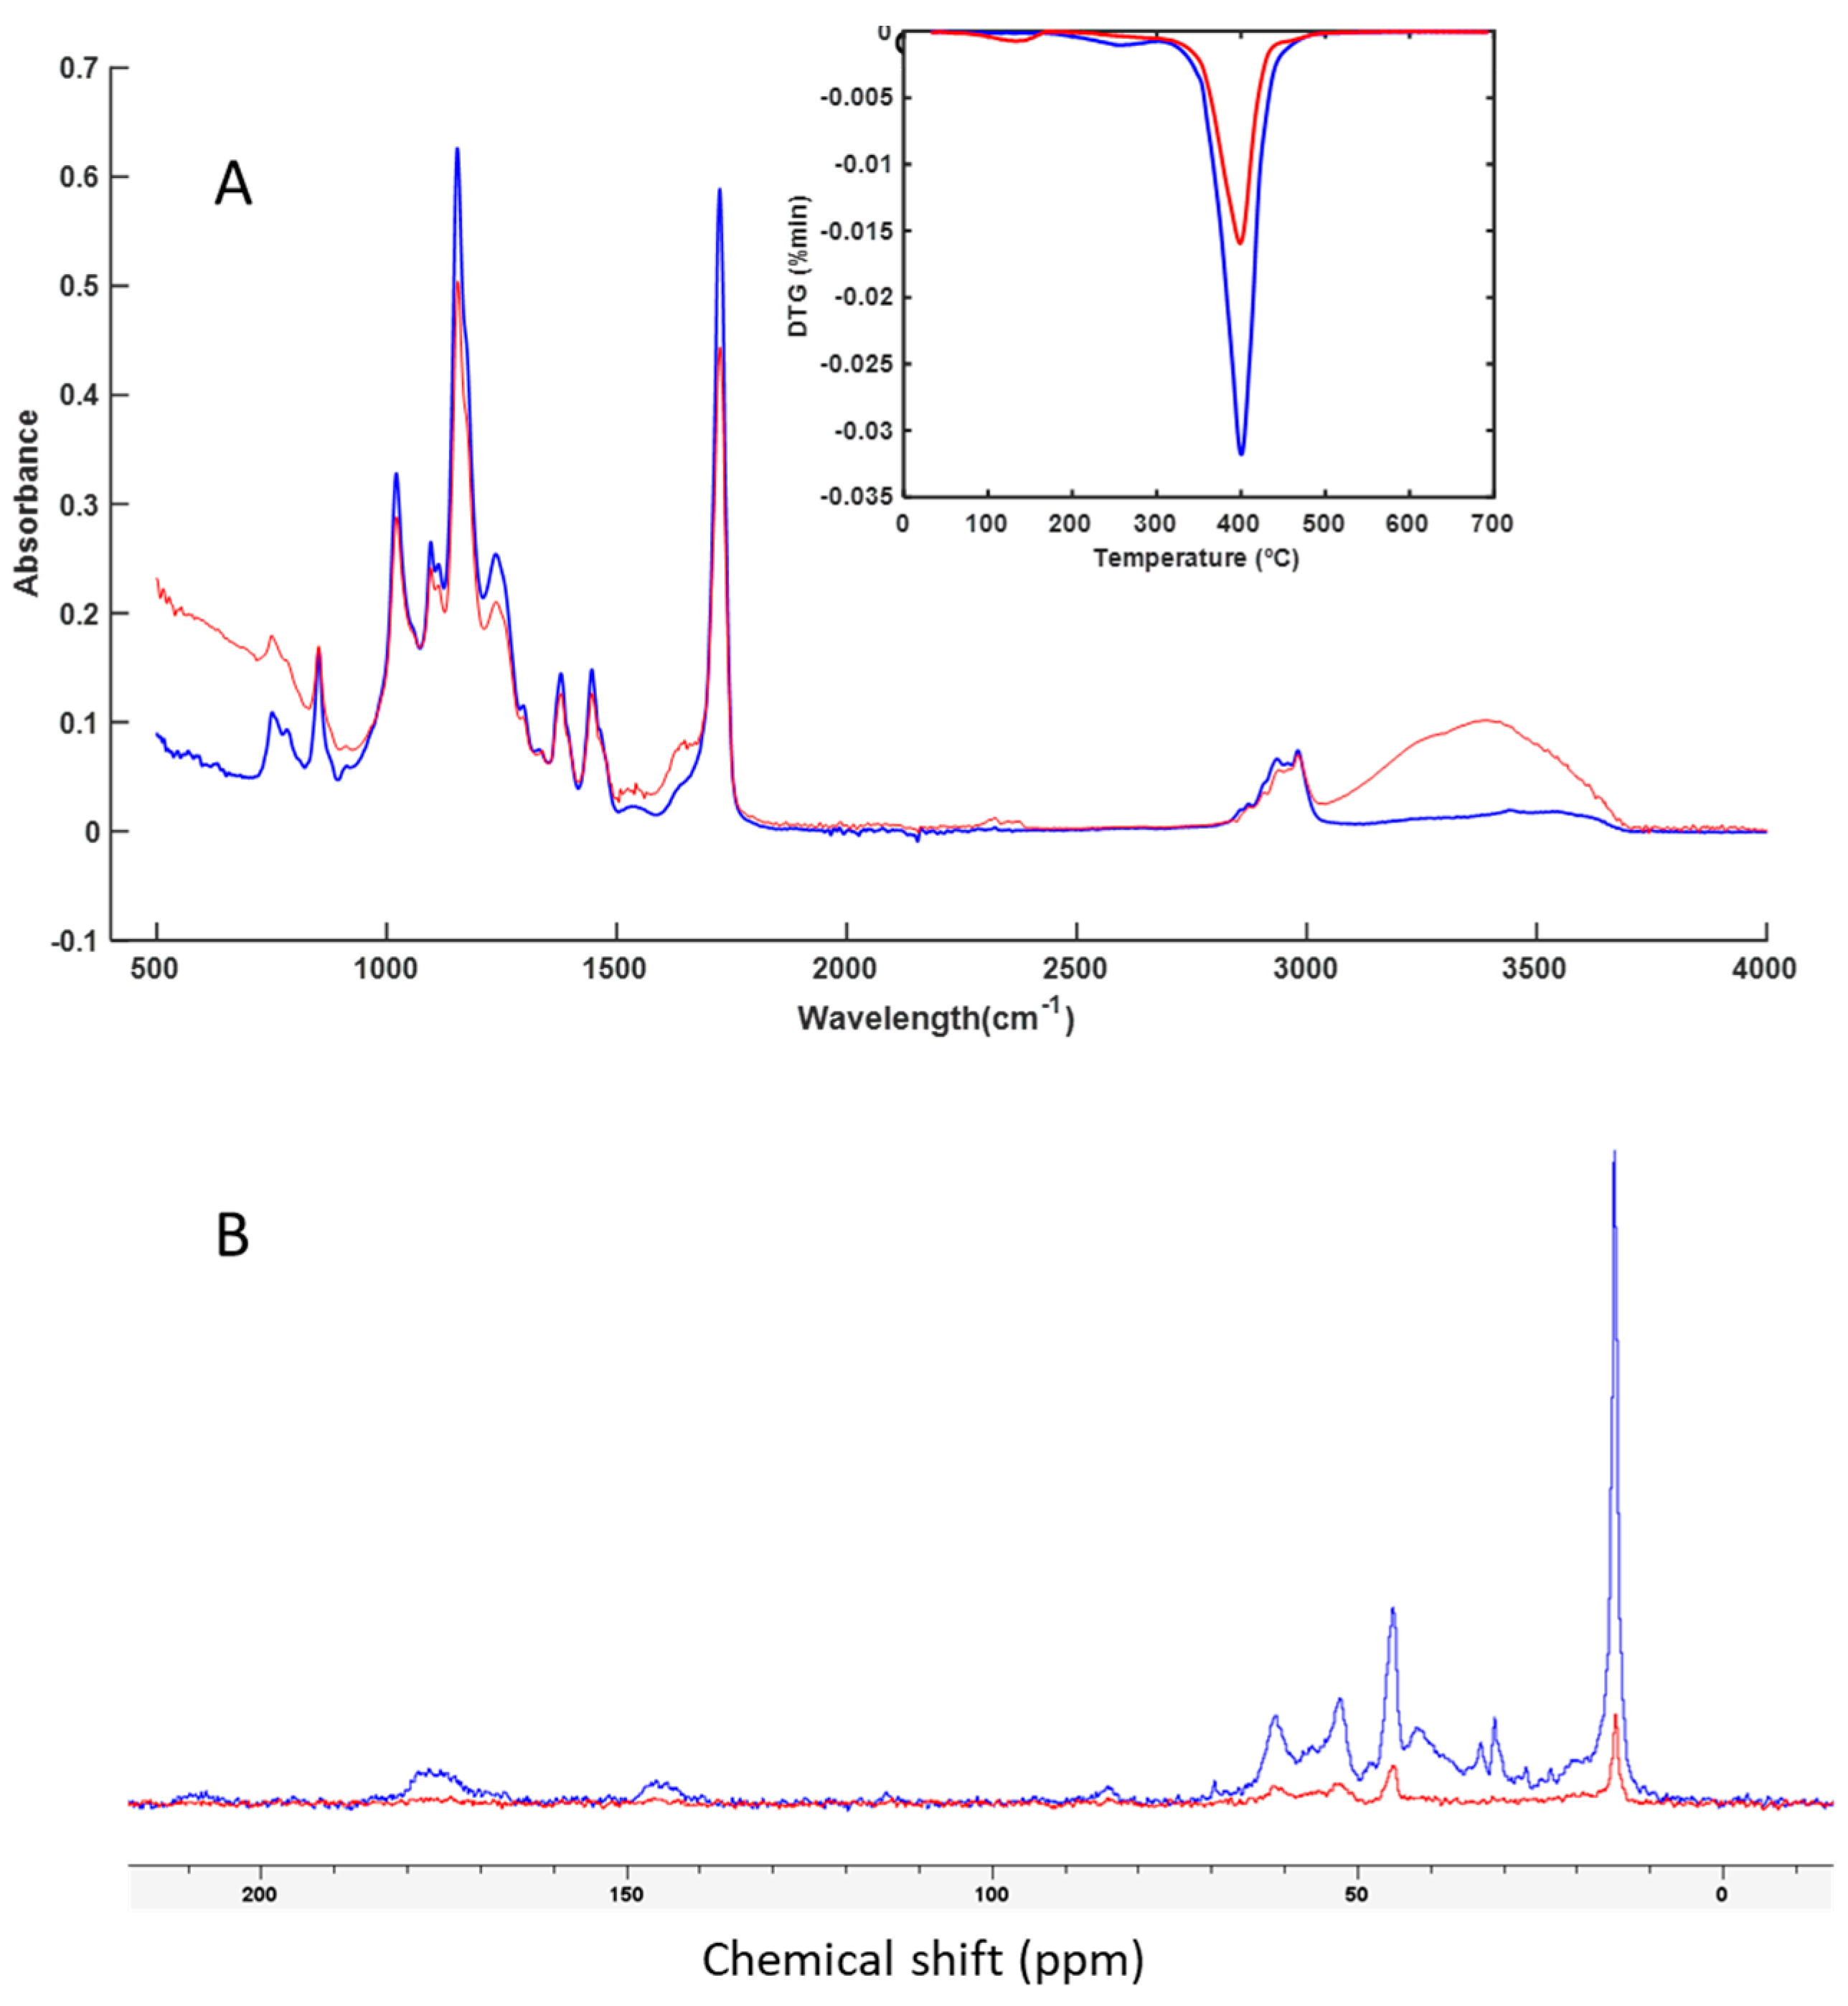
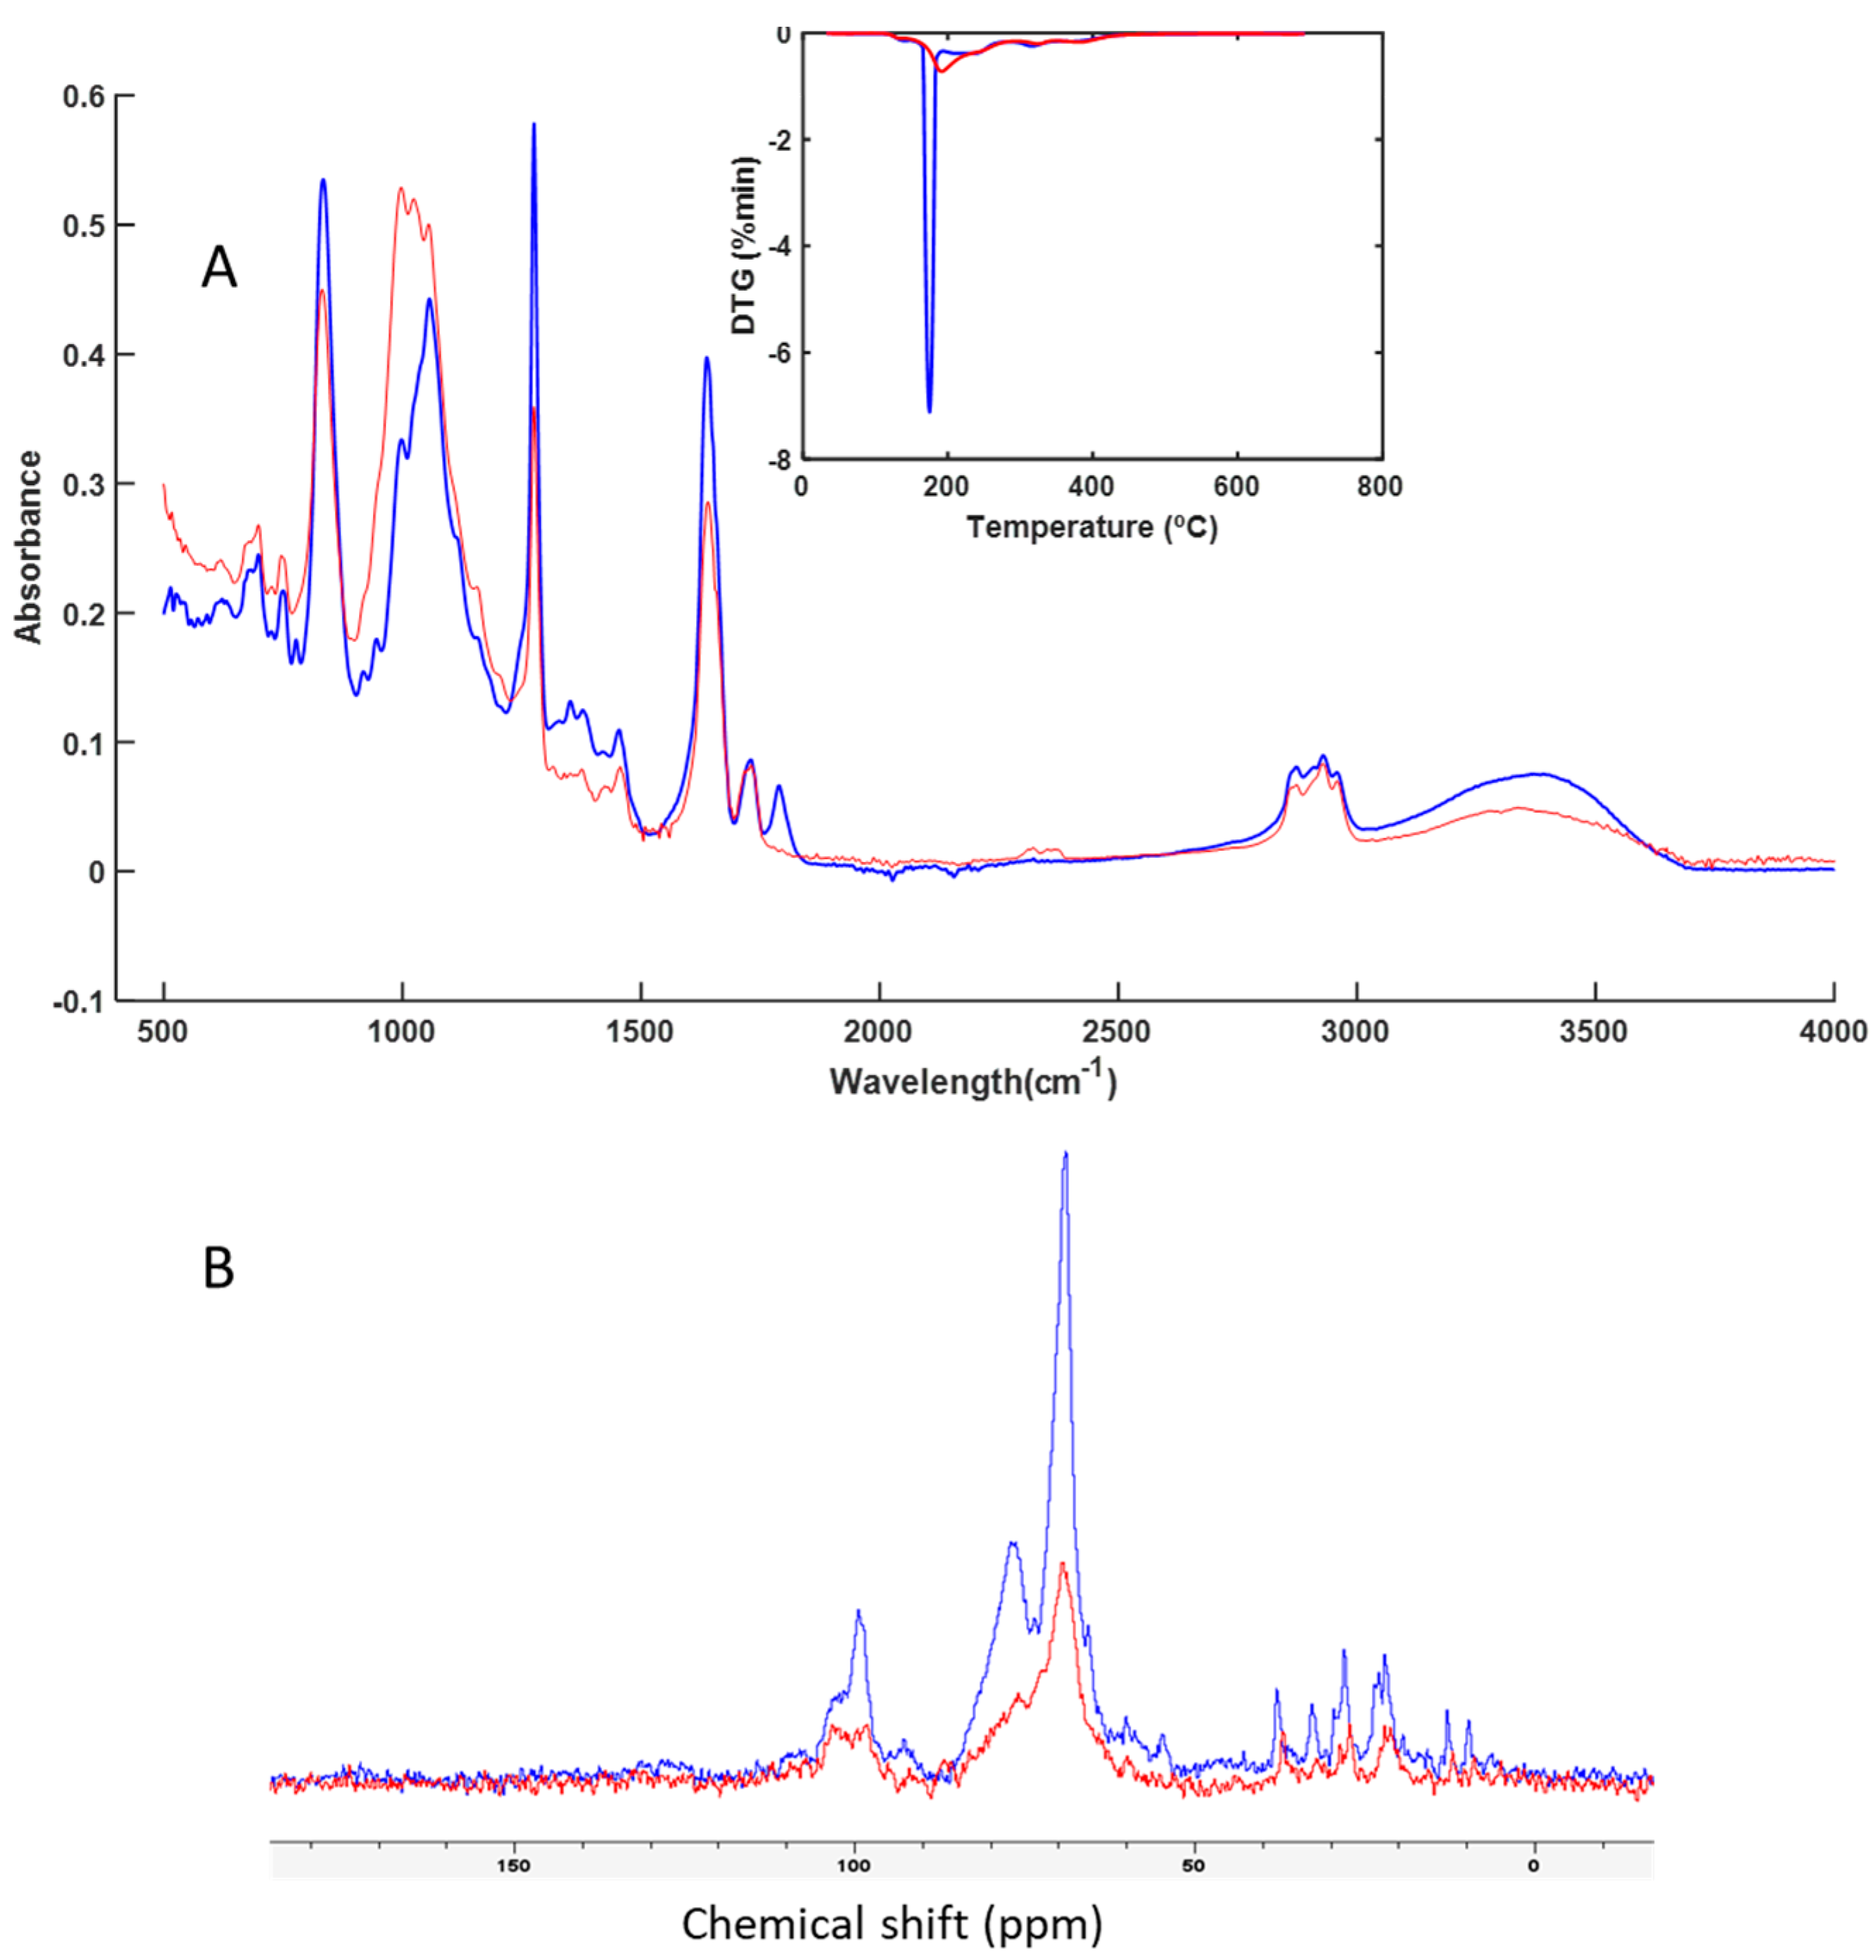
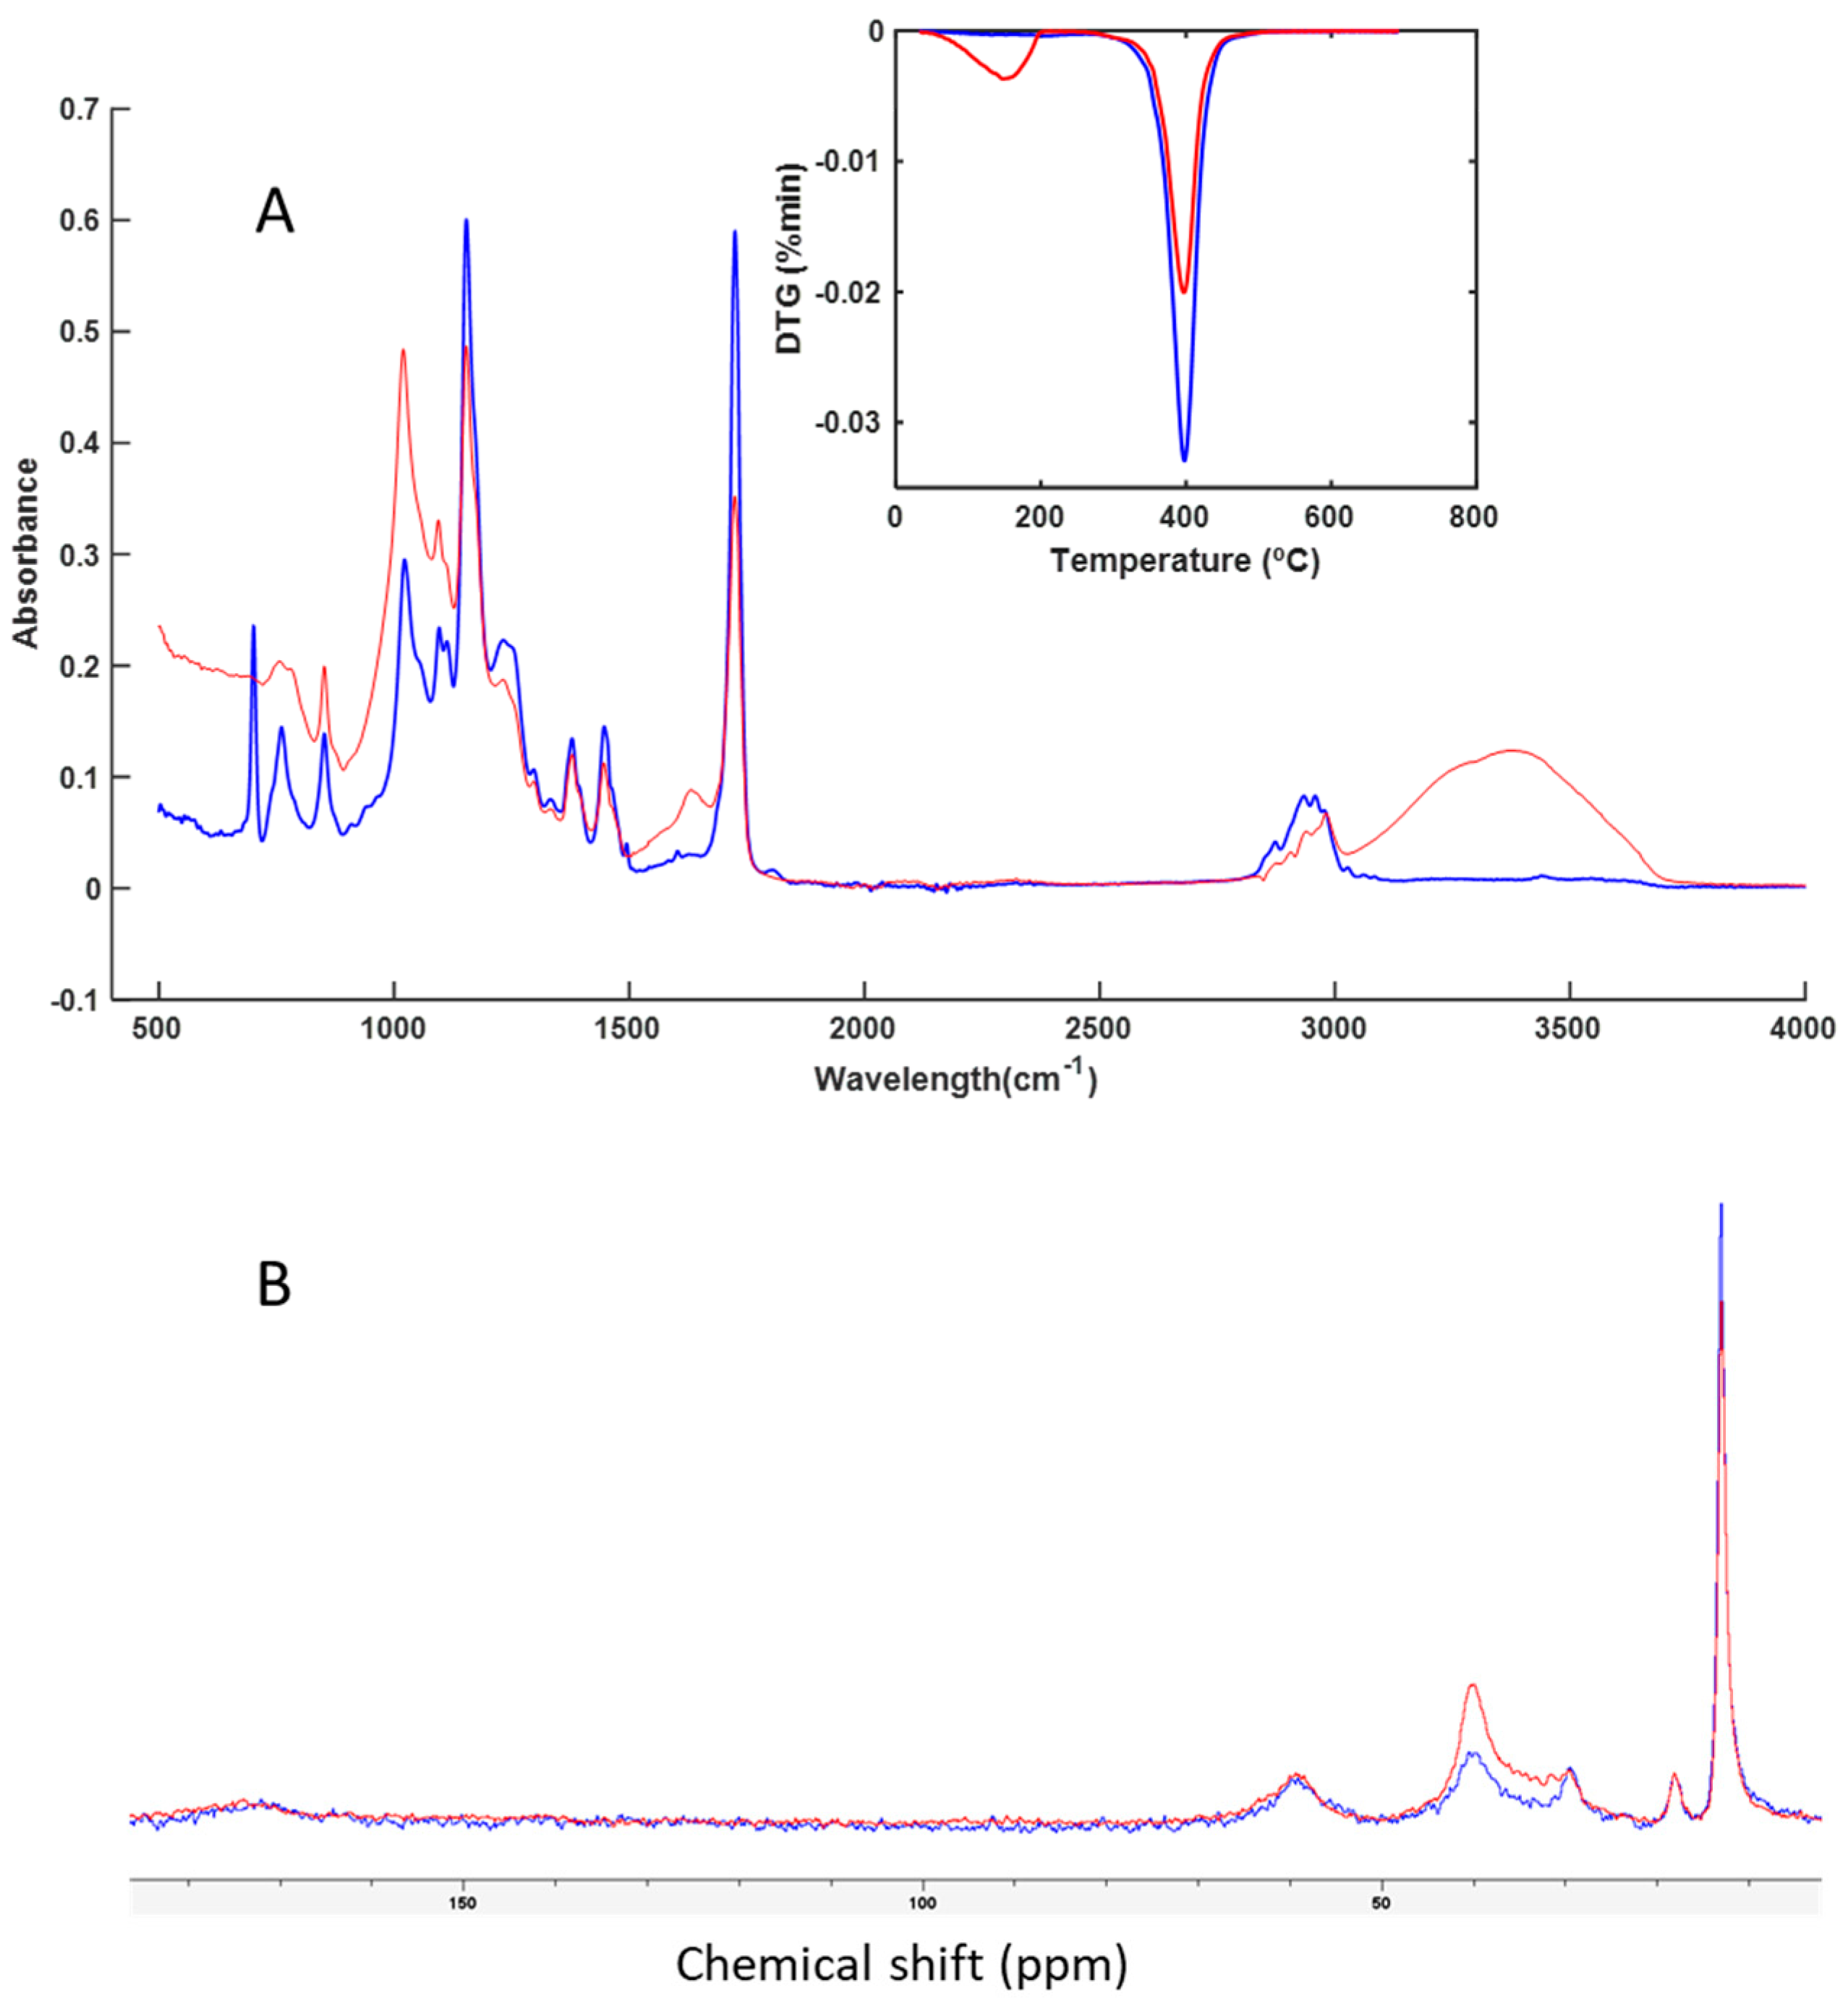
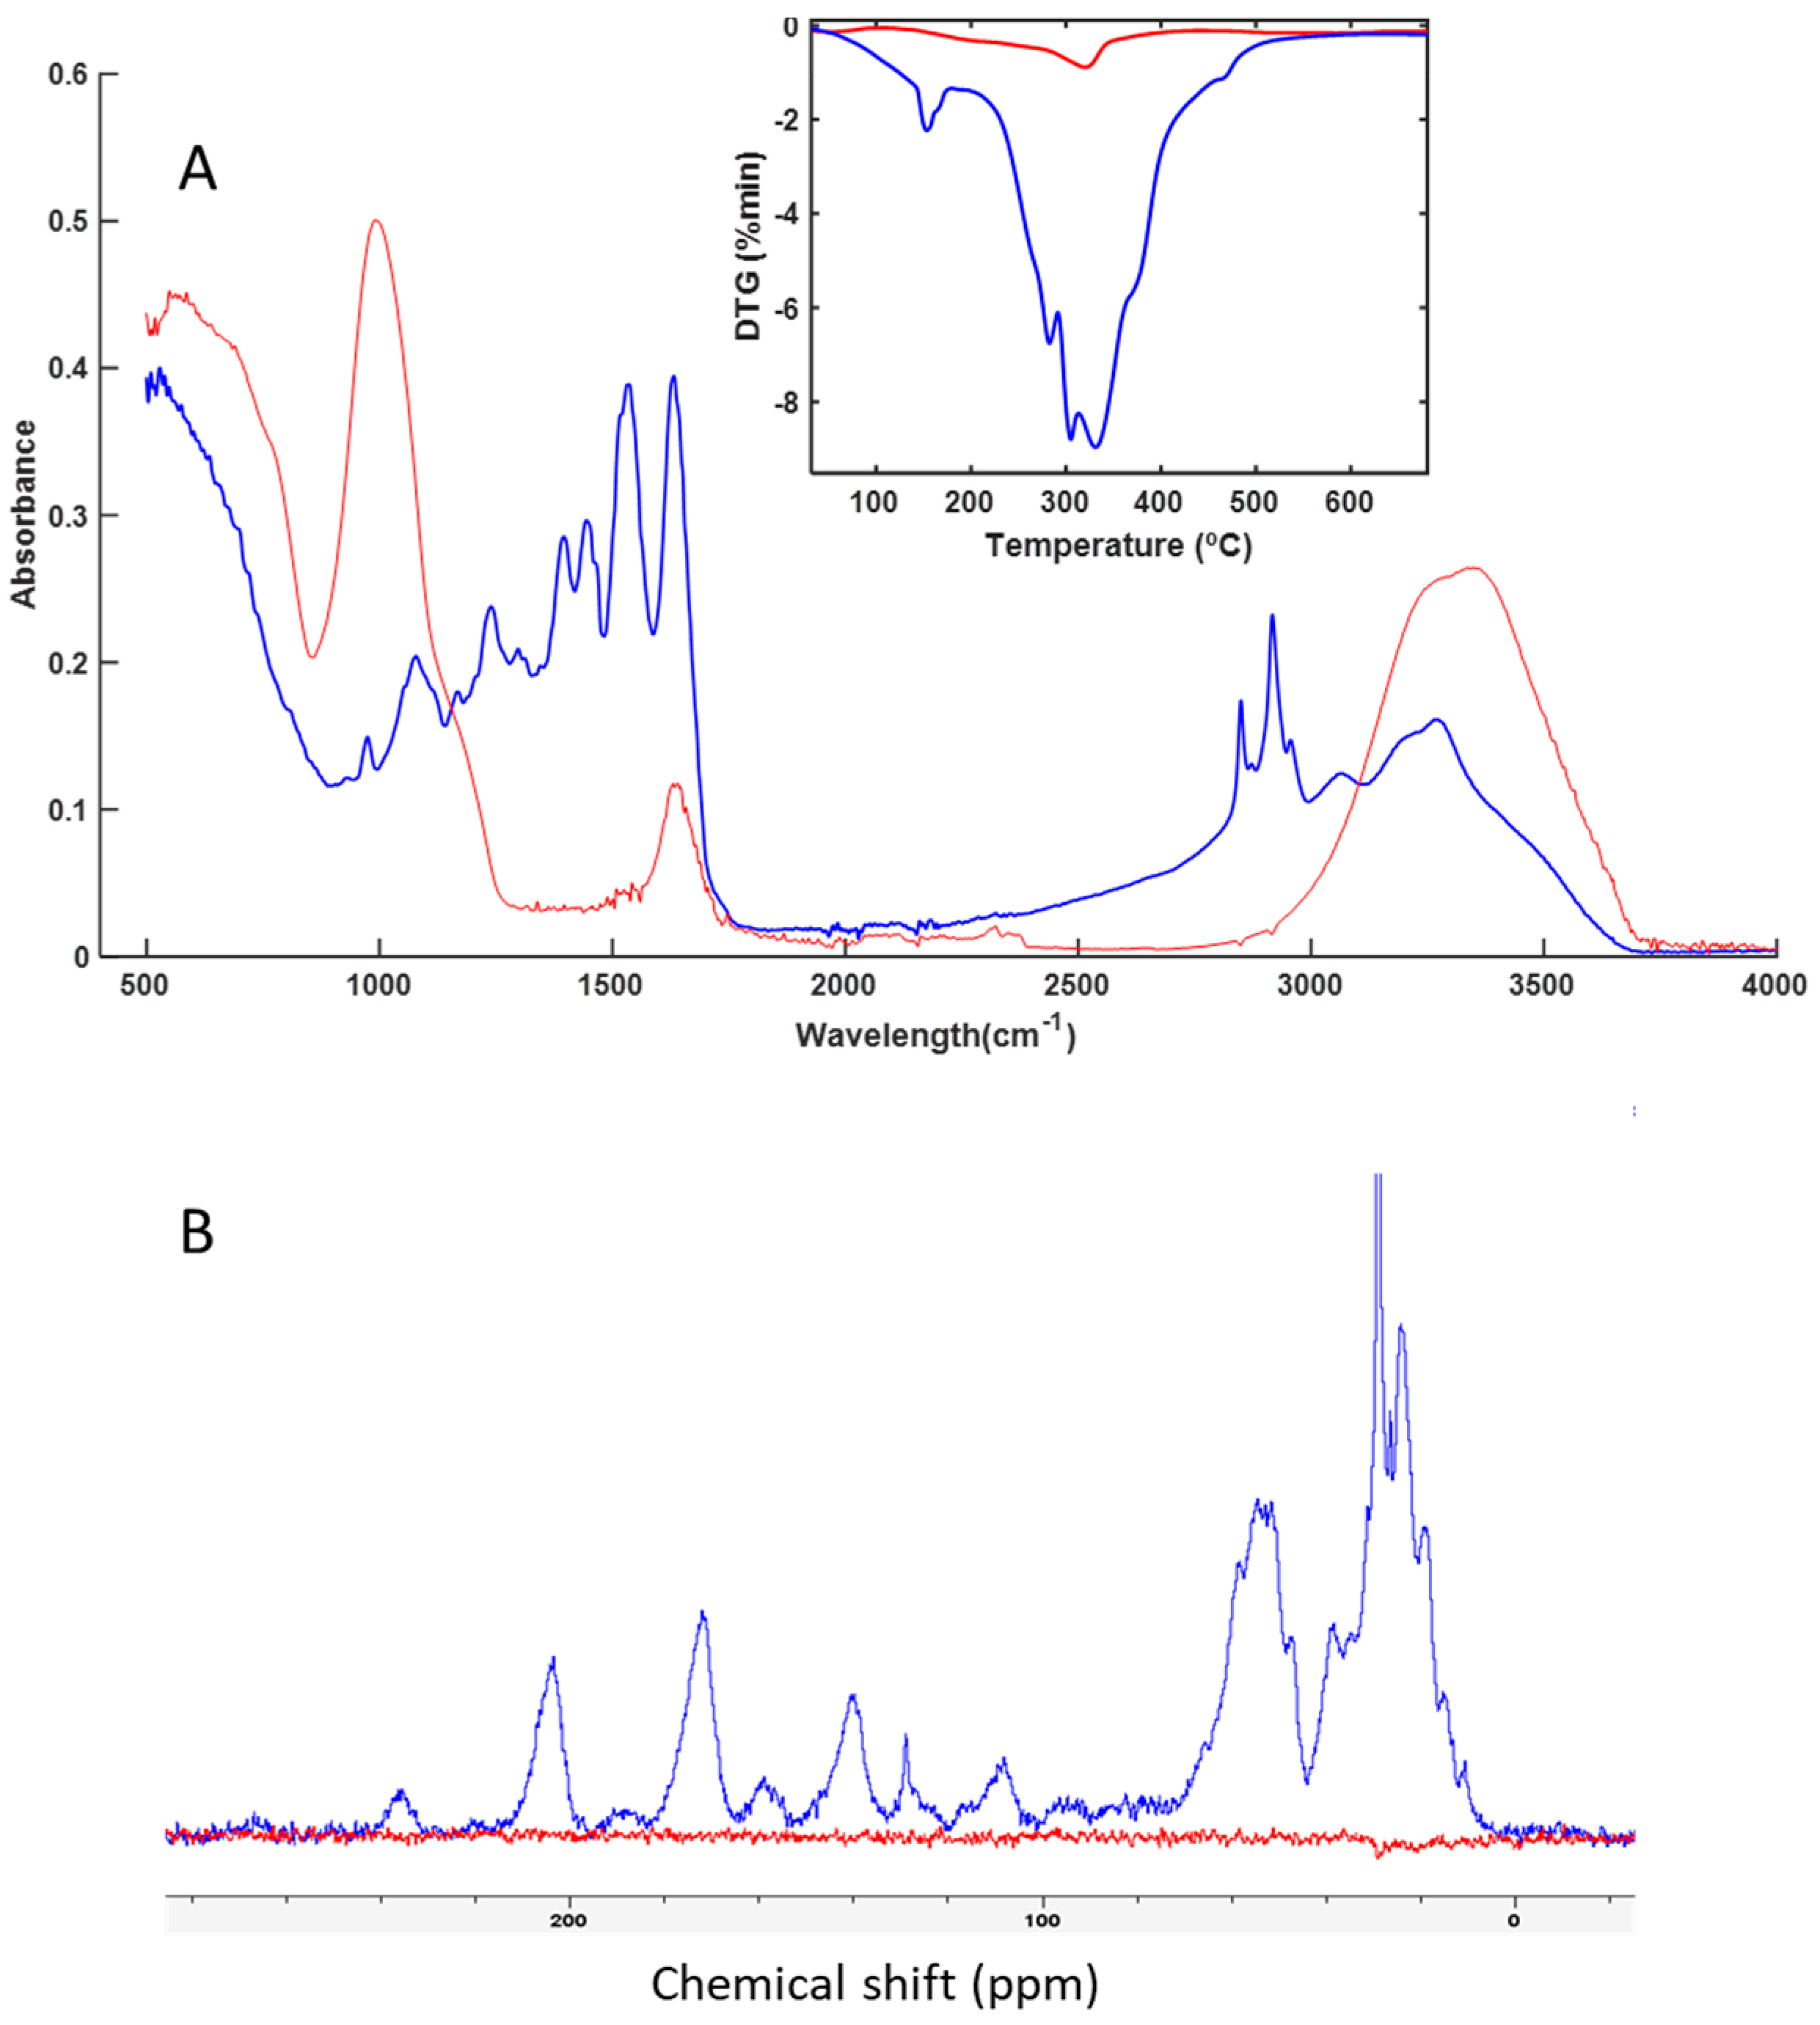
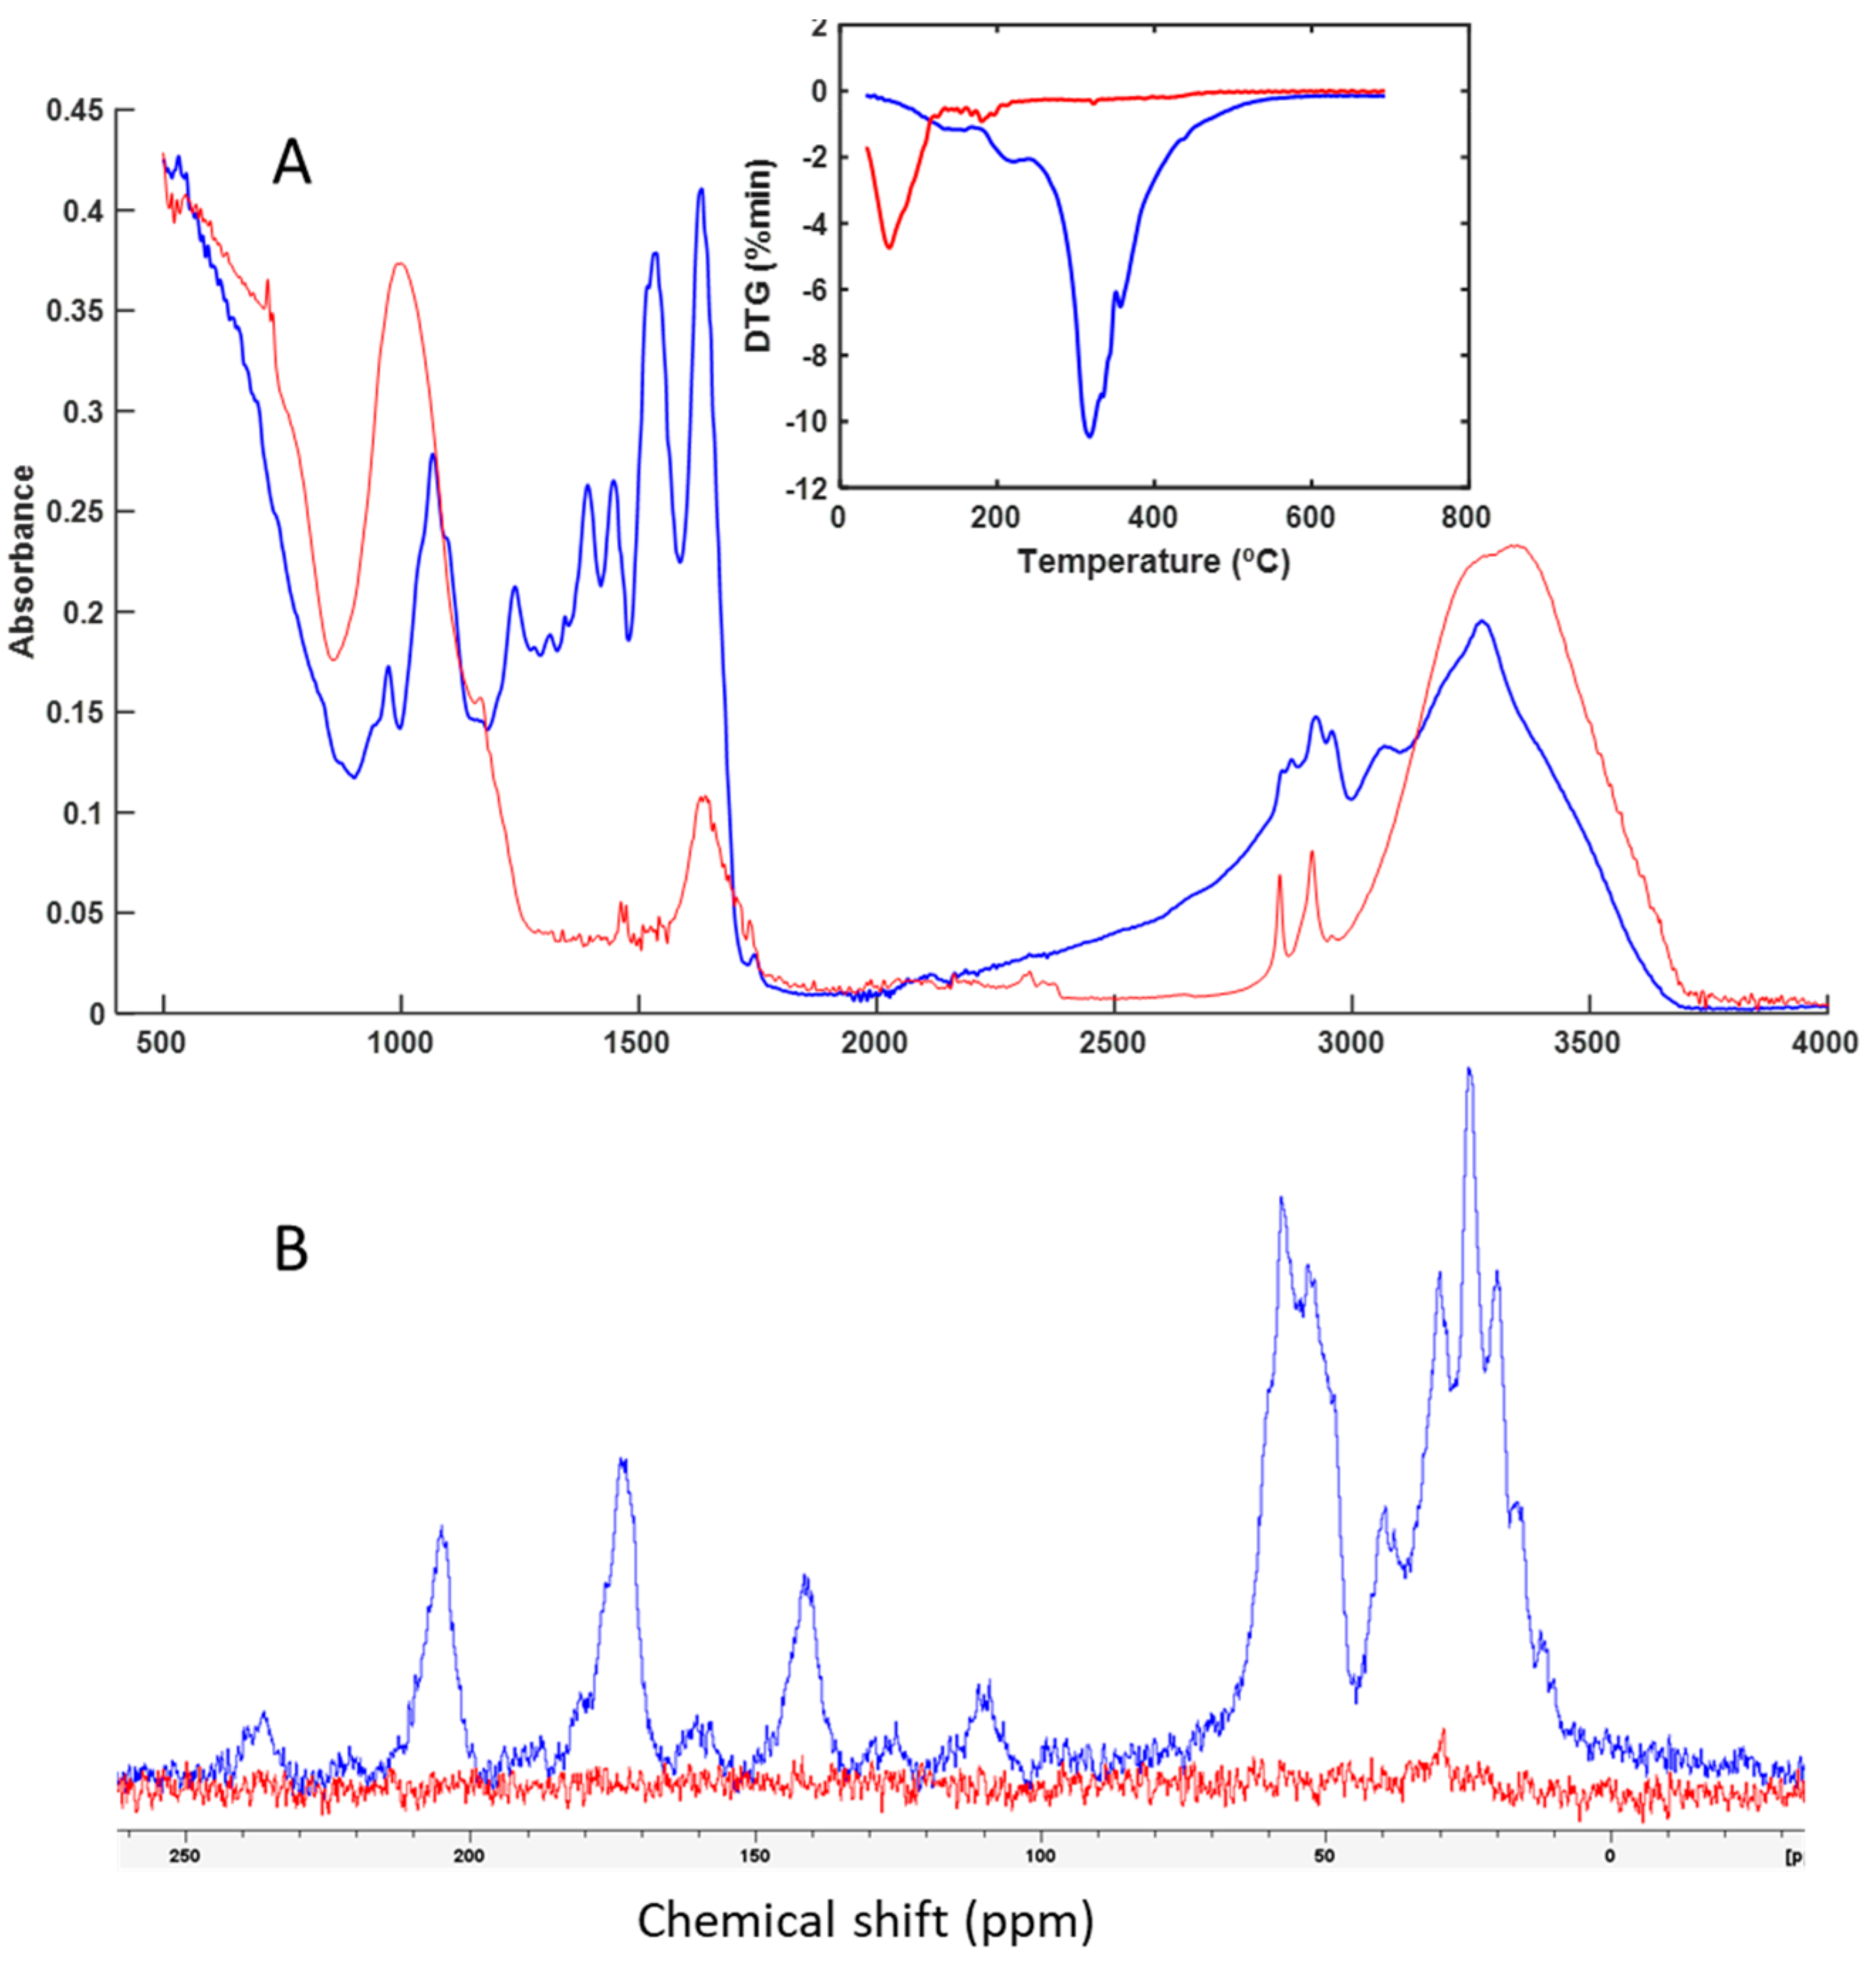
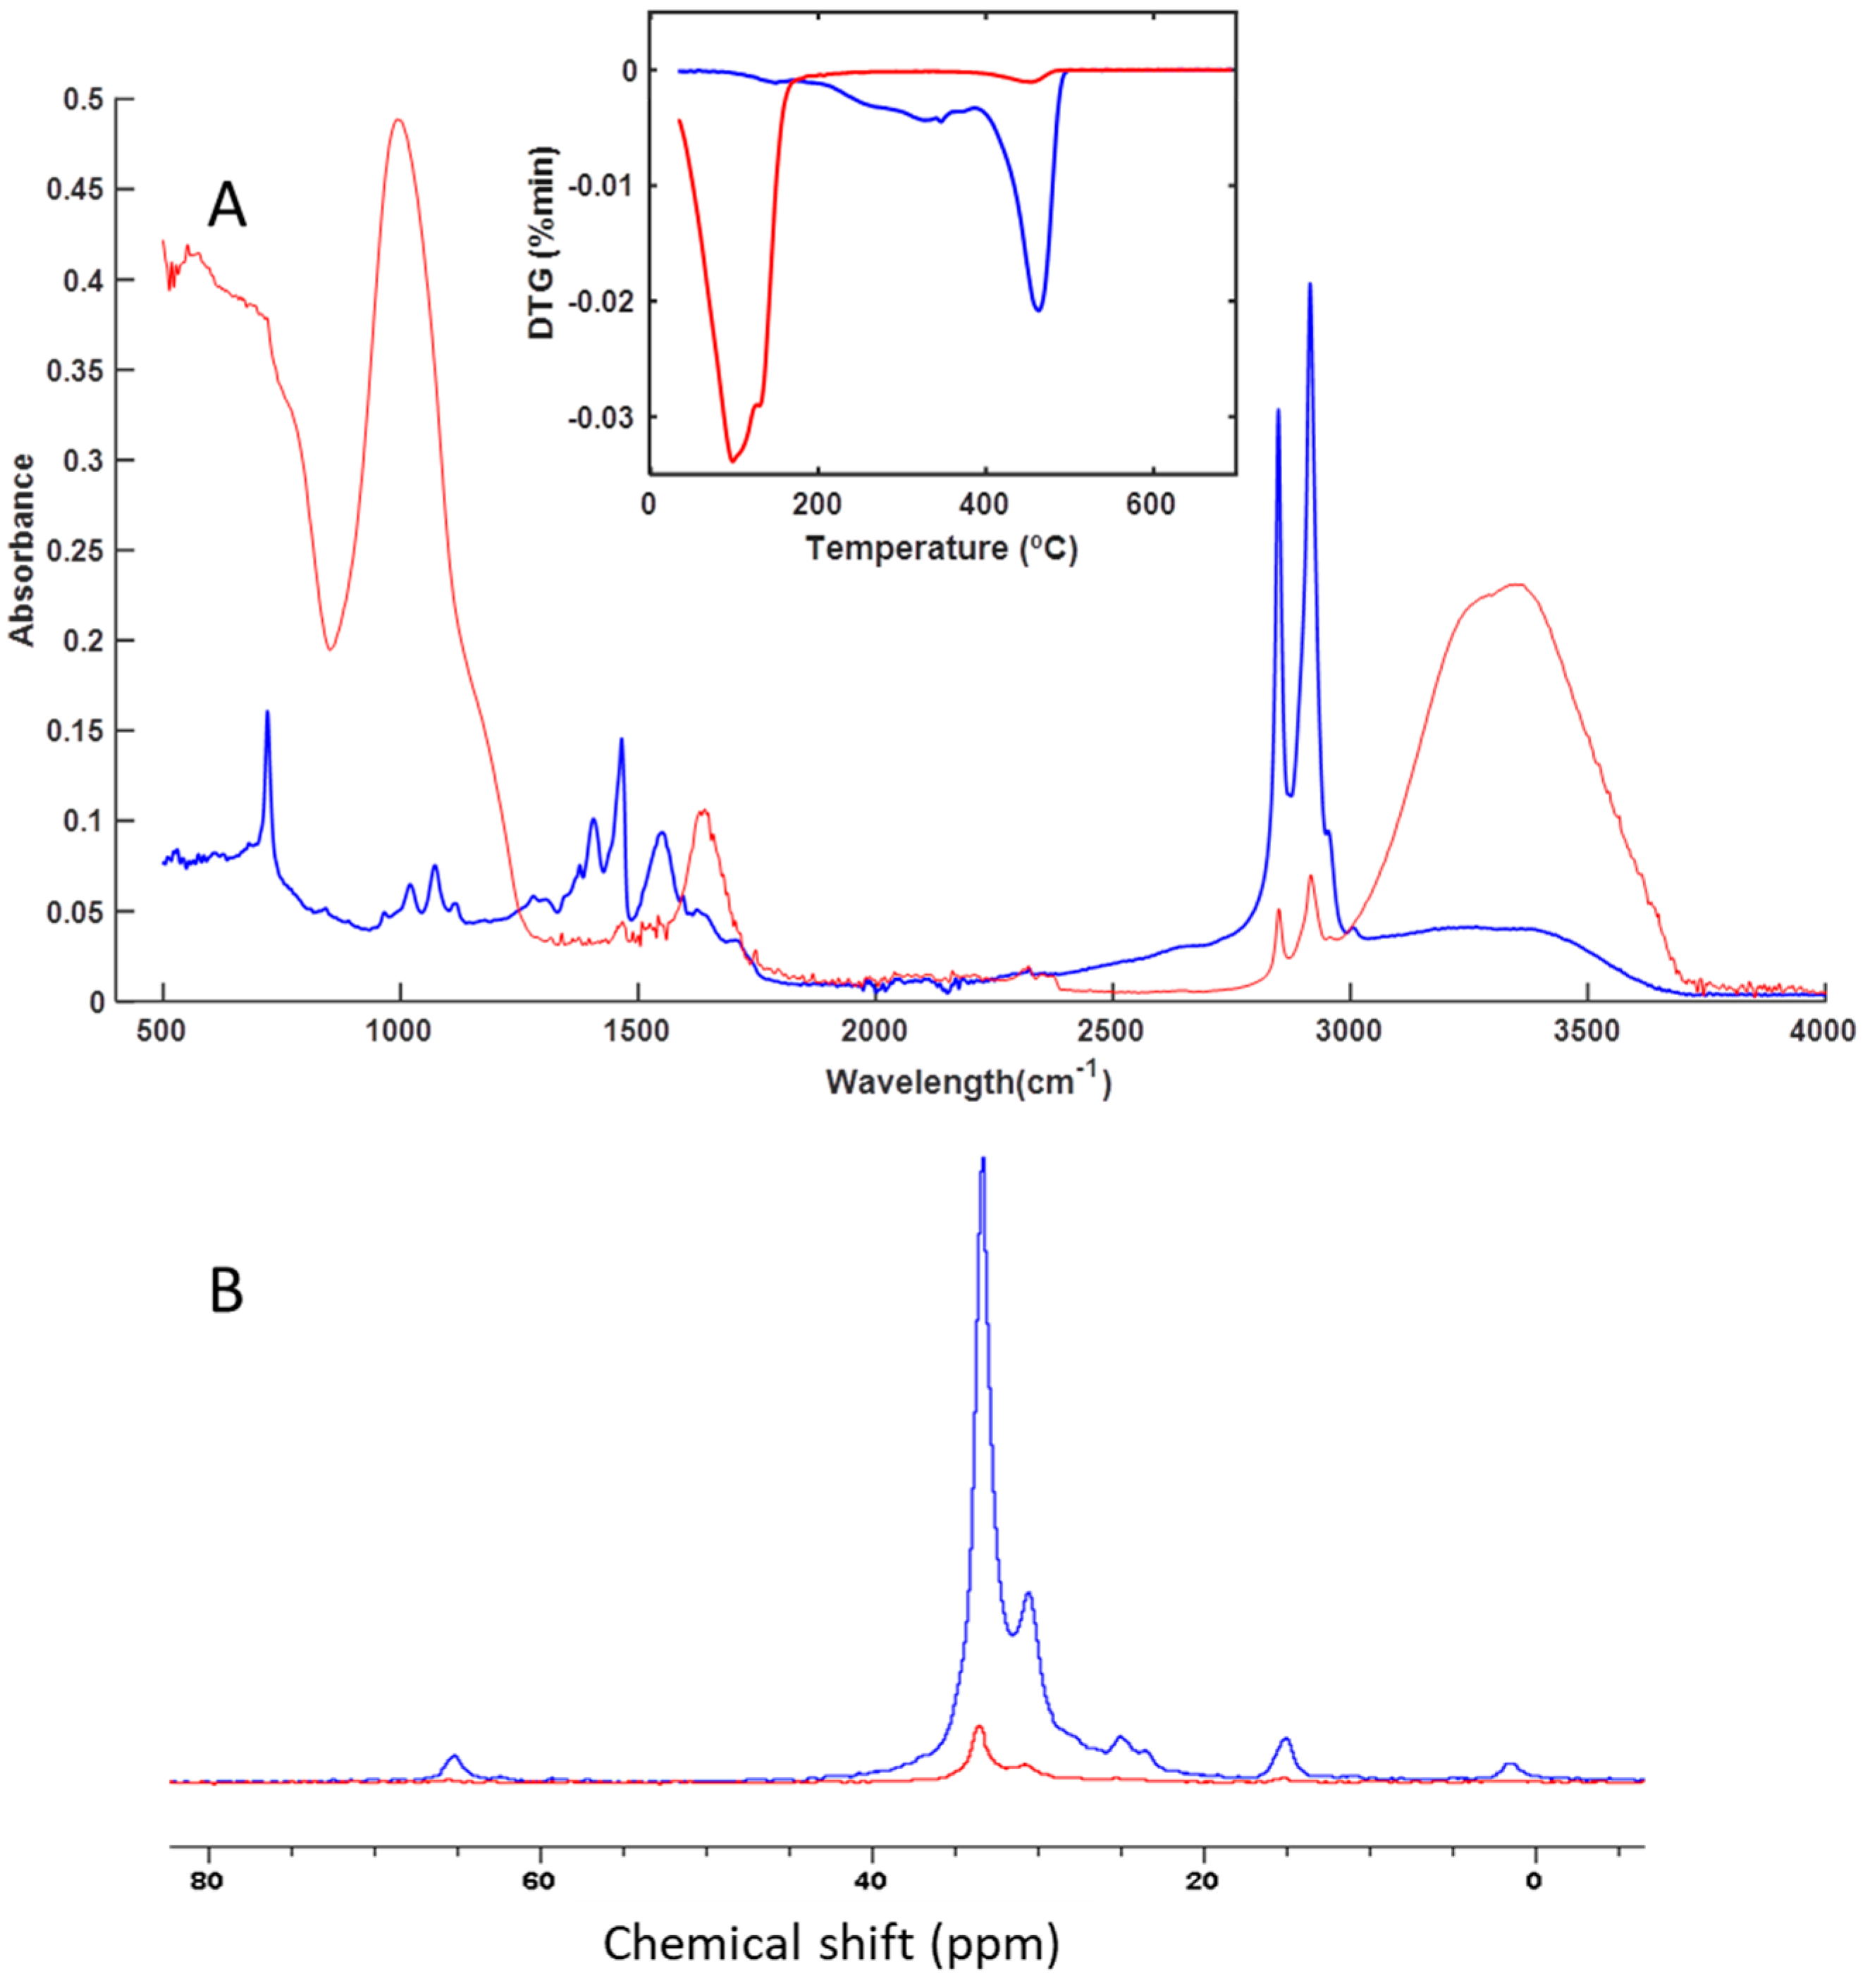

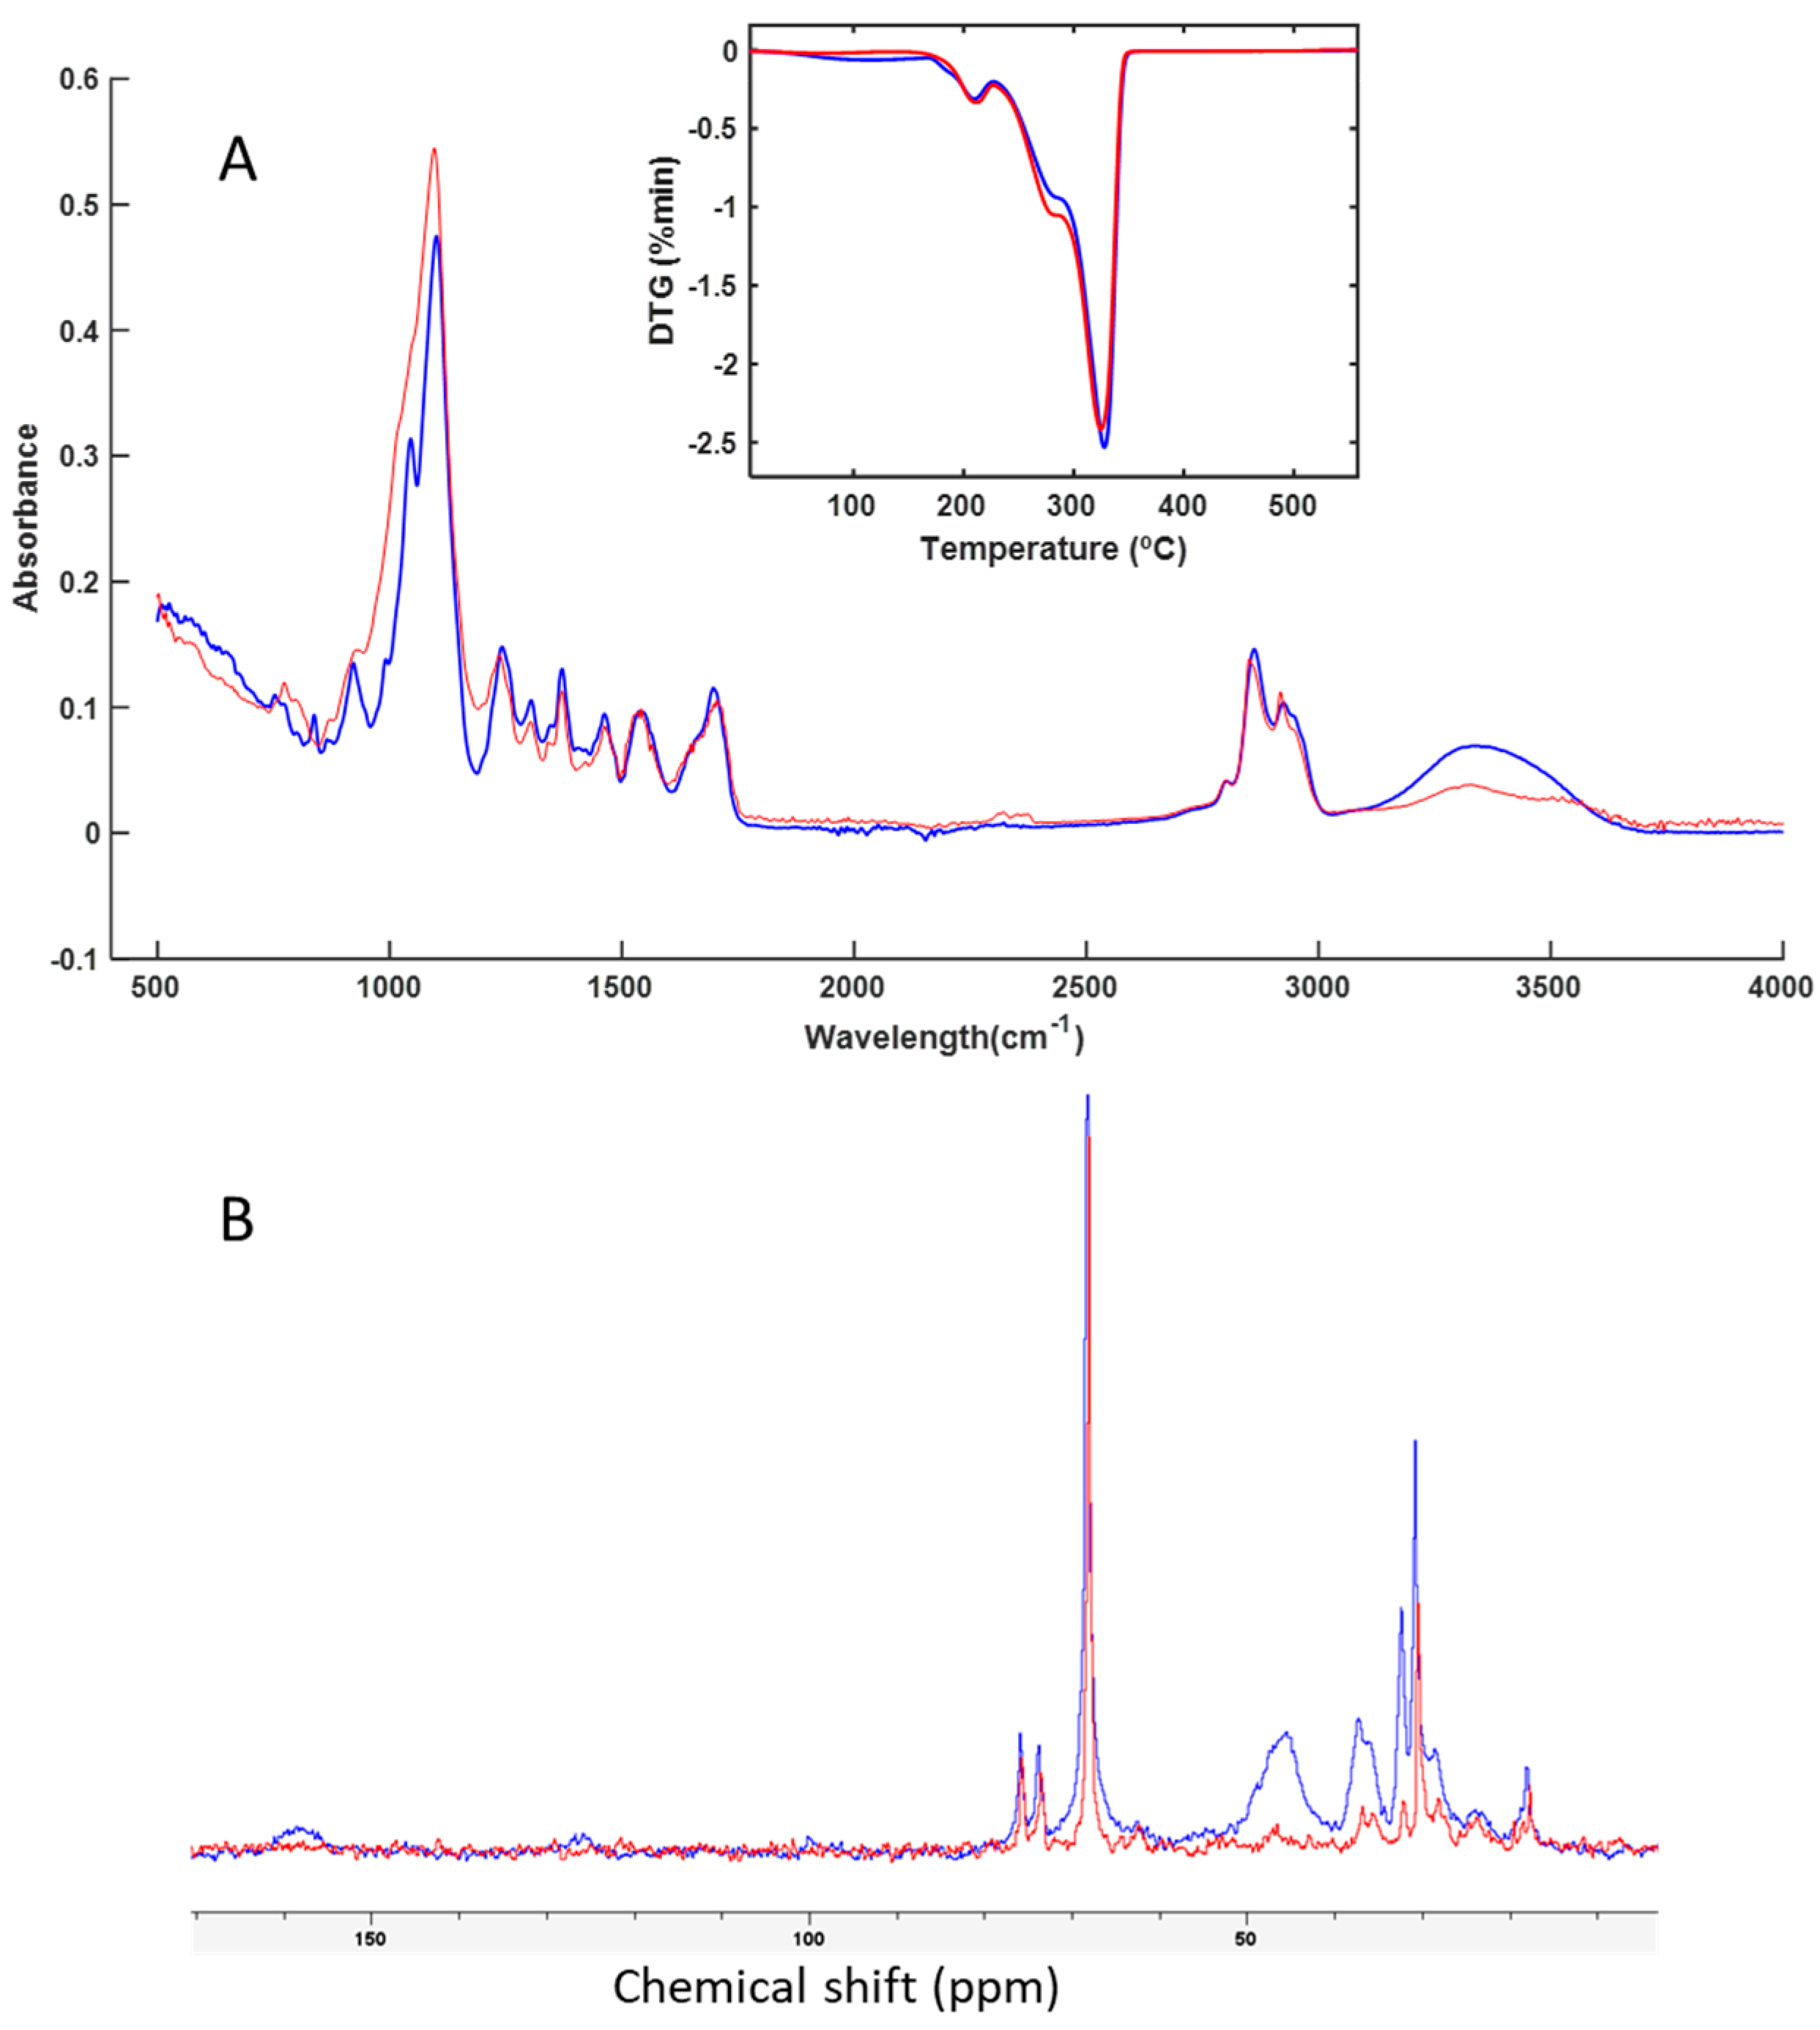
| Groups | Sample | Code | Leather |
|---|---|---|---|
| Polymers and resins | Isocyanate | IS | Crust leather + IS |
| Acrylic | EA | Crust leather + EA | |
| Nitrocellulose lacquer | NL | Crust leather + NL | |
| Bio-based materials | Acrylic BIO | AB | Crust leather + AB |
| Polyurethane top BIO | PTB | Crust leather + PTB + PFB* | |
| Polyurethane primer BIO | PFB | Crust leather + PTB + PFB* | |
| Binders and adhesives | Casein | CAS | Crust leather + CAS |
| Protein binder | EB | Crust leather + EB | |
| Finishing and treatment agents | Wax | EX | Crust leather + EX |
| Black pigment | BP | Crust leather + BP | |
| Control | Collagen | C+ | Collagen |
| Crust | CRT | Crust leather |
| Sample | Code | Carbon (%) | CO2 (g) | Nitrogen (%) | C/N |
|---|---|---|---|---|---|
| Polymers and resins | |||||
| Isocyanate | IS | 60.42 | 20.49 | 15.85 | 3.81 |
| Acrylic | EA | 59.08 | 20.58 | 0.83 | 71.35 |
| Nitrocellulose lacquer | NL | 44.09 | 20.21 | 6.83 | 6.45 |
| Bio-based materials | |||||
| Acrylic BIO | AB | 57.59 | 20.59 | 0.72 | 79.92 |
| Polyurethane top BIO | PTB | 61.63 | 20.34 | 5.10 | 12.10 |
| Polyurethane primer BIO | PFB | 98.35 | 20.74 | 0.23 | 433.4 |
| Bindersand adhesives | |||||
| Casein | CAS | 51.21 | 20.65 | 12.24 | 4.19 |
| Protein binder | EB | 47.19 | 20.76 | 13.45 | 3.51 |
| Finishing and treatment agents | |||||
| Wax | EX | 79.96 | 20.52 | 1.46 | 54.87 |
| Black pigment | BP | 71.28 | 20.91 | 3.85 | 18.49 |
| Control | |||||
| Collagen | C+ | 45.39 | 20.21 | 16.93 | 2.68 |
| Crust | CRT | 47.93 | -- | 10.49 | 4.57 |
| Sample | Code | Cr | Ni | Cu | Zn | As | Se | Mo | Cd | Pb | Hg | ||
|---|---|---|---|---|---|---|---|---|---|---|---|---|---|
| Batch A | EA | <1 | <1 | <5 | <1 | <1 | <1 | <1 | <1 | 1.2 | <0.15 | ||
| EX | <1 | <1 | <5 | <1 | <1 | <1 | <1 | <1 | 1.2 | <0.15 | |||
| EB | <1 | <1 | <5 | <1 | <1 | <1 | <1 | <1 | 1.2 | <0.15 | |||
| Batch B | PTB | <1 | <1 | <5 | <1 | <1 | <1 | <1 | <1 | <1 | <0.15 | ||
| PFB | <1 | <1 | <5 | <1 | <1 | <1 | <1 | <1 | <1 | <0.15 | |||
| Batch C | CAS | <1 | <1 | 5.6 | <1 | <1 | <1 | <1 | <1 | 1.0 | <0.15 | ||
| BP | <1 | <1 | 5.6 | <1 | <1 | <1 | <1 | <1 | 1.0 | <0.15 | |||
| AB | <1 | <1 | 5.6 | 1328.6 | <1 | <1 | <1 | <1 | 1.0 | <0.15 | |||
| Batch D | IS | <1 | <1 | <5 | <1 | <1 | <1 | <1 | <1 | <1 | <0.15 | ||
| NL | <1 | <1 | <5 | <1 | <1 | <1 | <1 | <1 | <1 | <0.15 | |||
| Control | C+ | <1 | <1 | <5 | <1 | <1 | <1 | <1 | <1 | <1 | <0.15 | ||
| CRT | <1 | <1 | <5 | <1 | <1 | <1 | <1 | <1 | <1 | <0.15 | |||
| Sample | Finishing product ThCO2 (g) | Biodegradability % |
Leather + finishing product ThCO2 (g) |
Biodegradability % |
|---|---|---|---|---|
| Isocyanate (IS) | 20.49 | 13.83 | 18.33 | 57.30 |
| Acrylic (EA) | 20.58 | 0.00 | 19.19 | 84.20 |
| Nitrocellulose lacquer (NL) | 20.21 | 5.73 | 18.84 | 52.91 |
| Acrylic BIO (AB) | 20.59 | 3.04 | 18.30 | 58.38 |
| Polyurethane top BIO (PTB) | 20.34 | 38.25 | 19.16* | 79.37* |
| Polyurethane primer BIO (PFB) | 20.74 | 0.00 | 19.16* | 79.37* |
| Casein (CAS) | 20.65 | 87.23 | 18.17 | 62.14 |
| Protein binder (EB) | 20.76 | 5.48 | 19.37 | 82.53 |
| Wax (EX) | 20.52 | 60.1 | 19.42 | 85.09 |
| Black pigment (BP) | 20.91 | 26.27 | 19.59 | 88.12 |
| Collagen (C+) | 20.21 | 93.30 | 19.97 | 97.67 |
| Sample | RGePa (%) | Biomass Rb | RGrPa (%) | Germination Indexa (GI) |
|---|---|---|---|---|
| Isocyanate (IS) | 100.0 | 134.8 | 105.5 | 105.5 |
| Acrylic (EA) | 95.0 | 116.9 | 123.1 | 116.9 |
| Nitrocellulose lacquer (NL) | 102.6 | 88.3 | 100.9 | 103.5 |
| Acrylic BIO (AB) | 101.3 | 80.9 | 95.4 | 96.6 |
| Polyurethane top BIO (PTB)* | 63.9 | 90.0 | 84.9 | 54.2 |
| Polyurethane primer BIO (PFB)* | 63.9 | 90.0 | 84.9 | 54.2 |
| Casein (CAS) | 97.4 | 155.7 | 78.0 | 75.9 |
| Protein binder (EB) | 81.0 | 115.5 | 83.5 | 67.6 |
| Wax (EX) | 102.6 | 112.7 | 114.4 | 117.3 |
| Black pigment (BP) | 102.6 | 151.5 | 125.9 | 129.1 |
| Collagen (C+) | 101.3 | 110.6 | 99.8 | 99.9 |
| F-ANOVA | 231 | 650 | 267 | 673 |
Disclaimer/Publisher’s Note: The statements, opinions and data contained in all publications are solely those of the individual author(s) and contributor(s) and not of MDPI and/or the editor(s). MDPI and/or the editor(s) disclaim responsibility for any injury to people or property resulting from any ideas, methods, instructions or products referred to in the content. |
© 2024 by the authors. Licensee MDPI, Basel, Switzerland. This article is an open access article distributed under the terms and conditions of the Creative Commons Attribution (CC BY) license (http://creativecommons.org/licenses/by/4.0/).


