Introduction
Since horses were domesticated more than 6,000 years ago in BC, the relationship between humans and horses has expanded far beyond food supply to include transportation, farming, warfare, entertainment, and companionship [
1,
2]. Today, in the modernized world, most horses are used for sports such as racing and competition or are bred as partners for human equestrians [
3]. Throughout their long history, humans have trained and bred horses that are obedient to people, do not run away, and accept living with us rather than their natural companions [
3,
4,
5,
6]. At the same time, humans have developed various training tools and techniques [
3,
4,
5,
6,
7]. However, many accidents have occurred in the course of interacting with horses, making horseback riding the life-threatening sport [
8,
9]. On the other hand, many horses have also lost their lives due to injuries or illnesses sustained during races, competitions, or their training [
3]. Horse training is a skill that humans have cultivated over the years, and methods has been accumulated by lots of experiences. While many horses are under stress during training, it is also true that adding a certain amount of stress can improve their athletic performance in races and competitions [
10]. However, especially for racehorses that begin their careers in a physically and mentally immature young state, it is extremely important to apply an appropriate training program according to the horse's physical conditions and personality [
10]. Overtraining is also known to lead to physical and mental abnormalities in horses [
11]. While the measurement results of blood lactate and cortisol provide important information [
10,
12,
13], but the methods are complicated and time-consuming; a system that integrates analysis of the horse's movement during training and heart rate data using IT technology would provide valuable data for evaluating the training load of horses.
Equtum® is an information processing system consisting of an inertial sensor attached to limbs of a horse, a tablet device that acquires sensor measurements, and a server that analyzes the horse's running condition based on the measurements obtained from the tablet terminal. A smartphone with GPS function mounted on the saddle cloth detects the horse's position and calculates the horse's speed at predetermined intervals based on the amount of change in this position information. The inertial sensor attached to limbs of a horse includes an angular velocity sensor, and the number of complete strides of the horse is calculated by the number of times in a unit time that the measured value of this angular sensor changes from negative to positive. The horse's pitch is also calculated from the number of complete strides in a given period of time. The horse's stride is calculated from the position information at the first time point when the readings of an angle sensor change from negative to positive and at the next point when the readings change from negative to positive. The horse's speed is also calculated from the change in position information at each time point.
Based on the waveform obtained from the angular velocity sensor attached to the forelimbs, the system determines which of the horse's forelimbs is the lead leg. The change in the horse's gait patterns (walk, trot, canter, or gallop) is determined by the phase shift of the waveforms originated from the left and right forelimbs.
The impact of the horse's grounding is calculated based on the maximum vertical value extracted by the sensors attached to each limb. According to this value and positional information, the percentage of time the horse's legs are swinging in the air (Swing time ratio, STR) is measured.
In addition to positional information, distance moved, speed, and acceleration, Equtum® measures the rate of ground impact and STR regarding the racehorse in training and visualizes the information on a dedicated tablet terminal. Along with this information, the heart rate of the trained horse is obtained. From a distance, the trainer is able to know the running condition of the trained horse and the intensity of the training, as well as to monitor cardiopulmonary functions. This allows the trainer to not only provide suitable training for the horse, but also to identify signs of injury or disease the horse at an early stage. It also helps to evaluate the degree of recovery of the horse and the appropriateness of training when the horse is subjected to rehabilitation after a rest period due to injury or illnesses.
2. Materials and Methods
2.1. Equtum® trial
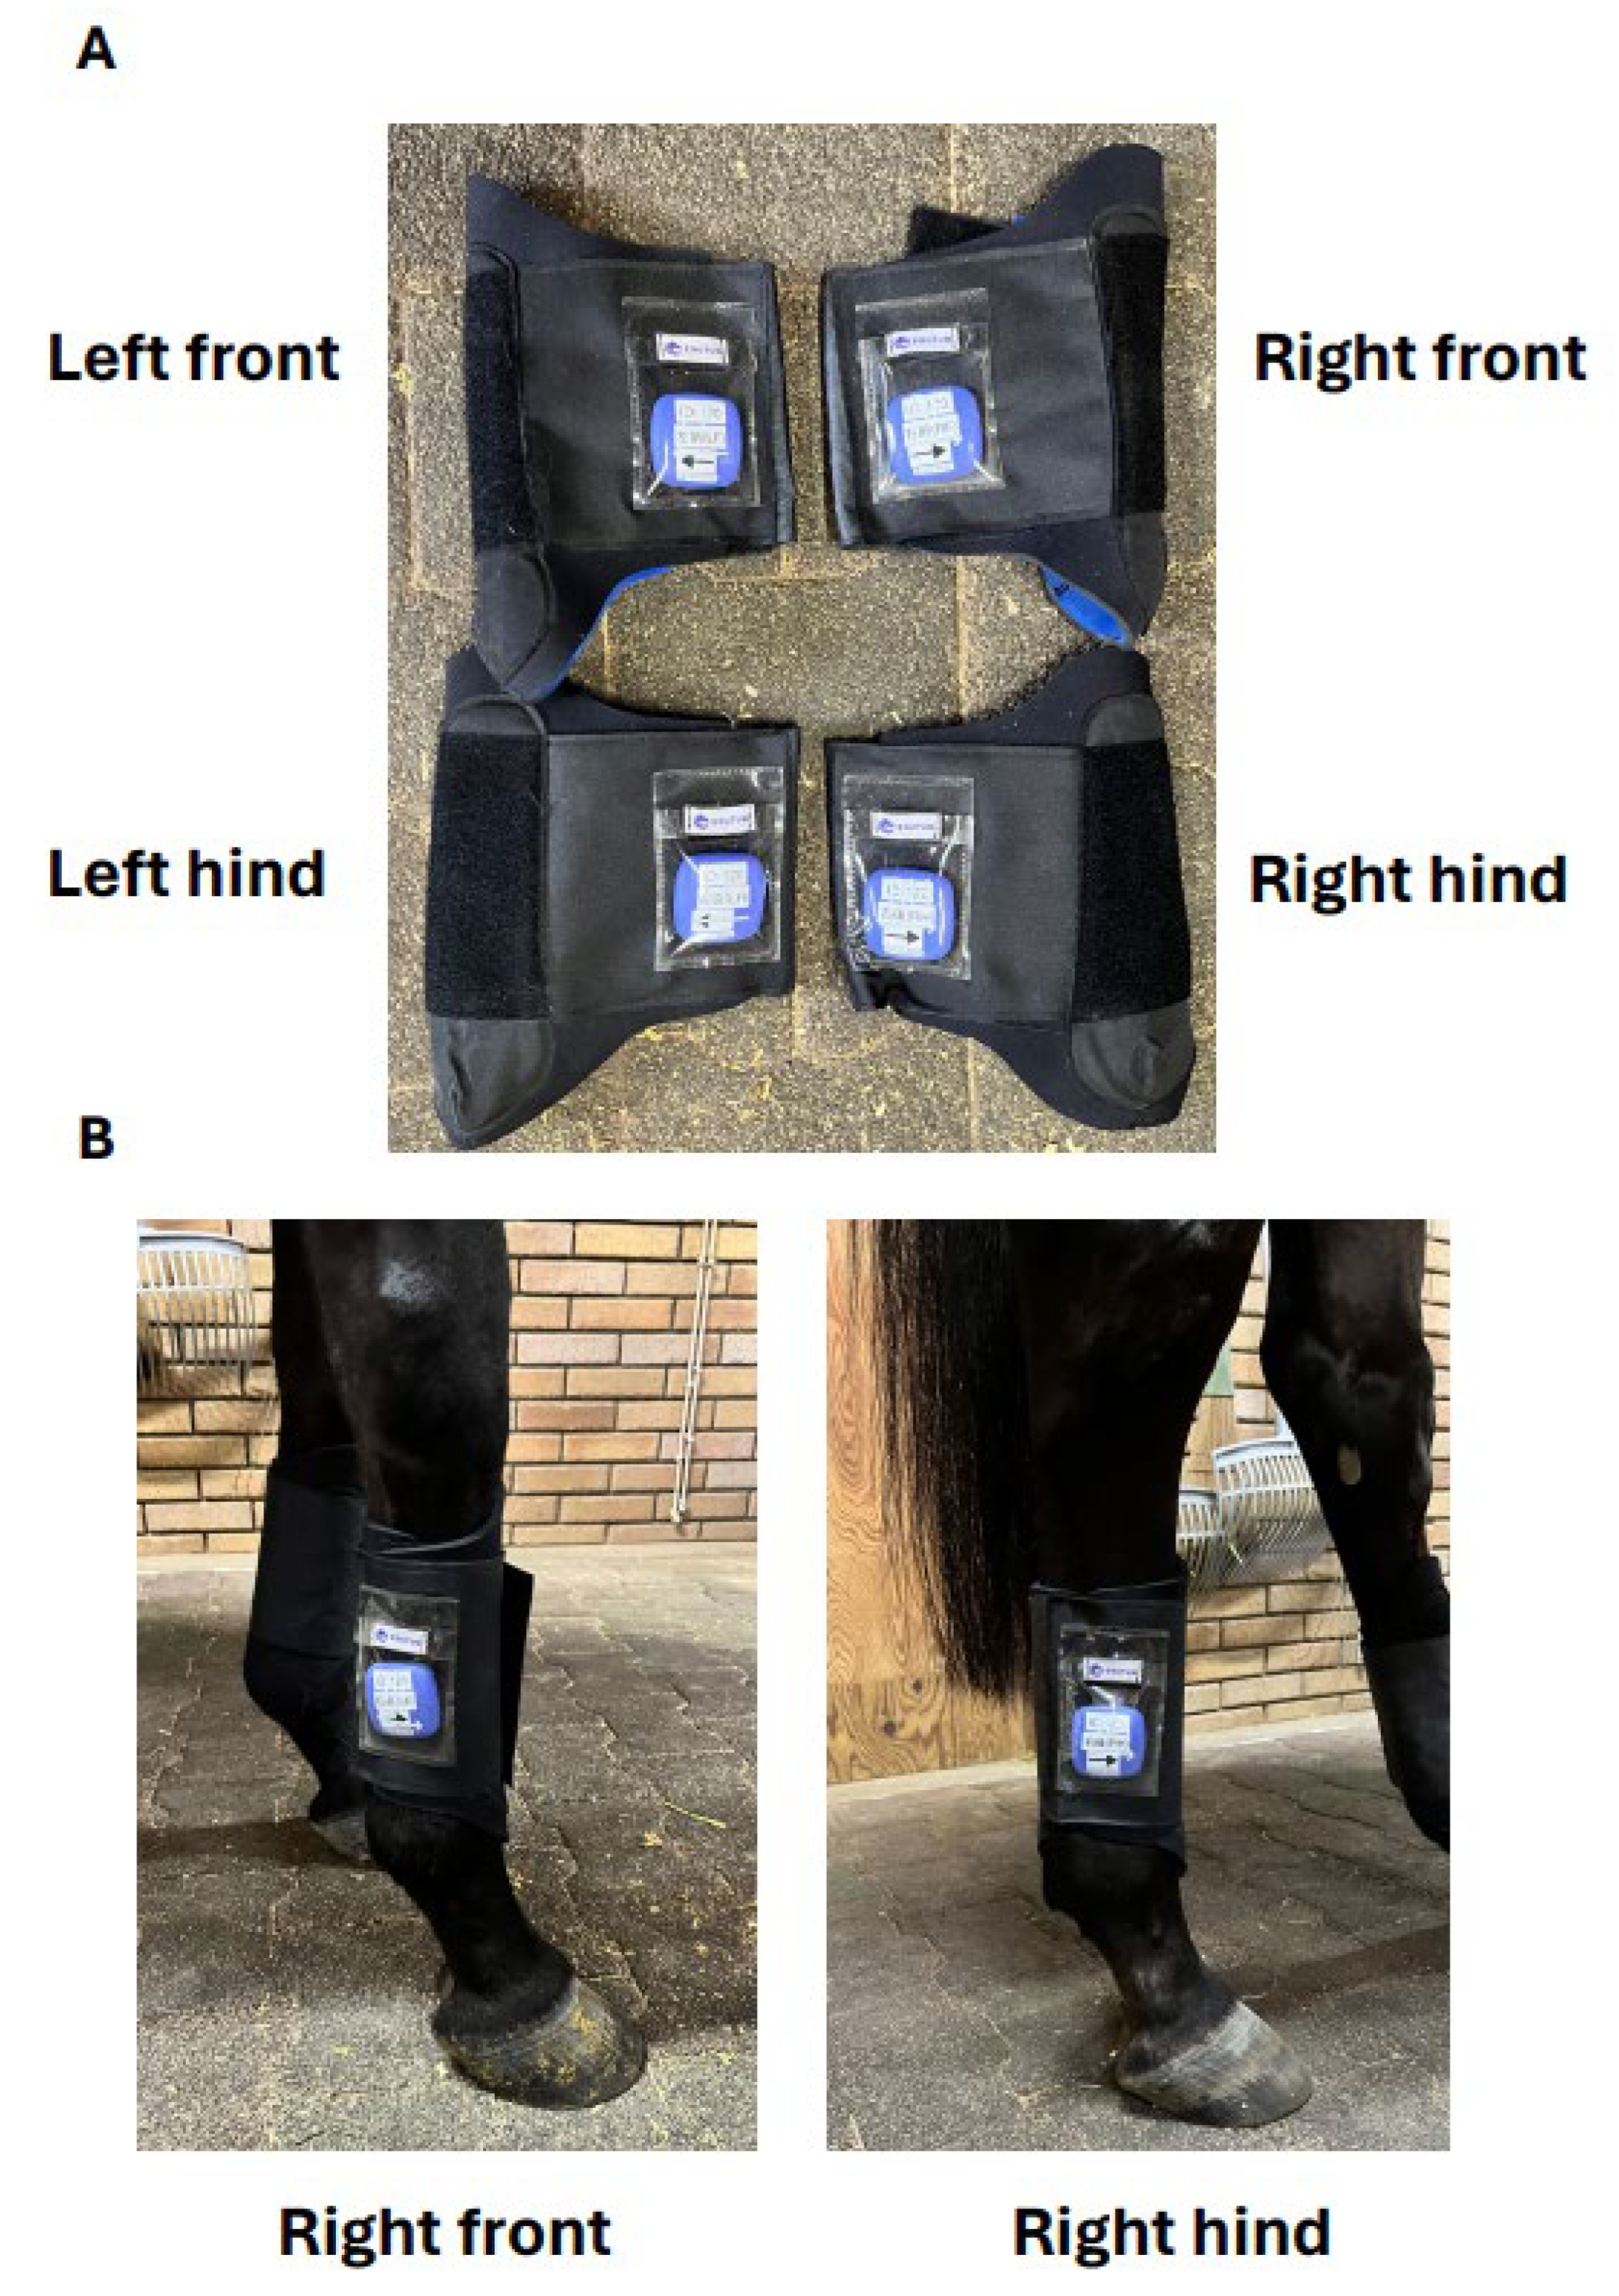
Equtum® was developed in collaboration with technical experts in ABEL Inc. and a team of veterinarians from Tokyo University of Agriculture and Technology. Before starting to use the system, a lithium-ion battery is set in the sensor box, and the dedicated Equtum® app downloaded to a smartphone with GPS function is started to confirm that the communication status with each sensor is normal. Each sensor is placed in the pocket of a dedicated leg protector and attached to the horse's limbs. The dedicated leg protectors can be attached and detached with Velcro tapes. When attaching, it is necessary to check the forelimb and hindlimb, the top and bottom of the sensor box, or the right and left sides, to ensure that they are correctly attached (
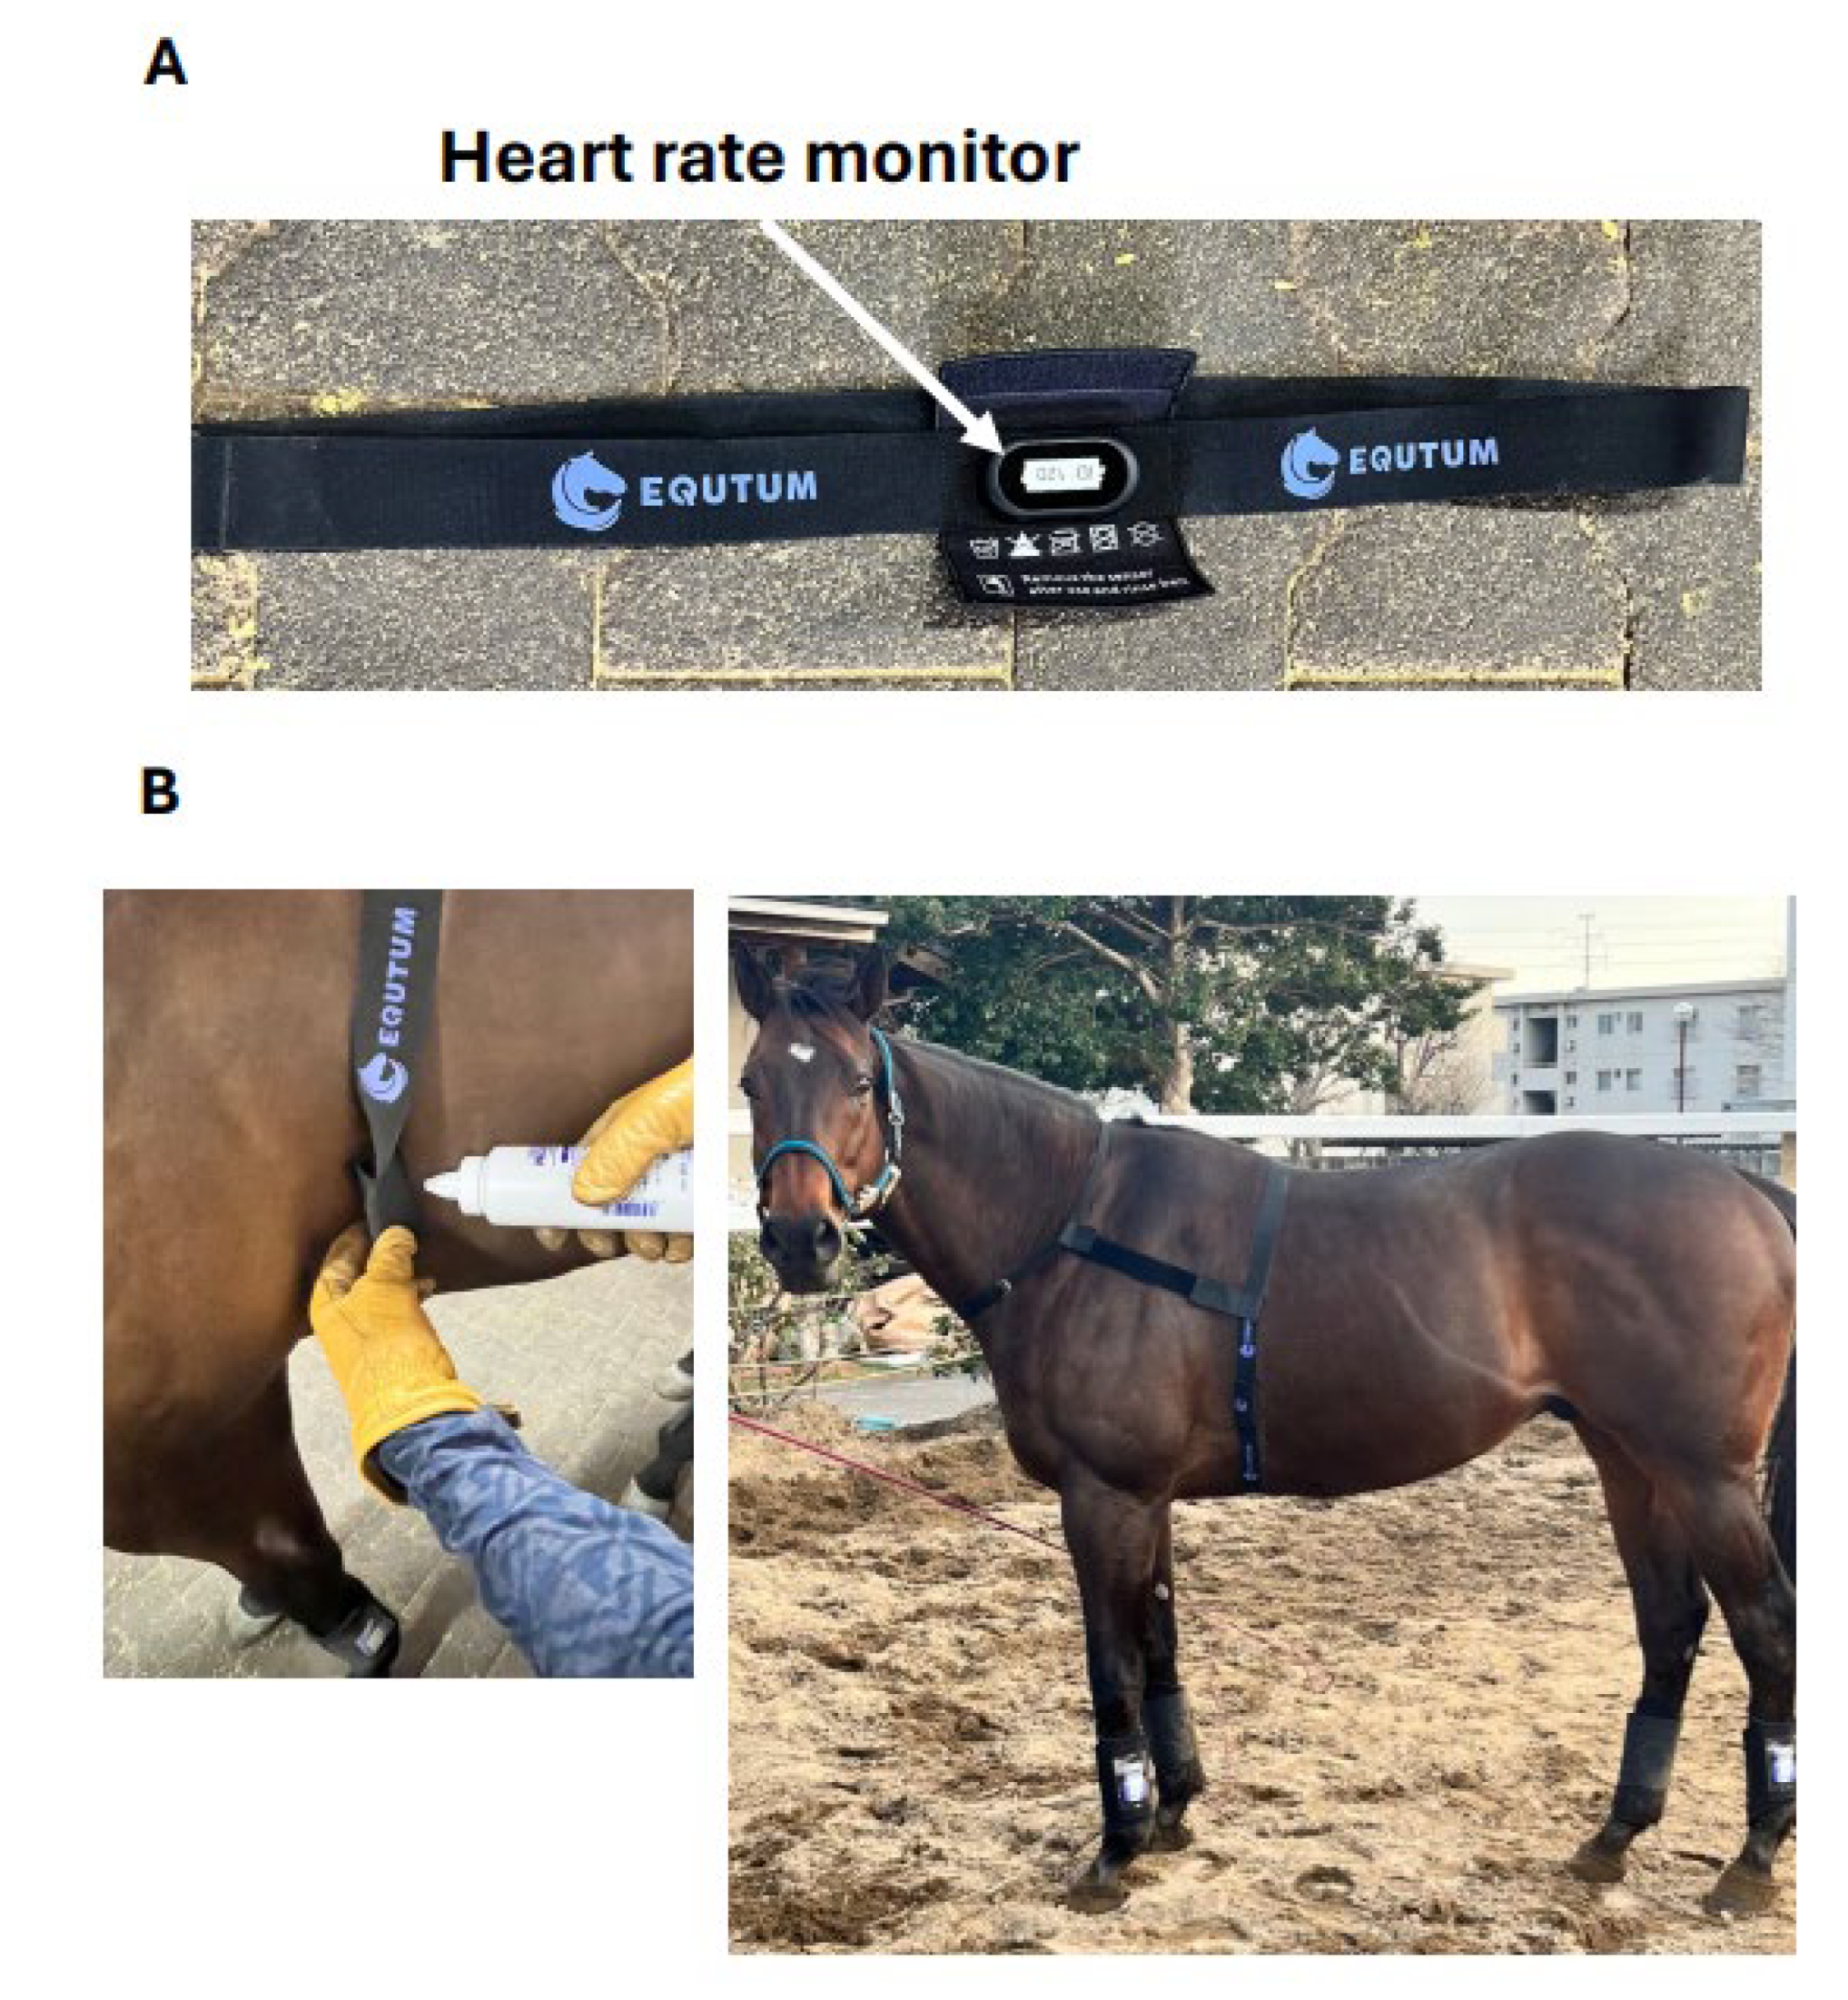
Figure 1A and B). The heart rate monitor (Polar Equine trotters, Polar, Japan) is attached to the front of the abdominal belt (
Figure 2A). The elastic, soft, optimized belt has a button to attach the heart rate sensor and a plastic buckle for easy attachment and removal. At this time, ultrasound gel is applied to maintain contact between the monitor portion of the belt and the horse (
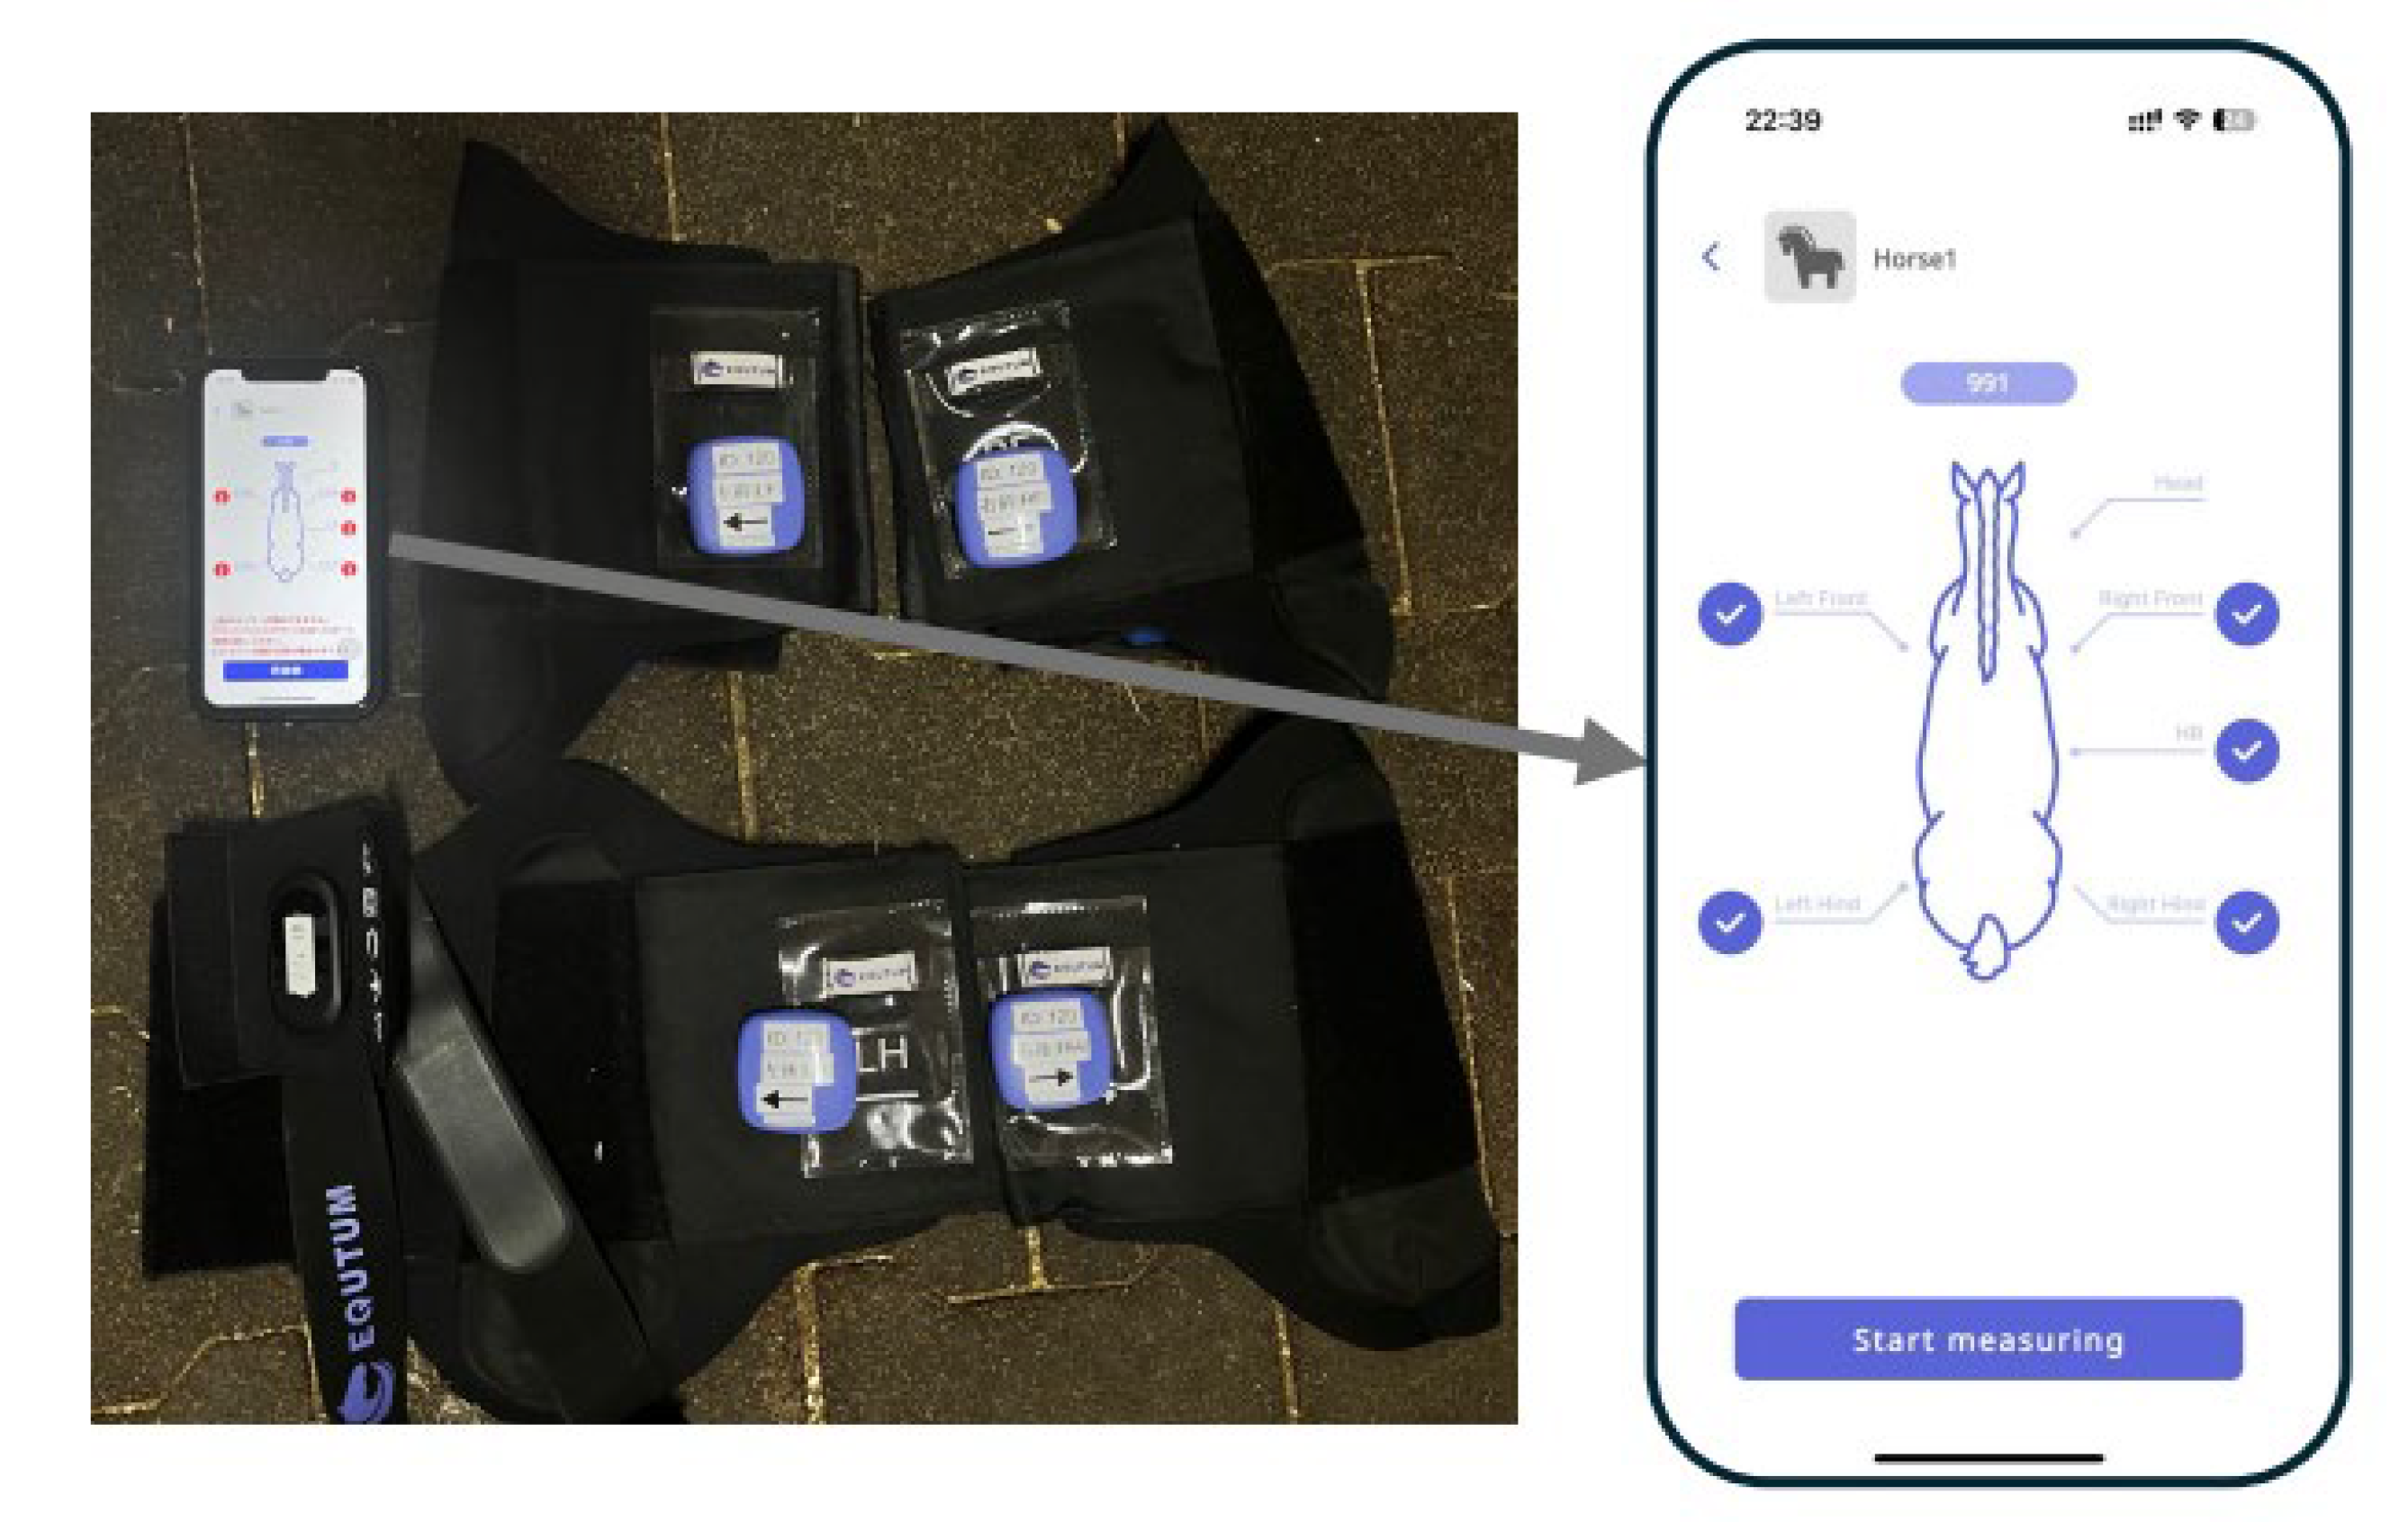
Figure 2B). When the dedicated Equtun® app on the smartphone that receives information from the sensors is launched, communication with the sensors begins immediately, and when each sensor is recognized, the "Start measuring" indicator is ready to be tapped (
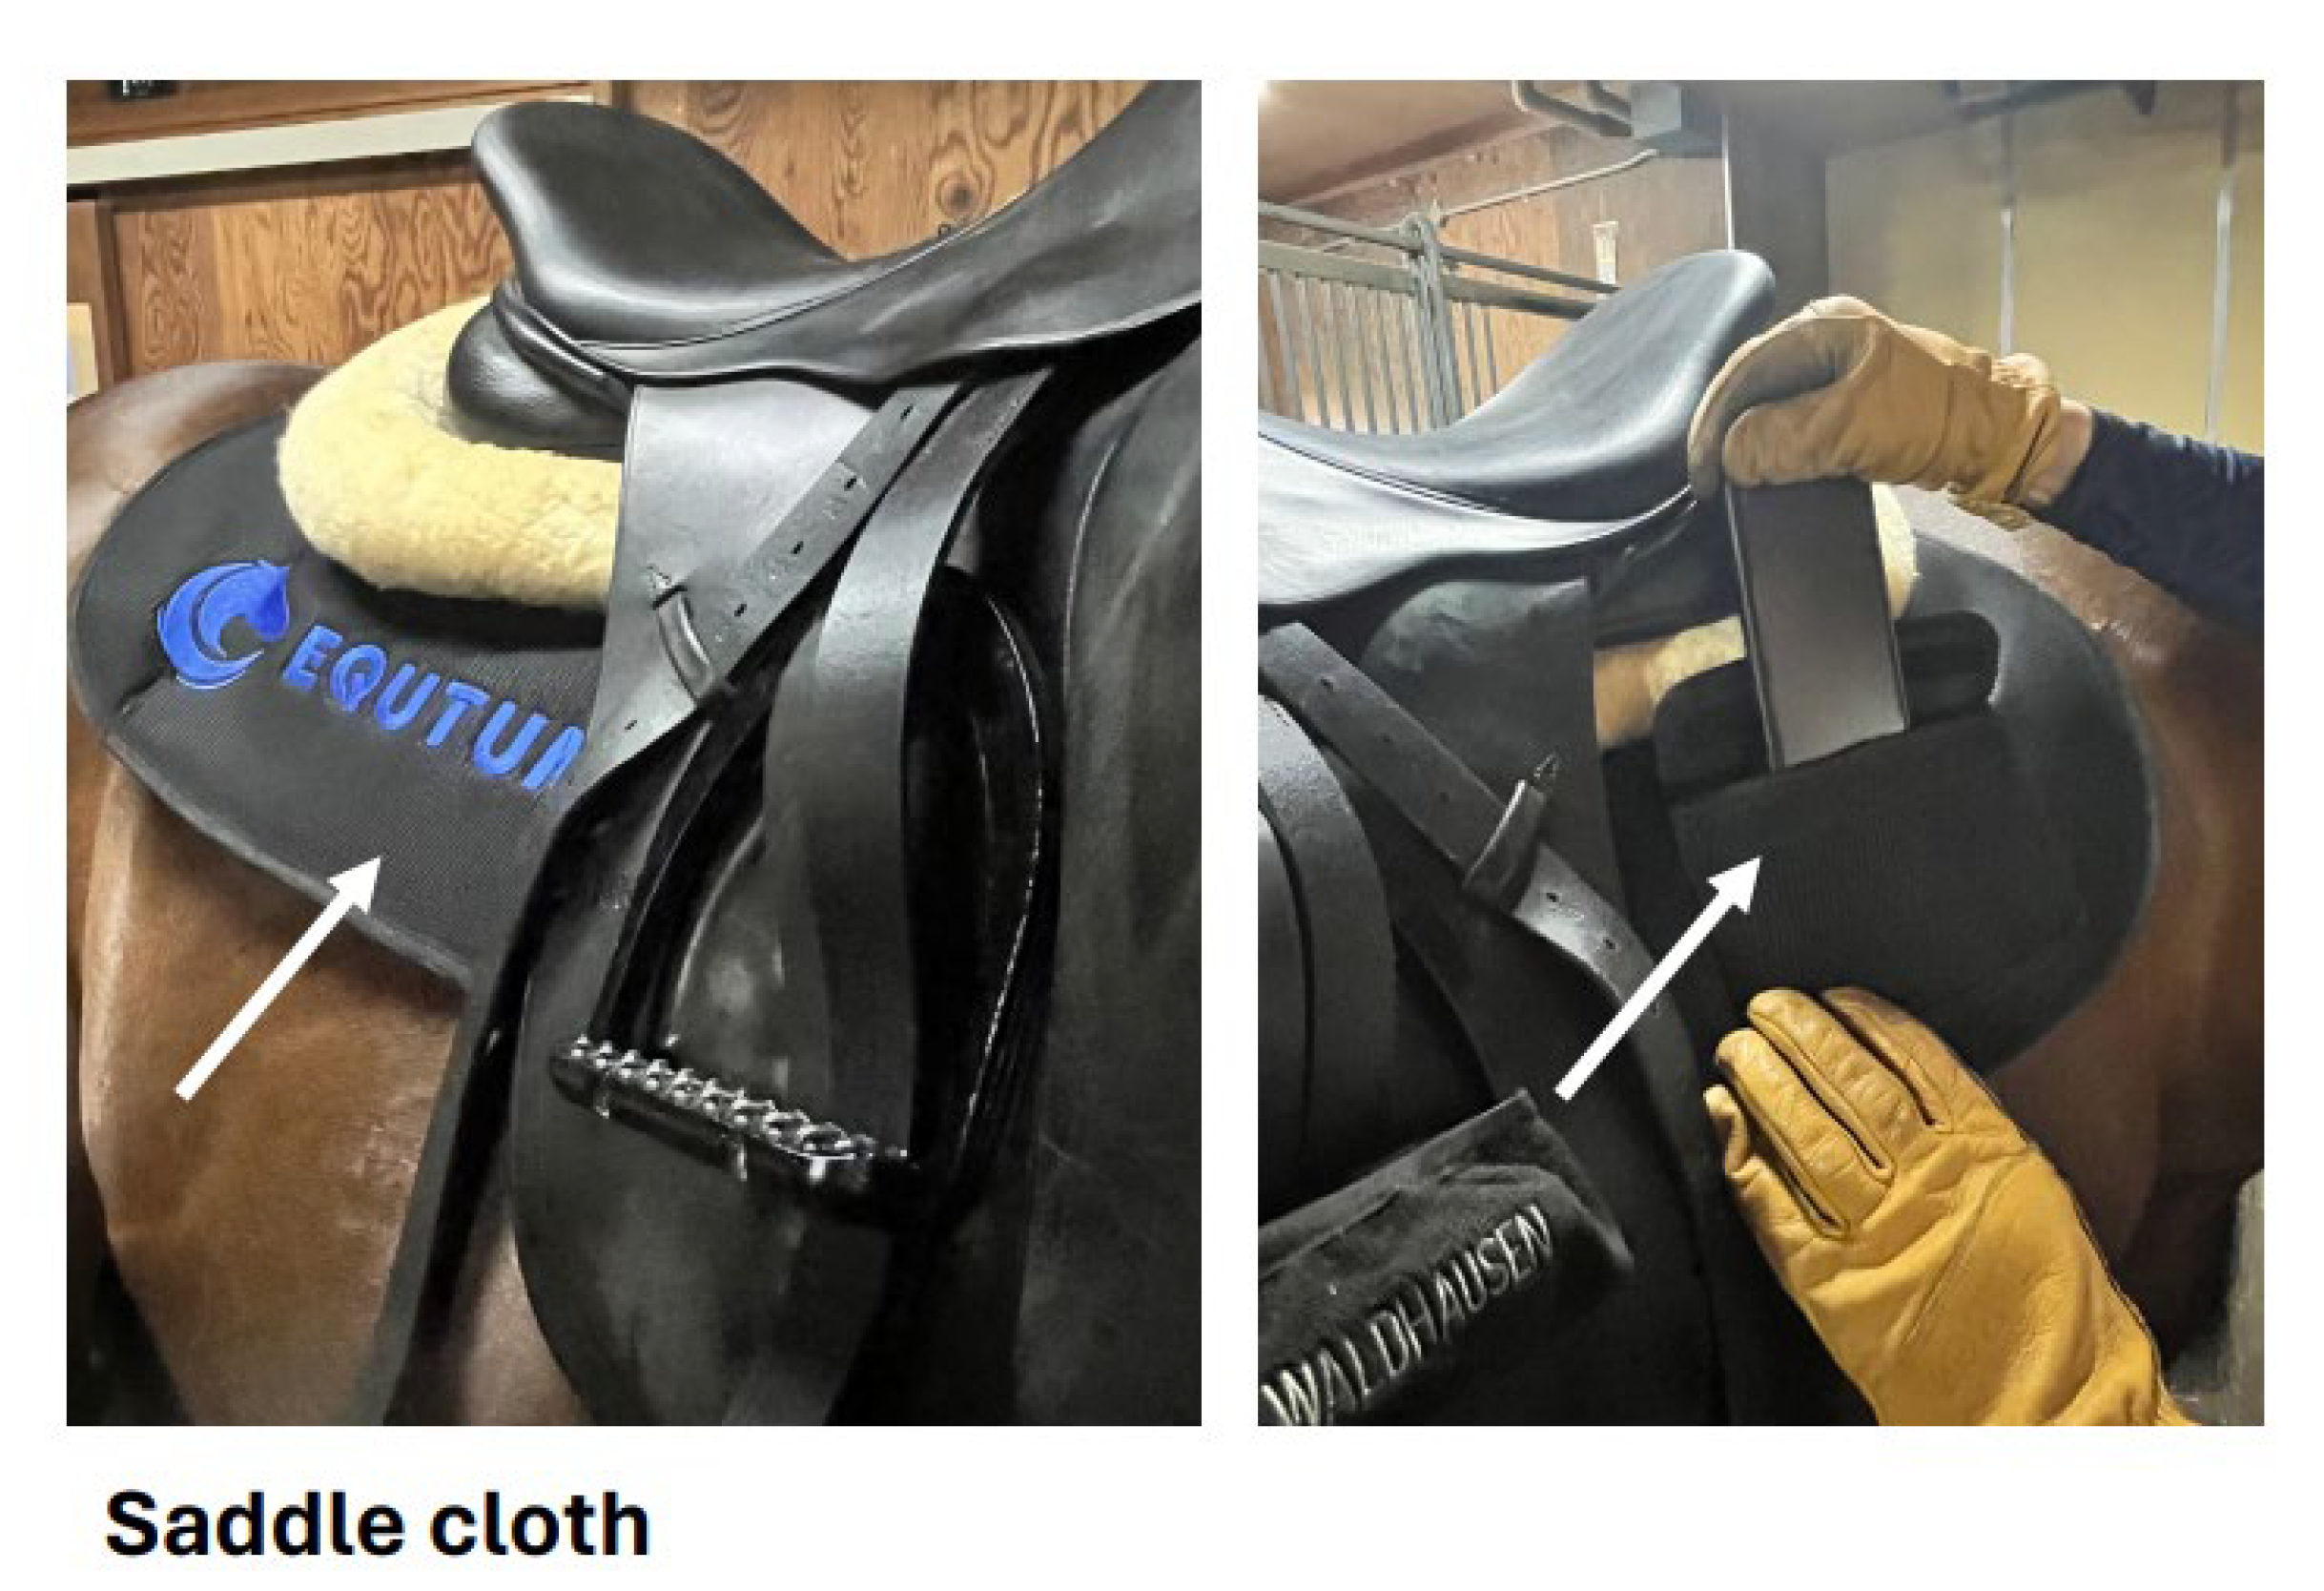
Figure 3). After communication with each sensor is established, the smartphone is placed in the pocket of the special saddle cloth and the horse is subjected to the training (
Figure 4). When a horse equipped with the sensors trains on the training course, data such as stride, pitch, impact when the leg touches the ground, ratio of legs swinging in space (Swing time ratio, STR) [
14], heart rate, etc., based on the distance traveled, speed, leg angles such as left/right or front/rear, and acceleration, as well as position information, are transferred to a server in the specialized cloud. All data is stored on a server in the cloud. The senior trainer checks these data in real time or after training using a dedicated terminal device.
2.2. Test training and data collection.
Horses used for test training were Thoroughbreds (2 geldings and 2 mares, ages 4-12 years) being retrained as retired racehorses and competition horses (2 geldings, KWPN 22 years and Westphalia 22 years). The horses are kept in good health by veterinarians, who ensure that they are free of injury, disease, pain, and lameness. After attaching sensors and tablet terminals to the horses, the test training consisted of walk, trot, canter, and gallop for an arbitrary length of time was performed to check communication and data acquisition status. The data acquired from the sensors and the wearable tablet were analyzed by a dedicated terminal tablet device. These test trainings were conducted in accordance with the guidelines for animal experiments at Tokyo University of Agriculture and Technology and were approved by the university's animal experiment committee (approval numbers R03-53, R04-86, R05-101, and R06-25).
3. Result
3.1. Waveforms of four different gait patterns of horses
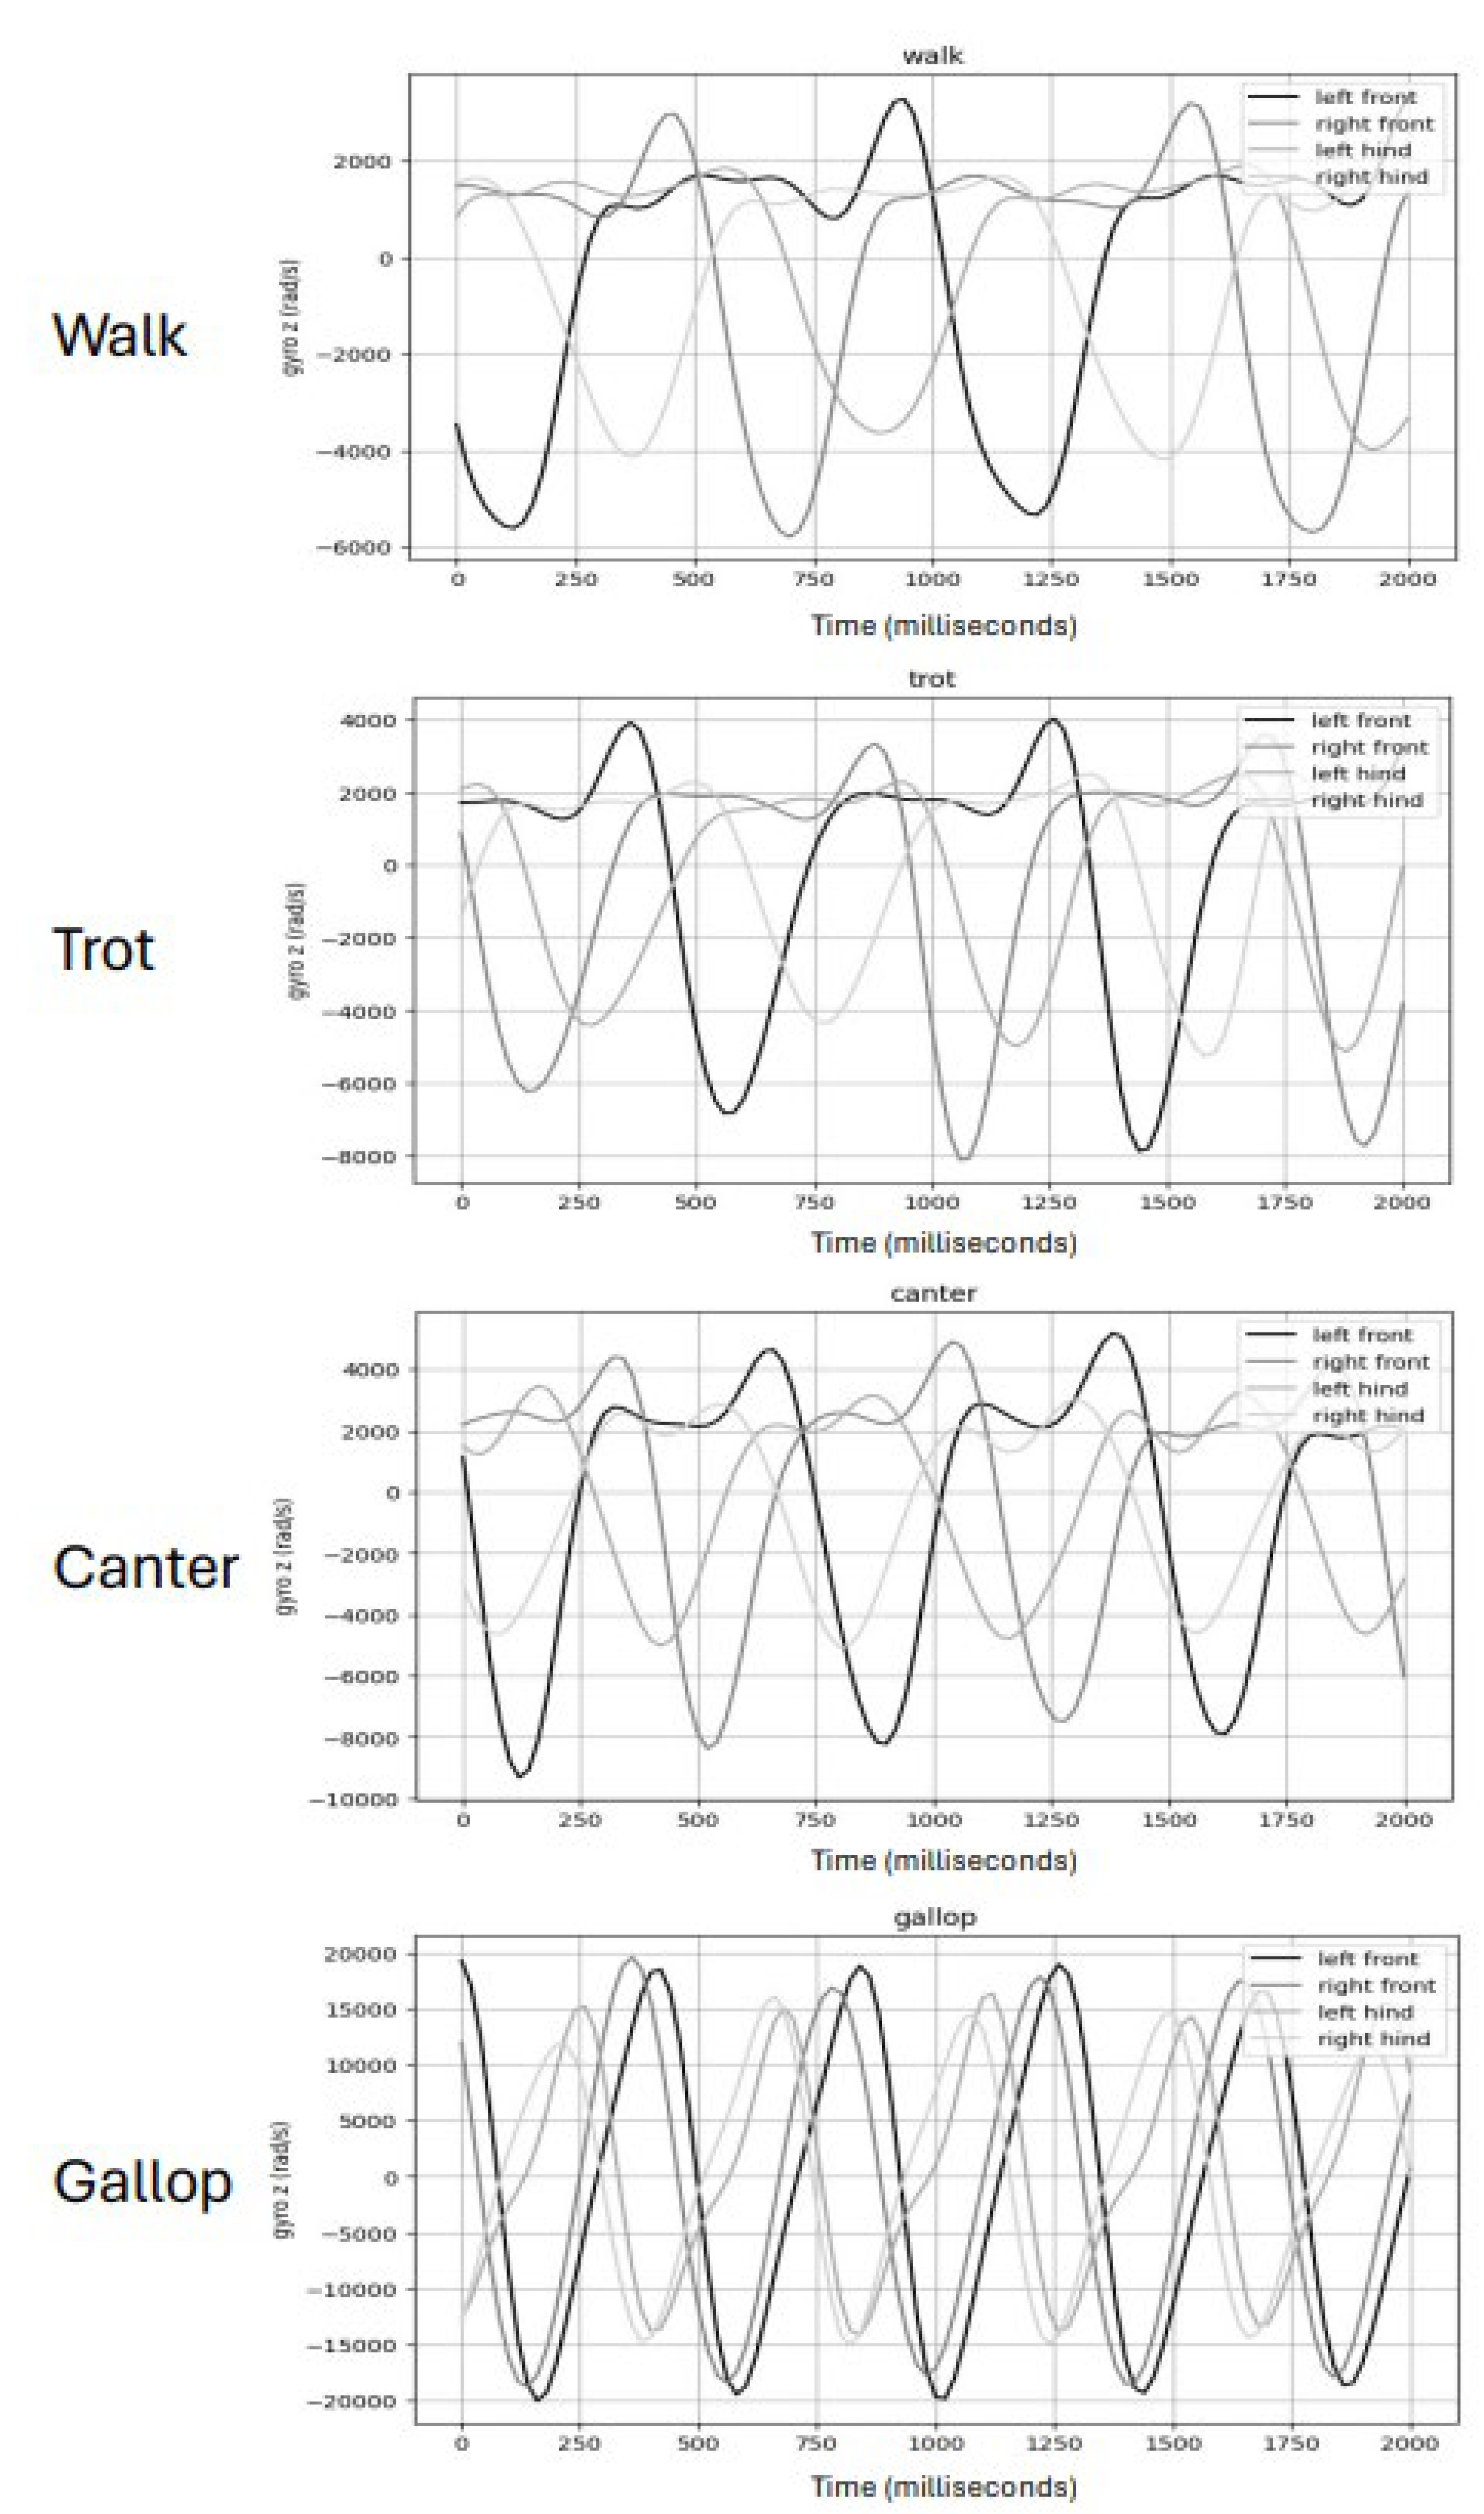
Attaching the sensors on the horse was easy. The horse did not seem to be particularly concerned about the sensor, that was able to perform training exercises while wearing it without any hindrance to its mobility. The communication with the tablet terminal was good, and various data could be acquired without any problems. The differences in waveforms depending on the horse's gait acquired by the sensor are shown in
Figure 5. In walk, the left and right forelimbs alternately repeat a waveform with a large amplitude, while those of the hindlimb is smaller than forelimbs. In trot, the waveforms with larger amplitudes are repeated for a shorter period of time than in walking. In canter, peak waveforms are observed not only in the forelimbs but also in the hindlimbs, and the repetition rate of the waveforms increases. In gallop, the waveform with a large amplitude is repeated, clearly different from the previous three gait patterns.
3.2. Data acquisition during test training
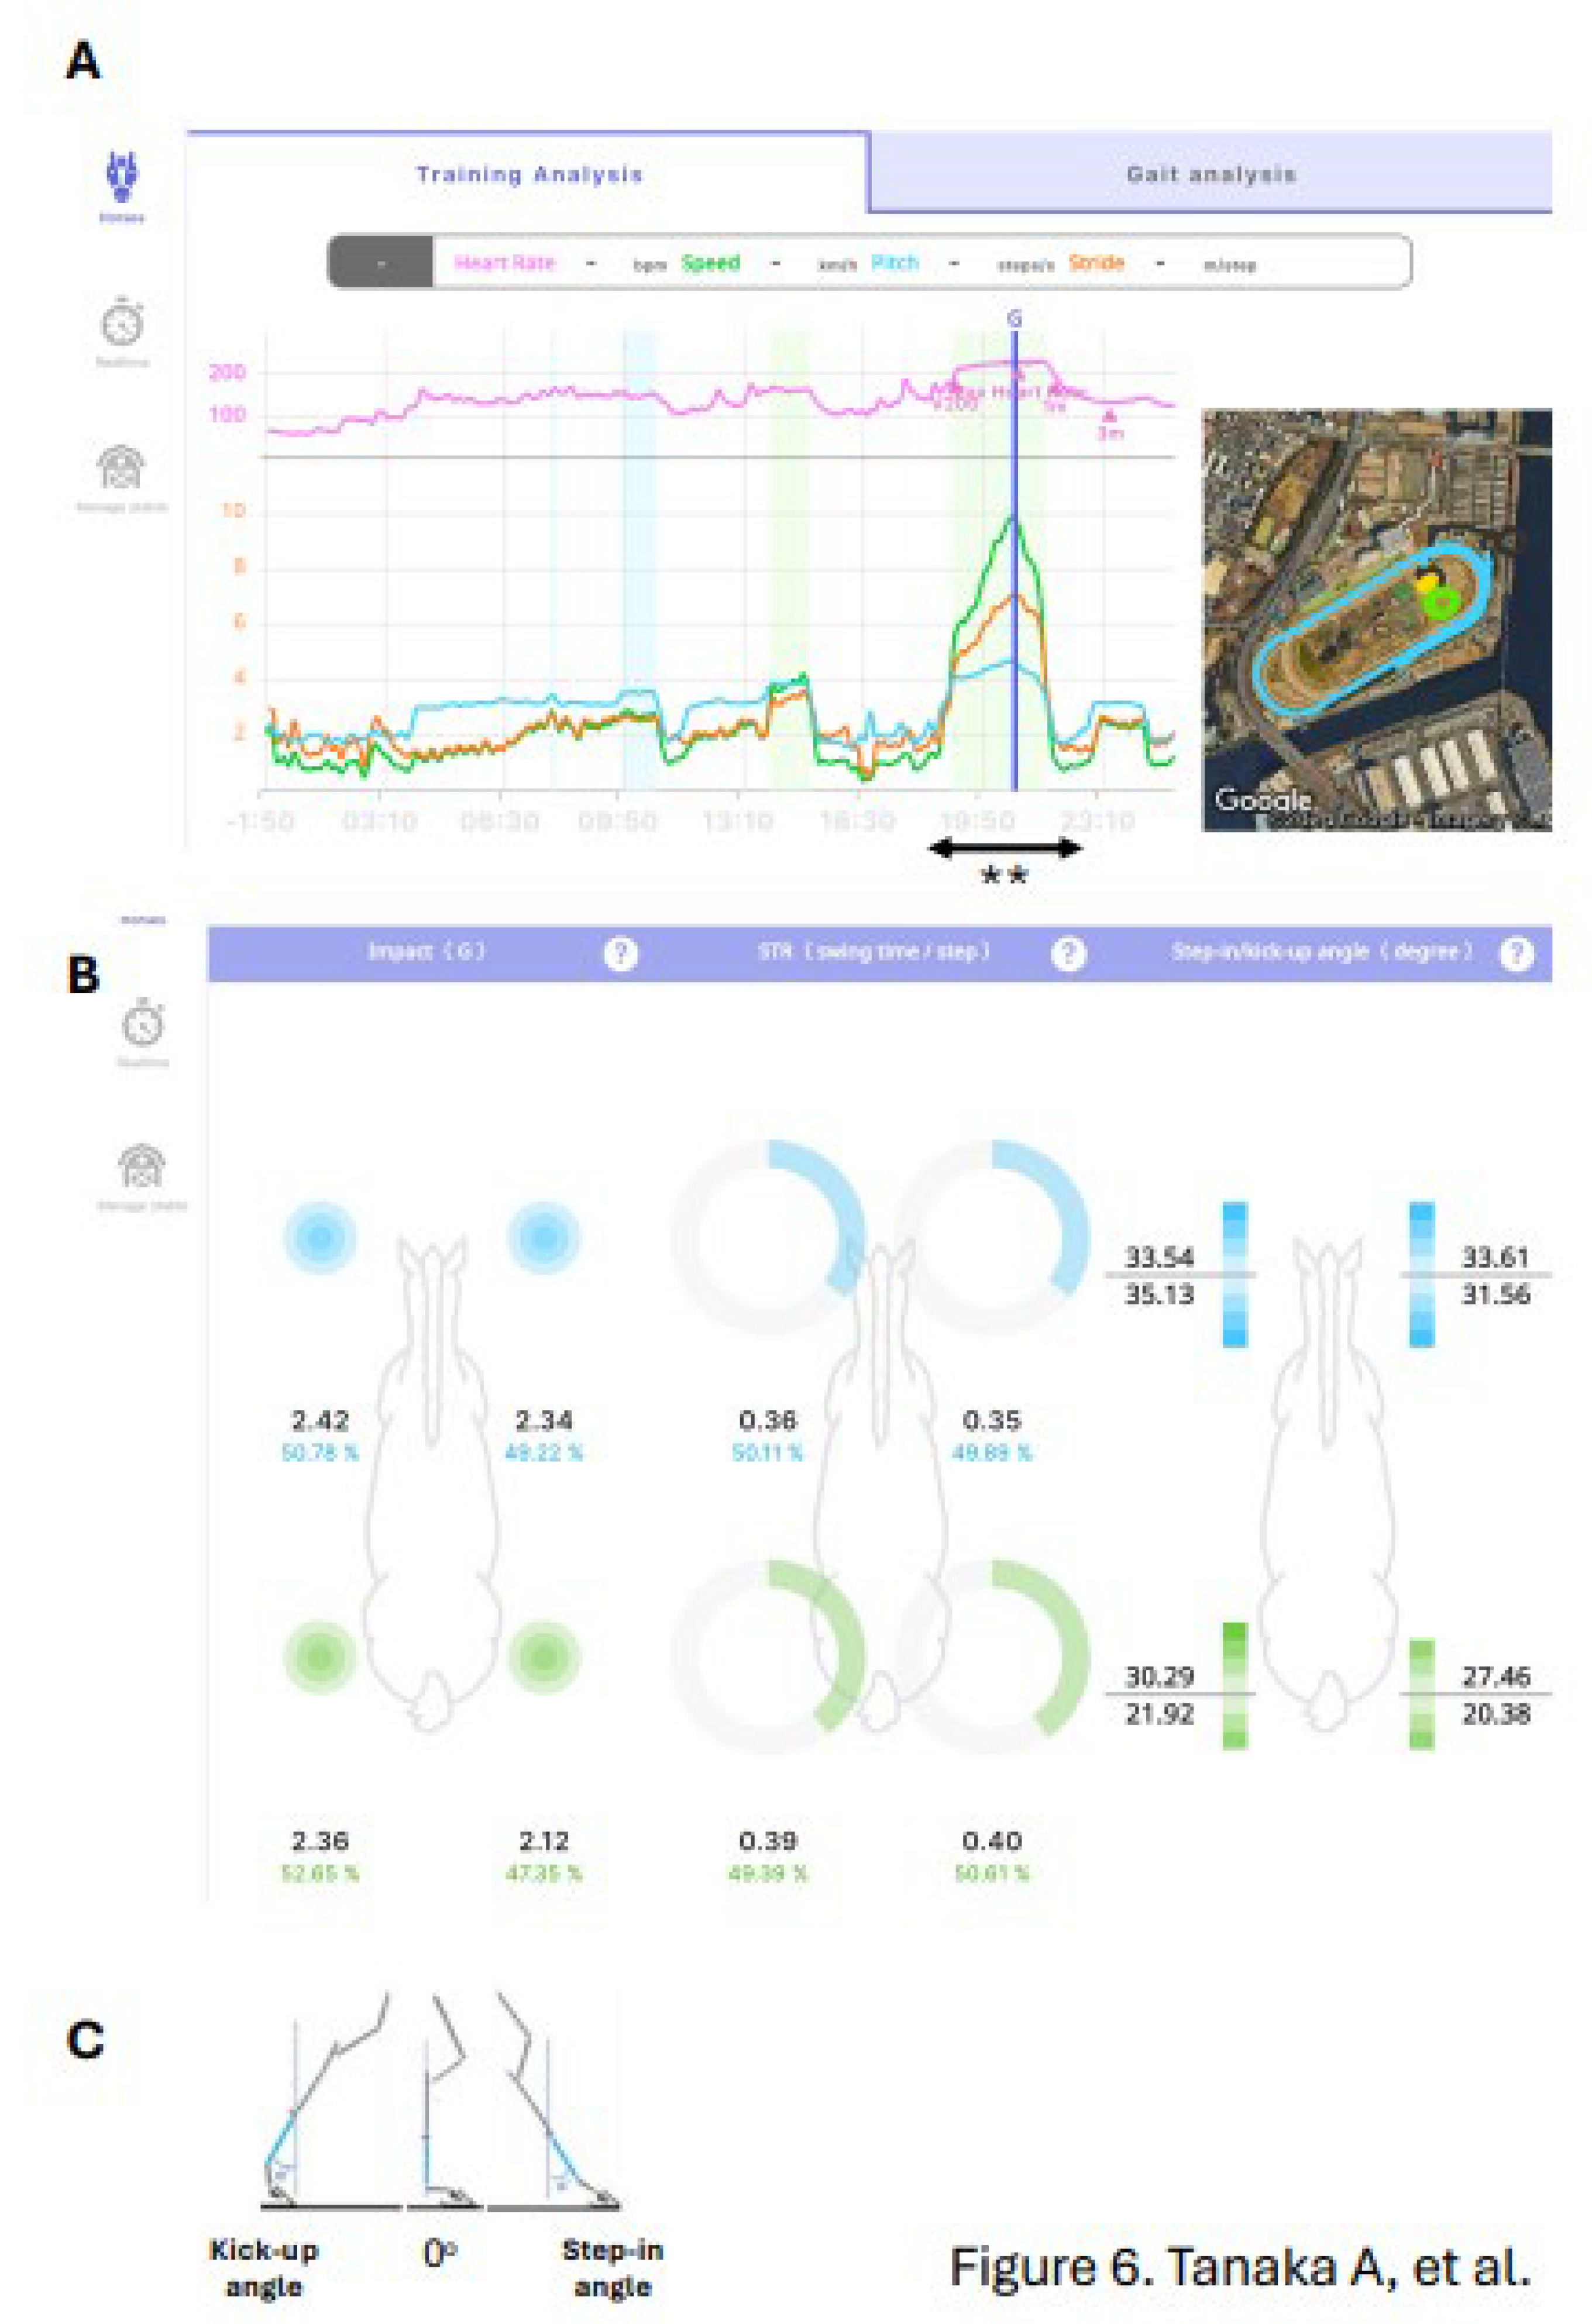
Figure 6 shows the screen showing the data acquired during the test training on the dedicated terminal tablet. Along with the position information, data such as distance traveled, speed, acceleration, and heart rate at that time were acquired and drawn as a line graph on the training analysis screen (
Figure 6A). On the gait analysis screen, the stride, pitch, impact of the leg on the ground, and the ratio of the leg floating in space (STR) are calculated and displayed (
Figure 6B), which are calculated from the angle and acceleration of the leg on the left, right or front and back. In particular, the angles of limb step and kick-up are measured and their ratios are analyzed, allowing the trainer to review the data at each time point (
Figure 6B). The angles of limb step-in and kick-up are analyzed as shown in
Figure 6C, using the straight standing position as the reference (0
o). Average degree of the step-in and kick-up angles of each limb are shown on the screen (
Figure 6C).
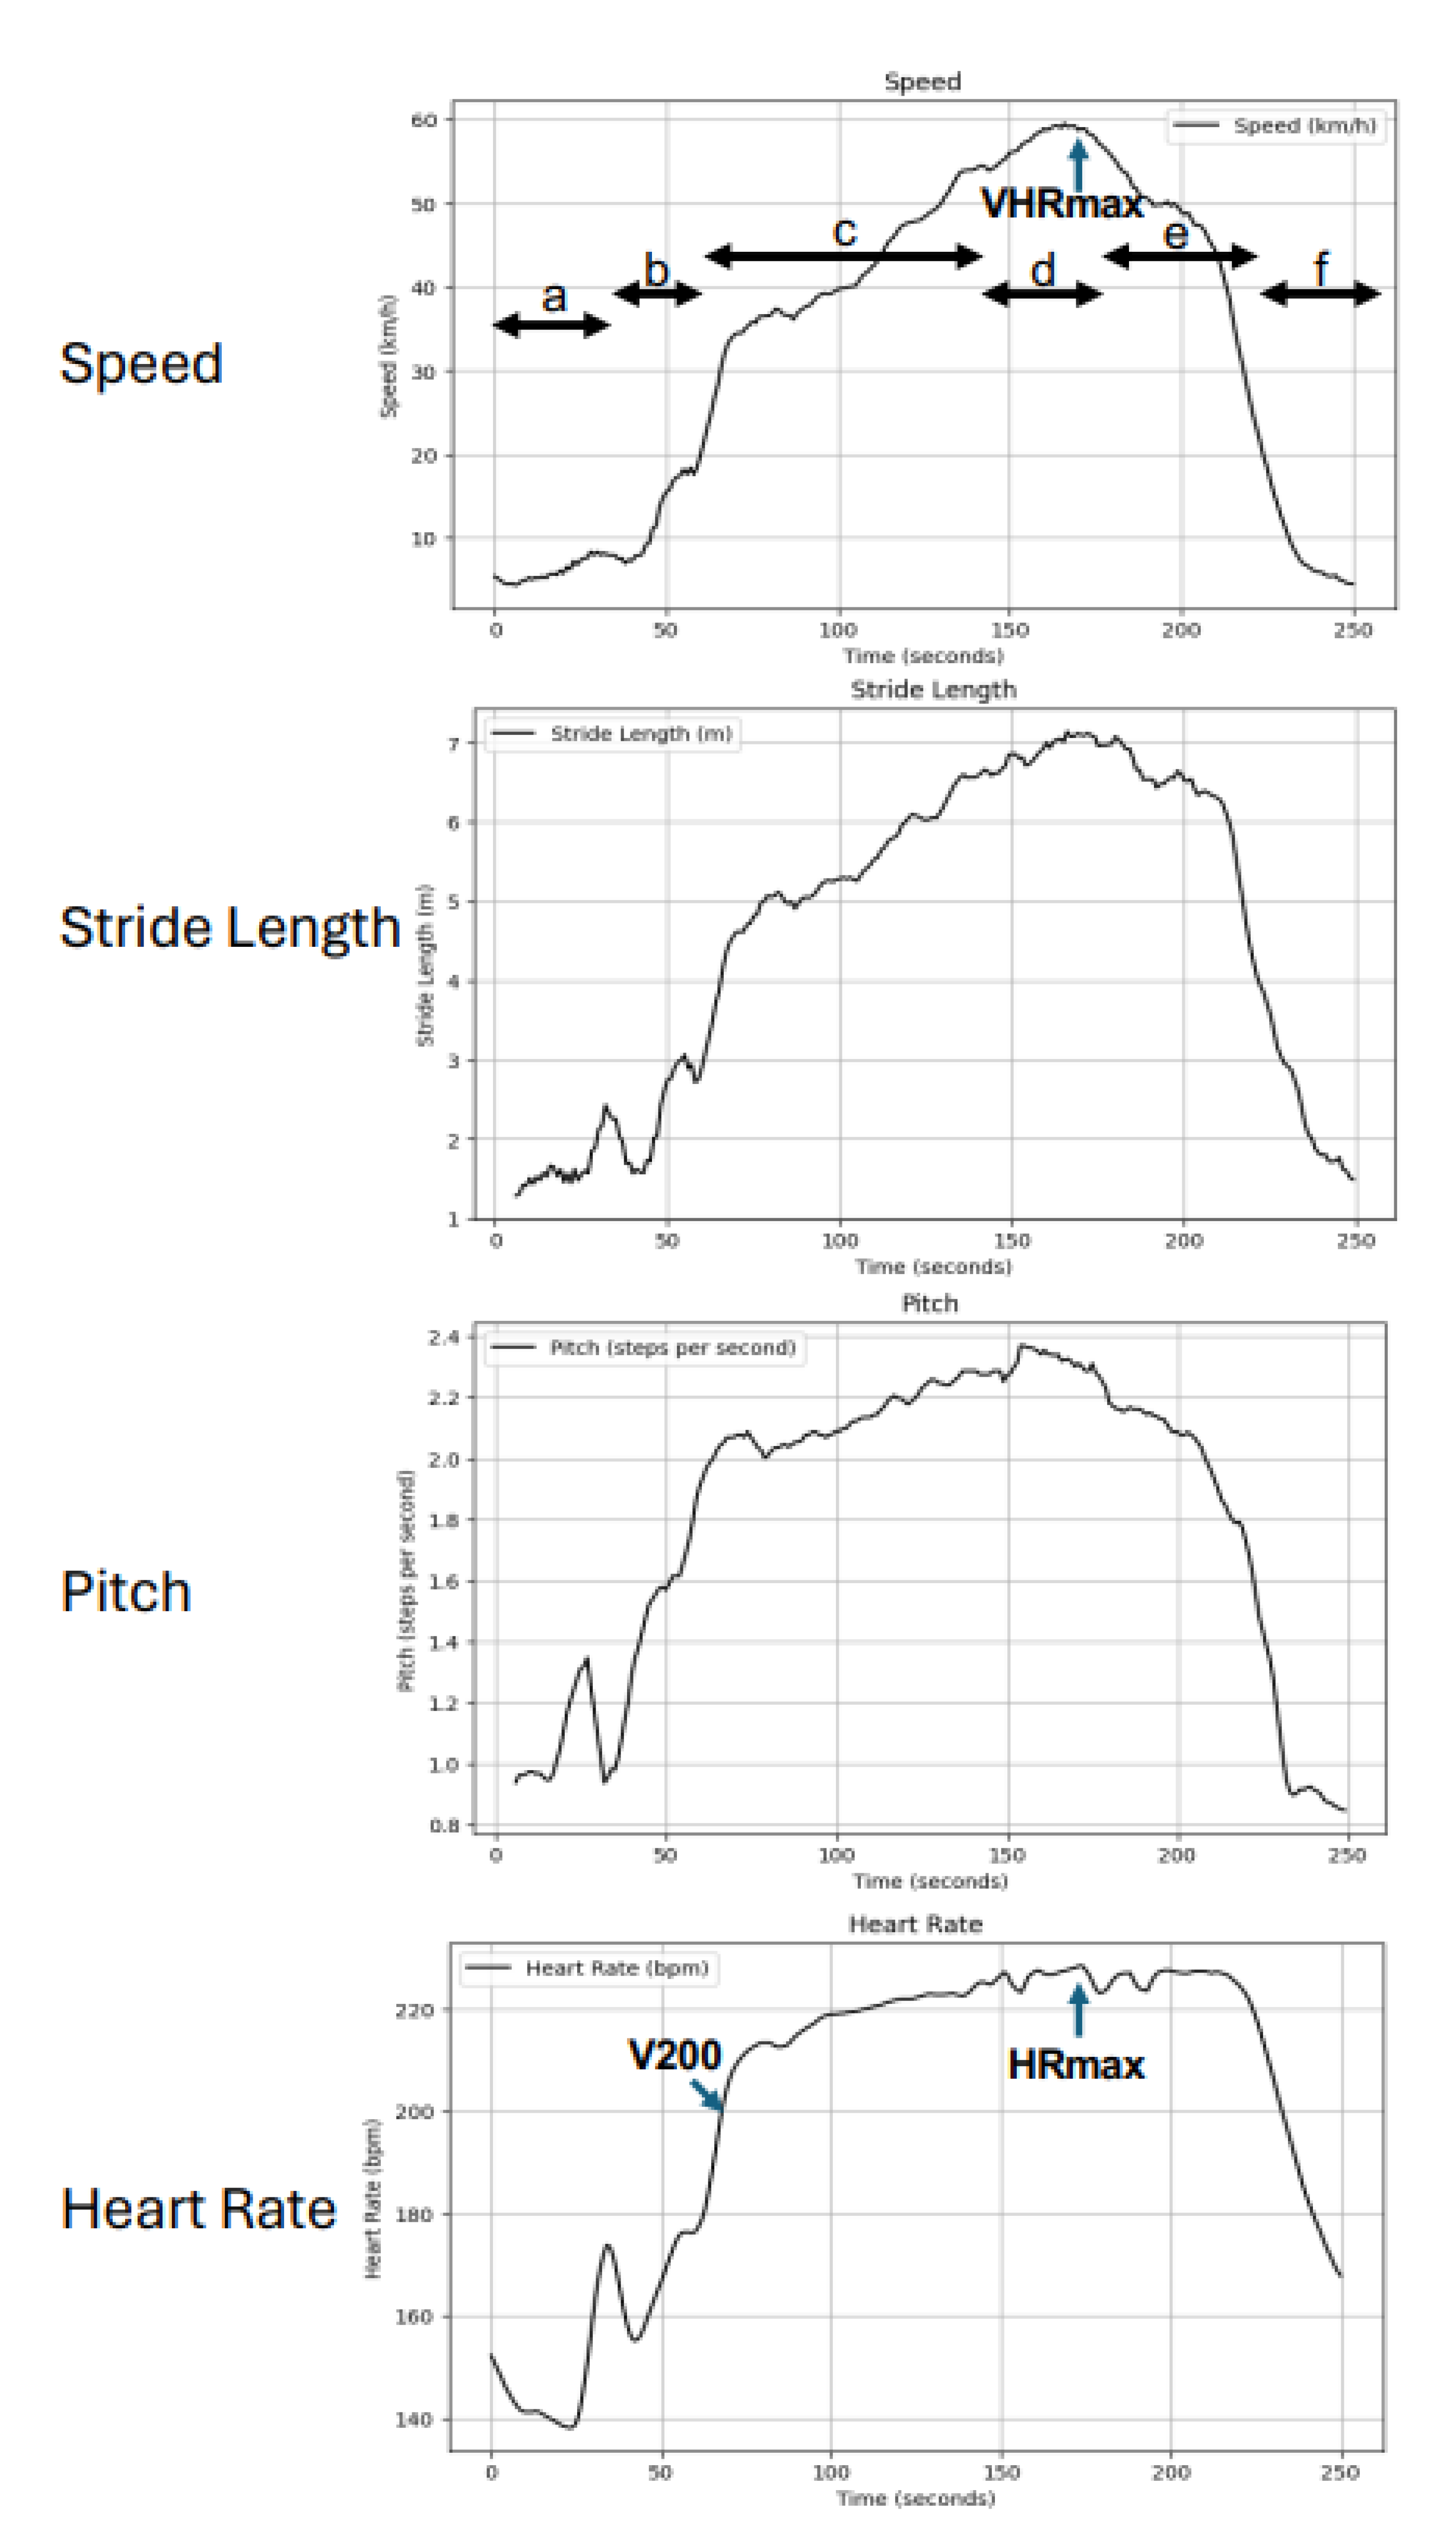
Figure 7 shows the waveform data for the time indicated by the arrow in
Figure 6A, and the gait patterns and lead forelimbs were extracted. The time course of each gait on the graph is as follows: from start to 35 seconds is trot (a), from 36 to 55 seconds is canter in the left lead (b), from 56 to 148 seconds is gallop in the left lead (c), from 149 to 175 seconds is gallop in the right lead(d), from 176 to 219 seconds is gallop in the left lead (e), then canter in the left lead (f). In the data at this time, speed was maximal in the right lead gallop, and at the same time the stride was increased. The highest heart rate (HRmax) and the speed at the highest heart rate (VHRmax) was recorded at 175 seconds in the graph. The timing for the heart rate to reach 200 beats/min (V200) was 67 seconds. The pitch tended to increase in advance of the speed and became at its highest value of the day when the max speed was recorded. The heart rate rises immediately upon entering the gallop, then remains almost flat, and then quickly declines as the speed was reduced to canter.
4. Discussion
Equtum® analyzed the gait patterns, lead leg, ground impact, and STR during training, as well as step-in and kick-up angles of each limb. Heart rate, speed, stride length, and pitch were also recorded over time. The heart rate of a racehorse at rest is about 30 to 40 beats/min, and it has been observed that horses with high racing ability have a low heart rate at rest [
15]. However, no large-scale analysis has been conducted. On the other hand, when a racehorse begins to run, its heart rate gradually increases, but once it exceeds 16 meters per second, its heart rate does not increase any further. The heart rate at this point is called the maximum heart rate (HRmax). HRmax varies greatly among individuals and is known to decrease with age [
16,
17]. When a horse is run at various speeds, the speed at which the maximum heart rate is recorded is called VHRmax [
16,
17]. VHRmax has been reported to correlate with maximal oxygen uptake, which increases with training, and is considered to be an excellent index for evaluating physical fitness of each horse [
15]. In addition, the index that indicates the running speed when the heart rate reaches 200 beats/min is called V200 [
16,
17]. On the other hand, the time point when the heart rate returns to 100 beats/min (THR100) indicates the resiliency of the heart and is an indicator of the horse's cardiopulmonary capacity. Studies have been conducted on the relationship between horse training and cardiopulmonary capacity using these indices, but no device has been developed that can simultaneously measure and analyze the exercise state of the limbs and the horse's balance, as well as heart rate. Using Equtum®, it is clear that HRmax, VHRmax, V200, and THR100 can be easily confirmed on the screen and comprehensively evaluated along with each limb condition.
Various measurement devices have been developed to analyze the heart rate and speed of racehorses and competition horses during training [
18,
19,
20]. Most of the system uses GPS to measure both speed and heart rate of the horse at the same time. Some of these measuring devices are attached on the girth and transmit speed and heart rate data to a dedicated terminal. Riders and trainers receive data feedback for short- and long-term analysis of the horse's speed and balance during training, as well as changes in the horse's movement due to the rider's ride. Data is visualized using a dedicated app installed on a tablet device. In contrast, Equtum® is a system that measures positional information, speed, and heart rate, along with various information from each limb, for a comprehensive evaluation of the horse's movement. Moreover, on the gait analysis screen, data of the impact, STR, and step-in/kick-up angles of each limb help trainer to know the horse's left/right or front/rear balance, and dominant lead legs. This equipment can be used not only for training, but also for veterinary purposes such as rehabilitating injured horses and determining the effectiveness of treatment.
In the horse training, particularly in training of racehorses, experience and senses of the trainer have been highly important, but it has not been difficult to quantify and visualize. Equtum®, the IoT device exclusively used in horse training, is a device that enables decision-making based on numerical values by providing real-time data such as speed, stride, and heart rate, etc. In addition, by inferring the distance aptitude and fatigue level of the relevant horse based on past training and race results, more accurate evaluations of training time, intensity, and training intervals can be made. Furthermore, in cooperation with veterinarians, it will be effective in predicting and early detection of pain and/or injuries of horses. We believe that the use of this system will contribute to a future in which all racehorses and competition horses can safely perform at their best.
Author Contributions
Conceptualization, A.T. and H.M.; methodology, H.O and T.T; validation, A.T., R.M, and H.M; formal analysis, A.T., R.M, and H.M; investigation, A.T., R.M, and H.M; resources, M.O., H.O., and T.T; writing—original draft preparation, A.T.; writing—review and editing, A.T., R.M, H.O., T.T., M.O., and H.M,; project administration, A.T. and H.M. All authors have read and agreed to the published version of the manuscript.
Funding
This work was supported by a grant for race-horse production and development 2021, 2022, and 2023 provided by the Japan Racing Horse Association.
Institutional Review Board Statement
The experimental protocol was approved by the standards specified in the guidelines provided by the Animal Care and Use Committee of the Tokyo University of Agriculture and Technology as well as those in the Science Council of Japan’s guidelines for the use of experimental animals (approval numbers R03-53, R04-86, R05-101, and R06-25, April 1st in 2012, 2022, 2023, and 2024).
Informed Consent Statement
Not applicable.
Data Availability Statement
Data are available upon request to the authors.
Acknowledgments
We appreciate Ms. Masako Sakuma, Ms. Ayano Hagiwara, and Ms. Rino Yanaida (Tokyo University of Agriculture and Technology) for their excellent horse care and training. We are grateful for Drs Hiroaki Sato, Shuntaro Urayama, Masanori Muranaka (Japan Racing Association, Tokyo, Japan) for their valuable advice and supports.
Conflicts of Interest
This work was performed in collaboration with Tokyo University of Agriculture and Technology and ABEL Inc. Both Hideki Oshima and Tomoki Tanezaki are employees of ABEL Inc.
References
- Librado, P.; Khan, N.; Fages, A., et al; et al. The origins and spread of domestic horses from the Western Eurasian steppes. Nature. 2021, 598, 634–640. [Google Scholar] [CrossRef] [PubMed]
- Remembering the real war horses. Vet. Rec. 2011, 169, 543. [CrossRef] [PubMed]
- Baragli, P.; Padalino, B.; Telatin, A. The role of associative and non-associative learning in the training of horses and implications for the welfare (a review). Ann. Ist Super Sanità, 2015, 51, 40–51. [Google Scholar] [CrossRef] [PubMed]
- McLean, A.N.; McGreevy, P.D. Ethical equitation: Capping the price horses pay for human glory. J. Vet. Behav. 2010, 5, 203–209. [Google Scholar] [CrossRef]
- Goodwin, D.; McGreevy, P.; Waran, N.; McLean, A. How equitation science can elucidate and refine horsemanship techniques. Vet. J. 2009, 181, 5–11. [Google Scholar] [CrossRef] [PubMed]
- Waran, N.K.; Casey, R. Horse training. In: Mills, D.S.; Mc-Donnell, S.M. (Eds). The domestic horse: the origins, development and management of its behaviour. Cambridge: Cambridge University Press; 2005.
- Hausberger, M.; Roche, E.; Henry, S.; Visser, K. A review of the human–horse relationship. Appl. Anim. Behav. Sci. 2008, 109, 1–24. [Google Scholar] [CrossRef]
- Hawson, L.A.; McLean, A.N.; McGreevy, P.D. The roles of equine ethology and applied learning theory in horse-related human injuries. J. Vet. Behav. 2010, 5, 324–338. [Google Scholar] [CrossRef]
- Lyn CY, Wright J, Bushnik T, Shem K. Traumatic spinal cord injuries in horseback riding. A 35-Year Review. Am. J. Sports Med. 2011, 39, 2441–2446. [Google Scholar] [CrossRef] [PubMed]
- Witkowska-Piłaszewicz, O.; Grzędzicka, J.; Sen, J.; Czopowicz, M.; Zmigrodzka, M.; Winnicka, A.; Cywinska, A.; Carter, C. Stress response after race and endurance training sessions and competitions in Arabian horses. Prev. Vet. Med. 2021, 188, 105265. [Google Scholar] [CrossRef] [PubMed]
- McKeever, K.H. Overtraining syndrome in standardbred horses: New insights into the role of red blood cell hypervolaemia. Vet. J. 2003, 165, 190–192. [Google Scholar] [CrossRef] [PubMed]
- Hauss, A.A.; Stablein, C.K.; Fisher, A.L.; Greene, H.M.; Nout-Lomas, Y.S. Validation of the Lactate Plus Lactate Meter in the Horse and Its Use in a Conditioning Program. J. Equi. Vet. Sci. 2014, 34, 1064–1068. [Google Scholar] [CrossRef]
- Massányi, M.; Halo, M.; Mlyneková, E.; Kováčiková, E.; Tokárová, K.; Greń, A.; Massányi, P.; Halo, M. The effect of training load stress on salivary cortisol concentrations, health parameters and hematological parameters in horses. Heliyon. 2023, 9, e19037. [Google Scholar] [CrossRef]
- Matsuda, K.; Orito, K.; Amagai, Y.; Jang, H.; Matsuda, H.; Tanaka, A. Swing time ratio, a new parameter of gait disturbance, for the evaluation of the severity of neuropathic pain in a rat model of partial sciatic nerve ligation. J. Pharmacol. Toxicol. Methods. 2016, 79, 7–14. [Google Scholar] [CrossRef]
- Gramkow, H.L.; Evans, D.L. Correlation of race earnings with velocity at maximal heart rate during a field exercise test in thoroughbred racehorses. Equine Vet. J. Suppl. 2006, 118–22. [Google Scholar] [CrossRef] [PubMed]
- Evans, D.L.; Rose, R.J. Determination and repeatability of maximum oxygen uptake and other cardiorespiratory measurements in the exercising horse. Equine Ve.t J. 1988, 20, 94–98. [Google Scholar] [CrossRef]
- Vermeulen, A.D.; Evans, D.L. Measurements of fitness in thoroughbred racehorses using field studies of heart rate and velocity with a global positioning system. Equine Vet. J. Suppl. 2006, 113–117. [Google Scholar] [CrossRef]
- Fonseca, R.G.; Kenny, D.A.; Hill, E.W.; Katz, L.M. The association of various speed indices to training responses in Thoroughbred flat racehorses measured with a global positioning and heart rate monitoring system. Equine Vet. J. Suppl. 2010, 51–57. [Google Scholar] [CrossRef] [PubMed]
- Bazzano, M.; Giudice, E.; Rizzo, M.; Congiu, F.; Zumbo, A.; Arfuso, F.; Di Pietro, S.; Bruschetta, D.; Piccione, G. Application of a combined global positioning and heart rate monitoring system in jumper horses during an official competition - A preliminary study. Acta Vet. Hung. 2016, 64, 189–200. [Google Scholar] [CrossRef] [PubMed]
- Buhl, R.; Nissen, S.D.; Winther, M.L.K.; Poulsen, S.K.; Hopster-Iversen, C.; Jespersen, T.; Sanders, P.; Carstensen, H.; Hesselkilde, EM. Implantable loop recorders can detect paroxysmal atrial fibrillation in Standardbred racehorses with intermittent poor performance. Equine Vet. J. 2021, 53, 955–963. [Google Scholar] [CrossRef]
|
Disclaimer/Publisher’s Note: The statements, opinions and data contained in all publications are solely those of the individual author(s) and contributor(s) and not of MDPI and/or the editor(s). MDPI and/or the editor(s) disclaim responsibility for any injury to people or property resulting from any ideas, methods, instructions or products referred to in the content. |
© 2024 by the authors. Licensee MDPI, Basel, Switzerland. This article is an open access article distributed under the terms and conditions of the Creative Commons Attribution (CC BY) license (http://creativecommons.org/licenses/by/4.0/).
