
Submitted:
06 June 2024
Posted:
10 June 2024
You are already at the latest version
Abstract
Power grid reliability is crucial to supporting critical infrastructure, but monitoring and maintenance activities are expensive and sometimes dangerous. Remote sensing enables real time data monitoring and collection related to environmental and industrial processes, like the power grid system. Monitoring the power grid successfully involves diverse sources of data including that inherent to the power operation and ambient atmospheric weather data. Detection methods can identify anomalies like arcing, and climate data in particular is becoming increasingly important in order to maintain power supply. Gaussian processes (GPs) are a well-established Bayesian method for analyzing data. However, the computational complexity of GPs limits their scalability. This is a challenge when dealing with remote sensing datasets, where acquiring a significant amount of data is common. Alternatively, traditional machine learning methods perform quickly and accurately, but lack the generalizability innate to GPs. The focus of this review is burgeoning research that leverages Gaussian processes and machine learning in remote sensing applications.
Keywords:
remote sensing
; grid management
; literature review
1. Introduction
Power grid reliability is crucial to supporting critical infrastructure. Service interruptions can have devastating consequences for communication, emergency, and transportation services, just to name a few. In addition to infrastructure, nearly every element of modern day living relies on a stable and functioning power grid, including heating and cooling systems, lighting, refrigeration, telecommunications, and internet access. Interruptions in the power supply can range from minor inconveniences, such as the temporary loss of internet or television services, to more significant problems, like the inability to access medical equipment or emergency services during critical situations [1]. As climate conditions worsen, the reliability of the power grid becomes even more significant. Extreme weather events, such as hurricanes, wildfires, or severe storms, can cause serious damage to power infrastructure, leading to prolonged power outages. Rising temperatures and changing weather patterns can strain the grid [2], resulting in increased demand for electricity, which in turn stresses transmission and distribution systems.
Managing the power grid is no easy task in ideal conditions, to say nothing of the threat of physical and cyber-attacks [3]. With this in mind, The Grid Communications and Security group at Oak Ridge National Laboratory (ORNL) researches integrated sensing and communications platforms to ensure efficient and reliable grid communications. The proposed system Autonomous Intelligence Measurements and Sensor Systems (AIMS) is currently underway. The goal of this research is to develop a machine-controlled response team with sensors, mobile platforms, communications and data storage and analysis components. These elements will make up a system capable of autonomous inspection and reporting with the explicit goal of improved grid reliability. The system will be comprised of advanced sensors, generative design AI, communications, autonomic systems, swarming technologies, energy harvesting, collaborative operation between drone and command center, and training of grid state measurements. Figure 1 presents a graphical overview of AIMS. AIMS has significant future implications for infrastructure management.
Burgeoning research that leverages Gaussian processes and machine learning in combination is the subject of this review. Remote sensing plays a major role in AIMS as its main goal will be achieved using sensor equipped drones. Each drone may have one or more sensors collecting different types of pertinent data, not to mention its own data, i.e., battery life, state, LiDAR, etc. It is not the intent of this project to have multiple independently operating drones, but to have a swarm that works together, therefore, the system will need to share data between drones. The data collected by drones will also need to be integrated with the data inherent to the power grid, like power flow, damping, and inertia, and ambient atmospheric data, like wind speed and temperature. I reviewed references directly related to remote sensing, however, remote sensing at power substations using multiple drones and sensors is novel work. For that reason, this paper highlights different types of remote sensing applications. Some applications employ the use of drones, others, the use of ocean crawlers and satellites. The common thread among them is the use of Gaussian processes and other stochastic methods in remote sensing to obtain usable information. This review includes over forty sources from a variety of journals and conference proceedings, most from 2017 to present since this field is quickly developing. Power load and weather forecasting, object detection, physics based simulations, drone exploration, and energy harvesting are areas of interest in this paper.
1.1. Remote Sensing
Remote sensing applications gained significant traction in autonomous surveillance [5,6,7], enabling the monitoring and collection of data related to environmental and industrial processes. Various devices, such as satellites, unmanned aerial vehicles (UAVs) or drones, and ocean crawlers, offer valuable tools for data acquisition in diverse contexts. When it comes to monitoring the power grid, leveraging drone and sensing technology provides a new opportunity. Drones equipped with sensors and cameras can be deployed to capture high-resolution imagery and collect data related power infrastructure, such as transmission lines, substations, and power distribution equipment. This data can include visual imagery, thermal imaging, LiDAR (Light Detection and Ranging) data, or other relevant sensor readings. Algorithms combining GPs and ML can identify patterns, detect anomalies, and predict potential failures or maintenance needs based on the data. This enables more efficient and targeted maintenance and inspection activities, leading to improved grid reliability and reduced downtime. The benefits of using autonomous drones for power grid monitoring are numerous:
- Efficiency: Drones can quickly and autonomously cover large areas, making it feasible to monitor extensive power infrastructure efficiently. They can capture data from challenging or inaccessible locations, such as remote areas or areas with difficult terrain, more easily and cost-effectively than traditional manual inspections.
- Safety: By using drones, human inspectors can avoid hazardous or risky situations, such as working at heights or navigating dangerous environments. Drones can reach areas that may be unsafe for personnel, minimizing the potential risks associated with manual inspections.
- Data accuracy and detail: Drones equipped with advanced sensors can capture high-resolution imagery and collect precise measurements, providing detailed data on the condition of power infrastructure. This allows for better assessment and understanding of the grid’s health and can aid in detecting early signs of potential issues.
- Real-time monitoring: Drones can be deployed for regular or periodic monitoring, providing real-time or near real-time data on the grid’s status. This enables proactive maintenance and response to changing conditions promptly.
- Cost-effectiveness: Adopting drone technology for power grid monitoring can lead to cost savings compared to traditional inspection methods. Drones can cover larger areas in less time, reduce the need for manual inspections, and improve the efficiency of maintenance operations.
1.2. Gaussian Processes
A Gaussian process (GP) is a generalization of the Gaussian distribution. It is a stochastic process that can be used for regression (GPR) and classification (GPC) [8,9]. Using standard notation, if X is a vector of random variables that follow a Gaussian distribution, then and where is the mean and is the covariance matrix. The collection of corresponding function values also follows a Gaussian distribution [10], so is a Gaussian process. Assuming independent and identically distributed Gaussian noise , defined as follows:
where is the mean function and is the covariance function, also called a kernel. Since this method is rooted in probabilistic methods, it provides reliable measures of its own uncertainty and is fairly interpretable [11], making it ideal for ”physics based” modeling. This interpretability can lead to the discovery of factors that influence physical processes, as opposed to the so called ”black box” of some machine learning (ML) algorithms. However, GPs have high computational costs, especially when dealing with large datasets or complex models. The computational complexity of GPs typically grows cubically with the number of data points, limiting their scalability [12]. This is a challenge when dealing with large remote sensing datasets, where acquiring a significant amount of data is common. Several sources reviewed in this paper directly address this problem in their methodology.
GPs have exciting implications for power grid operations. Parameter estimation, load forecasting, and anomaly detection are all capabilities of GPs, just to name a few. Many aspects of power grid operations are amenable to physics based modeling given their well established scientific properties (voltage, current, acoustics, temperature, etc.). The power grid is a complex system that provides a crucial service, making the interpretable results of GPs a significant benefit as opposed to "black box" methods.
2. Power Flow and Load Forecasting
Efficient operation of the power grid relies on forecasting. Forecasting in power grid operations is difficult because of its complexity - not only in its technical operation, but also because of climate factors associated with outdoor operation. Wind forces, for example, have serious consequences for power grid operation, but are very difficult to model. The AIMS project provides opportunities to collect diverse data in real-time that can be used in forecasting methods.
A physics-informed Gaussian process regression (PI-GPR) takes advantage of established physical processes to predict the phase angle, angular speed, and wind mechanical power of a three-generator power grid system [13]. The proposed method is similar to a traditional GPR but uses stochastic differential equations to estimate prior statistics instead of the likelihood. The authors compared the PI-GPR to a standard GPR model, the ensemble Kauman filter (EnKF) method, and autoregressive integrated moving average (ARIMA). They used log predictive probability to measure and compare accuracy. PI-GPR is slightly less accurate but comparable to GPR and had smaller standard deviation overall. EnKF is an online method while PI-GPR as applied is an offline process, therefore, EnKF is less computationally complex. However, because PI-GPR does all of the prior estimating offline, the actual forecast is less computationally complex than EnKF. In terms of performance, PI-GPR is comparable to EnKF. PI-GPR outperformed ARIMA and was more robust to noisy data. Although PI-GPR does not significantly outperform other methods overall, the first two seconds of forecasting are extremely precise. Figure 2 shows a comparison of PI-GPR and data-driven forecasting.
Another successful method for short-term prediction of electric loads is multi-output Gaussian process regression (MOGP) [14]. The future predictions (24-hour) are based on previous load, temperature, and dew point values. The authors evaluated MOGP using mean absolute percentage error as an accuracy measure in all cases. Simulation cases for prediction included using previous load, using previous load and dew point data, previous load and temperature data, and previous load, dew point, and temperature data. Six different kernels were tested on MOGP performance: linear, Matérn, polynomial, rational quadratic (RQ), piecewise (P.) polynomial, and radial basis function (RBF). Prediction using previous (7 day) load performed best with linear kernel. In all other cases, best performance occurred using an RQ kernel with 7 days of previous load and 2 days of previous dew point and temperature data. The results showed that prediction using previous load and temperature data outperformed that of previous load and dew point data and that prediction using previous load, dew point, and temperature data outperformed all other cases. To reach its goals for grid state measurements and collaborative operation, AIMS includes the incorporation of ambient data, like temperature and dew point. Opportunities to understand how climate affects the grid and how it can be used to influence grid operations is an interesting area for future work.
Chance constrained optimal power flow (CC-OPF) is a stochastic method used for modeling demand in power grid operations under conditions that allow a "violation probability" [15]. This method is meant to account for the uncertainties that accompany a complex system like power grid, for example, significant and unexpected weather events. A major drawback of CC-OPF is the associated computational complexity. A novel framework inserting GP into this process using Python [15] overcomes this issue while maintaining accuracy. Under this framework, the data-driven GP replaces the alternating current (AC) power flow equations, eliminating the need for knowledge of grid configuration and parameters. This framework is put into practice using synthetic data from multiple test cases from the Institute of Electrical and Electronics Engineers (IEEE)[16]. The authors used the IEEE 9-bus Test System with three generators and three loads and the IEEE 39-bus Test System with ten generators and twenty-one loads with the same voltage level and power ratio. In all cases, loads and renewable sources are uncertain. Root Mean Square Error (RMSE) measures the accuracy of GP prediction and the computation time, generation cost, and the empirical spread of output variables also evaluate the overall performance. In general, RMSE is low, but computational complexity remains an issue in this application and an area for future work.
Initial choices for kernel and basis function in GPR will have different effects on performance. Evaluating load forecasts using multiple kernel and basis functions [17] gives insight into this effect. The authors used mean average percentage error (MAPE) to consider three basis functions (constant, zero, and linear) and six kernel functions (exponential, squared exponential, Matérn 3/2, Matérn 5/2, rational quadratic, Ard exponential). Best performance varies by location, with different basis-kernel combinations and month of year (see Table 2.1). This does make sense in that weather plays a large factor in this model, but it is not particularly revealing of which combinations should be used. That said, in comparison to ANN and regression tree applications, GPR outperformed both in terms of MAPE.
As mentioned previously, the ACPF solution is non-linear and difficult to solve. A general solution framework using voltage and bus injection using GPR is proposed [18] in a simulated voltage limit violation scenario. The authors found that a strong relationship between Mean absolute error (MAE) and voltage variance. Thus, higher predicted standard deviation leads to higher approximation error. The proposed method outperformed standard methods including data based methods and is not computationally burdensome. In this case, GPR has shown promise in evaluating non-linear processes while maintaining interpretability.
Load forecasting during anomalous events is difficult given that most applications use historic data that may not reflect the uncertainty of these rare events. Deep Gaussian process (DGP) analysis accounts for limited data in this scenario by mimicking the layering idea of a neural network (NN) [19]. In this study, DGP outperforms back-propagation NN, sparse GP (SGP) and variational autoencoder DGP (VAE-DGP) in terms of MAPE. In general, the proposed DGP is better at capturing the uncertainty of the limited data during an uncertain event. It is clear in Figure 3, below, that DGP captures all of the data throughout the entire distribution.
Similarly, maintaining power balance during extreme weather events can be difficult since, by definition, they do not occur very often. A stochastic, multi-scenario method to model electrical power and energy balance that successfully accounts for extreme weather effects [20] in an application to hydropower and renewable energy. The proposed model is mimizing the total cost function based on certain constraints, as in a traditional OPF problem. In this case, constraints include include unit maintenance constraints, unit operation constraints, inter-regional power trade constraints and system operation constraints. The authors applied this method in a simulation under normal circumstances and under extreme weather for comparison. In the normal condition, operation is more economical but renewable energy spill probability is higher. Under the extreme condition, both operations have load losses, but the extreme condition has less loss. These results show that the extreme weather model can promote renewable energy consumption under extreme weather events and that the model is better at adapting to weather change, both of which maintain power balance. However, this approach should be further explored to determine the tradeoffs between cost and flexibility.
A method using stochastic distributed energy resources [21] to prompt pickup during blackouts also addresses maintaining power supply during anomalous events. The goal is to improve the system response between interruption and restoration of power supply. The authors apply this method as an optimization problem using ad hoc methods without needing to consider the power flow equations, form the power balance constraints through chance constraints, and enact connectivity constraints. A simulated case study revealed that understanding the stochastic nature of distributed energy resources is valuable for supply adequacy probabilities, but there is still a tradeoff between supply adequacy and load served. This work also did not consider energy balance, which would be necessary in a real-world scenario.
GPs are not always the most suitable method for a problem, specifically if the data or noise is non-Gaussian. A distributionally robust stochastic method for optimal power flow accounts for non-Gaussian forecast error while maintaining interpretability [22]. Other stochastic methods (like Gaussian methods) must make assumptions about the data that can only lead to overestimation or underestimation of risk. The authors contend that a data-driven approach that does not require these assumptions will allow them to more correctly control the tradeoffs between economic efficiency and risk constrain violation, provided an optimal solution to the power flow problem. This method is successful in demonstrating the control over parameters in applications to overvoltages related to photovoltaic power and N - 1 security line flow constraints related to wind generators [23]. The strength of this approach is in its modelling of forecast error, which leads to improved performance. That said, this approach is theoretically demanding and was not directly compared to other methods.
3. Temperature Detection from Remotely Sensed Images
Temperature sensing for identifying hot spots on power lines and transformers is valuable to power grid operations. Hot spots can be indicative of failure or potential failure and affect efficiency. Infrared (IR) is a convenient way to estimate temperature and IR cameras can be easily mounted on drones for inspection, as in the AIMS project. A new method using LiDAR and long-distance IR cameras [24] using Temperature-Radiation and Radiation-Digital distance mapping to approximate temperature more accurately. The process uses an offline method for data collection and interpolation (calculating distance through digital count and radiation via Planck’s law) and a online method for analysis. In the online process, LiDAR provides the distance measure and the IR camera provides the radiation measure. In a blackbody application, the proposed method outperformed forward looking IR and single mapping method at 3.5 and 7 m according to MSE. That said, under non-controlled conditions, atmospheric elements like humidity may have negative effects on results.
An application to stream management does consider the problems atmospheric conditions can add to temperature estimation from high and low resolution IR images [25]. Spectral mixing analysis (SMA) is the method of choice since it accounts for spectral signature, the topography, shadowing effects and the spatial resolution. This method was not compared to others and is limited by instrumentation of the time (2001). Although this analysis is focused on stream management, it is relevant to power grid applications in that the stream is an asset that must be distinguished from air temperature surrounding it, much like power lines.
A direct application of IR imaging for hot spot identification [26] using drones leverages information from both IR images and visible light images using image registration methodology. This process involves first identifying the power lines in the image using a Gaussian filter, edge detection, and Hough transform. After identifying power lines, a histogram threshold is used for hot spot identification. Once again, this method was to test functionality and was not compared to other methods, nor did it estimate temperature directly.
4. Wind Speed Forecasting
Climate change presents new challenges for power grid operation. Strong winds can damage infrastructure by causing galloping power lines, flying branches and debris, and downing power poles. Extreme high or low temperatures create significant demand on power grids. They can cause power lines to expand or contract due to their material composition. Weather variables are random in nature, therefore difficult to model.
Wind speed is difficult to forecast because it is random in nature and therefore there is no probability distribution that totally describes it. [27] compares four different distributions: a 2-parameter Weibull, 3-parameter Weibull, Gamma, and Lognormal distributions to ascertain the most suitable. Table 2.2 shows the results applied to wind data. The 3-parameter Weibull outperforms the other distributions, but none are significantly fit. Statistically, these distributions are interpretable, but a more flexible distribution may be useful here.
Statistical models are usually limited to short term prediction, but hybrid models seek to overcome this [28]. GP regression combined with other meteorological data and atmospheric stability ratings on public data from UK weather stations outperformed the current numerical method. However, it was somewhat location dependent. Furthermore, this method was interested in wind prediction to improved wind power output prediction more accurately, not specifically for forecasting power grid loads. Other research in hybrid models combing GPs with RNN similarly seeks to increase prediction accuracy while maintaining the probabilistic properties of GPs [29]. This method uses GP to provide necessary information to enhance the RNN model. The authors applied this method to data from the National Wind Energy Technology Center to assess its accuracy. The method outperforms other state of the art methods in terms of RMSE, but accuracy decreases as the forecast step increases and computational time was not reported.
A sparse GP with moving window strategy is proposed for predicting wind gusts, specifically [30]. Historical data from numerical weather prediction (NWP) and the European Center for Medium-Range Weather forecasts (ECMWF), as well as observed data from the 2022 Winter Olympics were used to train and validate the proposed method. Compared to the ECMWF, GP regression, random forest, ECMWF-Sparse GP regression, and ECMWF-multiple linear regression models, the proposed method outperforms the others in both short term and long term forecasting. The authors note that the spatial correlation of the input variables may be affecting the accuracy of this method. In addition to the sparse method, the moving window is meant to reduce computational complexity, although computational times are not reported.
An application using Warped Gaussian Process (WGP) is presented in [31]. The authors use sparse online WGP in order to account for the time-based data and the high computational cost associated with WGP. Once again, the purpose of this analysis is to better predict wind power production. On data from an actual wind farm, the proposed method was competitive with GP and splines quantile regression. However, future work would improve hyperparameter estimation, include heteroscedasticity, changes in wind direction, and terrain. Figure 4 shows the wind power production compared to the observed data and with confidence intervals. The results show the flexibility of WGP in action.
5. Physics Based Modeling
Physics based simulation is a process to model a dynamic system using the laws of physics. The appeal of physics-based models is the innate reflection of the physical world (time and space) and the generalizability. Artificial intelligence methods like machine learning perform quickly and with high accuracy, but at times are intractable and may not be utilizing statistical frameworks to their advantage. The drawback of statistical methods in big data applications is the large computational costs associated with using them. However, new methods have developed that reduce computational time while using the power of statistics in data analysis.
5.1. Spatial Statistics
A common problem in large datasets from remote sensing applications is incomplete lattice, or missing data. A multi-output GP regression combines data from multiple sensors with time series to understand their statistical relationship [32]. This application is meant to fill the gaps in the data left by some remote sensing operations, in this case, the gaps created by cloud cover in satellite images. Incorporating a time series allows for GPR prediction to estimate the data in time based on multiple different sensors while accounting for the relationships among the sensors. The authors applied this method to various vegetation land cover areas of interest. Since crop growth will differ with seasons, the authors further explored their method based on pixel information for spatial analysis in addition to the time series. In the short term, the proposed multioutput method outperforms standard GP, but computational complexity remains an issue for this method. In general, long term prediction using the proposed method is not highly accurate, but the interpretability of this method still stands out.
A new approach using Bayesian and Maximum Likelihood Estimation (MLE) is proposed in [33] to address this problem. A Markov chain Monte Carlo (MCMC) approach is taken for Bayesian inference and a Monte Carlo expectation-maximization algorithm for MLE. The approach was evaluated using simulated data (different lattice sizes and missingness) and real world data from the satellite sea surface temperatures in the Pacific Ocean (see Figure 5). Bayesian estimation incorporates prior knowledge and quantifies uncertainty but is computationally expensive and statistically complex. MLE offers simplicity and computational efficiency at the expense of explicit uncertainty quantification. Further research should explore hybrid approaches that combine the strengths of both methods for parameter estimation in GPs.
A divide-and-conquer strategy strategy within the Bayesian paradigm addresses scalability in spatial process modeling for geostatistical data [34]. The authors introduce the concept of ”spatial meta-kriging” (SMK), which involves partitioning the data into subsets, analyzing each subset using a Bayesian spatial process model, and then obtaining approximate posterior inference for the entire dataset by combining the individual posterior distributions from each subset. The approach offers full posterior predictive inference at arbitrary locations for the outcome as well as the residual spatial surface after accounting for spatially oriented predictors. The authors provide theoretical results and empirical illustrations using different simulation experiments and a geostatistical analysis of Pacific Ocean Sea surface temperature data. This article highlights the importance of addressing scalability issues in spatial process modeling and provides a practical and intuitive approach for analyzing massive spatially and temporally indexed databases. Areas of future work include scalable inference in two different situations: when spatio-temporal interpolation is sought at discrete time-points (e.g., monthly or yearly data), and when spatiotemporal interpolation is sought at arbitrary locations and timepoints. Additionally, multivariate spatial data analysis is an unexplored avenue.
New methods proposed in [35] highlight the limitations of using stationary kernels and the need for nonstationary kernels to model complex spatio-temporal processes. The authors introduce a new class of nonstationary kernels that can be learned from the data using a spectral representation of the covariance function and a GP regression model. Nonstationary random Fourier features are a type of kernel method that can be used to model nonstationary covariance functions in spatial statistics. Nonstationary kernels depend on the inputs themselves, unlike stationary kernels, which only depend on the lag vector between two points. The proposed method for learning nonstationary kernels from the data is to use a spectral representation of the covariance function. The frequencies used in the feature maps are treated as kernel parameters that are optimized by maximizing the log-marginal likelihood. Other examples of nonstationary kernels for this type of modeling are the polynomial kernel and the neural network kernel. The authors applied this method to daily high stock prices and temperature data. Overall, the results show that nonstationary kernels of arbitrary complexity were as easy to implement as stationary kernels but gain in computational efficiency.
Much of the image processing in the past was focused on aerial and satellite images with low spatial resolution. As very high-resolution imaging becomes more accessible, complex scenes require different methods to classify images. A novel framework using semantic segmentation and higher-order conditional random fields (CRF) exploits the range of contextual information available with higher order CRF [6]. The author’s approach uses a harmonic label co-existence (which is typical), but they also introduce local object co-occurence. This method ensures more practical labeling by penalizing unexpected label combinations and labels that rarely occur together (i.e., a tree segment should not appear be surrounded by car segments). The authors combat high computational costs with movemaking graph cuts. Compared to other methods, HCRF had the highest accuracy, cleared noisy labeling, and resulted in the most practical labels.
5.2. Low Rank and Sparse Approximation
Huang and Sun developed a hierarchical low rank approximation scheme for maximum likelihood estimation that is computationally efficient for large datasets [36]. The generalized hierarchical low rank approximation method (HLR) diverges from other methods by completing a low rank approximation for each hierarchy, meaning the approximated covariance is not low rank. Computational efficiency is gained by doing many more small calculations of eigenvalues and eigenvectors but avoiding the entire eigendecompositon. A numerical study, simulation study, and real-world study were conducted comparing HLR to several other methods. The numerical study shows HLR outperforms other methods in terms of dependence, smoothness, and noise level, and improves approximation. The simulation study reveals HLR outperforms other methods in terms of mean square error and the real-world study shows better performance based on likelihood. However, in the real-world study, a neural network performed faster than HLR.
Alternate formulations of the proposed hierarchical nearest neighbor Gaussian process (NNGP) models [37] expand on the previous work. In this case, the focus exploiting the sparsity of large spatial datasets. The NNGP model took multiple forms: the collapsed NNGP, the reponse NNGP, and the conjugate NNGP. The collapsed NNGP uses a Markov chain Monte Carlo (MCMC) to sample from the posterior and create an NNGP model capable of posterior predictive inference. This model operates most closely to a full GP model but remains computationally expensive since it recovers random spatial information and makes predictions. The response model similarly samples from the posterior to create a posterior predictive inference response NNGP, however, it does not fully recover latent information. To its advantage, this reduces computational cost while allowing for full Bayesian analysis and prediction at arbitrary locations. The conjugate NNGP is the most well-rounded because it retains the computational efficiency of the response and gives exact Bayesian inference. The computational advantage is the result of sampling from the marginal posterior distributions instead of the posterior. However, the conjugate NNGP introduces a hyperparameter that requires tuning. The authors’ work is the first to successfully use full Bayesian analysis on a spatial dataset at a scale of five million locations. Future work in this area would include analysis of spatial datasets from non-stationary processes, an appropriate application for AIMS, which will use drones equipped with LiDAR for the purposes of monitoring a power substation.
Fast evaluation of the likelihood for parameter inference in large datasets is also explored with Vecchia approximations [8]. Vecchia approximations are a class of approximations that reduce the computational complexity of GPs by exploiting the spatial structure of the data. The authors discuss two different variable orderings for the Vecchia approximation: response-first ordering and latent-first ordering. In response-first ordering, the response variables are ordered first, followed by the latent variables. This ordering is useful when the response variables are of primary interest and the latent variables are used to model the spatial dependence (the opposite for latent-first ordering). There are three different schemes for response-first ordering: full conditioning, partial conditioning, and no conditioning and two different schemes for latent-first ordering: full conditioning and no conditioning. A simulation reveals that the low-rank and sparse approximations did well in both accuracy and computational efficiency. Furthermore, the choice of variable ordering and conditioning have significant impact on both. The first-order methods were also applied to data from a real-world Orbiting Carbon Observatory 2 satellite with similar results (see Figure 6).
5.3. Spectral Applications
Class specific random forest (CSRF) successfully combine machine learning and stochastic processes [38]. CSRF, created by the authors, combines cross-correlation measures into random forest applications for classifying hyperspectral images. Spectral-spatial cross-correlation preserves the spectral-spatial components of the image and then uses class specific trees to classify the image. Applying CSRF to an Indian Pines Dataset and a Washington, D.C. mall Dataset reveals that CSRF outperforms support vector machine (SVM) methods and achieves the highest accuracy when combined with a composite kernel. That said, CSRF would benefit from future efforts in parameter tuning and computational cost analysis.
Change detection is the process of identifying and quantifying changes in remotely sensed images. Detecting changes in these images is challenging due to variations in lighting conditions, sensor characteristics, and geometric distortions. This is only made more complicated by multimodal sensor systems. A Bayesian approach to change detection is explored with the proposal of an unsupervised pixel pairwise-based Markov Random Field (MRF) model for multimodal change detection in remote sensing images [5]. MRF captures spatial relationships between pixels in remotely sensed images by incorporating contextual information and dependencies between neighboring pixels. The MRF framework effectively models the spatial interactions by defining an energy function that incorporates the pairwise potentials and assigns labels to each pixel. This approach includes local and global contextual cues, leading to improved accuracy. MRF outperformed other models in both accuracy and computational efficiency. Future work should focus scalability and the potential for real-time change detection applications.
A GPR method addresses the added complexity of panoramic images [39] in an object detection application. The proposed method accounts for geometric distortions and object pose mismatches while employing a sparseness constraint to address the high dimensionality problems that GPR faces. The model learned hyperparameters and trained offline and then the authors used an online method for detection. An application to Regions of Interest from panoramic images for car detection demonstrated its success in terms of Receiving Operator Characteristic (ROC). The proposed GPR method was more successful in terms of a high positive identification rate and a low false identification rate compared with a direct classification with no preprocessing and classification after warping the images into perspective patches. This method is clearly accounting for geometric distortions and pose mismatches, but should be compared to methods like CNN. Furthermore, how the Region of Interest is determined was not reported on in the article.
Real-time anomaly detection is an important factor of power grid monitoring and key to AIMS’ goals. Current methods are limited by the assumption that signals are stationary, which is not practical in a real-world scenario. A novel method using the spectral correlation function (SCF) allows for improved characterization of grid-signal distortions because it evaluates non-stationary signals [40]. This methods uses the correlation between spectral components of a signal to extract meaningful features. The authors applied SCF to real-world data from the Grid Event Signature Library and compared it to the methods amplitude-phase (AP), Fast Fourier Transform (FFT), power spectral density (PSD) using t-Distributed Stochastic Neighbor Embedding (t-SNE). SCF outperformed the other methods in terms of distinctive grouping and distinguished between anomaly events. Future work includes classifying multiple types of grid signatures and using non-linear models.
5.4. Gaussian Process Emulators
One particular type of physics-based GP is called an emulator. An emulator, also called a surrogate or proxy model, builds a statistical model meant to mimic a particular process [41] [7]. The advantage of emulators over full GPs is the increased computational efficiency while resulting in tractable models that can produce confidence intervals. Emulators focus on the use of physics-aware GPs in remote sensing and their implications for accurate and interpretable predictions. Figure 7 illustrates the general process. A Joint GP model combining actual data with simulated data, a latent force model (LFM) that encodes ordinary differential equations, and Automatic Gaussian Process Emulator (AGAPE) for forward and inverse modeling with automatic emulation [41] explore emulators as generators. Simulated data from a same-site scenario versus a cross-site scenario was evaluated to determine if the inclusion improved prediction accuracy. Although the Joint GP model did not outperform a full GP method, it did show that it is a safe way to combine simulated data with real data. The GP-LFM model combines data driven Bayesian approaches with purely mechanistic models can be a generative model, it maintains interpretability, and it shows good extrapolation capabilities. However, there is significant computational cost to this method and is only applicable to differentiable processes. In a toy example with multi-output and scalar inputs, AGAPE outperformed other methods in approximating the underlying function it was emulating. However, this method’s success is very dependent on choosing good starting points.
Emulators are further studied by using active learning to mimic complex and costly computational codes in a multioutput setting [7]. Here, the authors refer to a generic active emulation (AE) function and active multi-output Gaussian process emulator (AMOGAPE). They focus on a sequential method that uses an acquisition function that is optimized via gradient based methods. In this case, the authors apply AMOGAPE as a GP interpolator and regression formulation to synthetic and real-world data. They compared AMOGAPE to other sequential and non-sequential methods using synthetic data. In both cases, AMOGAPE outperformed other available methods as the number of nodes increased. Finally, the authors applied AMOGAPE to leaf canopy PROSAIL radiative transfer model (RTM) in two dimensional and three-dimensional space. Once again, AMOGAPE outperforms random sampling in both cases. Future work involves using alternative acquisition and kernel functions, as well as performance measures other than root mean square error.
5.5. Additional Gaussian Applications
The aforementioned problems with traditional GPs are addressed by utilizing Deep Gaussian Processes (DGP) that account for complex kernel processes, scale to large datasets, and improve prediction accuracy [9]. DGP creates hierarchies of GP models in a similar structure to deep neural networks. This setup improves computational efficiency since it can model multiple simple kernels, as opposed to a complex kernel required by some GP models. The authors applied this method to superspectral sounding data with multiple models: a full GP model, a sparse GP model, and DGPs with one to four layers. DGPs with two or more layers outperform the full GP model and are more computationally efficient.
Learning control-oriented models involving the development of optimal experiment design, receding horizon optimal control, and continuous model improvement are also available for GP applications [11]. Data-driven control strategies are possible with the integration of GPs in control frameworks because they can model system uncertainties/anomalies and predict behavior. Over time, the incorporation of prior knowledge will allow for optimized control actions and more adaptability within system dynamics. A case study of a simulated electricity grid with real world data verified this method in a ”demand response” problem. This research provides a valuable framework for bridging machine learning and controls for physical systems by using GPs. Further research should focus on addressing scalability and real-time implementation.
A truly autonomous system requires no user intervention. Practically speaking, in some applications this is not possible. In practice, data does not always follow a Gaussian distribution, so it is transformed (usually with a logarithmic or exponential function). A Warped Gaussian Process (WGP) addresses this by using a model that automatically learns the optimal transformation by ”warping” the predictions of a standard GP model and using continuous optimization to infer the parameters [42]. Another advantage of WGP is that the learned warping function is accessible. The authors compared the performance of the novel WGP to standard GP and variational heteroscedastic GP (VHGP) through three different experimental applications: the estimation of ocean chlorophyll concentration, vegetation parameter retrieval, and causal inference in a set of 28 geosciences problems. The chlorophyll experiment revealed that WGP outperforms standard GP and VHGP in all comparisons when using raw data. Vegetation parameter retrieval also showed that WGP had lower uncertainty and more homogenous results. Finally, WGP performed better than the other methods in causal inference. These combined results show that WGP performs well and has explanatory capabilities. Future work would benefit from WGP applications to nonparametric functions.
6. Exploration
One element of drone navigation is exploration. Programming a specific path for a drone can be efficient in scenarios where the operation is routine, however, in the case that an event is not routine, an autonomous drone needs to be able to make path decisions. In these events, a drone may need to be deployed to gather information and would ideally know when it has collected enough or must continue searching. GPs can determine the best trajectory based on available data while measuring the uncertainty of the unexplored area, i.e., what is the probability that an unexplored area would have new, valuable information.
Modern remote sensing provides a novel way to characterize important features of unexplored phenomena of interest [43]. The authors treat the combination of the available measurements and the probable uncertainty as an optimization problem. Parameters that estimate the cost of maneuvering are also incorporated. The authors evaluate this process in a simulated space exploration with test cases that emphasize and de-emphasize exploration. Case 1 favored exploration over data refinement, Case 2 placed less emphasis on exploring the whole field of interest, Case 3 decreases emphasis on exploration over time as data is collected, and Case 4 made emphasis on exploration dependent on the cost to perform maneuvering. Best performance occurred under conditions that favor exploration. Figure 8 shows the comparison in for all four cases.
The autonomous exploration of unknown phenomena is further investigated via a process termed ”informative planning” [44]. In this case the focus is on long-term planning, where the computational expense remains a continuous problem as data accumulates. Therefore, the authors use Sparse Online Gaussian Processes (SOGP) to reduce high computational costs. Online learning is pertinent here as the SOGP needs to incorporate the temporal variation of the environment, reestimating the hyperparameters when needed. This process needs spatio-temporal cues to justify the computational cost of any updates. The authors applied this method to a simulated ocean environment using real world salinity data. When hyperparameters were manually set, performance was weak, but data-driven selection improved performance and reflected ground truth.
7. Energy Harvesting
Energy harvesting is crucial in remote sensing operations. EH refers to the process of harnessing energy from external sources (i.e. wind, solar, etc.) and storing it [45]. A critical component of the AIMS project is the use of drones and sensors, which have a finite battery life. Charging stations, drones, sensors, etc. need to record battery level so that the system can make decisions accordingly. Drones need to retain enough battery to return to their charging stations and sensors need to indicate low battery life to the main control system to ensure their timely replacement. Adding stochastic processes to this system can create more efficient operation over drone and sensor battery life. Furthermore, electric field energy harvesting is of interest to power grid operations in general [46].
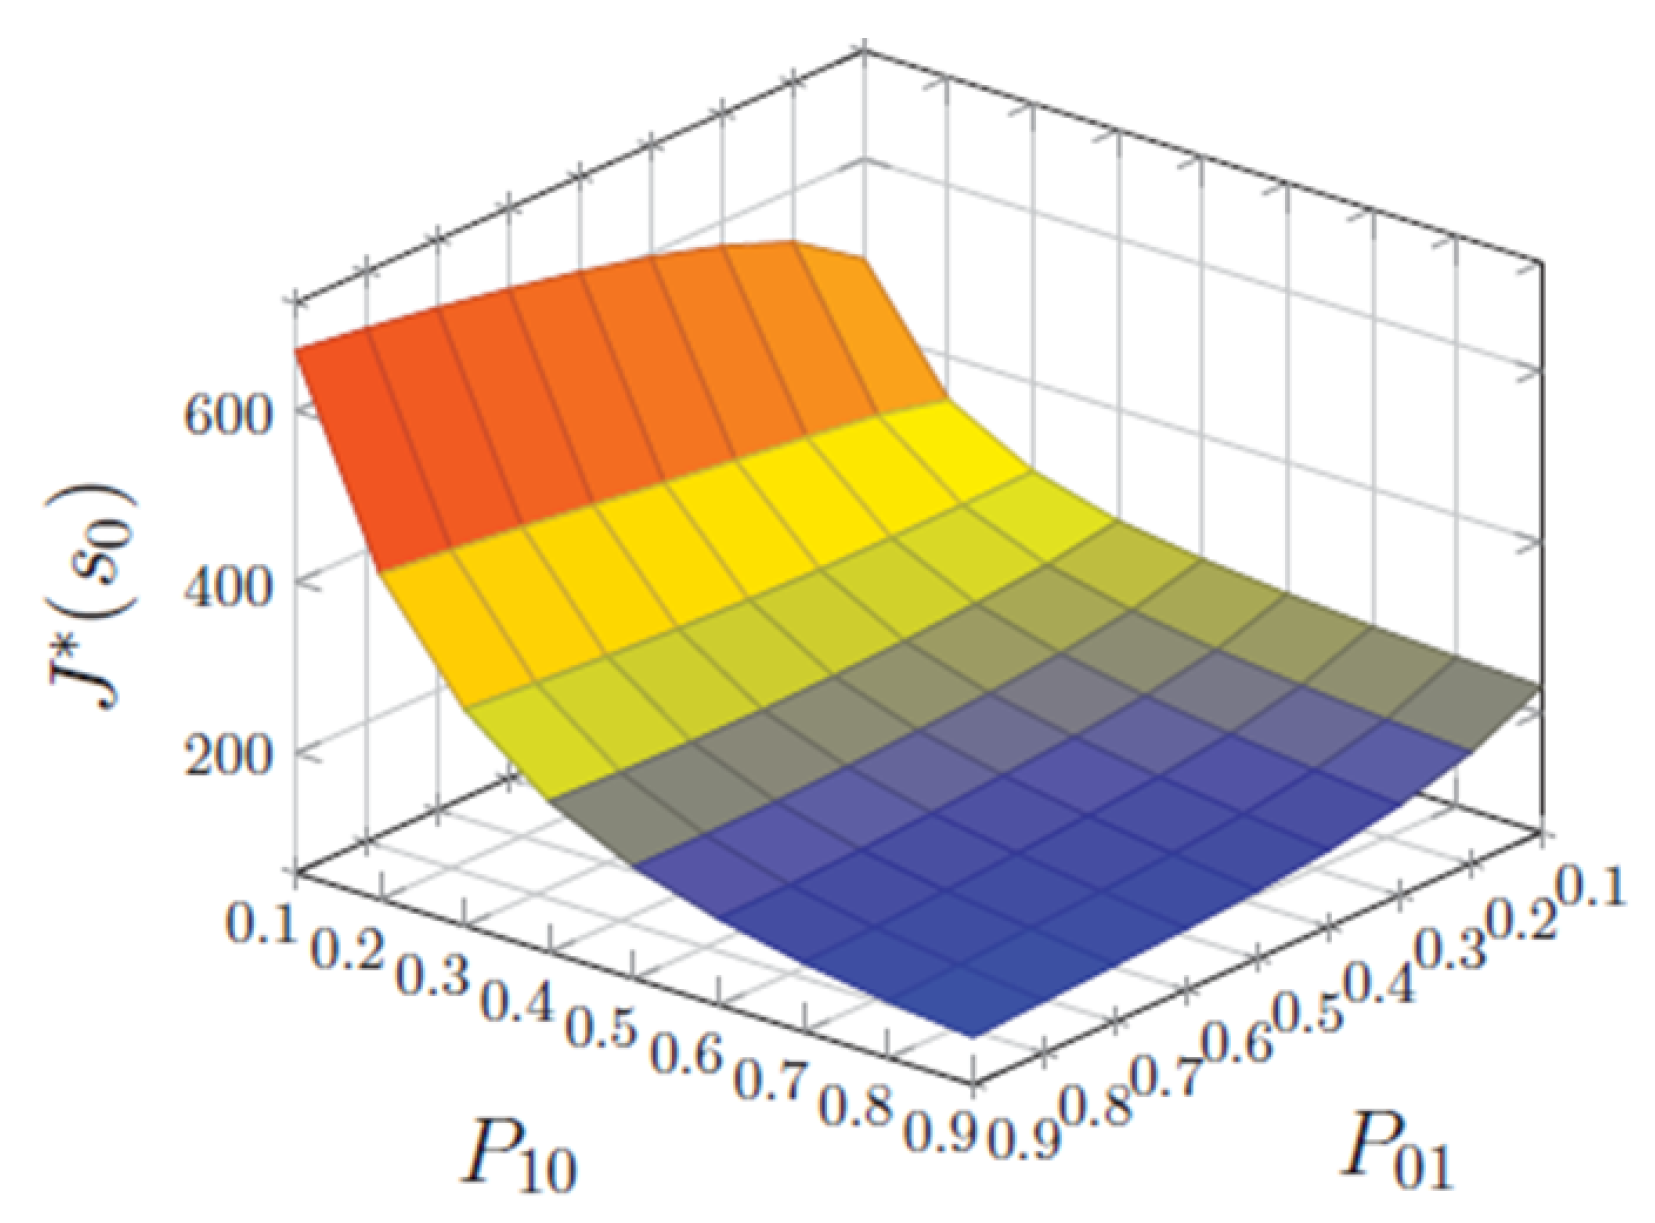
A novel method using an Age of Information (AOI) based status update system for a two-state stochastic process extends recent AOI research by considering the state of the stochastic process (normal or alarm) and when the status has changed but the monitoring application has not been informed [47]. The system consists of an energy harvesting sensor that sends status updates to a destination node under the condition that that the stochastic process will be in one of two states, normal or alarm, for a certain amount of time. At every timeslot the sensor generates a status update and then determines if the monitoring application is advised. If there is a state change, the system should leverage that with the AOI at the destination node to determine if an update is desirable given energy resources. Consideration of all these variables is a cost minimization problem to determine the best energy harvesting policy, achieved using a Markov Decision Process. The authors conclude that reserving energy is necessary to prepare for unexpected, long periods of an alarm state. In practical terms, status updates will be less frequent during a normal state and much more frequent during an alarm state, as shown in Figure 9.
8. Conclusion
This review highlights notable progress in leveraging Gaussian processes in remote sensing applications. The integration of the computational capabilities provided by machine learning and the analytical tractability of Gaussian analysis presents an advantageous combination. While much of the existing work in this field has primarily focused on simulated or theoretical applications, future work should focus on opportunities to translate these efforts into practical, real-time evaluation. Implementing these techniques will enhance the ability to effectively manage the power grid in a dynamic environment using the physics based data associated with its processes. Further research has the potential for significant advancements in grid monitoring, strengthening the ability to detect and respond to emerging threats, such as physical attacks, cyber-attacks, and the adverse impacts of climate change.
Funding
This research was supported by the Department of Energy Office of Electricity.
Conflicts of Interest
The authors declare no conflict of interest.
References
- Weiss, M.; Weiss, M. An assessment of threats to the American power grid. Energy, Sustainability and Society 2019, 9. [Google Scholar] [CrossRef]
- International Energy Agency (2023). Energy Efficiency 2023. IEA, Paris. Licence: CC BY 4.0.
- Department of Energy. Electric Emergency and Disturbance (OE-417) Events, 2023.
- Fuhr, P. Pilates (M617000251), 2022.
- Touati, R.; Mignotte, M.; Dahmane, M. Multimodal Change Detection in Remote Sensing Images Using an Unsupervised Pixel Pairwise-Based Markov Random Field Model. IEEE Transactions on Image Processing 2020, 29, 757–767. [Google Scholar] [CrossRef] [PubMed]
- Liu, Y.; Piramanayagam, S.; Monteiro, S.T.; Saber, E. Semantic segmentation of remote sensing data using Gaussian processes and higher-order CRFS. 2017 IEEE International Geoscience and Remote Sensing Symposium (IGARSS), 2017, pp. 5454–5457. [CrossRef]
- Svendsen, D.H.; Martino, L.; Camps-Valls, G. Active emulation of computer codes with Gaussian processes –Application to remote sensing. Pattern Recognition 2019, 100, 107103. [Google Scholar] [CrossRef]
- Katzfuss, M.; Guinness, J.; Gong, W.; Zilber, D. Vecchia Approximations of Gaussian-Process Predictions. Journal of Agricultural, Biological and Environmental Statistics 2020, 25, 383–414. [Google Scholar] [CrossRef]
- Svendsen, D.H.; Morales-Álvarez, P.; Molina, R.; Camps-Valls, G. Deep Gaussian Processes for Geophysical Parameter Retrieval. IGARSS 2018 - 2018 IEEE International Geoscience and Remote Sensing Symposium, 2018, pp. 6175–6178. [CrossRef]
- Zhang, A.; Lipton, Z.C.; Li, M.; Smola, A.J. Dive into Deep Learning; Cambridge University Press: Cambridge, United Kingdom, 2023. [Google Scholar]
- Jain, A.; Nghiem, T.; Morari, M.; Mangharam, R. Learning and Control Using Gaussian Processes. 2018 ACM/IEEE 9th International Conference on Cyber-Physical Systems (ICCPS), 2018, pp. 140–149. [CrossRef]
- Rasmussen, C.E.; Williams, C.K.I. Gaussian Processes for Machine Learning; Massachusetts Institute of Technology: Cambridge, MA, 2006. [Google Scholar]
- Tartakovsky, A.M.; Ma, T.; Barajas-Solano, D.A.; Tipireddy, R. Physics-informed Gaussian process regression for states estimation and forecasting in power grids. International Journal of Forecasting 2023, 39, 967–980. [Google Scholar] [CrossRef]
- Ghasempour, A.; Martínez-Ramón, M. Short-Term Electric Load Prediction in Smart Grid using Multi-Output Gaussian Processes Regression. 2023 IEEE Kansas Power and Energy Conference (KPEC), 2023, pp. 1–6. [CrossRef]
- Mitrovic, M.; Kundacina, O.; Lukashevich, A.; Budennyy, S.; Vorobev, P.; Terzija, V.; Maximov, Y.; Deka, D. GP CC-OPF: Gaussian Process based optimization tool for Chance-Constrained Optimal Power Flow. Software Impacts 2023, 16, 100489. [Google Scholar] [CrossRef]
- Mitrovic, M.; Lukashevich, A.; Vorobev, P.; Terzija, V.; Budennyy, S.; Maximov, Y.; Deka, D. Data-driven stochastic AC-OPF using Gaussian process regression. International Journal of Electrical Power & Energy Systems 2023, 152, 109249. [Google Scholar] [CrossRef]
- Yadav, A.; Bareth, R.; Kochar, M.; Pazoki, M.; Sehiemy, R.A.E. Gaussian process regression-based load forecasting model. IET Generation, Transmission & Distribution 2024, 18, 899–910. [Google Scholar] [CrossRef]
- Pareek, P.; Nguyen, H.D. A Framework for Analytical Power Flow Solution Using Gaussian Process Learning. IEEE Transactions on Sustainable Energy 2022, 13, 452–463. [Google Scholar] [CrossRef]
- Cao, D.; Zhao, J.; Hu, W.; Zhang, Y.; Liao, Q.; Chen, Z.; Blaabjerg, F. Robust Deep Gaussian Process-Based Probabilistic Electrical Load Forecasting Against Anomalous Events. IEEE Transactions on Industrial Informatics 2022, 18, 1142–1153. [Google Scholar] [CrossRef]
- Chen, Y.; Lu, Q.; Zhang, Z.; Xu, T.; Yang, Y.; Liu, Y. A Medium/Long-Term Electrical Power and Electrical Energy Balance Method for Power System Considering Extreme Weather. 2023 5th Asia Energy and Electrical Engineering Symposium (AEEES), 2023, pp. 749–752. [CrossRef]
- Chin, J.X.; Hug, G. Formation of ad hoc microgrids for prompt critical load pickup during blackouts by leveraging stochastic distributed energy resources. The Journal of Engineering 2021, 2021, 705–714. [Google Scholar] [CrossRef]
- Guo, Y.; Baker, K.; Dall’Anese, E.; Hu, Z.; Summers, T.H. Data-Based Distributionally Robust Stochastic Optimal Power Flow—Part I: Methodologies. IEEE Transactions on Power Systems 2019, 34, 1483–1492. [Google Scholar] [CrossRef]
- Guo, Y.; Baker, K.; Dall’Anese, E.; Hu, Z.; Summers, T.H. Data-Based Distributionally Robust Stochastic Optimal Power Flow—Part II: Case Studies. IEEE Transactions on Power Systems 2019, 34, 1493–1503. [Google Scholar] [CrossRef]
- Kim, J.; Kim, S. Temperature Estimation Adaptive to Variables over Distance Using Infrared–LiDAR. Applied Sciences 2021, 11. [Google Scholar] [CrossRef]
- Kay, J.; Handcock, R.; Gillespie, A.; Konrad, C.; Burges, S.; Naveh, N.; Booth, D. Stream-temperature estimation from thermal infrared images. IGARSS 2001. Scanning the Present and Resolving the Future. Proceedings. IEEE 2001 International Geoscience and Remote Sensing Symposium (Cat. No.01CH37217), 2001, Vol. 1, pp. 112–114. [CrossRef]
- Jalil, B.; Pascali, M.A.; Leone, G.R.; Martinelli, M.; Moroni, D.; Salvetti, O. To Identify Hot Spots in Power Lines Using Infrared and Visible Sensors. Multimedia and Network Information Systems. Springer International Publishing, 2019, pp. 313–321.
- Pobočíkováa, I.; Sedliačkováa, Z.; Michalkováa*, M. Application of Four Probability Distributions for Wind Speed Modeling. Procedia Engineering 2017, 192, 713–718. [Google Scholar] [CrossRef]
- Hoolohan, V.; Tomlin, A.S.; Cockerill, T. Improved near surface wind speed predictions using Gaussian process regression combined with numerical weather predictions and observed meteorological data. Renewable Energy 2018, 126, 1043–1054. [Google Scholar] [CrossRef]
- Zhu, S.; Yuan, X.; Xu, Z.; Luo, X.; Zhang, H. Gaussian mixture model coupled recurrent neural networks for wind speed interval forecast. Energy Conversion and Management 2019, 198, 111772. [Google Scholar] [CrossRef]
- Wang, H.; Zhang, Y.; Mao, J. Sparse Gaussian process regression for multi-step ahead forecasting of wind gusts combining numerical weather predictions and on-site measurements. Journal of Wind Engineering and Industrial Aerodynamics 2022, 220. [Google Scholar] [CrossRef]
- Kou, P.; Gao, F.; Guan, X. Sparse online warped Gaussian process for wind power probabilistic forecasting. Applied Energy 2013, 108, 410–428. [Google Scholar] [CrossRef]
- Pipia, L.; Muñoz-Marí, J.; Amin, E.; Belda, S.; Camps-Valls, G.; Verrelst, J. Fusing optical and SAR time series for LAI gap filling with multioutput Gaussian processes. Remote Sensing of Environment 2019, 235. [Google Scholar] [CrossRef]
- Stroud, J.R.; Stein, M.L.; Lysen, S. Bayesian and Maximum Likelihood Estimation for Gaussian Processes on an Incomplete Lattice. Journal of Computational and Graphical Statistics 2017, 26, 108–120. [Google Scholar] [CrossRef]
- Guinness, J. Permutation and Grouping Methods for Sharpening Gaussian Process Approximations. Technometrics 2018, 60, 415–429. [Google Scholar] [CrossRef] [PubMed]
- Ton, J.F.; Flaxman, S.; Sejdinovic, D.; Bhatt, S. Spatial mapping with Gaussian processes and nonstationary Fourier features. Spatial Statistics 2018, 28, 59–78. [Google Scholar] [CrossRef]
- Huang, H.; Sun, Y. Hierarchical Low Rank Approximation of Likelihoods for Large Spatial Datasets. Journal of Computational and Graphical Statistics 2018, 27, 110–118. [Google Scholar] [CrossRef]
- Finley, A.O.; Datta, A.; Cook, B.D.; Morton, D.C.; Andersen, H.E.; Banerjee, S. Efficient Algorithms for Bayesian Nearest Neighbor Gaussian Processes. Journal of Computational and Graphical Statistics 2019, 28, 401–414. [Google Scholar] [CrossRef]
- Liu, Z.; Tang, B.; He, X.; Qiu, Q.; Liu, F. Class-Specific Random Forest With Cross-Correlation Constraints for Spectral–Spatial Hyperspectral Image Classification. IEEE Geoscience and Remote Sensing Letters 2017, 14, 257–261. [Google Scholar] [CrossRef]
- Cheng, H.; Liu, Z.; Yang, J. Learning feature transforms for object detection from panoramic images. 2010 IEEE International Conference on Multimedia and Expo, 2010, pp. 643–648. [CrossRef]
- Alaca, O.; Ekti, A.R.; Wilson, A.; Holliman, J.; Piersall, E.; Yarkan, S.; Stenvig, N. Detection of Grid-Signal Distortions Using the Spectral Correlation Function. IEEE Transactions on Smart Grid 2023, 14, 4980–4983. [Google Scholar] [CrossRef]
- Camps-Valls, G.; Martino, L.; Svendsen, D.H.; Campos-Taberner, M.; Muñoz-Marí, J.; Laparra, V.; Luengo, D.; García-Haro, F.J. Physics-aware Gaussian processes in remote sensing. Applied Soft Computing 2018, 68, 69–82. [Google Scholar] [CrossRef]
- Mateo-Sanchis, A.; Muñoz-Marí, J.; Pérez-Suay, A.; Camps-Valls, G. Warped Gaussian Processes in Remote Sensing Parameter Estimation and Causal Inference. IEEE Geoscience and Remote Sensing Letters 2018, 15, 1647–1651. [Google Scholar] [CrossRef]
- Shekaramiz, M.; Moon, T.K.; Gunther, J.H. EXPLORATION AND DATA REFINEMENT VIA MULTIPLE MOBILE SENSORS BASED ON GAUSSIAN PROCESSES. Asilomar Conference on Signals, Systems, and Computers, 2017, pp. 885–889. [CrossRef]
- Ma, K.C.; Liu, L.; Sukhatme, G.S. Informative planning and online learning with sparse Gaussian processes. 2017 IEEE International Conference on Robotics and Automation (ICRA), 2017, pp. 4292–4298. [CrossRef]
- Sanislav, T.; Mois, G.D.; Zeadally, S.; Folea, S.C. Energy Harvesting Techniques for Internet of Things (IoT). IEEE Access 2021, 9, 39530–39549. [Google Scholar] [CrossRef]
- Zeng, X.; Yang, Z.; Wu, P.; Cao, L.; Luo, Y. Power Source Based on Electric Field Energy Harvesting for Monitoring Devices of High-Voltage Transmission Line. IEEE Transactions on Industrial Electronics 2021, 68, 7083–7092. [Google Scholar] [CrossRef]
- Stamatakis, G.; Pappas, N.; Traganitis, A. Control of Status Updates for Energy Harvesting Devices That Monitor Processes with Alarms. 2019 IEEE Globecom Workshops (GC Wkshps), 2019, pp. 1–6. [CrossRef]
Figure 1.
Autonomous Intelligence Measurements and Sensor Systems (AIMS) is a project currently underway in the Electrification and Energy Infrastructures Division of ORNL. This shows an overview of the AIMS operational scenario under some triggering event that requires monitoring [4].
Figure 1.
Autonomous Intelligence Measurements and Sensor Systems (AIMS) is a project currently underway in the Electrification and Energy Infrastructures Division of ORNL. This shows an overview of the AIMS operational scenario under some triggering event that requires monitoring [4].
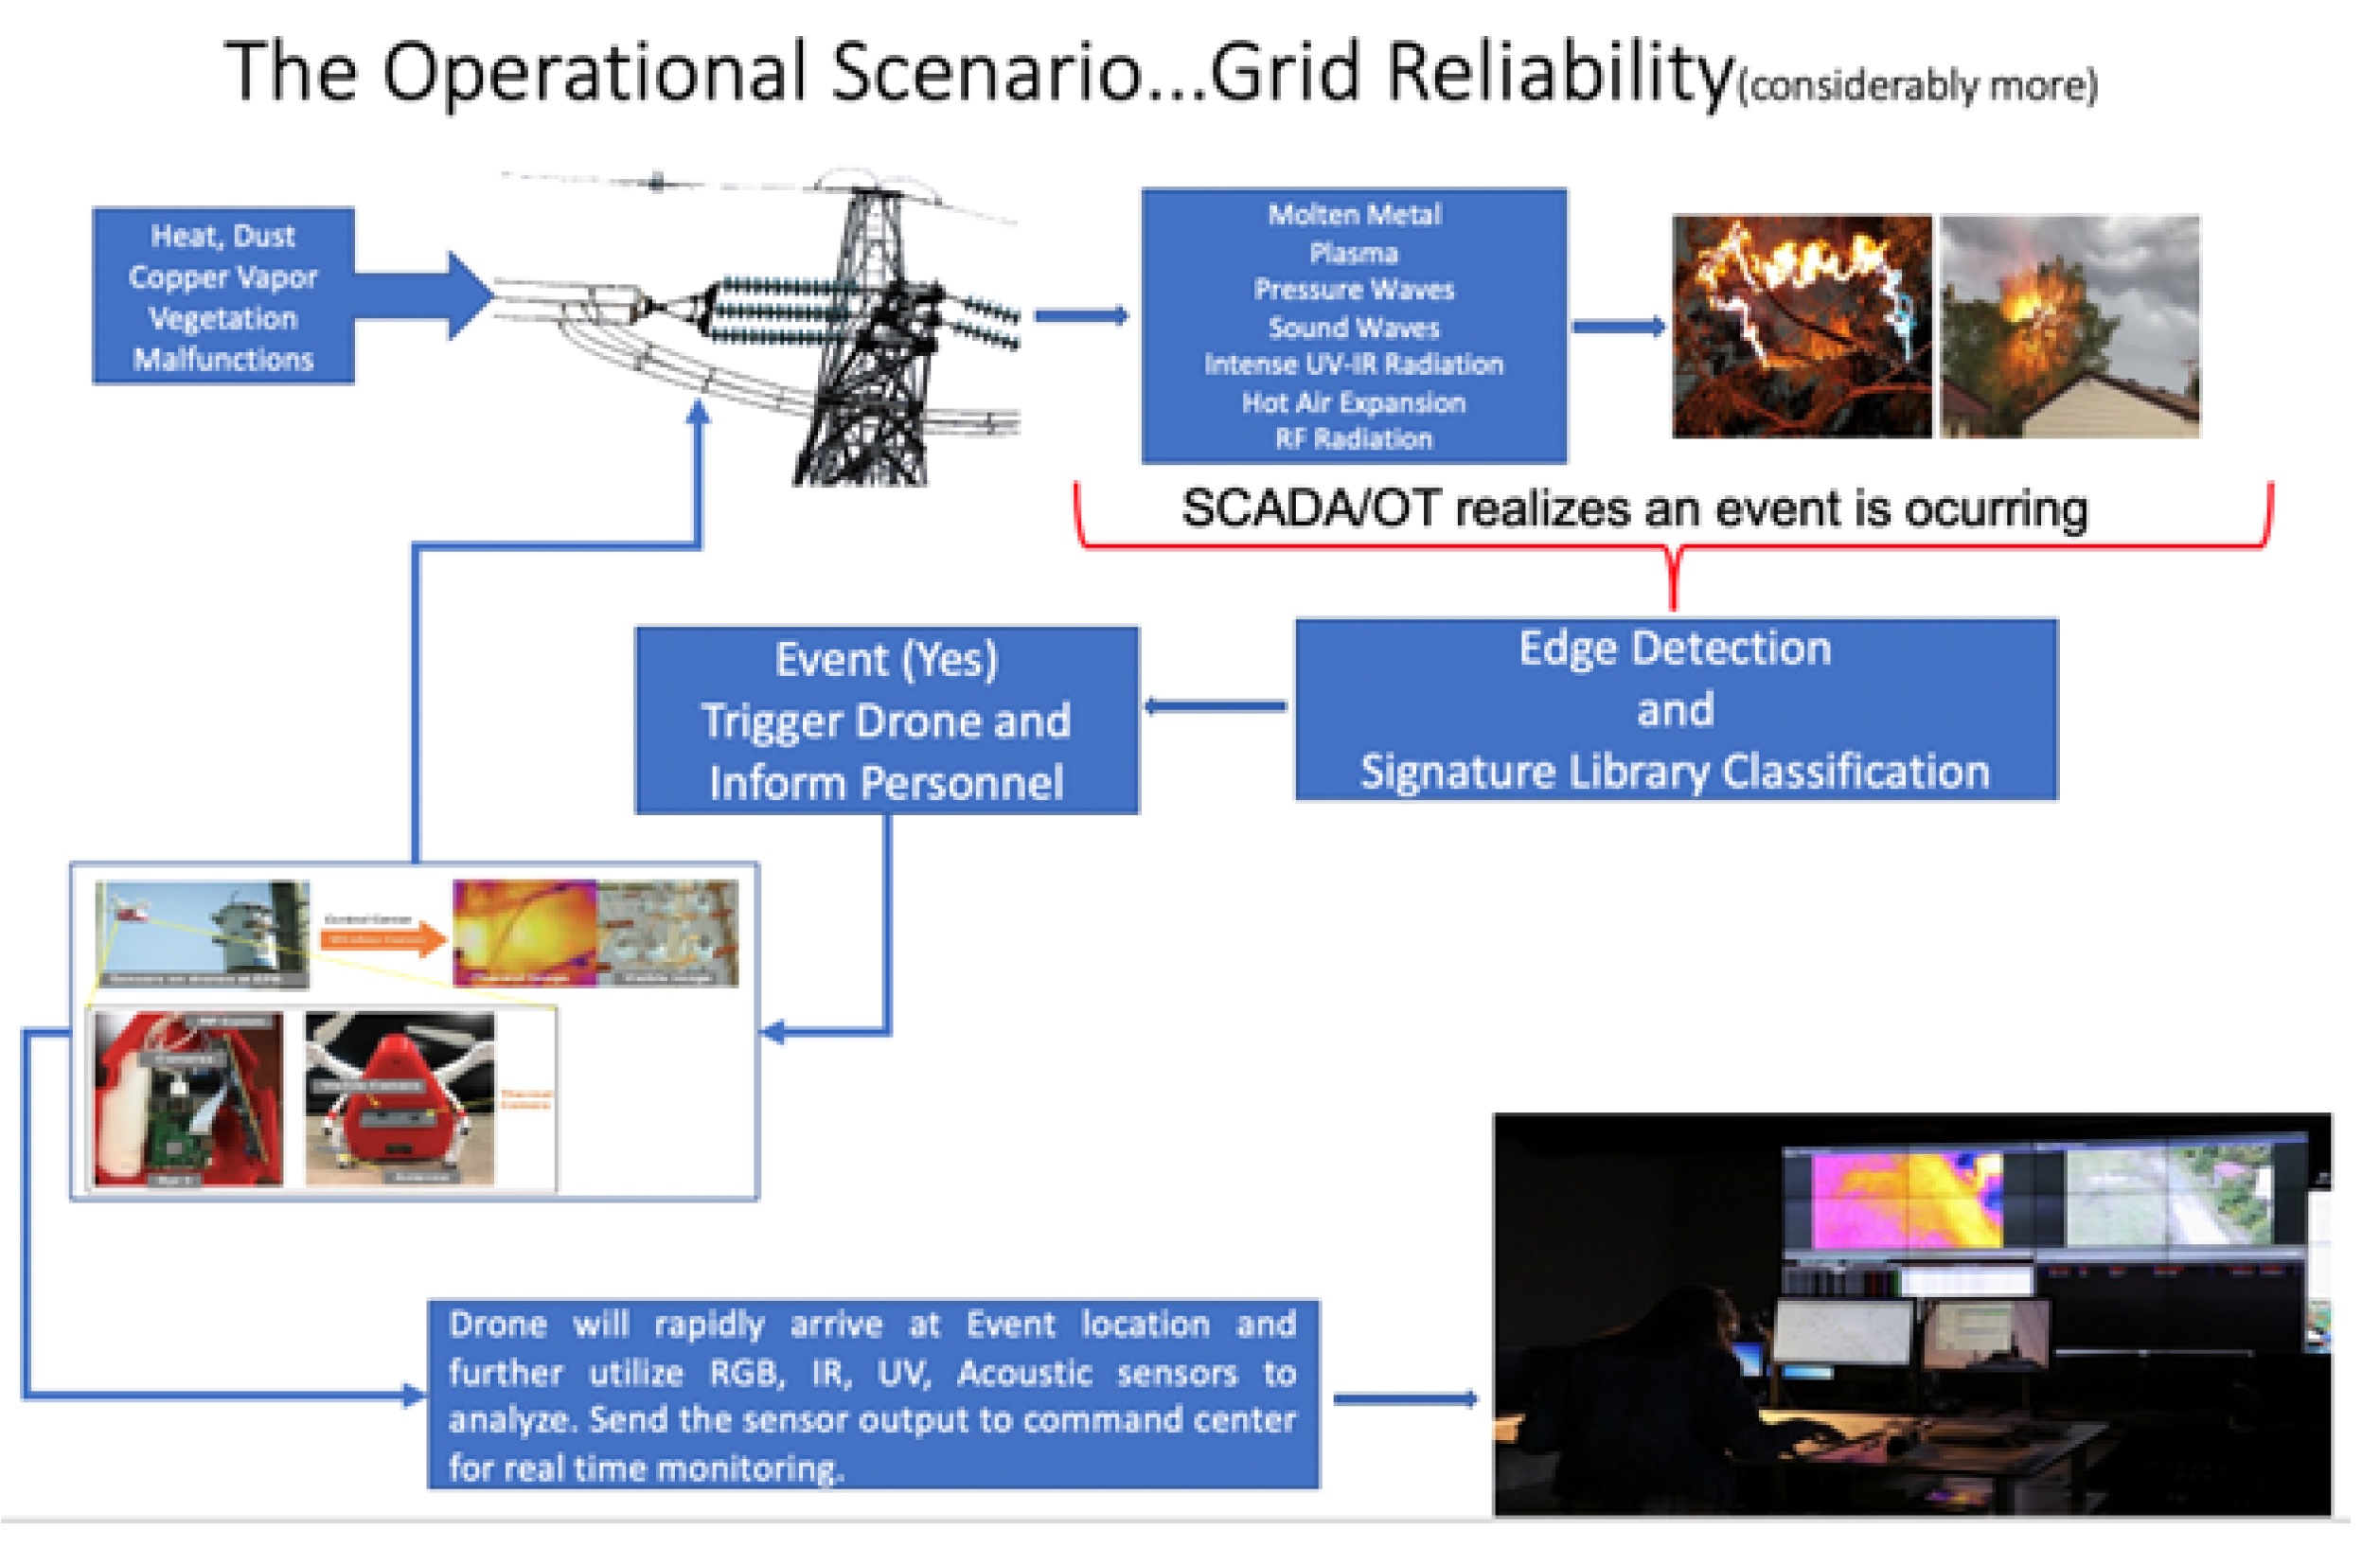
Figure 2.
PhI-GPR (left) and data-driven GPR (right) forecast of with and (k = 1, 2, 3) measurements available for t < 8.3375 s every 0.05 s [13].
Figure 2.
PhI-GPR (left) and data-driven GPR (right) forecast of with and (k = 1, 2, 3) measurements available for t < 8.3375 s every 0.05 s [13].
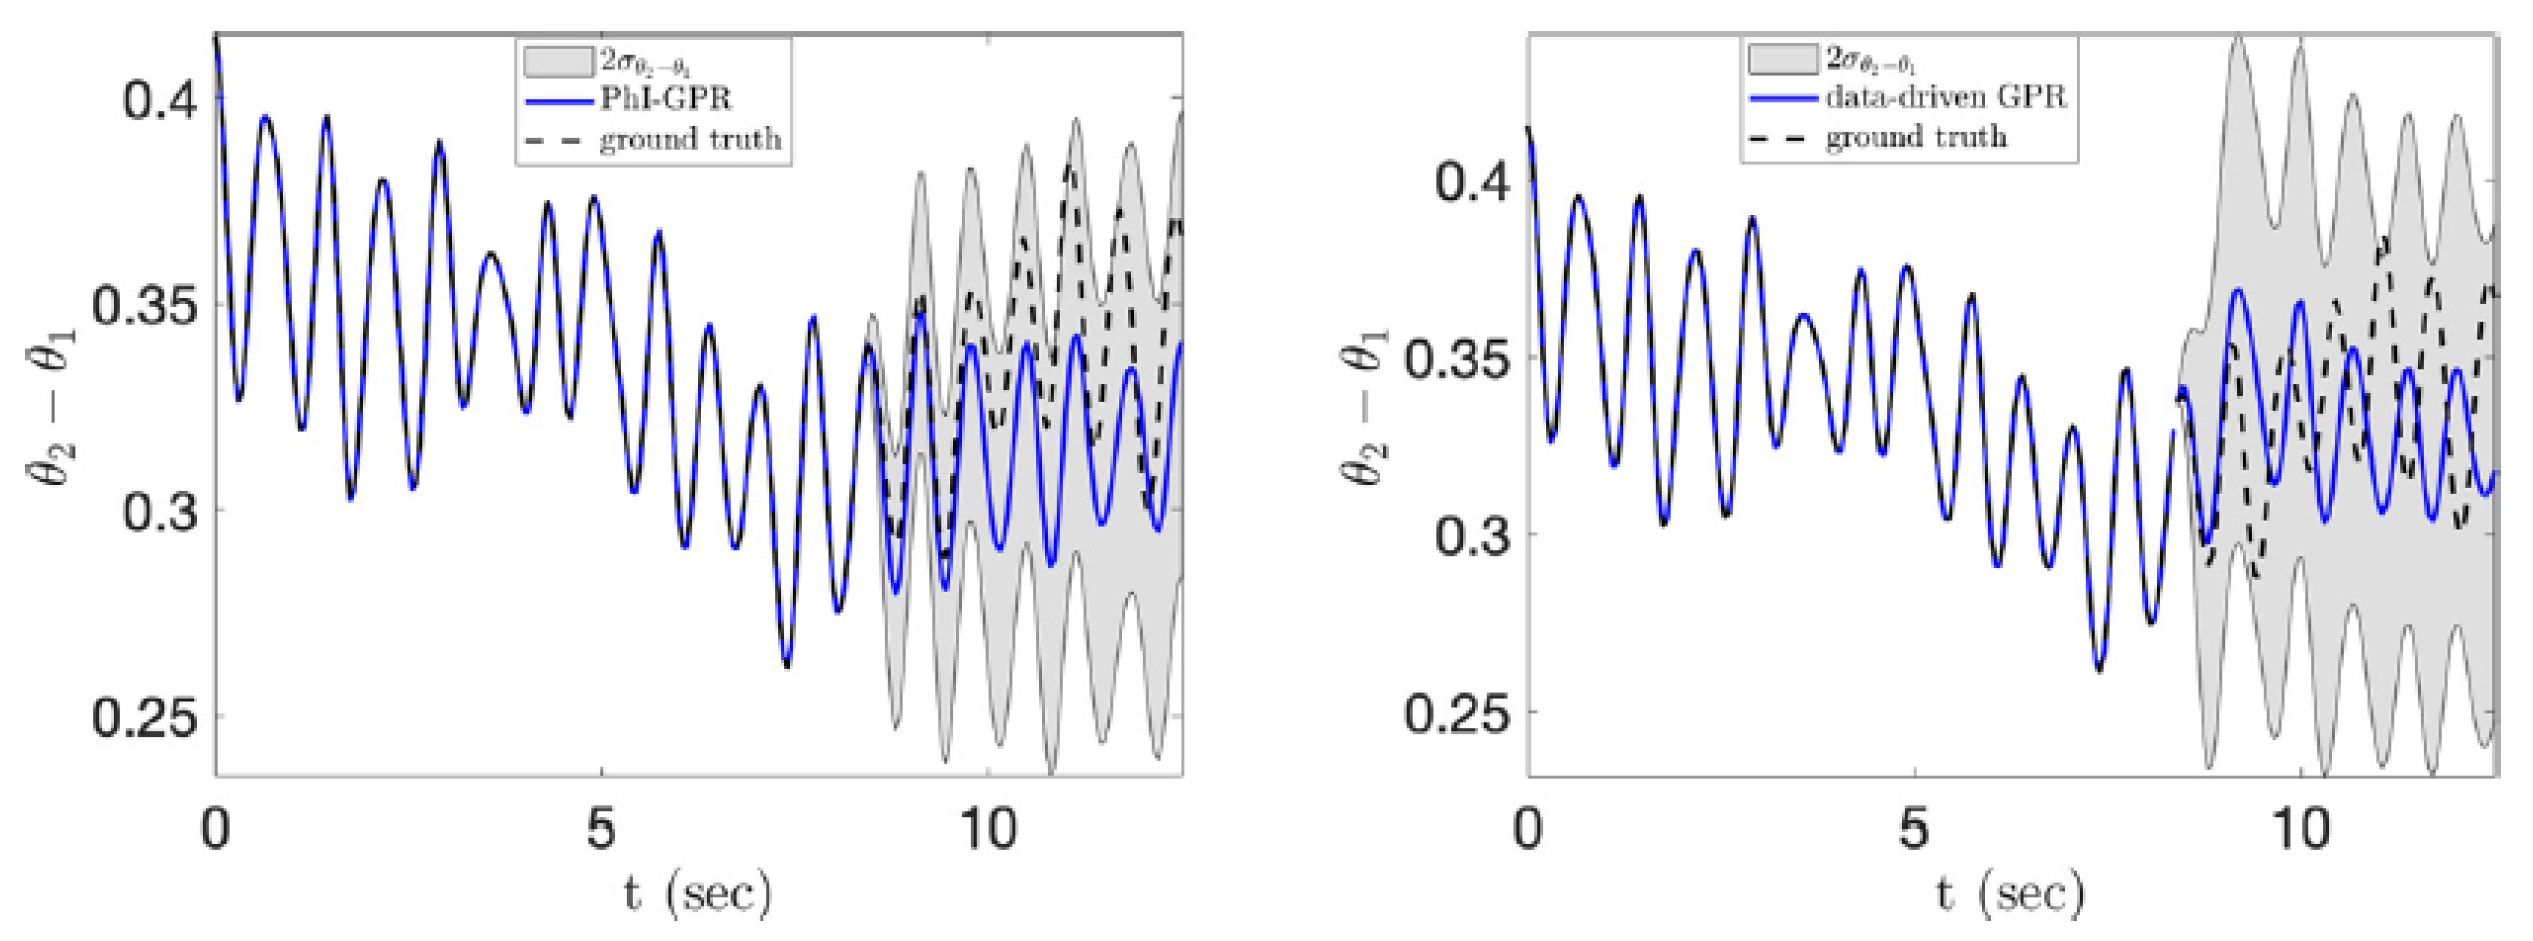
Figure 3.
Probabilistic load forecasting results of various methods for Seattle. (a) SGP. (b) VAE-DGP. (c) Proposed DGP method [19].
Figure 3.
Probabilistic load forecasting results of various methods for Seattle. (a) SGP. (b) VAE-DGP. (c) Proposed DGP method [19].
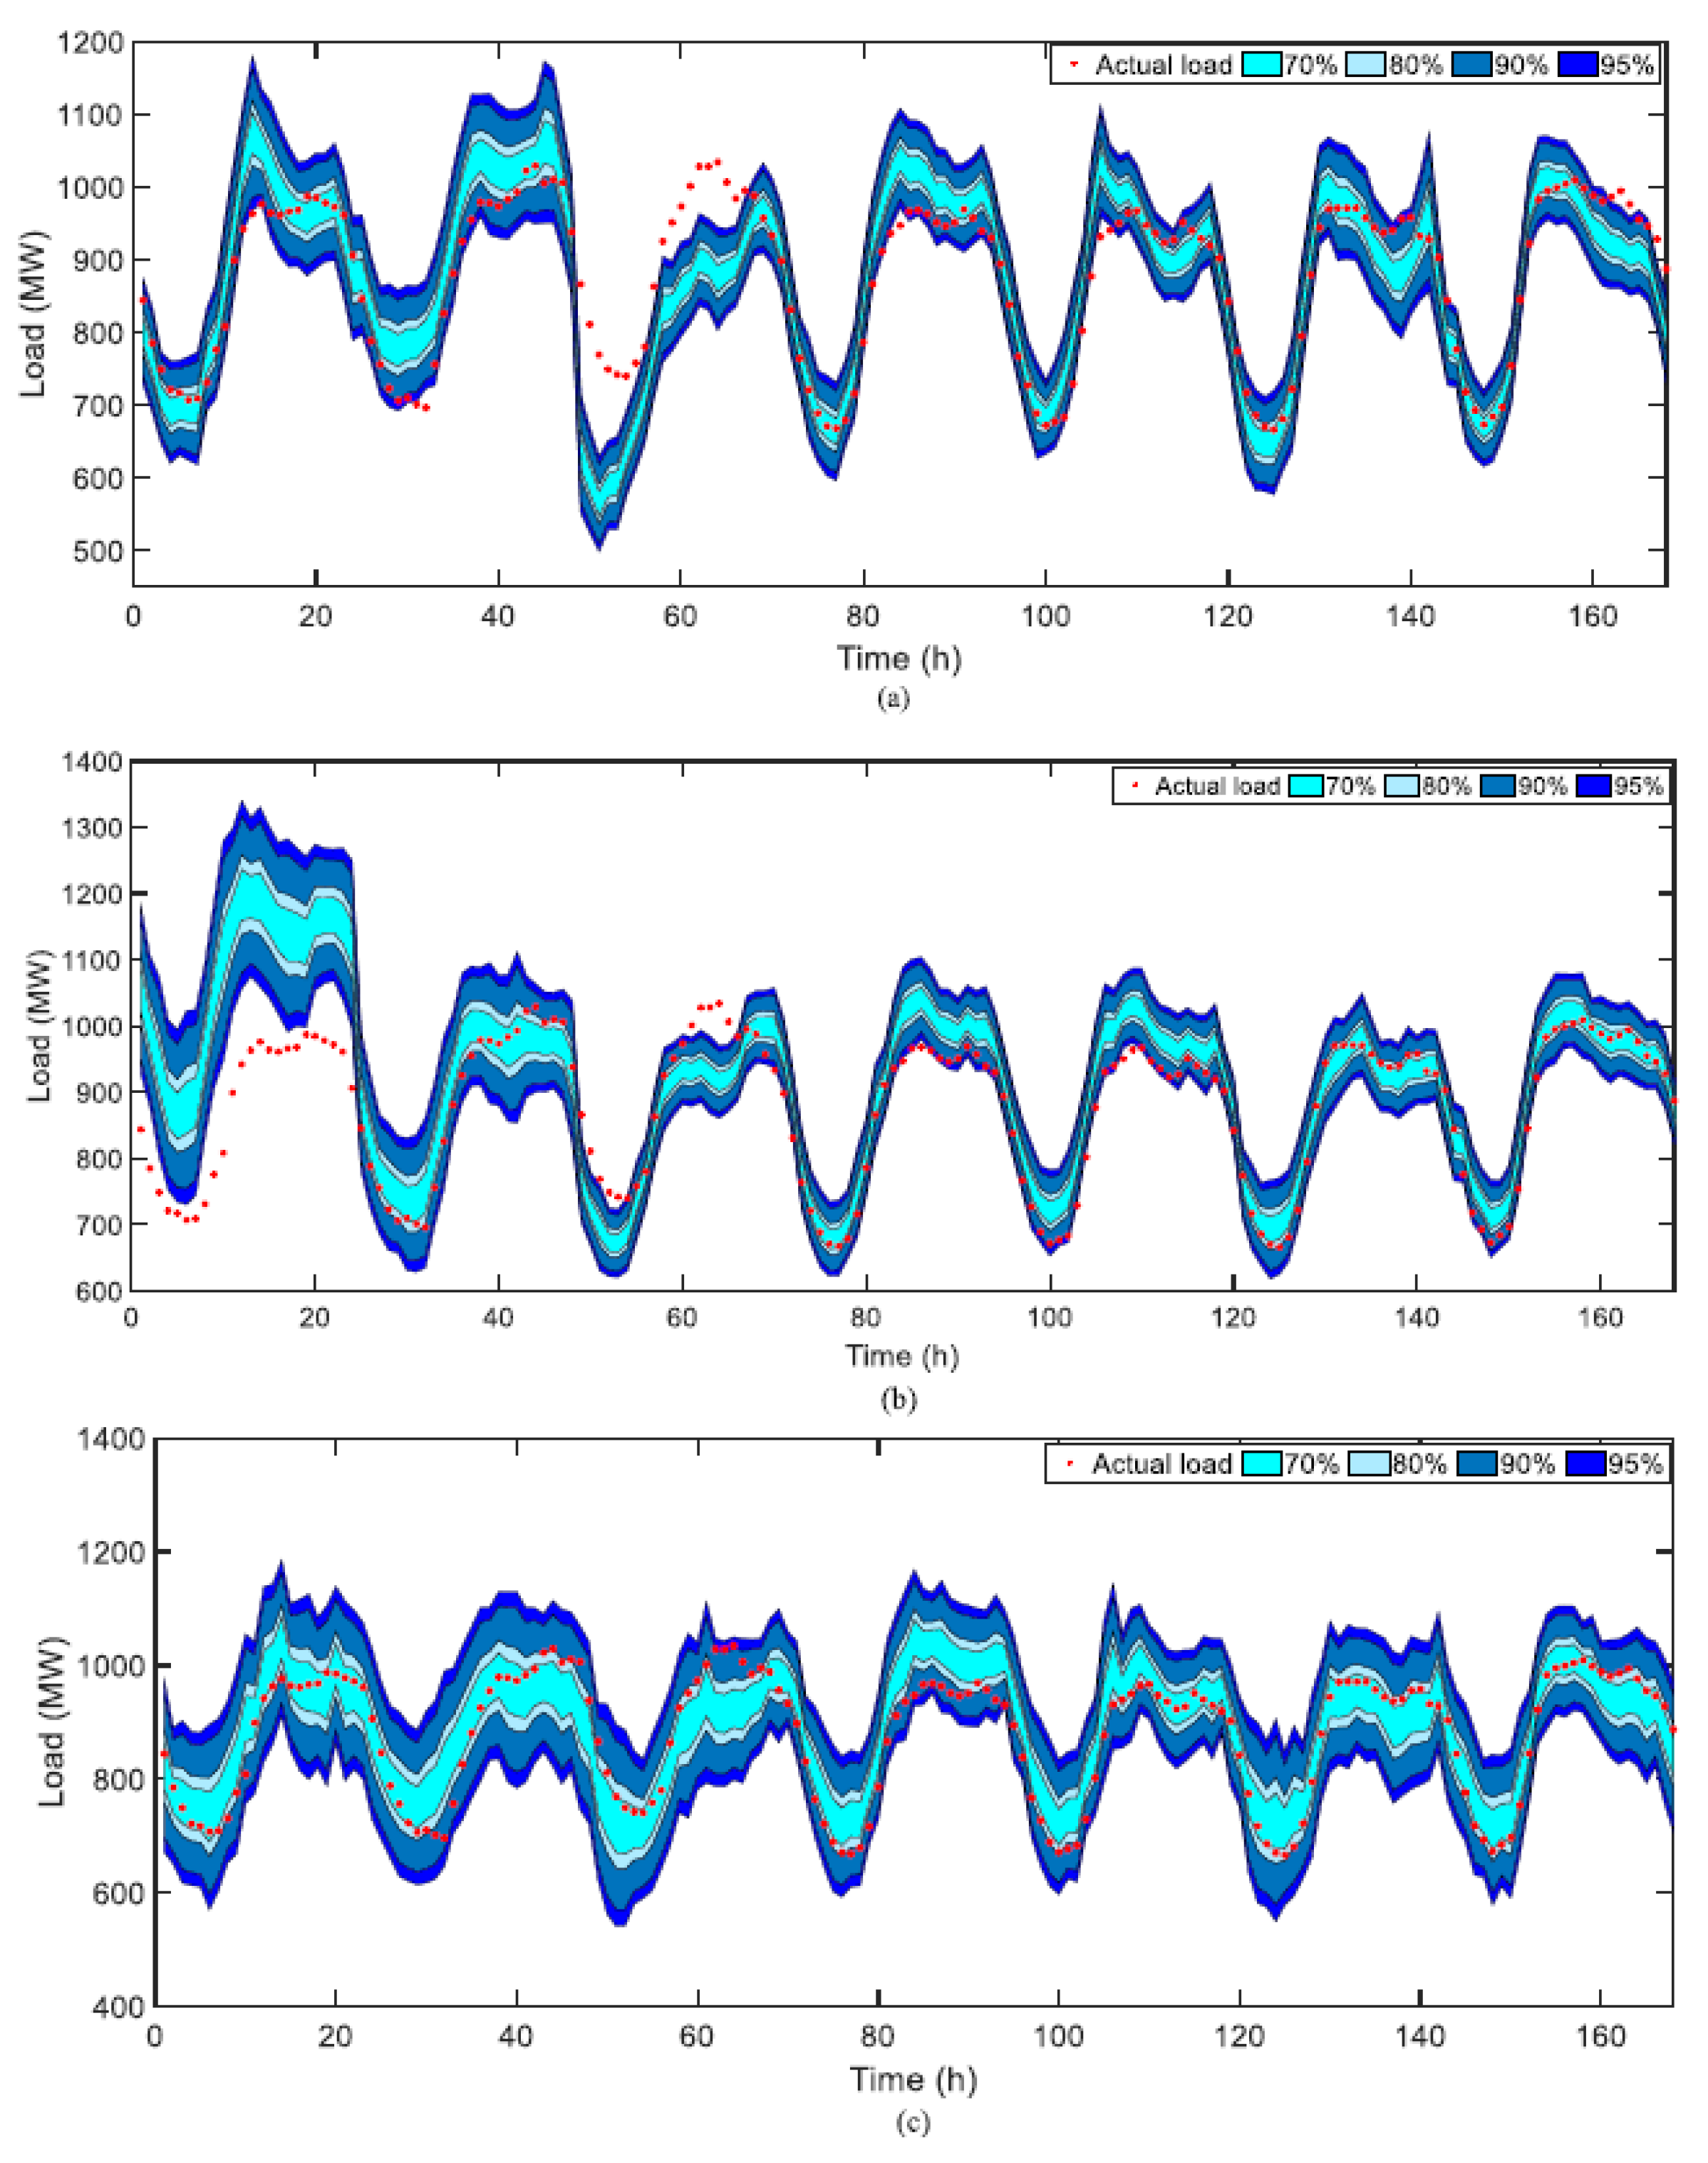
Figure 4.
Results of one-hour ahead wind power forecasting using sparse online WGP [31].
Figure 4.
Results of one-hour ahead wind power forecasting using sparse online WGP [31].
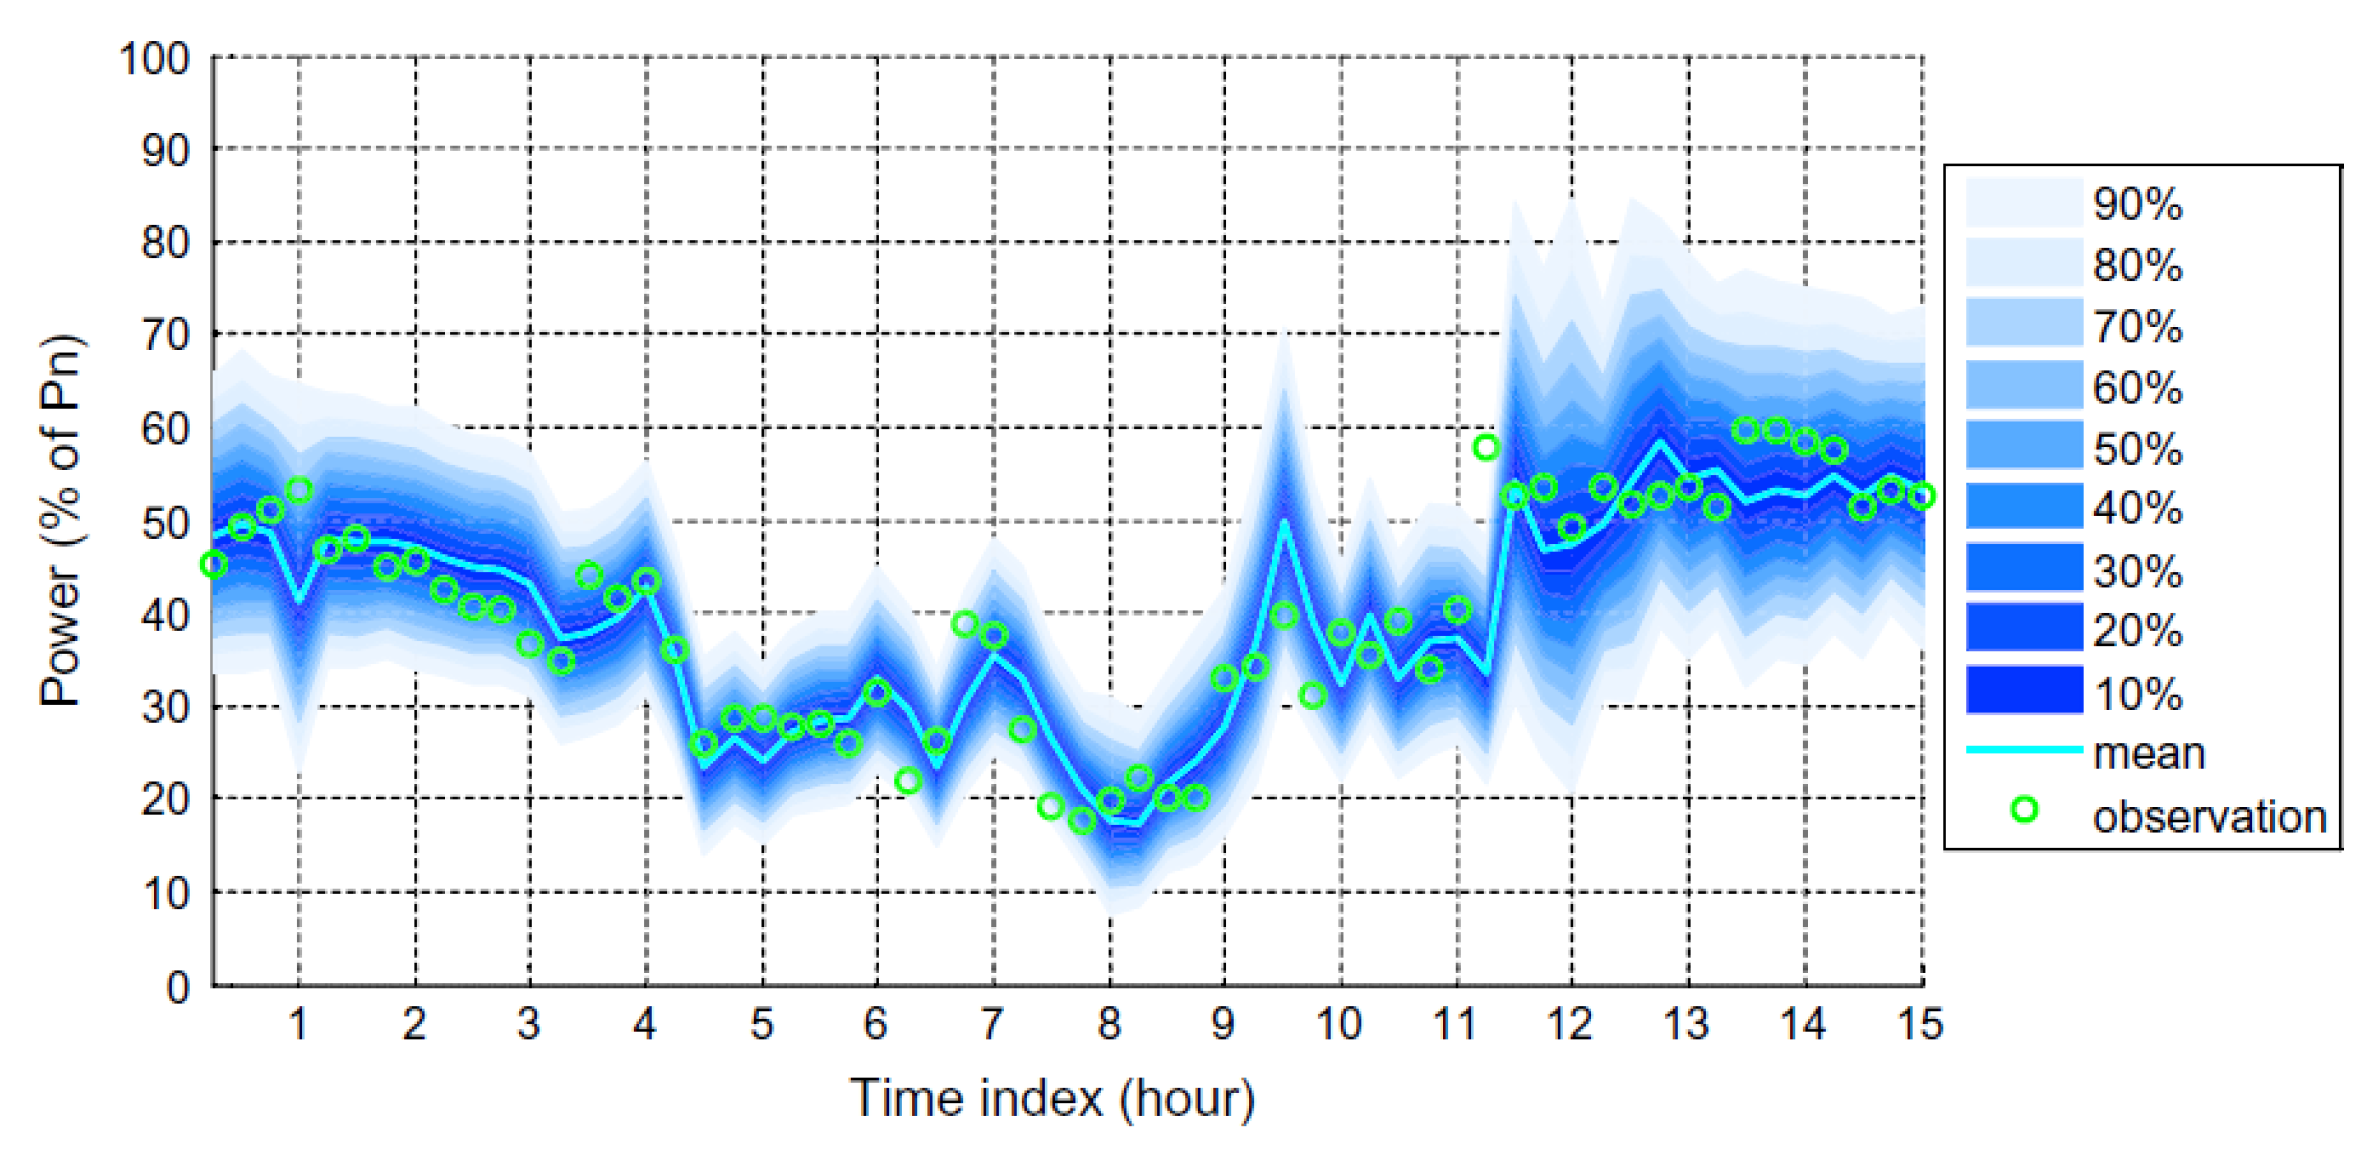
Figure 5.
Results of missing data reconstruction using TMI satellite data. (a) Observed data with missing portion, (b)-(c) Posterior mean and standard deviation for MCMC MLE estimation. (d)-(f) Posterior draws minus the posterior mean for MCMC MLE estimation. [33].
Figure 5.
Results of missing data reconstruction using TMI satellite data. (a) Observed data with missing portion, (b)-(c) Posterior mean and standard deviation for MCMC MLE estimation. (d)-(f) Posterior draws minus the posterior mean for MCMC MLE estimation. [33].
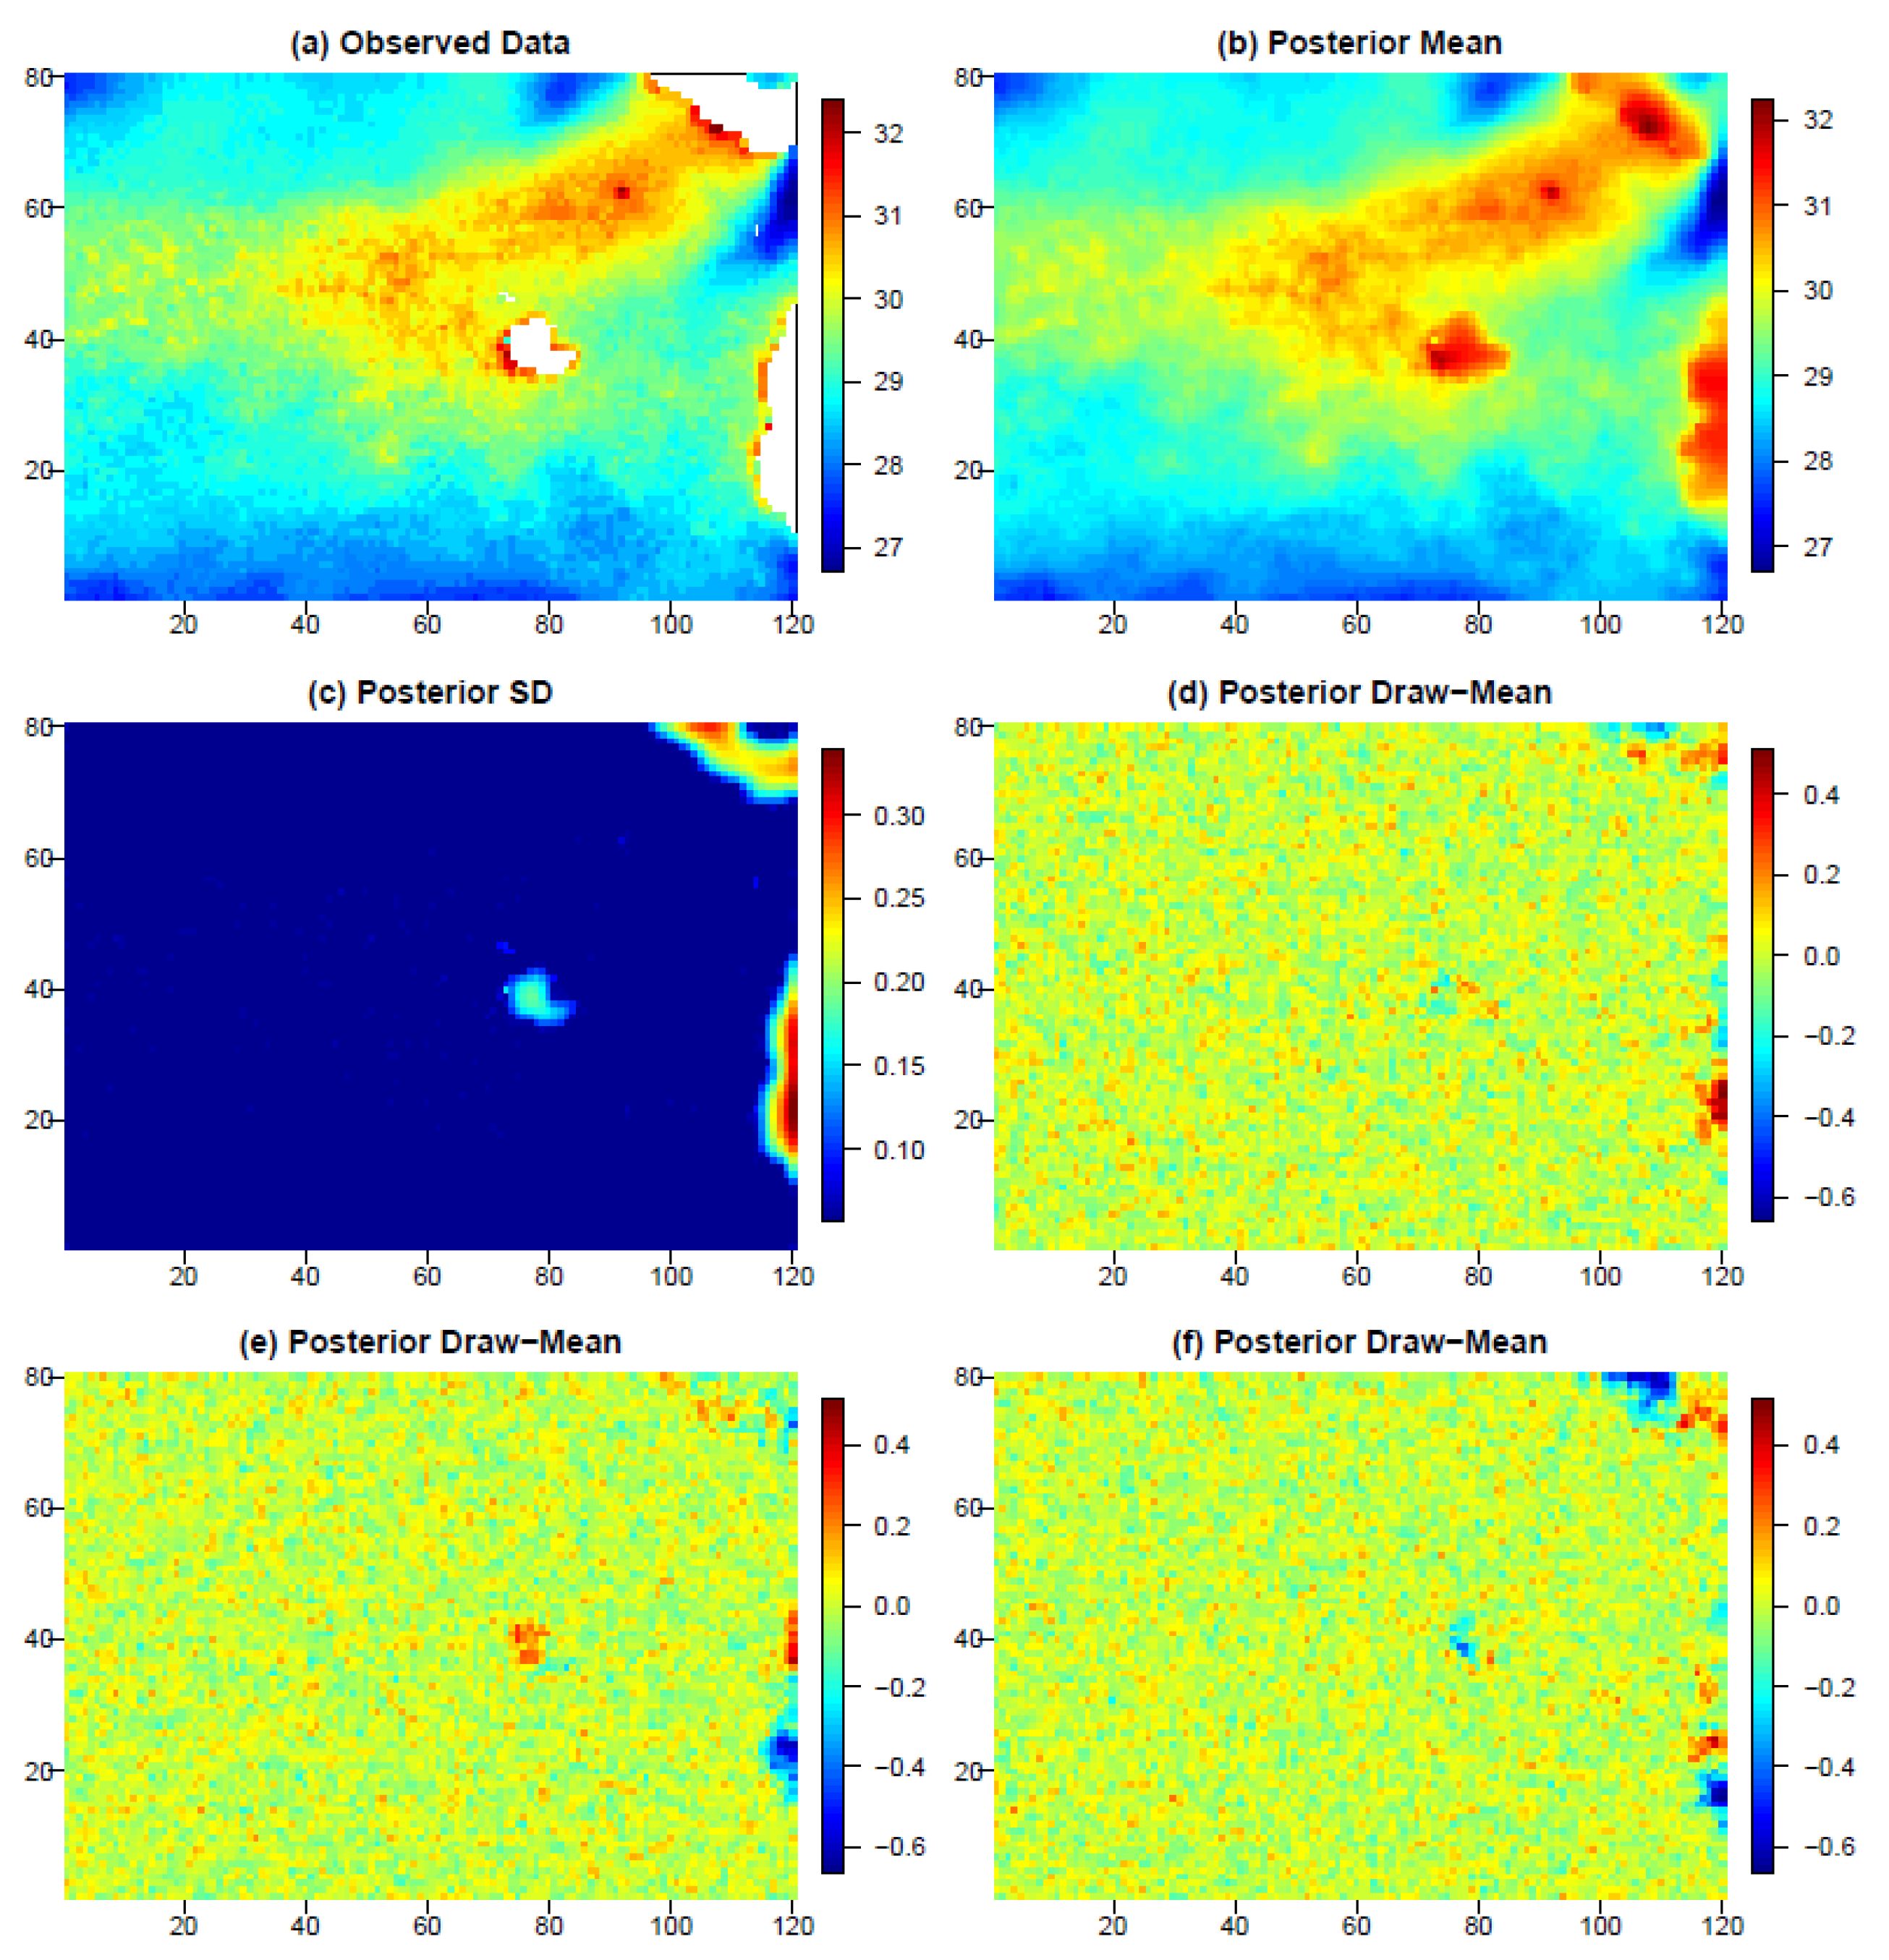
Figure 6.
Results of applying ordering Vecchia approximations on data from a real-world Orbiting Carbon Observatory 2 satellite to predict solar-induced chlorophyll fluorescence. These results provide evidence for fast and accurate evaluation in large datasets [8].
Figure 6.
Results of applying ordering Vecchia approximations on data from a real-world Orbiting Carbon Observatory 2 satellite to predict solar-induced chlorophyll fluorescence. These results provide evidence for fast and accurate evaluation in large datasets [8].
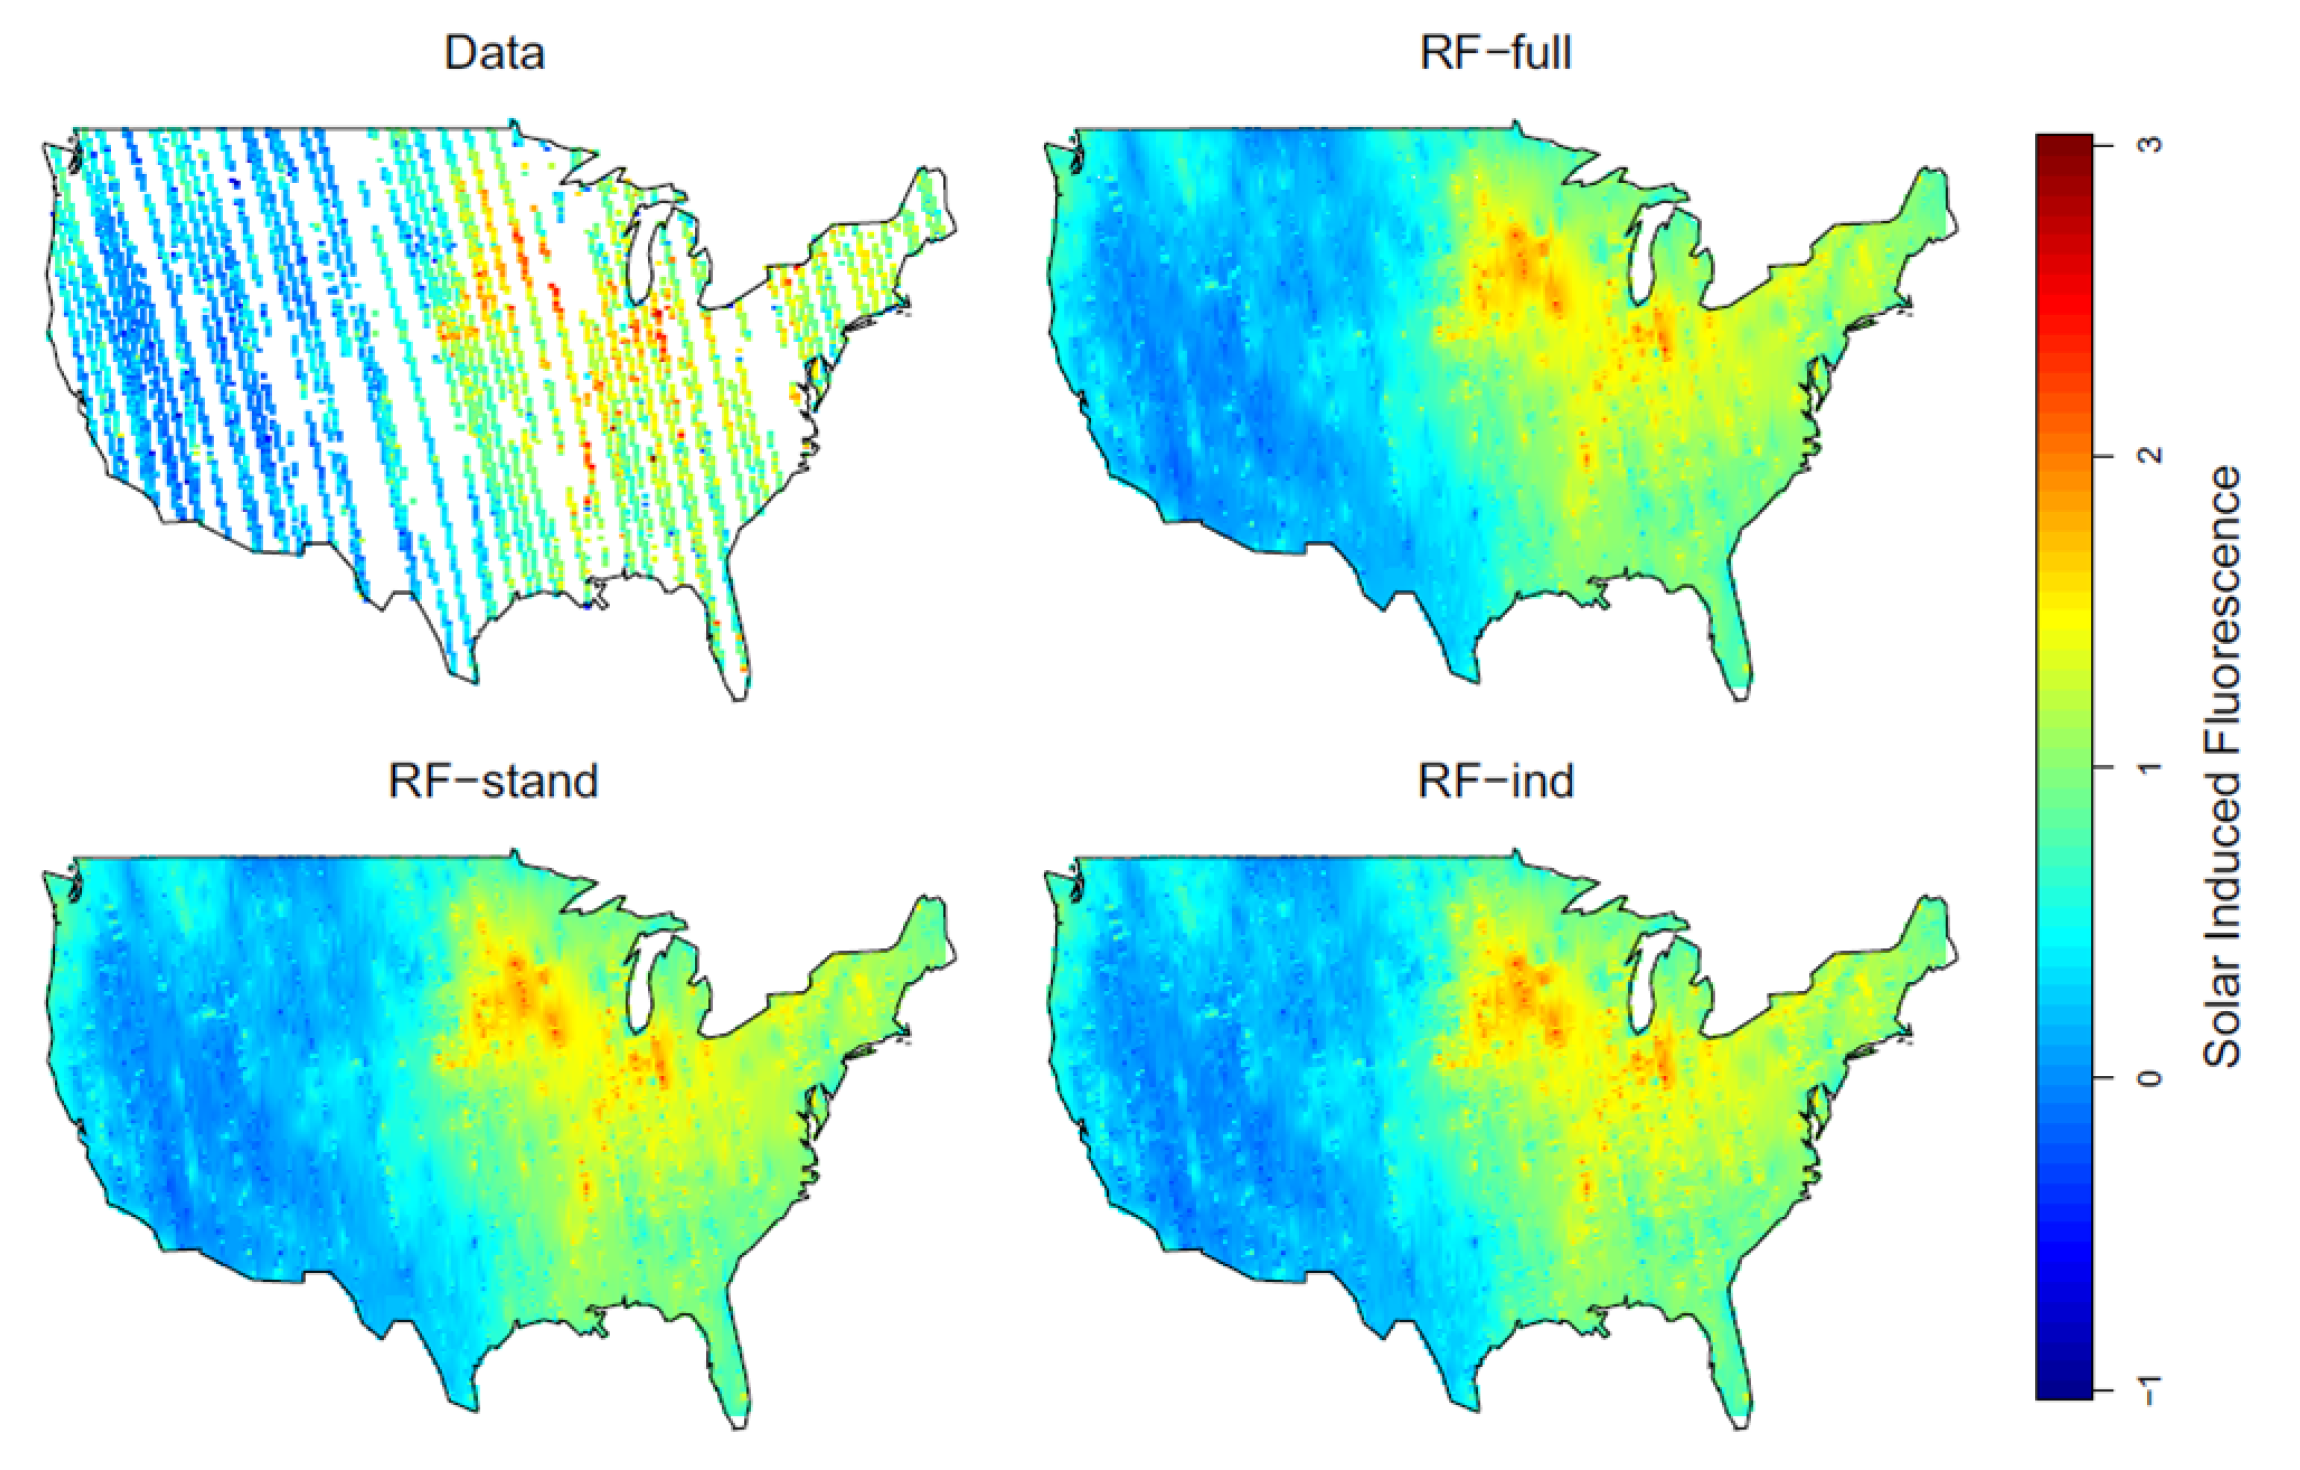
Figure 7.
General sketch of an Automatic Emulation (AE) procedure. The actual model (top - solid line), its approximation (top - dashed line) and an acquisition function . The maximum represents the new node [41].
Figure 7.
General sketch of an Automatic Emulation (AE) procedure. The actual model (top - solid line), its approximation (top - dashed line) and an acquisition function . The maximum represents the new node [41].
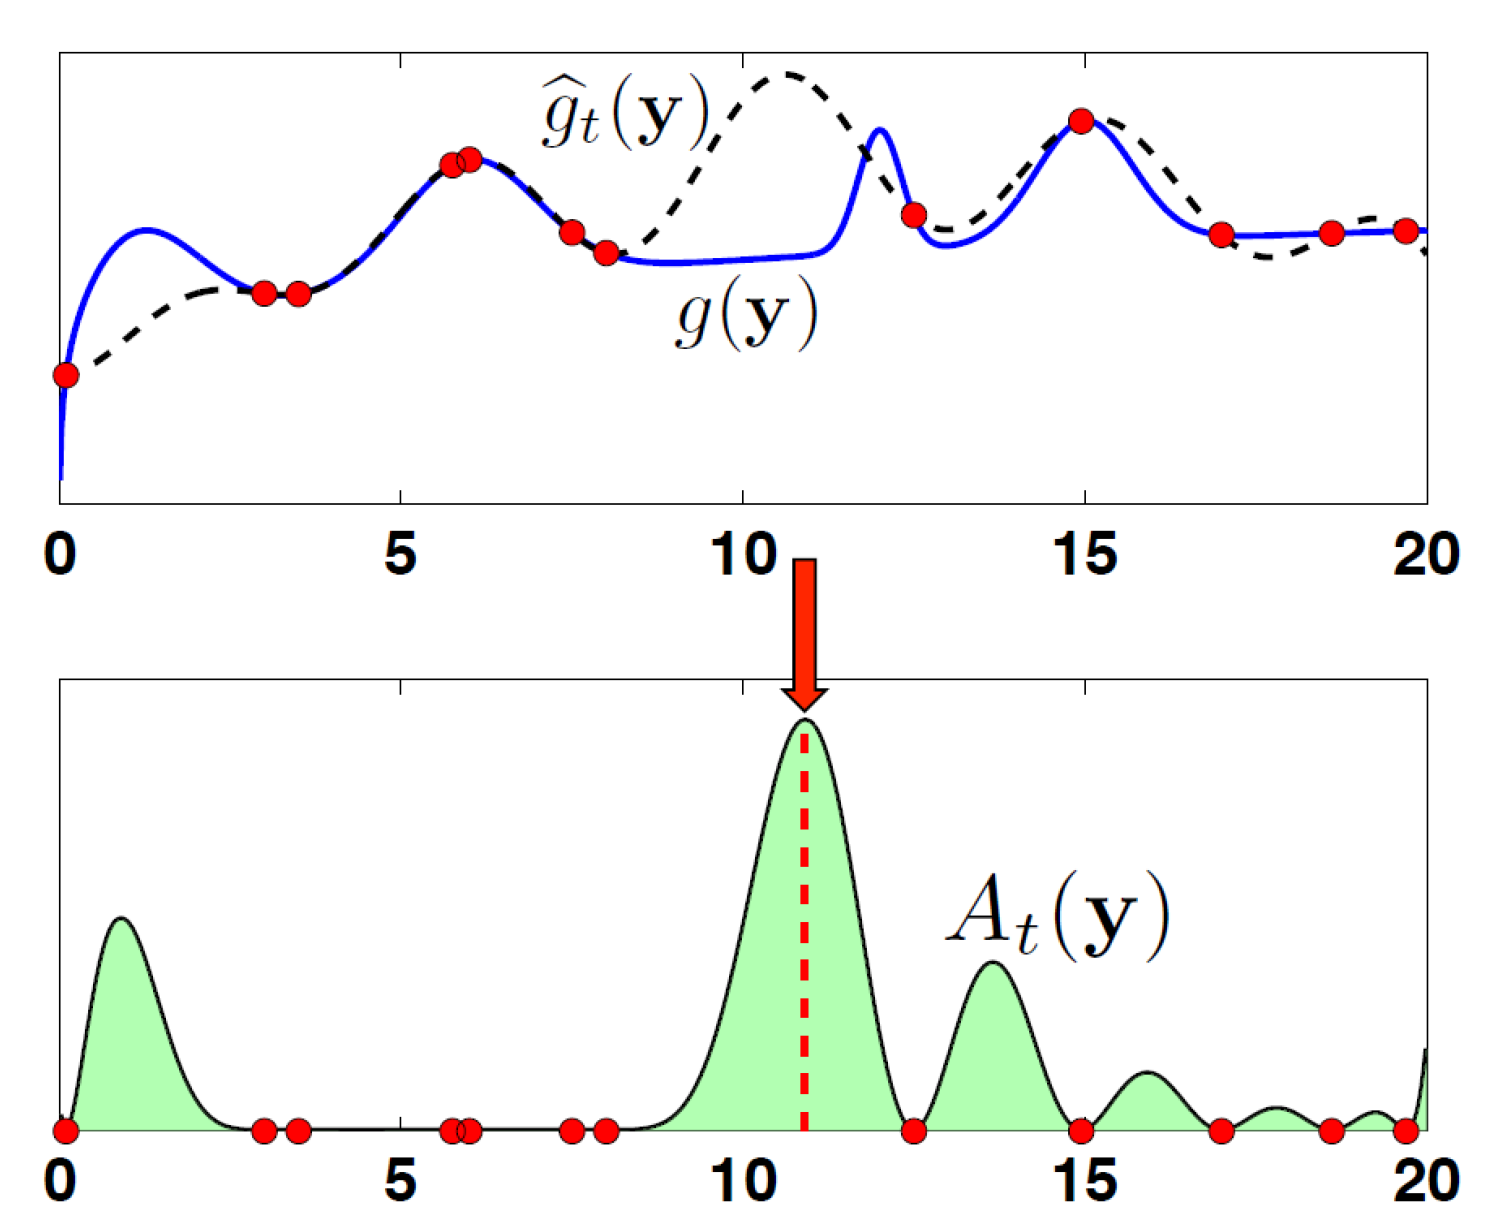
Figure 8.
A comparison of all four exploration cases among variance, reconstruction error, and peak signal-to-noise ratio. Best performance occurs when conditions favor exploration (Case 1) [43].
Figure 8.
A comparison of all four exploration cases among variance, reconstruction error, and peak signal-to-noise ratio. Best performance occurs when conditions favor exploration (Case 1) [43].
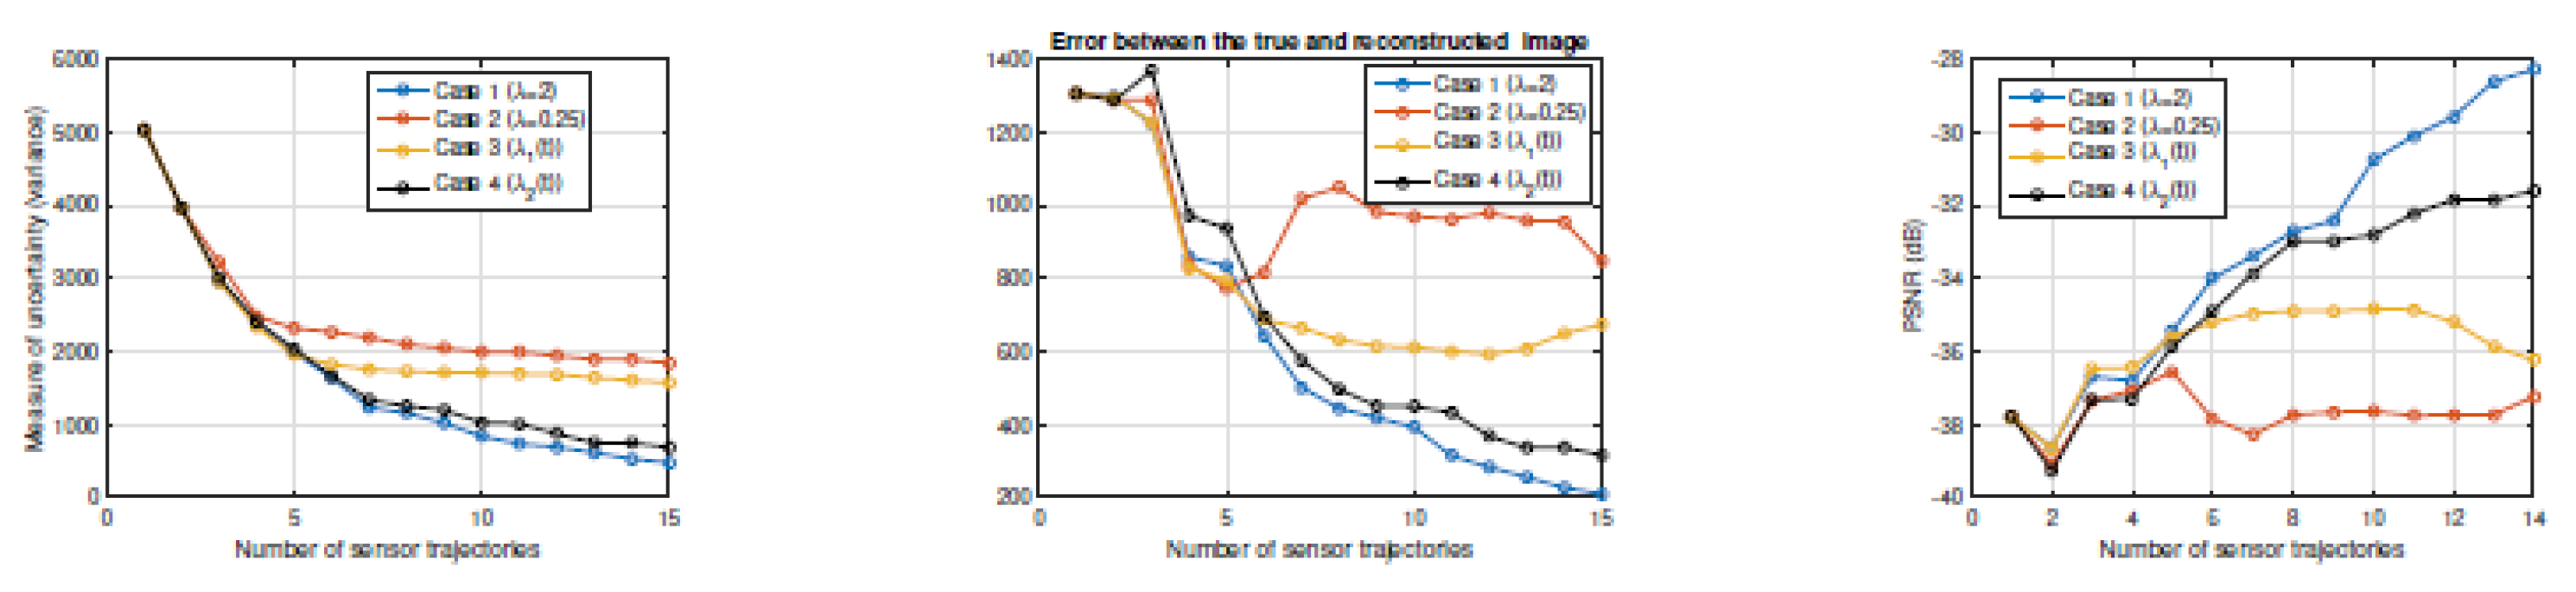
Figure 9.
The impact of different combinations of stochastic process’ state transition (P10 is normal, P01 is alarm) probabilities on the cost function, J*(s0) [47].
Figure 9.
The impact of different combinations of stochastic process’ state transition (P10 is normal, P01 is alarm) probabilities on the cost function, J*(s0) [47].
Disclaimer/Publisher’s Note: The statements, opinions and data contained in all publications are solely those of the individual author(s) and contributor(s) and not of MDPI and/or the editor(s). MDPI and/or the editor(s) disclaim responsibility for any injury to people or property resulting from any ideas, methods, instructions or products referred to in the content. |
© 2024 by the authors. Licensee MDPI, Basel, Switzerland. This article is an open access article distributed under the terms and conditions of the Creative Commons Attribution (CC BY) license (http://creativecommons.org/licenses/by/4.0/).
Copyright: This open access article is published under a Creative Commons CC BY 4.0 license, which permit the free download, distribution, and reuse, provided that the author and preprint are cited in any reuse.


