1. Introduction
Medium-scale traveling ionospheric disturbances (MSTIDs) are electron density fluctuations (wave-like) in the ionosphere plasma [
8,
30]. The study of these disturbances is relevant because they are involved in the dynamic processes linked to the lower-upper atmosphere coupling. Thus, disturbances may travel from lower to the upper atmosphere, causing plasma irregularities [
1,
6,
10]. Moreover, research on MSTIDs is also crucial for space weather since they can interfere with radio wave communications [
12,
15,
30]. In this regard, multiple efforts have been made to understand their origin and evolution. Measurements from different instruments have shown that MSTIDs typically have periods between 15 to 60 minutes, with wavelengths around 100 to 500 km and a phase velocity of 50 to 400 m/s [
5,
9,
13,
19]. Also, it has been found that the characteristics of these disturbances (amplitude and propagation direction) depend on latitude, longitude, local time, and season. For instance, Otsuka et al. [
19], Otsuka et al. [
20], Tsugawa et al. [
30] found that daytime MSTIDs have mainly aligned in the northeast-southwest direction with propagation to the southeastward (equatorward) direction in the north hemisphere, while nighttime MSTIDs were in the northwest-southeast direction with propagation to the southwest (equatorward) direction.
Although these disturbances are observed during day and night throughout the year, it is essential to distinguish between them since they have different generation mechanisms. During the daytime, atmospheric gravity waves (AGWs) are proposed to be the primary mechanism for generating MSTIDs, while nighttime MSTIDs are presumably associated with electrodynamical processes [
6,
9,
11]. However, it is difficult to identify the origin of this type of irregularities due to their inherent intermittency [
6]. There are many possible generation sources of AGWs, such as topographic, convective, shear, geostrophic adjustment, and wave-wave interactions. According to simulation studies, tropospheric convection is the mechanism capable of generating secondary AGWs traveling up to the thermosphere [
1,
6,
10]. In the case of nighttime MSTIDs, one of the electrodynamical processes responsible could be the Perkins instability (PI) [
11,
22,
30]. However, according to different studies, this instability by itself is not enough to generate nighttime MSTIDs. In conjunction with other irregularities such as sporadic E-layer (Es), these instabilities could jointly the seeds to produce MSTIDs at night [
3].
A correlation between the occurrence of MSTIDs and the solar cycle has been suggested. Particularly, for nighttime MSTIDs, some analyses reported both positive and negative correlations with the solar cycle [
7,
12,
21,
28]. For that reason, this correlation is still unclear. In this case, the period of our study corresponds to the solar minimum, and only geomagnetically undisturbed days were considered to avoid solar influence.
We present the characterization of MSTIDs based on TEC fluctuations during 2018-2019, a period of minimum solar activity. This study aims to analyze the disturbances generated by ionospheric activity over the Mexican territory and establish a methodology for future studies. The questions to be addressed in this research are: What is the TID type that appears over Mexico? Is there a pattern for the occurrence of TIDs? What is the relevance of occurrence time in determining the origin of the disturbance?
2. Materials and Methods
This study uses GNSS data from receivers across Mexico, which are part of the National Seismological Service and Transboundary, Land and Atmosphere Long-term Observational and Collaborative Network (SSN - TLALOCNet) [
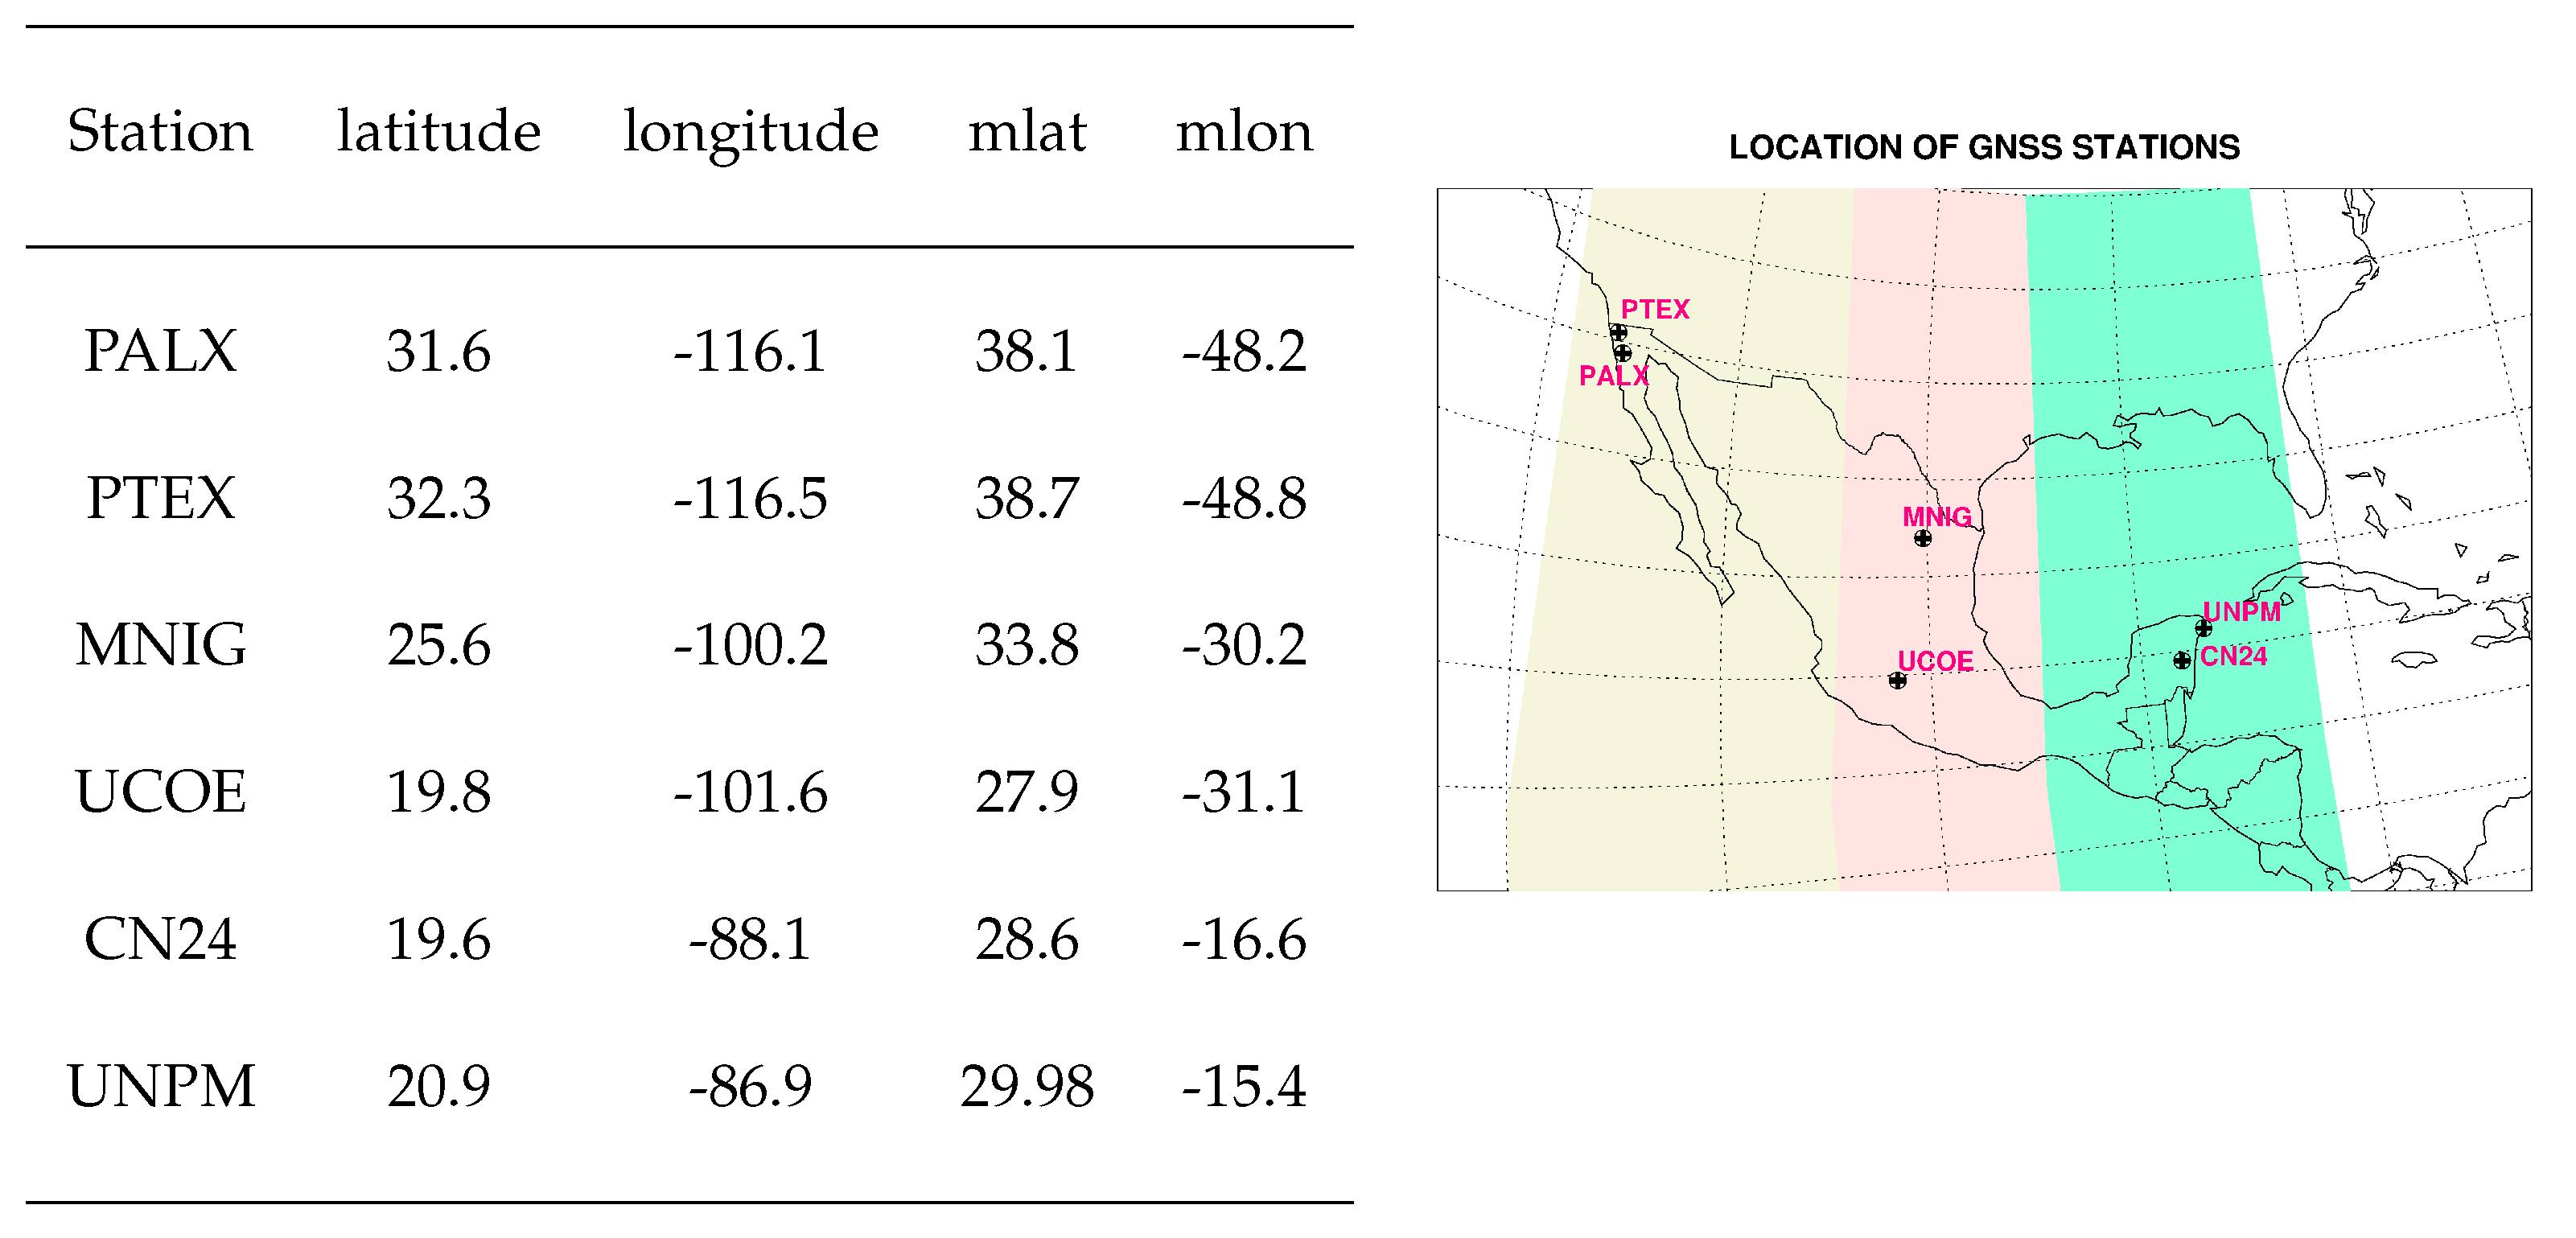
2]. Mainly, we are focusing the study on six GNSS stations located at different latitudes and longitudes to compare MSTIDs characteristics in three regions: north (PALX, PTEX), center (MNIG, UCOE), and south (UNPM, CN24).
Table 1 shows the locations of the GNSS stations, highlighting the three regions with different colors: yellow, red, and green represent the northern, central, and southern regions respectively, which can be seen in the map on the right.
Table 1 indicates the geographic and magnetic coordinates of all the receiver stations, according to the following: columns correspond to the receiver station name and their respective geographic and magnetic coordinates (magnetic latitude ≡
and magnetic longitude ≡
). In the map, we can see that the study covers critical locations in Mexico, such as the northeast, northwest, center, and southeast. Also, the three regions were chosen according to their geomagnetic coordinates. For that reason, the central region involves two stations (MNIG and UCOE) separated by a large extension, and the results and discussion of this region will be presented individually. Moreover, our study was conducted during solar minimum activity for two years, 2018-2019, taking geomagnetically quiet days only. Thus, we are removing solar disturbances.
2.1. TEC Estimation
There are two processes for approximating TEC values along the line of sight between the GNSS satellite and the receiver. The first one is based on the pseudoranges or pseudo-distances (distance between the satellite and the receiver), calculated in a simple form by a linear approximation: light velocity multiplied by the time difference between the emission and reception of the signal. The second method uses phase differences between two signals (carrier phases). In this study, we used Gopi Seemala’s software, which is based on both approximations [
26].
Particularly, GPS receivers use a dual frequency (
MHz and
MHz) to remove ionospheric effects. Thus, the general approximation to estimate TEC is given by Equation (
1):
where
and
are the pseudoranges,
and
are the carrier phases, and
and
are the receiver and satellite errors. The TEC approximation is giving in TEC units (TECu), where 1 TECu =
. This method only considers those satellites with an elevation angle above 20° to reduce the leveling errors. More about the general method can be consulted in Rama Rao et al. [
23].
2.2. Estimation of Detrended TEC (dTEC) and Identification of TID Events
According to the literature, TIDs are characterized by falls or diminished TEC values with some specific periodicities depending on the nature of the disturbance [
10,
12,
20,
26]. Thus, a detrending technique is applied to vTEC data to identify them. Under this approach, the vTEC data were fitted by a high-order polynomial function, established using the Savitzky-Golay filter, a mathematical tool for smoothing data [
25]. This filter uses the convolution function over a data window evaluated at an
n-order polinomial. Equation (
2) shows the filter estimation using the polynomial coefficients. After that, this polynomial function was subtracted from the vTEC data. Thus, the mathematical expression to remove the tendency of vTEC data is represented by Equation (
3). Here, “dTEC” is referred to as the detrended vTEC. It is important to mention that we are using one-hour data windows (± 30 minutes) to include all possible periods related to MSTIDs [
20,
30].
By analyzing the dTEC behavior, wave-like patterns related to the signatures of TIDs can be distinguished in the signal. However, we follow two extra criteria to select TID events: 1) the wave-like patterns must exhibit at least two wave cycles, and 2) all the maximums in this wave-like pattern are above 0.1 TECu. This threshold value of the TIDs events was established by analyzing the standard deviation of all wave-like patterns identified in the MNIG station. Other authors have used threshold values between 0.07 - 1 TECu [
9,
13,
18], which agree with the value used in this work. It is important to mention that the amplitude was calculated using the mean value approximation between the upper and lower points of the disturbance, referred to as the average absolute amplitude. Also, the TID events were fitted by a polynomial curve to extract the occurrence time and the interval.
A spectral analysis based on the Continuous Wavelet Transform (CWT) was used to determine the period of TIDs observed. The CWT of the data series was calculated following Torrence and Compo (1998) methodology [
29].
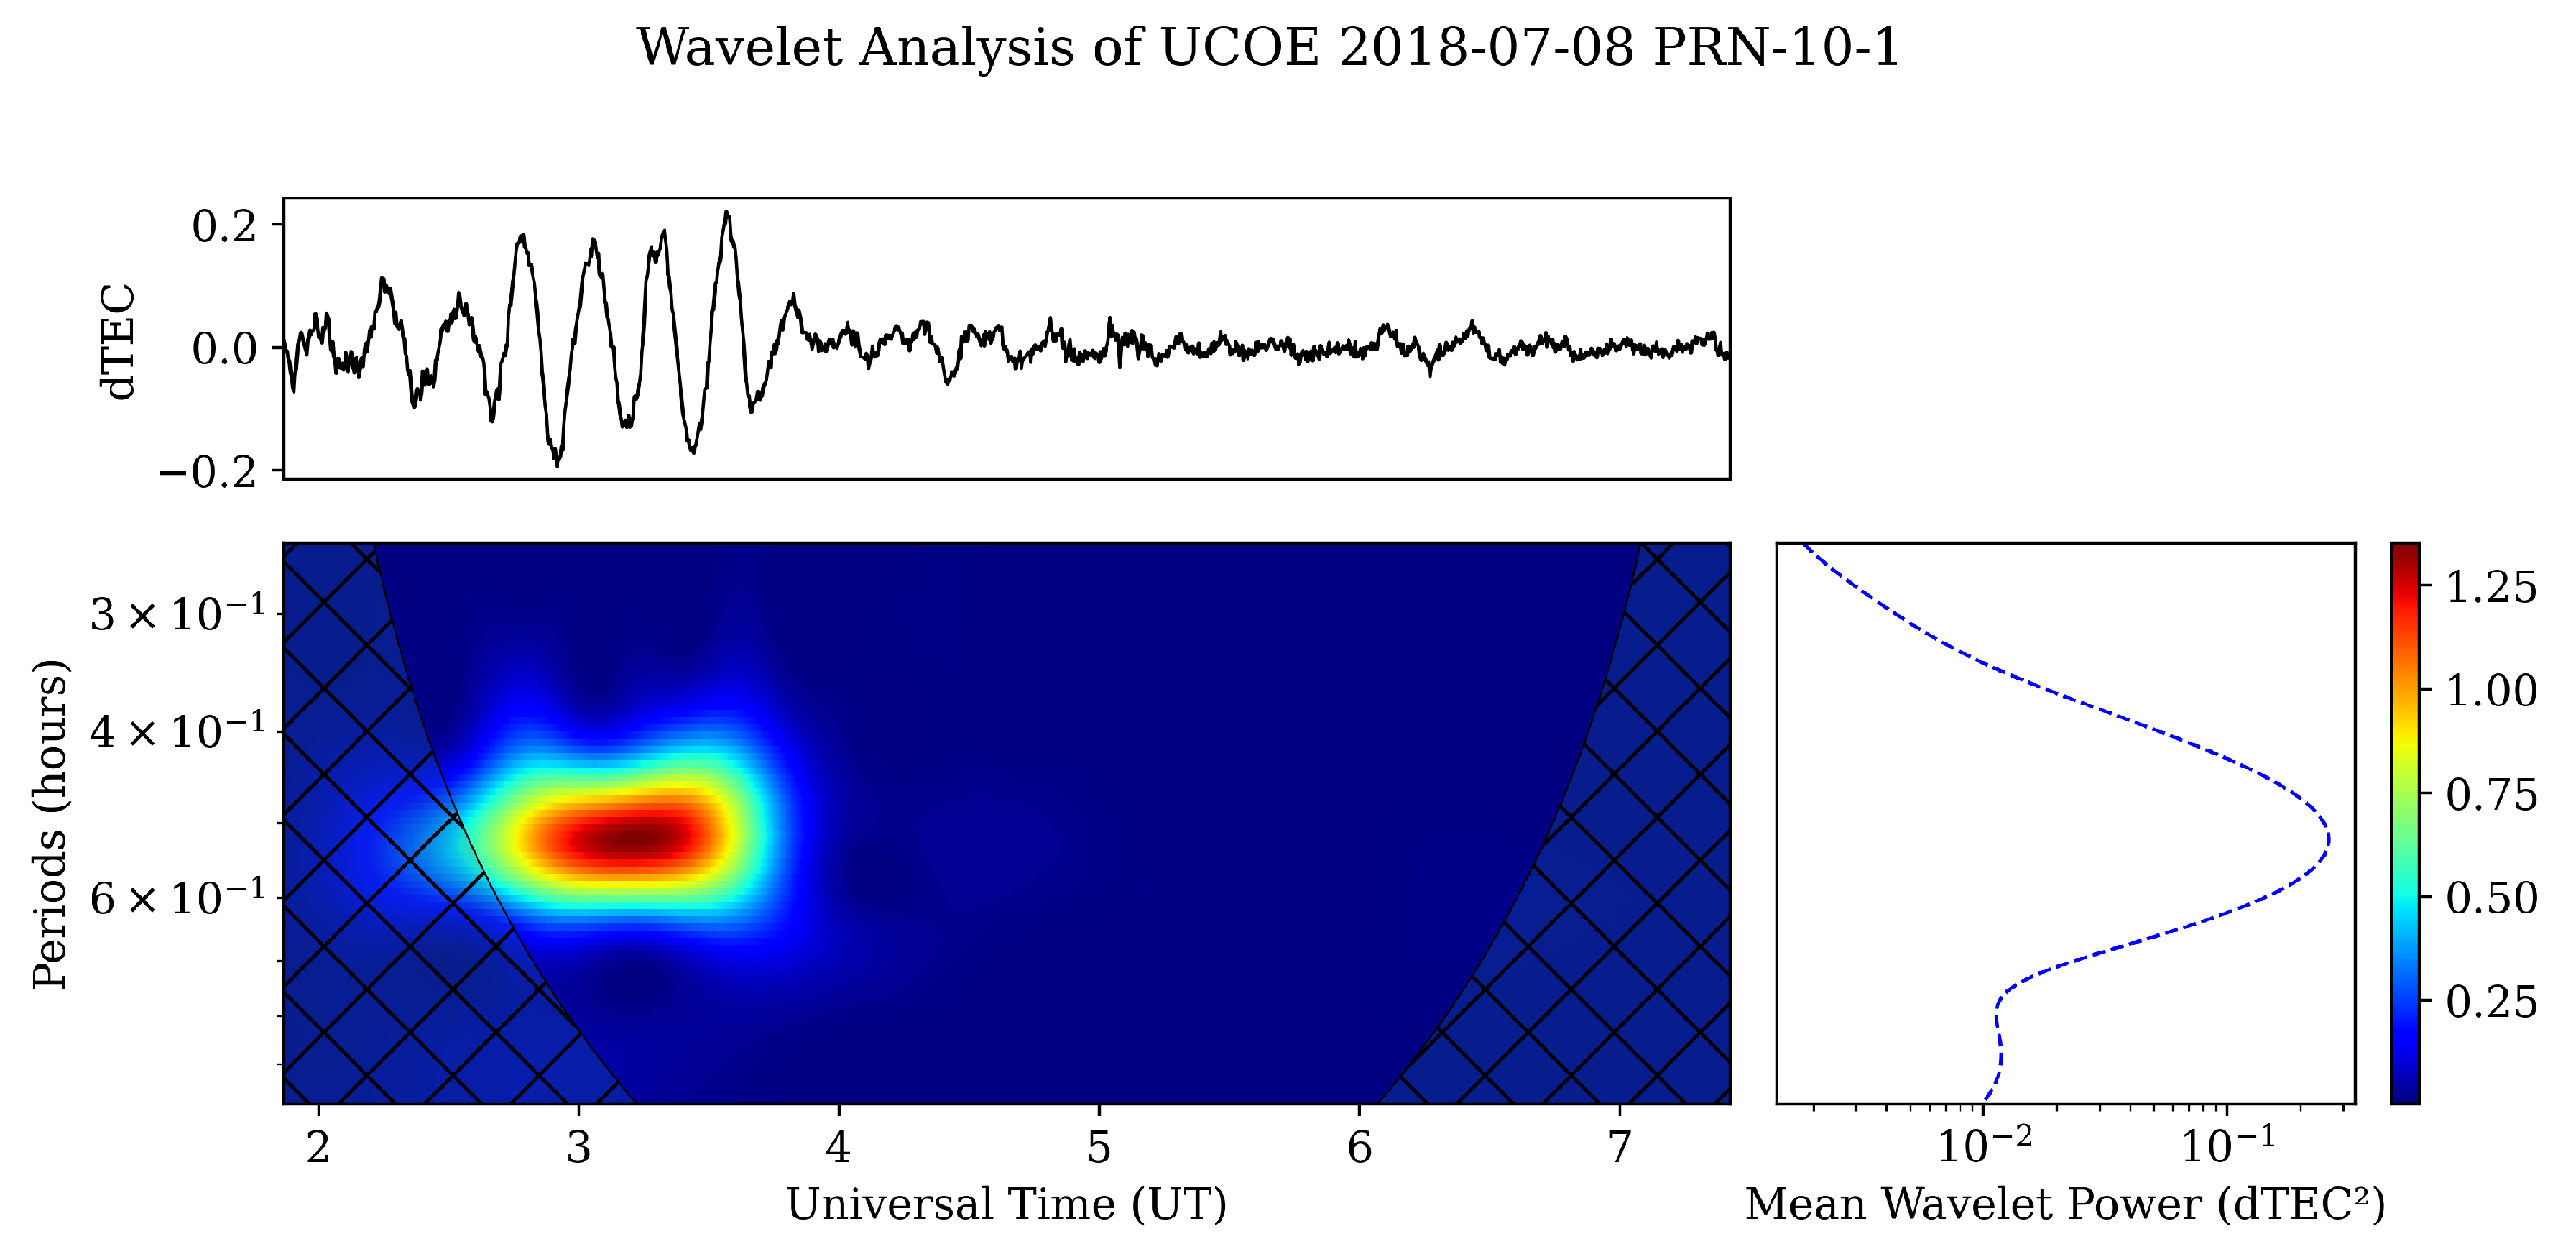
Figure 1 shows an example of the TID identification process. The upper panel shows the dTEC variation at one satellite, and the lower panel shows the CWT for the same time series. In the CWT, the horizontal axis represents the hours along the day, the vertical axis represents the period, and the signal’s power (intensity) is represented with colors. For a better understanding, we can visualize the CWT as a matrix array, where each row corresponds to one period value, the columns represent the time of the signal recording, and every point in the array is weighted according to a power value represented by the color distribution. Thus, the highest disturbances appear in red, while blue is associated with low activity. The pink square is delimitating the TID event. The same process was applied to each satellite registered by the receiver station. It is essential to highlight that different parameters were extracted from this analysis, such as: observational time, date, power or disturbance intensity, and amplitude.
2.3. Identification of TIDs Periodicities
The TIDs were classified into day and night events using the solar terminator position throughout the year. After this classification, a probability density function was applied to all TIDs periodicities falling in each group (daytime or nighttime). The first step was to construct a histogram for the TIDs periodicity distribution. In this case, we used the Herbert Sturges’ formula to estimate the histogram’s most favorable number of bars [
4]. Following this formula, the number of periods, corresponding to the number of bars (
k), was determined using the Equation (
4). Here,
n is the total number of TIDs events, and
and
correspond to the asymmetry and standard deviation, respectively. These quantities were calculated using the equations (5) and (6), where
X represents the TIDs periods. Finally, the probability density distribution for TIDs periods (
) was calculated using the approximations of equations (7) and (8), where
means the total data for each bar in an interval
, and
M is the total available data.
After obtaining all the probability density distributions, a skew-normal distribution was fitted to obtain the representative periodicity for each data set.
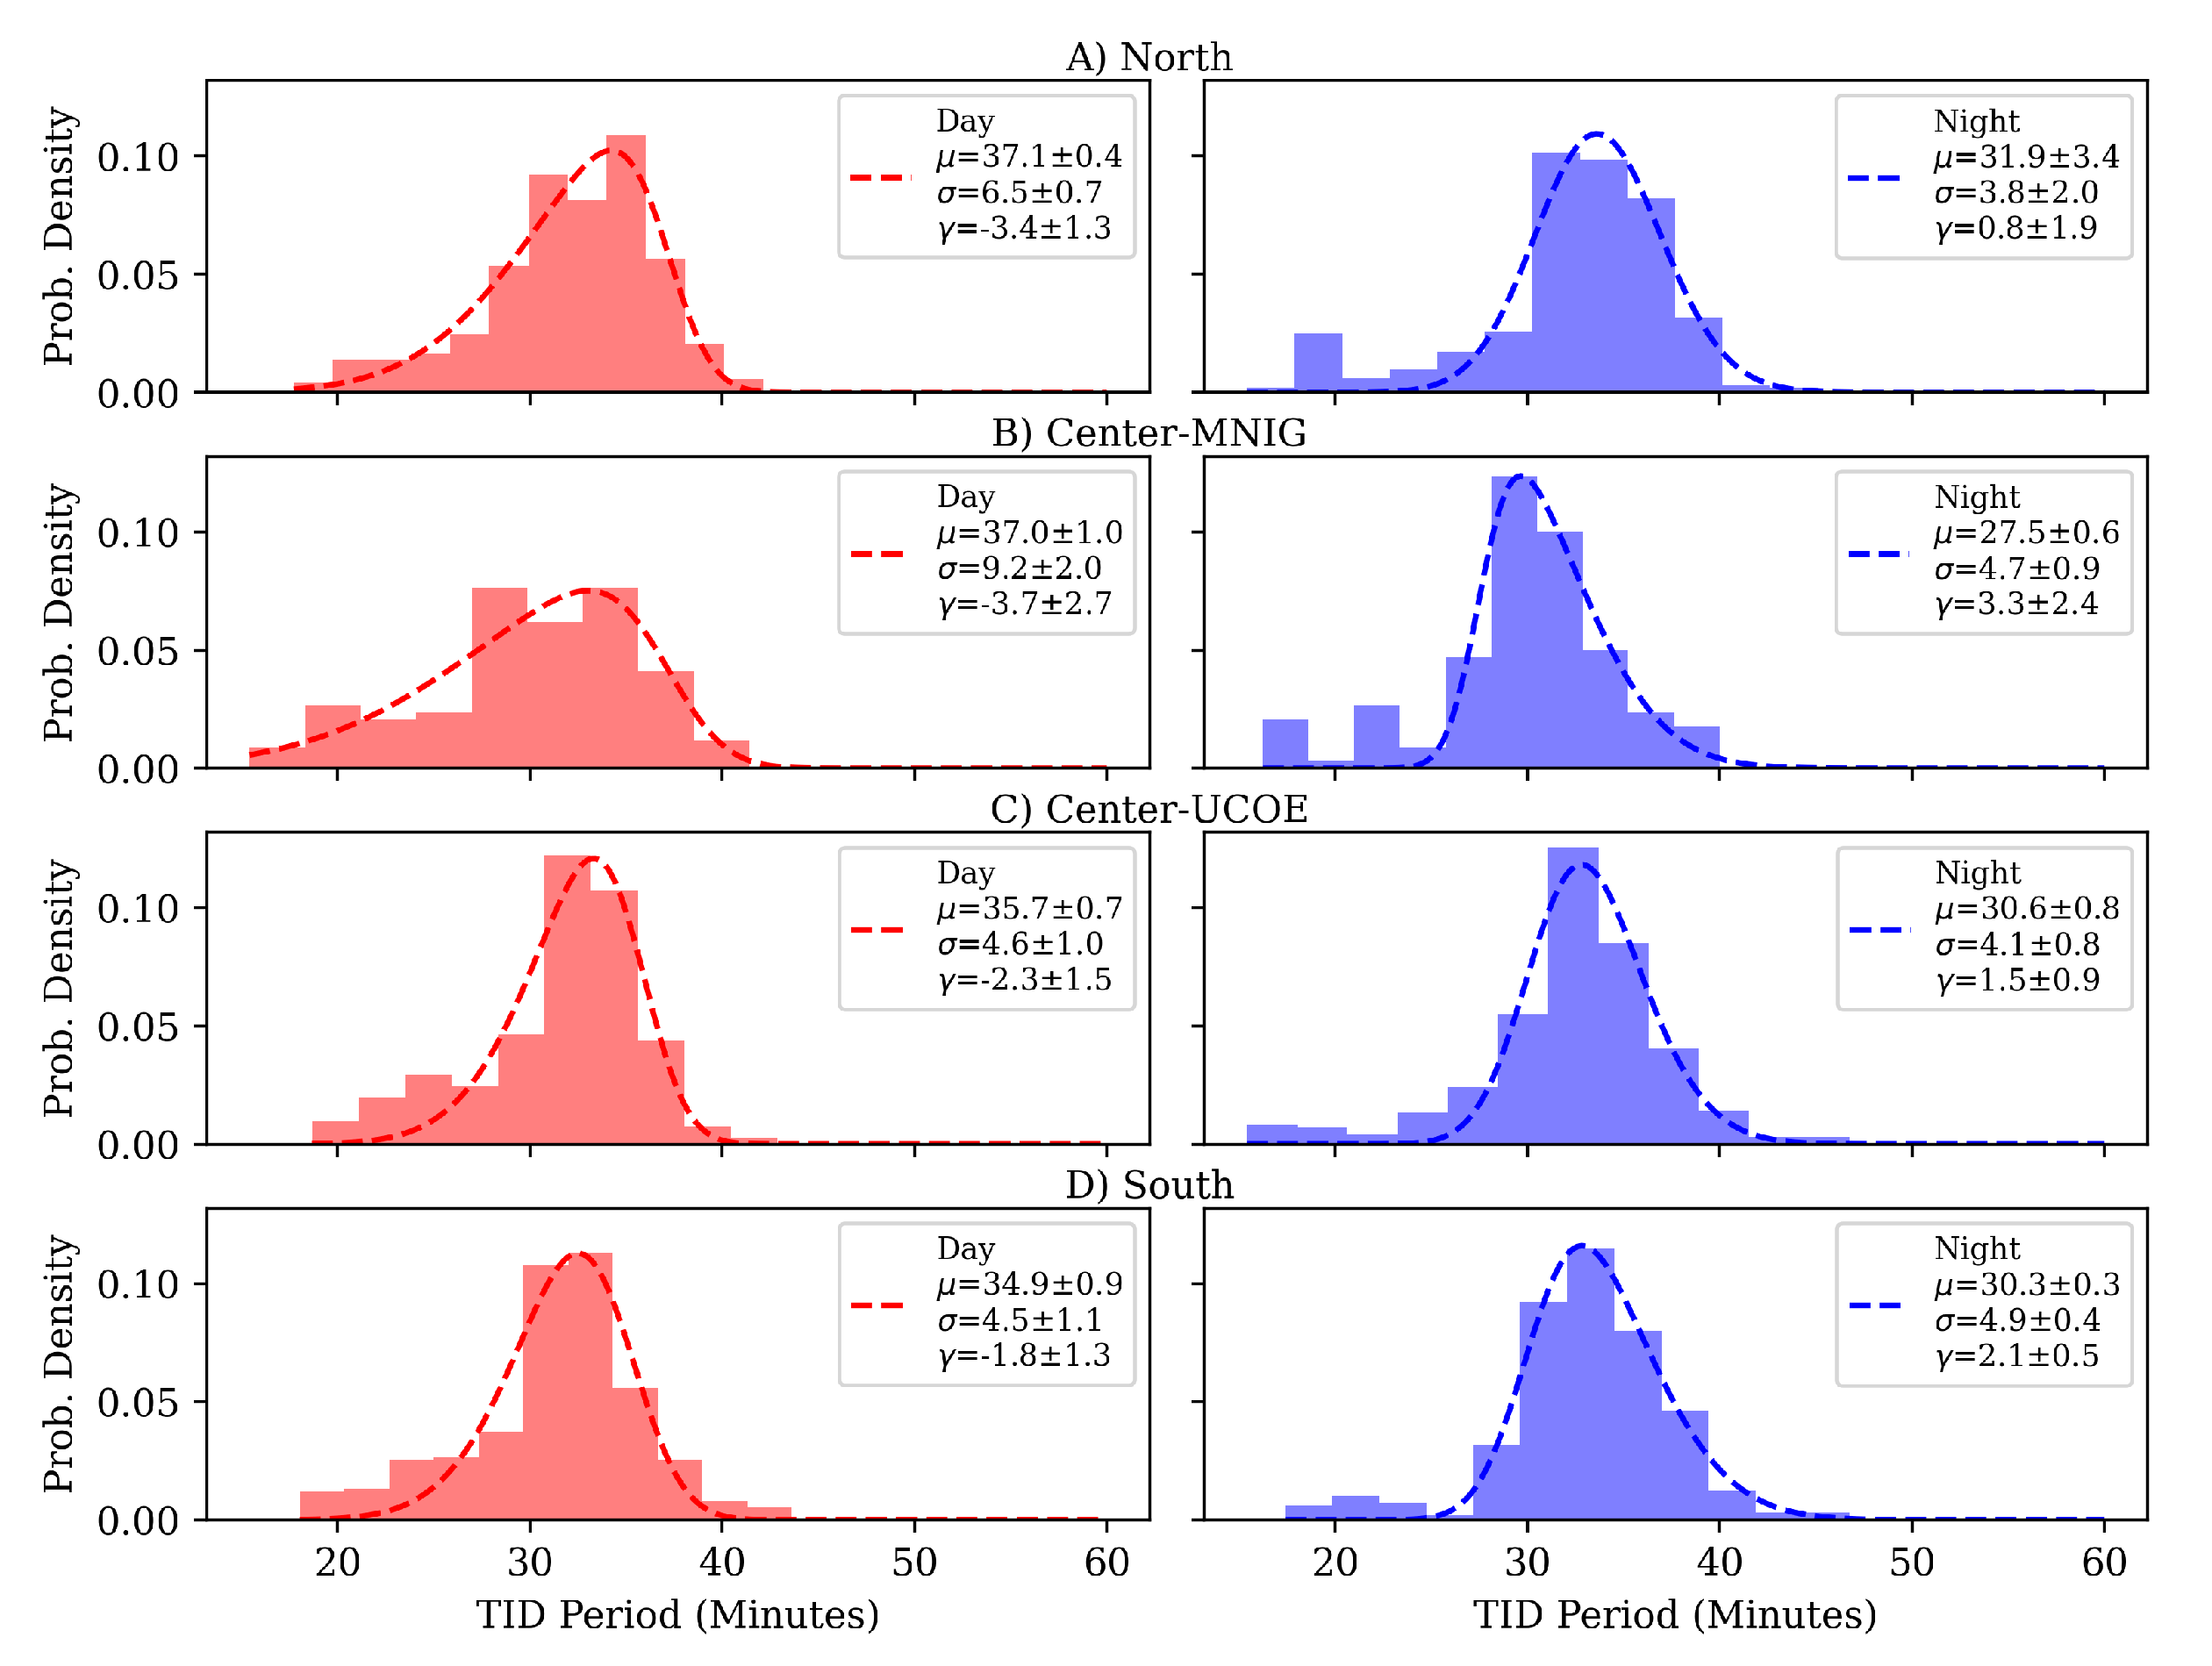
Figure 2 shows the periodicities of each region’s TID events identified during 2018 and 2019. Blue and red colors indicate nighttime and daytime events, respectively. The dashed line is the probability density function in the daytime (red color) and nighttime (blue color) of the TID events, where
represents the mean periodicity,
is the value of one standard deviation, and
is the skewness factor.
3. Results and Discussion
We will present the main results concerning TID events that occurred over three regions of Mexican territory, which were identified using GNSS data. In order to simplify the discussion, this section is divided into subsections: 1) periodicity and occurrence time, 2) disturbance energy, and 3) possible mechanism for generation.
3.1. Periodicity and Occurrence Time
According to the literature, periods between 10 minutes to one hour are expected for the MSTIDs, which agrees with the results of the periodicity analysis shown in
Figure 2. For daytime TIDs, the average periodicity was around 36.2 ± 6.6 min, while for nighttime TIDs, the average periodicity was 30.1 ± 5.1 min. Comparing these average values, we can see that daytime periods are larger than those for nighttime. These differences could be related to their generation mechanisms, which is in agreement with [
6,
11].
Table 2 summarizes the periodicities and number of events for each region. Here, we can see that the North and South stations registered more events, while the center stations exhibited a low MSTIDs activity. However, it is important to mention that there was just one year of data for the MNIG receiver, which is why the number of events was lower than for the other receivers.
By analyzing the number of identified MSTIDs, we can anticipate that the nighttime events were predominant for this period in all selected stations.
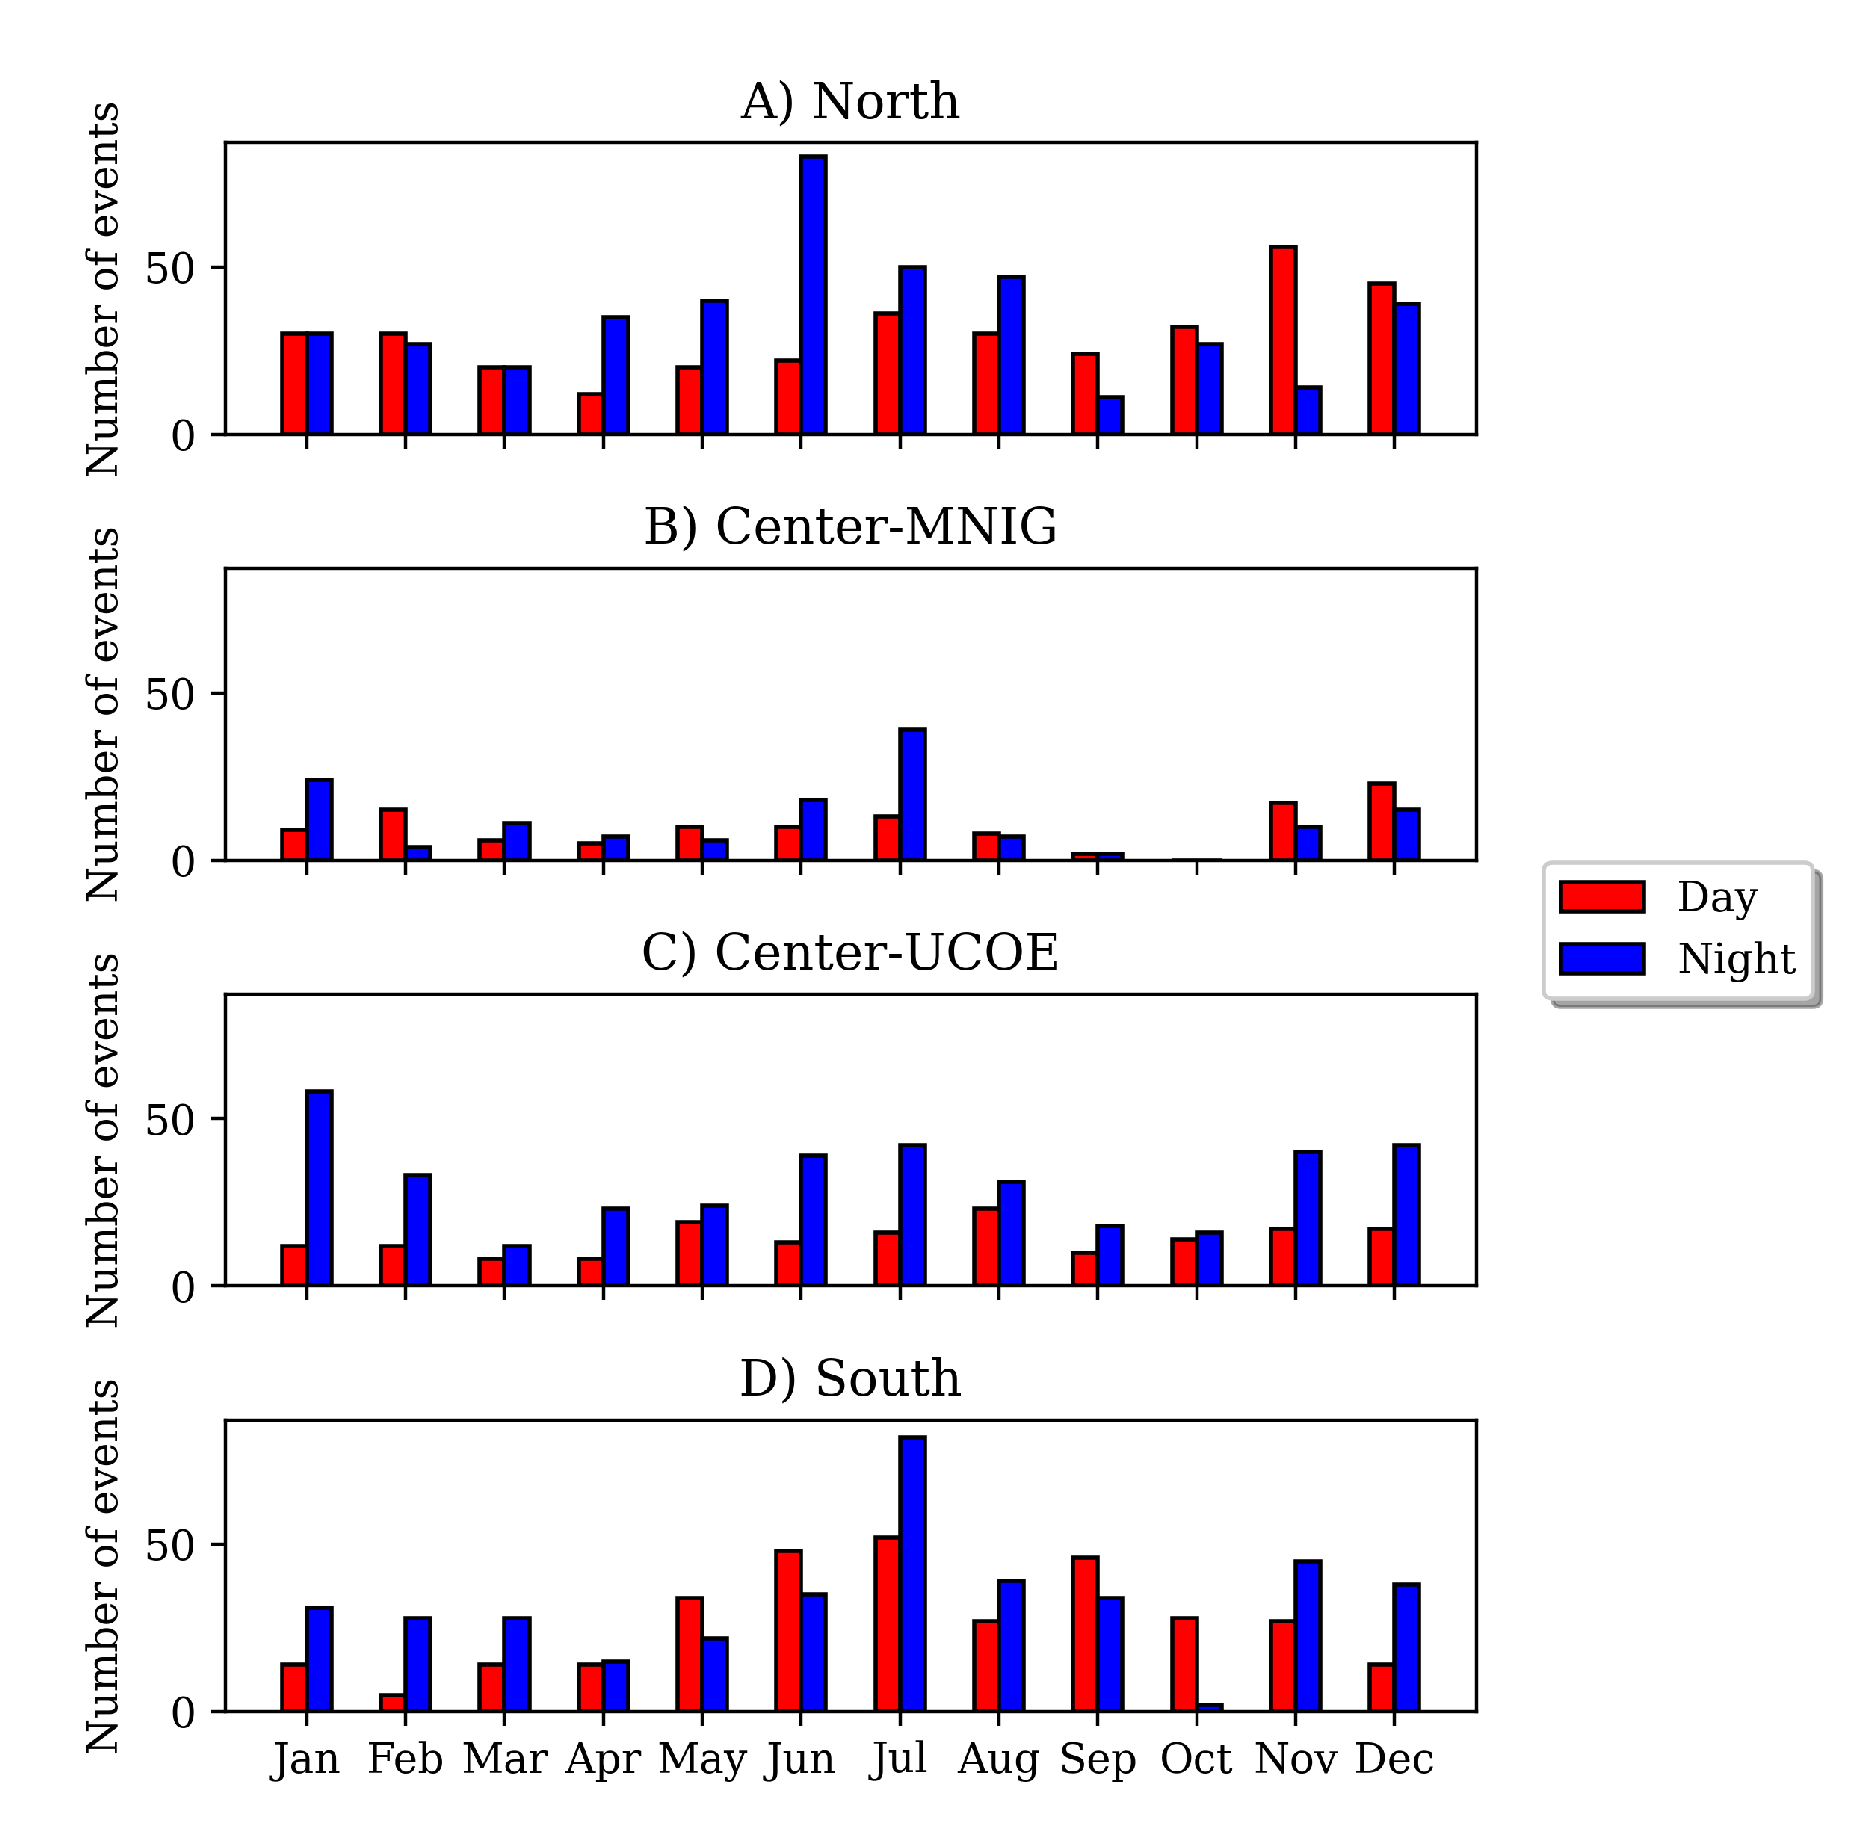
Figure 3 shows the monthly occurrence of MSTIDs events. Red and blue bars indicate the daytime and nighttime events, respectively. As we can observe in these plots, the number of events shows similarities between the three regions. For instance, most of the MSTIDs events occurred at night, exhibiting a predominance around mid-year (May, June, and July), especially in the northern and southern stations. This result suggests a high MSTIDs activity during summer. Also, UCOE station (center region) registered a large number of nighttime events during January, November, and December, suggesting a high MSTIDs activity during winter in this region.
At this point, we want to explore if there is a seasonal pattern to determine the disturbance’s origin. Thus, it is crucial to remember that the period of our study corresponds to a solar minimum, and only geomagnetically quiet days were considered. This means ionospheric variations should come from disturbances originated in the lower atmosphere [
15]. Moreover, as some authors have indicated, the occurrence time is also required to speculate on the origin of the disturbances. In this sense, to analyze the distribution of the occurrence time, we recorded the total number of MSTIDs events registered in a given month, which was taken as 100 %, and also the number of events registered per hour. Based on these quantities, we established the occurrence percentage of MSTIDs events every month and every hour.
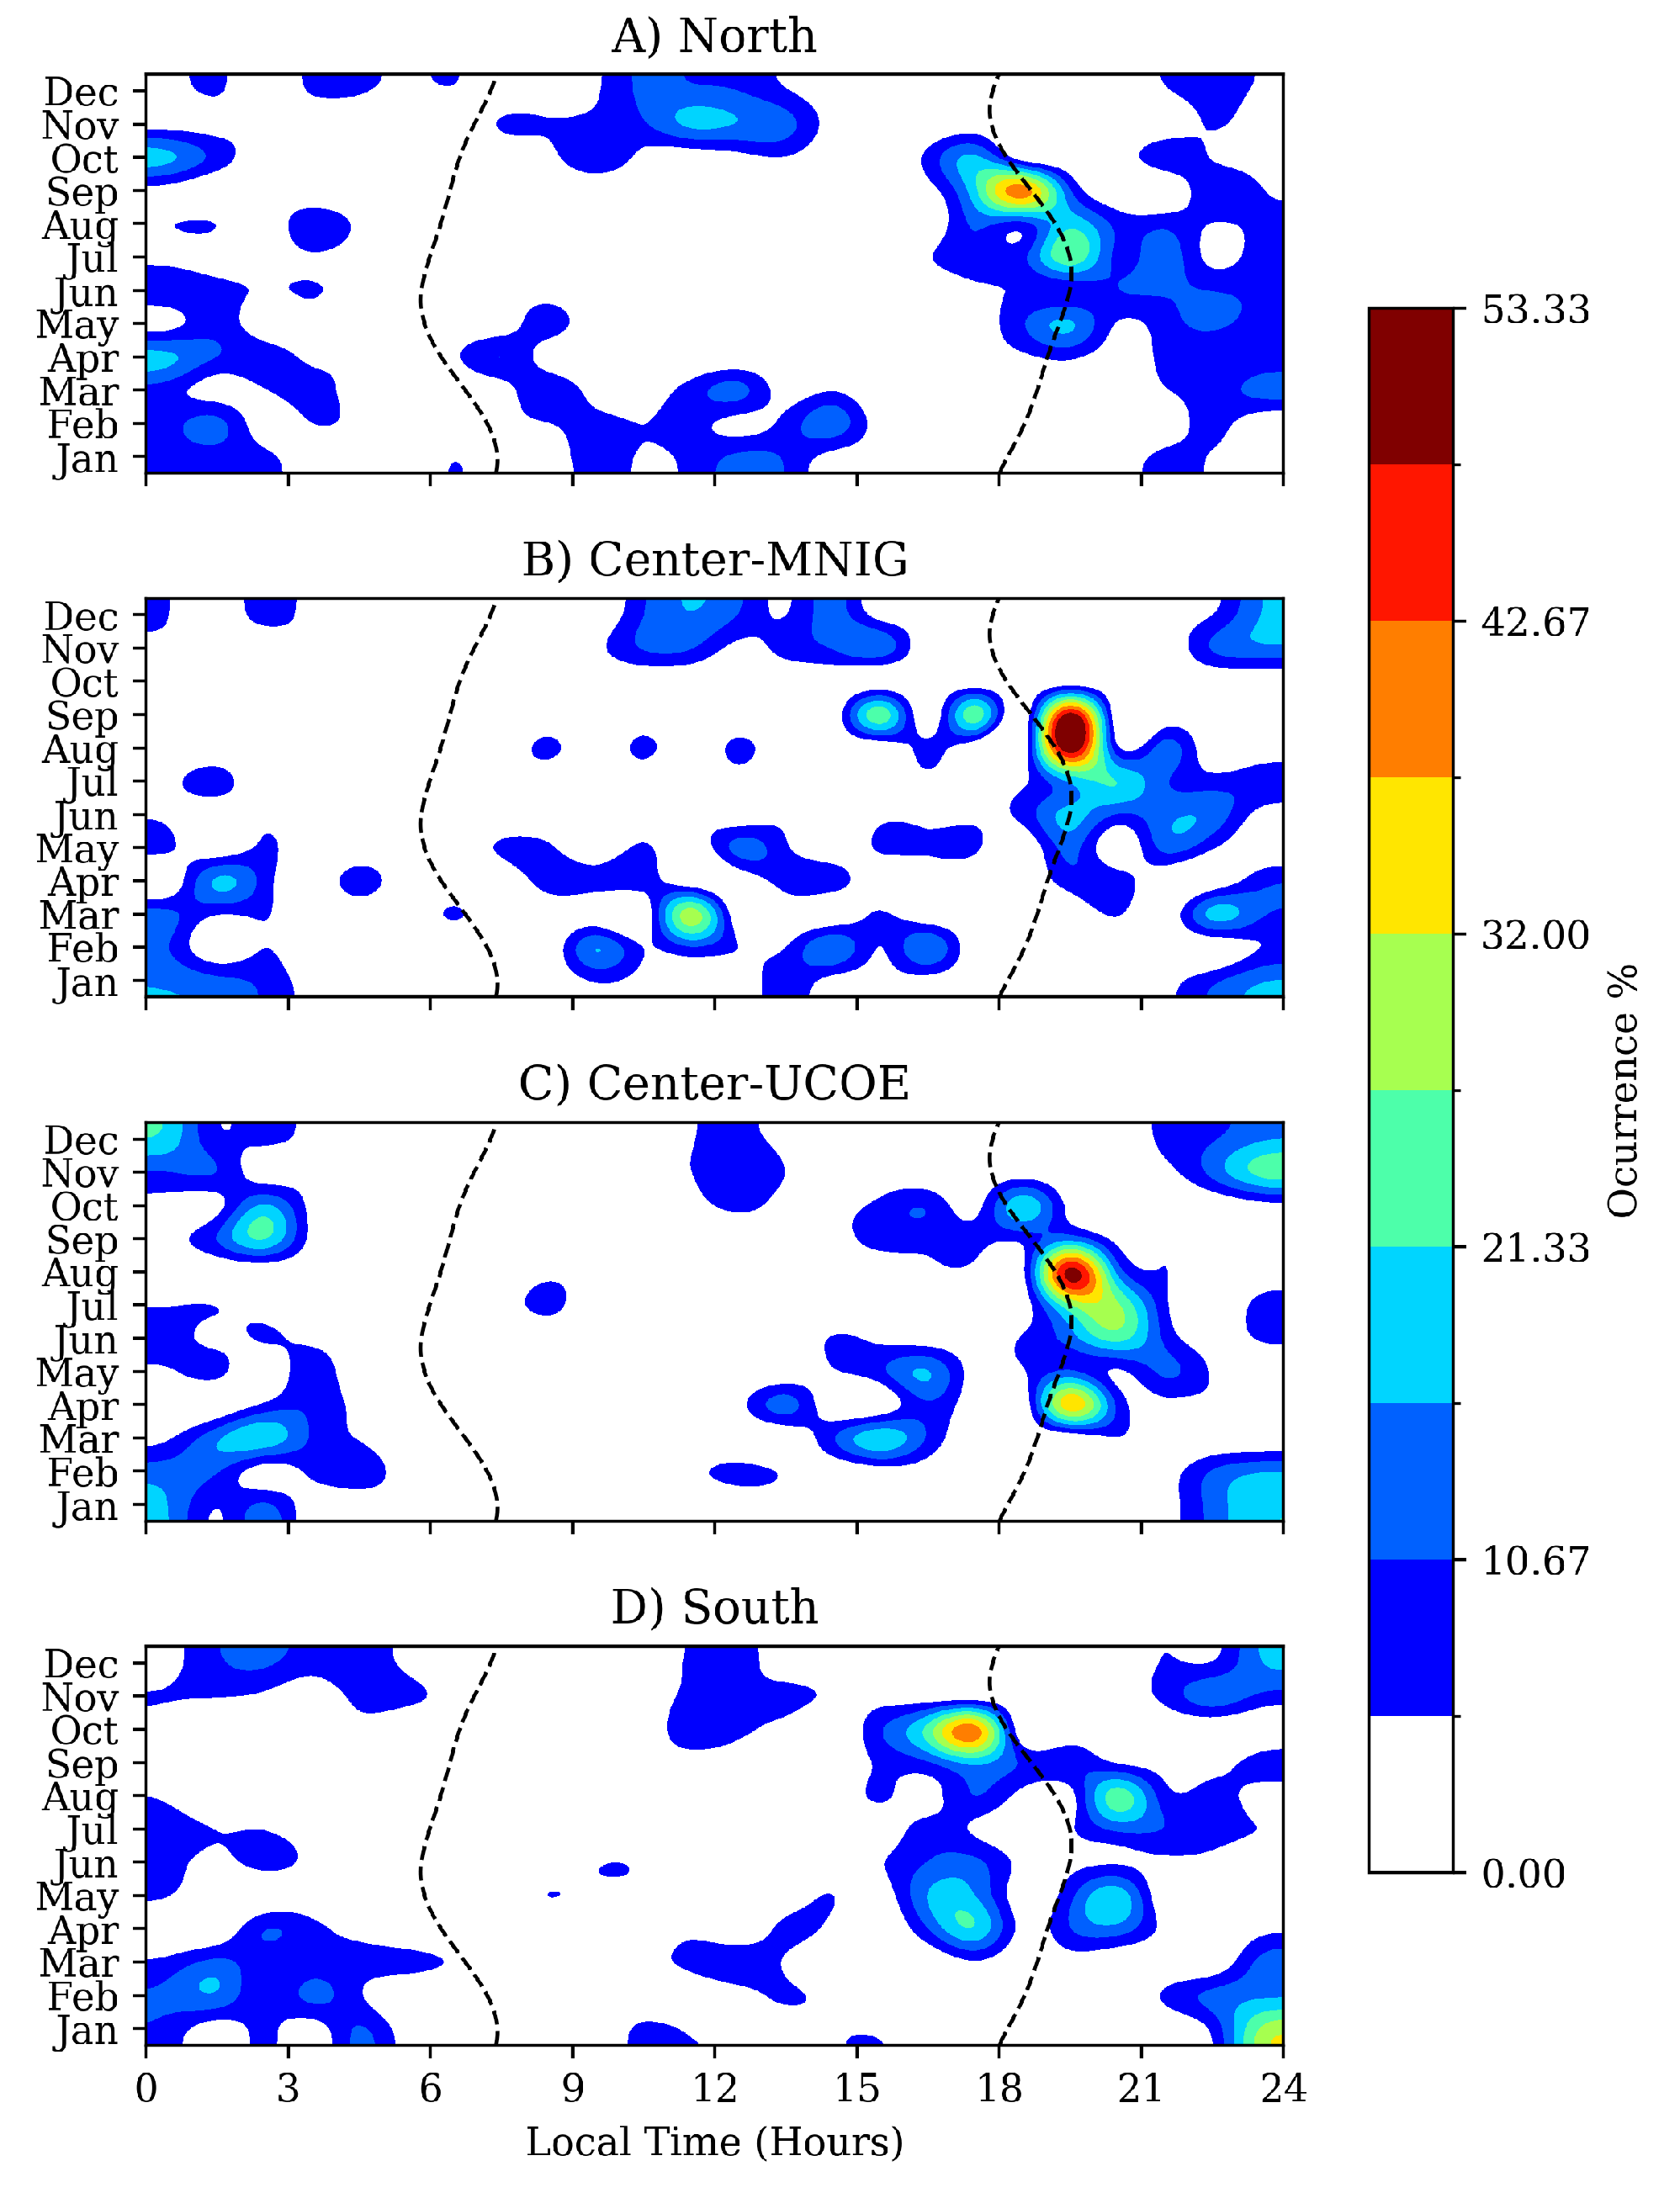
Figure 4 displays a map showing the hours and occurrence months to visualize the main MSTIDs activity for the three regions. Colors indicate the occurrence percentage of MSTID events, with dark red being the highest occurrence. As we can note, the color scale reaches up to 53.33 %, indicating that this percentage is the highest in the distribution of events throughout the months and hours. Also, it is important to highlight that just a few zones exhibited a high MSTIDs activity, located around the sunset terminator, mainly at night. In the northern region, there was a high MSTIDs activity from August to September, while in the southern region, this activity was more intense from September to October. For the center region, the MNIG station also exhibited high activity from August to September, and the UCOE station mainly did so during August. In addition, the MSTIDs activity remained significant during April, June, and July. Despite most events occurring at night, a significant percentage were registered around mid-day during January, November, and December.
A detailed inspection of
Figure 4 allows us to see that many MSTID events occurred around the sunset terminator for this period. Different studies have indicated that terminators are sources of MSTIDs because these regions aid tropospheric convective motions that, at the same time, are involved in the generation of secondary AGW traveling up to the thermosphere [
6,
10]. However, in this case, the MSTIDs were registered only during the sunset terminator. Similar results were obtained by Figueiredo et al. [
5] using low latitude stations. They also questioned on why MSTID events are not generated at sunrise terminator.
Additionally, the vertical temperature gradient is a necessary condition to generate atmospheric instability, which is one of the primary triggers for the convective motions in the troposphere [
1]. This condition is consistent with the high MSTIDs occurrence during summer when the temperature gradient at solar terminators is more significant.
3.2. Disturbance Energy
Considering TID as a mechanical wave, we can assume that its power is proportional to the wave’s energy, which at the same time is related to the squared amplitude. Following this assumption, we first analyzed the amplitude variability of MSTIDs to investigate the disturbance energy. Thus, a statistical analysis based on the median and quartiles of the MSTID amplitudes was developed.
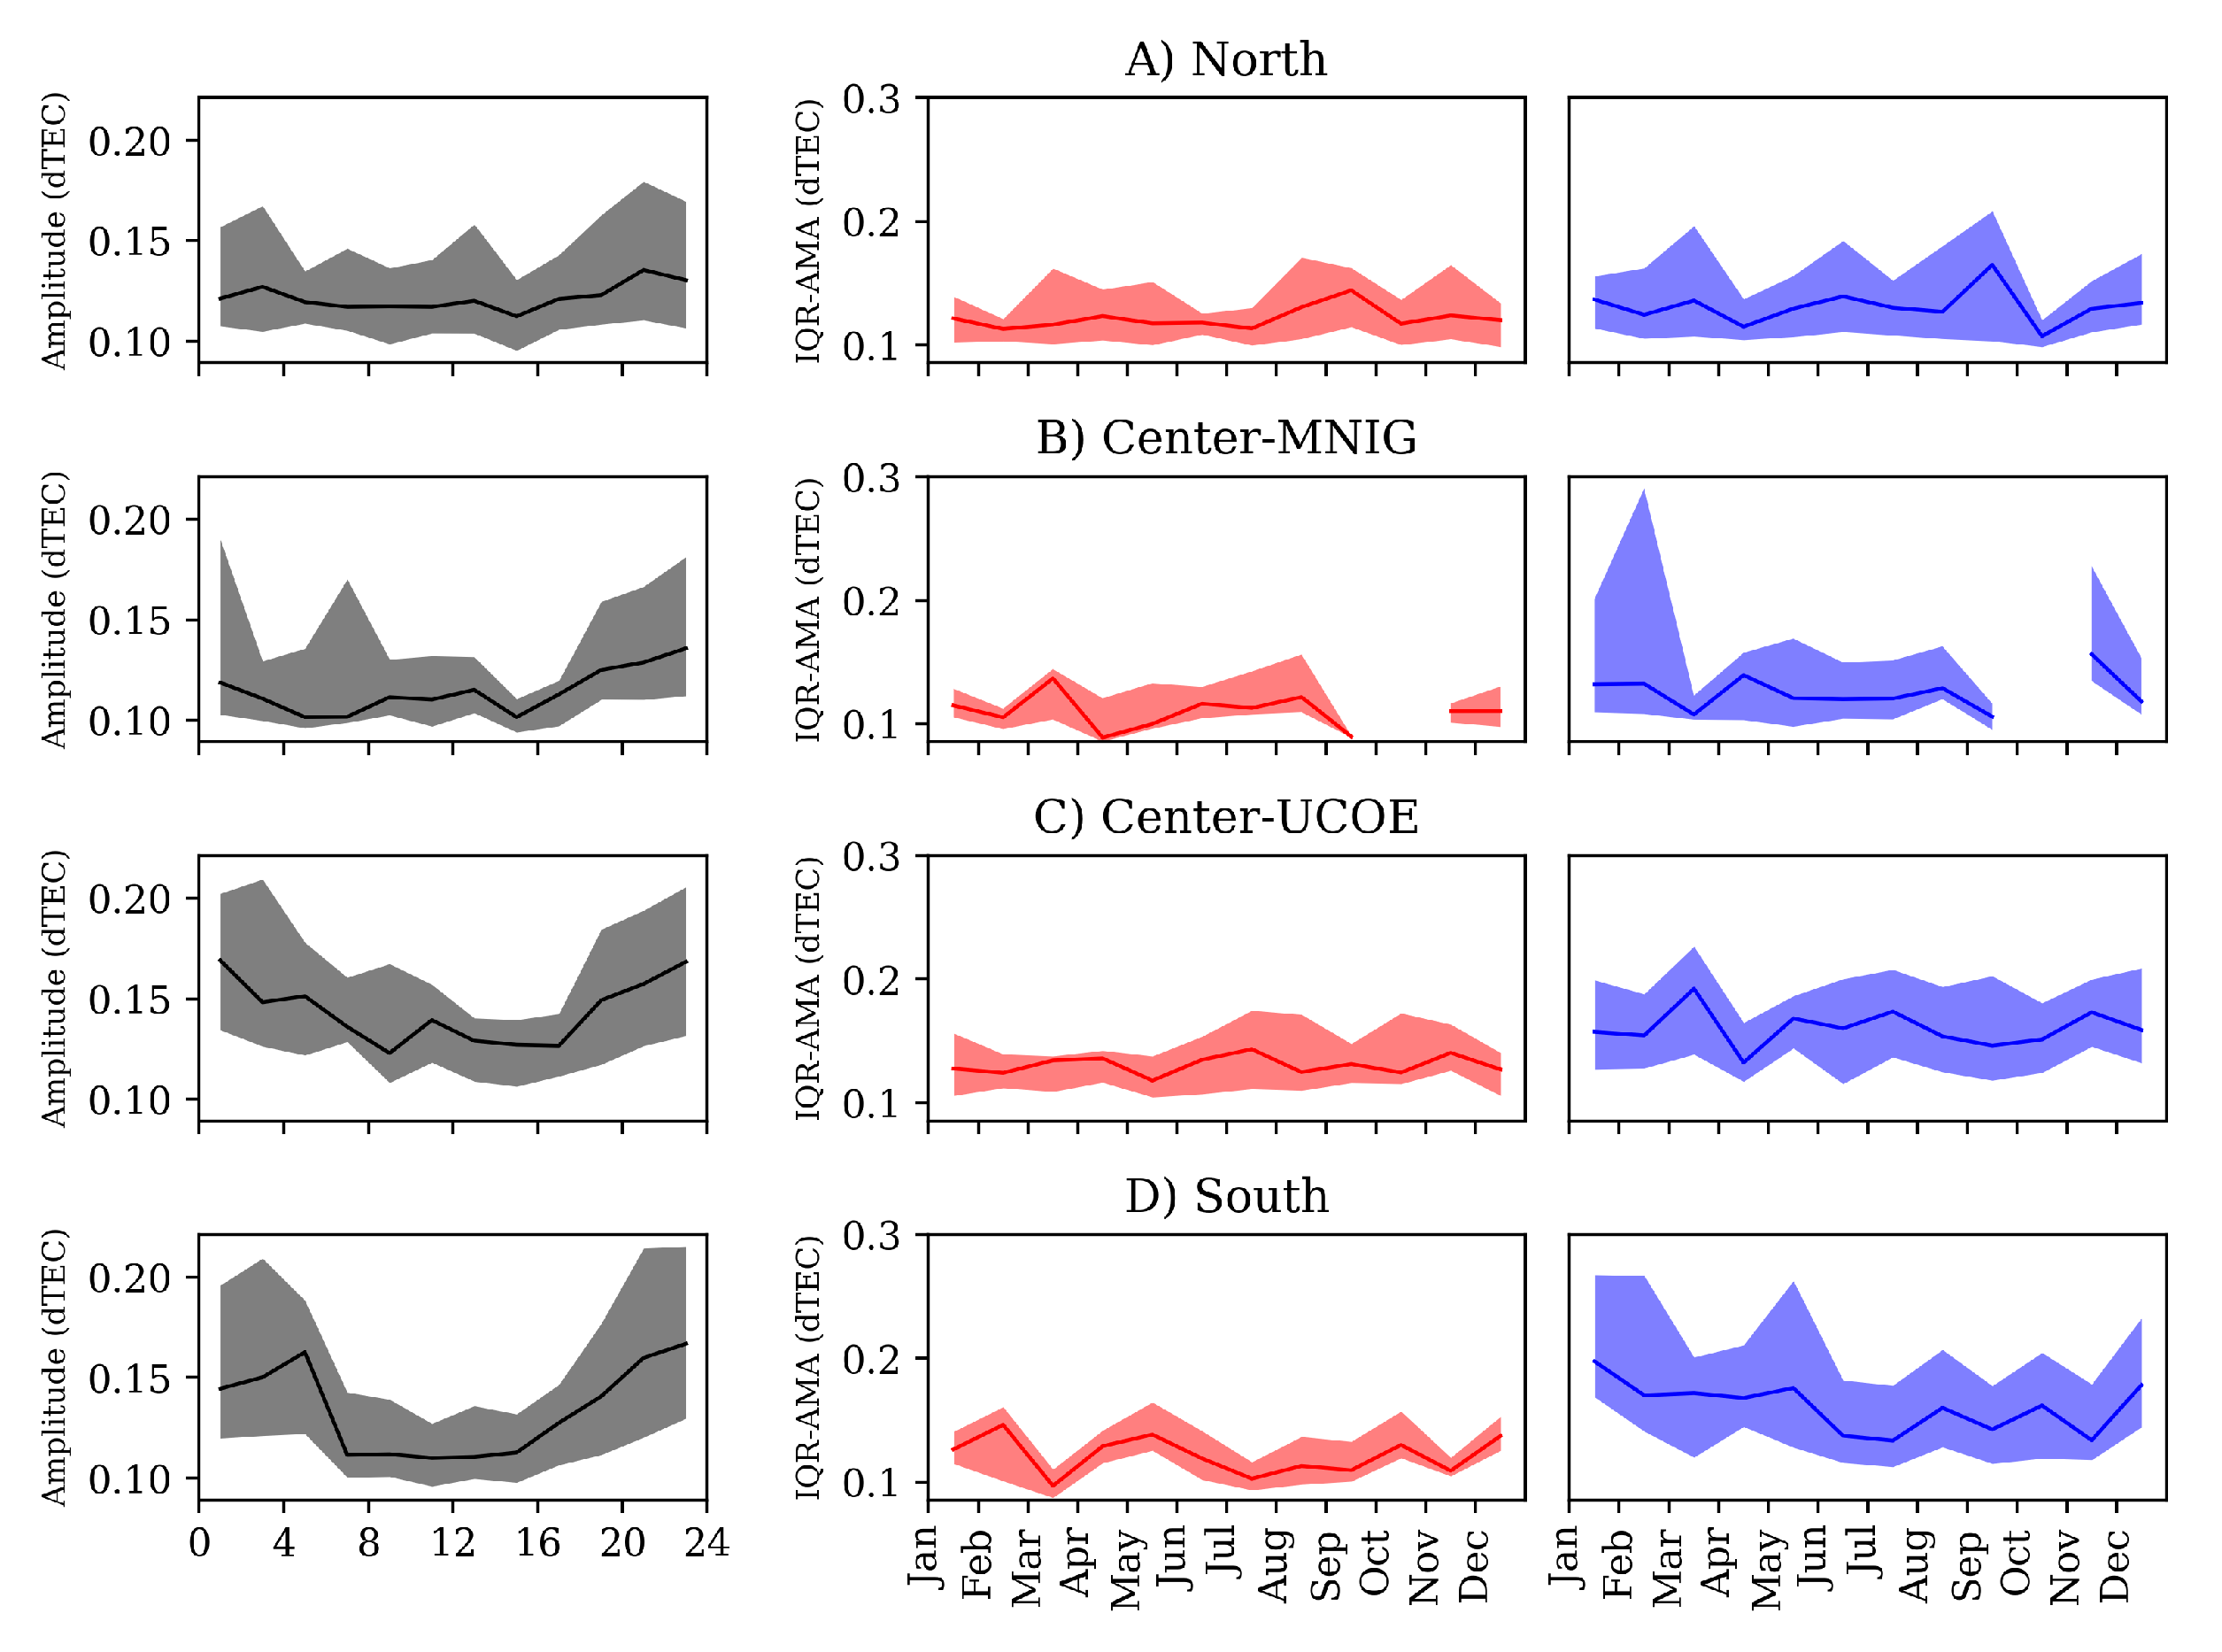
Figure 5 shows the amplitude variability as a function of the local time (left panels) and throughout the year (center and right panels) for day and nighttime (same color scheme as
Figure 3). On the left panels, the solid line corresponds to the median value, where the shadowed region symbolizes the first and third quartiles for the amplitude variation of MSTID with the local time, in which 50 % of the events are contained. As we can see, the local time analysis shows that the values of the amplitude median are very close (low variation), with values between 0.1 and 0.2 dTEC.
Nonetheless, the shadowed region is very wide, i.e., there is a high dispersion of the amplitudes, mainly at nighttime. This high dispersion also suggests that the largest amplitudes of MSTIDs occurred at night. Particularly for this study, the southern stations (CN24 and UNPM) registered the highest amplitude dispersion between 20:00 and 04:00 AM.
In
Figure 5, we also included the annual amplitude variability of MSTID events (center and right panels) to investigate if they were more frequent in some months than others. These plots were constructed by estimating the amplitude median (AMA) for each month and its respective first and third quartiles (IQR) to indicate the amplitude dispersion. This process was repeated for each time interval, daytime (red) and nighttime (blue). In this case, we did not identify a particular pattern. However, as observed in the local time plots, the amplitude dispersion at night was higher than during daytime. A similar behavior was identified using the MSTIDs’ power variation, in which nighttime events presented a higher power in comparison to daytime events.
Figure 6 summarizes the variability range between the first and third quartiles of the TID’s power. Here, we can visualize that the highest variability occurred near the solar terminators. As mentioned before, solar terminators are common sources of TIDs because, to first approximation, the transition between day and night generates atmospheric instabilities. Our results suggest that the most energetic MSTIDs occurred particularly around the sunset terminator for this period. This could mean that the energy transfer from the lower atmosphere is more efficient at night, possibly due to the reduction of ionospheric electron density throughout the sunset. This could be the answer for the question: why MSTID events are not generated at sunrise terminator.
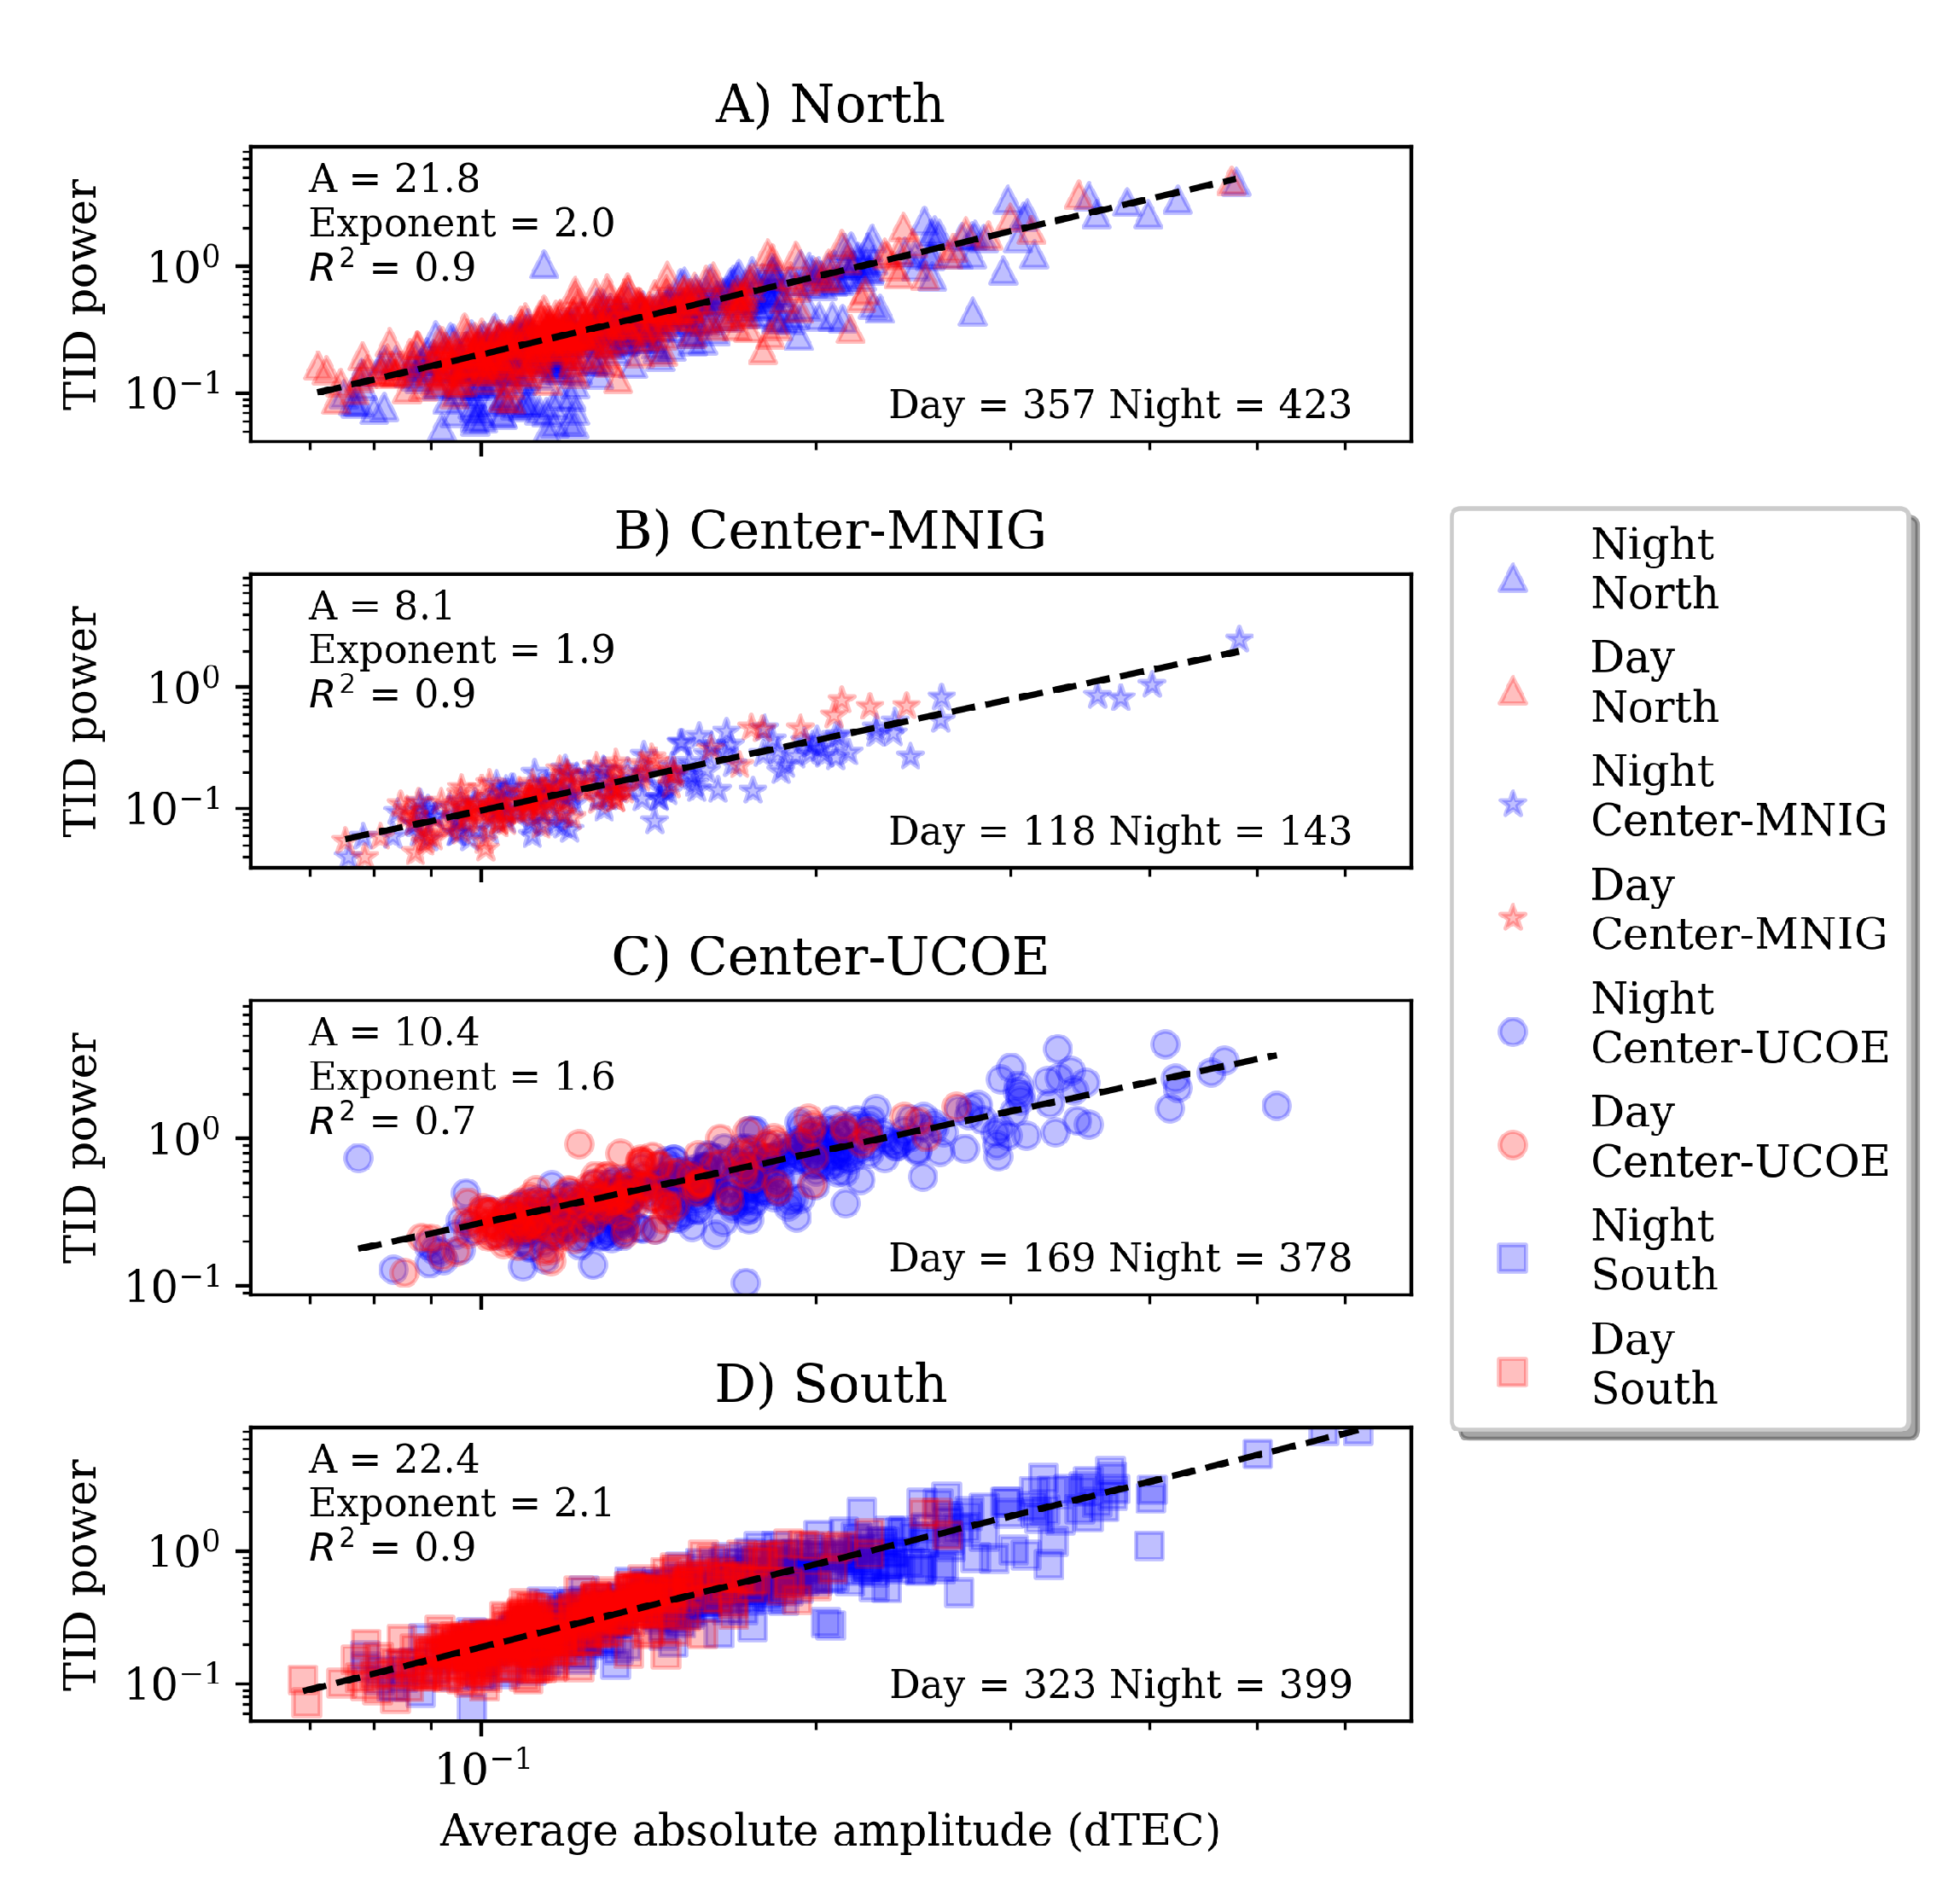
By exploring the relationship between the power and average amplitude of MSTIDs, we can also corroborate that the strongest MSTIDs occurred at night.
Figure 7 shows the power variation versus amplitude of MSTID events. Blue and red symbolize the day and night events, respectively. As we can note, the wave-like patterns did not exhibit amplitudes higher than 0.7 TECu during this period. According to previous studies, the average electron density over this region is around ≈ 12.9 ± 5 TECu at midnight, then falls in density represent 5.4 % [
24,
27].
3.3. Possible Mechanism for Generation
In general, ionospheric irregularities (plasma bubbles, TIDs) arise from complex dynamical processes seeded by plasma instabilities plus the physical conditions of the lower-upper atmosphere system. Thus, the development of MSTIDs combines different factors such as atmospheric conditions, wind patterns, geographical position, local time, season of the year, solar activity, etc. Here, we have explored some of the fundamental aspects of the MSTIDs, such as differences between day and night, occurrence patterns, geographical contrast and disturbance energy. To a first approximation, our results reveal that MSTID occurrence pattern is congruent with gravity wave observations, whose activity has been reported to be at its maximum in summer and winter [
6,
13].
As mentioned before, formation of gravity waves is, typically associated with convective motions in the lower atmosphere. These motions are originated by atmospheric instabilities, e.g. temperature differences between lower-upper atmosphere, orography, eathquakes, etc. In this regard, [
1] have suggested that temperature differences between troposphere and thermosphere are the key for the convective motions, highlighting the importance of lower-upper atmospheric coupling.
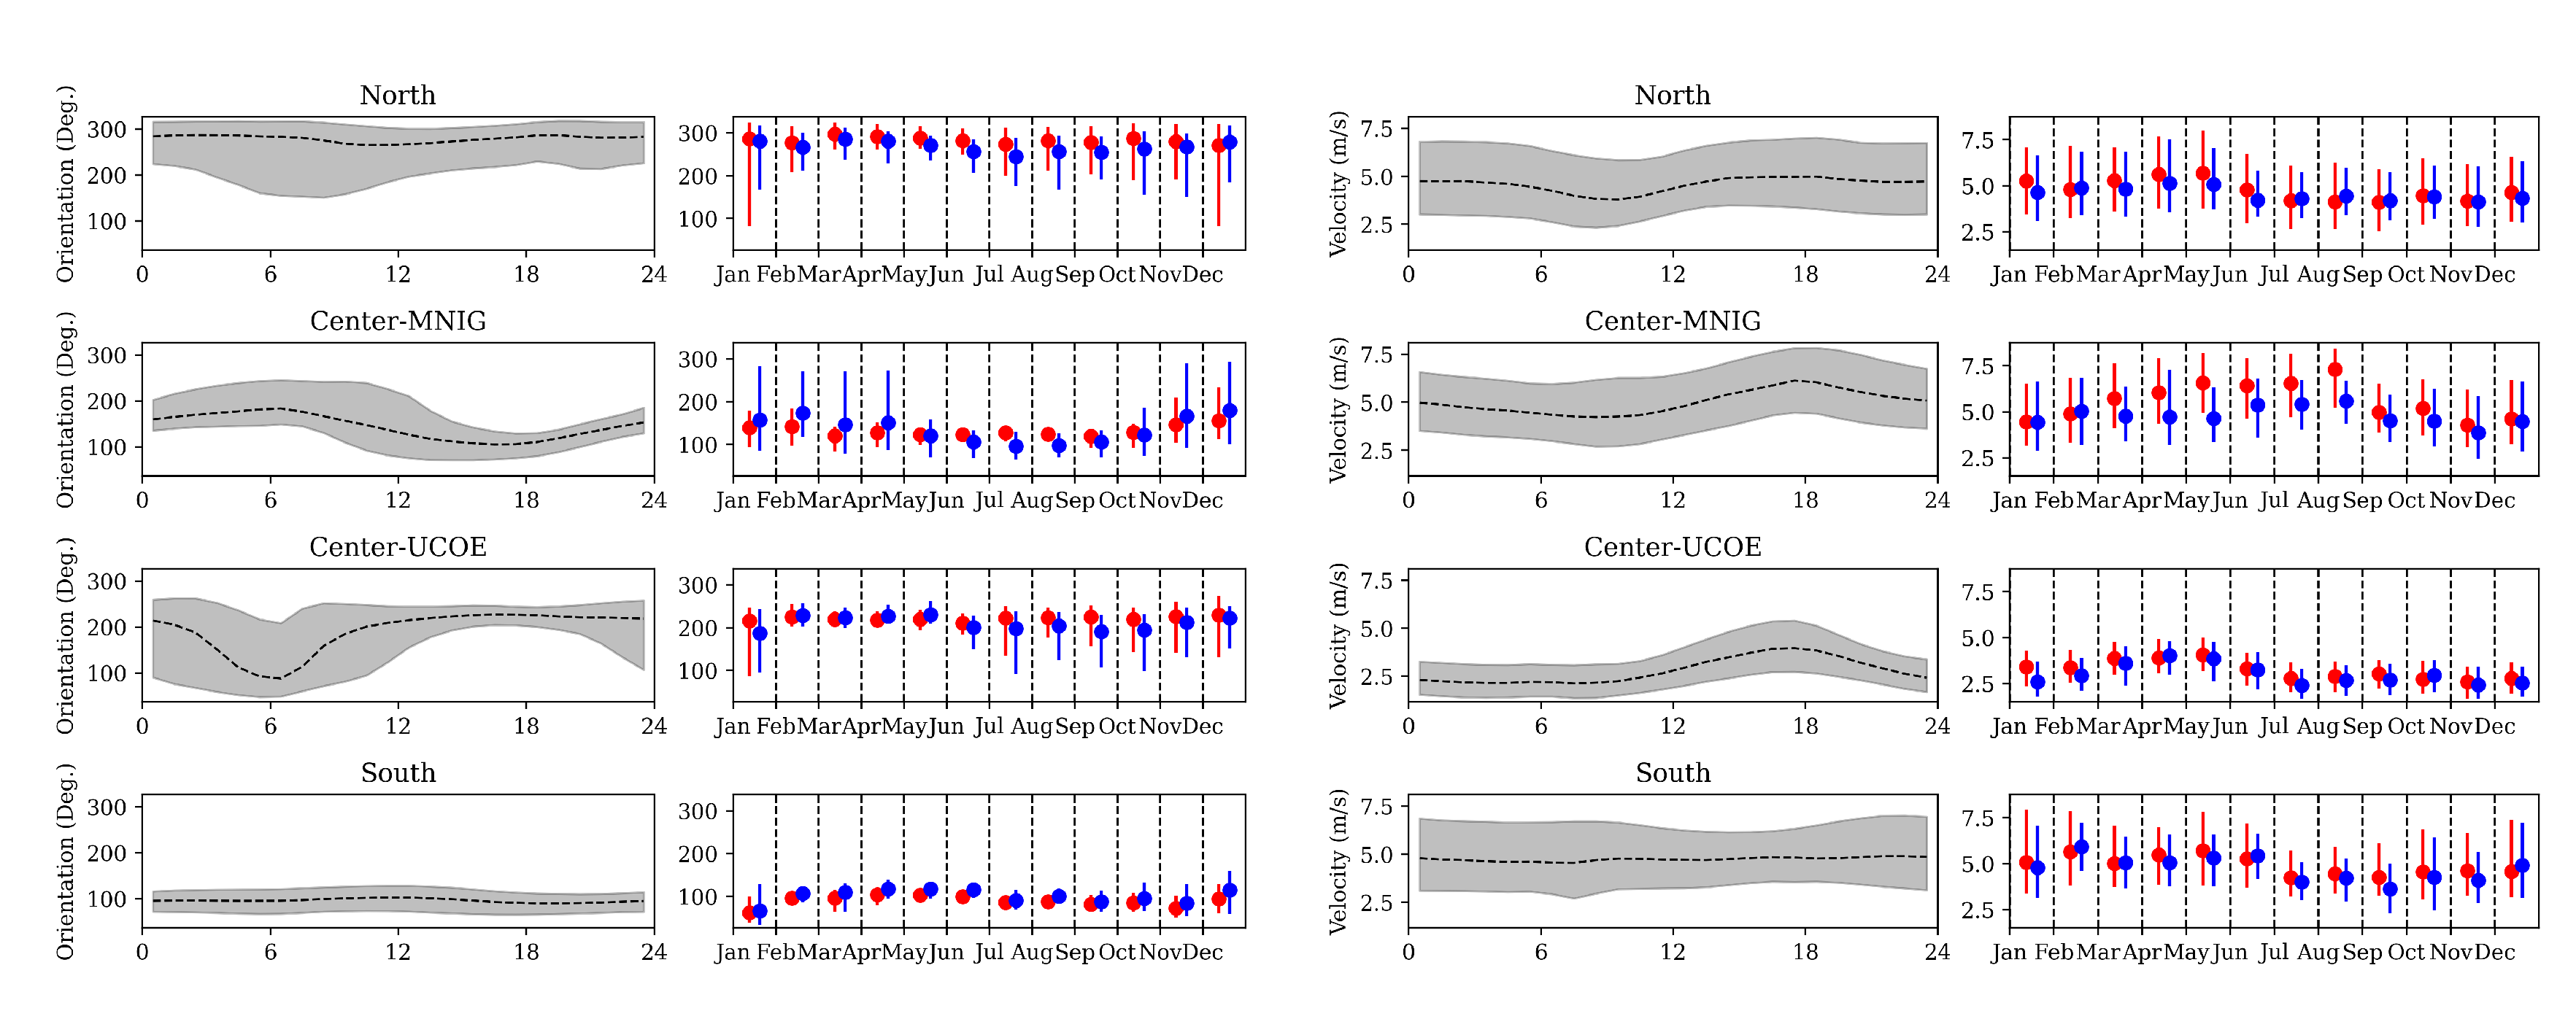
To explore the generation mechanism in more detail, we analyzed the neutral wind (orientation and velocity) and temperature profiles using data from the Prediction Of Worldwide Energy Resources (POWER) project, a compilation of data sets from new satellite systems [
31]. In this case, data were taken at the troposphere (≈ 50 meters above mean sea level). Following the structure in
Figure 5, the wind median for the orientation and velocity were calculated for every hour and month.
Figure 8(a) shows the orientation median of neutral wind for hours (left) and months (right), while
Figure 8(b) corresponds to the median velocity of neutral wind for hours (left) and months (right). Blue and red circles symbolize the monthly median for daytime and nighttime events. The wind variability of orientation and velocity do not exhibit a clear pattern that can explain the generation of disturbances in the thermosphere. Wind orientation shows a considerable change during the morning (6 AM to 12 PM) in the north and center regions. However, the main occurrence time for MSTIDs in the three regions was around the sunset terminator (17:00 to 20:00 LT), which means that changes in wind orientation are not correlated with the MSTIDs occurrence.
On the other hand, the wind velocity pattern presented an increment during the night. Although the velocity range was small (from 2.5 to 7.5 km/h), the median velocity exhibited an enhancement at night. Particularly at geographical positions such as UCOE station, this enhancement remained from April to June (spring). A similar behavior was observed in the northern region. Besides, the wind velocity pattern presented the highest values around MNIG station from April to August.
It is important to highlight that velocity increments occurred during spring and summer, when the highest temperatures are registered in Mexico. In this sense, this variability in the troposphere at night could amplify the convective motions and the disturbance development in the mesosphere (gravity waves) and thermosphere (MSTIs). Additionally, hurricane season in Mexico usually goes from May to November, which may be another trigger for MSTIDs development. However, further studies are necessary.
4. Conclusions
The MSTIDs are ionospheric irregularities seeded by plasma instabilities and physical conditions in the lower-upper atmosphere. Their development combines different factors such as atmospheric conditions, wind patterns, geographical position, local time, season of the year, solar activity, etc. We presented the analysis of MSTID events over the Mexican territory during 2018 and 2019, minimum activity of solar cycle 24. Based on GNSS data from SSN-TLALOCNet network, we explored some of the fundamental aspects of MSTIDs, such as differences between day and night events, seasonal variability, geographical contrast and disturbance energy. The main results can be summarized as follows:
The MSTID events were predominant at night for this period.
Most of the nighttime events were registered near the sunset terminator.
Nighttime events exhibited the highest amplitude and energy variations.
The maximum MSTIDs activity occurred in summer for north and south regions; while for the center region, most of the events were registered in winter. These periods are coincident with gravity waves observations.
According to POWER data analysis, a high variability in wind velocity pattern was registered during spring and summer, mainly at night, which coincides with the MSTIDs occurrence (May - July). Thus, part of the MSTIDs activity could be related to this wind variability.
Author Contributions
For research articles with several authors, a short paragraph specifying their individual contributions must be provided. The following statements should be used “Conceptualization, E.Romero-Hernandez, F. Salinas-Samaniego and O.Jonah; methodology, E. Romero-Hernandez, F. Salinas-Samaniego, E. Aguilar-Rodriguez and M. Rodriguez-Martinez; software, F. Salinas-Samaniego and R. Aguirre-Gutierrez; validation, O.Jonah, G.A.S. Picanço, C.M. Denardini, M. Sergeeva and A. Gonzalez-Esparza; formal analysis, E. Romero-Hernandez and F. Salinas-Samaniego; investigation, E. Romero-Hernandez and O.Jonah; resources; data curation, F. Salinas-Samaniego; writing—original draft preparation, E.Romero-Hernandez; writing–review and editing, O. Jonah, E. Aguilar-Rodriguez, C. Guerrero-Peña, F. A. García-Castillo, S. Ayala-Gomez, and E. Perez-Tijerina; funding acquisition, M. Rodriguez-Martinez, E. Perez-Tijerina. All authors have read and agreed to the published version of the manuscript.”
Acknowledgments
E. Romero-Hernandez acknowledges support from PAICYT project 273-CE-2022 and CONAHCYT project CF-2023-G-364. E. Aguilar-Rodriguez acknowledges support from DGAPA/PAPIIT project IN106224, and CONAHCYT project CF-2023-G-364. MRM acknowledges support from DGAPA project (IN115423).
References
- Borchevkina, O.P. , Adamson, S.O., Dyakov, Y.A., Karpov, I.V., Golubkov, G.V., Wang, P.-K., and Golubkov, M.G. The Influence of Tropospheric Processes on Disturbances in the D and E Ionospheric Layers. Atmosphere. 2021, 12, 1116. [Google Scholar]
- Cabral-Cano E., X. Pérez-Campos, B. Márquez-Azúa, M. A. Sergeeva, L. Salazar-Tlaczani, C. DeMets, D. Adams, J. Galetzka, K. Hodgkinson, K. Feaux, Y. L. Serra, G. S. Mattioli, M. Miller. TLALOCNet: A Continuous GPS-Met Backbone in Mexico for Seismotectonic and Atmospheric Research. Seismological Research Letters 2018, 80(2A), 373–381. [Google Scholar]
- Cosgrove, R. B. , Tsunoda, R. T., Fukao, S., and Yamamoto, M. Coupling of the Perkins instability and the sporadic E layer instability derived from physical arguments. J. Geophys. Res. Space Physics 2004, 100(A6), 1–11. [Google Scholar]
- Doane, D.P. Aesthetic frequency classification. American Statistician 1976, 30, 181–183. [Google Scholar] [CrossRef]
- Figueiredo, C. A. O. B. , Takahashi, H., Wrasse, C. M., Otsuka, Y., Shiokawa, K., and Barros, D. Medium-scle traveling ionospheric disturbances observed by detrended total electron content maps over Brazil. J. Geophys. Res. Space Physics , 2018, 123, 2215–2227. [Google Scholar] [CrossRef]
- Fritts, D.C. and Alexander, M.J. Gravity wave dynamics and effects in the middle atmosphere. Rev. Geophys. 2003, 41, 1003:1–1003:64. [Google Scholar] [CrossRef]
- Hernández-Pajares, M. ,J.M. Juan, J. Sanz, and A. Aragón-Àngel. Propagation of medium scale traveling ionospheric disturbances at different latitudes and solar cycle conditions, Radio Sci. 2012, 47, RS0K05.
- Hocke, K, and Schlegel, K. A. Review of atmospheric gravity waves and travelling ionospheric disturbances: 1982 - 1995. Ann. Geophysique 1996, 14(9), 917–940.
- Jonah, O. F., E. A. Kherani, and E. R. De Paula. Observation of TEC perturbation associated with medium-scale traveling ionospheric disturbance and possible seeding mechanism of atmospheric gravity wave at a Brazilian sector. J. Geophys. Res. Space Physics 2016, 121, 2531–2546. [Google Scholar] [CrossRef]
- Jonah, O. F. , Coster, A., Zhang, S., Goncharenko, L., Erickson, P. J., de Paula, E. R., and Kherani, E. A. TID observations and source analysis during the 2017 Memorial Day weekend geomagnetic storm over North America. J. Geophys. Res. Space Physics 2018, 123, 8749–8765. [Google Scholar] [CrossRef]
- Kelley, M. C. On the origin of mesoscale TIDs at midlatitudes, Ann. Geophys. 2011, 29, 361–366. [Google Scholar]
- Kotake, N. , Otsuka, Y., Tsugawa, T., Ogawa, T., and Saito, A. Climatological study of GPS total electron content variations caused by medium-scale traveling ionospheric disturbances. J. Geophys. Res. Space Physics 2006, 111(A4), A04306. [Google Scholar]
- Kotake, N. , Otsuka, Y., Tsugawa, T., Ogawa, T., and Saito, A. A Statistical study of medium-scale traveling ionospheric disturbances observed with the GPS networks in Southern California. Earth, Planets and Space 2007, 59(2), 95–102. [Google Scholar] [CrossRef]
- Lee, W. K. , Kil, H., and Paxton, L. J. Global distribution of nighttime MSTIDs and its association with E region irregularities seen by CHAMP satellite. J. Geophys. Res. Space Physics 2021, 126(5), e2020JA028836. [Google Scholar] [CrossRef]
- Liu, Y. , Zhou, C., Xu, T., Tang, Q., Deng, Z. X., Chen, G. Y. and Wang, Z. K. Review of ionospheric irregularities and ionospheric electrodynamic coupling in the middle latitude region. Earth Planet. Phys. 2021, 5(4), 1–21. [Google Scholar] [CrossRef]
- MacDougall, J. , Abdu, M., Batista, I., Fagundes, P. R., Sahai, Y., and Jayachandran, P. T. On the production of traveling ionospheric disturbances by atmospheric gravity waves. J. Atmos. Sol. Terr. Phys. 2006, 71(17-18), 200–2016. [Google Scholar]
- Makela, Jonathan J. and Otsuka Y. Overview of Nighttime Ionospheric Instabilities at Low- and Mid-Latitudes: Coupling Aspects Resulting in Structuring at the Mesoscale. Space Sci Rev 2012, 168, 419–440. [Google Scholar] [CrossRef]
- Oluwadare, T.S. , Jakowski, N., Valladares, C.E. et al. Climatology of Medium-Scale Traveling Ionospheric Disturbances (MSTIDs) Observed with GPS Networks in the North African Region. Pure Appl. Geophys. 2022, 179, 2617. [Google Scholar] [CrossRef]
- Otsuka, Y. , Kotake, N., Shiokawa, K., Ogawa, T., Tsugawa, T., and Saito, A. Statistical study of medium-scale traveling ionospheric disturbances observed with a GPS receoiver network in Japan. In Aeronomy of the Earth’s atmosphere and ionosphere; IAGA Special Sopron Book Series, 2011; pp. 291–299.
- Otsuka, Y. , Suzuki, K., Nakagawa, S., Nishioka, M., Shiokawa, K., and Tsugawa, T. GPS observations of medium-scale traveling ionospheric disturbances over Europe. Ann. Geophys. 2013, 31(2), 163–172. [Google Scholar] [CrossRef]
- Otsuka, Y. , Shinbori, A., Tsugawa, T., and Nishioka, M. Solar activity dependence of medium-scale traveling ionospheric disturbances using GPS receivers in Japan. Earth Planets and Space 2021, 73(1), 22. [Google Scholar] [CrossRef]
- Perkins, F. Spread F and ionospheric currents. J. Geophys. Res. 1973, 78, 218–226. [Google Scholar] [CrossRef]
- Rama Rao P. V. S., S. Gopi Krishna, K. Niranjan, and D. S. V. V. D. Prasad. Temporal and spatial variations in TEC using simultaneous measurements from the Indian GPS network of receivers during the low solar activity period of 2004-2005. Ann. Geophys. 2008, 24, 3279–3292. [Google Scholar] [CrossRef]
- Romero-Hernandez, E. , Denardini, C. M., Jonah, O. F., Essien, P., Picanço, G. A. S., Nogueira, P. A. B., et al. Nighttime ionospheric TEC study over Latin America during moderate and high solar activity. J. Geophys. Res. Space Physics 2020, 125, e2020JA028210. [Google Scholar] [CrossRef]
- Savitzky, A. , and Golay, M. J. E. Smoothing and differentiation of data by simplified least squares procedures. Analytical Chemistry 1964, 36, 1627–1639. [Google Scholar] [CrossRef]
- Seemala, G. K. , and C. E. Valladares. Statistics of total electron content depletions observed over the South American continent for the year 2008. Radio Sci. 2011, 46, RS5019. [Google Scholar] [CrossRef]
- Sergeeva, M.A. , Maltseva O.A., Gonzalez-Esparza J.A., Mejia-Ambriz J.C., De la Luz V., P. Corona-Romero, L.X. Gonzalez, V.J. Gatica-Acevedo, Romero-Hernandez E., Rodriguez-Martinez M., Aguilar-Rodriguez E. TEC behavior over the Mexican region, Ann. Geophys. 2018, 61(1), GM104.
- Terra, P. , Vargas, F., Brum, C. G. M., and Miller, E. S. Geomagnetic and solar dependency of MSTIDs occurrence rate: A climatology based on airglow observations from the Arecibo observatory ROF. J. Geophys. Res. Space Physics 2020, 125(7), e2019JA027770. [Google Scholar] [CrossRef]
- Torrence, C. and Compo G.P. A practical guide to wavelet analysis. Bull. Am. Meteorol. Soc. 1998, 79, 61–78. [Google Scholar] [CrossRef]
- Tsugawa, T. , Kotake, N., Otsuka, Y. et al. Medium-scale traveling ionospheric disturbances observed by GPS receiver network in Japan: a short review. GPS Solut. 2007, 11, 139–144. [Google Scholar] [CrossRef]
- NASA Prediction Of Worldwide Energy Resources Project. Available online: https://power.larc.nasa.gov/.
Figure 1.
The detrended signal from one satellite (up) and its continuous wavelet transform (down). The color code symbolizes the intensity of each period.
Figure 1.
The detrended signal from one satellite (up) and its continuous wavelet transform (down). The color code symbolizes the intensity of each period.
Figure 2.
Distribution of TIDs periodicities observed in the three regions of the Mexican territory: a) North, b) Center-MNIG, c) Center-UCOE, and d) South. The dashed line is the probability density function for both daytime (red) and nighttime (blue) TIDs events.
Figure 2.
Distribution of TIDs periodicities observed in the three regions of the Mexican territory: a) North, b) Center-MNIG, c) Center-UCOE, and d) South. The dashed line is the probability density function for both daytime (red) and nighttime (blue) TIDs events.
Figure 3.
Monthly occurrence of MSTID events observed in the three regions: A) North, B) Center-MNIG, C) Center-UCOE, and D) South. Blue and red colors indicate nighttime and daytime events, respectively.
Figure 3.
Monthly occurrence of MSTID events observed in the three regions: A) North, B) Center-MNIG, C) Center-UCOE, and D) South. Blue and red colors indicate nighttime and daytime events, respectively.
Figure 4.
Percentage distribution of occurrence of MSTID events by hours and months. The color scale indicates the occurrence percentage, with dark red being the highest occurrence. Dashed lines represent solar terminators.
Figure 4.
Percentage distribution of occurrence of MSTID events by hours and months. The color scale indicates the occurrence percentage, with dark red being the highest occurrence. Dashed lines represent solar terminators.
Figure 5.
Amplitude variation of dTEC for both local time and months through the year. The plots in each row are referred to as A) North region, B) Center-MNIG, C) Center-UCOE, and D) South region. Solid lines represent the median, while the colored region indicates the variation between the first and third quartiles (IQR).
Figure 6.
Distribution of the IQR’s power variability throughout the months and hours. Dark red indicates the maximum power variation, and dashed lines represent the solar terminators.
Figure 6.
Distribution of the IQR’s power variability throughout the months and hours. Dark red indicates the maximum power variation, and dashed lines represent the solar terminators.
Figure 7.
Power variation versus the amplitude of MSTID events. The symbols indicate each region: A)North, B) Center-MNIG, C) Center-UCOE, and D) South. Blue and red refer to daytime and nighttime events.
Figure 7.
Power variation versus the amplitude of MSTID events. The symbols indicate each region: A)North, B) Center-MNIG, C) Center-UCOE, and D) South. Blue and red refer to daytime and nighttime events.
Figure 8.
(a) Variation of wind orientation throughout the hours (left) and months (right) for the three regions. (b) Variation of wind velocity throughout the hours (left) and months (right) for the three regions. The gray zone corresponds to the IQR variation, and blue and red circles represent the monthly median values for day and night events, respectively.
Table 1.
List of GNSS receivers across mexican territory used to identify TID events. Columns correspond to the receiver station name, geographic position, and magnetic position (magnetic latitude ≡ mlat and magnetic longitude ≡ mlon). The map on the right shows the three regions for this study with different colors: north in yellow, center in red, and south in green.
Table 2.
Periodicity and number of TID events identified for each region.
Table 2.
Periodicity and number of TID events identified for each region.
| |
Daytime |
Nighttime |
| Region |
Period (minutes) |
of events |
Period (minutes) |
# of events |
| North |
37.1 ± 0.4 |
357 |
31.9 ± 0.3 |
423 |
| Center-MNIG |
37.1 ± 1.0 |
118*
|
27.5 ± 0.6 |
143*
|
| Center-UCOE |
35.7 ± 0.7 |
169 |
30.6 ± 0.8 |
378 |
| South |
34.9 ± 0.9 |
323 |
30.3 ± 0.3 |
399 |
|
Disclaimer/Publisher’s Note: The statements, opinions and data contained in all publications are solely those of the individual author(s) and contributor(s) and not of MDPI and/or the editor(s). MDPI and/or the editor(s) disclaim responsibility for any injury to people or property resulting from any ideas, methods, instructions or products referred to in the content. |
© 2024 by the authors. Licensee MDPI, Basel, Switzerland. This article is an open access article distributed under the terms and conditions of the Creative Commons Attribution (CC BY) license (http://creativecommons.org/licenses/by/4.0/).
