Preprint
Article

Metabolomic and Transcriptomic Analyses Revealed Lipid Differentiation Mechanisms in Agaricus bisporus at Ambient Conditions

Altmetrics

Downloads

84

Views

34

Comments

0

A peer-reviewed article of this preprint also exists.

Submitted:

07 June 2024

Posted:

11 June 2024

You are already at the latest version

Alerts
Abstract
Agaricus bisporus is one of the most popular mushroom species in the world; however, mushrooms are highly susceptible to browning due to the absence of a protective cuticle layer and high respiration rate. The molecular mechanism underlying the process of mushroom browningneeds to be explored. Here, we analyzed the transcriptomic and metabolomic data from A. bisporusat ambient temperature. Specifically, a total of 263 significantly changed metabolites and 4492 differentially expressed genes were identified. Lipid metabolites associated with cell membrane degradation were predominantly up-regulated during ambient storage. Transcriptomic data further revealed the alterations of the expression of membrane lipid metabolism-related enzymes. Additionally, energy metabolic processes and products such as glycolysis and linoleic acid changed significantly during ambient storage, indicating their potential roles in the quality deterioration of A. bisporus. These findings provide new insights into the underlyingl ipidmetabolic mechanism of A. bisporus during postharvest ambient storage and will provide values for mushroom preservation techniques.
Keywords: 
Subject: Biology and Life Sciences  -   Food Science and Technology

1. Introduction

The introduction should briefly place the study in a broad context and highlight why it is important. It should define the purpose of the work and its significance. The current state of the research field should be carefully reviewed and key publications cited. Please highlight controversial and diverging hypotheses when necessary. Finally, briefly mention the main aim of the work and highlight the principal conclusions. As far as possible, please keep the introduction comprehensible to scientists outside your particular field of research. References should be numbered in order of appearance and indicated by a numeral or numerals in square brackets—e.g., [1] or [2,3], or [4,5,6]. See the end of the document for further details on references. Agaricus bisporusis one of the largest genera of macrofungi with a pleasant taste and diverse health benefits including of anticancer, antioxidant, anti-diabetic, antimicrobial, and anti-obesity activity [1,2]. Due to its high nutritional and medicinal value, A. bisporus has been considered as one of the most important mushrooms [3]. Furthermore, numerous studies have highlighted the potential of bioactive compounds derived from A. bisporus for developing drugs against serious diseases, as demonstrated through bioactivity analyses[4]. A. bisporus lectin (ABL) and mannose-binding protein (Abmb) have been investigated for their potential in medicinal or pharmaceutical application [5]. China is the top producer of A. bisporusand has been for the last two to there decades.
The visual appeal of mushrooms is a key determinant in impacting consumer purchasing decisions [6]. It is difficult to conserve the quality of harvested A. bisporus due to the absence of a protective cuticle layer and high respiration rate [7,8]. The quality degradation of mushrooms causes moisture and nutrient loss, browning, tissue softening, and cap opening [9]. In recent years, various postharvest approaches have been implemented to prolong the preservation of A. bisporus. For example, physical methods such as modified at mosphere packaging, irradiation and pulsed electric fields can extend the shelf life of A. bisporus [10,11,12]. The senescence of A. bisporusis delayed by chemical methods such as antimicrobial agents or electrolytic water cleaning, ozone, and coating treatment [13,14,15,16]. Additionally, the storage temperature is the most crucial factor influencing the respiration, color, and ripening of mushrooms. Increasing the storage temperature accelerates the aging, browning, weight loss, and softening of the mushrooms [17]. Therefore, for better results, most postharvest A. bisporus preservation methods should be accompanied by low and constant temperature (above 0 °C) conditioning strategies [18].
Generally, browning is one of the main causes of quality losses of A. bisporus [19]. Browning decreases the commercial value of mushrooms and ultimately leads to considerable economic losses. Substantial evidence indicates that enzymatic browning during storage is the main cause of browning in A. bisporus during storage [21]. Enzymatic browning of A. bisporus is a complex processinvolving various phenolic compounds [21], phenoloxidases [22,23] and multiple other enzymes[24,25].The expression of Abppo genes in the A. bisporus fruit body (pileus, stipe and gill) browning are inhibited by UV-C treatment [26]. Moreover, a study integrating metabolomics and transcriptomics reported that the A. bisporus browning can be affected by the dynamic content of organic acids and trehalose [27]. Maintenance of cell membrane integrity is also an important factor in inhibiting postharvest browning of A. bisporus. Lin et al. showed that phase change materials combined with melatonin treatment could regulate the expressions of antioxidant-associated genes and maintain the cell membrane integrity to effectively delay browning of A. bisporus [28]. Additionally, melatonin treatment can prominently inhibit electron leakage by significantly increasing the expression levels of AbNdufB9 and AbRIP1to protect the cell membrane [29].
Significant research advances have been achieved in the preservation of A. bisporus. However, understanding of postharvest mushroom physiology and metabolism remains largely lacking. In recent years, high-throughput techniques have become widely utilized for investigating the molecular-level biological processes and metabolic mechanisms in plants [30,31]. In this study, we utilized metabolomic and transcriptomic data to analyze the dynamics of major metabolites and the underlying regulatory pathways in A. bisporus throughout various storage stages. Our research not only sheds light on the postharvest physiology of A. bisporus but also contributes to enhancing post-harvest storage practices and the development of effective preservation technologies.

2. Materials and Methods

2.1. Mushroom Materials and Treatments

White mushrooms (A. bisporus, A15) were harvested from Longchen Modern Agriculture Technology Company, in Jiaxing City, Zhejiang Province, China. Mushrooms with consistent shape, size, and excellent quality were carefully selected and promptly transported to the laboratory, where they were pre-cooled at 4°C overnight. The samples were randomly divided into 3 groups, each group had 3 biological replicates, and each replicate contained six A. bisporus fruiting bodies. Subsequently, the mushrooms were put into boxes and stored at 23±1 °C (room temperature, RT), and the mushroom flesh (0.5 cm thick) was collected from three storage periods of 0 h (CK), 6 h (RT_6) and 24 h (RT_24). Samples were ground into powder with liquid nitrogen and stored frozen at 80°C until later use.

2.2. Measurements of Browning Index, Firmness and Weight Loss

The degree of browning, also referred to as the browning index, was accessed by calculating the ratio of the browned area to the cap surface and scored on a scale of one to five [32]. Firmness was measured by the Stable Micro System (SMS) TAXT Plustexture analyser (Stable Micro System, United Kingdom). For each mushroom, the 2mm diameter cylindrical probe of the firmness mirror was pressed into the mushroom at a speed of 5mm/s, and the hardness was defined as the maximum force in the force versus time curve. Weight loss of whole mushrooms during storage was noted. For each weight measurement, the mass of 20 mushrooms was measured. Weight loss was calculated as reported by Nazir et al. [33].

2.3. Determinations of Polyphenol Oxidase Activity, Total Phenolic Content, Malondialdehyde (MDA) and Electrolyte Leakage

The extraction and activity of polyphenol oxidase (PPO) were performed as described by Meng et al. [34] with slight modifications. Two grams of frozen tissue was homogenized in 5 mL of phosphate buffer (0.2 M, pH=6.4), and centrifuged at 12000 rpm for 15 min at 4°C. Then, 400 µL of the supernatant was taken and reacted with 2 mL of phosphate buffer and 900 μL 50mM catechol (Sigma Aldrich, Shanghai, China). Changes in absorbance at 420 nm were recorded over 3 min. A change of 0.01 per minute at 420 nm is defined as one unit (U) of PPO activity. PPO activity was expressed as U per g fresh weight (g−1 FW).
Total phenolic content was measured accordingto the method described by Liu et al.[35]. Half a gram of frozen tissue was homogenized with 5 mL ofice-cold 1% HCl–methanol solution and incubated at 4 °C for 20 min. The mixture was centrifuged at 10000 rpm for 10 min at 4 °C. The collected supernatant was diluted five-fold with 1% HCl–methanol solution. The absorbance was measured at 280 nm, and the phenolic compounds were expressed as OD280 per gram of fresh weight (g−1 FW).
Measurement of MDA content was carried out using the method described byPleșoianu and Nour [36] with some modifications. Two grams of frozen tissue was homogenized with 5 mL of 10% trichloroacetic acid (TCA), and centrifuged at 12000 rpm for 15 minat 4 °C. One milliliter of the supernatant was reacted with 1 mL of 0.67% 2-thiobarbituric acid (TBA) in a water bath at 100 °C for 20 min, and then cooled immediately to room temperature.The mixture was centrifuged at 12000 rpm for 10 min. Absorbencies of the supernatant at 450 nm, 532 nm and 600 nm were measured. The MDA content was calculated using the following formula:
MDA content (μmol g-1)=6.45 × (A532 − A600) − 0.56 × A450.
The determination of electrolyte leakage was conducted according to the previous method proposed by Yan et al.[37]. Mushroom pulp pellets (1 cm in diameter and 0.3 cm in thickness) were placed in a triangular flask with 40 mL double distilled water for 10 min at ambient temperature. The initial conductivity (EC1) of the mixture was measured.The flask was boiled for 10 min and then cooled down to ambient temperatures before measuring the final conductivity (EC2). The conductivity of deionized water (EC0) was also measured. Electrolyte leakage was an indicator of the change in membrane permeability and was calculated as follows:
Electrolyte leakage (%) = 100% ×(EC1 − EC0)/(EC2 − EC0)

2.4. Ultrastructural Observation of Cells

The samples were cut into small pieces (1 mm × 1 mm × 3 mm) and immediately prefixed in 2.5 % (v/v) glutaraldehyde solution. After rinsing the stationary phase liquid with phosphate buffered saline (PBS), the samples were then post-fixed with 1% osmium tetroxide for 2 h. Subsequently, the samples were cleaned using PBS again and dehydrated in acetone solutionsat 30%, 50%, 70%, 85%, 90% and then twice at 100% acetone. Samples were then placed in SPI 812 epoxy resin embedding agent overnight. Ultrathin sections (70 nm) were cut using an ultramicrotome (EM UC7, Leica Biosystems, Solms, Germany) and observed under transmission electron microscopy (TEM; Hitachi HT7700, Hitachi Ltd., Tokyo, Japan).

2.5. Transcriptome Sequencing and Data Analysis

RNA-Seq sequencing libraries were generated by NEBNext UltraTM RNA Library Prep Kit for Illumina (New England BioLabs, USA) using high-quality RNA samples, and then sequenced on an Illumina platform to generate150 bp paired-end reads. RNA-Seq was performed using the method described previously[31].The genome sequence of A.bisporus (https://www.ncbi.nlm.nih.gov/datasets/genome/GCF_000300575.1/) was used as the reference. Sequencing readswere filtered by fastpv0.19.3. HISAT2 v2.1.0 was used for mapping clean reads to the reference genome. Gene expression levels were calculated as FPKM(fragments per kilobase million). DESeq2 v1.22.1 was employed to identify the differentially expressed genes (DEGs) with a threshold of the log2 |fold change| ≥ 1 and the false discovery rate (FDR) < 0.05. Three biological replicates were assessed for each sample.

2.6. Widely Targeted Metabolomics Profiling and Analysis

The extraction, identification and quantification of metabolites in A. bisporus flesh were conducted by Wuhan Metware Biotechnology Co., ltd (Wuhan, China). Briefly, metabolite extracts were analyzed using a UPLC-ESI-MS/MS system (UPLC, ExionLC™ AD; MS, Applied Biosystems 4500 Q TRAP). The sample extracts were injected into a UPLC (Agilent SB-C18, 1.8 μm, 2.1 mmx 100 mm), the mobile phase A was pure water with 0.1% formic acid, and phase B was acetonitrile with 0.1 % formic acid. Sample measurements were performed using a gradient program that employed a 95% A, 5% B starting condition. A linear gradient was programmed to 5% A, 95% B over 9 minutes with a composition of 5% A, 95% B held for 1 minute followed by a composition of 95% A, 5.0% B reached in 1.1 minutes and held for 2.9 minutes. The flow rate was set to 0.35 mL/min; the column oven was set to 40 °C; and the injection volume was 4 μL. Alternatively, the effluent was connected to an ESI triple quadrupole linear ion trap (QTRAP)-MS.
The ESI source was operated with the following parameters: source temperature 550°C; ion spray voltage (IS) 5500 V (positive ion mode)/-4500 V (negative ion mode); ion source gas I (GSI), gas II(GSII), curtain gas (CUR) were set at 50, 60, and 25 psi, respectively; the collision-activated dissociation(CAD) was high.QQQ scans were obtained in MRM experiments with the collision gas (nitrogen) setting as the medium. DP (de-clustering potential) and CE (collisional energy) for individual MRM leaps were accomplished by further DP and CE optimization. A specific set of MRM transitions were monitored for each period based on the metabolites eluted during that period. Three biological replicates were performed.

2.7. RNA Extraction and Real-Time Quantitative PCR (qPCR)

Total RNA isolation and purification were conductedwith Trizol (Takara, Biotechnology, Dalian, China), following the manufacturer’s instructions. Reverse transcription was performed with a HiScript II 1st Strand cDNA Synthesis Kit (Vazyme Biotech, Nanjing, China) according to the manufacturer’s instructions.The relative expression level of each gene was determined by real-time quantitative PCR with HiScript II Q RT SuperMix (Vazyme Biotech, Nanjing, China) and the 2-ΔΔCt method. All the reactions were repeated three times, and the AbTubulin gene (AGABI2DRAFT_195658) was used as an internal control for normalization.

2.8. Statistical Analysis

All of the measurements were conducted in triplicate. All statistical analyses were performed by SPSS Statistics 19 (IBM, New York, USA) using one-way analysis of variance (ANOVA). P<0.05 was considered statistically significant for Duncan’s multiple comparison test. The data were fitted and plotted using GraphPad Prism 9.0.0 (GraphPad Software Inc., La Jolla, CA, USA).

3. Results

3.1. Browning Processof Postharvest A. bisporus Storage at Room Temperature

Variations in appearance and quality traits of postharvest A. bisporus occurred throughout storage. As shown in Figure 1A, comparing with samples before treatment, the mushrooms began to have slight browning symptoms after 2 h of storage and exhibited a sharp increase in browning severity after 6 d of storage (Figure 1A and B), with a browning index reaching 4.43 on 48 h of storage (Figure 1B).We also measured firmness and weight loss at the same time. The firmness of A. bisporus showed a decreasing trend during the storage period with the value declining from 586.21 to 453.37 (Figure 1C). While the weightloss of the mushrooms increased gradually throughout the storage period (Figure 1D).
Browning is an indicator of quality deterioration in A. bisporus. PPO catalyzes the oxidative polymerization of polyphenols to form melanin deposits.The total phenolic content and PPO activity of the mushrooms accumulated significantly during the entire storage period (Figure S2A and B). In addition, the increase in PPO activity leveled off between 44 h and 48 h. The cell membrane integrity is very important to ensure the normal operation of the physiological activities of organisms. Here, in our results, the MDA content in A.bisporus increased gradually during the first 28 h, and then increased rapidly (Figure S2C); the relative conductivity rate had a similar trend (Figure S2D).

3.2. Lipid Metabolites Associated Ultrastructural Changes of Cell Membrane Degradation during Ambient Storage of A. bisporus

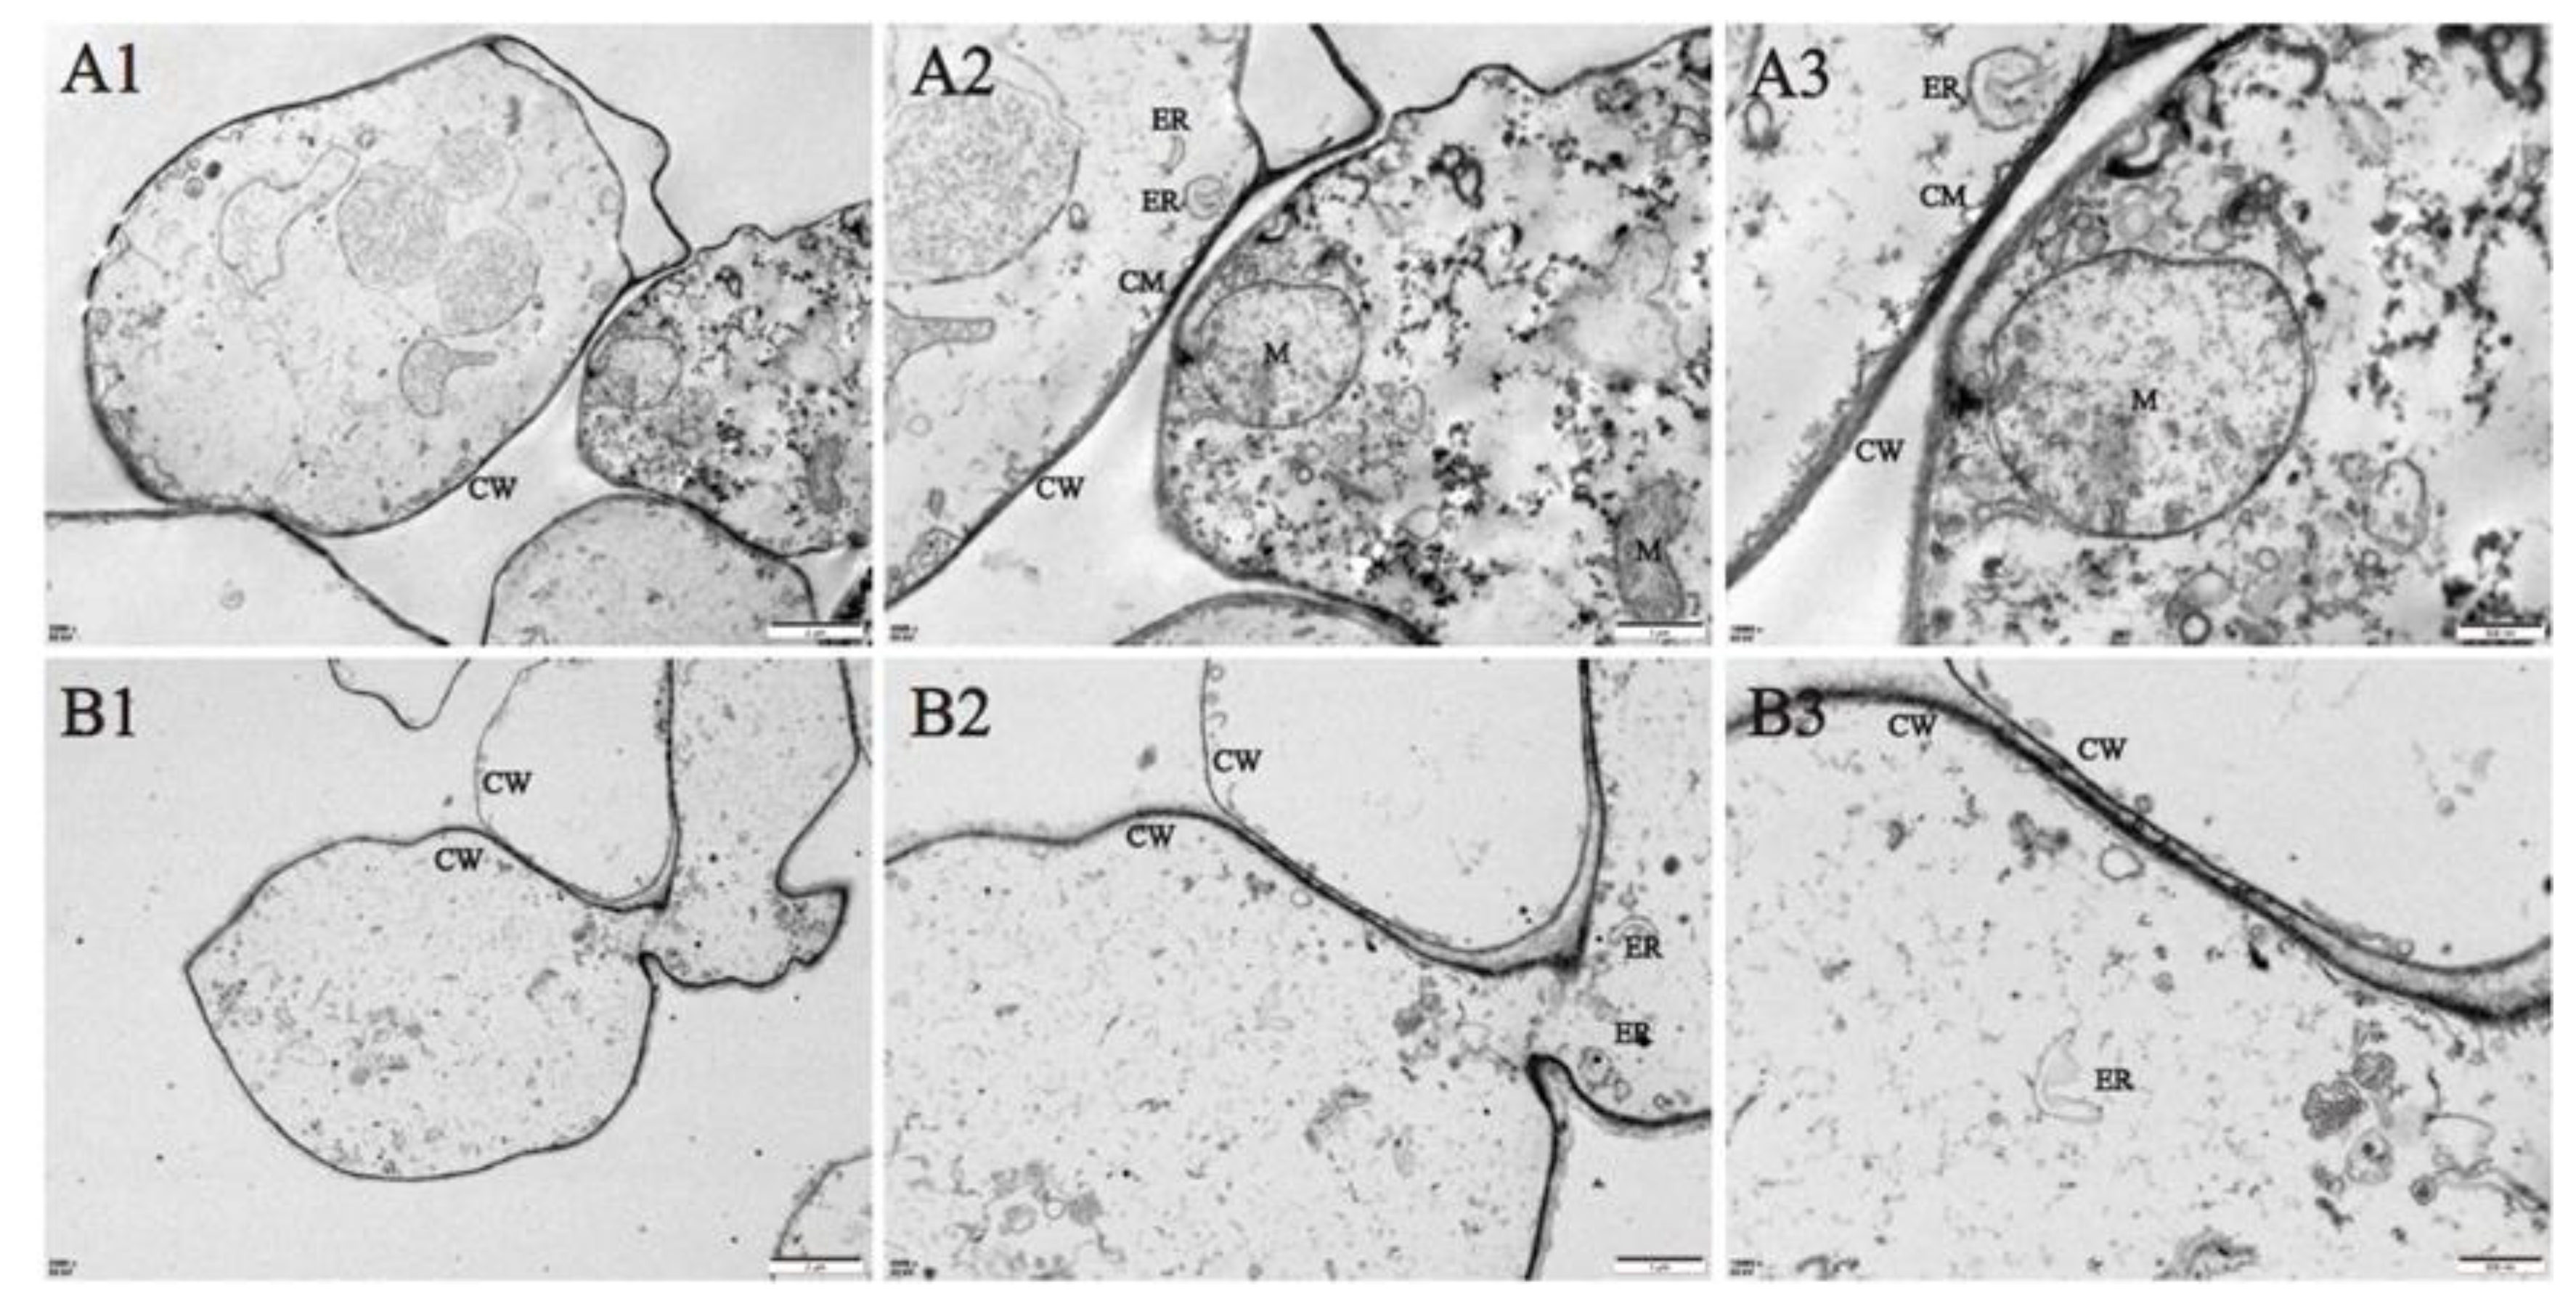
The ultrastructural changes of coretissues during storage were observed by transmission electron microscopy. At the initial timepoint (0 h), cell morphology was normal and unperturbed (Figure 2A). After 24 h of storage, A.bisporus cells were smaller, the cytoplasmic membranes were broken, and the mitochondria were degraded. At the same time, the cytoplasmic electron density decreased, and cell contents were lost (Figure 2B).
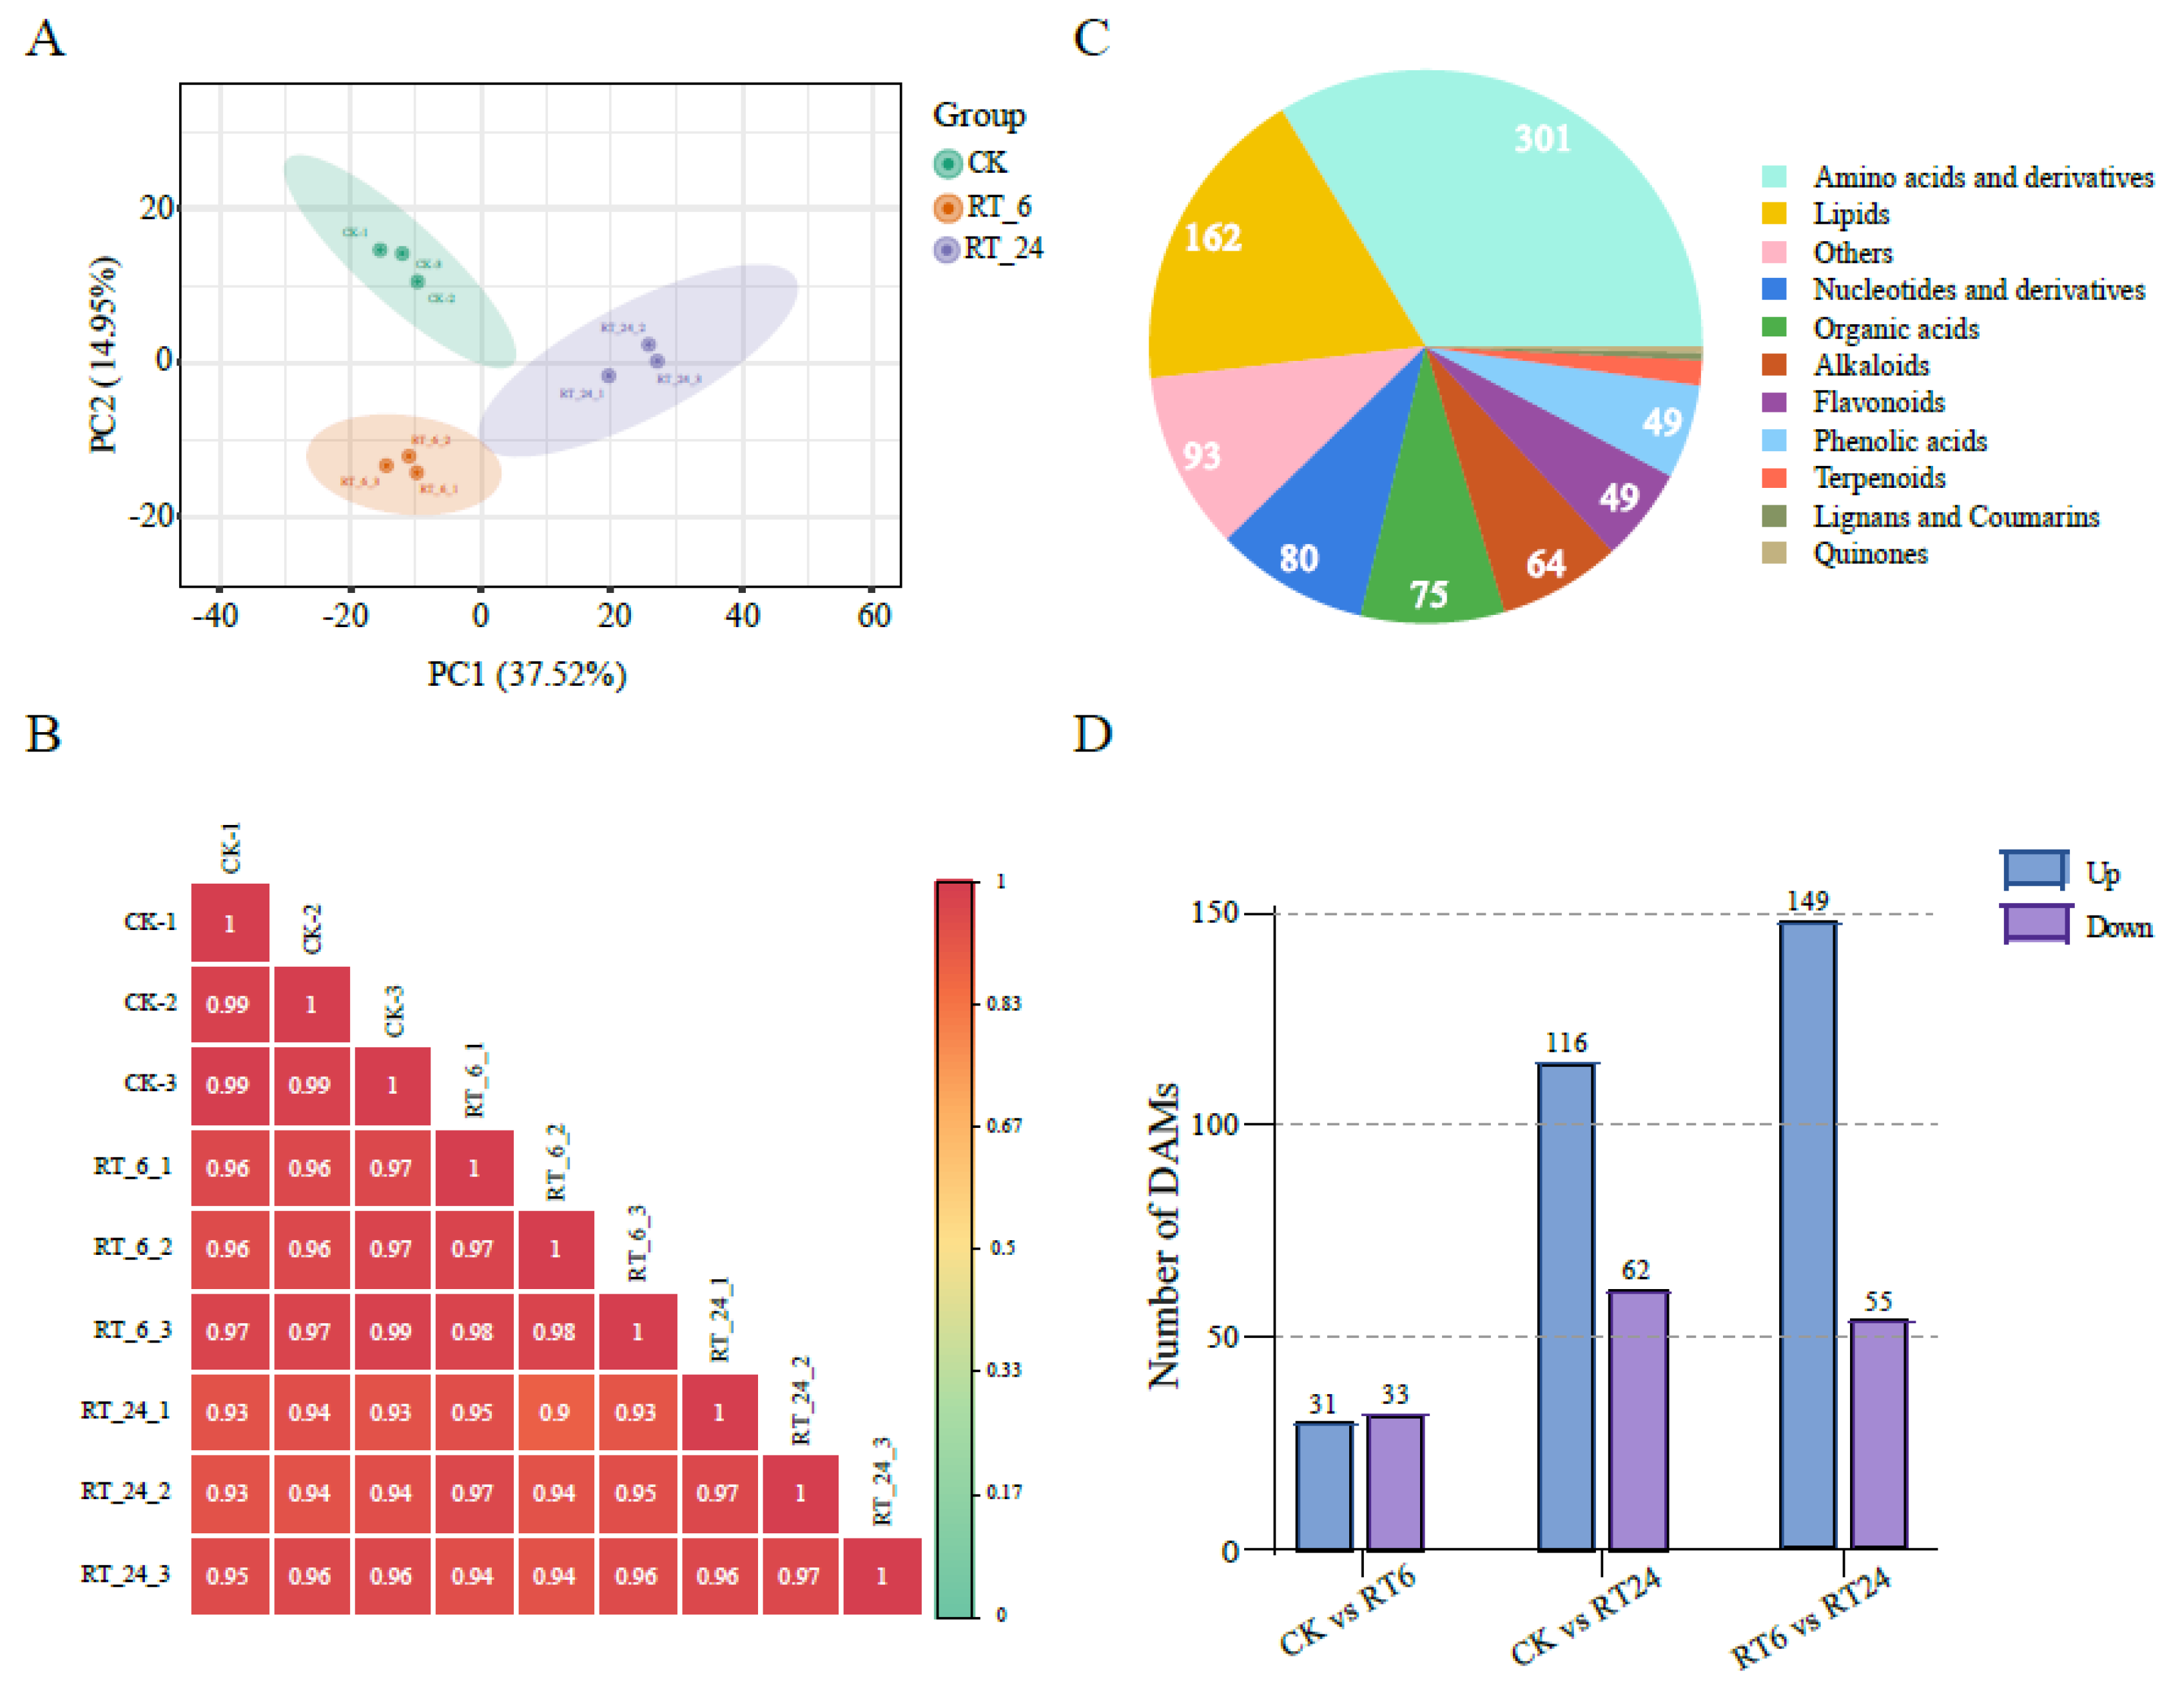
To generate a comprehensive insight into the metabolome dynamics in the A.bisporus browning processat room temperature for 6 and 24 hours, the widely targeted metabolomics technique was carried out to systematically identify and quantify all metabolites present in the mushroom flesh, including primary and secondary metabolites. A principal component analysis (PCA) revealed that the metabolite samples were by storage time (Figure 3A). The Pearson’s correlation coefficients (R2) between biologicalrepeatsand between the control and experimental groups were greater than 0.9 (Figure 3B). Altogether, these results indicated that metabolomics data were highly replicable and qualified for further analyses. Further statistics on the metabolites displayed that 893 compounds sexclusively grouped into 11 classes, including amino acids and derivatives (301), lipids (162), others (93), nucleotides and derivatives (80), organic acids (75), alkaloids (64), flavonoids (49), phenolic acids (49), terpenoids (13), lignans and coumarins (4), and quinones (3) (Figure 3C; Table S1). Based on pairwise comparisons, 64 significantly differentially accumulated metabolites (DAMs) (31 upregulated, 33 downregulated) were identified between CK and RT_6; 178 DAMs (116 upregulated, 62 downregulated) were identified between CK and RT_24; and there were 204 DAMs (149 upregulated, 55 downregulated) between RT_6 and RT_24 (Figure 3D). Overall, the number of DAMs increased with the extension of storage time.

3.3. Differentially Accumulated Lipidmetabolites Analysis of Flesh under Different Storage Times

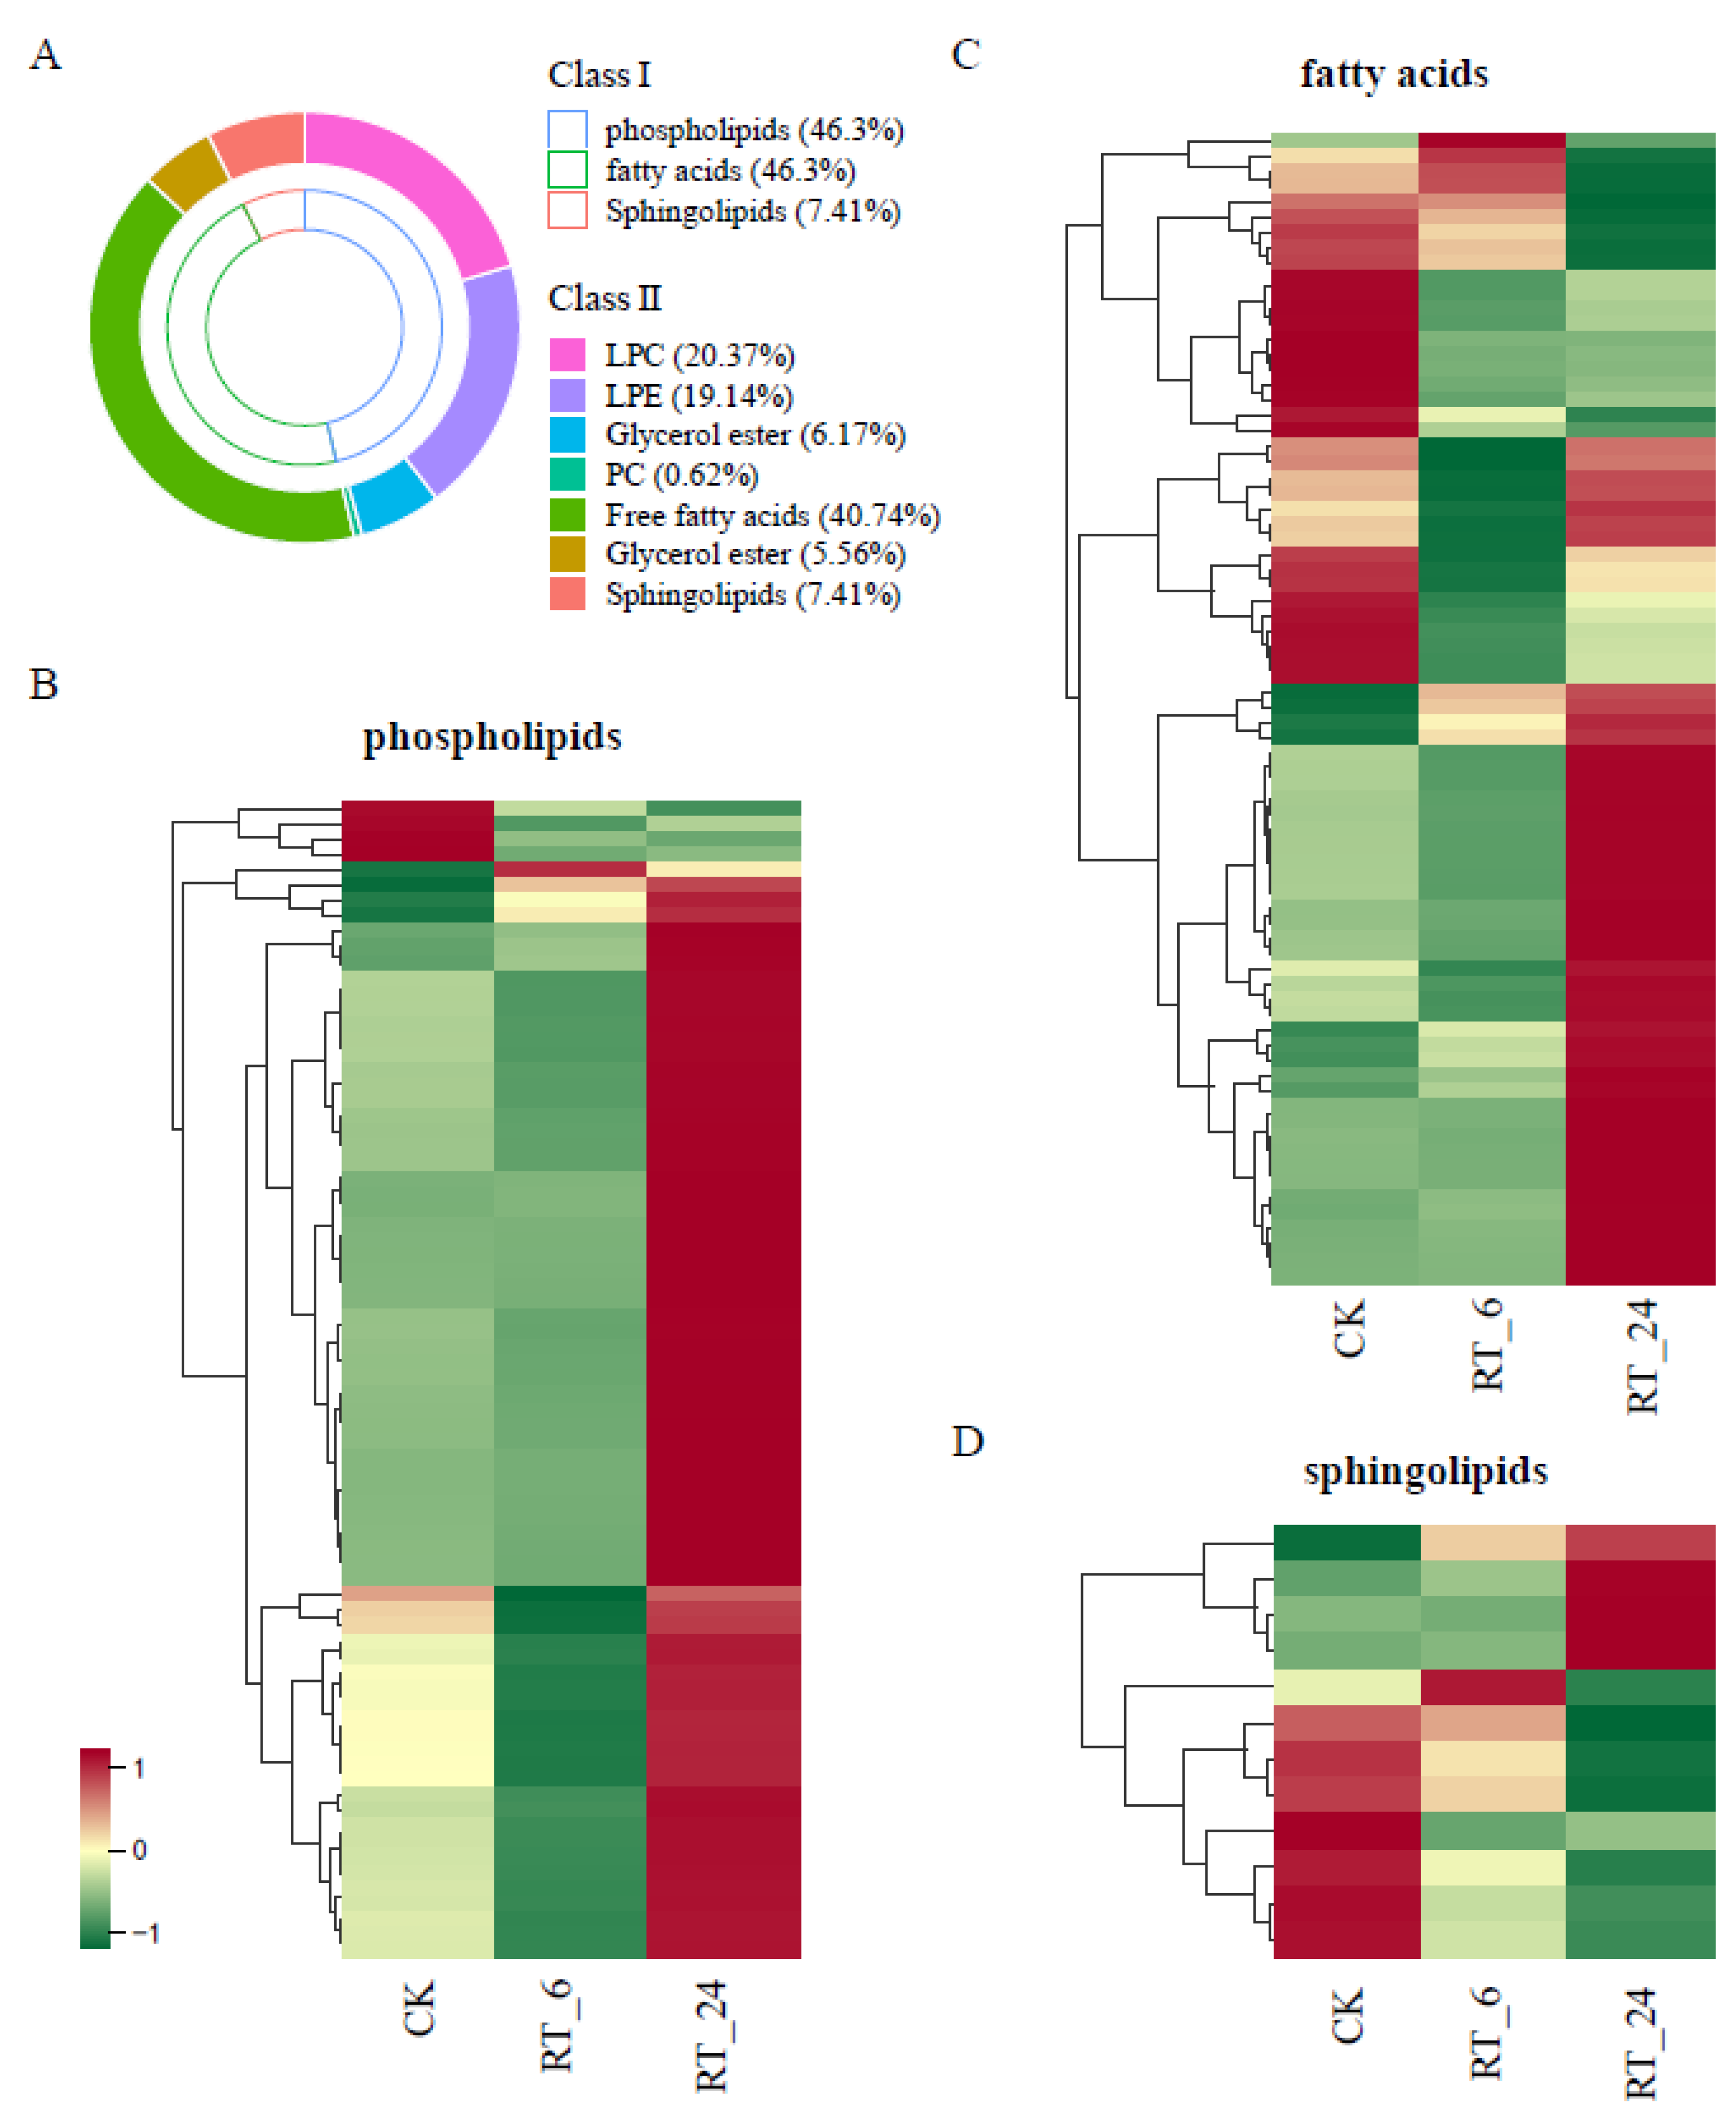
To explore the physiological processes related to for the DAMs, Kyoto Encyclopedia of Genes and Genomes (KEGG) annotation and analysis were performed. The enrichment analysis showed that a total of seven pathways were significantly affected during the whole RT storage process, including ‘flavone and flavonolbiosynthesis’, ‘glycolysis’, ‘purine metabolism’, ‘linoleic acid metabolism’, ‘sphingolipid metabolism’, ‘nucleotide metabolism’, and ‘plant hormone signal transduction’ (p< 0.05) (Figure S1; Table S2). Two out of seven metabolic pathways identified were closely associated with lipid metabolism, and approximately 18% of metabolites identified in samples were lipids (Figure 3C), indicating that lipids play an important role in the loss of quality during RT storage. Here, we mainly focused onlipid metabolites, a total of 161 lipid speciescan be further divided into three classes: phospholipids(PLs, 46.3% total lipid species), fatty acids (FAs, 46.3%), and sphingolipids (SPs, 7.41 %) (Figure 4A, Table S3). Among these lipids, PLs and FAs account for more than 92.6 % of the total lipid content, and free fatty acid (FFA, 16:0, 18:0, and 18:1) was the most predominant fraction in FAs (Figure 4A). In A.bisporus storage, the vast majority (95%) of PL contents increased at 24 h (Figure 4B), whereas FAs and SPs were differentially accumulated (Figure 4C and 4D). In general, these results showed that most lipids increased in accumulation during storage at RT.

3.4. Transcriptomic Analysis of Flesh under Different Storage Times

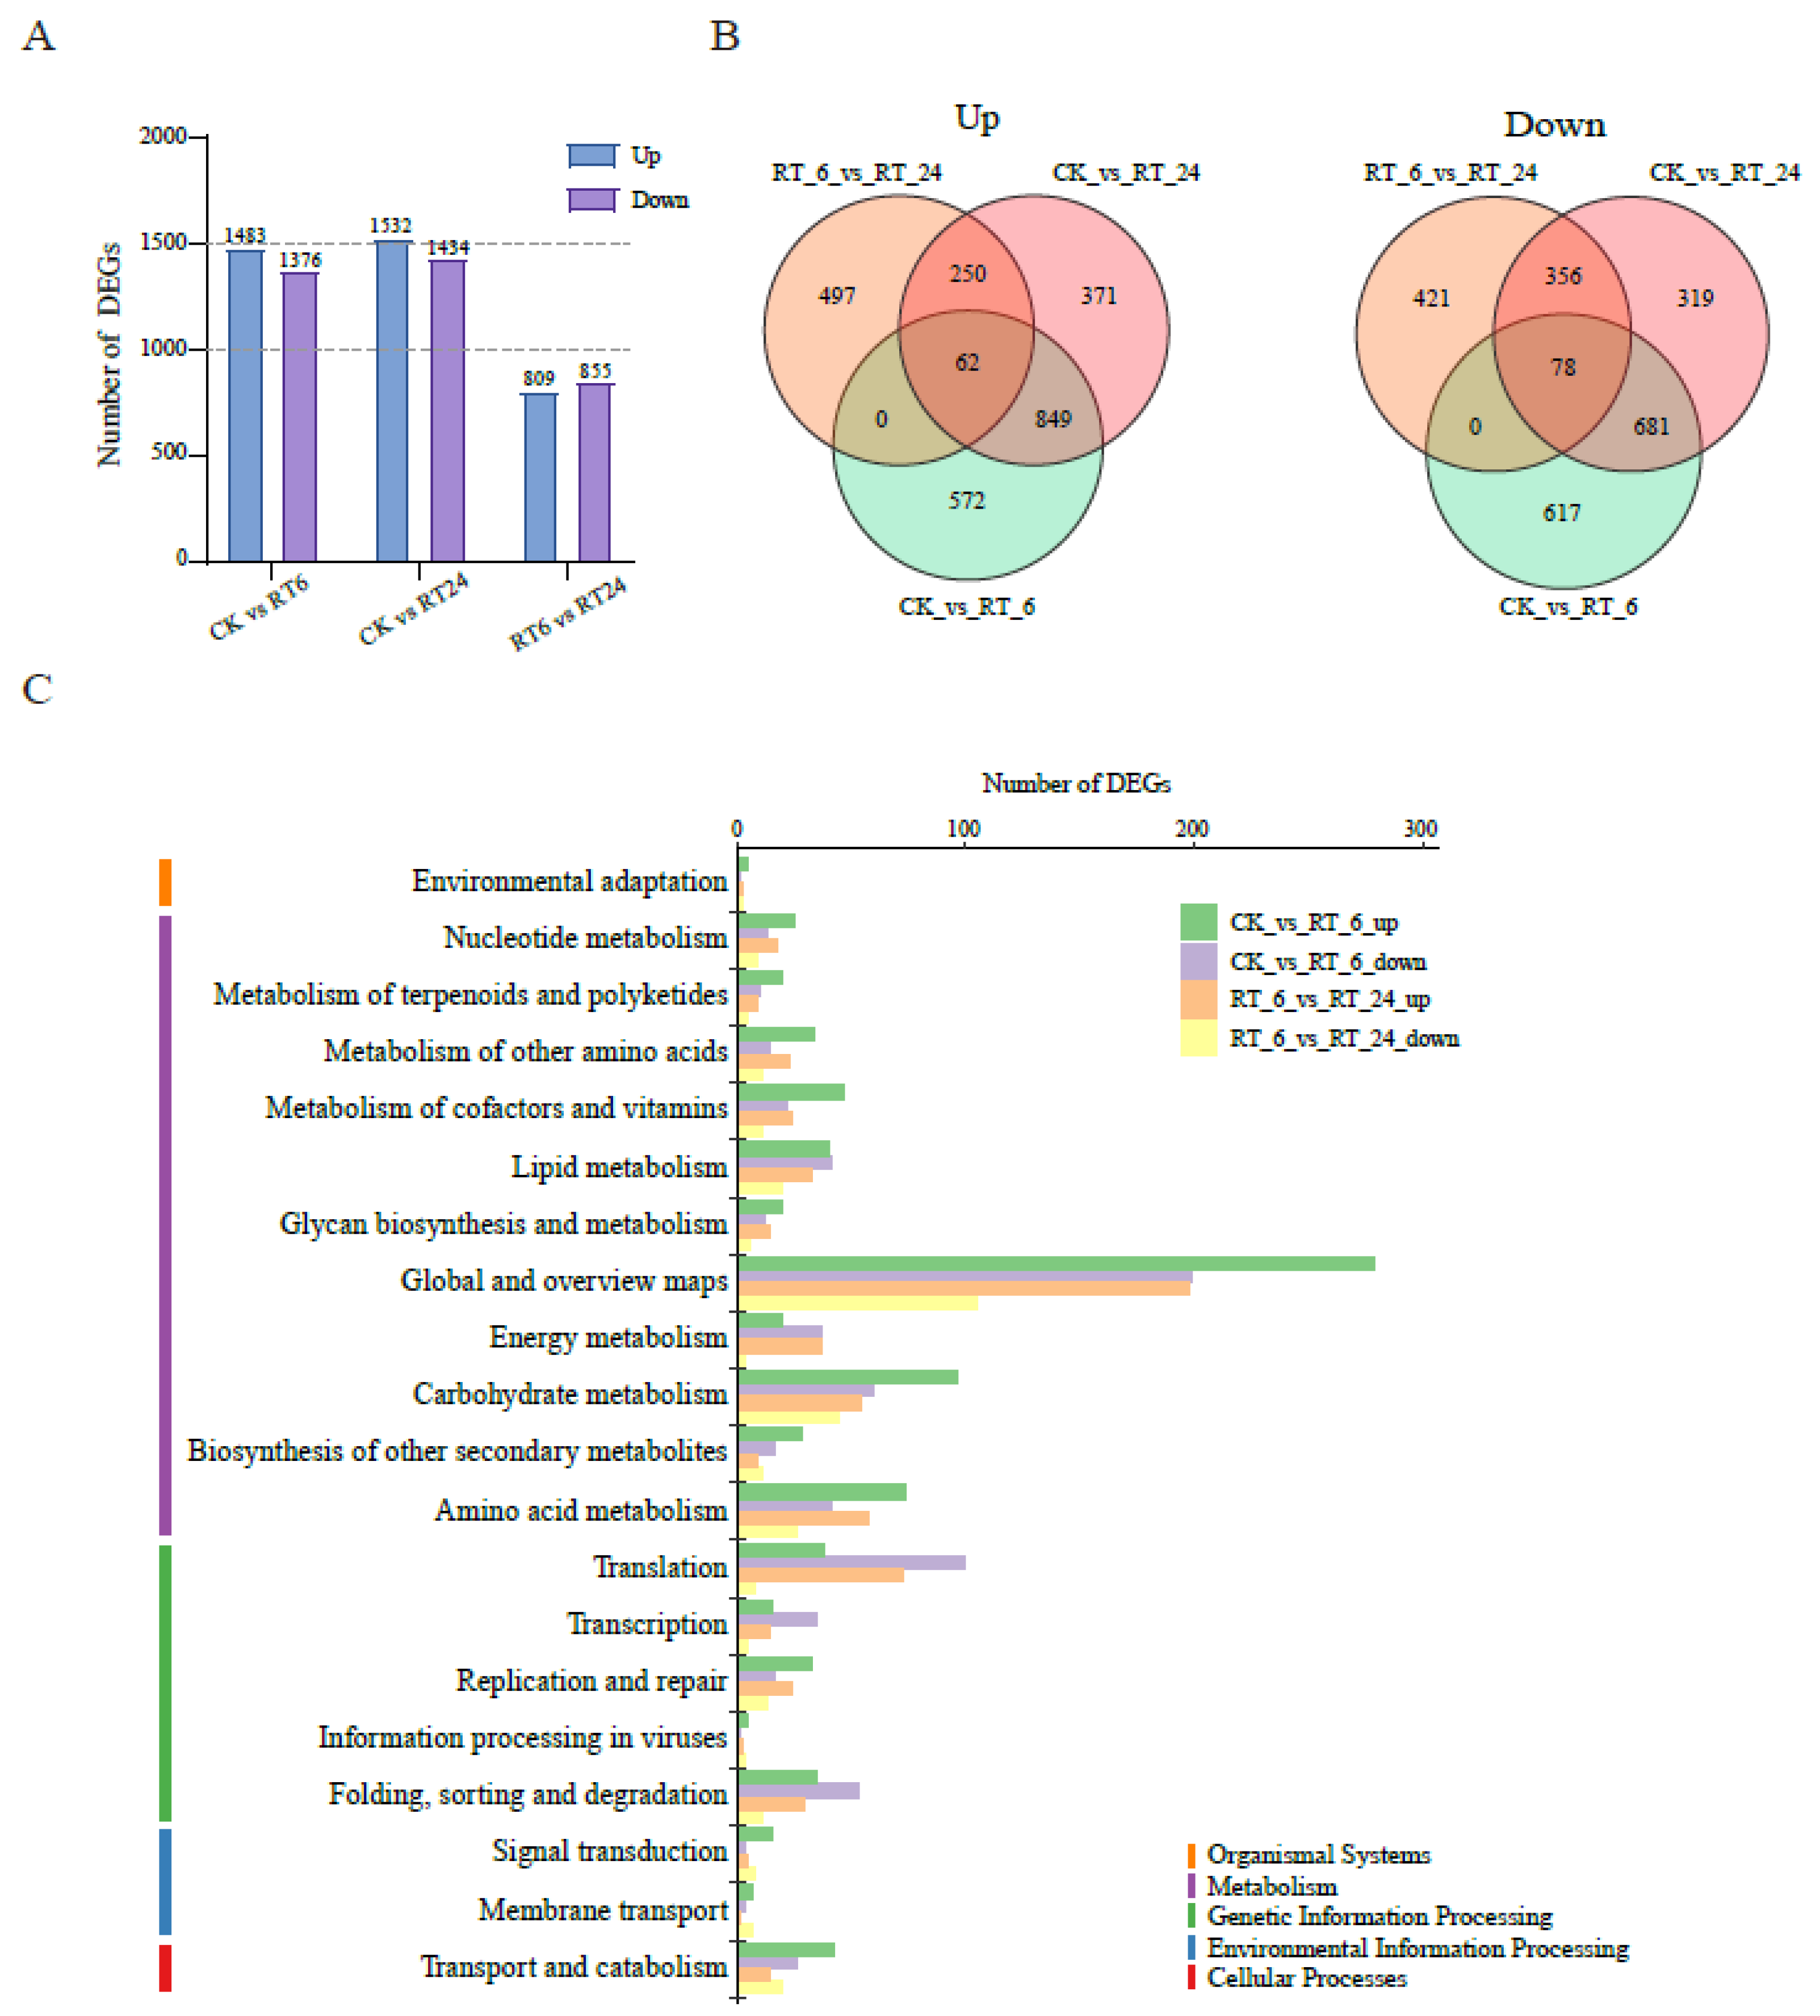
To investigate transcriptomic dynamics during RT storage, the transcriptomes at the three storage time points were investigated (Figure S4). Compared with CK, a total of 2,859 (CK vs RT_6), 2,966 (CK vs RT_24), 1,664 (RT_6 vs RT_24) DEGs were identified (Figure 5A).The number of DEGs between ‘CK vs RT_6’ and ‘CK vs RT_24’ was similar, but the combination ‘RT_6 vs RT_24’ was much less, suggesting that various physiological processes of fruiting bodies were stimulated during 0 h ~ 6 h storage. Overall expression patterns of up-regulated and down-regulated DEGs among three timepoints were illustrated with Venn diagrams (Figure 5B). Among all pairwise comparisons (‘CK vs RT_6’ and ‘CK vs RT_24’ and‘RT_6 vs RT_24’) shared 62 up-regulated genes and 78 down-regulated genes, which indicated that these core genes may be associated withquality maintenance or fruiting bodies browning in A.bisporus. DEGs were then classified according to the pathways in which they participate using the KEGG database, with a total of five categories in the first-level classification (Figure 5C, Table S4). The primary category “metabolism” included the most DEGs. Secondary categories in “metabolism” had more up-regulated DEGs in the early storage period except for “lipid metabolism” and “energy metabolism”. Notably, in the category of “lipid metabolism”, almost the same up- and down-regulated DEGs were found in RT_6, but had higher expression levels in RT_24. These results suggested that lipid metabolism was stimulated during storage. In the primary category “genetic information processing”, categories of “translation”, “transcription”, “folding, sorting and degradation” were dominated by down-regulated DEGsat 6 h, but there were more up-regulated DEGs at 24 h. This indicated that transcription and translation activity was inhibited in RT_6 and significantly activated in RT_24, which may be an adaptation to physiological and metabolic processes.

3.5. Alterations of Lipid Metabolism Pathway Genes in the Flesh under Different Storage Times

As the metabolic analysis revealed that the abundances of major components of fatty acids, phospholipids, and sphingolipids involved in lipid metabolism changed significantly during storage periods, we next identified DEGs involved in lipid metabolism in the transcriptome and plotted the lipid metabolic pathway (Figure 6). Lipid metabolism includes fatty acid biosynthesis and degradation, galactolipid metabolism, and sphingolipid metabolism. Genes encodinglong-chain acyl-CoA synthetase (LACS, AGABI2DRAFT_149127, AGABI2DRAFT_192638, AGABI2DRAFT_195230) associated with fatty acid degradation had higher expression levels in RT_24 compared to those in CK and RT_24. It indicated the degradation of fatty acids might be activated during later storage, and provided abundant precursors for galactolipid and sphingolipid metabolism. Among genes associated with galactolipid metabolism, the genes encoding phospholipase A (PLA, AGABI2DRAFT_151295), phosphatidic acidphosphatase (PAP, AGABI2DRAFT_205847), base-exchange-type phosphatidylserine synthase (PSS, AGABI2DRAFT_224623), phospholipase D (PLD, AGABI2DRAFT_186563), and phosphatidylinositol3-kinase (PI3K, AGABI2DRAFT_151460, AGABI2DRAFT_218336, AGABI2DRAFT_151451) all showed higher transcript level in RT_6, suggesting that galactolipid metabolism was activated during the early period, accompanied by the accumulation of higher levels of lysophosphatidylcholine (LPC) and lysophosphatidylethanolamine (LPE) in RT_24 (Figure 4B). Several genes involved in sphingolipid biosynthesis were down-regulated in RT_6, including those encoding ketosphinganine reductase (KSR, AGABI2DRAFT_186193), sphingoid base hydroxylase (SBH, AGABI2DRAFT_228680) for phyto-sphinganine biosynthesis, as well as genes encoding enzymes lag 1 homolog (LOH, AGABI2DRAFT_191824), ceramidase (Cdase, AGABI2DRAFT_192931), delta8 sphingolipid long-chain base desaturase (∆8SLD, AGABI2DRAFT_189913), fatty acid alpha-hydroxylase (FAH, AGABI2DRAFT_194616) for GlcCer biosynthesis. These results suggested that the accumulation of lipids was, to some extent, controlled at the transcription level, thus providing evidence that the lipid metabolism pathway was changed at the transcription level.

3.6. Transcription Factors Are Correlated with the Differential Accumulation of Metabolites in A. bisporus

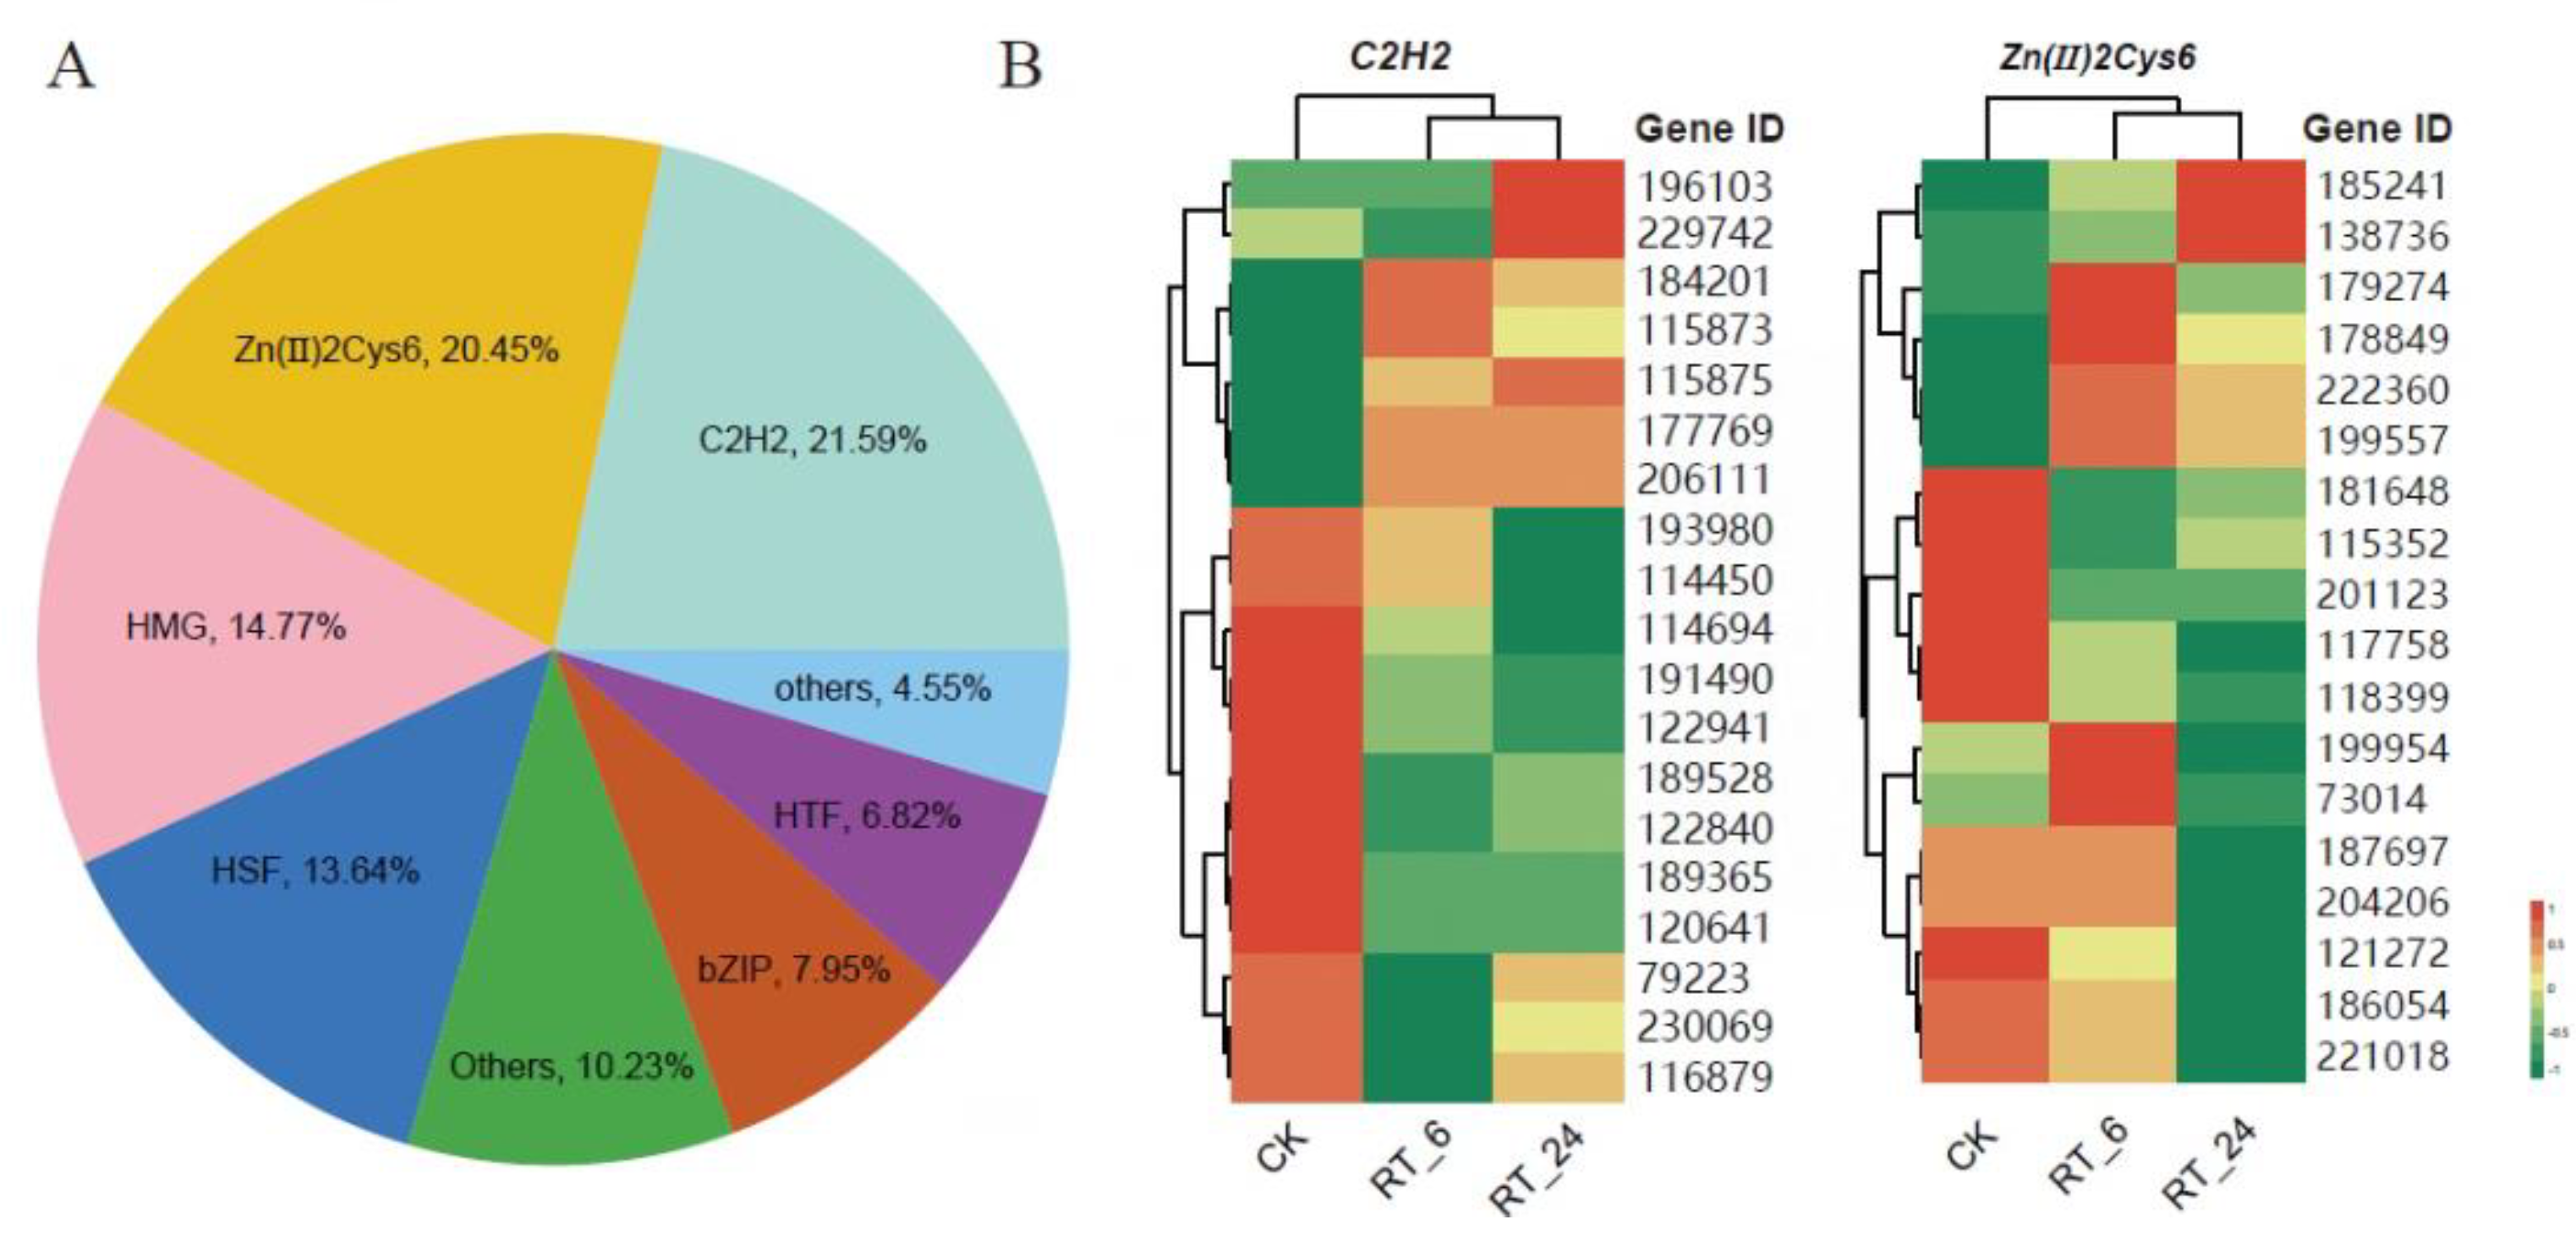
Transcription factors (TFs), especially C2H2 zinc finger proteins and Zn(II)2Cys6 transcription factors play key roles in regulating the response of edible fungi to environmental conditions. Heat shock factor (HSF) transcription factors are important regulators of gene expression in response to heat stress in edible fungi. In our dataset, 88 differentially expressed transcription factors (DETFs) belonging to 16 TF families were identified. The most abundant DETFs were members of the C2H2 (21.59%) and Zn(II)2Cys6 (20.45%) families, followed by the high mobility group (HMG) (14.77%) and HSF (13.64%) (Figure 7A). Interestingly, most of the C2H2 (12/19, 63%) and Zn(II)2Cys6 (12/18, 67%) genes were down-regulated in the flesh at 24 h of ambient storage, although some were up-regulated at 6 h of storage (Figure 7B). These DETFs may contribute to the production of DAMs in the flesh of A. bisporus.

3.7. Integrated Transcriptomic and Metabolomic Analyses

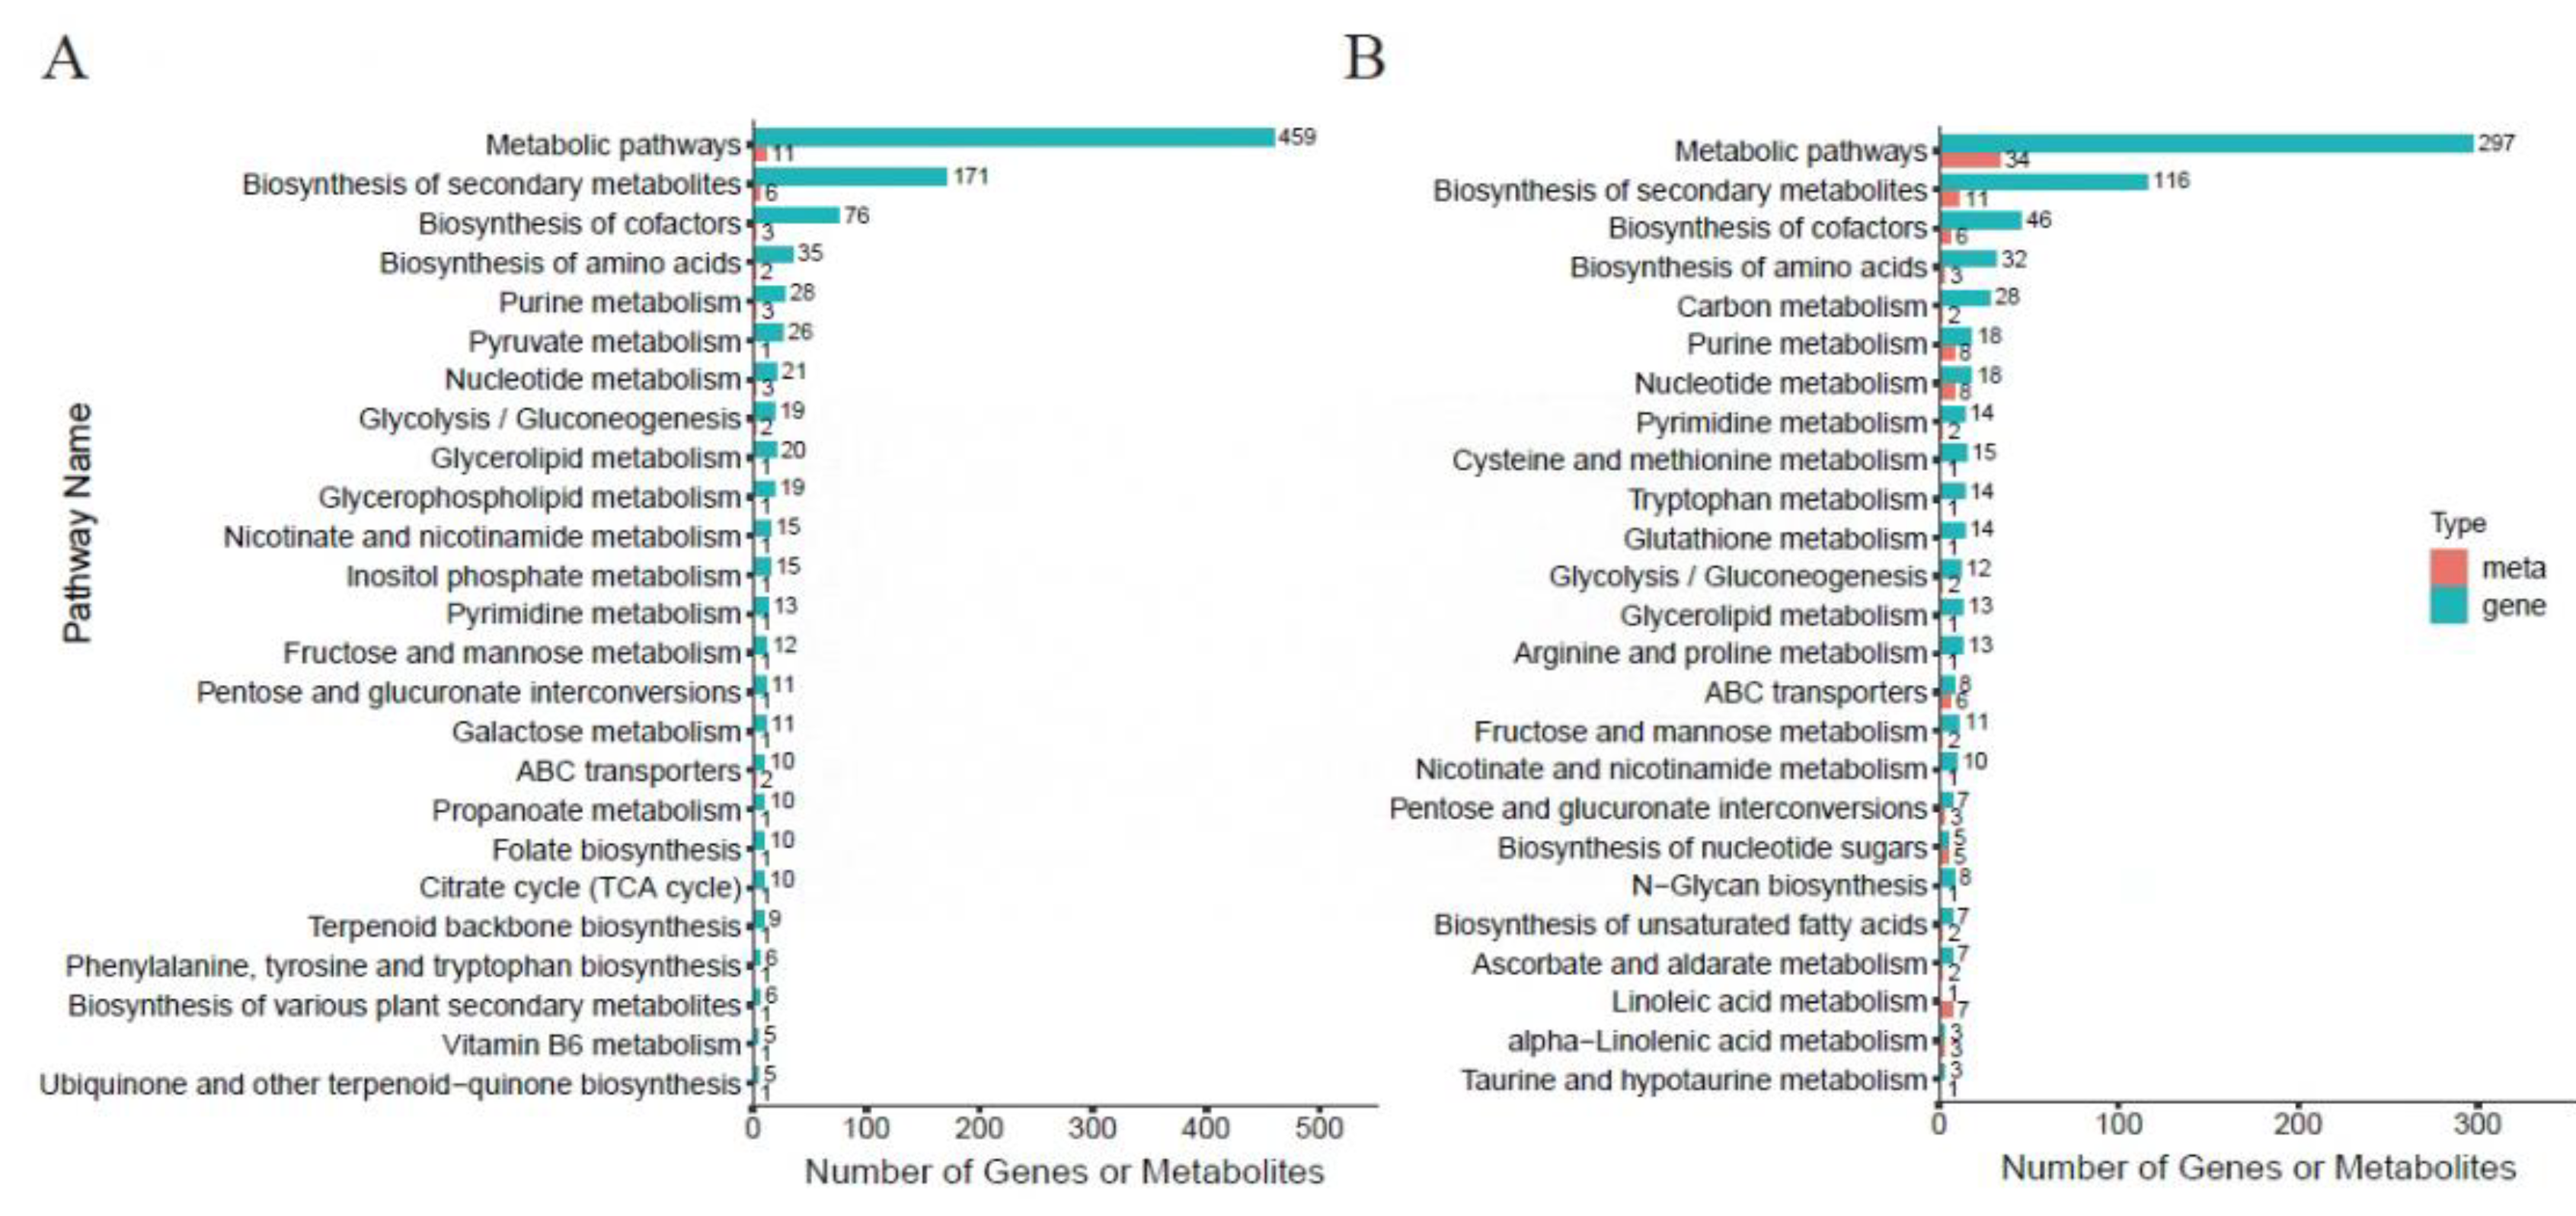
To further elucidate the changes occurring in A. bisporus flesh during ambient storage, we integrated metabolomics and transcriptomics data. At the 6h of ambient storage, both DAMs and DEGs in mushroom flesh were enriched in the same KEGG pathway, which was mainly associated with ‘secondary metabolite biosynthesis and metabolism’, ‘cofactor biosynthesis’, ‘amino acid biosynthesis’, ‘purine metabolism’, and ‘pyruvic acid metabolism’ (Figure 8A). In contrast, after 24 hours of ambient storage, mushroom flesh was associated with additional pathways, including ‘carbon metabolism’, ‘glutathione metabolism’, and ‘proline metabolism’, in addition to the a forementioned pathways (Figure 8B). These findings imply that A. bisporus may mitigate the deterioration caused by ambient storage through a series of mechanisms related to amino acid biosynthesis and energy metabolism.

4. Discussion

A. bisporus is the most cultivated mushroom worldwide [38]. Due to high respiration and transpiration rates, it is difficult to conserve the quality of harvested button mushrooms, resulting in the loss of taste and high nutritional value [39,40]. A.bisporusis very perishable and has a short shelf life of 1-3 days at room temperature (RT) after harvest [41]. Figuring out the physiological and molecular mechanisms behind the button mushroomsstorage at RTis quite helpful for breeding practice and postharvest management. The metabolome and transcriptome have been combined to comprehensively analyze the physiological and metabolic information of fruits and vegetables; e.g., jujube [42], flowering cabbage [43], radish [30], and citrus [44]. In this study, we conducted a comparative analysis of the metabolome and transcriptome of A. bisporus flesh at various time points during ambient storage. We identified numerous differentially abundant metabolites (DAMs) and differentially expressed genes (DEGs). Our findings highlight that the deterioration of A. bisporus quality is primarily linked to processes such as membrane lipid metabolism, energy metabolism, and oxidative reactions.
Browning index is the main quality indicator for evaluating the browning of edible mushrooms [45]. In addition, firmness and weight loss are the main factors determining the storage quality of edible fungi, reflecting the degree of softening andquality loss during storage [46,47]. Similar to aprevious study [48], button mushrooms stored under 23℃ began to slightly brown after 2 h (Figure 1A,B), with a corresponding decline in firmness (Figure 1C) and weight (Figure 1D). Mushroom browning is a complex process that is regulated by a series of enzymes such as PAL and POD. It is widely believed that PPO oxidizes phenolic substrates into anthraquinone compounds, leading to the occurrence of browning [49]. Here, the content of phenolic substrates showed an increasing trend in ambient storage unlike previous studies [50,51]. We speculate that the changing trend of phenolic substances is inconsistent due to different storage temperatures of mushrooms and different measurement times. The antioxidant activity of mushrooms is usually related to the total phenolic content. Ambient temperature may signal stimulation of mushrooms to produce more phenolic compounds as a defense response [52]. Moreover, in the present study, the trend of PPO activity was consistent with previous studies in that there was a gradual increase during storage [26,51]. However, in the transcriptomic data, the transcript abundance of Abppo1 and Abppo3 were down-regulated after 6 h storage at RT temperature and did not change significantly after 24 h. Meanwhile, the transcript abundance of Abppo2, Abppo4, Abppo5, and Abppo6 in mushroom flesh remained unchanged at 6 h and 24 h of storage. These results indicated that PPO-encoding genes might be regulated by multiple factors [3].
The cell membrane system plays an important role in the normal physiological metabolism of fruits and vegetables [53]. MDA is the major product of membrane lipid peroxidation and its accumulation is regarded as an indicator ofcell membrane integrity, leading to increased membrane leakage and cellular senescence [54,55]. As previously reported [51], MDA contents and electron leakage of mushroom increased constantly during the storage, accelerating senescence of A. bisporus. The TEM results further demonstrated that the microstructure integrity of the button mushrooms was disrupted during ambient storage (Figure 2). Additionally, in ourmetabolome data, content of phospholipids, sphingolipids and fatty acids significantlychanged, with 95% of the phospholipid content increasing significantly after 24 h of ambientstorage (Figure 4).The phospholipids with elevated levels were lysophosphatidylcholine (LPC) and lysophosphatidylethanolamine (LPE), which are the final metabolic breakdown product of phosphatidylcholine (PC) and phosphatidylethanolamine (PE), the most abundant phospholipid components in cell membranes [56,57]. Taken together, the results suggest that the lipid metabolites pathway may be activated in A. bisporus during ambient storage. Previous studies have provided evidence that postharvest treatments could reduce MDA content and benefit quality due to the maintenance of cell membrane stability in many different vegetables and fruits, such as pineapples, persimmons, and button mushrooms [58,59,60,61]. The activation of the lipid metabolite pathways in flesh during ambient storage might be a mechanism employed by A. bisporusto cope with abiotic stress, such as temperature.
During postharvest storage, a large number of metabolites changed rapidly, causing browning in parallel with quality deterioration of the button mushroom. Based on the analysis of the metabolomics, we found a significant increase in the abundances of some major fatty acids, glycerophospholipids, and glycerolipids relative to those in CK. Additionally, we characterized differential regulation of key metabolic pathways, including glycolysis, linoleic acid metabolism, sphingolipid metabolism, and nucleotide metabolism (Figure S1). Several strategies in microorganisms indicate that ATP from energy metabolic reactions such as glycolysis and linoleic acid metabolism is involved in the synthesis of fatty acids and phospholipids to repair cell membranes [62,63,64]. We further attempted to establish a regulatory network related to lipid metabolism according to the transcriptomic data (Figure 6). Within this network, transcript abundances of a series of key genes for lipid metabolism, such as PLD, PI3K, PSS, LACS, and IPUT, were significantly induced during storage This effect likely contributed to increasing the content of fatty acids and sphingolipids. Furthermore, there is evidence that in peach, AP2/ERF superfamily transcription factor ABR1plays a critical role in regulating lipid metabolism [65,66]. However, the AP2/ERF transcription factor family, is found only in plants [67].It would be interestingto mine other transcription factors that can regulate lipid metabolism in response to ambient temperature in future studies.
In summary, the metabolic processes of A. bisporus related to postharvest quality during ambient storage were investigated using metabolomic and transcriptomic approaches. Changes in lipid metabolites, particularly the high accumulation of LPC and LPE, indicated that the cell membrane structure of A. bisporus was dynamically remodeled during ambient storage. The changes may have a great impact on the appearance and texture of A. bisporus. Future studies will focus on developing preservation techniques that inhibit cell membrane degradation. Together, our results provide a theoretical basis and reference for further post-harvest preservation management of A. bisporus.

Supplementary Materials

The following supporting information can be downloaded at the website of this paper posted on Preprints.org, Figure S1: Identification and functional characterization of the differentially accumulated metabolites (DAMs) of the button mushroom flesh under different storage times at 23 ℃. (A) Venn diagram depicting the shared and specific metabolites between the three compared groups of the mushroom samples. KEGG enrichment analysis of the DAMs between (B) CK vs RT_6, (C)RT_6 vs RT_24, (D) CK vs RT_24.; Figure S2: Total phenolic content (A), PPO activity (B), MDA content (C), and relative conductivity rate (D) of button mushroomsduring postharvest storage at 23 °C.; Figure S3: Preliminary analysis of transcriptomics data.(A) PCA of the nine samples for transcriptomics analysis. (B)Pearson’s correlation coefficients of different storage times.; Figure S4: Validation of RNA-seq data by qPCR analysis.; Table S1: The identified metabolites in the button mushroom flesh.; Table S2: KEGG enrichment analysis of DAMs.; Table S3: The identified lipid metabolites in the button mushroom flesh.; Table S4: KEGG pathway enrichment analysis of DEGs.; Table S5: KEGG pathway annotation and classification of DEGs.; Table S6: DEGs and pathways related to lipid metabolism.; Table S7: Details of primers for qPCR used in this study.

Author Contributions

Conceptualization, G.Y. and N. L.; methodology, M. T. and Y.T.; validation, Y.F.; formal analysis, F.C.; investigation, Y.T. and Y.H.; resources, F.C. and Y.F.; data curation, M. T., Y.T. and F.C.; writing—original draft preparation, M. T., Y.T. and N. L.; writing—review and editing, N. L. and G.Y.; visualization, F.C.; supervision, G.Y. and N. L; project administration, N. L.; funding acquisition, G.Y. and N. L. All authors have read and agreed to the published version of the manuscript.

Funding

Please add: This research was funded by the New Variety Breeding Project of Science Technology Department of Zhejiang Province to N.L. (2021C02073-4) and by the Research Program of Qilu Institute of Technology to G.Y. (QIT23TP009).

Acknowledgments

We are grateful to Xingyu Lin (Zhejiang A&F University) for technical supports for the physiological experiments.

Conflicts of Interest

The authors declare no conflicts of interest. The funders had no role in the design of the study; in the collection, analyses, or interpretation of data; in the writing of the manuscript; or in the decision to publish the results.

References

  1. Sen, S.; Chakraborty, R. Herbal Medicine in India: Indigenous Knowledge, Practice, Innovation and Its Value; Springer: Berlin/Heidelberg, Germany, 2019. [Google Scholar]
  2. Venturella, G.; Ferraro, V.; Cirlincione, F.; Gargano, M.L. Medicinal mushrooms: bioactive compounds, use, and clinical trials. Int J Mol Sci. 2021, 22, 634. [Google Scholar] [CrossRef] [PubMed]
  3. Usman, M.; Murtaza, G.; Ditta, A. Nutritional, medicinal, and cosmetic value of bioactive compounds in button mushroom (Agaricus bisporus): A review. Appl Sci. 2021, 11, 5943. [Google Scholar] [CrossRef]
  4. Chaitanya, M.V.N.L.; Jose, A.; Ramalingam, P.; Mandal, S.C.; Kumar, P.N. Multi-targeting cytotoxic drug leads from mushrooms. Asian Pacific J. Trop. Med. 2019, 12, 531. [Google Scholar] [CrossRef]
  5. Tirta Ismaya, W.; Tjandrawinata, R.R.; Rachmawati, H. Lectins from the Edible Mushroom Agaricus bisporus and Their Therapeutic Potentials. Molecules 2020, 25, 2368. [Google Scholar] [CrossRef] [PubMed]
  6. Predanócyová, K.; Árvay, J.; Šnirc, M. Exploring consumer behavior and preferences towards edible mushrooms in Slovakia. Foods. 2023, 12, 657. [Google Scholar] [CrossRef] [PubMed]
  7. Fernandes, Â.; Antonio, A.L.; Oliveira, M.B.P.P.; Martins, A.; Ferreira, I.C.F.R. Effect of gamma and electron beam irradiation on the physico-chemical and nutritional properties of mushrooms: A review. Food Chem. 2012, 135, 641–650. [Google Scholar] [CrossRef] [PubMed]
  8. Zhang, K.; Pu, Y.Y.; Sun, D.W. Recent advances in quality preservation of postharvest mushrooms (Agaricus bisporus): A review. Trends Food Sci. Technol. 2018, 78, 72–82. [Google Scholar] [CrossRef]
  9. Qu, H.; Zhou, H.B.; Ma, T.; Zheng, Z.H.; Zheng, E.P.; Yang, H.L.; Gao, H.Y. TMT-based quantitative proteomic analysis of postharvest Coprinus comatus fruiting body during storage. Postharvest Biol. Technol. 2022, 185, 111786. [Google Scholar] [CrossRef]
  10. Yurttas, Z.S.; Moreira, R.G.; Castell-Perez, E. Combined vacuum impregnation and electron-beam irradiation treatment to extend the storage life of sliced white button mushrooms (Agaricus bisporus). J. Food Sci. 2014, 79, E39–E46. [Google Scholar] [CrossRef]
  11. Gantner, M.; Guzek, D.; Pogorzelska, E.; Brodowska, M.; Wojtasik-Kalinowska, I.; Godziszewska, J. The Effect of Film Type and Modified Atmosphere Packaging with Different Initial GAS Composition on the Shelf Life of White Mushrooms (Agaricus bisporus L.). J. Food Process. Preserv. 2016, 41, e13083. [Google Scholar] [CrossRef]
  12. Dellarosa, N.; Frontuto, D.; Laghi, L.; Dalla Rosa, M.; Lyng, J.G. The impact of pulsed electric fields and ultrasound on water distribution and loss in mushrooms stalks. Food Chem. 2017, 236, 94–100. [Google Scholar] [CrossRef] [PubMed]
  13. Guan, W.; Fan, X.; Yan, R. Effect of combination of ultraviolet light and hydrogen peroxide on inactivation of Escherichia coli O157: H7, native microbial loads, and quality of button mushrooms. Food Control. 2013, 34, 554–559. [Google Scholar] [CrossRef]
  14. Aday, M.S. Application of electrolyzed water for improving postharvest quality of mushroom. LWT Food Sci. Technol. 2016, 68, 44–51. [Google Scholar] [CrossRef]
  15. Nasiri, M.; Barzegar, M.; Sahari, M.A.; Niakousari, M. Tragacanth gum containing Zataria multiflora Boiss. essential oil as a natural preservative for the storage of button mushrooms (Agaricus bisporus). Food Hydrocoll. 2017, 72, 202–209.
  16. Wang, T.; Yun, J.; Zhang, Y.; Bi, Y.; Zhao, F.; Niu, Y. Effects of ozone fumigation combined with nano-film packaging on the postharvest storage quality and antioxidant capacity of button mushrooms (Agaricus bisporus). Postharvest Biol. Technol. 2021, 176, 111501. [Google Scholar] [CrossRef]
  17. Azevedo, S.; Cunha, L.M.; Oliveira, J.C.; Mahajan, P.V.; Fonseca, S.C. Modelling the influence of time, temperature and relative humidity conditions on the mass loss rate of fresh oyster mushrooms. J. Food Eng. 2017, 212, 108–112. [Google Scholar] [CrossRef]
  18. Singh, P.; Langowski, H.C.; Wani, A.A.; Saengerlaub, S. Recent advances in extending the shelf life of fresh Agaricus mushrooms: A review. J. Sci. Food Agric. 2010, 90, 1393–1402. [Google Scholar] [CrossRef] [PubMed]
  19. Wu, X.; Guan, W.; Yan, R.; Lei, J.; Xu, L.; Wang, Z. Effects of UV-C on antioxidant activity, total phenolics and main phenolic compounds of the melanin biosynthesis pathway in different tissues of button mushroom. Postharvest Biol. Technol. 2016, 118, 51–58. [Google Scholar] [CrossRef]
  20. Gao, X. ; Wu,W. ; Chen,H.; Niu,B.;Han,Y.; Fang,X.;Chen,H.; Liu,R.;Gao, H. Nitric oxide treatment delays quality deterioration and enzymatic browning of Agaricus bisporus via reactive oxygen metabolism regulation, Food Front. 2023, 4, 447–458. [Google Scholar]
  21. Ding, Y.; Zhu, Z.; Zhao, J.; Nie, Y.; Zhang, Y.; Sheng, J.; Meng, D.; Mao, H.; Tang, X. Effects of postharvest brassinolide treatment on the metabolism of white button mushroom (Agaricus bisporus) in relation to development of browning during storage. Food Bioprocess Technol. 2016, 9, 1327–1334. [Google Scholar] [CrossRef]
  22. Toivonen, P.M.A.; Brummell, D.A. Biochemical bases of appearance and texture changes in fresh-cut fruit and vegetables. Postharvest Biol. Technol. 2008, 48, 1–14. [Google Scholar] [CrossRef]
  23. Wrona, M.; Bentayeb, K.; Nerín, C. A novel active packaging for extending the shelf-life of fresh mushrooms (Agaricus bisporus). Food Control 2015, 54, 200–207. [Google Scholar] [CrossRef]
  24. Ghasemi-Varnamkhasti, M.; Mohammad-Razdari, A.; Yoosefian, S.H.; Izadi, Z. Effects of the combination of gamma irradiation and Ag nanoparticles polyethylene films on the quality of fresh bottom mushroom (Agaricus bisporus L.). J. Food Processing Preserv. 2018, 42, e13652. [Google Scholar] [CrossRef]
  25. Joshi, K.; Warby, J.; Velverde, J.; Tiwari, B.; Cullen, P.J.; Frias, J.M. Impact of cold chain and product variability on quality attributes of modified atmosphere packed mushrooms (Agaricus bisporus) throughout distribution. J. Food Eng. 2018, 232, 44–55. [Google Scholar] [CrossRef]
  26. Lei, J.; Li, B.; Zhang, N.; Yan, R.; Guan, W.; Brennan, C.S.; Gao, H.; Peng, B. Effects of UV-C treatment on browning and the expression of polyphenol oxidase (PPO) genes in different tissues of Agaricus bisporus during cold storage. Postharvest Biol. Technol. 2018, 139, 99–105. [Google Scholar] [CrossRef]
  27. Cai, Z.-X.; Chen, M.-Y.; Lu, Y.-P.; Guo, Z.-J.; Zeng, Z.-H.; Liao, J.-H.; Zeng, H. Metabolomics and transcriptomics unravel the mechanism of browning resistance in Agaricus bisporus. PLoS ONE 2022, 17, e0255765. [Google Scholar] [CrossRef]
  28. Lin,Y. ;Zhan,L.;Shao,P.; Sun, P. Phase-change materials and exogenous melatonin treatment alleviated postharvest senescence of Agaricus bisporus by inhibiting browning and maintaining cell membrane integrity. Postharvest Biol. Technol. 2022, 192, 112009. [Google Scholar]
  29. [Li, L.; Kitazawa, H.; Zhang, X.H.; Zhang, L.M.; Sun, Y.; Wang, X.Y.; Liu, Z.L.; Guo, Y.Y.; Yu, S.X. Melatonin retards senescence via regulation of the electron leakage of postharvest white mushroom (Agaricus bisporus). Food Chem. 2021, 340, 127833. [Google Scholar]
  30. Zhang, Y.; Zhao, X.; Ma, Y.; Zhang, L.; Jiang, Y.; Liang, H.; Wang, D. Transcriptome and metabolome profiling to elucidate mechanisms underlying the blue discoloration of radish roots during storage. Food Chem. 2021, 362, 130076. [Google Scholar] [CrossRef] [PubMed]
  31. Zhao, L.; Zhang, B.; Huang, H.; Huang, W.; Zhang, Z.; Wang, Q.; Luo, H.; An, B. Metabolomic and Transcriptomic Analyses Provide Insights into Metabolic Networks during Cashew Fruit Development and Ripening. Food Chem. 2023, 404, 134765. [Google Scholar] [CrossRef]
  32. Li, T.; Zhang, J.; Gao, X.Y.; Chen, J.F.; Zheng, Y.F.; Gao, Y.Q.; Qiu, L.Y. The molecular mechanism for the ethylene regulation of postharvest button mushrooms maturation and senescence. Postharvest Biol. Technol. 2019, 156, 110930. [Google Scholar] [CrossRef]
  33. Nazir, A.; AlDhaheri, M.; Mudgil, P.; Marpu, P.; Kamal-Eldin, A. Hyperspectral imaging based kinetic approach to assess quality deterioration in fresh mushrooms (Agaricus bisporus) during postharvest storage. Food Control 2021, 131, 108298. [Google Scholar] [CrossRef]
  34. Meng, D.; Song, T.; Shen, L.; Zhang, X.; Sheng, J. Postharvest application of methyl jasmonate for improving quality retention of Agaricus bisporusfruit bodies. J. Agric. Food Chem. 2012, 60, 6056–6062. [Google Scholar] [CrossRef] [PubMed]
  35. Liu, J.; Tian, S.; Meng, X.; Xu, Y. Effects of chitosan on control of postharvest diseases and physiological responses of tomato fruit. Postharvest Biol. Technol. 2007, 44, 300–306. [Google Scholar] [CrossRef]
  36. Plesoianu, A.M.; Nour, V. Effect of Some Polysaccharide-Based Edible Coatings on Fresh White Button Mushroom (Agaricus bisporus) Quality during Cold Storage. Agriculture. 2022, 12, 1491. [Google Scholar] [CrossRef]
  37. Yan, X.; Cheng, M.; Wang, Y.; Zhao, P.; Wang, K.; Wang, Y.; Wang, X.; Wang, J. Evaluation of film packaging containing mesoporous nanosilica and oregano essential oil for postharvest preservation of mushrooms (Agaricus bisporus). Postharvest Biol. Technol. 2023, 198, 112263. [Google Scholar] [CrossRef]
  38. Choi,Y. J.; Eom, H.;Yang,S.-H.;Nandre,R.;Kim,S.;Kim,M.;Oh,Y.-L.;Nakazawa,T.;Honda,Y.;Ro,H.-S. Heterokaryosis, the main obstacle in the generation of PPO1-edited Agaricus bisporus by CRISPR/Cas9 system. Sci. Hortic. 2023, 318, 112095. [Google Scholar] [CrossRef]
  39. Hammond, J.B.W.; Nichols, R. Changes in respiration and soluble carbohydrates during the post-harvest storage of mushrooms (Agaricus bisporus). J. Sci. Food Agric. 1975, 26, 835–842. [Google Scholar] [CrossRef]
  40. Mohebbi, M.; Ansarifar, E.; Hasanpour, N.; Amiryousefi, M.R. Suitability of Aloe vera and Gum Tragacanth as Edible Coatings for Extending the Shelf Life of Button Mushroom. Food Bioprocess Technol. 2012, 5, 3193–3202. [Google Scholar] [CrossRef]
  41. Thakur, R.R.; Shahi, N.C.; Mangaraj, S.; Lohani, U.C.; Chand, K. Development of an organic coating powder and optimization of process parameters for shelf life enhancement of button mushrooms (Agaricus bisporus). J. Food Process. Preserv. 2011, 45, e15306. [Google Scholar] [CrossRef]
  42. Zhang, Q.; Wang, L.; Liu, Z.; Zhao, Z.; Zhao, J.; Wang, Z.; Zhou, G.; Liu, P.; Liu, M. Transcriptome and Metabolome Profiling Unveil the Mechanisms of Ziziphus jujuba Mill. Peel Coloration. Food Chem. 2019, 312, 125903. [Google Scholar] [CrossRef] [PubMed]
  43. Mou, Z.L.; Wang, L.; Zeng, Z.X.; Su, X.G.; Ji, S.J.; Shan, W.; Kuang, J.; Lu, W. ; Chen,Y. ;Zhao,Y.;Chen,J. Metabolomics integrated with transcriptomics unveil the regulatory pathways of modified atmosphere packaging–maintained leaf quality of Chinese flowering cabbage, Food Chem. 2023, 405, 134910. [Google Scholar]
  44. Hou, J.; Yan, D.; Liu, Y.; Wang, W.; Hong, M.; He, M.; Yang,X. ; Zeng, K.;Yao, S. Global changes in metabolic pathways in endocarp of ‘Dayagan’ hybrid citrus fruit during segment drying revealed by widely targeted metabolomics and transcriptomics analysis. Postharvest Biol. Technol. 2023, 198, 112255. [Google Scholar] [CrossRef]
  45. Li, L.; Kiroaki, H.; Zhang, R.; Wang, X.; Zhang, L.; Yu, S.; Li, Y. New insights into the chilling injury of postharvest white mushroom (Agaricus bisporus) related to mitochondria and electron transport pathway under high O2/CO2 controlled atmospheres. Postharvest Biol. Technol. 2019, 152, 45–53. [Google Scholar] [CrossRef]
  46. Subramaniam, S.; Jiao, S.; Zhang, Z.; Jing, P. Impact of post-harvest processing or thermal dehydration on physiochemical, nutritional and sensory quality of shiitake mushrooms. Compr. Rev. Food Sci. Food Saf. 2021, 20, 2560–2595. [Google Scholar] [CrossRef] [PubMed]
  47. [Tao, L.; Long, H.; Zhang, J.; Qi, L.; Zhang, S.; Li, T.; Li, S. Preparation and coating application of γ-polyglutamic acid hydrogel to improve storage life and quality of shiitake mushrooms. Food Control. 2021, 130, 108404. [Google Scholar]
  48. D. Mohapatra, Z.M. Bira, J.P. Kerry, J.M. Frías, F.A. Rodrigues, Postharvest Hardness and Color Evolution of White Button Mushrooms (Agaricus bisporus), J. Food Sci. 2010, 75, E146–E152.
  49. Mohapatra, D.; Bira, Z.M.; Kerry, J.P.; Frías, J.M.; Rodrigues, F.A. Postharvest hardness and color evolution of white button mushrooms (Agaricus bisporus). J. Food Sci. 2010, 75, 146–152. [Google Scholar] [CrossRef]
  50. Qu, T.; Li, B.; Huang, X.; Li, X.; Ding, Y.; Chen, J.; Tang, X. Effect of Peppermint Oil on the Storage Quality of White Button Mushrooms (Agaricus Bisporus). Food Bioprocess Technol. 2020, 13, 404–418. [Google Scholar] [CrossRef]
  51. Zhang, L.M.; Liu, Z.L.; Sun, Y.; Wang, X.M.; Li, L. Combined antioxidant and sensory effects of active chitosan/zein film containing a-tocopherol on Agaricus bisporus. Food Packag. Shelf Life 2020, 24, 100470. [Google Scholar] [CrossRef]
  52. Gao, M.S.; Feng, L.F.; Jiang, T.J. Browning inhibition and quality preservation of button mushroom (Agaricus bisporus) by essential oils fumigation treatment. Food Chem. 2014, 149, 107–113. [Google Scholar] [CrossRef]
  53. Kong, X.; Wei, B.; Gao, Z.; Zhou, Y.; Shi, F.; Zhou, X.; Zhou, Q.; Ji, S. Changes in membrane lipid composition and function accompanying chilling injury in bell peppers. Plant Cell Physiol. 2017, 59, 167–178. [Google Scholar] [CrossRef]
  54. Hu, Y.-H.; Chen, C.-M.; Xu, L.; Cui, Y.; Yu, X.-Y.; Gao, H.-J.; Wang, Q.; Liu, K.; Shi, Y.; Chen, Q.-X. Postharvest application of 4-methoxy cinnamic acid for extending the shelf life of mushroom (Agaricus bisporus). Postharvest Biol. Technol. 2015, 104, 33–41. [Google Scholar] [CrossRef]
  55. Huang, Q.; Qian, X.; Jiang, T.; Zheng, X. Effect of chitosan and guar gum based composite edible coating on quality of mushroom (Lentinus edodes) during postharvest storage. Sci. Hortic. 2019, 253, 382–389. [Google Scholar] [CrossRef]
  56. [Van der Veen, J.N.; Kennelly, J.P.; Wan, S.; Vance, J.E.; Vance, D.E.; Jacobs, R.L. The Critical Role of Phosphatidylcholine and Phosphatidylethanolamine Metabolism in Health and Disease. Biochim. Biophys. Acta (BBA)—Biomembr. 2017, 1859, 1558–1572. [Google Scholar] [CrossRef] [PubMed]
  57. He, M.; Kuk, A.C.Y.; Ding, M.; Chin, C.F.; Galam, D.L.A.; Nah, J.M.; Tan, B.C.; Yeo, H.L.; Chua, G.L.; Benke, P.I.; et al. Spns1 is a lysophospholipid transporter mediating lysosomal phospholipid salvage. Proc. Natl. Acad. Sci.USA 2022, 119, e2210353119. [Google Scholar] [CrossRef] [PubMed]
  58. Liu, C.-E.; Chen, W.-J.; Chang, C.-K.; Li, P.-H.; Lu, P.-L.; Hsieh, C.-W. Effect of a high voltage electrostatic field (HVEF) on the shelf life of persimmons (Diospyros kaki). LWT. 2017, 75, 236–242. [Google Scholar] [CrossRef]
  59. Petriccione, M.; Pagano, L.; Forniti, R.; Zampella, L.; Mastrobuoni, F.; Scortichini, M.; Mencarelli, F. Postharvest treatment with chitosan affects the antioxidant metabolism and quality of wine grape during partial dehydration. Postharvest Biol. Technol. 2018, 137, 38–45. [Google Scholar] [CrossRef]
  60. Yan, M.; Yuan, B.; Xie, Y.; Cheng, S.J.; Huang, H.D.; Zhang, W.; Chen, J.Q.; Cao, C.J. Improvement of postharvest quality, enzymes activity and polyphenoloxidase structure of postharvest Agaricus bisporus in response to high voltage electric field. Postharvest Biol. Technol. 2020, 166, 111230. [Google Scholar] [CrossRef]
  61. Cheng, R.; Li, W.; Wang, Y.; Cheng, F.; Wu, H.; Sun, Y. Low voltage electrostatic field treatment of fresh-cut pineapples with slightly acidic electrolytic water: Influence on physicochemical changes and membrane stability. Sci. Hortic. 2023, 308, 111602. [Google Scholar] [CrossRef]
  62. Wang, Y.; Luo, Z.; Khan, Z.U.; Mao, L.; Yin, T. Effect of nitric oxide on energy metabolism in postharvest banana fruit in response to chilling stress. Postharvest Biol. Technol. 2015, 108, 21–27. [Google Scholar] [CrossRef]
  63. Luo, S.; Hu, H.; Wang, Y.; Zhou, H.; Zhang, Y.; Zhang, L.; Li, P. The role of melatonin in alleviating the postharvest browning of lotus seeds through energy metabolism and membrane lipid metabolism. Postharvest Biol. Technol. 2020, 167, 111243. [Google Scholar] [CrossRef]
  64. Yan,Z. ; Wang, H.;Kou,X.;Wu,C.;Fan,G.;Li,T.;Zhou,D. Metabolomics analysis reveals that MeJA treatment induces postharvest blueberry resistance to Botrytis cinerea. Postharvest Biol. Technol. 2022, 194, 112075. [Google Scholar]
  65. Wang, K.; Yin, X.-R.; Zhang, B.; Grierson, D.; Xu, C.-J.; Chen, K.-S. Transcriptomic and metabolic analyses provide new insights into chilling injury in peach fruit. Plant Cell Environ. 2017, 40, 1531–1551. [Google Scholar] [CrossRef]
  66. Zhu, Y.C.; Wang, K.; Wu, C.X.; Zhao, Y.; Yin, X.R.; Zhang, B.; Grierson, D.; Chen, K.S.; Xu, C.J. Effect of Ethylene on Cell Wall and Lipid Metabolism during Alleviation of Postharvest Chilling Injury in Peach. Cells. 2019, 8, 1612. [Google Scholar] [CrossRef]
  67. Gutterson, N.; Reuber, T.L. Regulation of disease resistance pathways by AP2/ERF transcription factors. Curr. Opin. Plant Biol. 2004, 7, 465–471. [Google Scholar] [CrossRef] [PubMed]
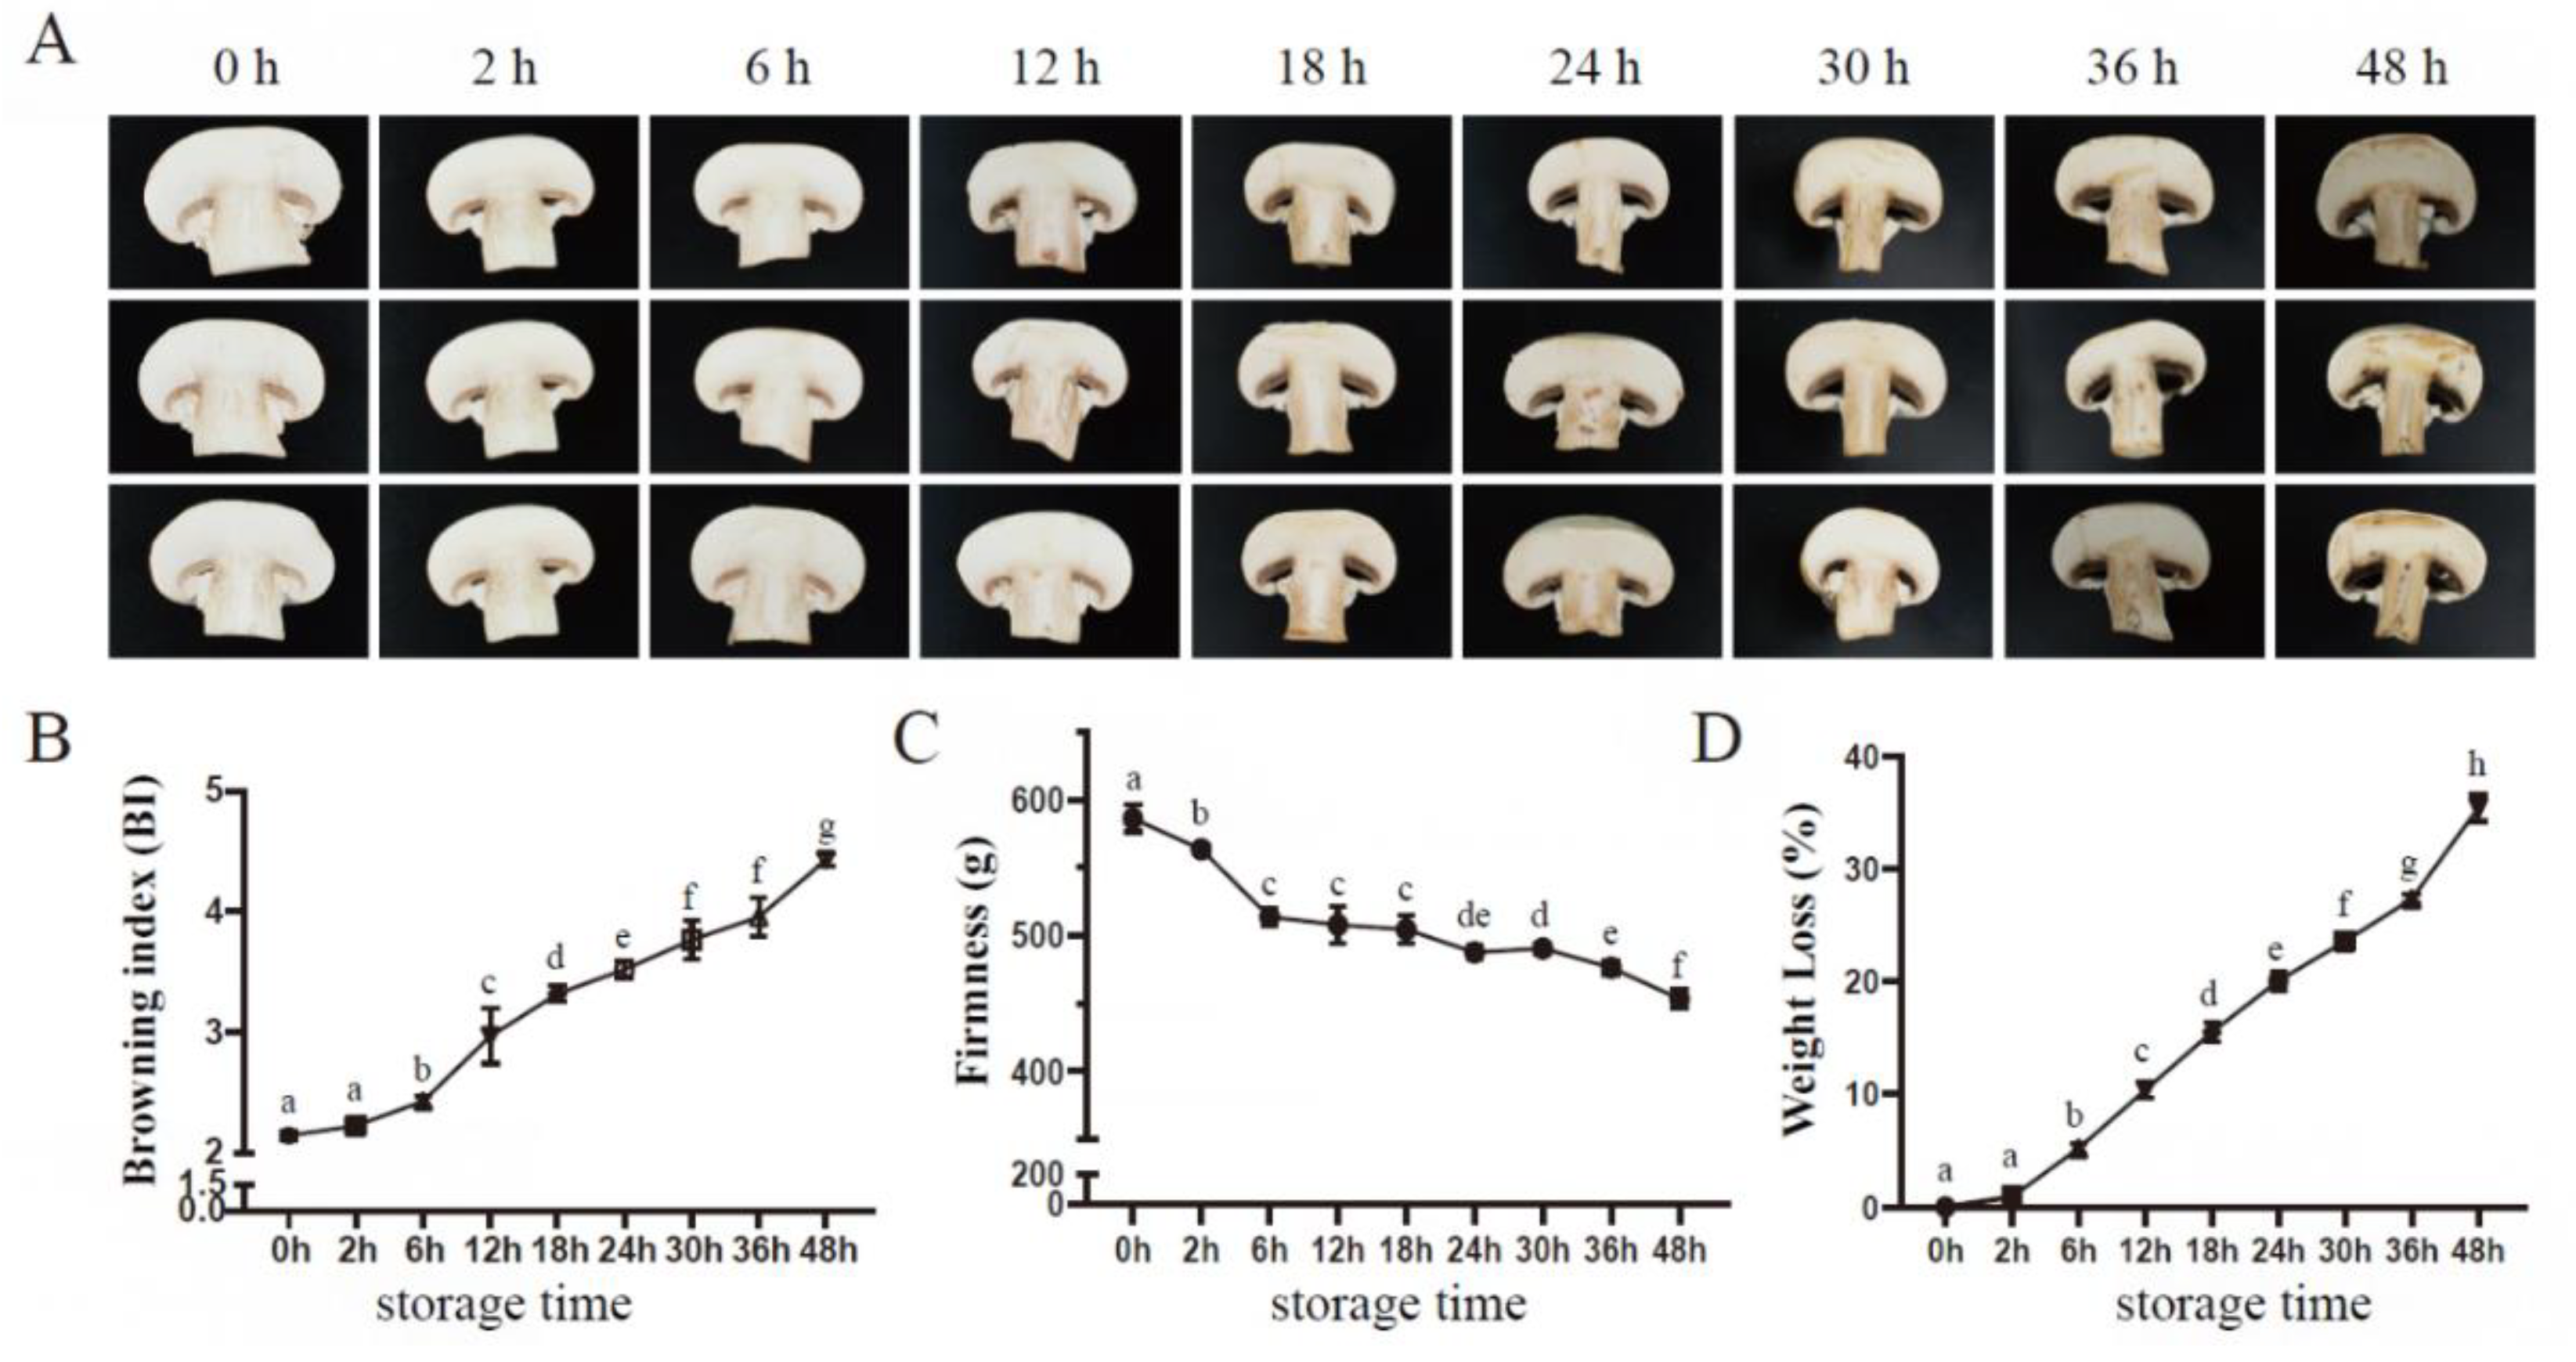
Figure 1. Button mushroom change inappearance(A), browning index (B), firmness (C), and weight loss (D) during postharvest storage at 23 °C. Vertical bars represent standard deviation (n = 3). Different lower-case letters represent significant differences between samples under different storage points.
Preprints 108635 g001
Figure 2. Changes in the cellular ultrastructure of A. bisporus before storage at room temperature (A1, A2, A3) and after 24 h of storage (B1, B2, B3). CW, cell wall; CM, cell membrane; ER, endoplasmic reticulum; M, mitochondria; Magnification power: A, B1. ×2500;A2,B2. ×5000;A3,B3. ×10000. Images are representative of three replicates.
Preprints 108635 g002
Figure 3. Metabonomic analysis of the button mushrooms under different storage times at 23 ℃. (A) PCA and (B) Pearson’s correlation coefficients of different storage times. (C) Pie chart of the types and quantities of metabolites identified. (D) The blue and purple bars indicate the numbers of up- and down-regulated DAMs between each comparison group.
Preprints 108635 g003
Figure 4. Lipidomic analysis of button mushrooms flesh under different storage times at 23 ℃. (A) The contents of different lipid families and species. Heatmap of contents of phospholipids (B), fatty acids (C), and sphingolipids (D) differentially accumulated in the comparison of CK, RT_6 and RT_24.The red, yellow, and green denote the low, middle, and high content.PC, phosphatidylcholine; LPC, lysophosphatidylcholine; LPE, lysophosphatidylethanolamine.
Preprints 108635 g004
Figure 5. Transcriptomic analysisofbutton mushrooms flesh under different storage times at 23 ℃. (A) The blue and purple bars indicate the numbers of up- and down-regulated DEGs between each comparison group, respectively. (B) Venn diagram of up- and down-regulated differentially expressed genes, respectively. (C) KEGG annotation and classification of differentially expressed genes.
Preprints 108635 g005
Figure 6. Modulation of lipid metabolism pathway genes during storage at 23 ℃. Solid arrows indicate biosynthetic steps and dashed arrows indicate catabolic steps.The expression patterns are presented by heatmap on the basis of log2 FPKM. The color gradient from green to red corresponds to transcript levels from low to high. Abbreviations used are as follows: MCMT, malonyl-CoA: acyl carrier protein malonyltransferase; LACS, long-chain acyl-CoA synthetase; GPAT, glycerol-3-phosphate acyltransferase; LPA, lysophosphatidic acid; LPAT, lysophosphatidic acid acyltransferase; PLA, phospholipase A; PA, phosphatidic acid; PAP, PA phosphatase;CDS, CDP-diacylglycerol synthase; PSS, base-exchange-type phosphatidylserine synthase; PLD, phospholipase D; PI3K, PI 3-kinase; KSR, ketosphinganine reductase; SK, sphingosine kinase; SPL, sphingosine 1-phosphate lyase; LOH, lag1 longevity assurance homolog; SBH, sphingosine base hydroxylase; CDase, ceramidase; ∆8SLD, delta8 sphingolipid long-chain base desaturase; FAH, fatty acid alpha-hydroxylase; IPUT, inositol phosphoryl ceramide glucuronosyltransferase.
Preprints 108635 g006
Figure 7. Differentially expressed transcription factors (TFs) in button mushrooms. (A) The ratios of differentially expressed transcription factors from different classes. (B) Expression profiles of differentially expressed C2H2 and Zn(II)2Cys6 family members. Up-regulated (red) and down-regulated (green) genes are indicated.
Preprints 108635 g007
Figure 8. This is a figure. Schemes follow the same formatting. Transcriptome (gene) and metabolome (meta)-combined KEGG enrichment analysis. Joint KEGG enrichment of histograms for RT_6 vs. CK (A) and RT_24 vs. RT_6 (B).
Preprints 108635 g008
Disclaimer/Publisher’s Note: The statements, opinions and data contained in all publications are solely those of the individual author(s) and contributor(s) and not of MDPI and/or the editor(s). MDPI and/or the editor(s) disclaim responsibility for any injury to people or property resulting from any ideas, methods, instructions or products referred to in the content.
Copyright: This open access article is published under a Creative Commons CC BY 4.0 license, which permit the free download, distribution, and reuse, provided that the author and preprint are cited in any reuse.
Prerpints.org logo

Preprints.org is a free preprint server supported by MDPI in Basel, Switzerland.

Subscribe

© 2024 MDPI (Basel, Switzerland) unless otherwise stated