1. Introduction
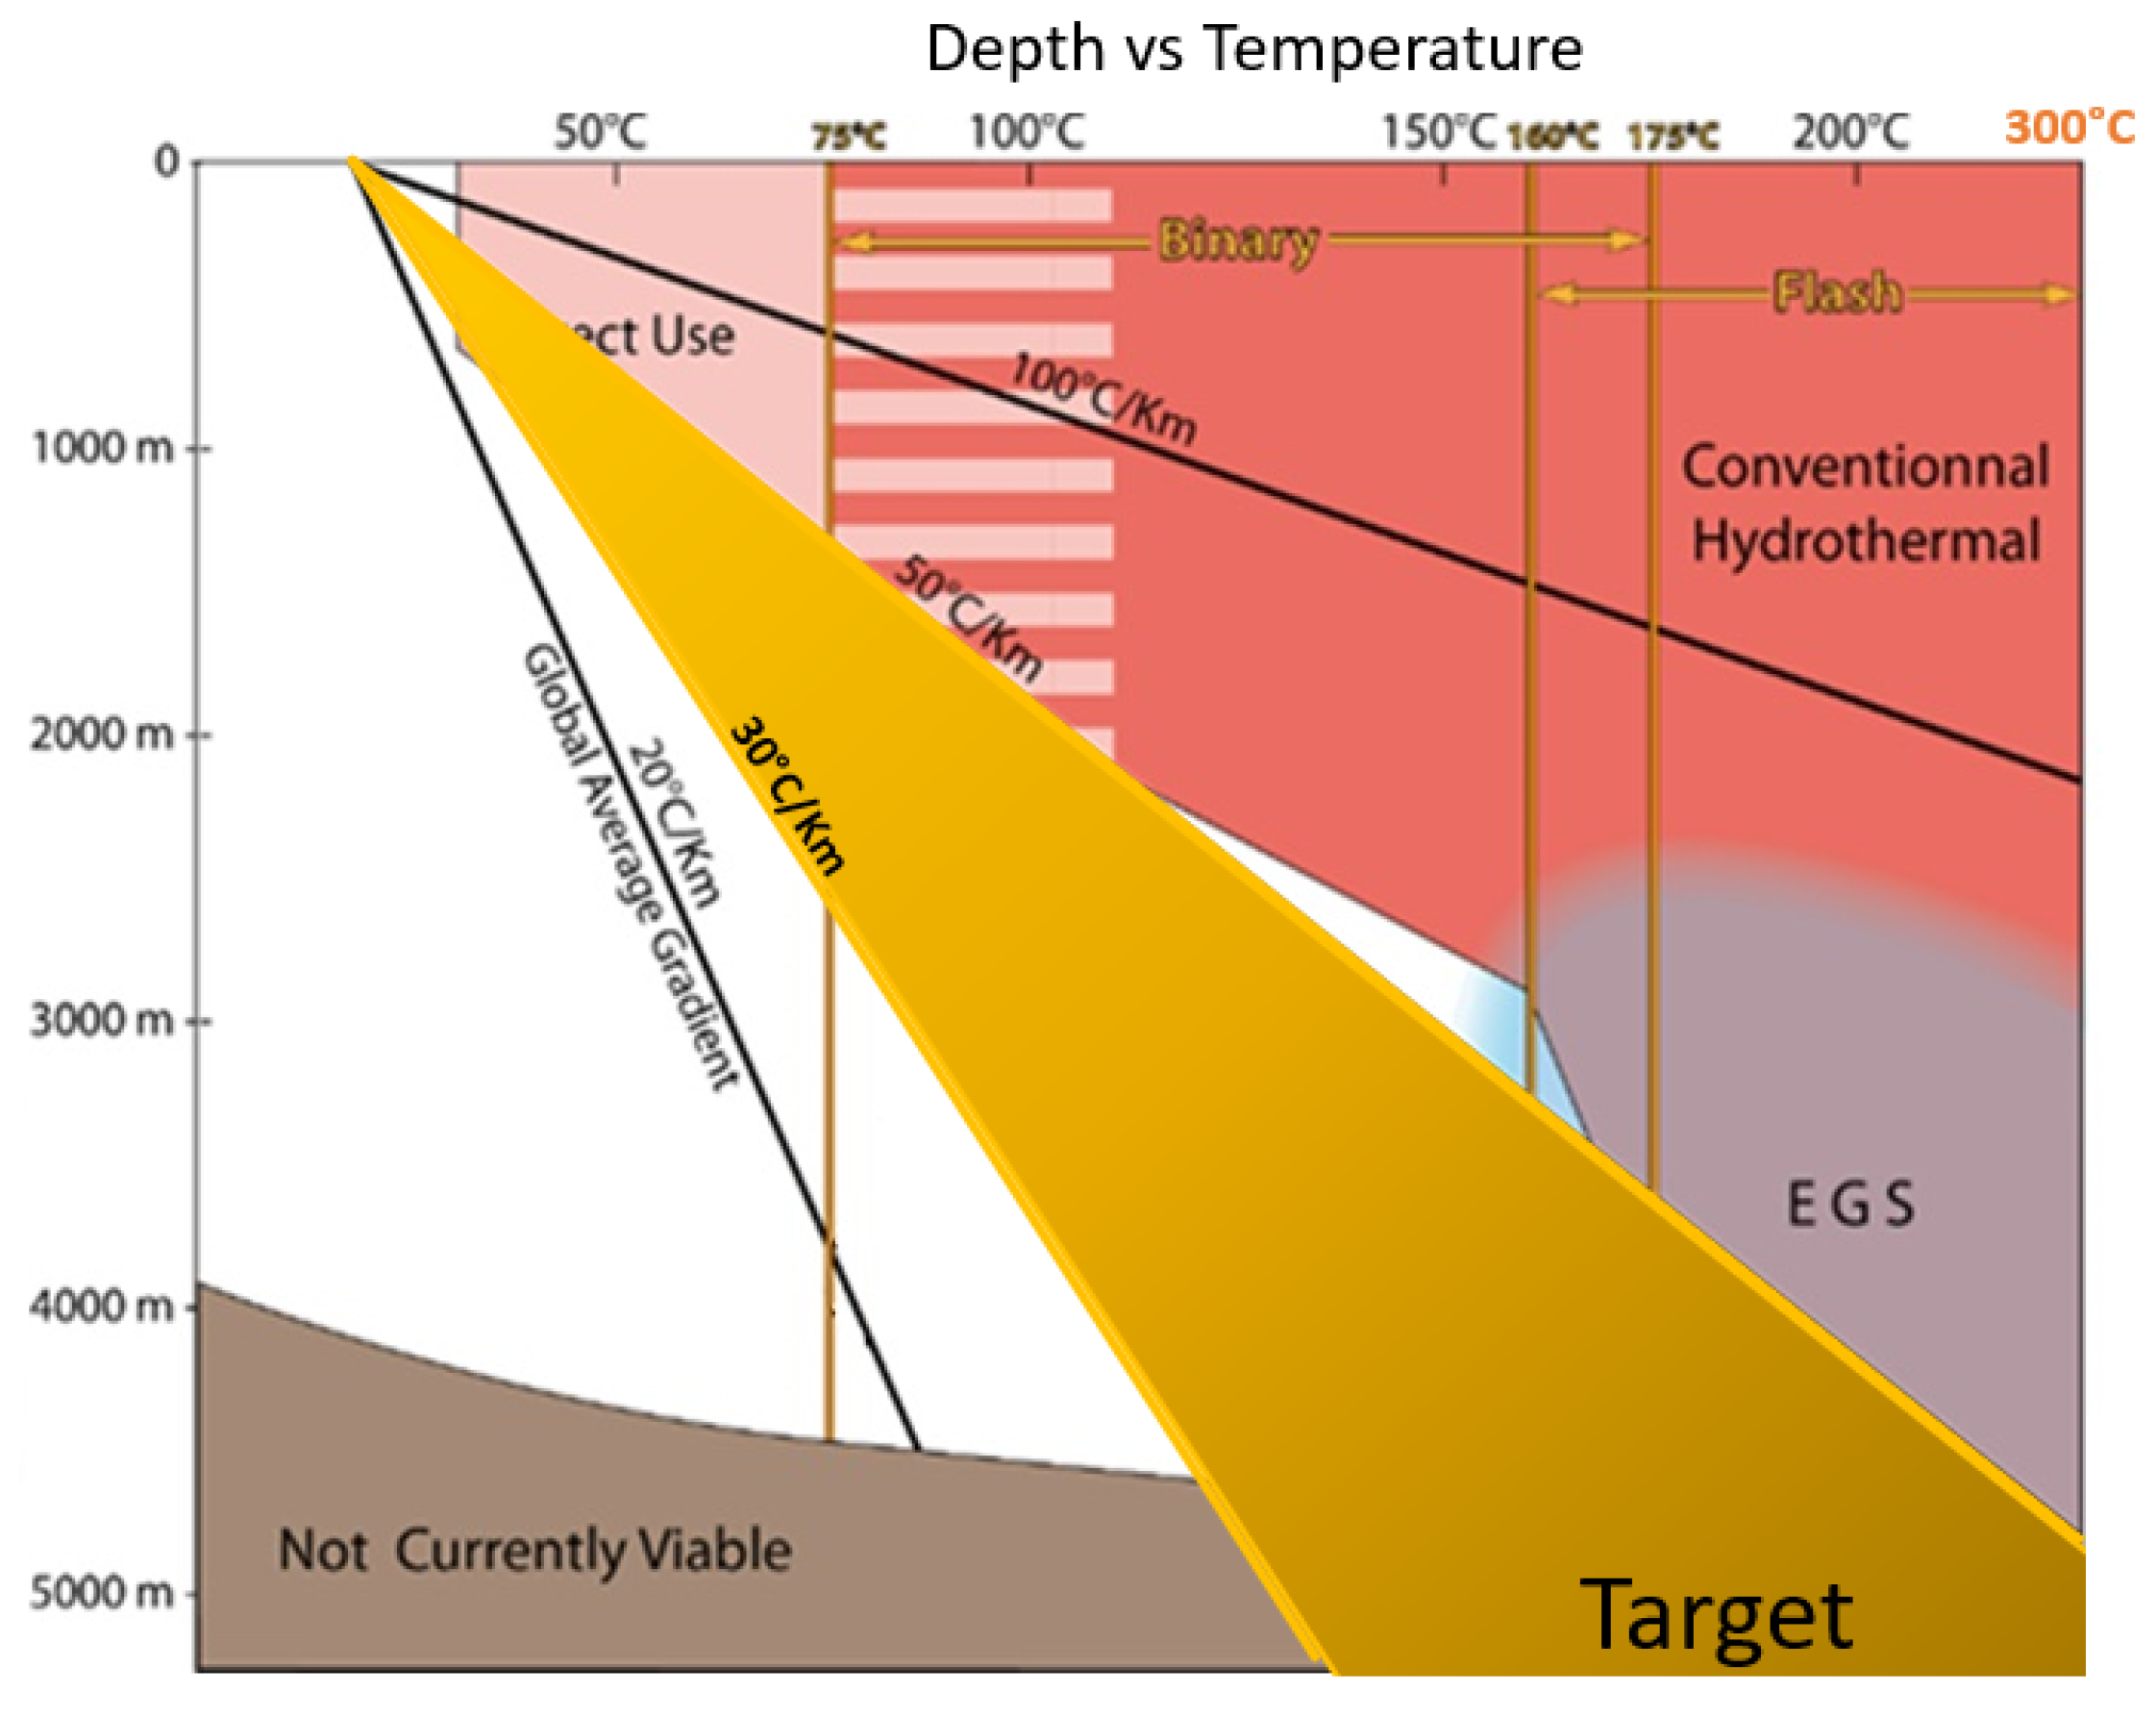
Geothermal energy, sourced from the Earth’s internal heat, offers a sustainable low carbon solution for continuous power generation, despite challenges in its extraction and utilization. The Denver-Julesburg (DJ) Basin, covering parts of Colorado, Wyoming, and Nebraska, presents untapped geothermal potential, especially in the Wattenberg field’s basement. This region, known for its high heat flow and thermal gradient, requires advanced drilling technologies due to its complex geology and deep reservoirs that can reach temperatures up to 300 °C (572 °F). Successful exploitation depends on a deep understanding of subsurface geology, fluid dynamics, and reservoir characteristics such as porosity, permeability, and thermal properties, which are pivotal in determining the efficiency of heat extraction. As depicted in
Figure 1, technologies vary with depth and temperature; shallow, hot areas might use conventional hydrothermal systems, while deeper, hotter regions may need Enhanced Geothermal Systems (EGS) to create permeable fracture networks for effective heat extraction. This highlights the necessity for innovative approaches in exploring and harnessing geothermal energy in challenging environments.
Maintaining optimal fluid flow rates is critical in geothermal energy extraction to prevent thermal breakthrough and sustain reservoir pressure, as highlighted by recent studies [
1,
2,
3]. Strategic placement and configuration of production and injection wells are essential for managing these aspects without causing interference. Advanced reservoir engineering techniques, including simulation and monitoring, are increasingly vital for maximizing heat extraction and ensuring the longevity of the reservoir [
4,
5].
As the field of geothermal technology advances, ongoing research and innovative approaches, such as Enhanced Geothermal Systems (EGS), are crucial. EGS, recognized as a promising method for harnessing geothermal energy in low-permeability formations, involves creating permeability through hydraulic stimulation but must carefully consider potential issues like induced seismicity and environmental impacts [
6].
The DJ Basin, with its high geothermal gradients and complex geological features, offers significant potential for geothermal exploration [
7,
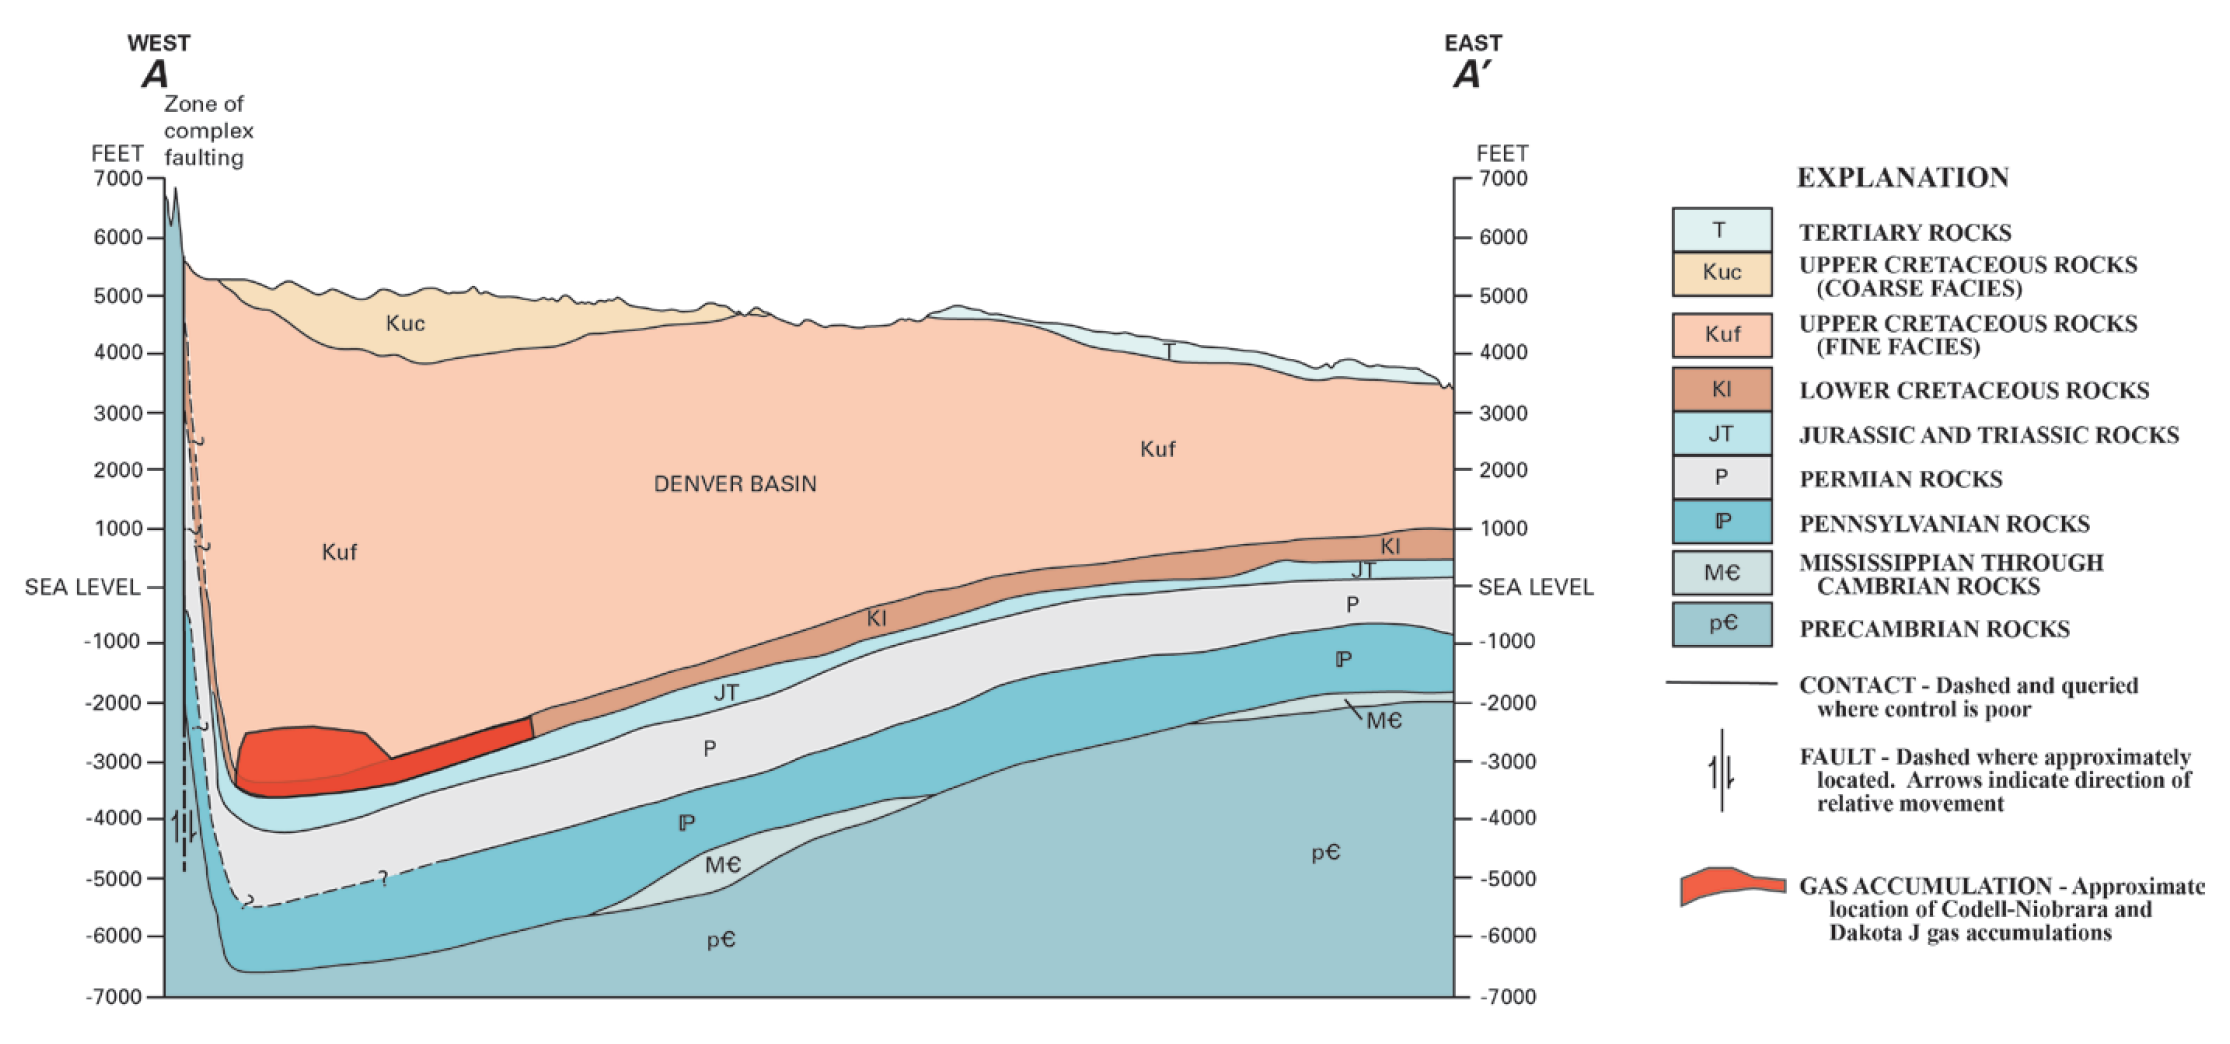
8]. The basin’s geothermal profile, illustrated in
Figure 2, shows a complex network of fault zones and cracked substrates favorable for Hot Dry Rock (HDR) systems. This cross-sectional view details the geological strata, fault zones, and potential HDR reservoirs, focusing on the Precambrian rocks in the Wattenberg field’s basement, which are key targets for geothermal exploitation.
1.1. Geothermal Well Configurations
The quest for efficient geothermal energy extraction continues to drive innovation, particularly in well configurations such as the development of closed-loop systems in horizontal wells. Innovations like the heat transmission fluid recycling in horizontal wells, offer high heat mining rates in low-temperature geothermal reservoirs without complex hydro-fracturing, signaling a shift towards more sustainable solutions [
10]. Multilateral well configurations in Enhanced Geothermal Systems (EGS) further exemplify significant progress, optimizing fluid-rock interactions for maximal heat extraction [
11].
Additionally, advancements in horizontal wells, which generally yield better sweep efficiency than vertical wells, improve energy extraction by extending contact with the reservoir [
12]. In EGS, the integration of advanced drilling and fracturing techniques enhances heat output while managing thermal breakthrough risks, as shown in the Western Canada Sedimentary Basin [
13]. The exploration of U-Shaped and Pipe-in-Pipe Closed Loop Geothermal Systems (CLGS) by researchers such as Song et al. [
14] and Bu et al. [
15], alongside the Coaxial Closed-Loop Geothermal Systems studied by Zhang et al. [
16] and Wang et al. [
17], introduce innovative approaches to address challenges like water loss and thermal short-circuiting, enhancing heat exchange efficiency.
This work expands on previous studies to explore the application of these innovative well configurations in deep Hot Dry Rock (HDR) reservoirs, extending to depths up to 20,000 ft ( 6100 meters) to model U-Shaped, V-Shaped, EGS, and Pipe-in-Pipe systems. This effort not only pushes the boundaries of geothermal research but also evaluates the feasibility, efficiency, and potential of these configurations in tapping into Earth’s deep thermal energy, making a substantial contribution to sustainable energy extraction.
2. Methodology
This work presents a detailed reservoir simulation study to assess the geothermal energy extraction potential from deep wells in the Wattenberg field’s granitic basement, DJ Basin, Colorado. The study evaluates various well configurations and operational strategies, specifically comparing traditional and innovative system designs such as U-Shaped, V-Shaped, Inclined V-Shaped, and Pipe-in-Pipe setups against Enhanced Geothermal Systems (EGS). Through numerical modeling, it explores the thermal dynamics under different operational conditions, focusing on the comparative efficacy of open-hole versus closed-hole systems and the potential of hybrid approaches combining closed-loop and EGS technologies. The findings aim to enhance understanding of reservoir behavior, optimize energy output, and improve the longevity and performance of geothermal systems, thereby contributing to advanced geothermal resource development in complex geological settings like the DJ Basin, Colorado.
2.1. Numerical Reservoir Simulation Approach
Reservoir simulation is essential for understanding the behavior of geothermal reservoirs under various operational conditions, particularly in the granitic formations of the Wattenberg field, DJ Basin, Colorado. Utilizing numerical modeling, this research solves the conservation equations for mass, momentum, and energy across a discretized grid to analyze interactions between the geothermal fluid, rock fractures, and the rock matrix. The methodology aims to deepen our understanding of the physical and thermal characteristics of the reservoir. By simulating different operational scenarios, such as varying well layouts, fluid temperatures, and injection and production rates, we address key research questions to optimize geothermal energy extraction.
The simulation is grounded in a detailed understanding of the geological and geothermal properties of the Wattenberg field’s granitic formations at a depth of 6100 meters. Key parameters like permeability, porosity, thermal conductivity, specific heat, and the viscosity of high-temperature geothermal fluids—typically brine—are defined to model fluid movement and heat transfer in the reservoir. To focus on the deep formations, we insulate all production wells to minimize interference from shallower sedimentary layers, allowing a direct assessment of the deeper geothermal potential.
We test various operational scenarios, including adjustments to well layouts, fluid injection temperatures, and flow rates, to evaluate their impact on energy extraction. This detailed simulation process provides precise and meaningful insights, enhancing the prediction reliability and supporting the development of more efficient and sustainable geothermal systems in the DJ Basin.
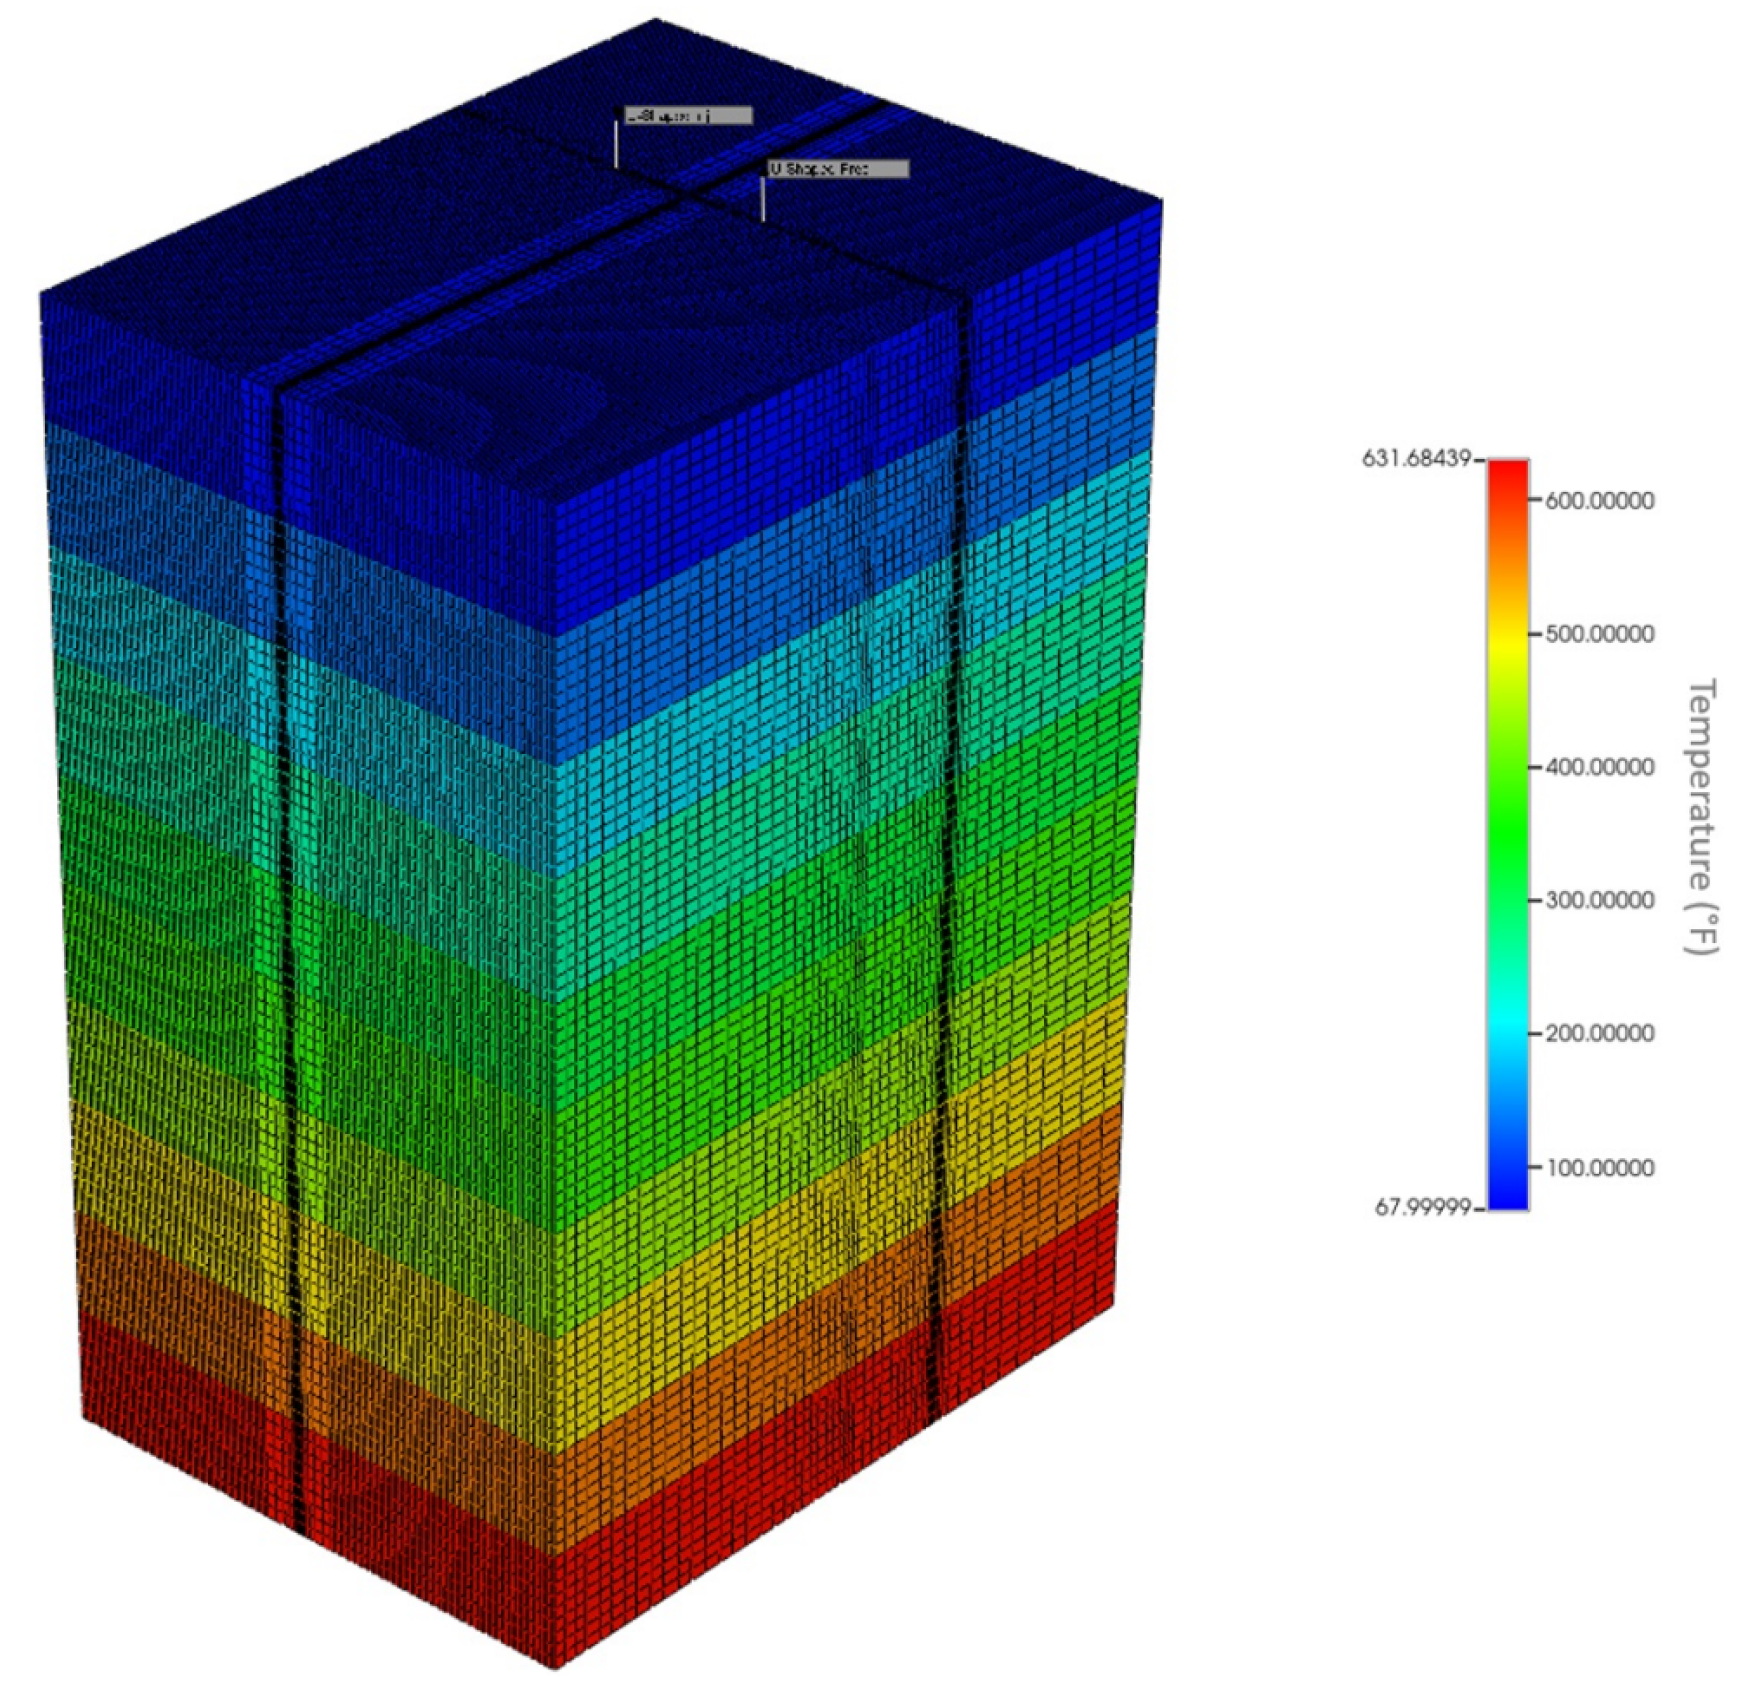
Our simulation utilizes a Cartesian grid oriented along the I, J, and K axes, with dimensions of 141, 59, and 86 blocks respectively. This setup ensures a detailed representation near critical wellbore locations to enhance thermal dynamics modeling (
Figure 3). Each block, identified by a User Block Address (UBA), is key for achieving model convergence and accurately depicting temperature variations within the rock matrix. The reservoir simulator was built using the commercial software STARS by Computer Modeling Group (CMG).
For our geothermal reservoir simulations, we simplify the fluid-rock interaction, treating reservoir properties as constants. The porosity is set at 1%, and permeability at 1e-6 millidarcies, with 100% water saturation assumed across the reservoir. Hydrostatic pressure gradient and rock compressibility are critical to the simulation’s foundational parameters, established at 10 kPa/m and 4.35e-7 1/kPa, respectively, crucial for accurate pressure distribution modeling within the reservoir (
Table 1).
The thermal behavior of the reservoir is modeled using best-case scenario properties based on recent studies by Frash et al. [
18], which recommend a formation volumetric heat capacity of 2,667,500 J/(m³·°C) and a thermal conductivity of 252,720 J/(m·day·°C).
These properties are integral to our understanding of heat transfer dynamics within the reservoir, applied alongside a working fluid volumetric heat capacity of 53,500 J/(m·day·°C). The simulation uses freshwater as the working fluid, with properties configured to high-temperature conditions of the geothermal reservoir (
Table 2).
Initial conditions reflect the geothermal and pressure environment of the deep subsurface targeted for exploration, establishing a consistent baseline for the simulation’s phase equilibrium studies (
Table 3).
Geomechanical interactions were not explicitly modeled to focus on thermal dynamics and fluid flow within the wells, consistent with the operational premise of closed-loop and EGS configurations. This comprehensive approach allows for detailed analysis and optimization of geothermal energy extraction strategies within the Wattenberg field’s granitic formations, providing valuable insights into enhancing efficiency and sustainability.
2.2. Wells Configuration and Fluid Dynamics
This section explores the detailed configuration of wells within each model, emphasizing the importance of distinct well types and their operational parameters for optimizing fluid dynamics in energy extraction processes.
2.2.1. U-Shaped Closed-Loop System Model Description
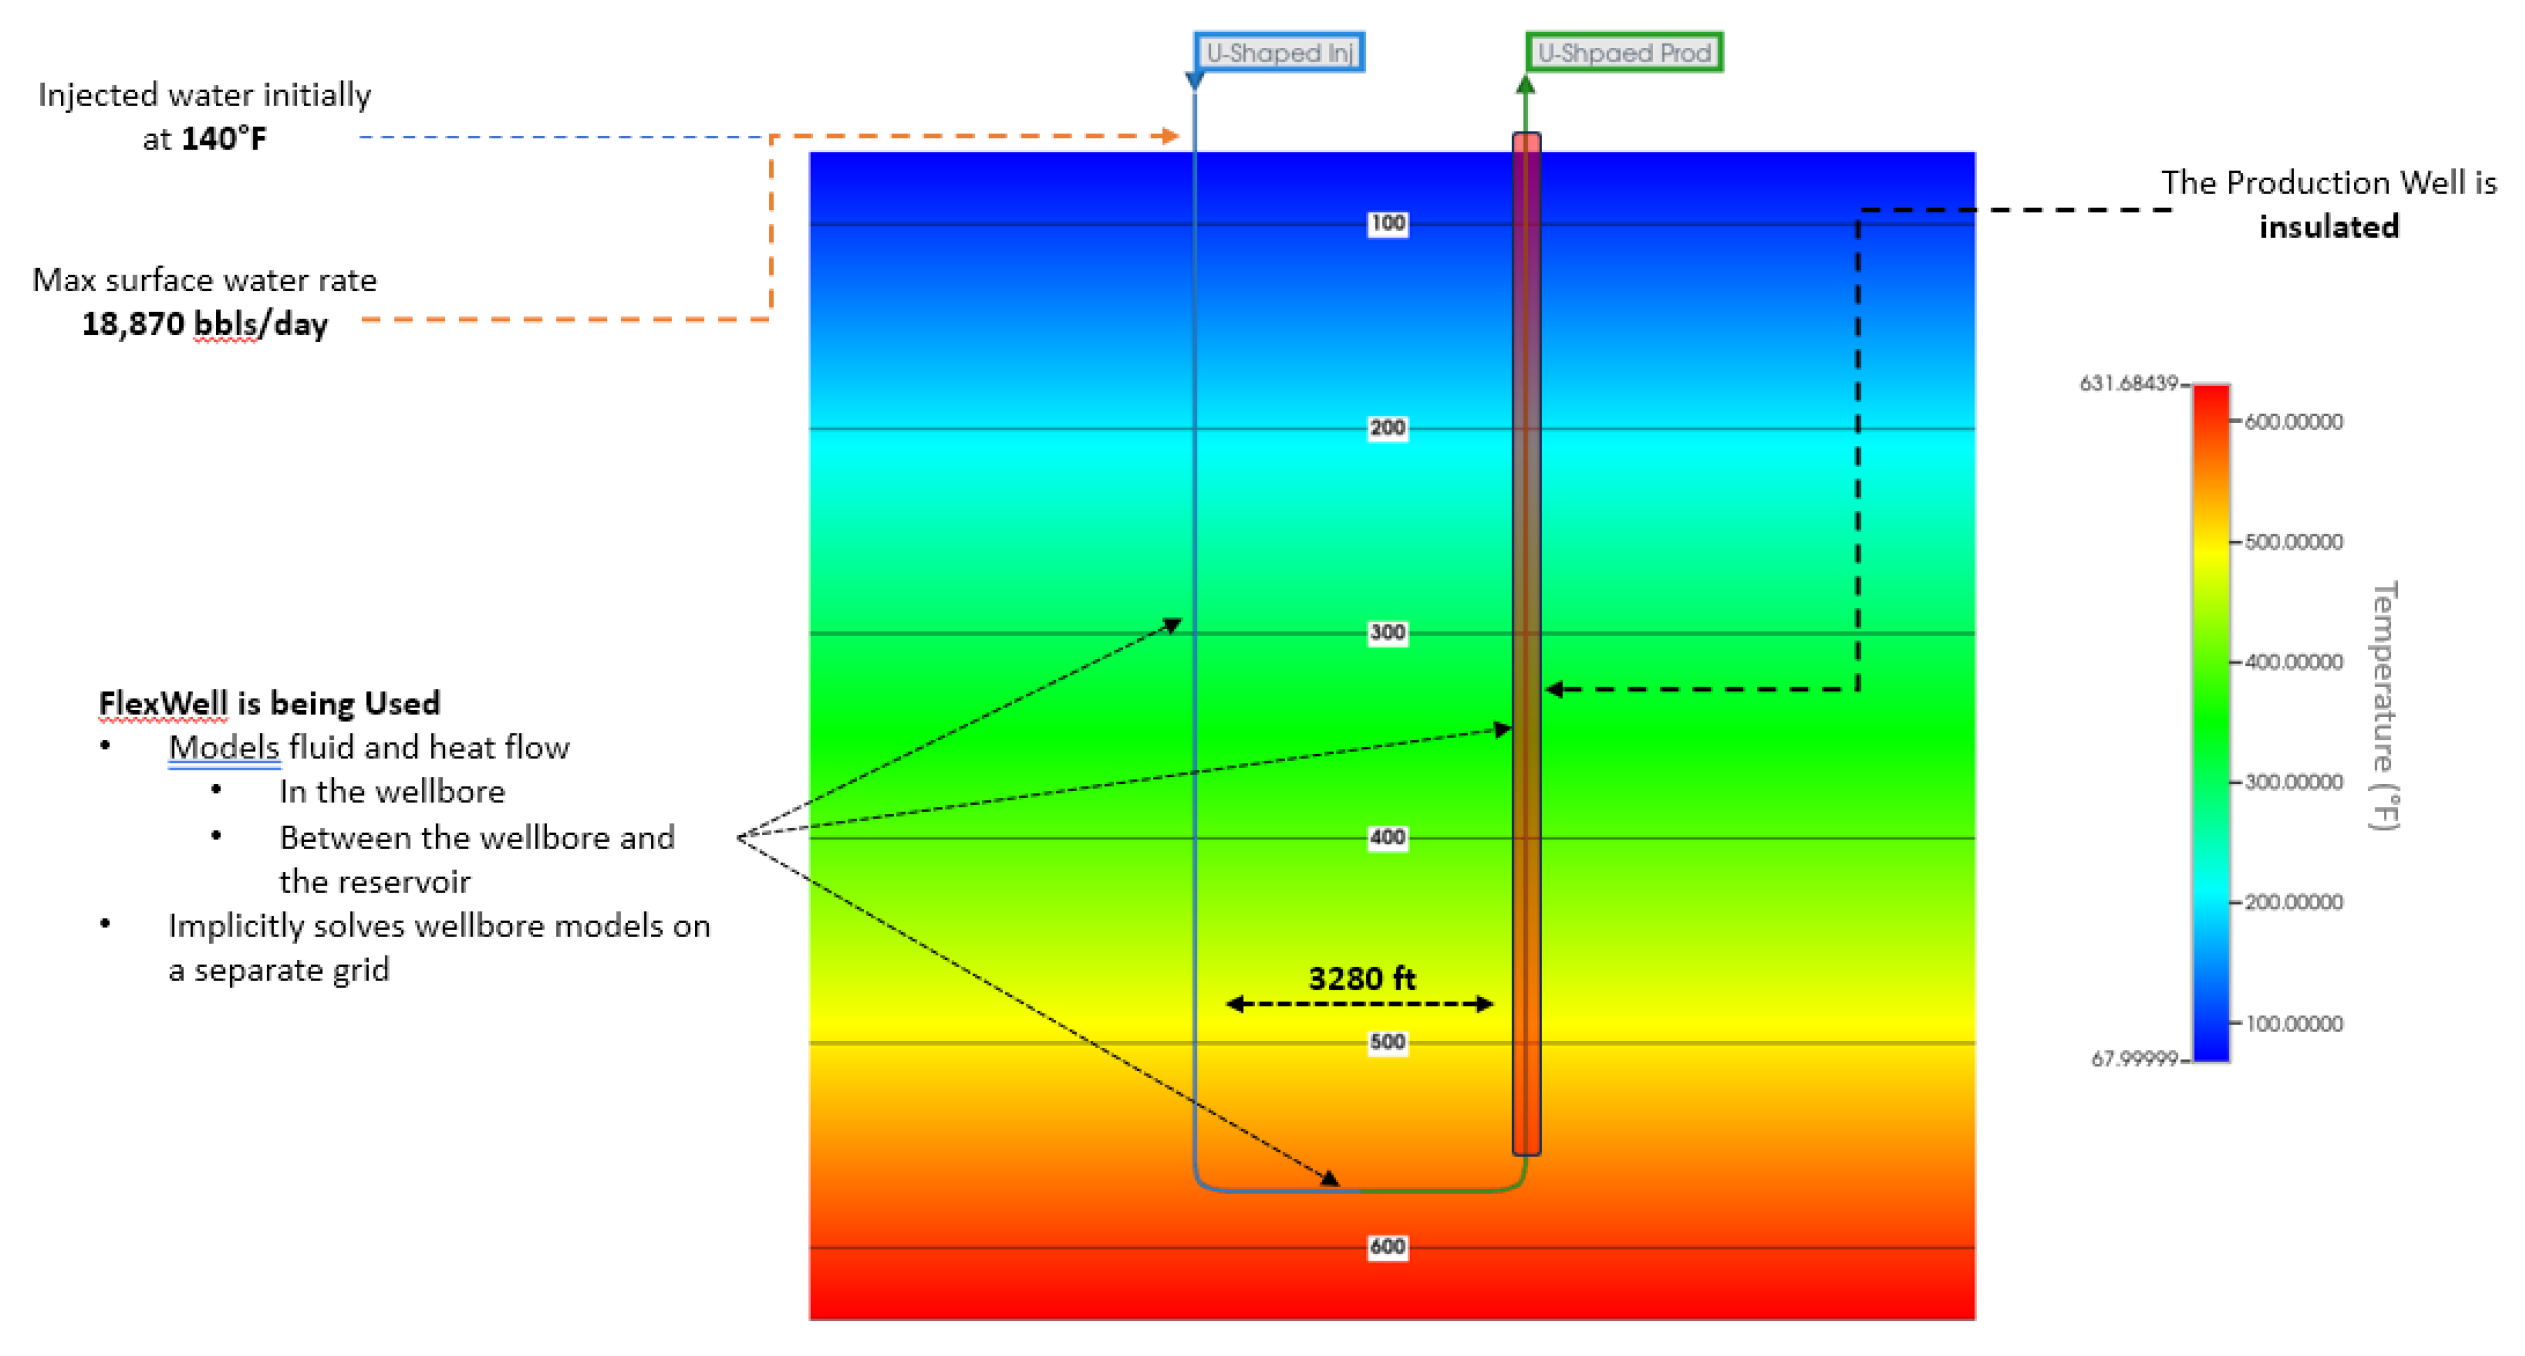
The U-Shaped CLGS represents an innovative approach designed for efficient geothermal energy extraction from Hot Dry Rock (HDR) reservoirs. It employs two horizontal wells, connected at the target depth and representing a single continuous pipe for fluid flow, configured in a U-shape to promote continuous heat transfer to the flowing fluid through the reservoir, simplifying construction and reducing costs while enhancing heat extraction efficiency (
Figure 4).
The injection segment of the U-shaped model, termed “Injector,” initiates at the surface and extends deep into the geothermal system, aligned with the refined grid blocks to ensure accurate fluid dynamics modeling. This well starts from UBA (48, 17, 1) and extends horizontally after reaching UBA (48, 17, 77), continuing to UBA (67, 17, 77). It is categorized as an injection well and designed to handle a maximum surface water rate of 3000 m3/day with a standardized well radius of 0.14 m for uniformity across the model.
Similarly, the “Producer” well mirrors the “Injector” in terms of trajectory and operational parameters but functions to extract the heated fluid. It stretches from UBA (87, 17, 1) to UBA (87, 17, 76) and connects horizontally to UBA (67, 17, 77), maintaining the system’s fluid balance with identical operational conditions to the Injector. The production well is insulated to preserve thermal energy extracted from deep within the reservoir. This insulation is crucial for minimizing heat losses across the extended horizontal reach, ensuring efficient heat exchange.
The working fluid used is freshwater, set at an injection temperature of 60°C, with a steam quality of 0, under a pressure of 6875 kPa, optimized for the geothermal conditions of the model.
The FlexWell configuration is integral for accurately simulating the thermal and fluid mechanics of the U-shaped model. It involves specifying casing properties and diameter for both the “Injector” and “Producer” wells to ensure consistent and accurate modeling within the FlexWell framework (
Table 4).
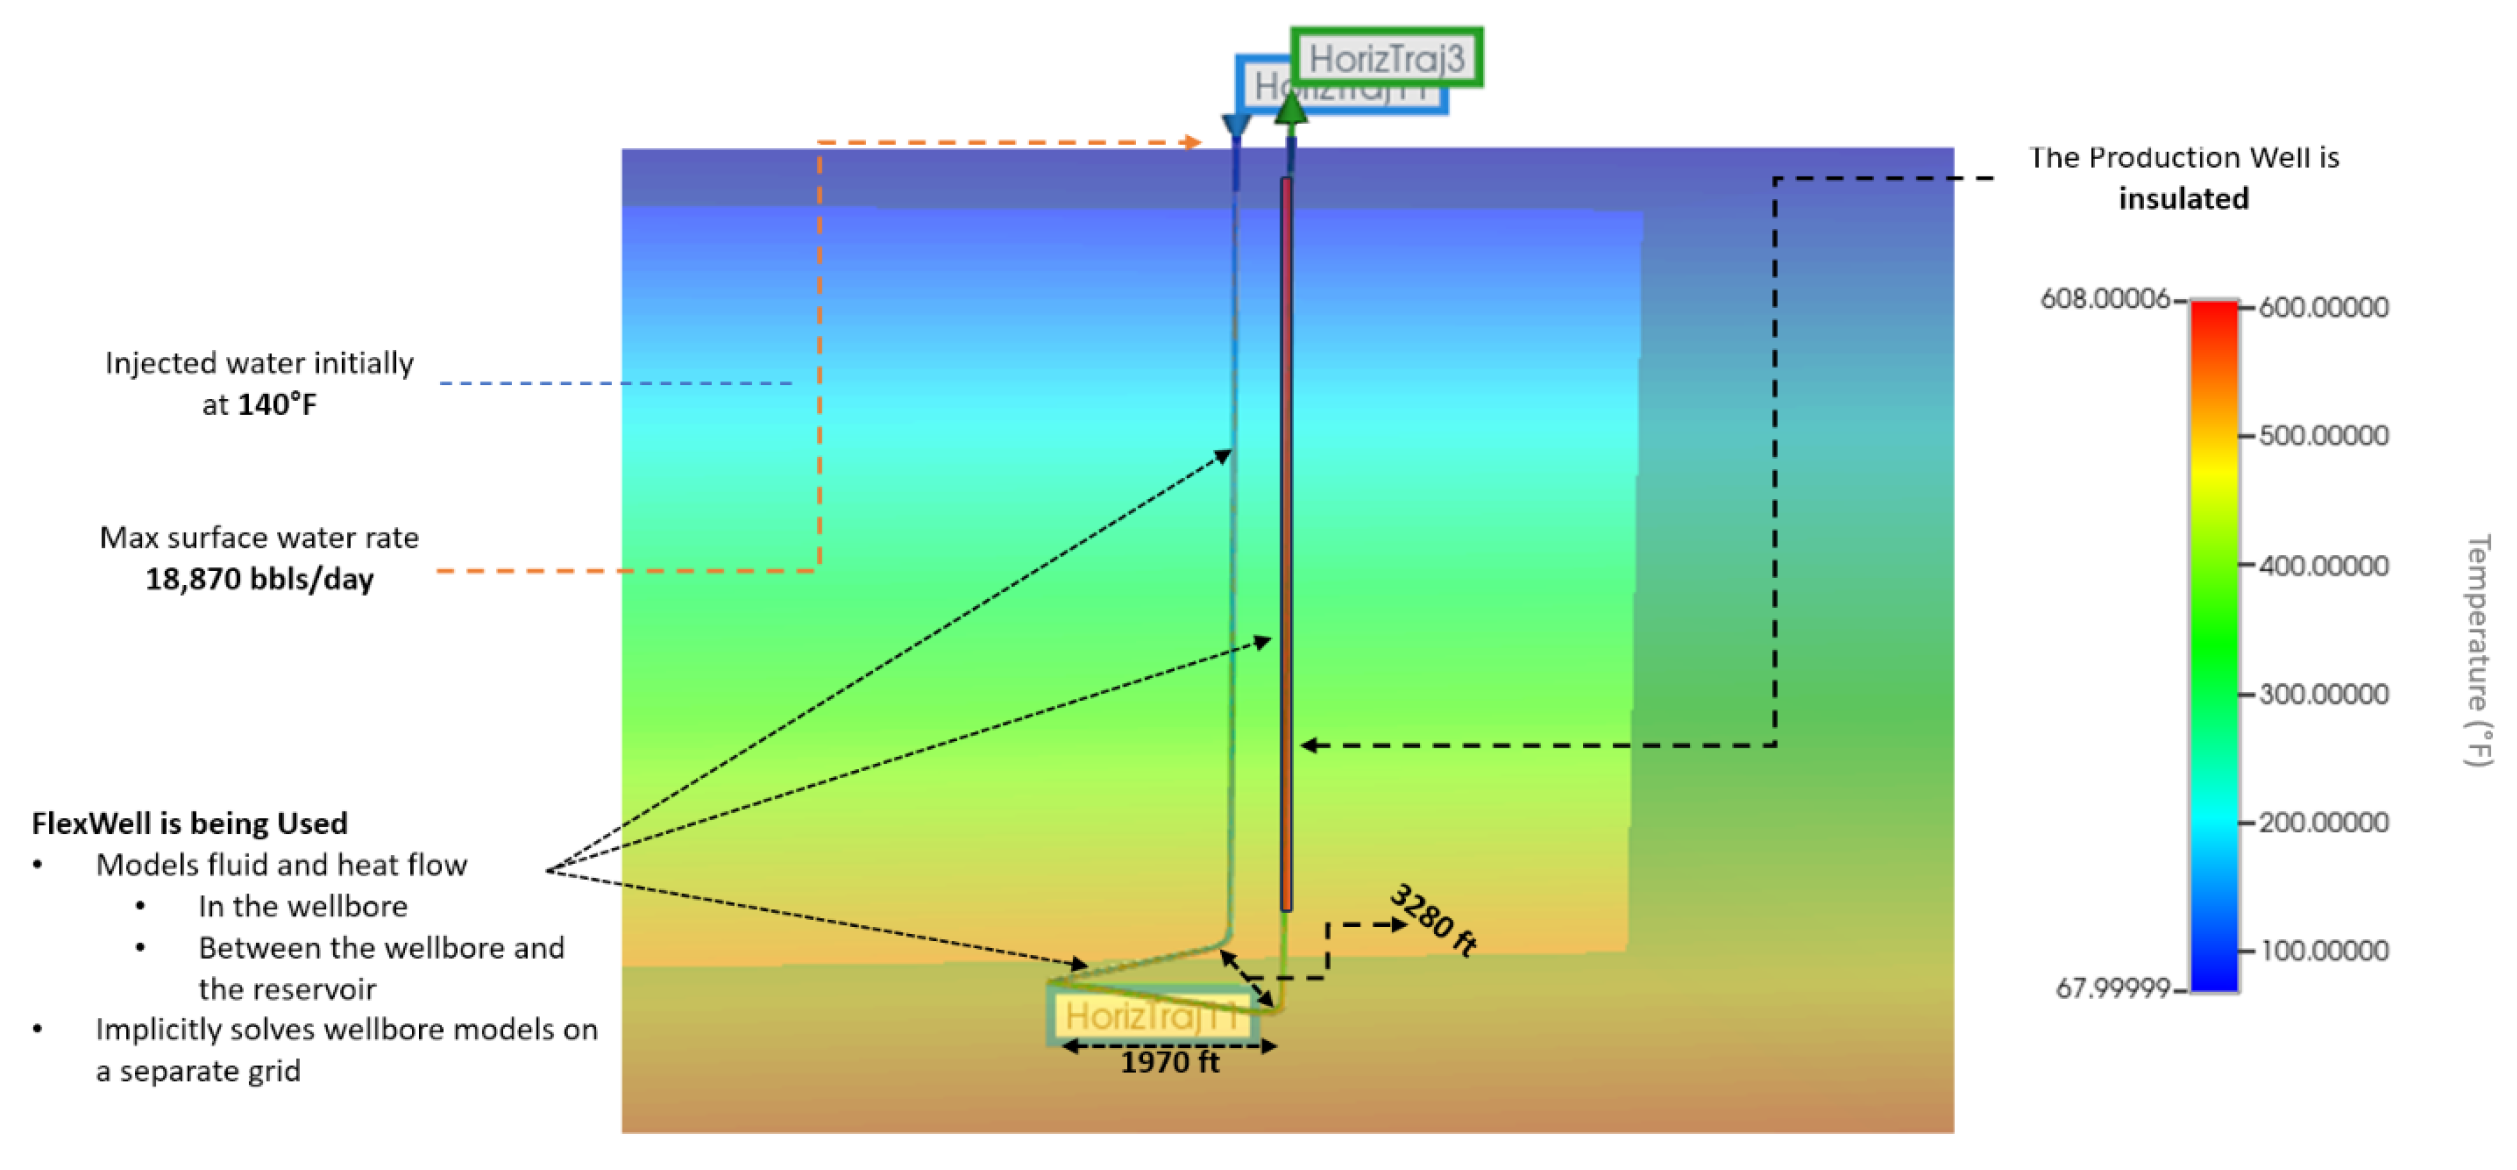
2.2.2. V-Shaped Closed-Loop System Model Description
The V-Shaped Closed-Loop System, also known as the U-Shaped Extended Horizontally (USEH) model, marks a significant advancement in geothermal well design. This system is specifically engineered to maximize the extraction of geothermal energy from the high-temperature zones of Hot Dry Rock (HDR) reservoirs by incorporating horizontal extensions at considerable depths (
Figure 5).
In the V-Shaped model, wells descend vertically to a depth of 6100 meters, reaching high-temperature regions ideal for energy extraction. At this depth, each well extends 600 meters horizontally, increasing the contact area between the heat transfer fluid and the geothermally heated rock, thereby enhancing heat absorption. This V-Shaped configuration underscores the strategic placement and operational control of wells to maximize geothermal energy extraction efficiency, significantly improving the system’s heat absorption capacity and energy output.
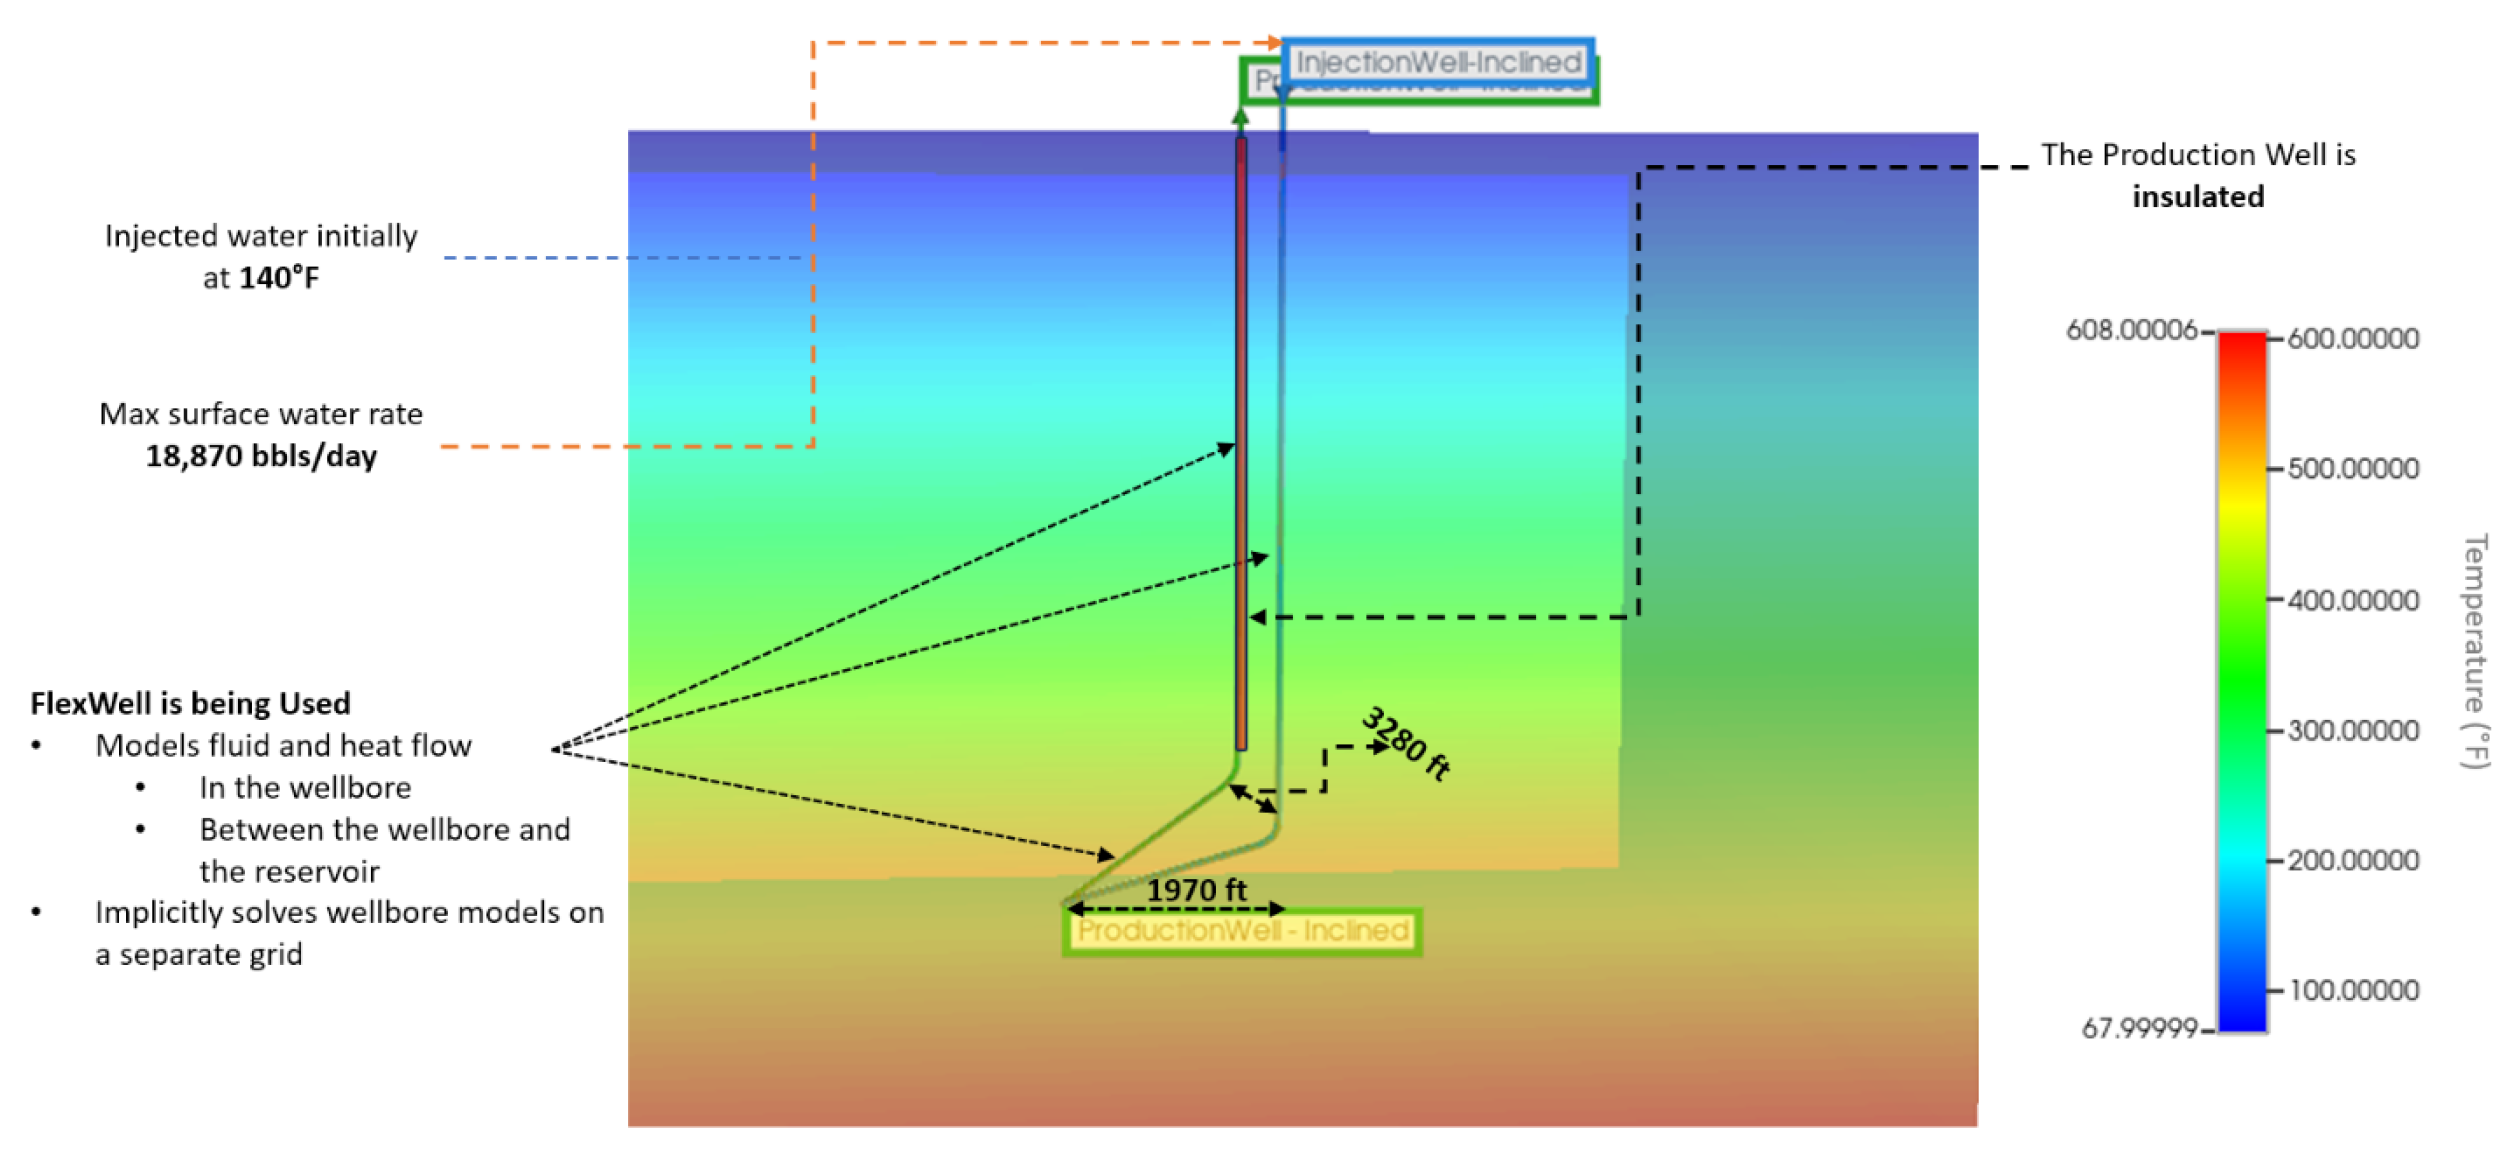
2.2.3. Inclined V-Shaped Closed-Loop System Model Description
The Inclined V-Shaped model is a refined geothermal well configuration designed to enhance heat extraction from Hot Dry Rock (HDR) reservoirs. This advanced model begins with two wells 1000 meters apart on the surface, descending vertically before diverging into an inclined 600-meter lateral section, reaching a depth of 6100 meters where reservoir temperatures are around 300°C (
Figure 6). This unique geometry increases the thermal contact surface area between the heat transfer fluid and the surrounding rock, boosting the system’s heat recovery capacity.
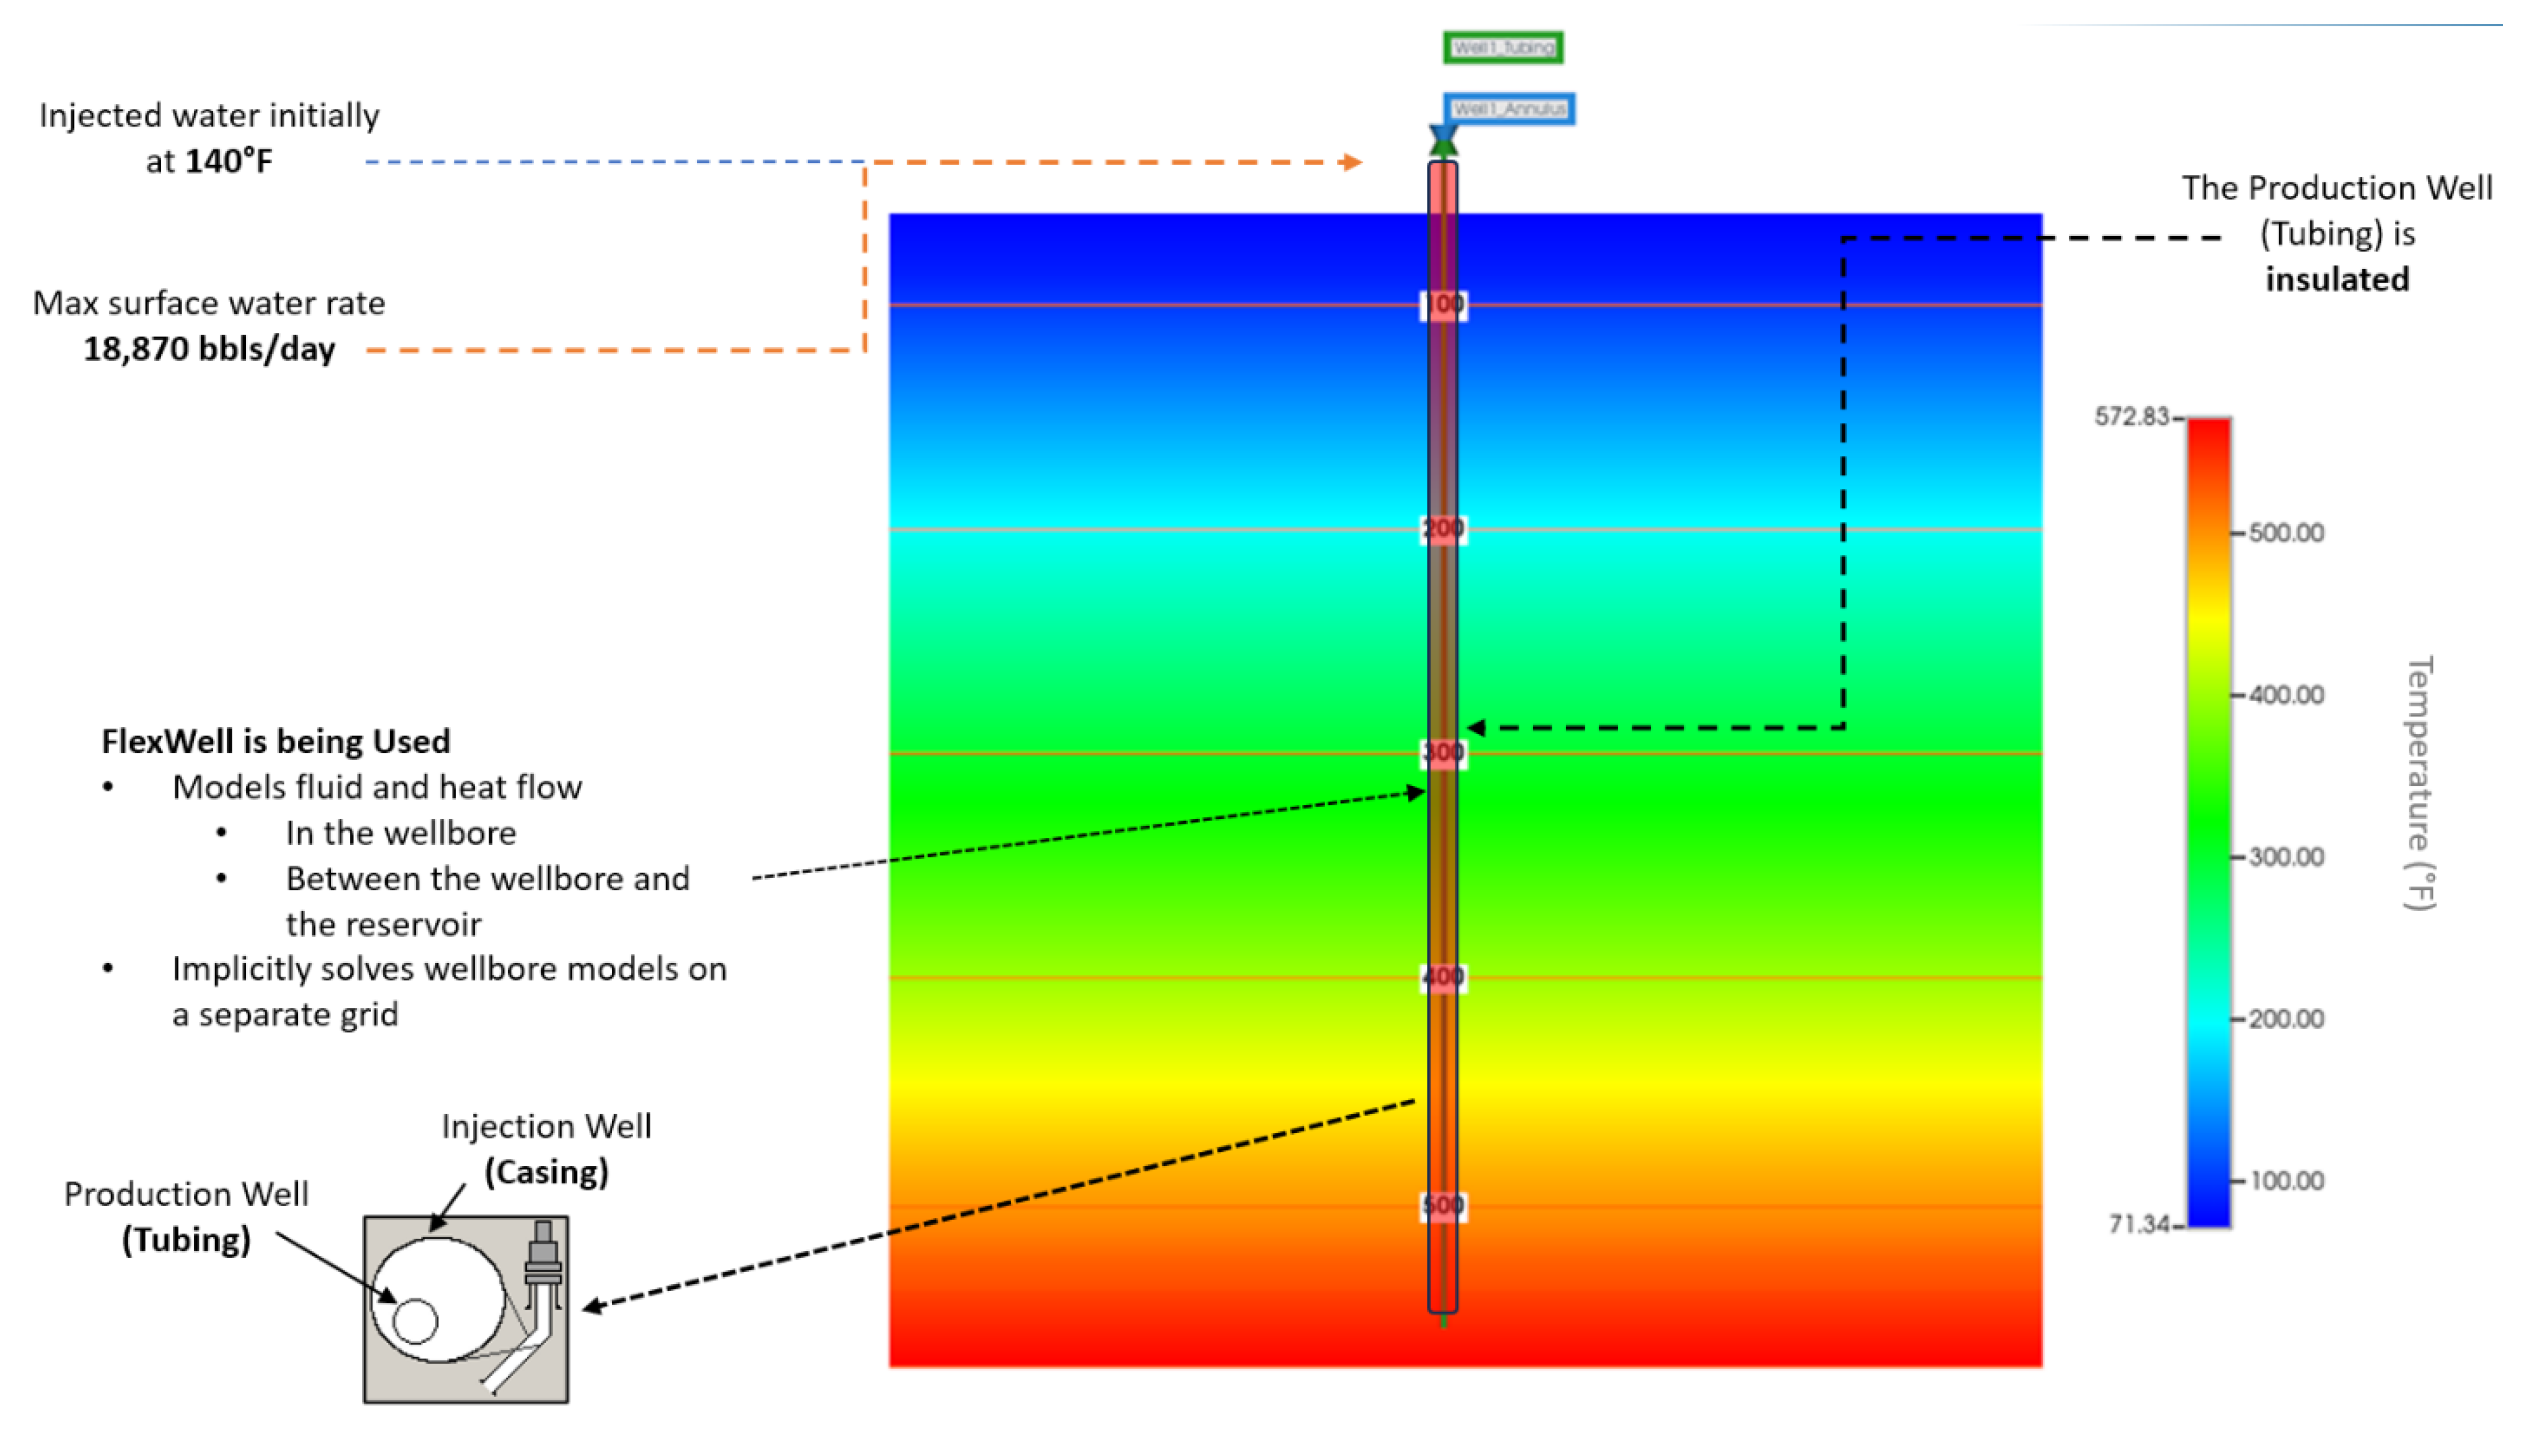
2.2.4. Pipe-In-Pipe Closed-Loop System Model Description
The Pipe-in-Pipe (PIP) CLGS consists of a dual-pipe configuration within a single borehole. The system features two primary wells: the “Casing” well as the outer section for injection and the inner “Tubing” well as the producer. Both wells handle a maximum surface water rate of 3000 m
3/day. The “Casing” well has a radius of 0.14 m, while the “Tubing” well has a narrower radius of 0.076 m, optimizing fluid dynamics. Freshwater is injected at 60°C with a steam quality of 0 and an operating pressure of 6875 kPa. The system includes the FlexWell model feature for dynamic simulation of the well interactions (
Figure 7).
Both wells are thermally insulated, with the “Casing” well having an inner diameter of 0.14 m and an outer diameter of 0.152 m, and the “Tubing” well an inner diameter of 0.076 m and an insulated outer diameter of 0.102 m. This setup ensures accurate representation of operational dynamics and thermal behavior, maximizing heat retention and optimizing heat exchange.
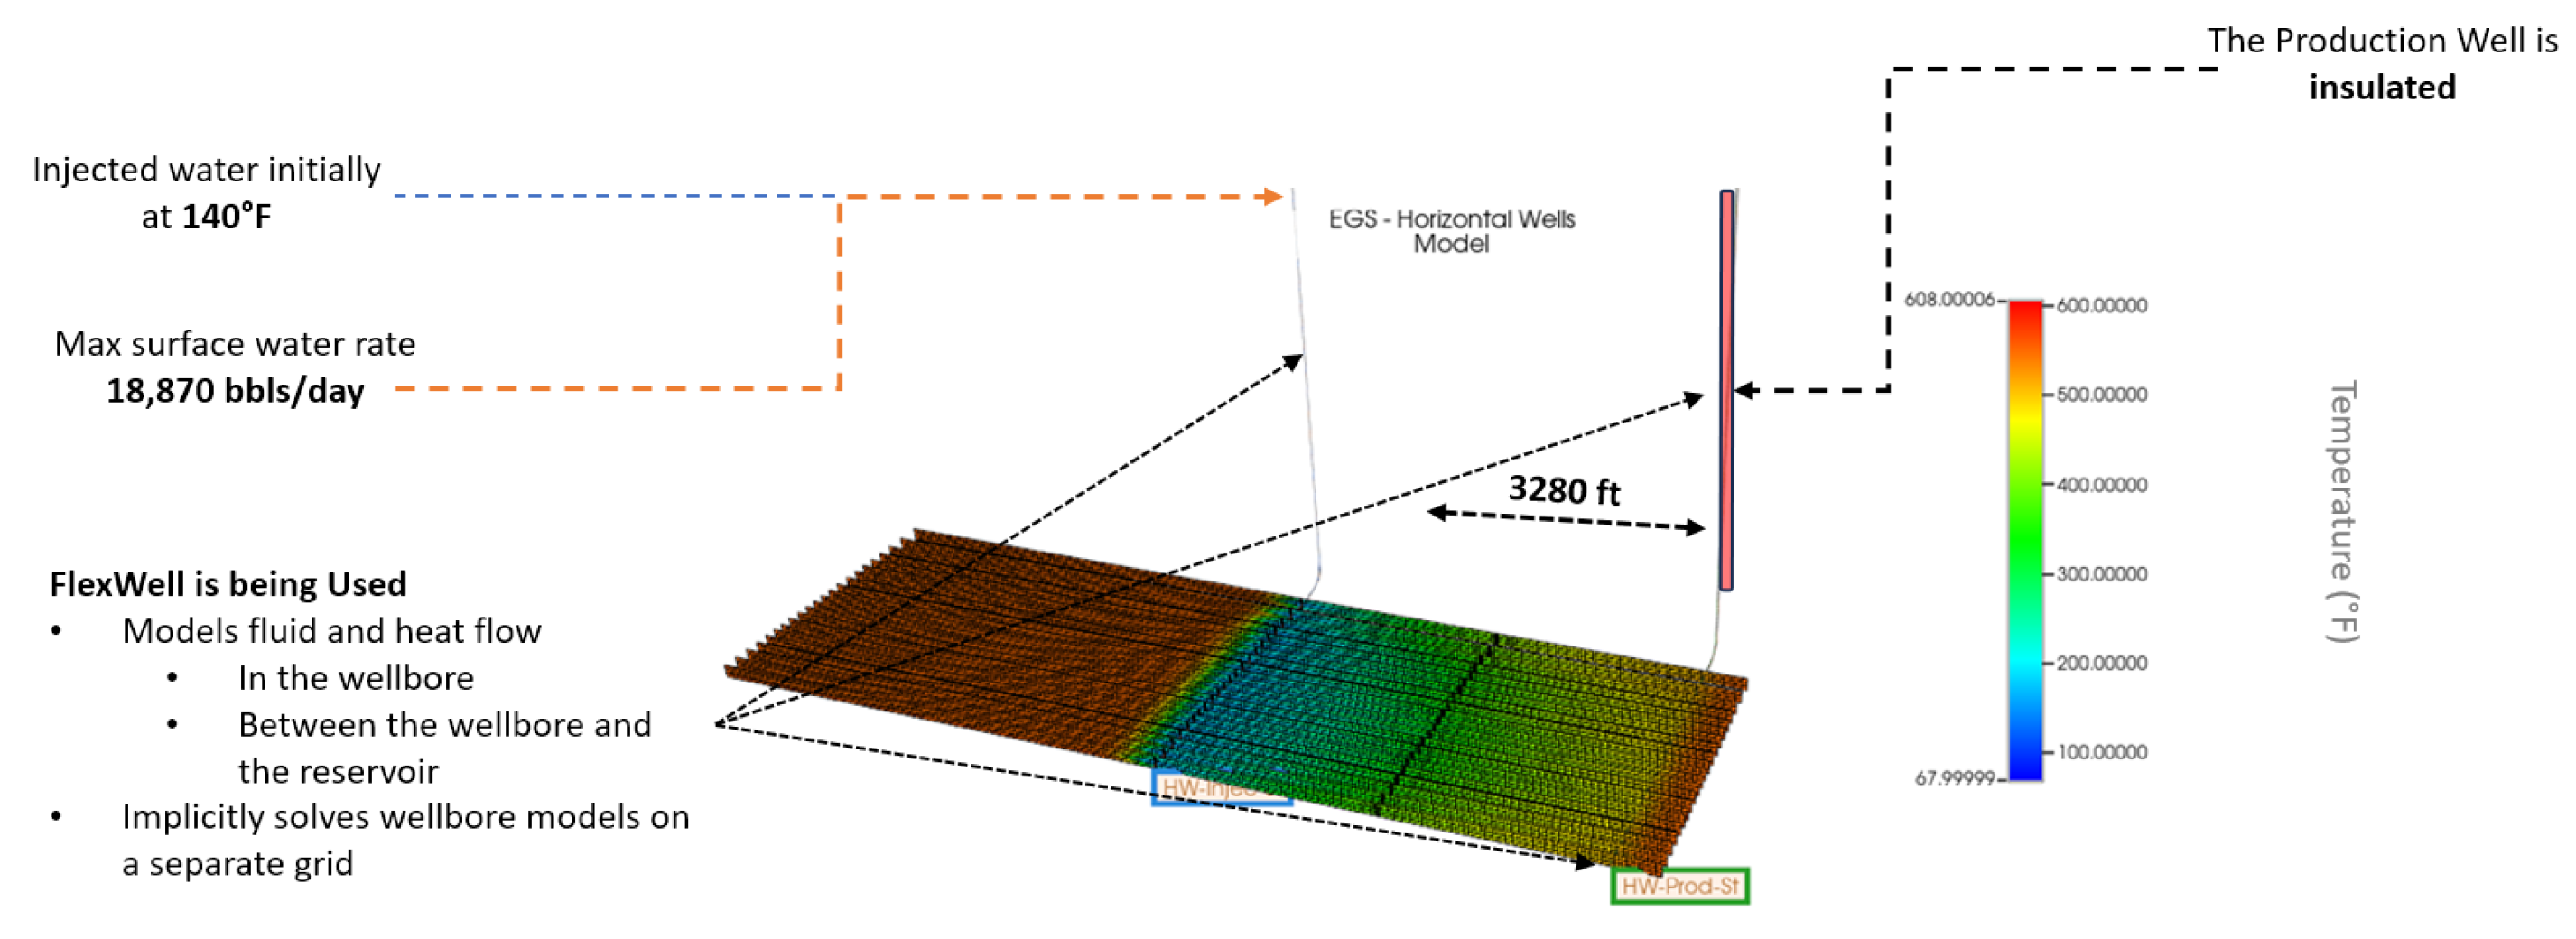
2.2.5. Enhanced Geothermal System (EGS) Model Description
The Enhanced Geothermal System (EGS) model employs a progressive approach to maximize heat extraction in geothermal energy systems. This model uses engineered hydraulic fractures to increase reservoir permeability and establish extensive heat transfer pathways.
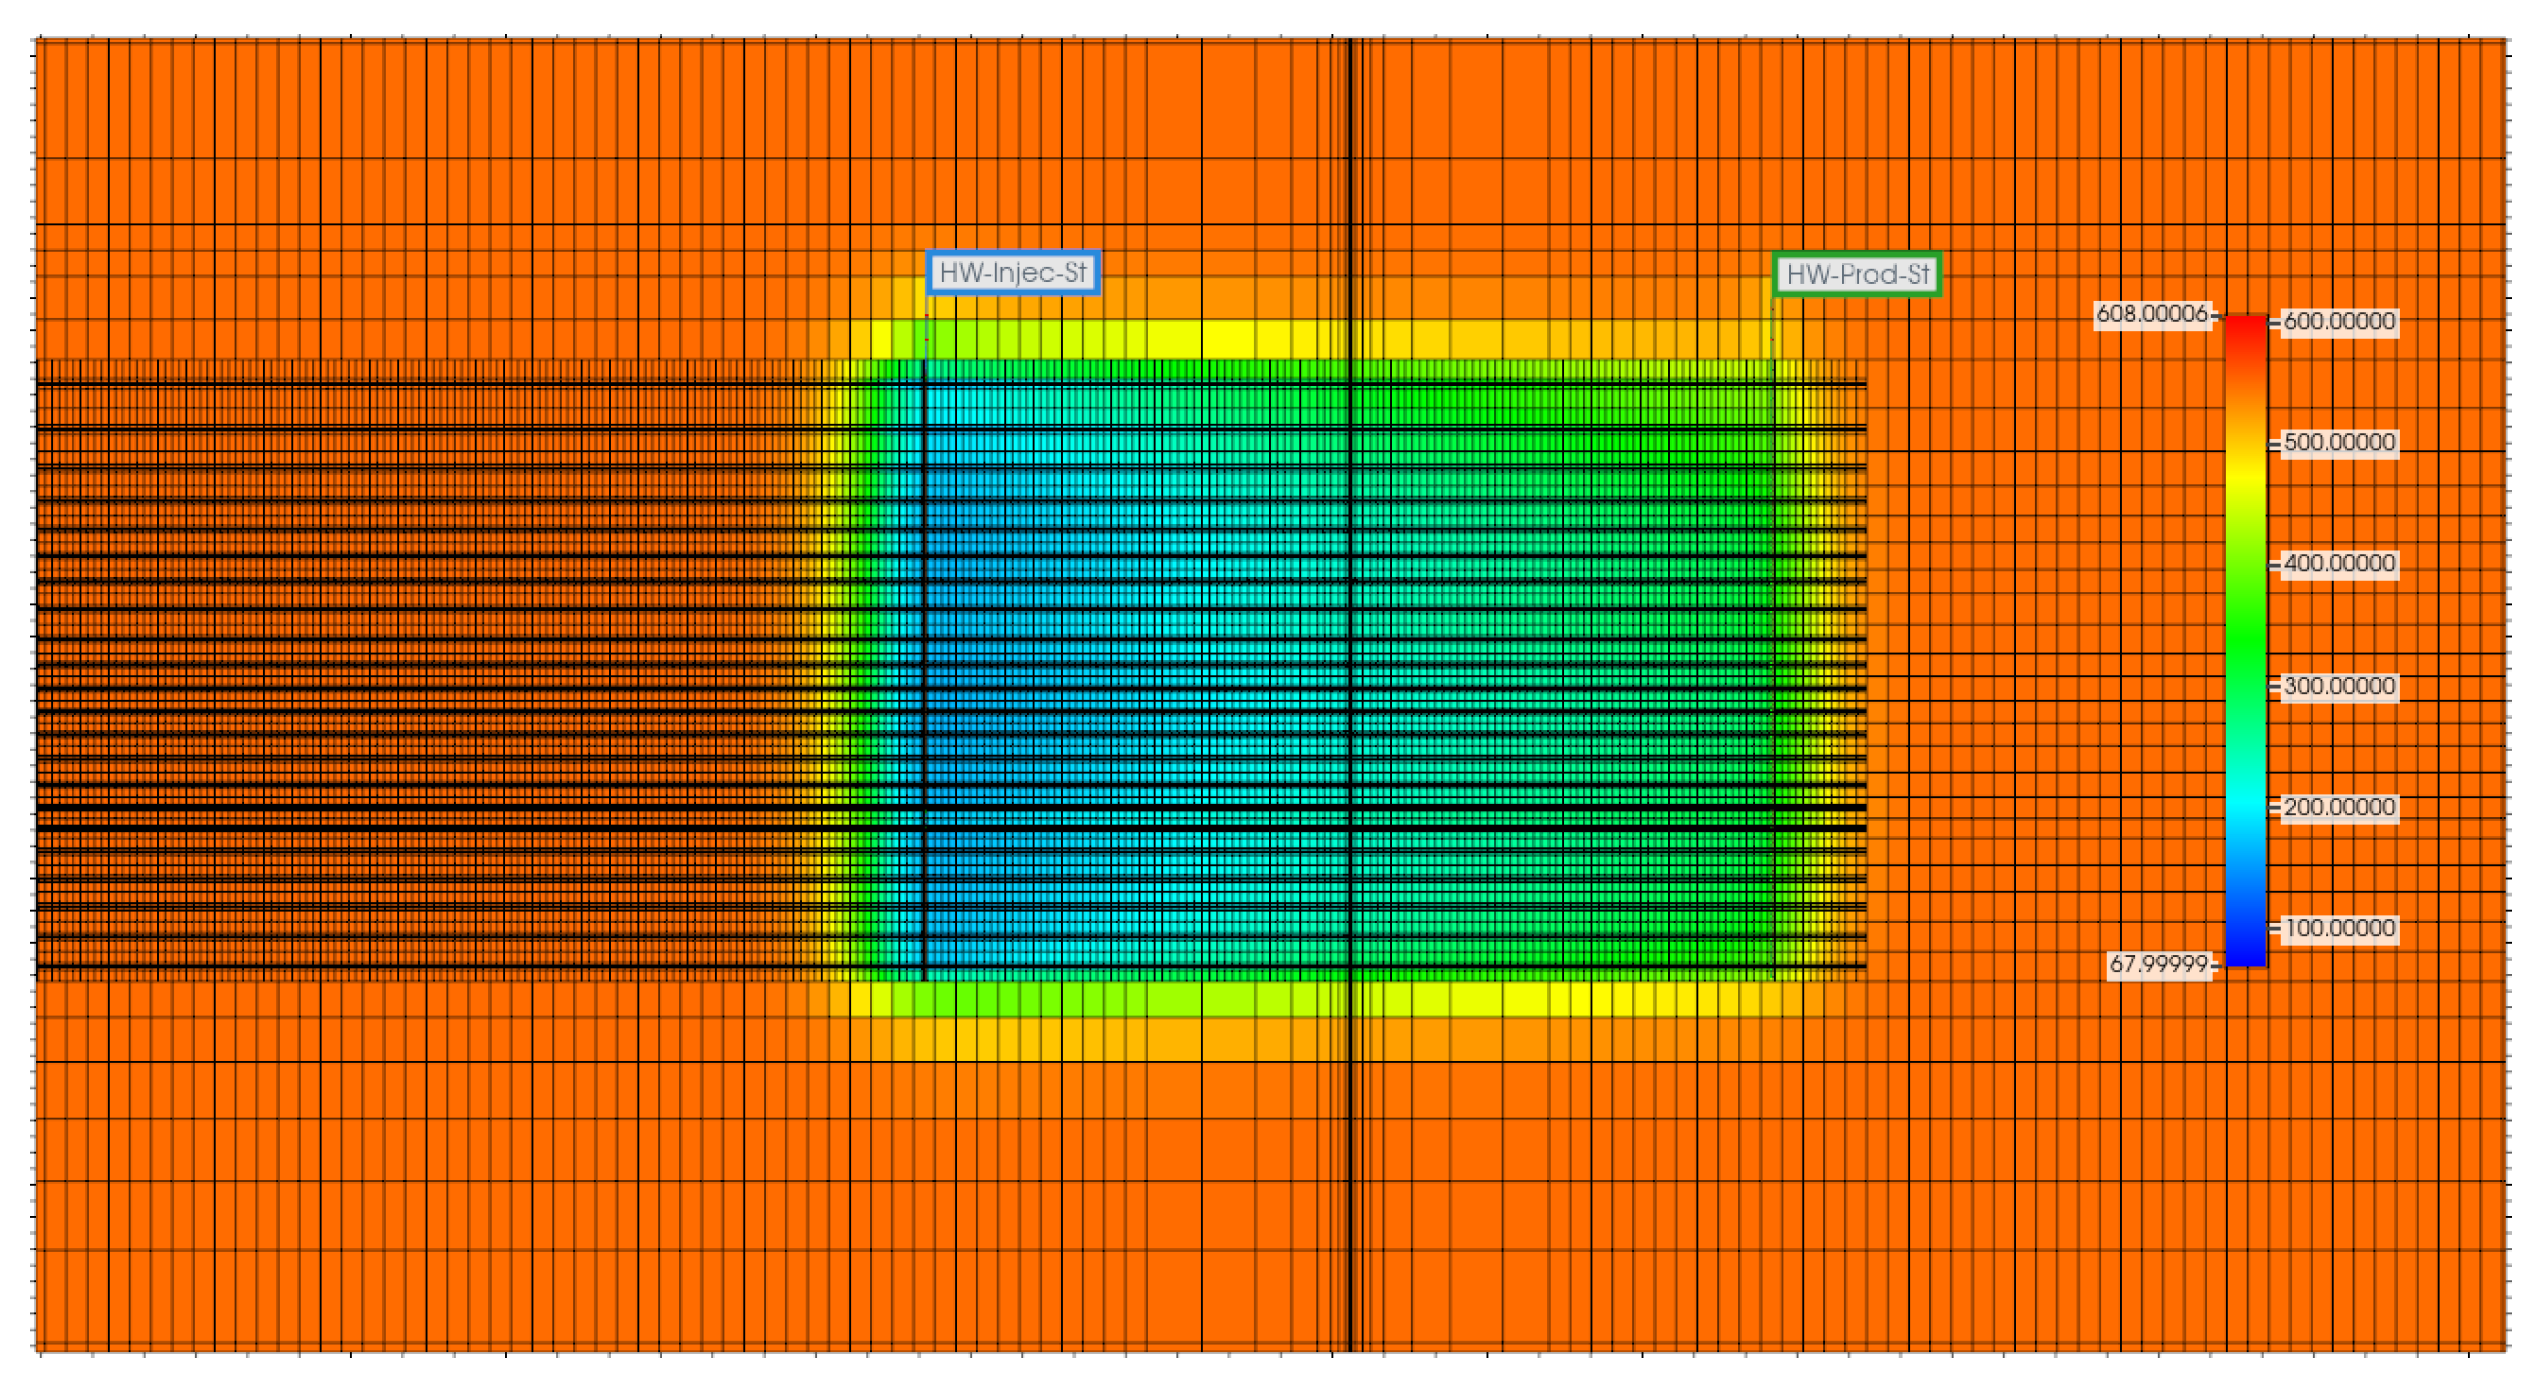
The injector well, the primary fluid entry point, is designed to inject water at a specific rate and temperature to maximize heat absorption. It starts from UBA (47, 12, 1) and extends horizontally to UBA (47, 36, 77), with a maximum surface water rate of 3000 m³/day and a well radius of 0.14 m. The producer well, starting from UBA (87, 12, 1) to UBA (87, 36, 77), parallels the injector to efficiently transport the heated fluid to the surface, following similar operational parameters (
Figure 8).
The system uses freshwater at 60°C, a steam quality of 0, and a pressure of 6875 kPa, ensuring effective heat absorption and compatibility with EGS demands. Initial setup includes defining perforation intervals for both the injector and producer wells to optimize fluid flow and heat exchange, ensuring precise modeling and effective heat retrieval. This integration enhances simulation fidelity and highlights the EGS model’s potential to significantly improve the efficiency and output of geothermal energy systems.
2.2.6. Enhanced Geothermal System (EGS) Inclined Model Description
The Inclined Enhanced Geothermal Open Loop model offers a strategic adaptation within enhanced geothermal systems, employing an inclined configuration to address technical drilling challenges in deep-seated geothermal resource areas. This approach is particularly beneficial in regions where vertical drilling is impractical due to complex geological structures or obstructions.
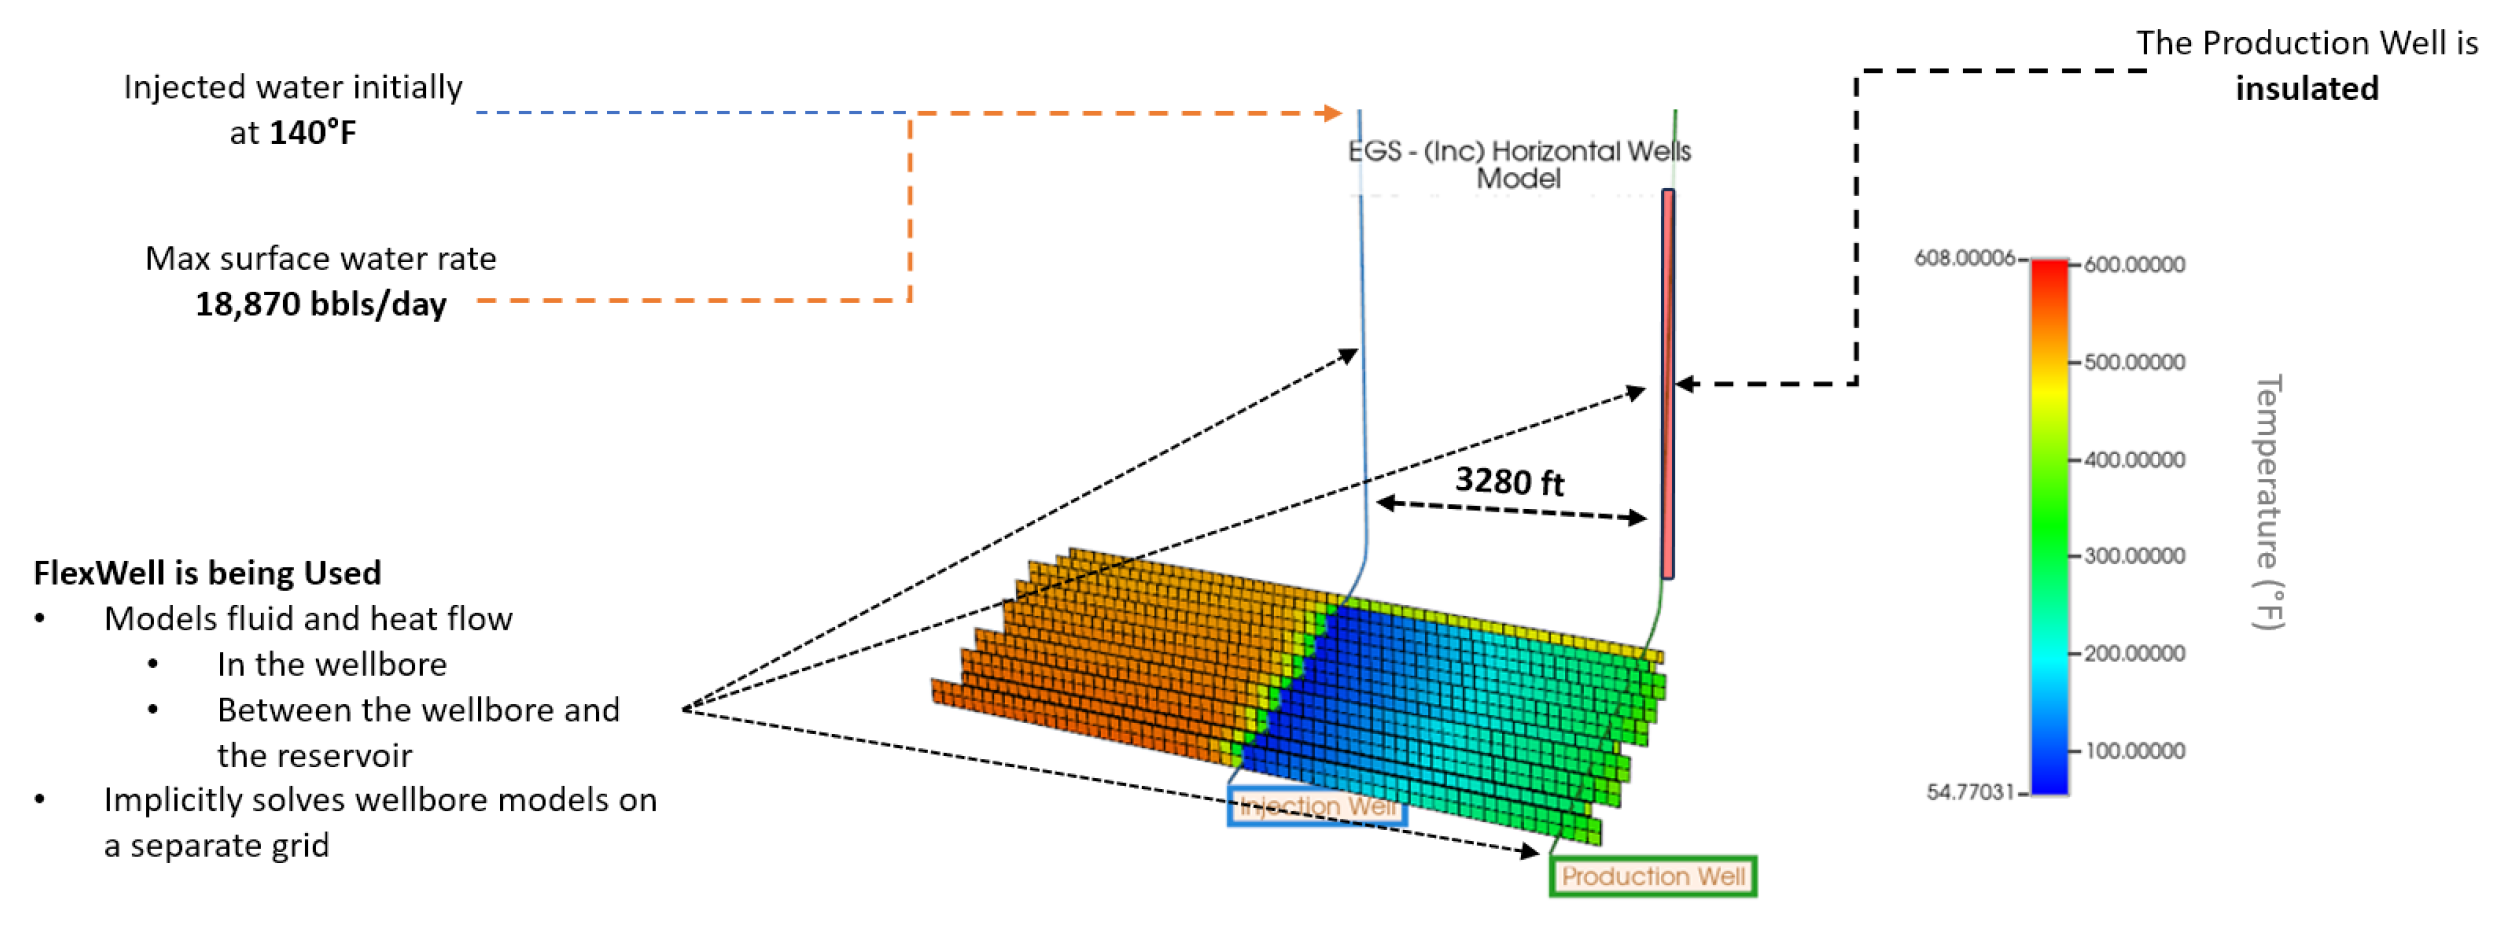
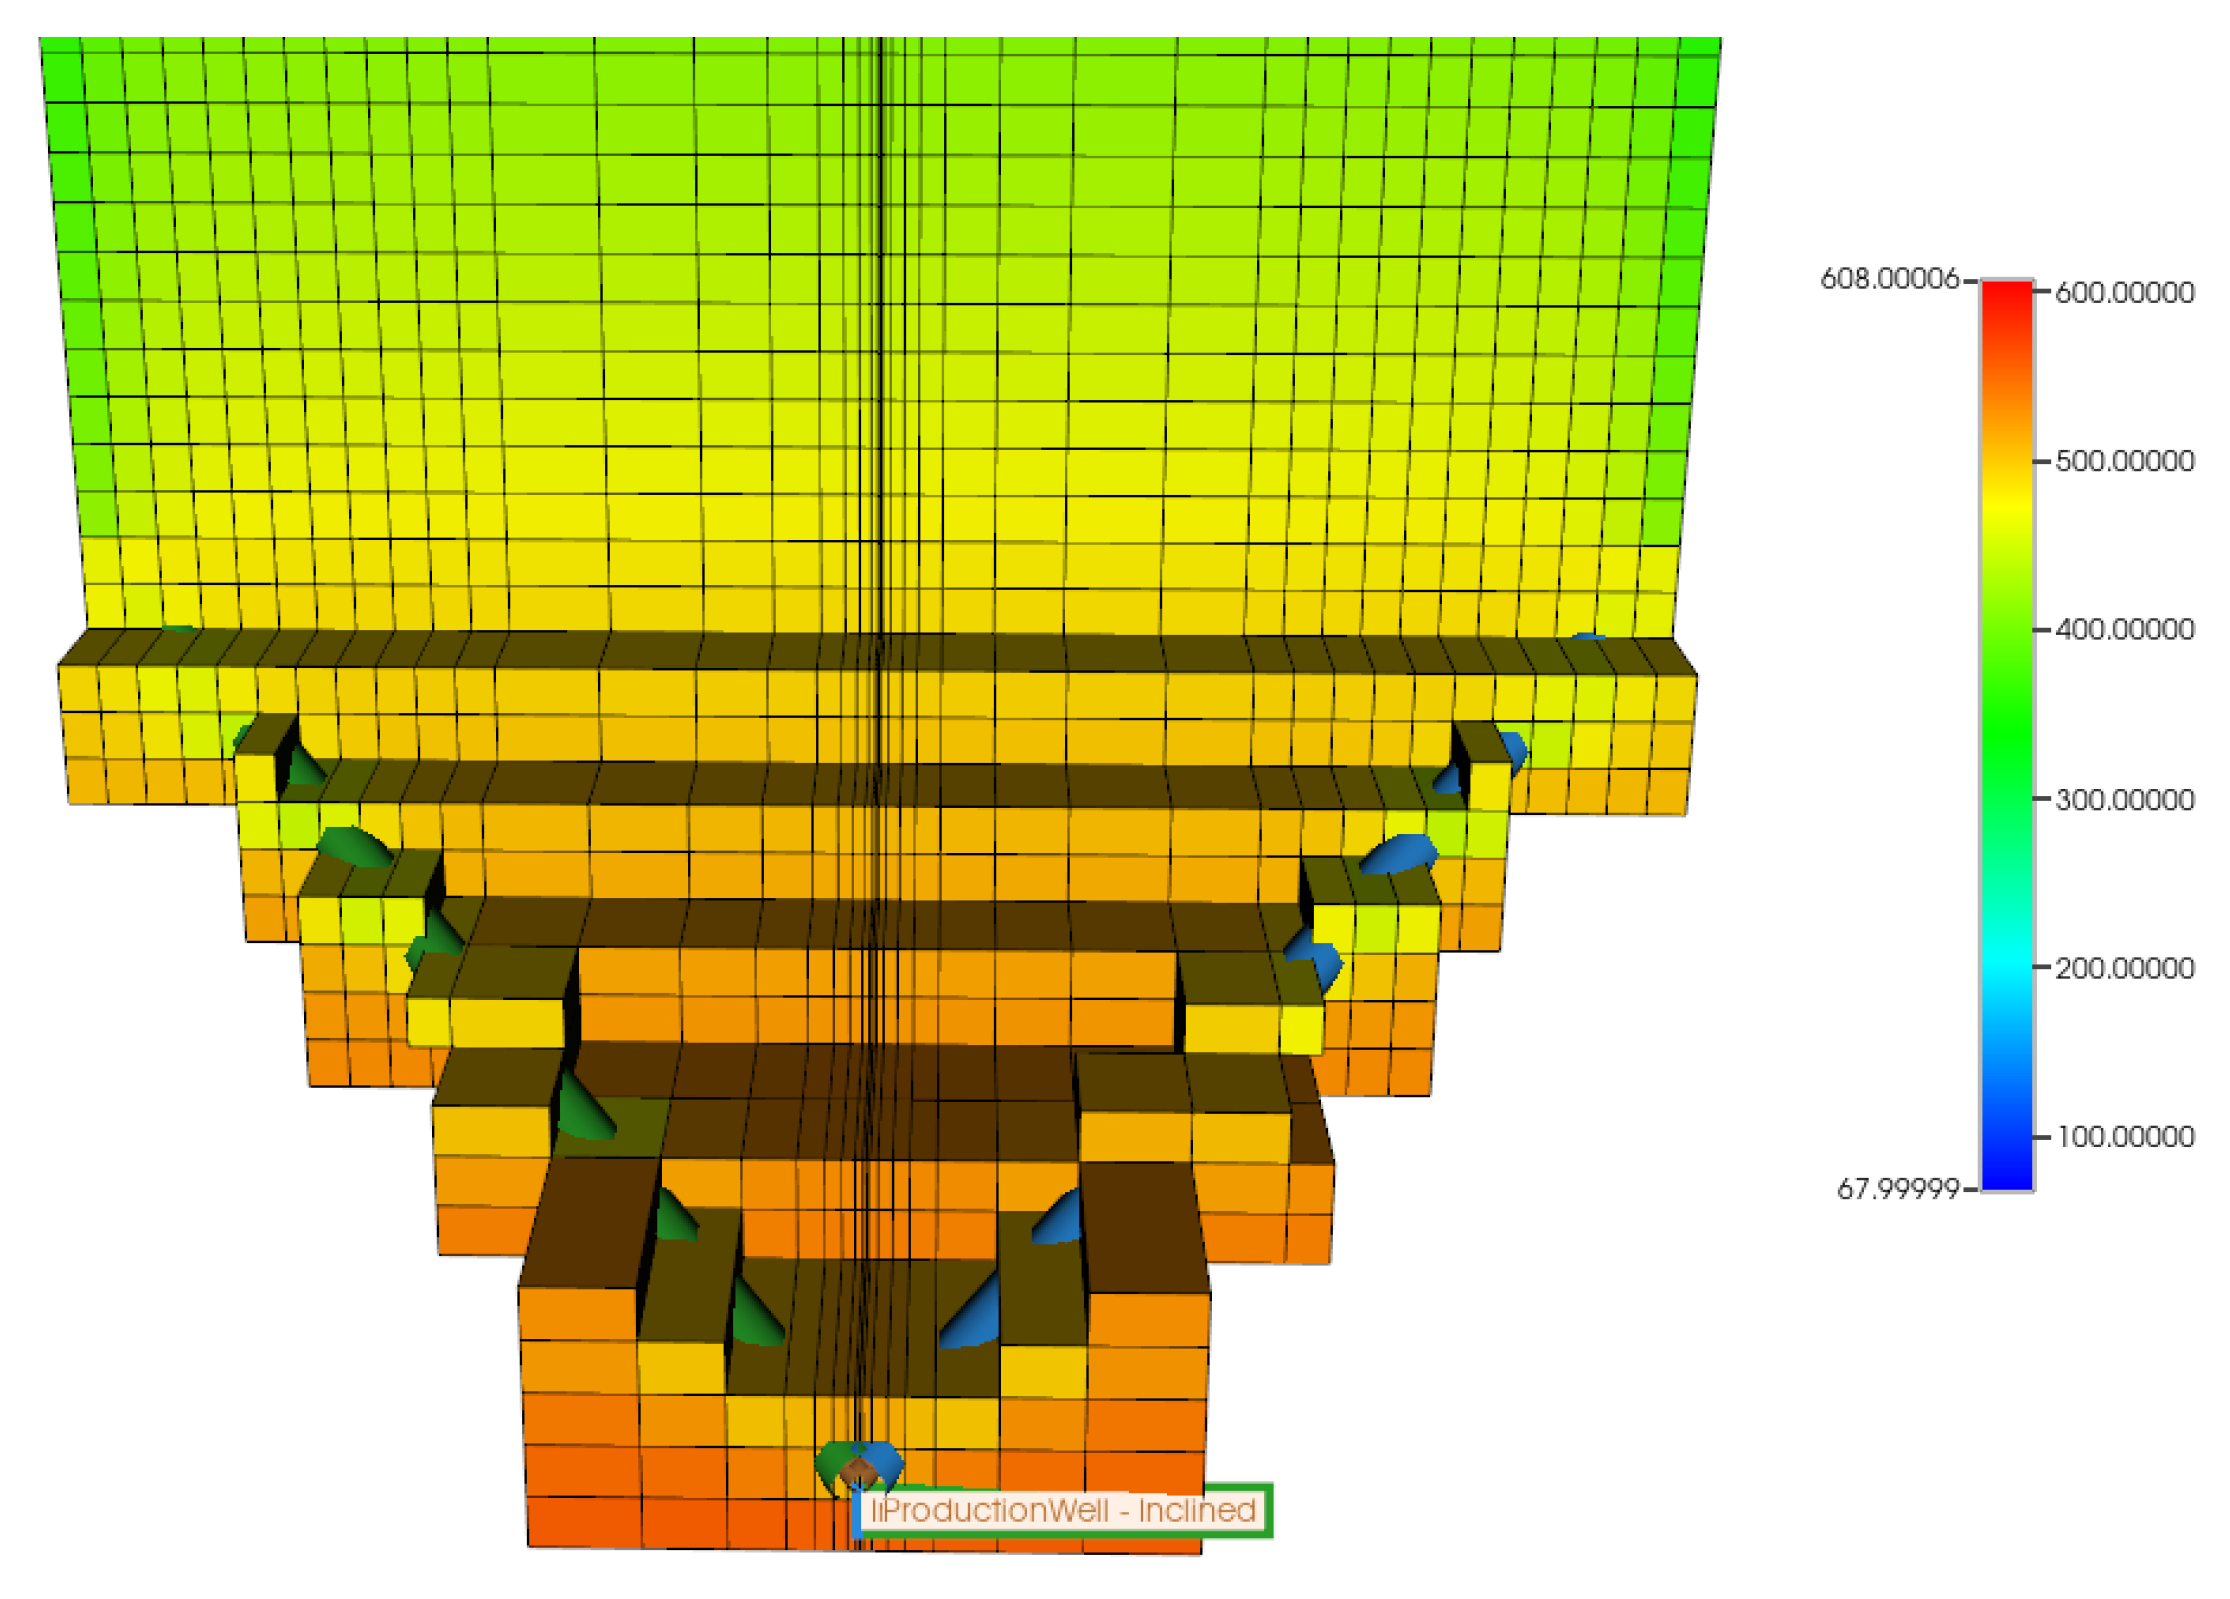
In the EGS - Inc model, wells reach a true vertical depth of 6100 meters, accessing a high-temperature zone. Beyond this depth, the wells extend horizontally for 1000 meters at the bottom of the geothermal gradient, traversing the hottest parts of the HDR formation to maximize thermal interaction and energy transfer (
Figure 9).
3. Results
Our simulation models are built on a robust foundation, integrating key parameters and insights from seminal research within the geothermal energy domain. We have adopted critical thermal parameters such as rock and cement thermal conductivities and specific heat capacities from the work of Frash, et al. [
18], essential for modeling the thermal dynamics between geothermal fluids and reservoir formations. This integration aids in optimizing our models for advanced and enhanced geothermal systems.
Additional foundational data from Won et al. [
19] on the thermal and mechanical properties of casing materials inform our simulations, enhancing the accuracy of our models in predicting the thermal and mechanical stability of geothermal wells.
Our models also draw from Norbeck and Latimer [
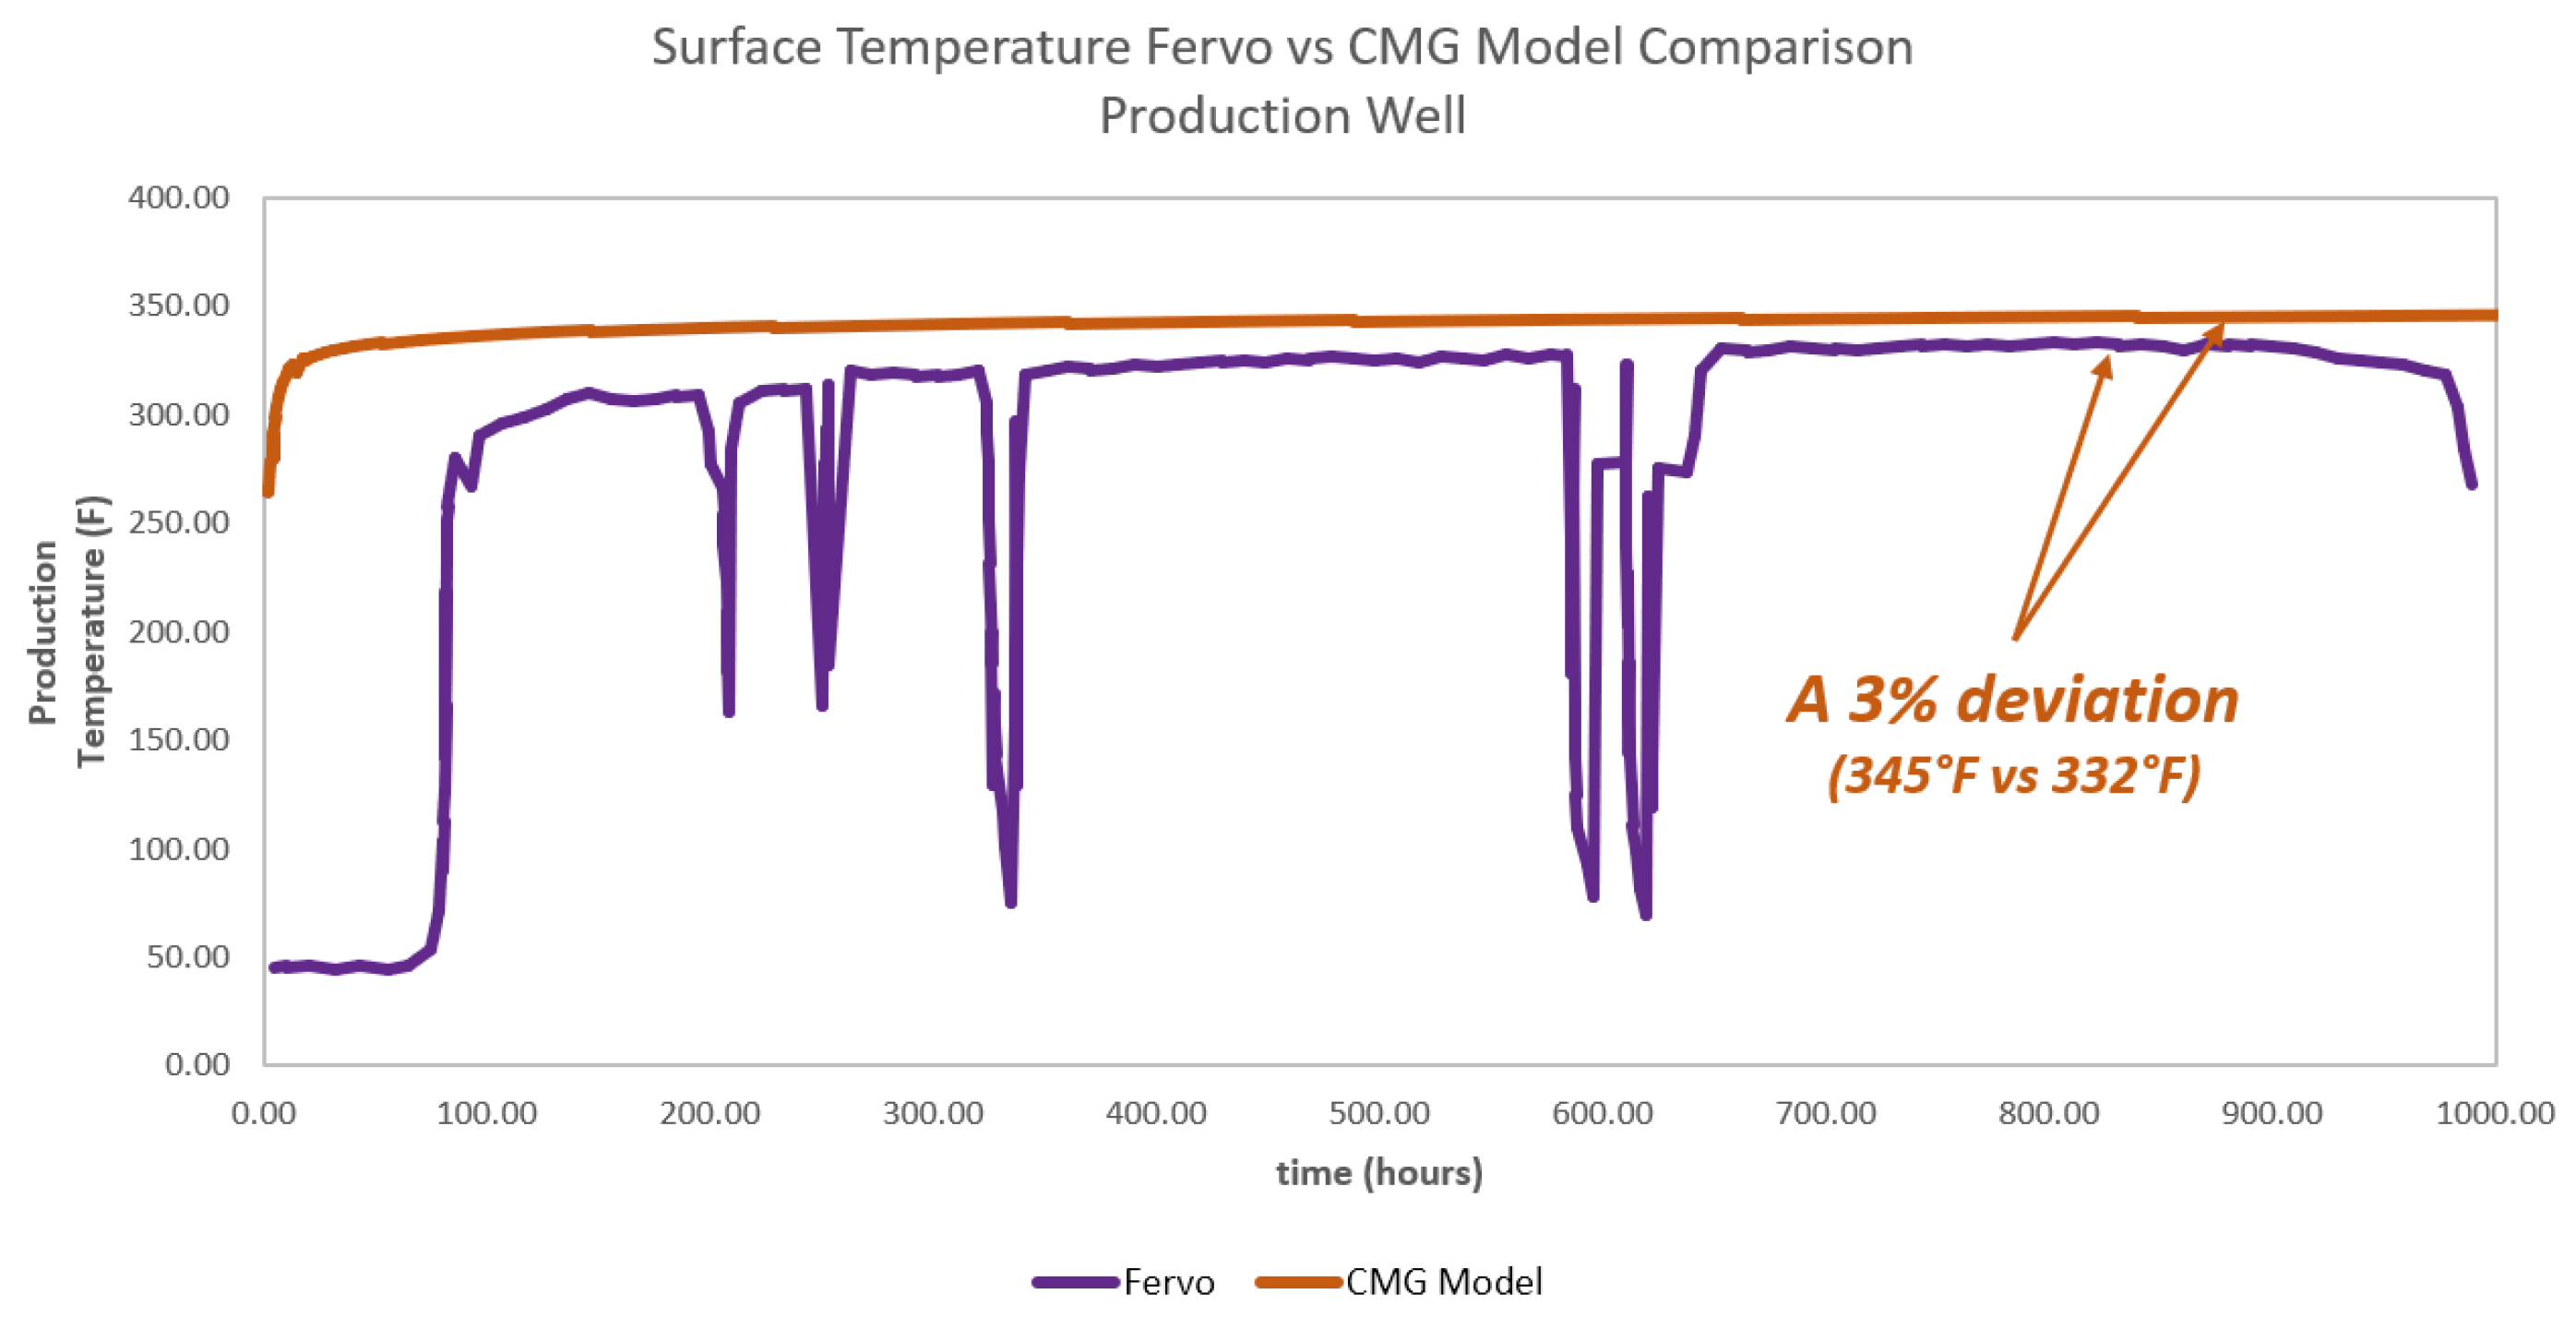
20], who provided a commercial-scale demonstration of enhanced geothermal systems (EGS). Their real-case scenario serves as a benchmark for the verification of the reservoir simulation model built in this study. When comparing the field demonstration data with the simulation results, a 3% deviation in the production well temperature was compared, which is considered a good estimate (
Figure 10).
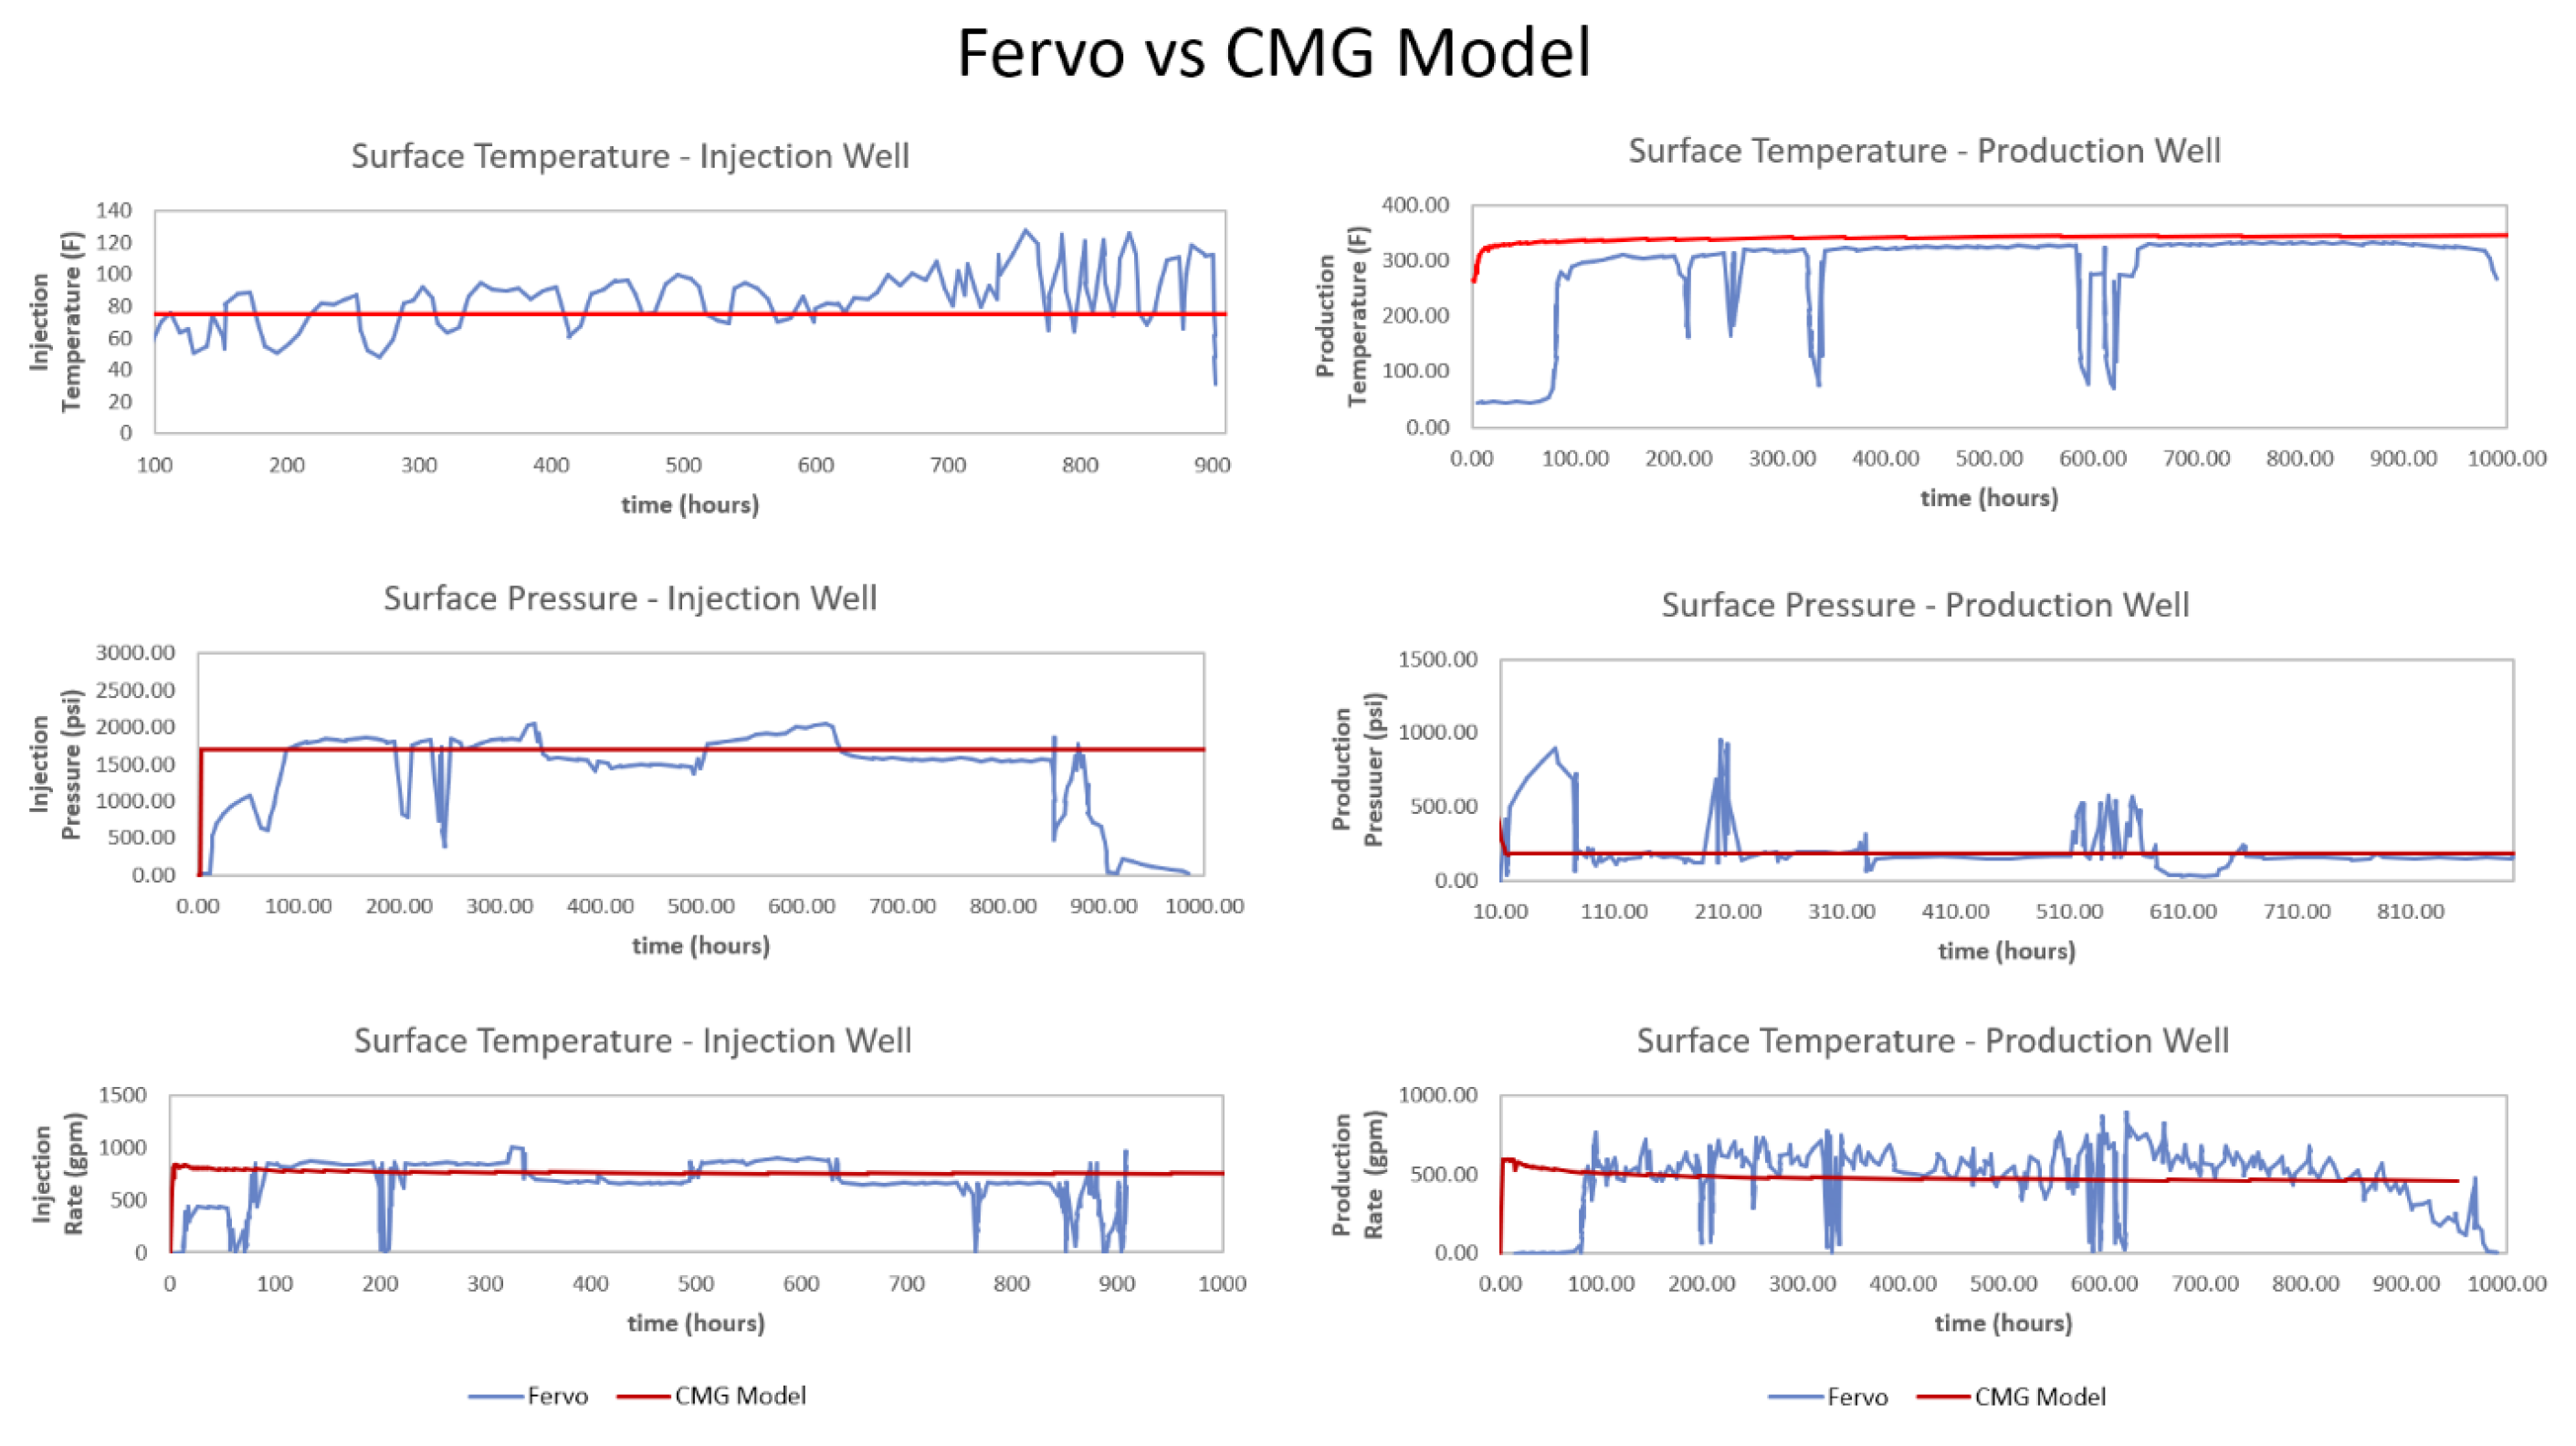
This validation extends to temperature, pressure, and flow rate comparisons, confirming the calibration of the reservoir simulation model (
Figure 11).
The following subsections present an analysis of the simulation results obtained from studying various geothermal well configurations over a period of 80 years.
3.1. Long-Term Performance Analysis of U-Shaped Geothermal Well Models
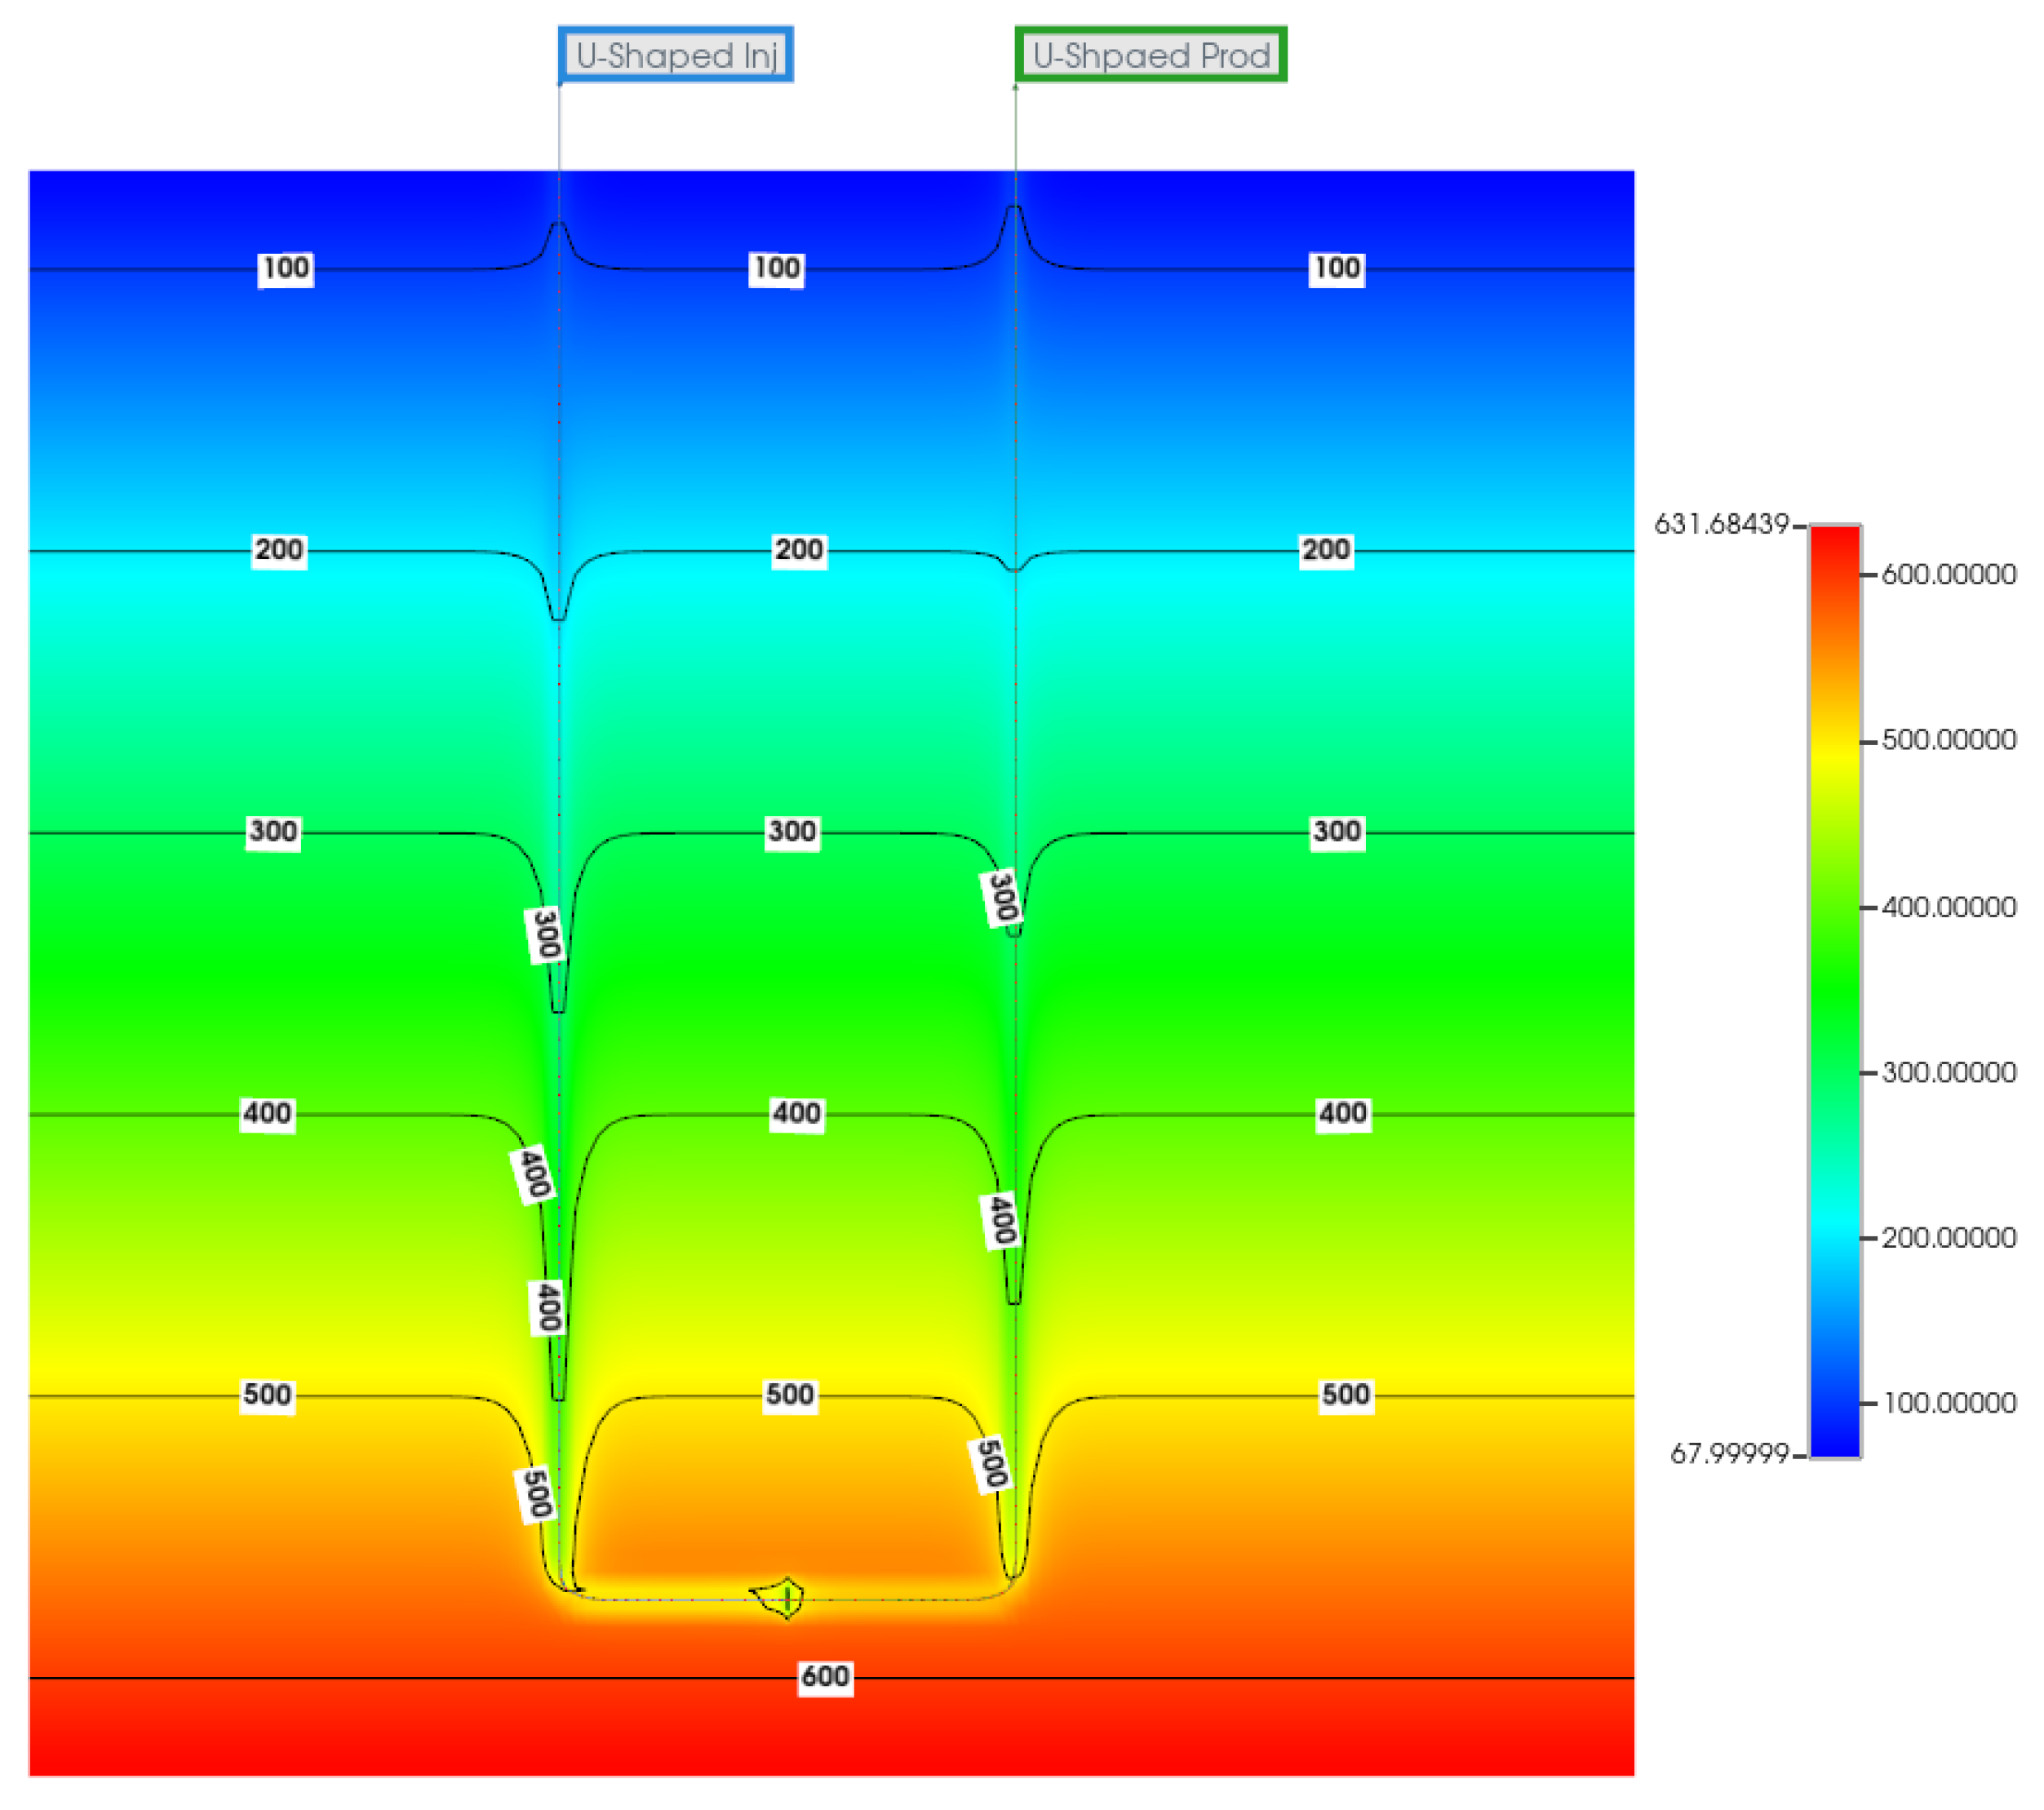
The U-Shaped Closed Loop Wells model has shown notable efficiency in extracting heat from deep sections of the Wattenberg formation reservoir, particularly at 6100 meters where temperatures reach up to 300 °C. The lateral well, connecting the injection and production wells, significantly enhances heat absorption from this deep and hot part of the formation, boosting the model’s efficiency (
Figure 12).
Figure 12.
U-Shaped closed loop wells reservoir temperature distribution after 80 years.
Figure 12.
U-Shaped closed loop wells reservoir temperature distribution after 80 years.
Figure 13.
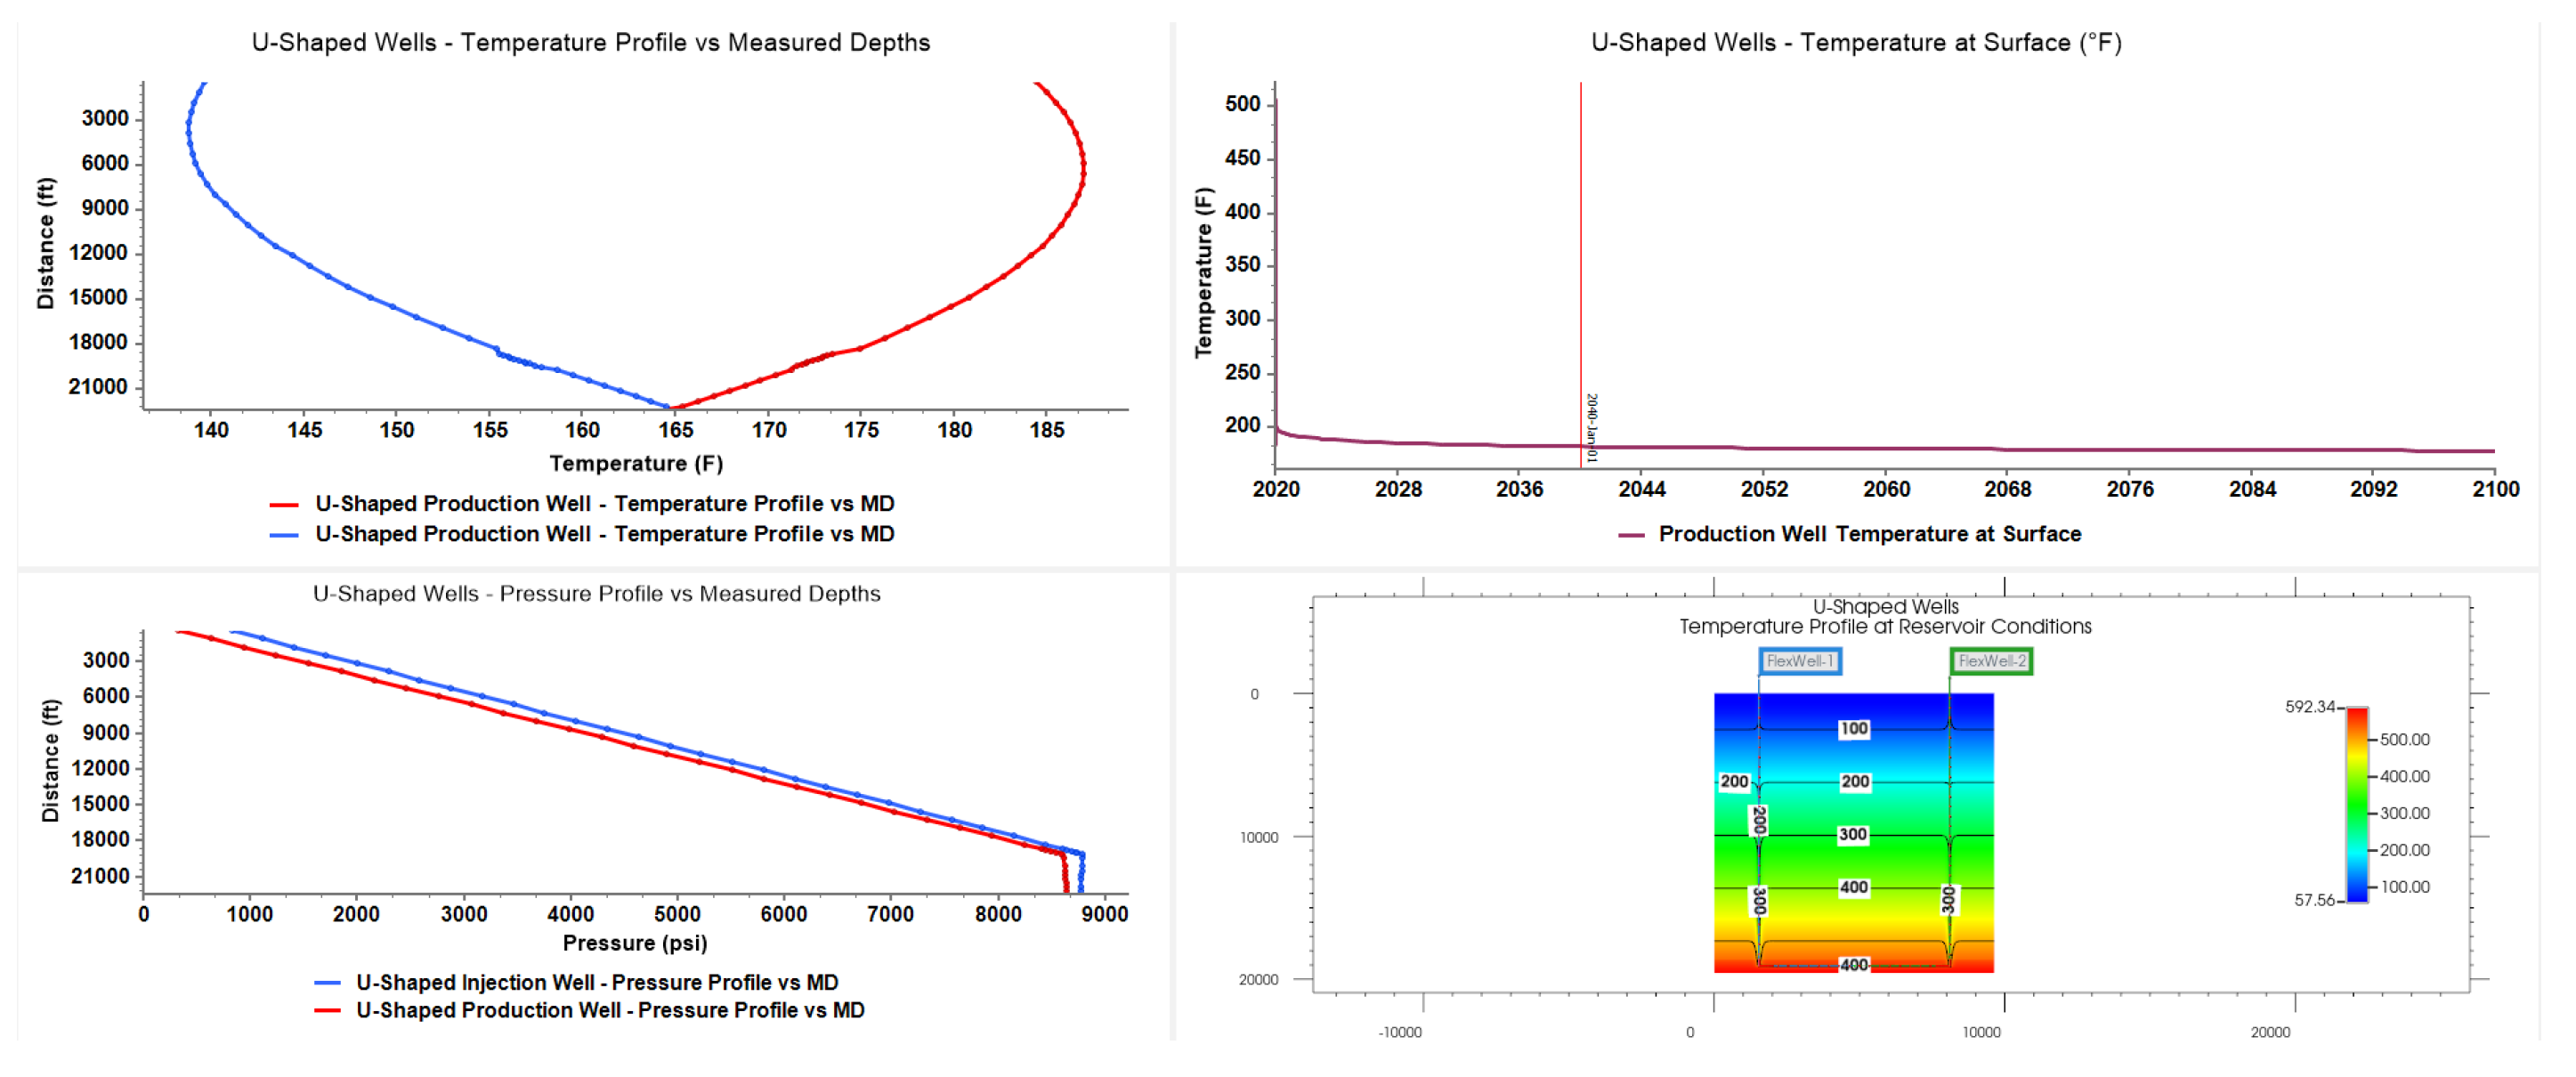
Thermal and pressure dynamics in U-Shaped well systems: profiles and projections.
Figure 13.
Thermal and pressure dynamics in U-Shaped well systems: profiles and projections.
After 20 years, the model recorded a final operational temperature of 182 °F, compared to the injected fluid’s temperature of 140 °F, illustrating effective heat gain. Temperature profiles indicate that while there’s a slight temperature decrease near the surface due to cooler surrounding rock, temperatures increase with depth, aligning with the geothermal gradient. This effect underscores the model’s complex thermal dynamics and efficient heat transfer, primarily through direct fluid-rock contact. Both injection and production wells show uniform bottom-hole temperatures, indicating the connection of the wells at the target depth. Notably, water, the sole working fluid in this model, remains in the liquid phase under operational conditions. Overall, the U-Shaped model combines effective heat extraction with simplicity of design and operational feasibility, maintaining high temperatures over extended periods and ensuring stable temperature and pressure profiles. This reliability positions it as a promising option for sustained geothermal energy extraction and broader application in geothermal projects (
Figure 14 and
Figure 15).
3.2. Long-Term Performance Analysis of U-Shaped Geothermal Fractured Well Models
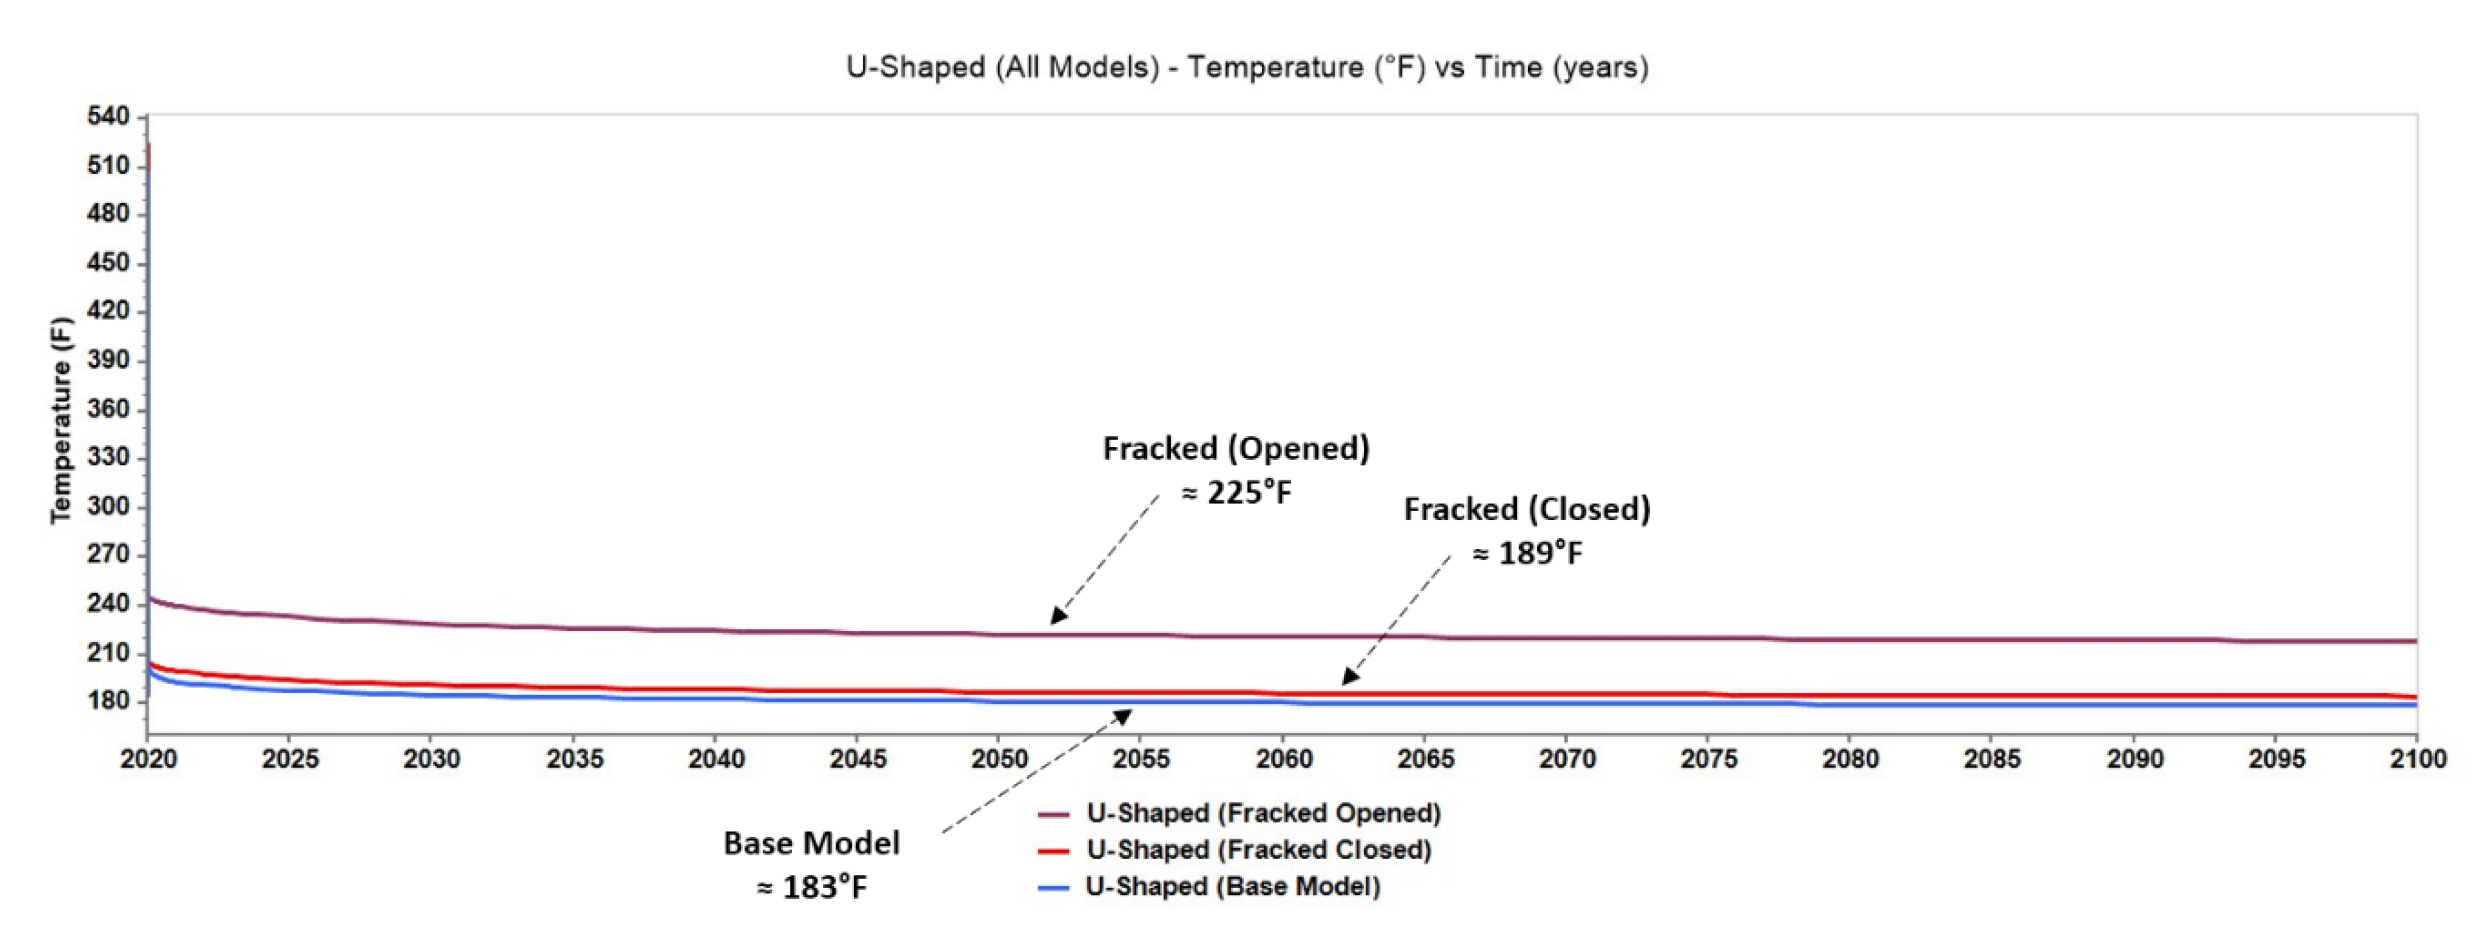
This section evaluates the impact of introducing highly conductive materials into the reservoir to simulate enhanced thermal conductivity. By increasing the thermal conductivity of reservoir water from 53,500 J/(m·day·°C) to 6.48e+06 J/(m·day·°C), akin to integrating a material like copper, the model mimics the thermal effects of such additions, potentially via hydraulic fracturing. The wells are isolated from the reservoir rock by closing the well perforations, preventing any exchange between the injected water and the reservoir fluids, and maintaining a controlled environment to observe the conductivity’s influence on water temperature. Over 20 years, the model reached a stable final temperature of 189 °F, with only a 3% deviation, suggesting effective heat distribution and temperature stability, advantageous for applications requiring consistent thermal conditions. Opening the perforations allows direct interaction between the well water and the reservoir, significantly impacting the well’s thermal profile due to the high conductivity. This configuration led to a temperature increase of approximately 23%, reaching 225 °F (
Figure 14 15).
Comparing both configurations, the introduction of a highly conductive material has a minimal impact on the closed U-shaped well system, maintaining an average temperature of 189 °F over 20 years. However, the open fracture model exhibits a significant temperature increase to an average of 225 °F, underscoring that open fractures can considerably boost heat transfer. This indicates potential advantages for enhancing thermal recovery processes, emphasizing the critical role of fracture management in optimizing geothermal well performance.
3.3. Long-Term Performance Analysis of Pipe-In-Pipe Geothermal Well Models
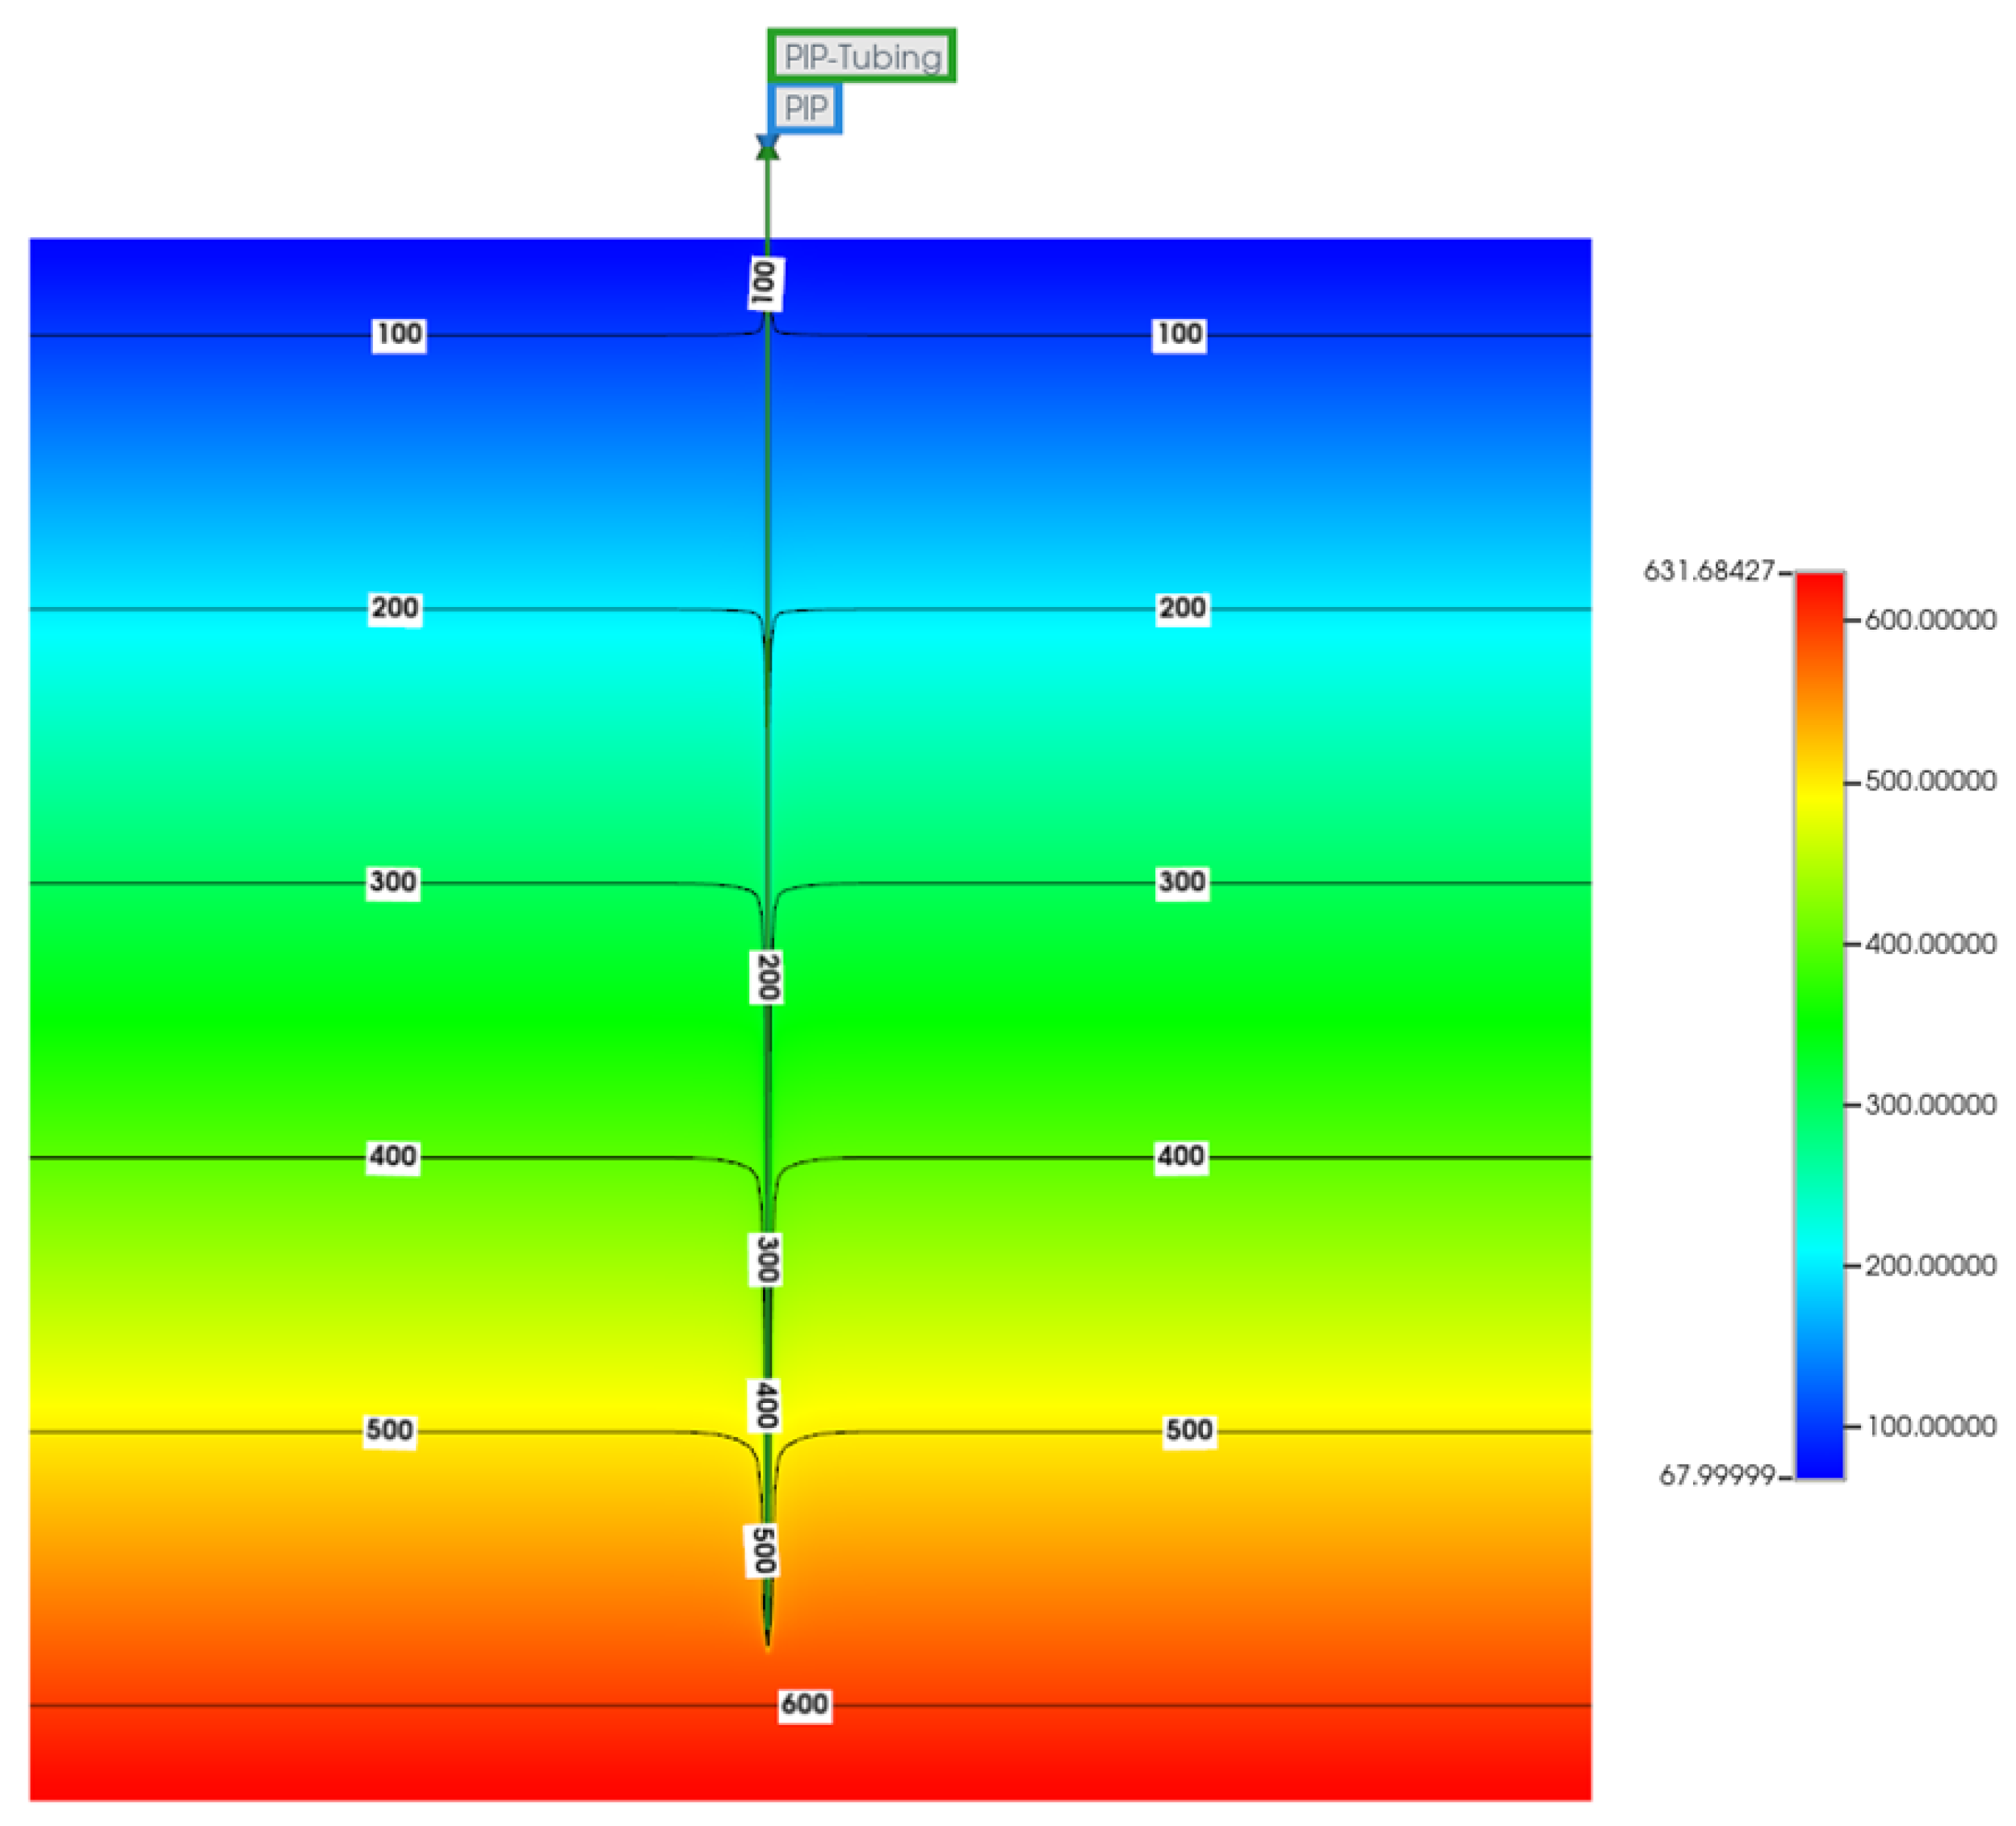
The Pipe-in-Pipe (PIP) closed loop well model, utilizing a dual-pipe configuration intended to enhance thermal efficiency, has demonstrated suboptimal performance in heat extraction from the deept formations. The absence of a lateral well, which in models like the U-Shaped significantly enhances heat absorption at depths of 6100 meters and temperatures of 300 °C, is a primary factor in its underperformance (
Figure 15).
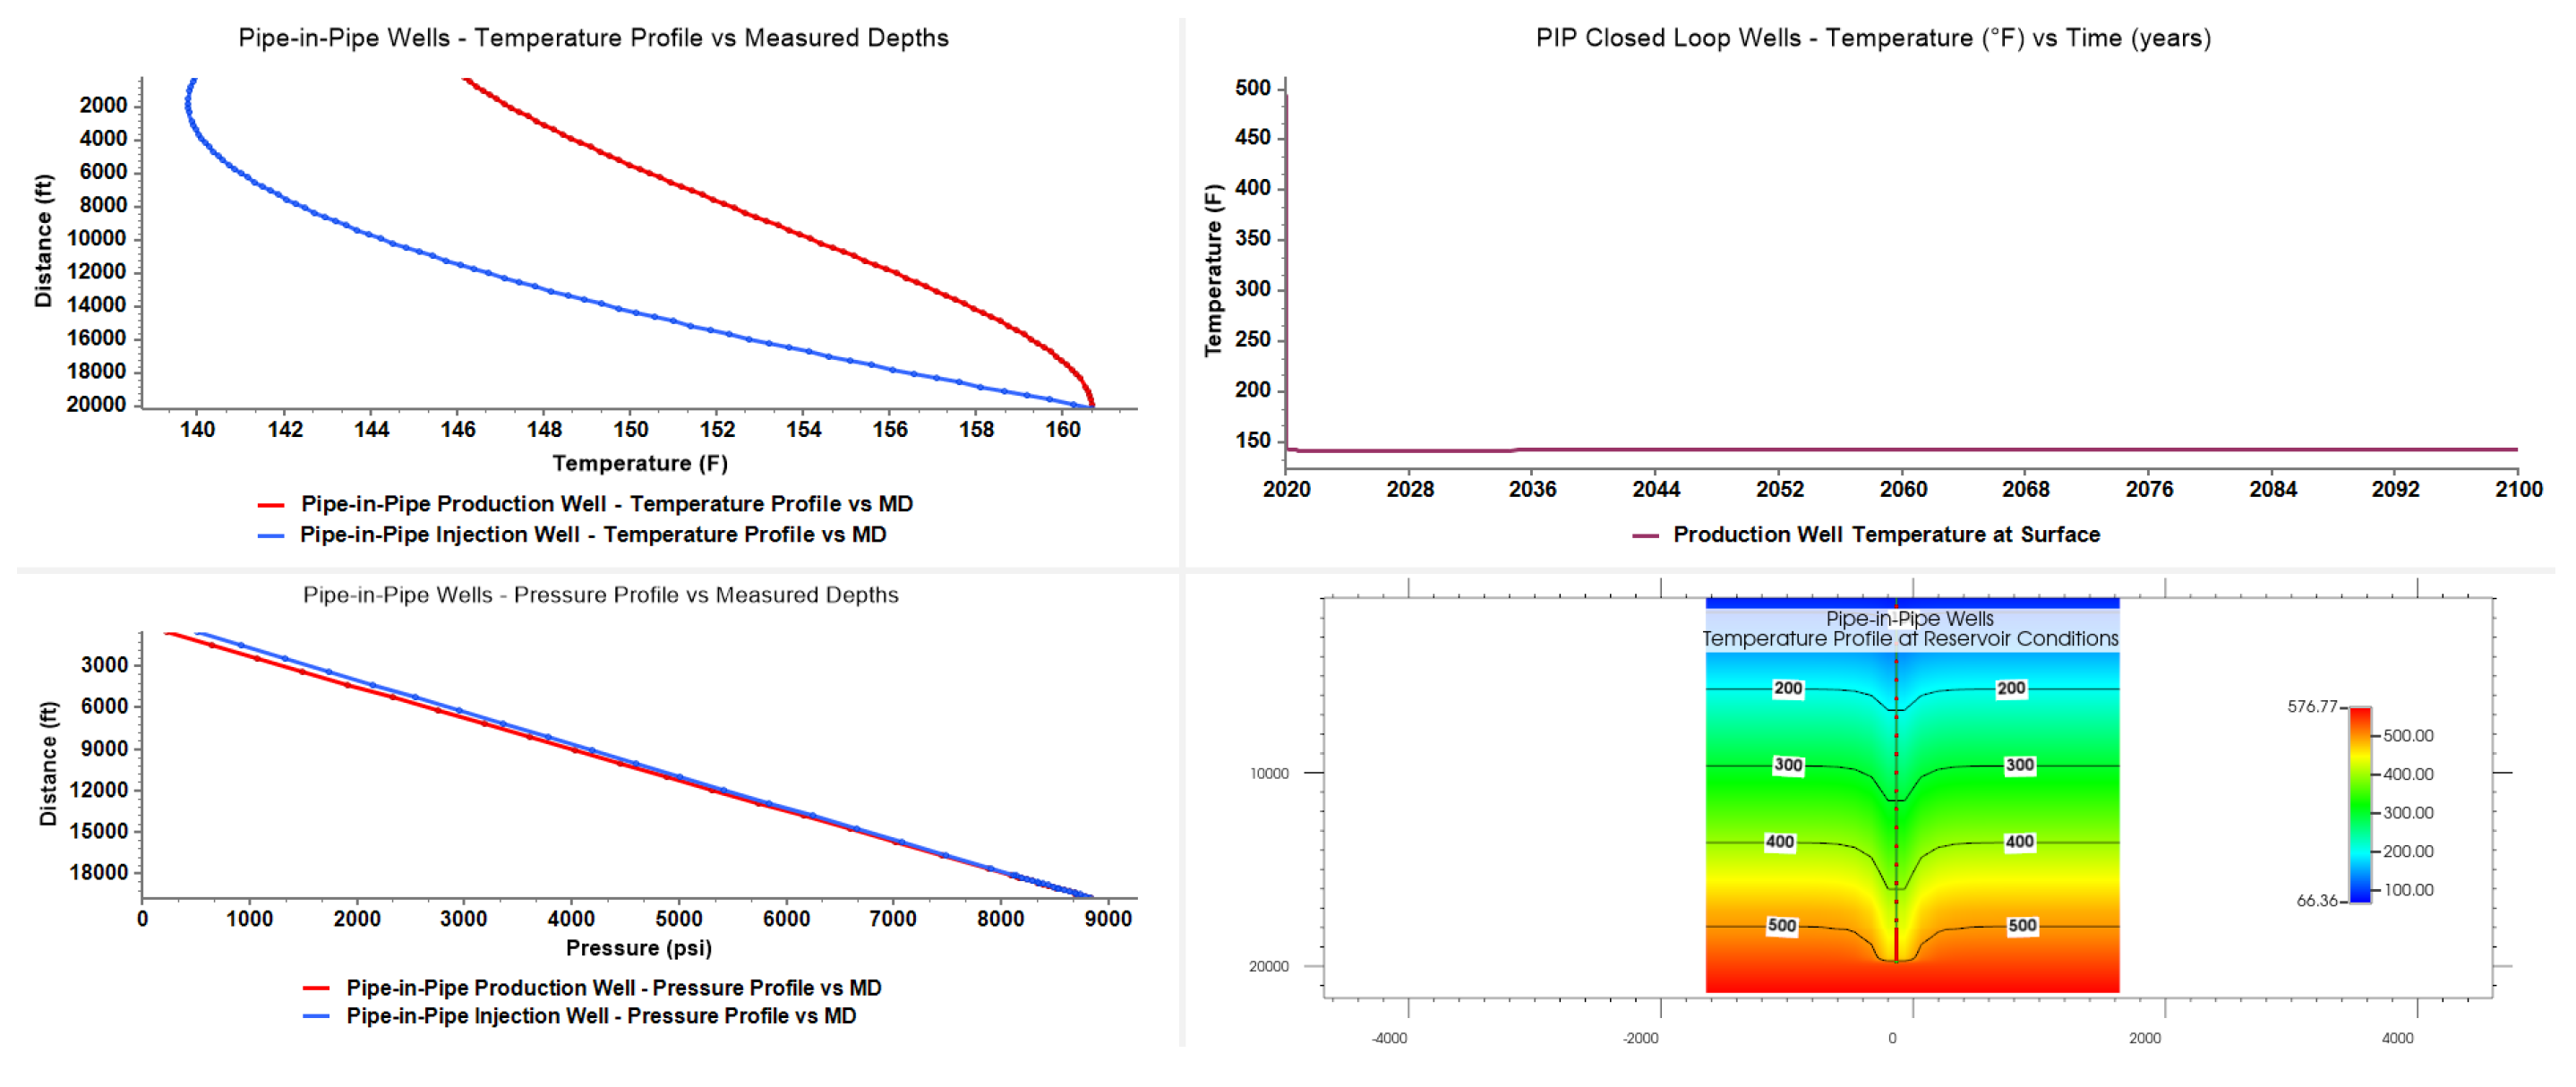
Contrary to expectations, the injected water does not effectively utilize the formation’s heat, leading to a disappointing final temperature of 143 °F after 20 years, only slightly higher than the injected fluid’s temperature of 140 °F. This minimal increase in temperature underscores the model’s inefficiencies, as the concentric design of the production well within the injection well reduces the contact area with the targeted formation, thus diminishing heat transfer. Temperature profiles obtained from the simulation model indicate intersecting temperatures between the injection and production wells at certain depths, with no significant temperature differential. The production well’s temperature profile, influenced by the concentric tubing design, shows reduced heat extraction compared to the U-Shaped model.
The PIP model’s design limitations significantly impact its efficiency. This suggests a need for further development and potential redesign to optimize its performance for geothermal energy extraction, highlighting the possibility that significant optimizations may be necessary to enhance its thermal efficiency and make it competitive with simpler configurations (
Figure 16).
3.4. Long-Term Performance Analysis of V-Shaped Geothermal Well Models
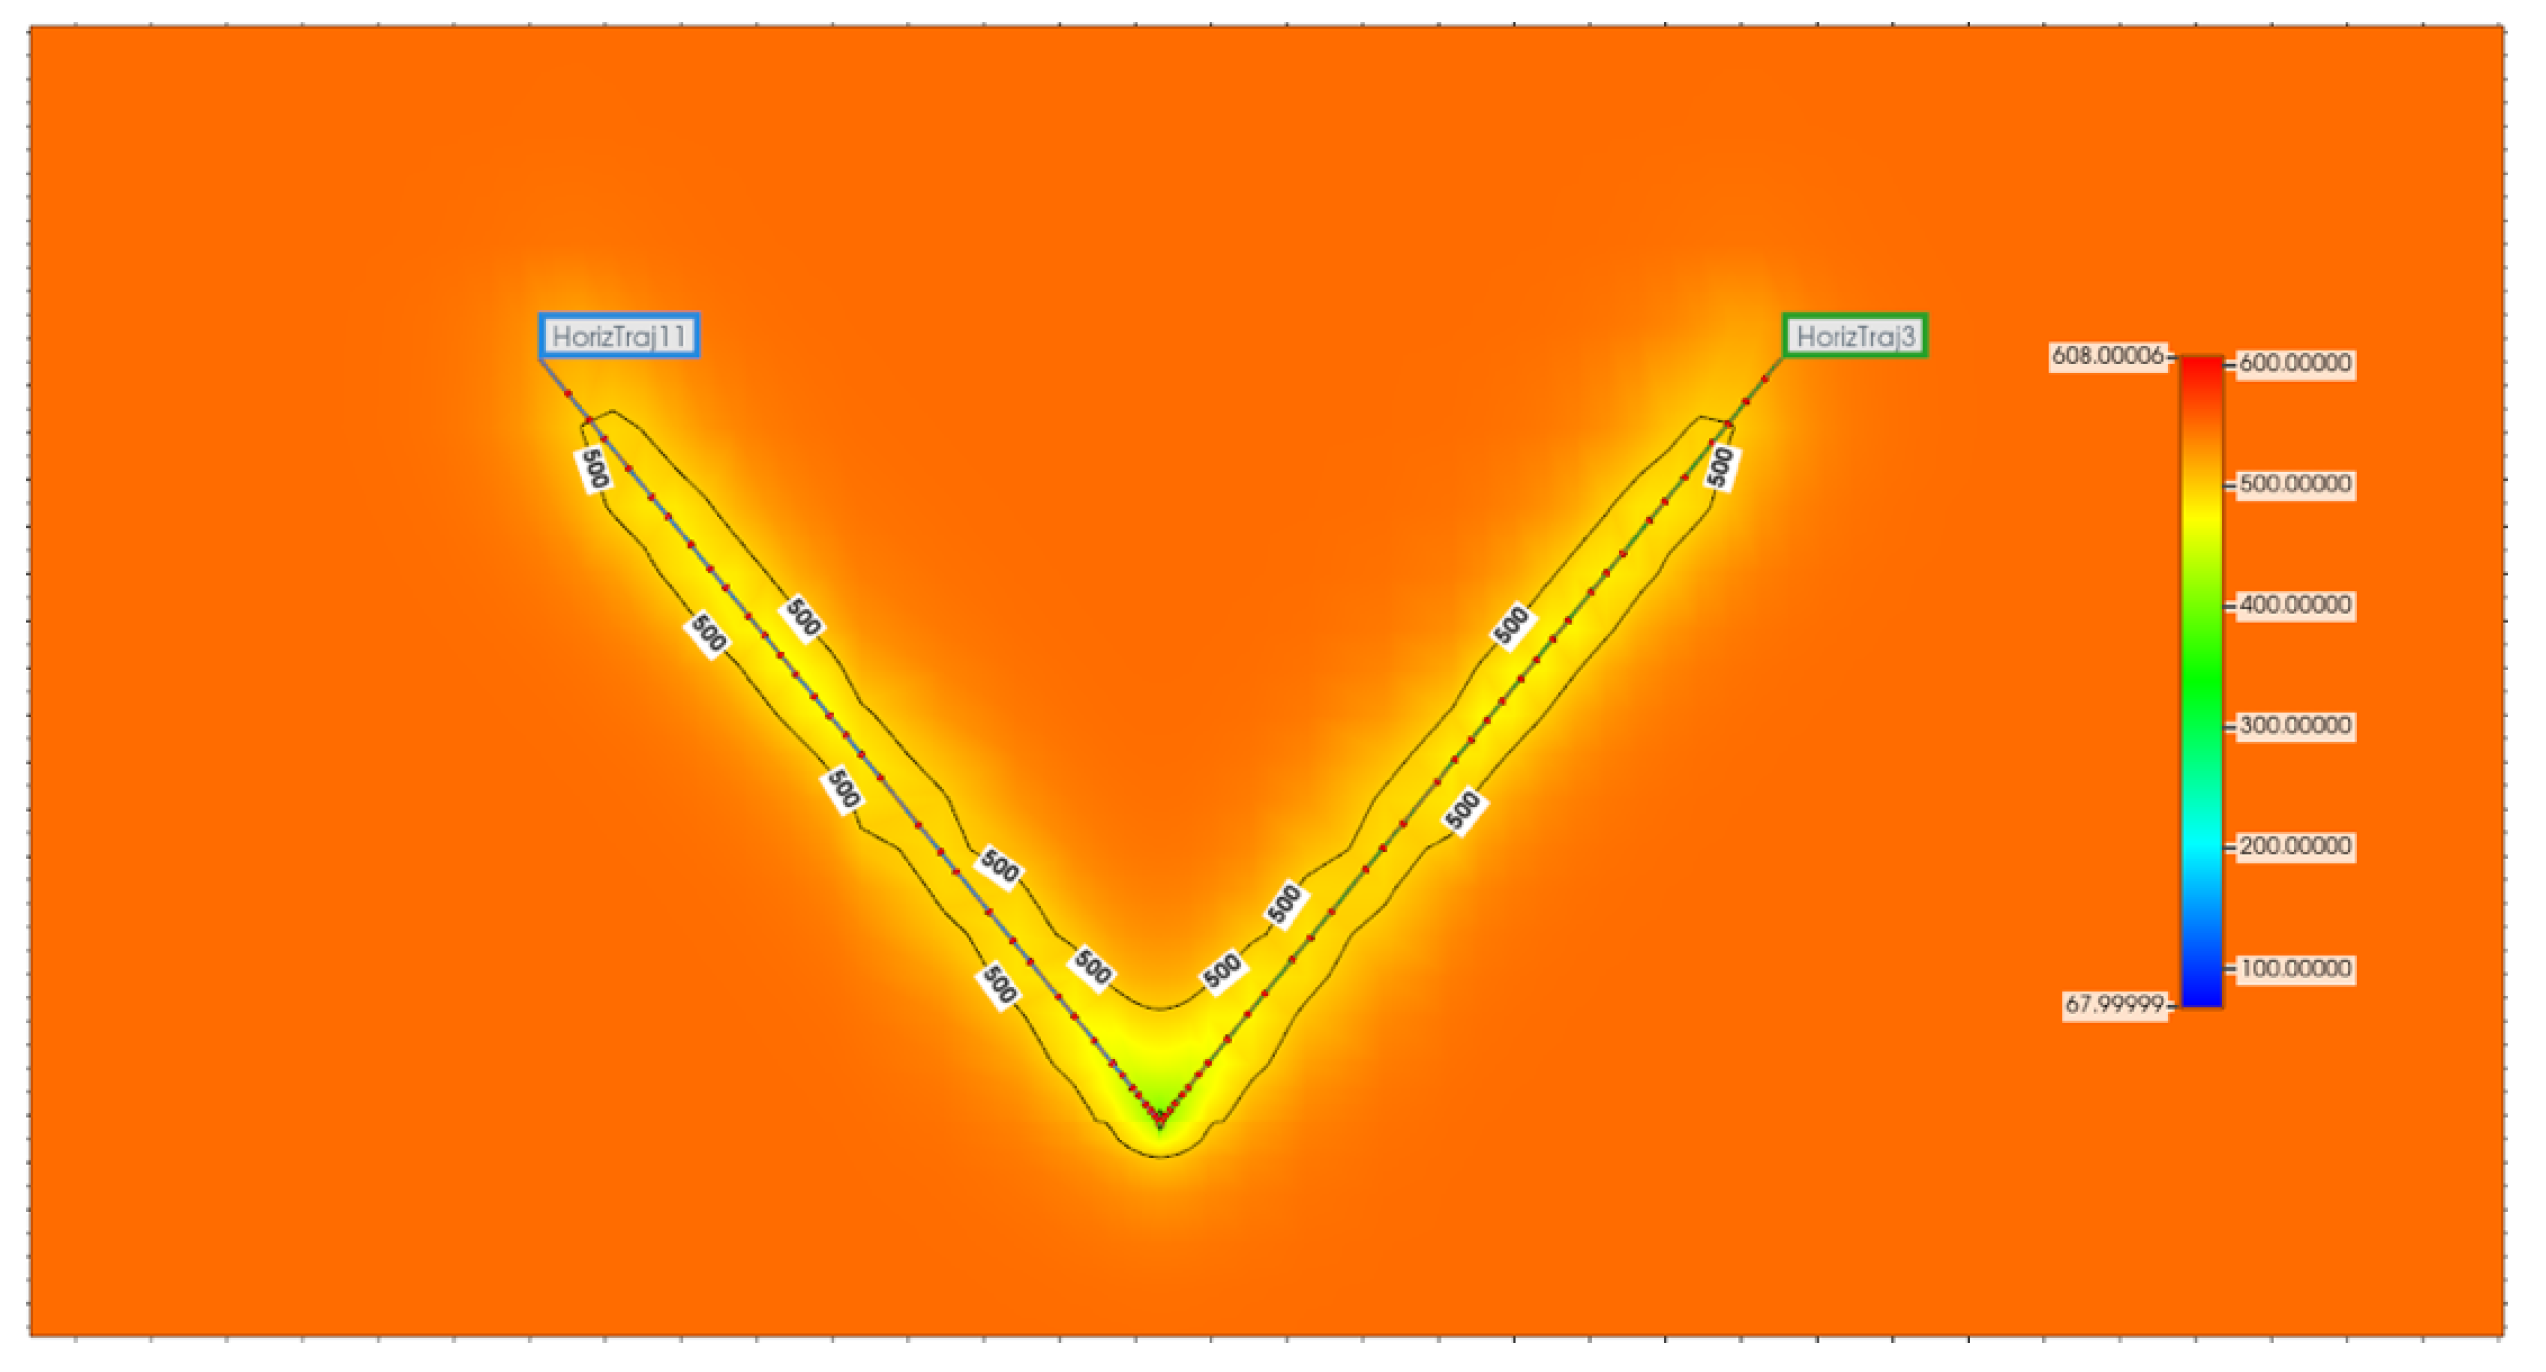
The V-Shaped Closed Loop Wells model has excelled in extracting geothermal energy from the Wattenberg formation reservoir’s deepest sections. This model’s lateral well, connecting the injection and production wells, effectively absorbs heat from the deepest point at 6100 meters where temperatures reach up to 300 °C (
Figure 17). Its larger lateral section, compared to the U-Shaped Base Model, significantly improves the contact between the wells and the formation, optimizing heat extraction for closed-loop systems.
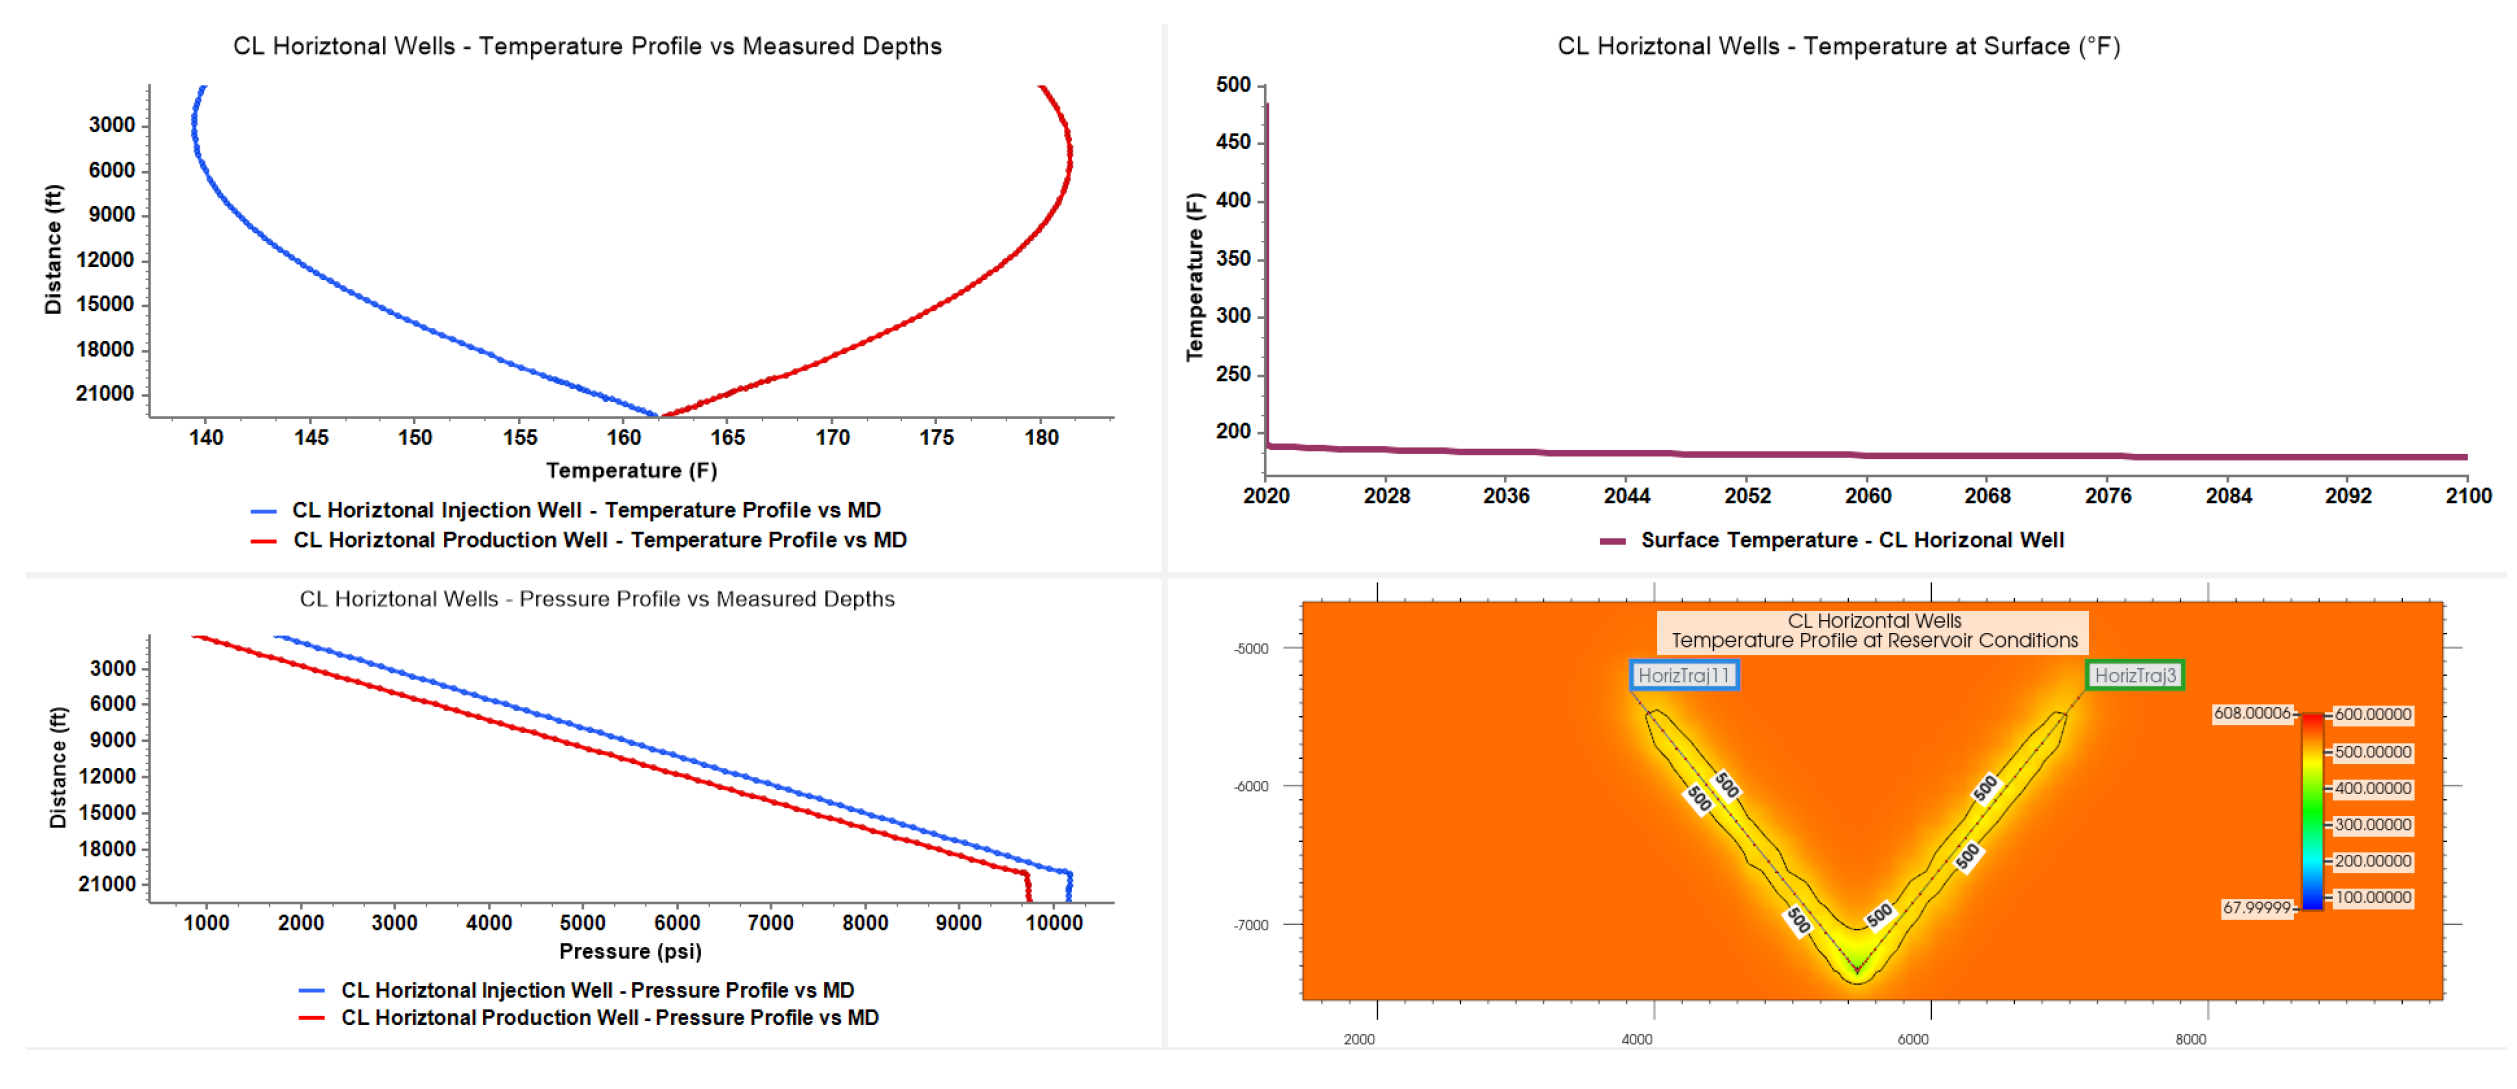
Over a 20-year simulation period, the V-Shaped model recorded a final temperature of 185 °F, a notable increase from the injected fluid’s initial temperature of 140 °F. Temperature profiles analyzed across various wells and depths show a minor decrease in temperature near the surface but reveal that both wells’ profiles intersect at deeper levels, demonstrating the model’s effectiveness. The heat transfer primarily occurs through the casing walls, suggesting an indirect contact between the water and the reservoir rock. Like other models, the V-Shaped system uses water as the working fluid, with its properties under various operational states, confirming that water remains in the liquid phase throughout. The V-Shaped model slightly outperforms the U-Shaped model due to its enhanced contact area with the hot rock formations, leading to more efficient heat transfer. The robust efficiency and innovative design of the V-Shaped model make it a reliable and effective option for geothermal energy extraction, as further illustrated in
Figure 18, detailing the thermal and pressure dynamics within the system.
3.5. Long-Term Performance Analysis of Inclined V-Shaped Geothermal Well Models
The Inclined V-Shaped Closed Loop Wells model achieves respectable heat extraction from the deepest formations of the Wattenberg formation reservoir, though it records lower temperatures compared to the U-Shaped and V-Shaped models. The model effectively utilizes heat around the injection and production wells, but the lateral well’s reduced contact at the maximum depth of 6100 meters at 300 °C makes it less effective in closed-loop systems (
Figure 19).
After 20 years, the model reached a final temperature of 179°F. This result will be analyzed in relation to the injected fluid’s initial temperature of 140 °F. Temperature profiles show a slight decrease at shallower depths, intersecting at one point to demonstrate efficiency. However, the inclined wellbore leads to an unsteady temperature increase, indicating less stability compared to other models (
Figure 20).
Although it offers good baseline efficiency, the Inclined V-Shaped model exhibits slightly lower performance due to its inclined design, which, while addressing drilling challenges, introduces thermal efficiency losses. Despite this, the model maintains stable temperature and pressure profiles, making it a reliable option for geothermal energy extraction. The model’s performance, including thermal and pressure dynamics, highlighting its operational profiles and projections.
3.6. Long-Term Performance Analysis of EGS Well Models
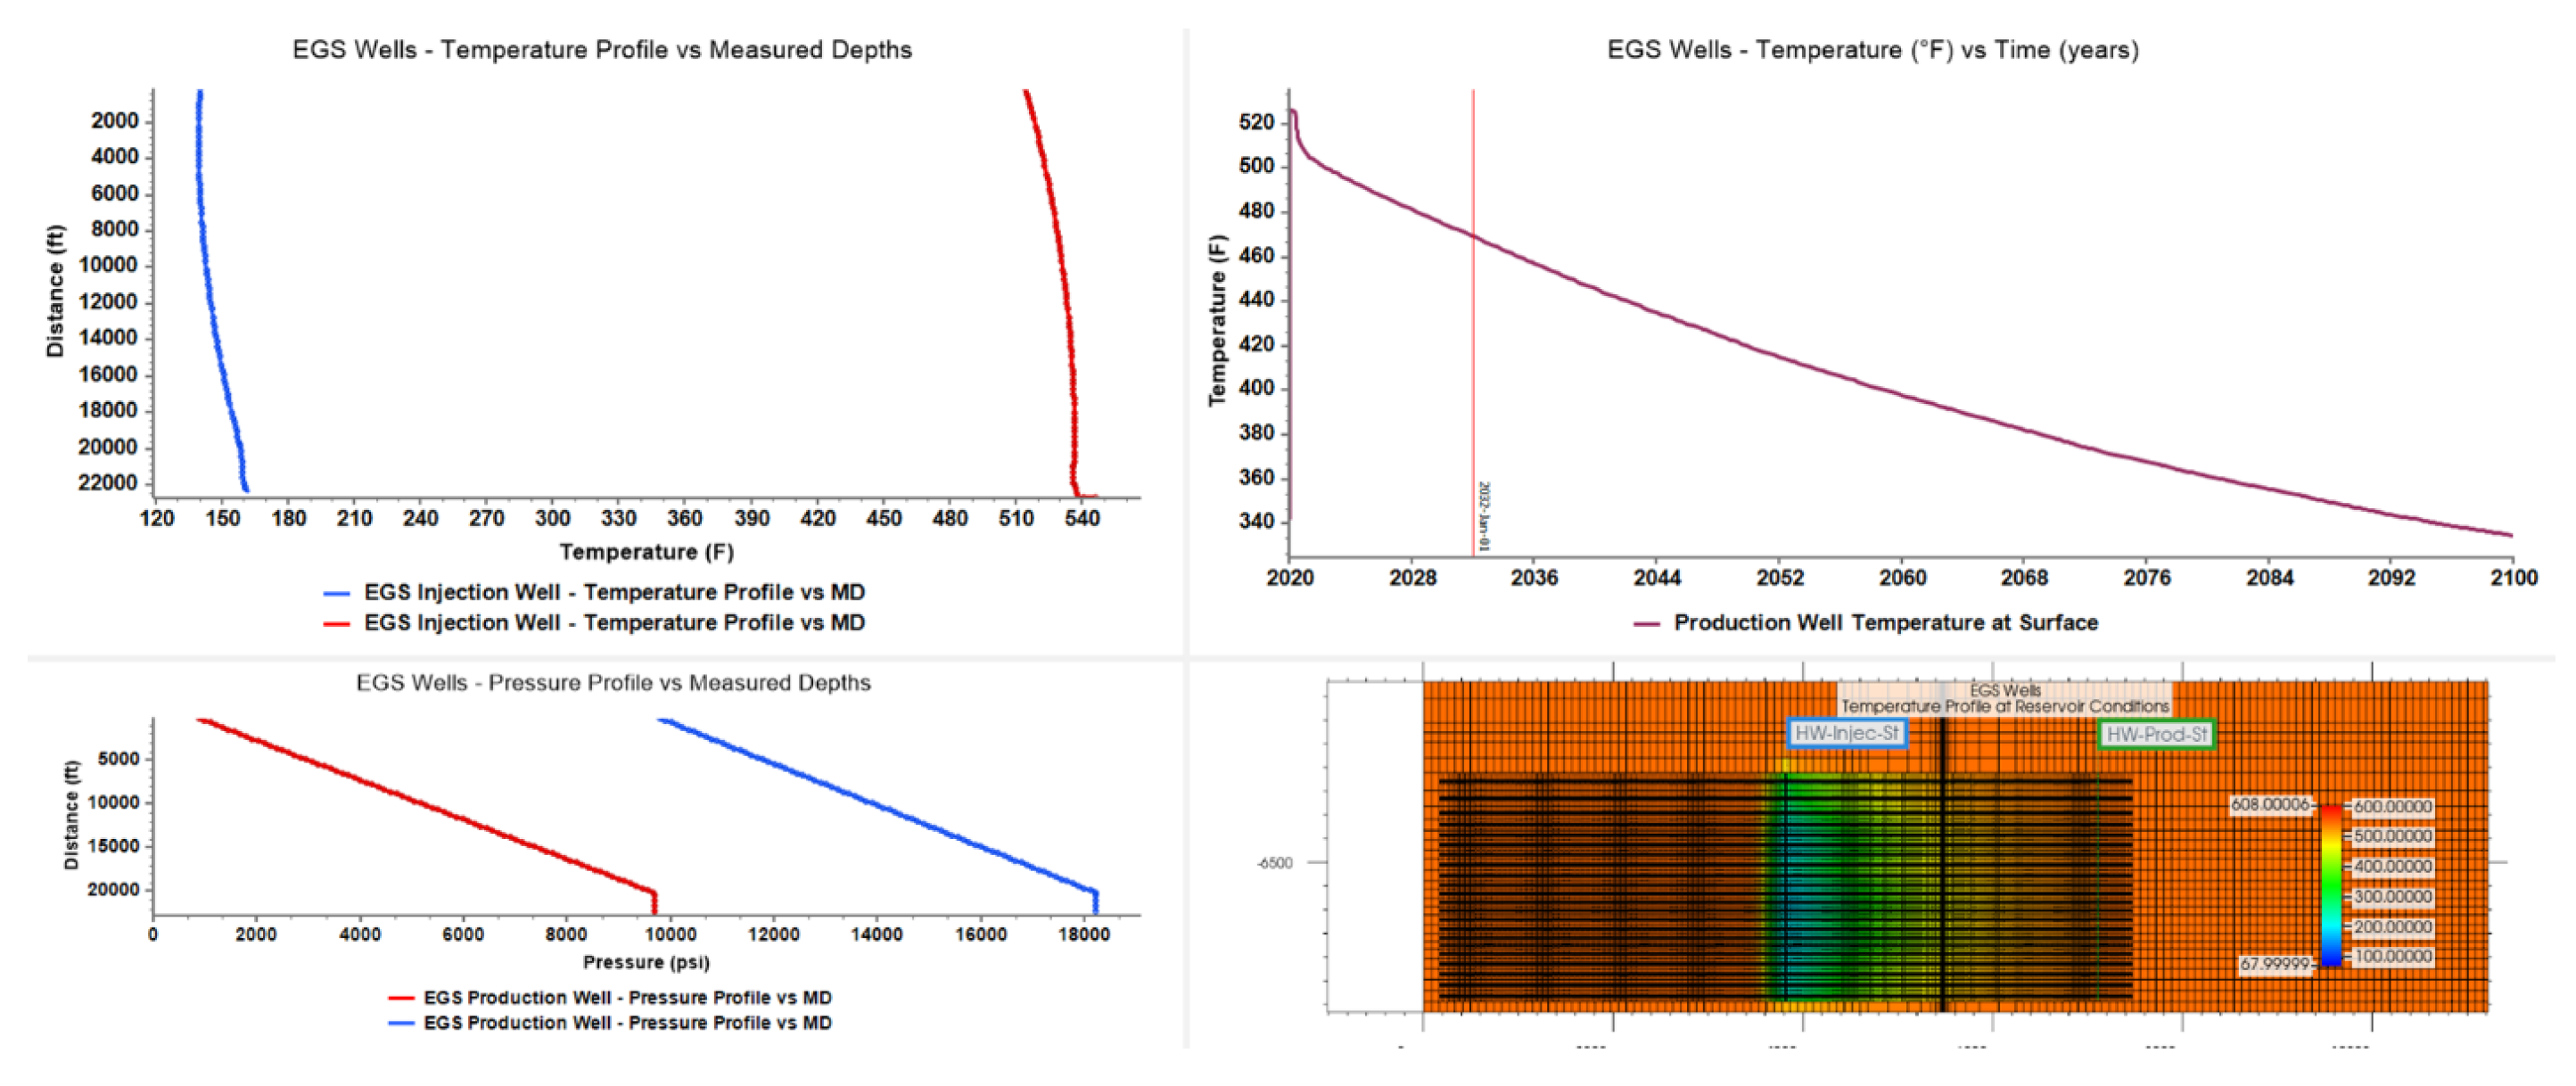
The Enhanced Geothermal System (EGS) model has shown outstanding performance in heat extraction from the deepest formations of the Wattenberg formation reservoir. Utilizing hydraulic fractures, this model significantly enhances the contact area between the injected fluid and the targeted formation at depths of 6100 meters and temperatures of 300 °C, optimizing the heat extraction process (
Figure 21). Here we assume that all fractures have the same contribution to fluid flow from the injection to the production well.
After 20 years of operation, the EGS model recorded a final temperature of 446 °F, marking a substantial increase from the injected fluid’s initial temperature of 140 °C. Water remains in the liquid phase under all operational conditions, highlighting the system’s adaptability and robustness. Temperature profiles across various wells show a significant difference between the bottom hole temperatures, demonstrating the model’s effective heat transfer. Overall, the EGS Wells model’s superior design and hydraulic fracturing techniques greatly enhance its thermal efficiency. It maintains stable temperature and pressure profiles, making it highly effective for deep geothermal resource extraction (
Figure 22). The high temperatures achieved underscore the potential of EGS technologies to access and utilize deeper and hotter geothermal resources effectively.
3.7. Long-Term Performance Analysis of Inclined EGS Well Models
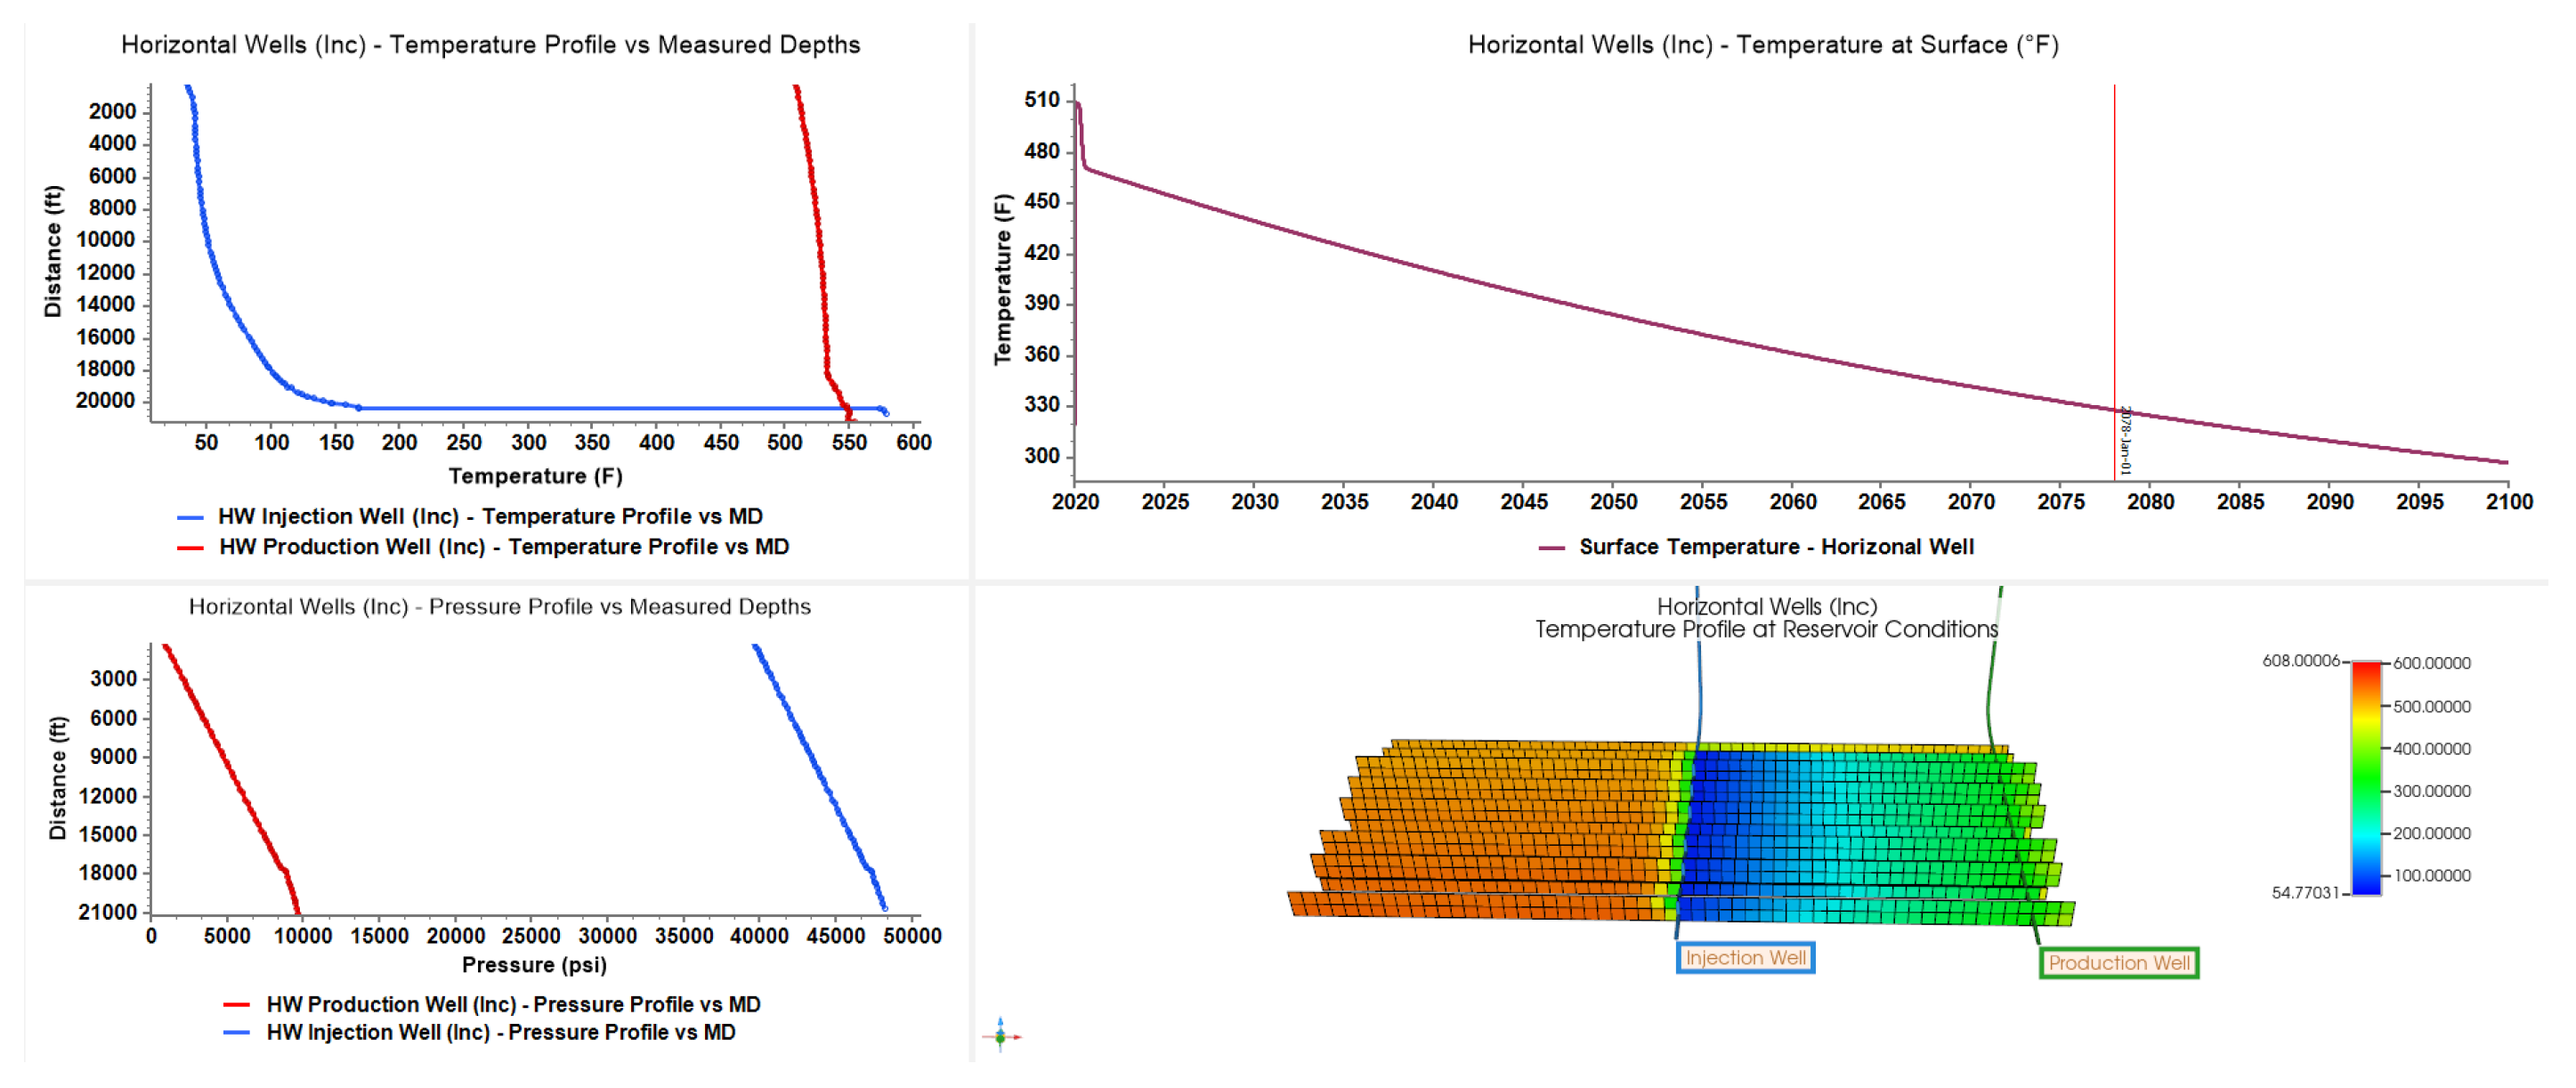
The Inclined EGS Wells model effectively extracts heat from the Wattenberg formation, albeit at slightly lower temperatures than the standard EGS model. Utilizing hydraulic fracturing, this model enhances heat absorption through extended fractures between injection and production wells, which reach depths of 6100 meters and temperatures of 300 °C (
Figure 23).
After 20 years, the model reached a final temperature of 425 °F, illustrating significant heat gain compared to the injected fluid’s initial temperature of 140 °C. Temperature profiles across different depths show that despite the fractures not extending to the well’s tip, there is significant disparity between the wells, indicating effective heat extraction. The model uses water as the exclusive thermal medium, confirming stability across a wide range of operational conditions. Although it performs slightly below the standard EGS model, the Inclined EGS model’s design enhances reservoir permeability and facilitates extensive heat extraction, maintaining stable temperature and pressure profiles, and proving reliable for geothermal energy extraction (
Figure 24).
The inclined design is strategically employed to overcome drilling challenges, demonstrating the potential of inclined configurations to efficiently exploit geothermal energy under difficult conditions. This design choice, while slightly reducing efficiency, showcases the model’s adaptability and effectiveness in geothermal extraction.
3.7.1. Models Discussion
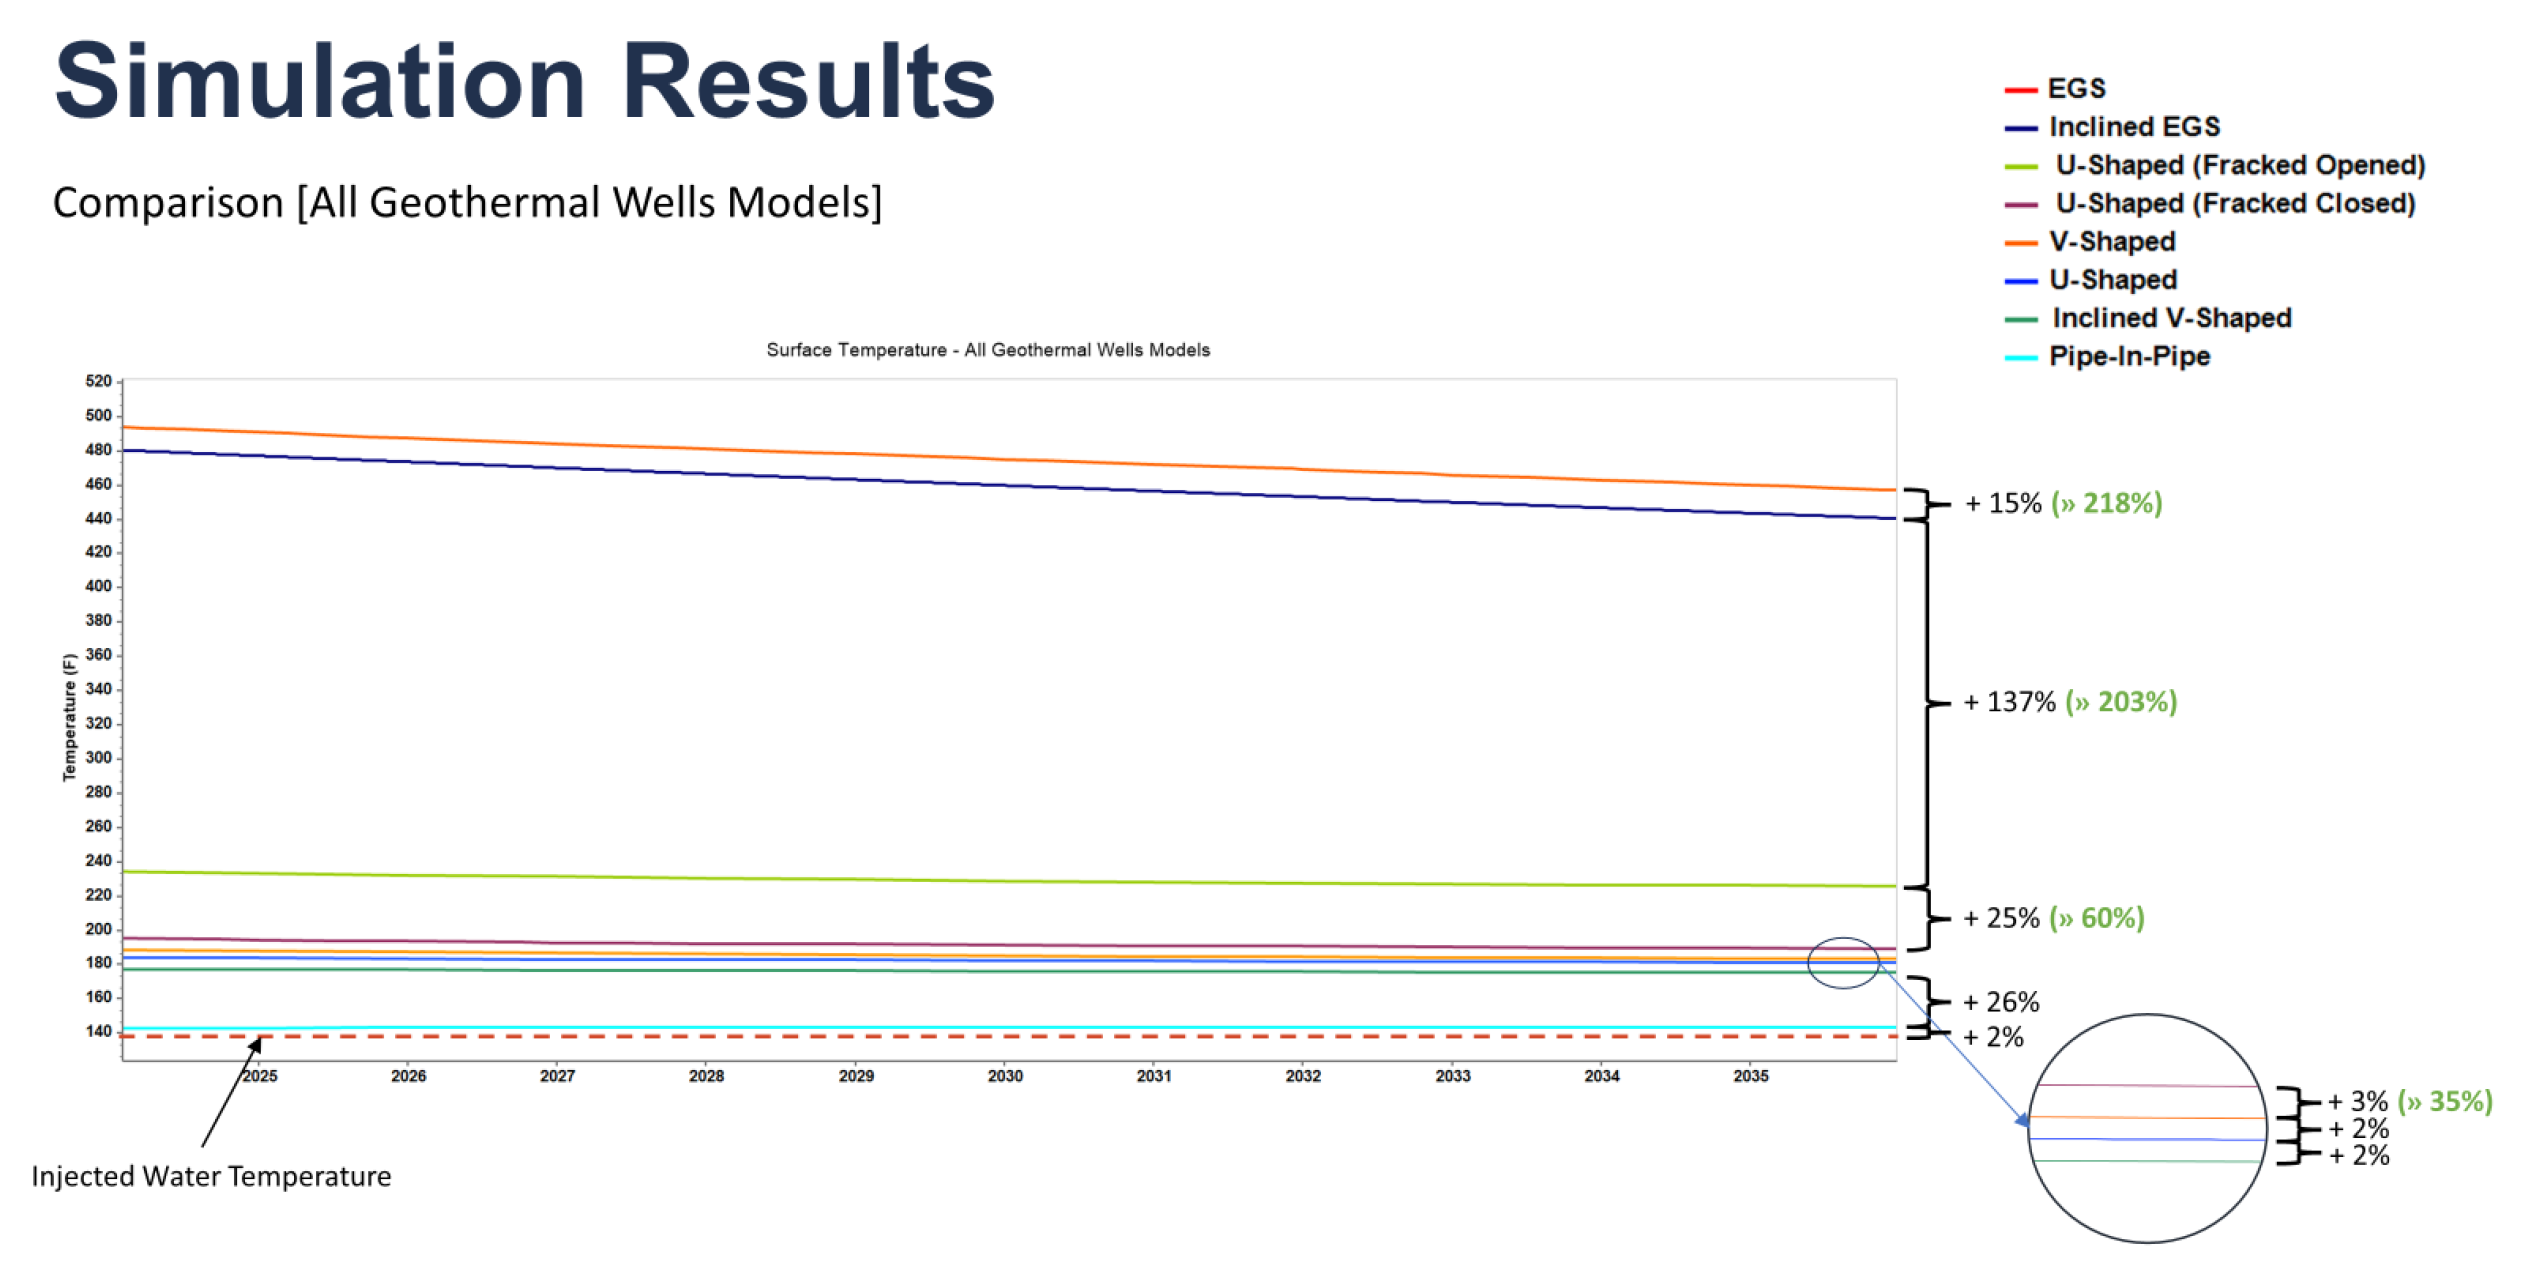
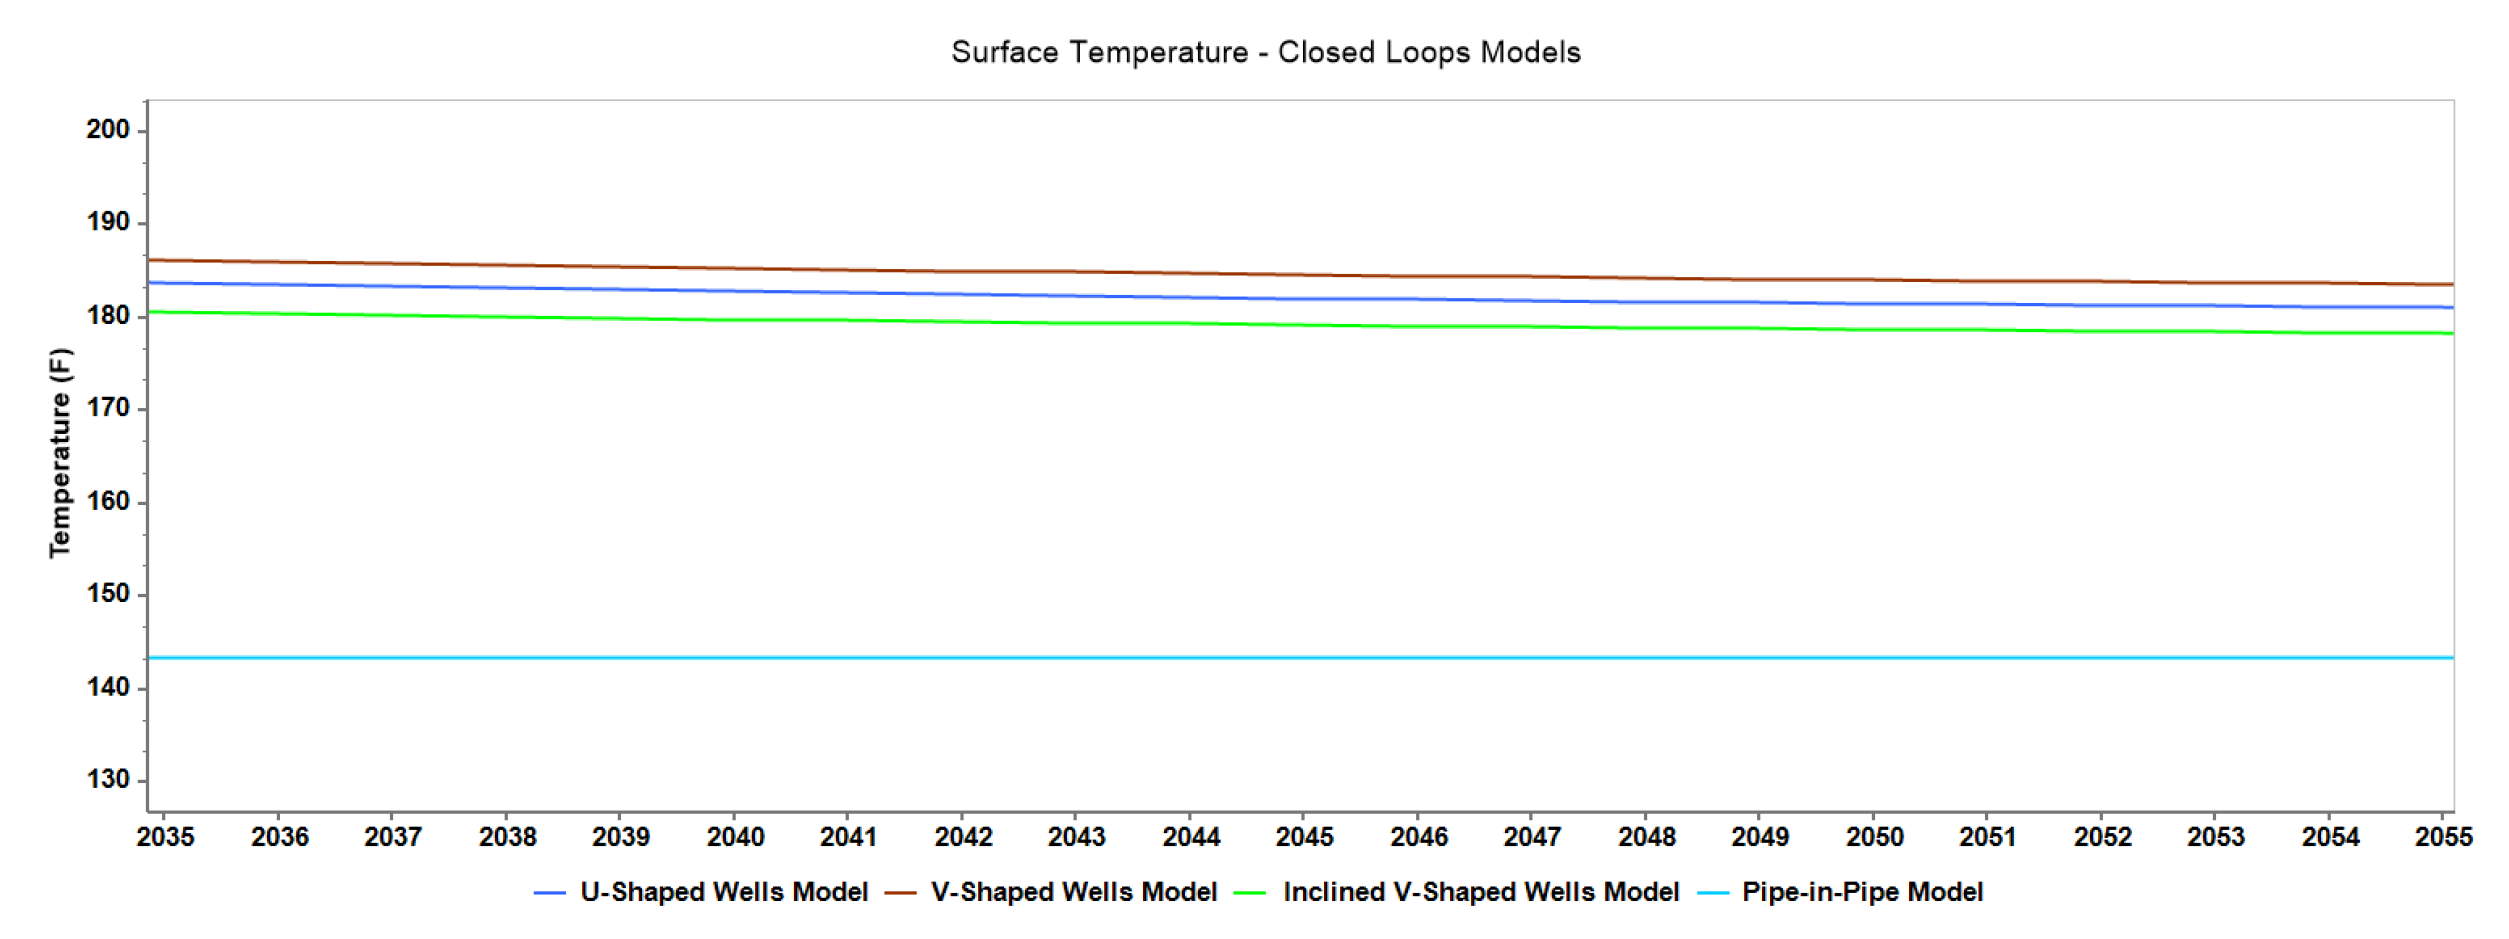
The analysis of closed-loop and Enhanced Geothermal System (EGS) models reveals significant differences in efficiency and performance across geothermal well configurations. The closed-loop systems, including U-Shaped, V-Shaped, Inclined V-Shaped, and Pipe-in-Pipe (PIP) models, operate within a relatively narrow temperature range, with the V-Shaped model showing a slight thermal advantage due to longer residence time of injected fluid at the deepest part of the well (
Figure 25). This illustrates the impact of design complexity on thermal extraction efficiency, balancing simplicity against performance enhancements.
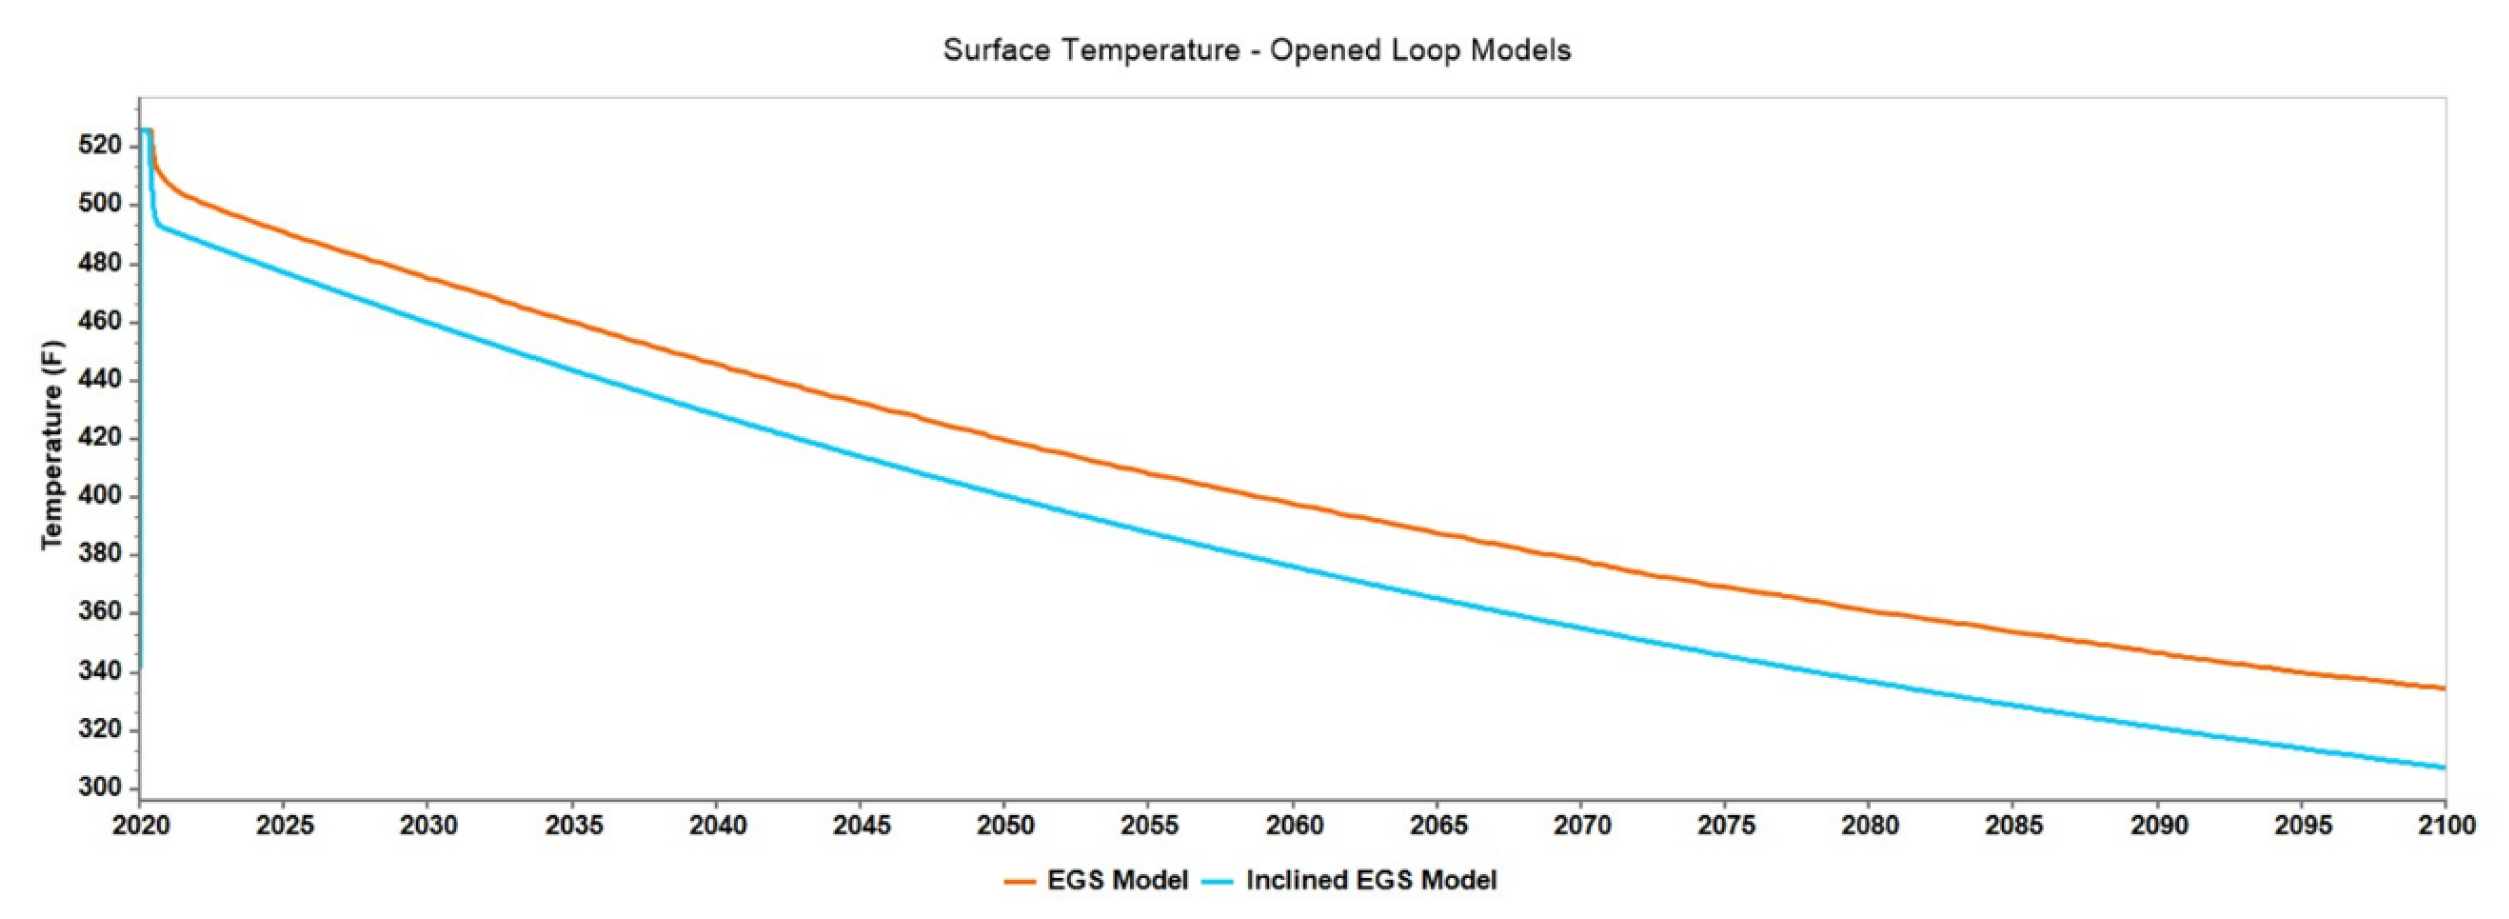
In contrast, the EGS and Inclined EGS models exhibit substantially higher temperatures, benefiting from hydraulic fracturing and optimized well design (
Figure 27). Despite the slight decrease in thermal efficiency due to the inclined design, both EGS configurations significantly outperform the closed-loop models, demonstrating the effectiveness of EGS technology in accessing deeper geothermal resources. However, there is a continuous decrease in output temperature in the EGS configurations, due to the cooling of the reservoir rock over time.
Figure 26.
Estimated produced surface temperature for EGS and inclined EGS wells after 20 years.
Figure 26.
Estimated produced surface temperature for EGS and inclined EGS wells after 20 years.
Figure 27.
Overall produced surface temperature comparison of all geothermal well configurations after 20 Years.
Figure 27.
Overall produced surface temperature comparison of all geothermal well configurations after 20 Years.
A comprehensive overview presented in
Figure 27 compares all models, clearly highlighting the superior performance of EGS systems over traditional closed-loop configurations. While the U-Shaped and V-Shaped models achieve moderate temperature gains, specialized modifications like fracturing in the U-Shaped (Fracked High-Conductivity) models significantly boost performance.
The temperature increase (
) across models varies, with the Pipe-in-Pipe model showing a minimal +3 °F increase, underscoring its limited efficiency. Meanwhile, EGS models display dramatic increases of +306 °F and +285 °F, exemplifying their potent high-temperature extraction capabilities (
Table 5). This stark contrast underscores the effectiveness of EGS systems in harnessing high-temperature geothermal energy, further enhanced by fracturing and material innovations in certain models. This analysis not only highlights performance variability among geothermal configurations but also emphasizes the potential for significant enhancements in traditional systems through innovative techniques. Moreover, it reaffirms the high thermal efficiencies achievable with EGS systems, positioning them as ideal for deep geothermal energy extraction. These findings are vital for guiding future research and development in optimizing geothermal extraction techniques to maximize energy capture and efficiency in the renewable energy sector.
4. Summary and Conclusions
This study provides an exhaustive numerical modeling study of diverse geothermal well configurations in the Wattenberg formation, using the CMG-STARS thermal reservoir simulation software to evaluate their thermal efficiency and potential for electricity generation.
The study encompasses traditional Closed-Loop Geothermal (CLG) systems like Pipe-in-Pipe and U-Shaped designs, alongside innovative setups such as hybrid models that combine closed-loop and open-loop features through hydraulic fracturing and high-conductivity material injections.
The study highlighted moderate thermal performance across traditional CLG systems but showed significant enhancements in U-Shaped models through the hybrid system, markedly improving their delta temperature () values.
The Enhanced Geothermal Systems (EGS) configurations, including standard and Inclined EGS, demonstrated exceptional heat extraction capacities, suitable for electricity generation in the deeper and more complex reservoirs of the DJ Basin, with values of +306 °F and +285 °F respectively.
These findings suggest that while EGS models offer superior performance, their implementation requires careful consideration of geological and technical challenges to ensure sustainable energy output.
Author Contributions
Conceptualization, L.E.Z.; methodology, A.N. and L.E.Z; validation, A.N. and L.E.Z.; formal analysis, A.N. and L.E.Z.; investigation, A.N. and L.E.Z.; resources, L.E.Z; writing—original draft preparation, A.N.; writing—review and editing, L.E.Z.; supervision, L.E.Z.; project administration, L.E.Z.; funding acquisition, L.E.Z. All authors have read and agreed to the published version of the manuscript.
Funding
This research was funded by the Rock and Fluid Multiphysics consortium of the Colorado School of Mines.
Data Availability Statement
The data that support the findings of this study are available on request from the corresponding author. The data are not publicly available due to privacy or ethical restrictions.
Conflicts of Interest
The authors declare no conflicts of interest.
Abbreviations
The following abbreviations are used in this manuscript:
| CLG |
Closed-loop geothermal |
| CMG |
Computer Modeling Group |
| DJ |
Denver-Julesburg |
| EGS |
Enhanced Geothermal Systems |
| HDR |
Hot Dry Rock |
| PIP |
Pipe-in-Pipe |
| UBA |
User block address |
References
- Cheng, Y.; Zhang, Y.; Yu, Z.; Hu, Z.; Ma, Y.; Yang, Y. Experimental and numerical studies on hydraulic fracturing characteristics with different injection flow rates in granite geothermal reservoir. Energy Science & Engineering 2021, 9, 142–168. [Google Scholar] [CrossRef]
- Pratama, H.B.; Saptadji, N.M. Study of Production-Injection Strategies for Sustainable Production in Geothermal Reservoir Two-Phase by Numerical Simulation. Indonesian Journal on Geoscience 2021, 8. [Google Scholar]
- Simmons, S.F.; Allis, R.G.; Kirby, S.M.; Moore, J.N.; Fischer, T.P. Interpretation of hydrothermal conditions, production-injection induced effects, and evidence for enhanced geothermal system-type heat exchange in response to 30 years of production at Roosevelt Hot Springs, Utah, USA. Geosphere 2021, 17, 1997–2026. [Google Scholar] [CrossRef]
- Xu, T.; Zhao, Y.; Zhao, J.; Zhang, L.; Liu, S.; Liu, Z.; Feng, B.; Feng, G.; Yue, G. Heat Extraction Performance and Optimization for a Doublet-well Geothermal System in Dezhou, China. Energy Exploration & Exploitation 2022, 40, 619–638. [Google Scholar] [CrossRef]
- Chen, G.; Jiao, J.J.; Jiang, C.; Luo, X. Surrogate-assisted level-based learning evolutionary search for geothermal heat extraction optimization. Renewable and Sustainable Energy Reviews 2024, 189, 113860. [Google Scholar] [CrossRef]
- Majer, E.L.; Baria, R.; Stark, M.; Oates, S.; Bommer, J.; Smith, B.; Asanuma, H. Induced seismicity associated with Enhanced Geothermal Systems. Geothermics 2007, 36, 185–222. [Google Scholar] [CrossRef]
- Abdelrahman, K.; Ekwok, S.E.; Ulem, C.A.; Eldosouky, A.M.; Al-Otaibi, N.; Hazaea, B.Y.; Hazaea, S.A.; Andráš, P.; Akpan, A.E. Exploratory mapping of the geothermal anomalies in the neoproterozoic Arabian Shield, Saudi Arabia, using magnetic data. Minerals 2023, 13, 694. [Google Scholar] [CrossRef]
- Zhang, C.; Feng, Q.; Zhang, L.; Qin, S.; Jiang, G.; Hu, J.; Hu, S.; Huang, R.; Zhang, H. Characteristics of Radiogenic Heat Production of Widely Distributed Granitoids in Western Sichuan, Southeast Tibetan Plateau. Lithosphere 2022, 2022, 4165618. [Google Scholar] [CrossRef]
- Robson, S.G.; Banta, E.R. Geology and hydrology of the deep bedrock aquifers in eastern Colorado. Report 85-4240, 1987. Report.
- Cui, G.; Ren, S.; Zhang, L.; Ezekiel, J.; Enechukwu, C.; Wang, Y.; Zhang, R. Geothermal exploitation from hot dry rocks via recycling heat transmission fluid in a horizontal well. Energy 2017, 128, 366–377. [Google Scholar] [CrossRef]
- Song, X.; Shi, Y.; Li, G.; Yang, R.; Wang, G.; Zheng, R.; Li, J.; Lyu, Z. Numerical simulation of heat extraction performance in enhanced geothermal system with multilateral wells. Applied Energy 2018, 218, 325–337. [Google Scholar] [CrossRef]
- Jiang, H.; Guo, L.; Kang, F.; Wang, F.; Cao, Y.; Sun, Z.; Shi, M. Geothermal Characteristics and Productivity Potential of a Super-Thick Shallow Granite-Type Enhanced Geothermal System: A Case Study in Wendeng Geothermal Field, China. Sustainability 2023, 15, 3551. [Google Scholar] [CrossRef]
- Kazemi, A.; Mahbaz, S.; Dehghani-Sanij, A.; Dusseault, M.; Fraser, R. Performance Evaluation of an Enhanced Geothermal System in the Western Canada Sedimentary Basin. Renewable and Sustainable Energy Reviews 2019, 113, 109278. [Google Scholar] [CrossRef]
- Song, X.; Shi, Y.; Li, G.; Shen, Z.; Hu, X.; Lyu, Z.; Zheng, R.; Wang, G. Numerical analysis of the heat production performance of a closed loop geothermal system. Renewable Energy 2018, 120, 365–378. [Google Scholar] [CrossRef]
- Bu, X.; Jiang, K.; Li, H. Performance of geothermal single well for intermittent heating. Energy 2019, 186, 115858. [Google Scholar] [CrossRef]
- Zhang, Y.; Yu, C.; Li, G.; Guo, X.; Wang, G.; Shi, Y.; Peng, C.; Tan, Y. Performance analysis of a downhole coaxial heat exchanger geothermal system with various working fluids. Applied Thermal Engineering 2019, 163, 114317. [Google Scholar] [CrossRef]
- Wang, G.; Song, X.; Shi, Y.; Zheng, R.; Li, J.; Li, Z. Production performance of a novel open loop geothermal system in a horizontal well. Energy Conversion and Management 2020, 206, 112478. [Google Scholar] [CrossRef]
- Frash, L.P.; Meng, M.; Bijay, K. Greenfield Reservoir Engineering for the Wattenberg Field with Comparison of Advanced, Enhanced, and Caged Geothermal Systems, 2024.
- Won, J.; Choi, H.J.; Lee, H.; Choi, H. Numerical investigation on the effect of cementing properties on the thermal and mechanical stability of geothermal wells. Energies 2016, 9, 1016. [Google Scholar] [CrossRef]
- Norbeck, J.; Latimer, T. Commercial-Scale Demonstration of a First-of-a-Kind Enhanced Geothermal System. EarthArXiv eprints 2023, X52X0B. [Google Scholar] [CrossRef]
Figure 1.
Temperature vs depth plot illustrating possible geothermal gradients and its association with geothermal energy systems.
Figure 1.
Temperature vs depth plot illustrating possible geothermal gradients and its association with geothermal energy systems.
Figure 2.
Map of greater Wattenberg area, located within the Denver-Julesburg Basin of Colorado. West–east cross section A–A’ showing structural setting of the Denver Basin, Colorado, adapted from [
9].
Figure 2.
Map of greater Wattenberg area, located within the Denver-Julesburg Basin of Colorado. West–east cross section A–A’ showing structural setting of the Denver Basin, Colorado, adapted from [
9].
Figure 3.
Geothermal reservoir model grid system.
Figure 3.
Geothermal reservoir model grid system.
Figure 4.
U-Shaped closed loop well model description.
Figure 4.
U-Shaped closed loop well model description.
Figure 5.
V-Shaped closed loop well model description.
Figure 5.
V-Shaped closed loop well model description.
Figure 6.
Inclined V-shaped closed loop well model description geometric configuration.
Figure 6.
Inclined V-shaped closed loop well model description geometric configuration.
Figure 7.
Pipe-in-pipe closed loop well model description.
Figure 7.
Pipe-in-pipe closed loop well model description.
Figure 8.
EGS well model description.
Figure 8.
EGS well model description.
Figure 9.
Inclined EGS well model description.
Figure 9.
Inclined EGS well model description.
Figure 10.
Fervo field demonstration data vs reservoir simulation results in terms of produced surface temperature.
Figure 10.
Fervo field demonstration data vs reservoir simulation results in terms of produced surface temperature.
Figure 11.
Fervo field demonstration data vs reservoir simulation results in terms of injection and production wells surface temperature, pressure, and flow rate.
Figure 11.
Fervo field demonstration data vs reservoir simulation results in terms of injection and production wells surface temperature, pressure, and flow rate.
Figure 14.
Produced surface temperature (°F) vs time (years) – U-shaped (All models) comparison).
Figure 14.
Produced surface temperature (°F) vs time (years) – U-shaped (All models) comparison).
Figure 15.
Pipe-in-pipe well closed loop well reservoir temperature distribution after 80 years.
Figure 15.
Pipe-in-pipe well closed loop well reservoir temperature distribution after 80 years.
Figure 16.
Thermal and pressure dynamics in pipe-in-pipe well systems: profiles and projections.
Figure 16.
Thermal and pressure dynamics in pipe-in-pipe well systems: profiles and projections.
Figure 17.
V-Shaped closed loop wells reservoir temperature distribution after 80 years.
Figure 17.
V-Shaped closed loop wells reservoir temperature distribution after 80 years.
Figure 18.
Thermal and pressure dynamics in V-Shaped wells systems: profiles and projections.
Figure 18.
Thermal and pressure dynamics in V-Shaped wells systems: profiles and projections.
Figure 19.
Inclined V-shaped closed loop wells reservoir temperature distribution after 80 years.
Figure 19.
Inclined V-shaped closed loop wells reservoir temperature distribution after 80 years.
Figure 20.
Thermal and pressure dynamics in V-Shaped wells systems: profiles and projections.
Figure 20.
Thermal and pressure dynamics in V-Shaped wells systems: profiles and projections.
Figure 21.
EGS well reservoir temperature distribution after 80 years.
Figure 21.
EGS well reservoir temperature distribution after 80 years.
Figure 22.
Thermal and pressure dynamics in EGS wells systems: profiles and projections.
Figure 22.
Thermal and pressure dynamics in EGS wells systems: profiles and projections.
Figure 23.
Inclined EGS well reservoir temperature distribution after 80 years.
Figure 23.
Inclined EGS well reservoir temperature distribution after 80 years.
Figure 24.
Thermal and pressure dynamics in inclined EGS wells systems: profiles and projections.
Figure 24.
Thermal and pressure dynamics in inclined EGS wells systems: profiles and projections.
Figure 25.
Produced surface temperature comparison of closed-loop well configurations after 20 Years.
Figure 25.
Produced surface temperature comparison of closed-loop well configurations after 20 Years.
Table 1.
Input parameters for the reservoir and grid section.
Table 1.
Input parameters for the reservoir and grid section.
| Parameter |
Value |
| Porosity |
0.01 |
| Permeability |
1e-6 md |
| Water saturation |
100% |
| Hydrostatic gradient |
10 kPa/m |
| Rock compressibility |
4.35e-7 kPa-1 |
| Formation thermal conductivity |
252,720 J/(m·day·°C) |
| Formation volume heat capacity |
2,667,500 J/(m³·°C) |
| Working fluid volume capacity |
53,500 J/(m·day·°C) |
| Temperature gradient |
50 °C/km |
Table 2.
Component properties for simulation.
Table 2.
Component properties for simulation.
| Parameter |
Value |
| AVISC |
0.0047352 cp |
| BVISC |
1515.7 °C |
| Reference pressure |
61,000 kPa |
| Reference temperature |
300 °C |
| Surface pressure |
101 kPa |
| Surface temperature |
20 °C |
Table 3.
Parameters for initial conditions.
Table 3.
Parameters for initial conditions.
| Parameter |
Value |
| Reference pressure |
61,000 kPa |
| Reference depth |
6100 m |
Table 4.
Diameter specifications for FlexWells.
Table 4.
Diameter specifications for FlexWells.
| Well |
Wall inner diameter (ID) |
Wall outer diameter (OD) |
| Injector |
0.14 m |
0.152 m |
| Producer |
0.14 m |
0.152 m |
Table 5.
Well models temperature performance comparison.
Table 5.
Well models temperature performance comparison.
| Well Model |
Surface Temperature (°F) |
(°F)) |
| Pipe-in-Pipe |
143 |
+3 |
| Inclined V-Shaped |
179 |
+39 |
| U-Shaped |
182 |
+42 |
| V-Shaped |
185 |
+45 |
| U-Shaped (Fracked Closed) |
189 |
+49 |
| U-Shaped (Fracked Opened) |
225 |
+85 |
| Inclined EGS |
425 |
+285 |
| EGS |
446 |
+306 |
|
Disclaimer/Publisher’s Note: The statements, opinions and data contained in all publications are solely those of the individual author(s) and contributor(s) and not of MDPI and/or the editor(s). MDPI and/or the editor(s) disclaim responsibility for any injury to people or property resulting from any ideas, methods, instructions or products referred to in the content. |
© 2024 by the authors. Licensee MDPI, Basel, Switzerland. This article is an open access article distributed under the terms and conditions of the Creative Commons Attribution (CC BY) license (http://creativecommons.org/licenses/by/4.0/).
