Preprint
Article

Assessing Treatments to Mitigate End-Face Cracking in Air-Dried Acacia dealbata Logs

Altmetrics

Downloads

74

Views

25

Comments

0

A peer-reviewed article of this preprint also exists.

Submitted:

07 June 2024

Posted:

11 June 2024

You are already at the latest version

Alerts
Abstract
Acacia dealbata Link, named Mimosa in Portugal, is an invasive hardwood species with potential for construction use, but research is limited. The available stock of small-diameter juvenile wood (sjw) logs can help reduce this gap, but tangential cracking at log ends challenges fastener connections. This study evaluated different treatments to control and reduce end-face cracking in sjw logs during air drying, an economical and environmentally friendly procedure. Extreme two-thirds of sixteen Mimosa logs were subjected to two treatments: one with longitudinal kerfs 15 mm deep along the length (2 and 3 kerfs) and the other with a hollow in the centre up to half the length (16 mm and 30 mm diameters). Over 219 days of air drying and compared with the central part, kerfing treatments significantly reduced outer wood tangential cracking (p < 0.001), with the 3-kerf also reducing crack numbers (p < 0.05) but increasing significantly cracks near the pith (p < 0.01). The 30 mm central hollow significantly reduced central perforation cracking (p < 0.05). Results suggest that a combined treatment approach could help mitigate cracking, enhancing the suitability of wild Mimosa logs for construction use.
Keywords: 
Subject: Engineering  -   Architecture, Building and Construction

1. Introduction

Acacia dealbata Link, commonly known as Mimosa in Portugal, is a hardwood species native to Australia. It is highly invasive due to its rapid growth rate and prolific seed production [1], significantly increasing fuel loads in colonized native forests [2,3]. According to the national forest inventory [4], the area covered by species of the Acacia genus, unlike other forest species such as Pinus pinaster Link, increased by 3.7 ha between 1995 and 2005 and now occupies 8.4 thousand ha in continental Portugal. One control method is through harvesting, resulting in a potential residual reserve of mimosa.
Efforts to extract value from this species and offset operational costs have led researchers to explore various applications, such as fuel production [5], paper pulp [6], and textile dyeing [7]. On the other hand, the use of Mimosa in construction faces challenges due to its wild growth characteristics, including the predominance of young trees (10-20 years old) with irregular shapes and small transverse sections, which consequently yield low timber volume and limit its suitability for manufacturing boards and engineered wood products.
One promising avenue for integrating Mimosa into construction involves utilizing small-diameter juvenile wood (sjw hereafter) logs, a by-product of forest management supported by existing research [8,9,10]. Environmental, economic, and technical considerations advocate for the utilization of sjw due to its potential to diversify wood usage, prolong its lifespan beyond a mere primary by-product, and decrease energy consumption during processing, drying and transportation, as observed by Ramage et al. [11], rationalizing the supply chain and enhances environmental sustainability. Furthermore, Green et al. [12] and Larson et al. [13] have demonstrated that a low level of processing for sjw can be advantageous because it does not reduce the exterior resistant material (mature outer wood) and does not weaken the area surrounding the knots.
However, post-felling Mimosa s j w log often develops local cracks due to environmental interactions, which compromise durability, promote water accumulation, facilitate biological colonization, and increase susceptibility to fire by expanding the exposed perimeter. Studies suggest that the formation of cracks impacts the mechanical performance of beams [14] or connectors [15]. Furthermore, a high percentage of juvenile wood increases vulnerability to brittle failure and longitudinal shrinkage [16]. Evans [17] defines cracks resulting from drying stresses as "checks" or "splits," depending on their appearance on one or both sides of the wood piece respectively. Other definitions, such as "collapse" or "honeycomb," are associated with failures within the drying process [18]. Despite extensive research on cracking phenomena using small samples under controlled conditions [19,20], scale effects such as moisture content gradient (MCG) influence cracking in massive pieces like logs, primarily in the tangential plane [21].
Internal stresses from the drying process, alongside incidental stress tree growth [22] and internal factors like anisotropy or anatomical characteristics, contribute to cracking formation, further influencing susceptibility to cracking [19]. Control of environmental drying conditions, facilitated by appropriate kiln-drying protocols or pretreatments, can significantly reduce drying defects [23,24].
Due to the availability and yielding limitations of sjw Mimosa logs, a practical alternative is air-drying, which can be carried out in areas near the harvest. This reduces energy consumption in transportation and sawing [25], further improving the material’s environmental impact. Evans et al. [26] determined that the type of drying (air or kiln) does not significantly affect the formation of cracks in radiata and slash pine logs 125/150 mm in diameter and 700 mm in length. However, greater crack depths in air-dried logs were observed. The duration of air drying depends on the species, size (diameter and length), local environmental conditions of temperature and relative humidity during storage, and the time of year when stacking begins. In California, Simpson et al. [27] used air-dried Ponderosa pine and Douglas-fir logs with diameters ranging from 102 to 203 mm and lengths of 2.4 m, achieved moisture content values close to 20% in twenty days when starting in summer (July) and in one hundred forty days when starting in autumn (October). This also conditions the use of logs in construction, as achieving conventional moisture content values for use (around 12%, for example) requires longer drying times or the assistance of artificial drying to reach service values.
Some researchers have conducted comparative studies on various "destructive" treatments to reduce or control cracking in logs [26]. One approach involves "kerfing" on the outer surface to release drying stresses. This method includes options such as creating one or more cuts along or kerfing to a certain depth depending on the log diameter [28,29] or making numerous small incisions distributed regularly over the surface [17,28]. Another strategy entails drilling a central hollow along the entire length of the log [30,31], which reduces the thickness and humidity gradient while increasing the exposed surface area. However, Lim et al. [32] found that the complete removal of material may compromise load capacity, potentially leading to failure under punctual load conditions.
Despite limited studies, Acacia gender wood exhibits noteworthy physical-mechanical properties, underscoring its potential for diversifying the timber supply chain amidst increasing demand. In Portugal, Martins [33] obtains mean values of density 647 kg/ m 3 , 13,900 MPa of MOE, and a bending strength of 65 MPa for Acacia melanoxylon (Blackwood), demonstrating its applicability for Glulam. In Chile, a technical report from the Forestry Institute [34] reports mean density values of 495 kg/ m 3 , 11,515 MPa of MOE, and 65.7 MPa of flexural strength for Acacia dealbata, which are higher than those of the reference species for use in construction (Pinus radiata Link). Also, using conventional kiln-drying on 25 and 50-mm boards of Acacia melanoxylon and Acacia dealbata, Ananias et al. [35] achieved satisfactory results with wood free of cracks or “collapse”. These results present an opportunity to explore the suitability of Mimosa logs in truss structures, which utilize smaller, shorter (therefore, lighter) axially loaded components. However, controlling or reducing drying cracks is necessary, especially at the ends where connections are inserted.
This study aims to control and/or reduce cracks at the ends of wild sjw Mimosa logs by combining air drying with two treatments: longitudinal kerfing and central hollowing. It is part of a larger study to evaluate applicability in construction using low-processed air-dried logs.

2. Materials and Methods

2.1. Collection of sjw Logs

As an initial phase of a broader experimental campaign, logs of Acacia dealbataLink (hereafter referred to as Mimosa) were recollected from a large accumulation of timber waste originating from forest cleaning activities in northern Portugal. These logs were stored outdoors within the courtyard of a sawmill located in the city of Porto. The selection criteria for the logs prioritized obtaining stems with minimal sweep, devoid of visible outer surface damage, and possessing intact bark. Sixteen sjw logs of mimosa, aged between 14 and 19 years and approximately 2000 mm long, were chosen for the study. The diameter of each log, measured using an electronic calliper with a precision of 0.01 mm, ranged from a maximum of 121 mm to a minimum of 67 mm, all exhibiting irregular cross-sectional shapes. The bark was retained until natural detachment occurred. Within the sawmill facility, the ends were enveloped in polyethene film to mitigate moisture loss.
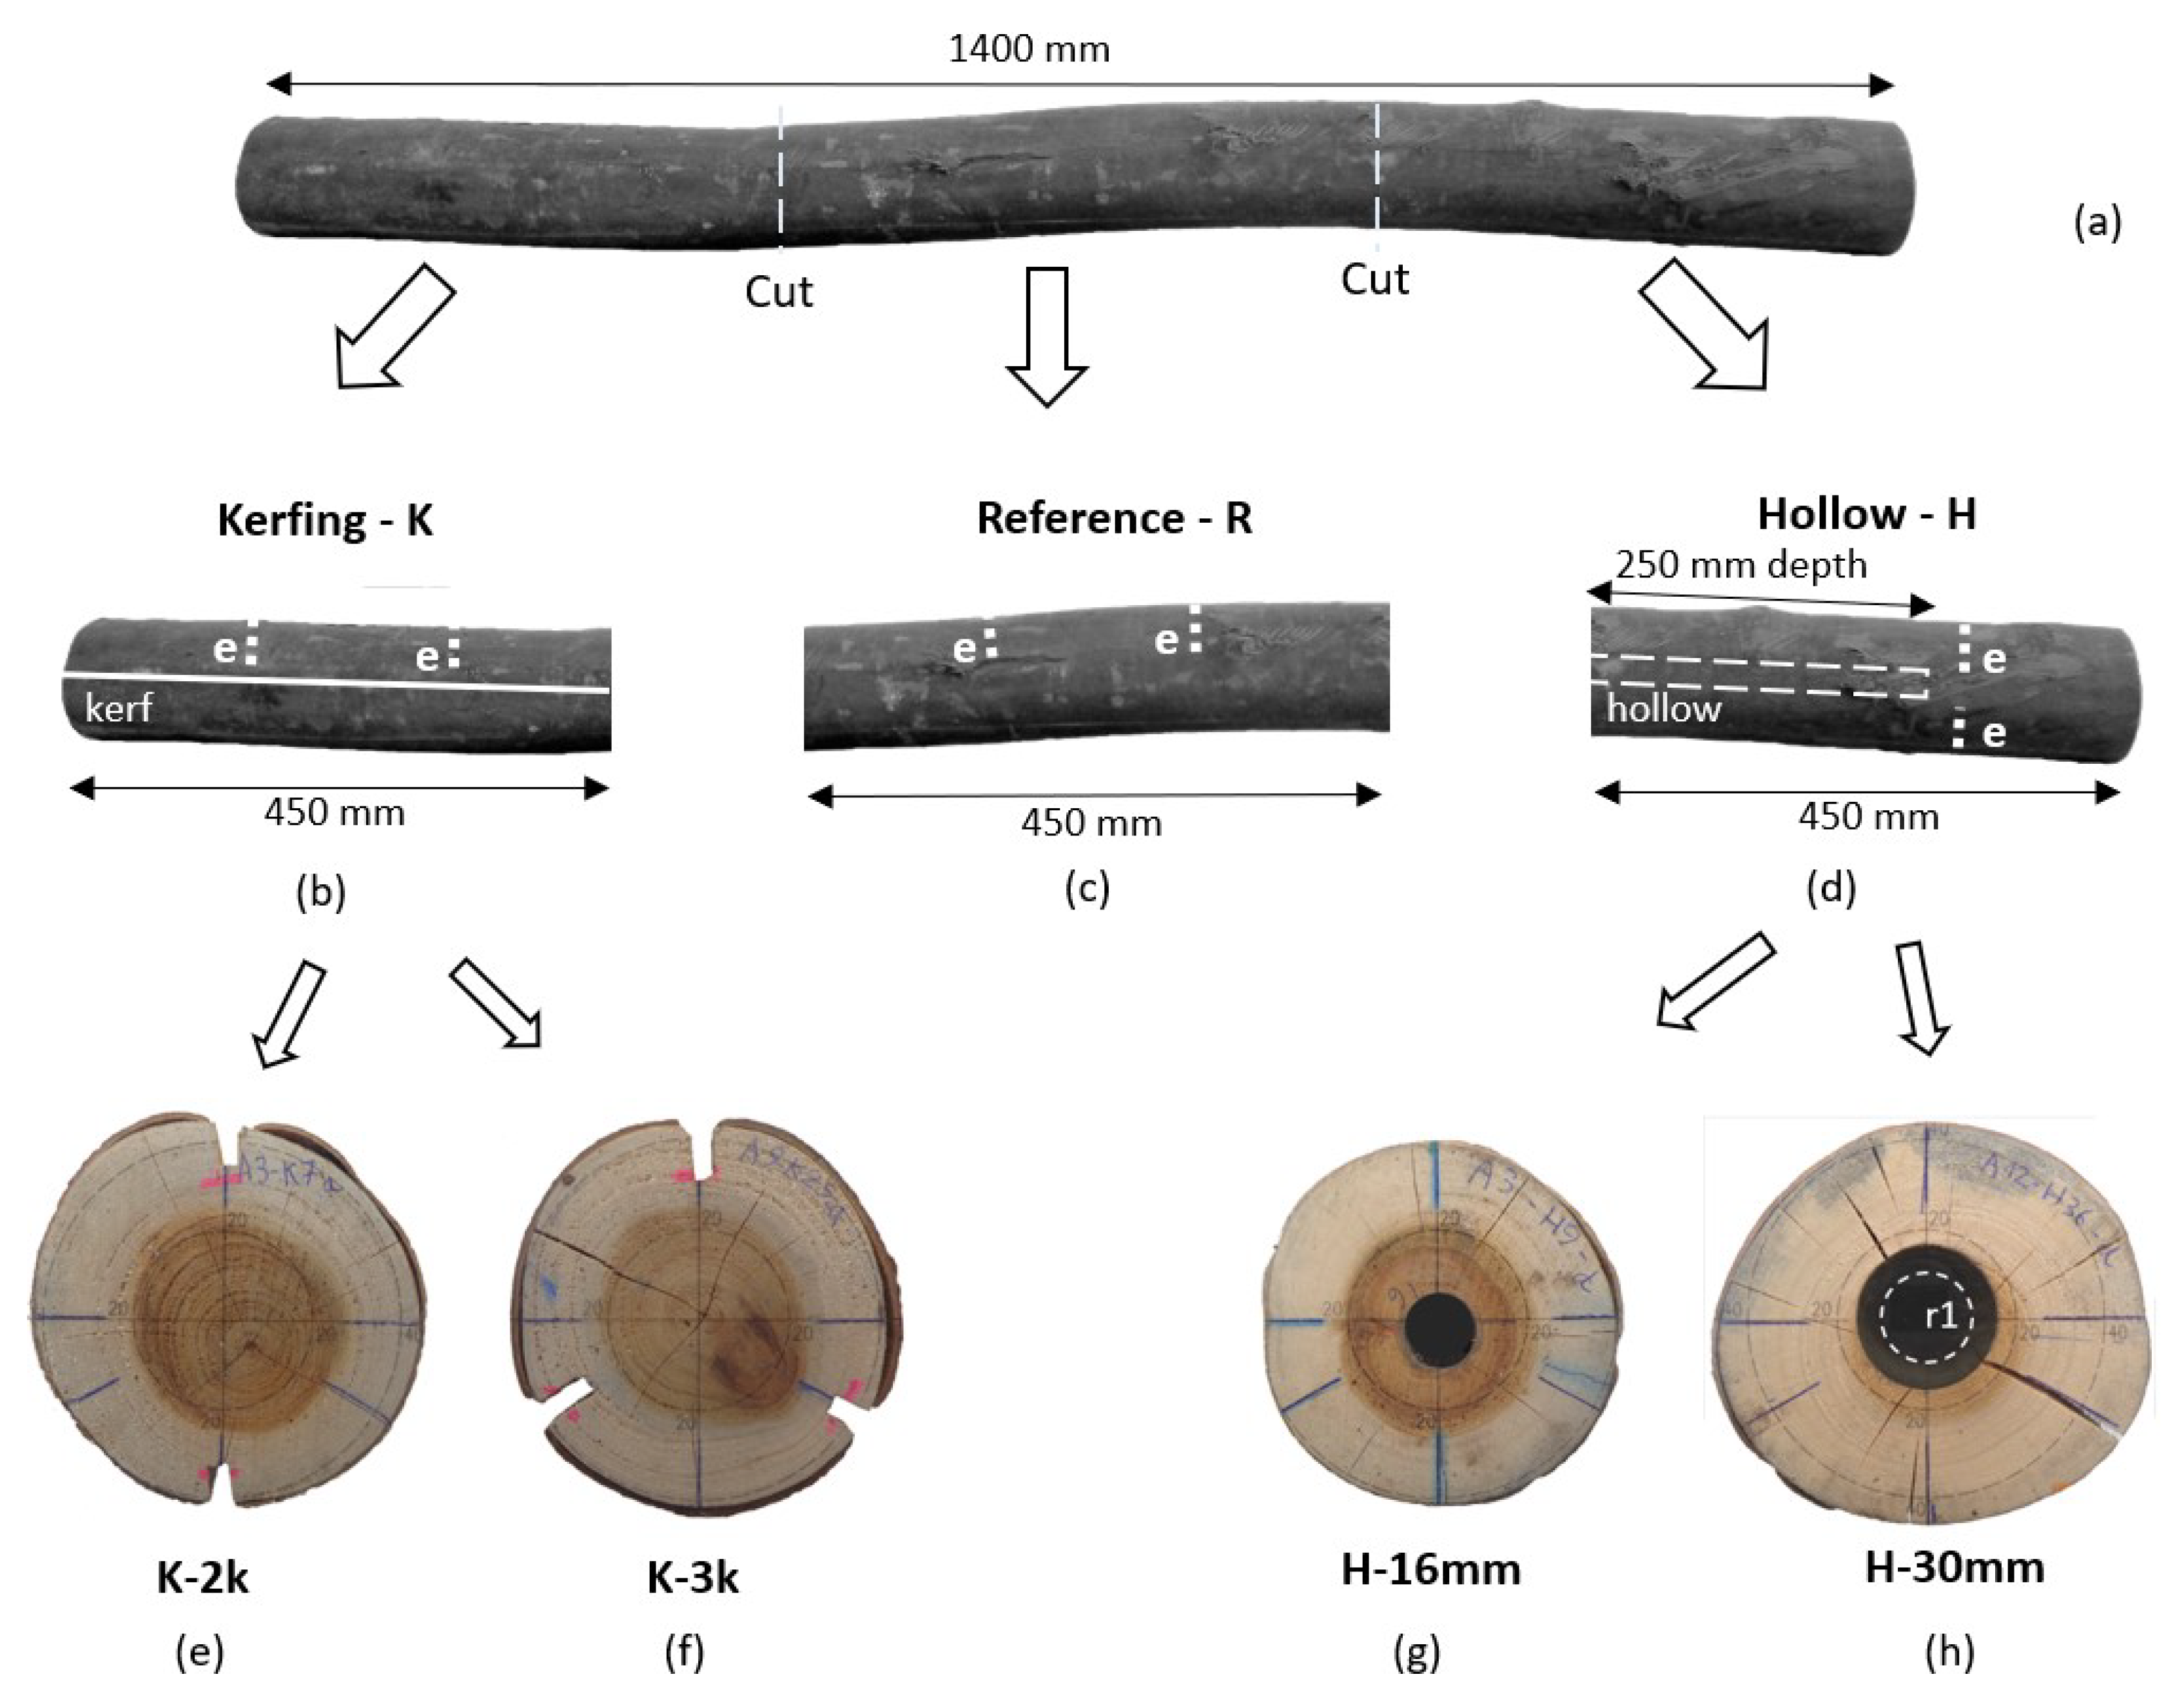
Figure 1. Sample Preparation Layout. (a) Initial Log and Division into Three Sample Types: (b) Logs with kerfing along their length - K; (c) Logs without any treatment - R; and (d) Logs with a central hollow -H. The letter "e" indicates electrode pair locations to measure moisture content. Variations for the Two Types of Treatments: (e) 2k, Two kerfs along the length of the log; (f) 3k, Three kerfs along the length of the log; (g) 16mm, central hollow of 16 mm in diameter; and (h) 30mm, central hollow of 30 mm in diameter.
Preprints 108722 g001

2.2. Samples Preparation

A reference line was drawn along the entire length of each log, and then 2 to 3 cm were trimmed from each end. Subsequently, each log was divided into three samples of 450 mm each, as depicted in Figure 1(a). Three treatments were carried out. Kerfing cuts (K) 15 mm deep were carried out throughout the upper sample’s overall length, as Figure 1(b) shows. The central sample, shown in Figure 1(c), remained untreated and served as the reference (R). In the bottom segment, a central hollow (H) was created as depicted in Figure 1(d) by drilling with a drill bit positioned at the geometric centre of the section.
The manual kerfs treatment was made along the samples with a 3 mm width saw disc and involved the two variations depicted in Figure 1(e) and (f). Similarly, the hollowing treatment (H) was executed with two variations shown in Figure 1(g) and (h). Partial drilling was conducted until 250 mm depth, ensuring no compromise to the specimen integrity.

2.3. Air-Drying of the Samples

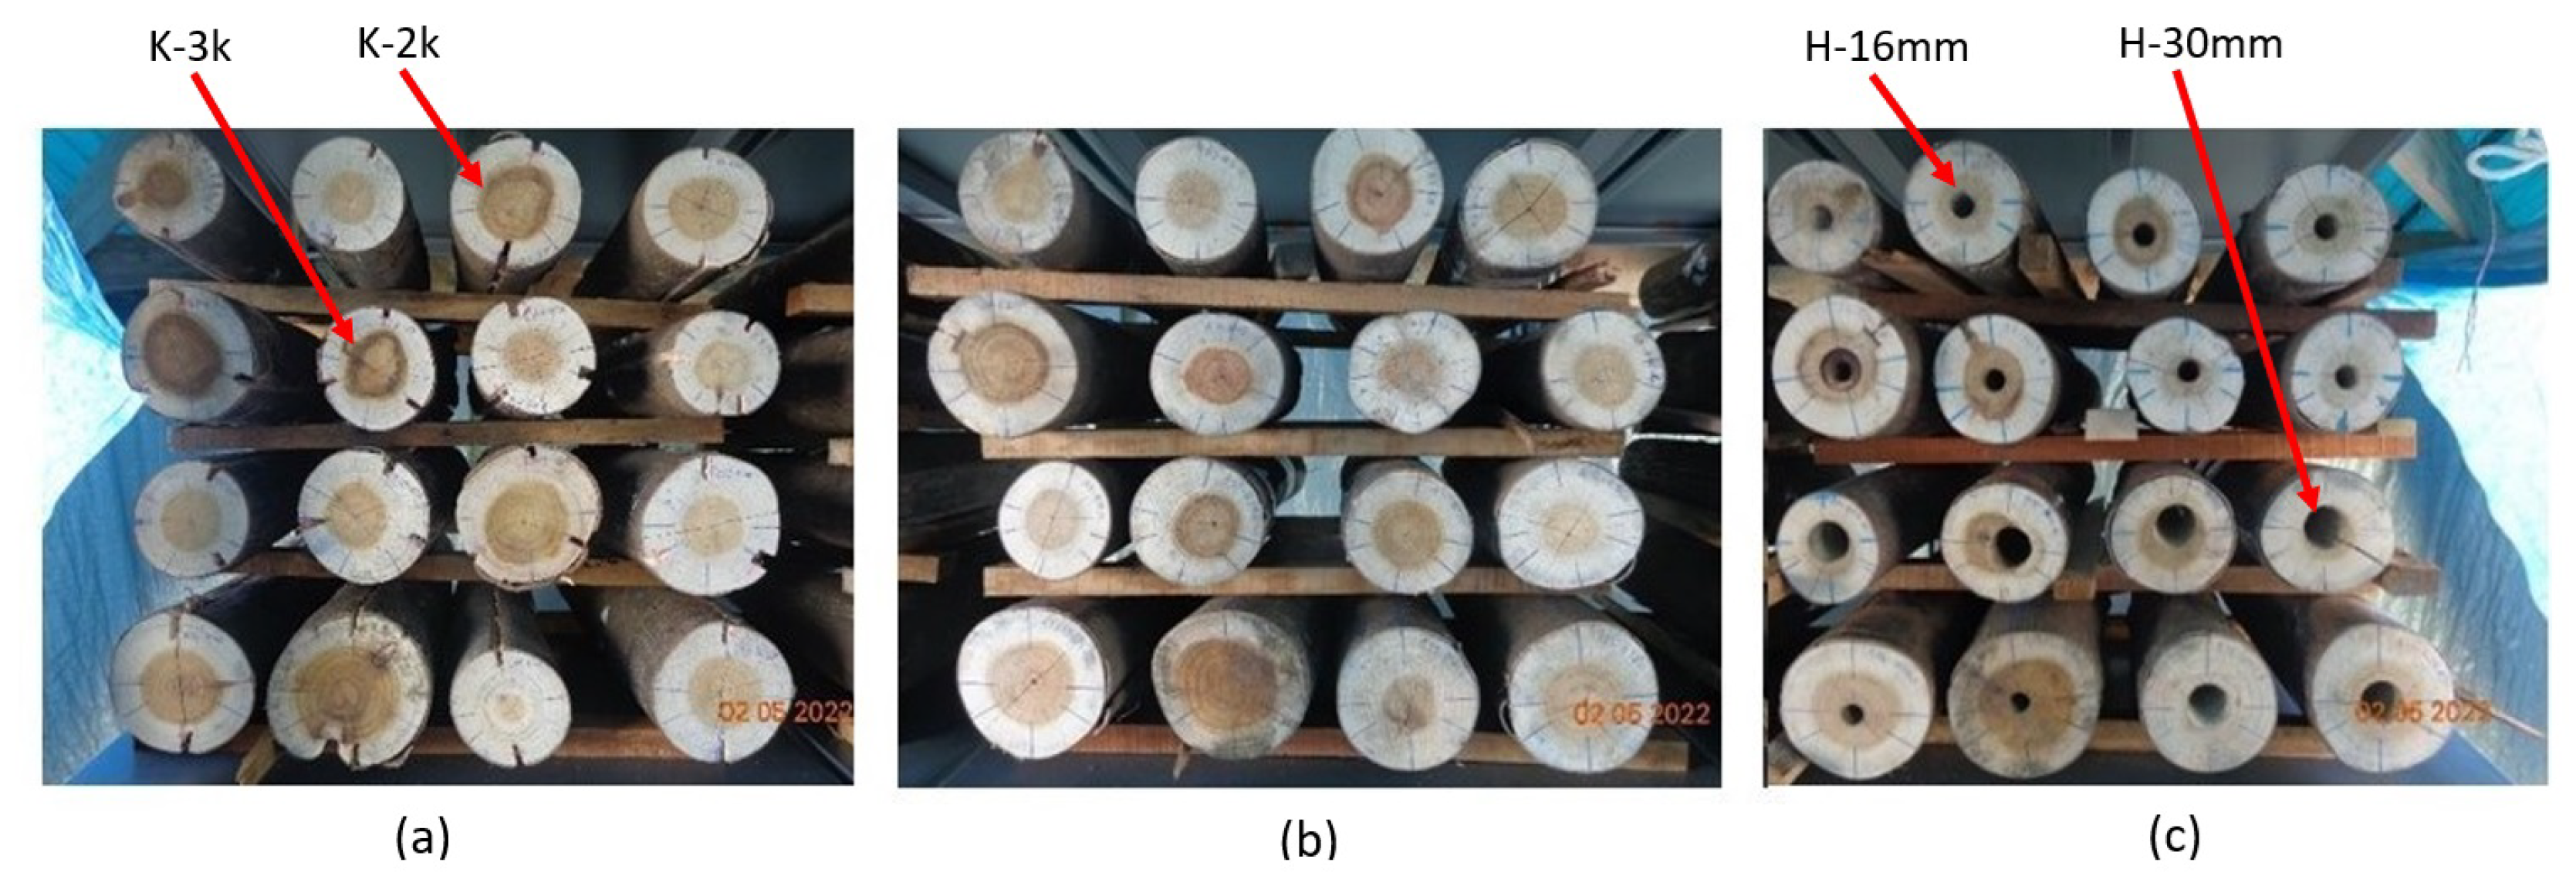
The forty-eight specimens (16 x 3) underwent air-drying on the terrace of the IB-S building at the University of Minho, Guimarães (41°27’11.6"N 8°17’26.7"W) from early February to the first week of September 2022. Periodic temperature (T) and relative humidity (RH) measurements were recorded using a mark Govee brand thermo-hygrometer device. An elevated area was established approximately one meter above the ground level, shielded from rain and direct radiation, according to class 3.1 defined by standard EN 335-2: 2007. No additional treatments were applied, such as sealing or burning over the end faces of the logs. The samples were stacked with a horizontal gap of 20 mm between them and elevated by 20 mm using dry wooden strips, as depicted in Figure 2(a), (b), and (c).
For moisture content (MC) measurement, an electrical resistance hygrometer, the Protimeter SurveyMaster® BLD5365, was employed. The hygrometer was positioned over two electrode heads inserted into each specimen, localised as indicated by the letter "e" in Figure 1(b), (c) and (d). These electrodes are made of screws coated with insulating tape, penetrated to a depth of 20 mm, burying the screw tip into the specimen. Each pair of electrodes was inserted perpendicular to the wood fibres into pre-drilled holes less than 20 mm deep and spaced 30 mm apart. Subsequently, they were securely screwed in place, and their heads were sealed with silicone. Additionally, each specimen’s mass (m) was measured using an electronic scale manufactured by the Steinberg brand, with a maximum capacity of 50 kg and a reading precision of 1 g. To calibrate the hygrometer readings, 16 slices were extracted from the central part of the reference specimen (R). These slices were saturated with water and then stored in a climatic chamber maintained at 20 ± 0.5°C and a relative humidity of 60 ± 5%. There, regular mass and moisture content measurements were conducted using the hygrometer until a constant mass was achieved. MC was determined with the dry weight for each measurement following the BS EN 13183-1:2002 standard. The mean wood density adjusted to 12% moisture content ( ρ 12 ) was determined according to ISO 3131.

2.4. Measurement of Cracking on Log End-Faces

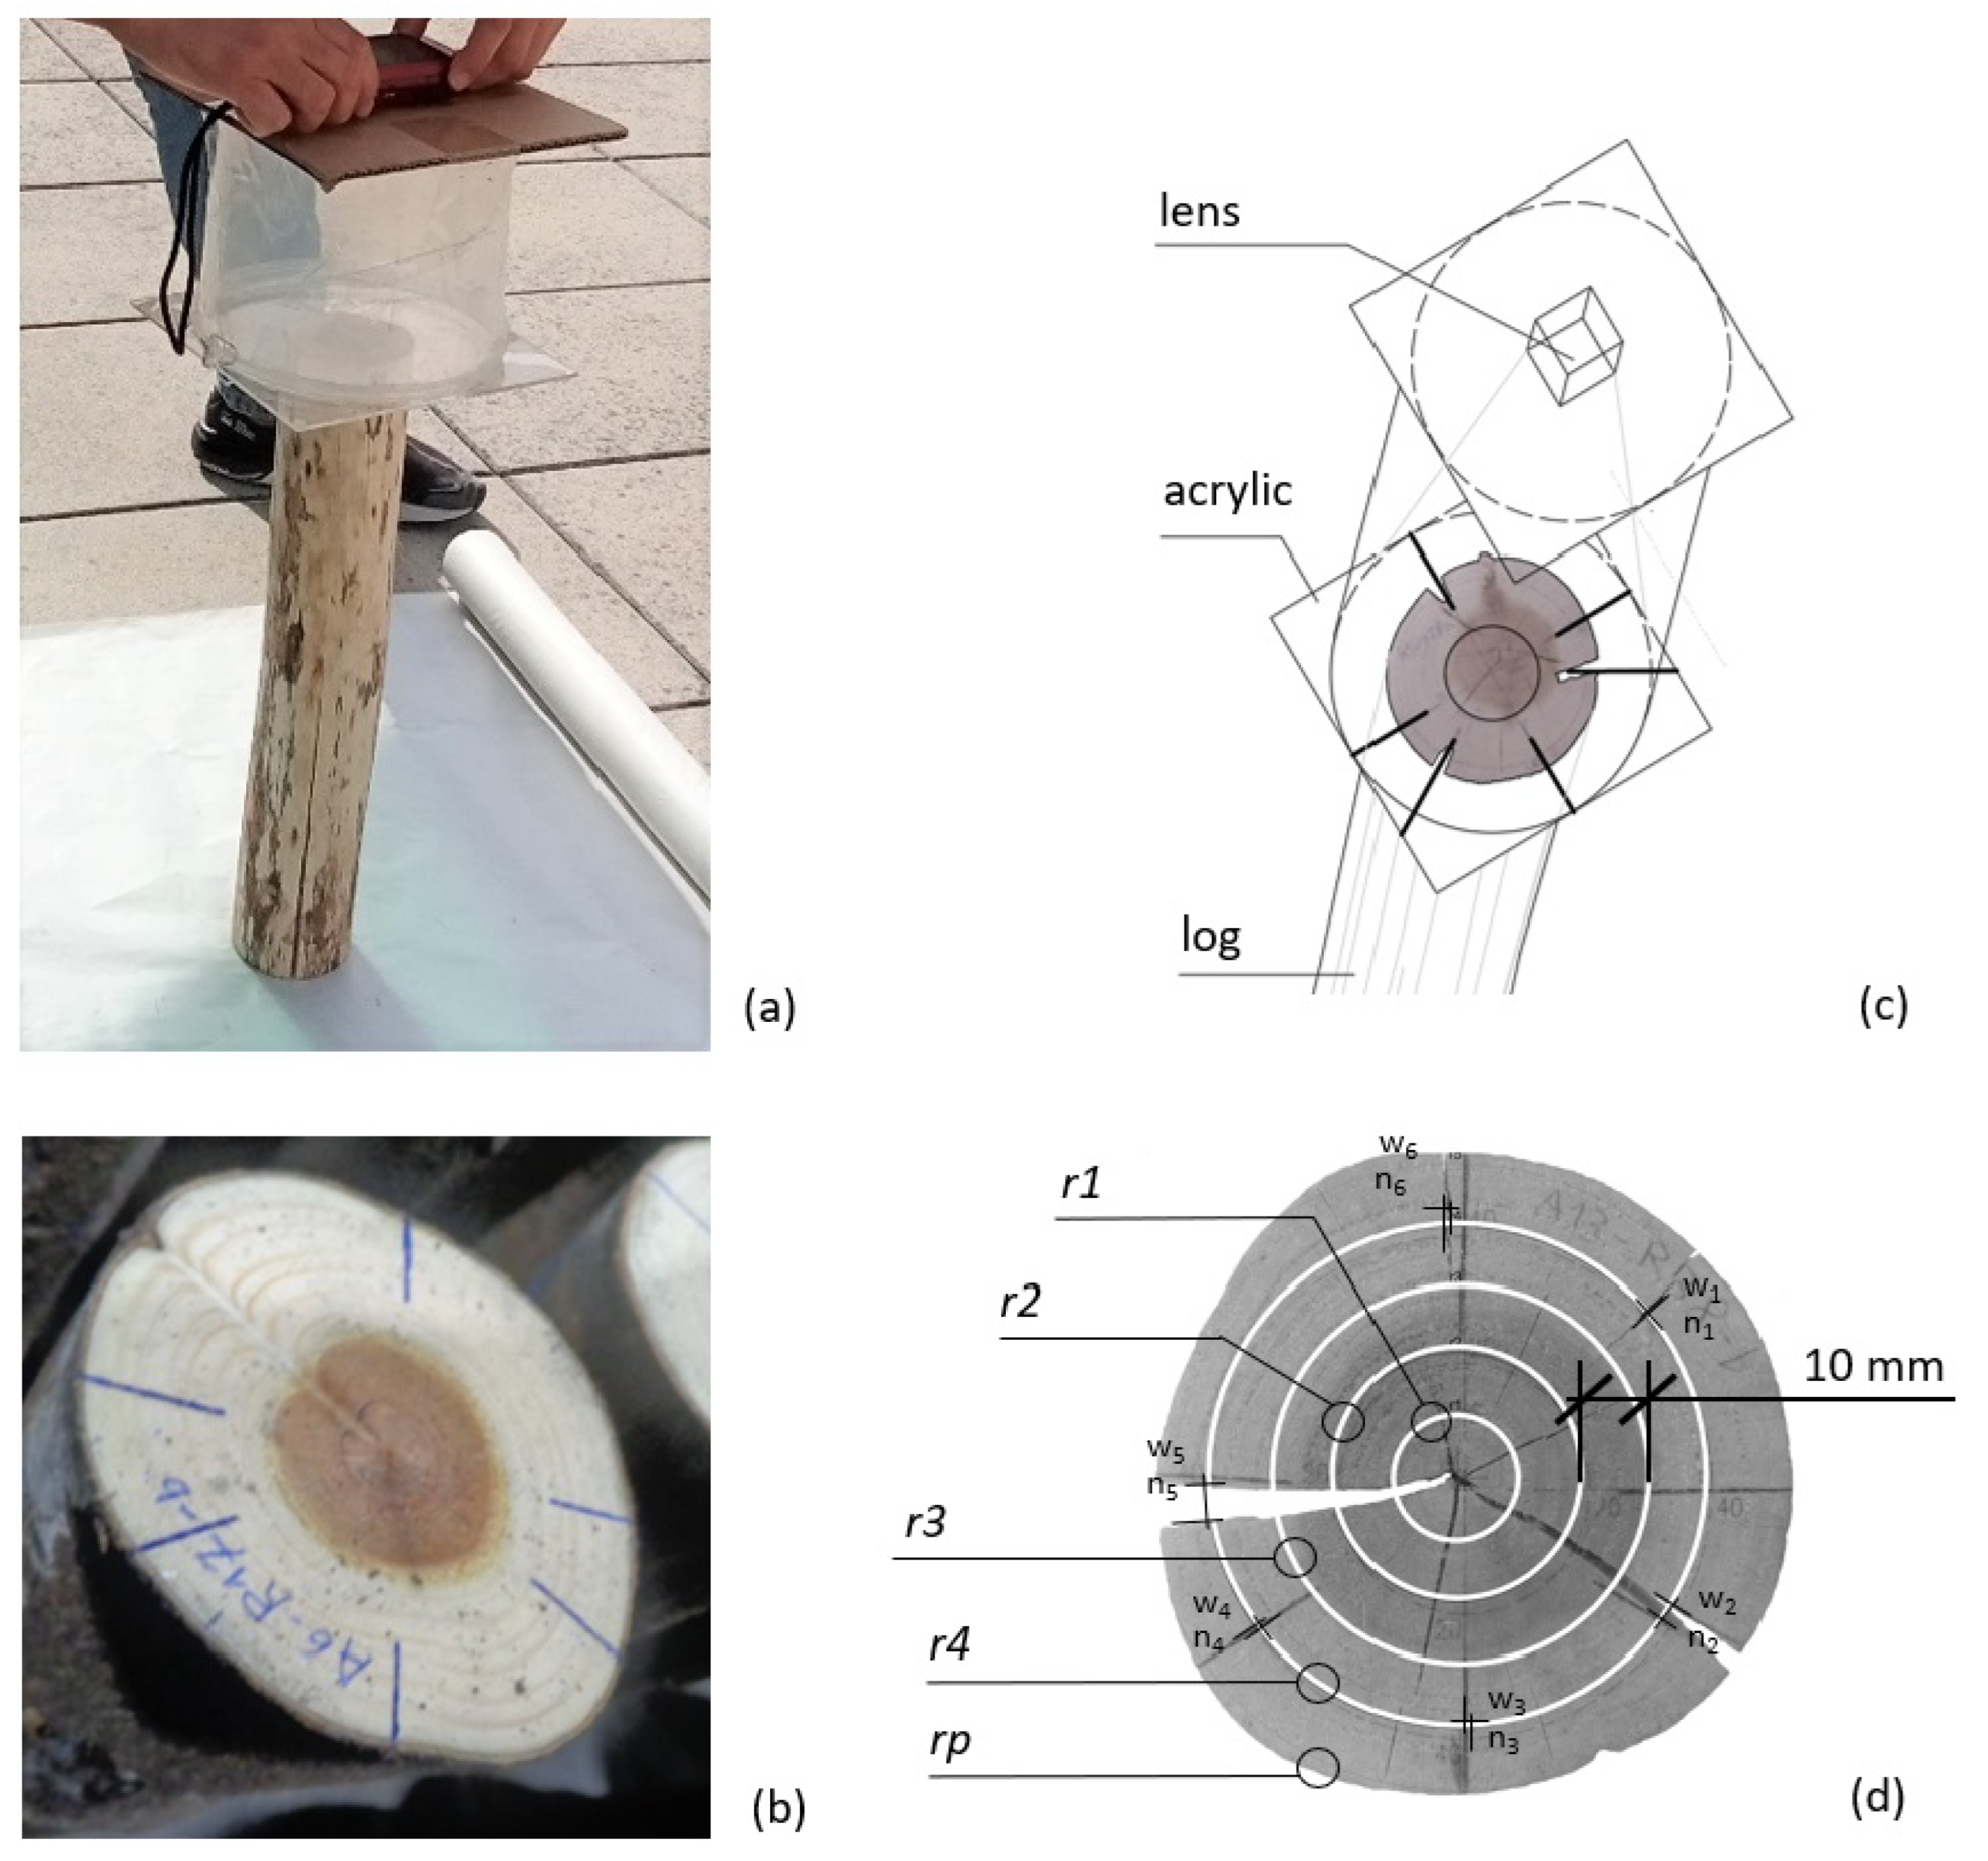
To capture the formation of cracks on the end faces of logs, photographs were taken at regular intervals (every two weeks) using a Sony DSC-H90 digital camera with a resolution of 350 dpi. As Figure 3(a) indicates, the camera lens was kept 200 mm orthogonal from the log end-face. The orthogonal reference axes drawn on the end face of the log shown in Figure 3(b) were overlaid on a transparent acrylic plate marked with axes and scale references, as illustrated in Figure 3(c). Subsequently, the captured images were oriented and scaled to produce TIFF format images over a CAD file as Figure 3(d) is shown.
A pattern of circular concentric rings centred on the pith was superimposed onto the CAD file to study the formation of tangential cracks on the end face. Image analysis was performed using the freely available software ImageJ, which has been used in other reference studies [36,37]. As shown in Figure 3(d), separated each 10 mm, 3 or 4 rings (depending on size) were overlaid: ring 1, named r1; ring 2, named r2; ring 3, named r3; ring 4, named r4; and like last ring, the perimeter without bark, named rp. For each ring, intersections between visible cracks and the rings were counted, and the width of each intersection was measured with a tolerance of ± 0.5 mm. Non-perpendicular crack axes were measured at their minimal width. Based on this data, the following two parameters were defined in lowercase letters.
The relative cracking value c r , measured as a percentage (%), calculated using the formula:
c r = Σ w c P r 100
Where Σ w c is the sum of all widths of tangential cracks, and P r is the perimeter of the corresponding circular ring and for rp, is the perimeter of log without bark. For instance, in Figure 3(d), c r of ring 4 is the sum of w 1 + w 2 + ..., divided by the perimeter of ring 4, P r 4 , expressed as a percentage.
And the second one is the relative number of cracks n r , corresponding to the number of cracks per decimeter ( n d m ), defined as:
n r = n c P r d m
Where n c is the total number of cracks, and P r is the perimeter of the corresponding circular ring and for rp, is the perimeter of log without bark. For example, in Figure 3(d), n r of ring 4 is the total number of cracks, n 1 + n 2 + ..., divided by the perimeter of ring 4, P r 4 , expressed as the number of cracks per decimeter.
Some adaptations were made for each specific treatment. In the kerfing technique (K), the total sum of crack widths was recorded and analysed separately to evaluate the specific effect of the kerfs. For this analysis, the width of the saw blades used was subtracted from the total crack width: for 2 kerfs (2k), 6 mm was subtracted, and for 3 kerfs (3k), 9 mm was subtracted. In the case of the central hollow technique (H), the centre for concentric rings was not the pith but rather the centre of the perforation. Additionally, for the H-30mm variant, ring 1 (r1) was excluded from the measurements.

2.5. Experimental Design and Statistical Analysis

A descriptive statistical analysis was performed to analyze response variables across all end faces studied. Mean values were compared using t-tests. The assumptions of normality were verified using the Shapiro-Wilk test, and the equality of variance was assessed using the Levene test. All tests were conducted at a 95% confidence level and were executed using Excel’s Real Statistics tool. To compare the cr and n°r response variables on each ring an analysis of variance (ANOVA) was employed, followed by post-hoc group comparisons using Tukey’s Honestly Significant Difference (HSD) test at a 95% confidence level. These analyses were conducted using RStudio [38].
Table 1 summarizes the experimental design. The first row indicates the total number of samples. The second row specifies the number of untreated/treated end-face pairs. The last row shows the end-face variations studied for each treatment.

3. Results

3.1. Cracking Formation During Air-Drying

3.1.1. Evolution of Environmental Conditions and Moisture Content (MC)

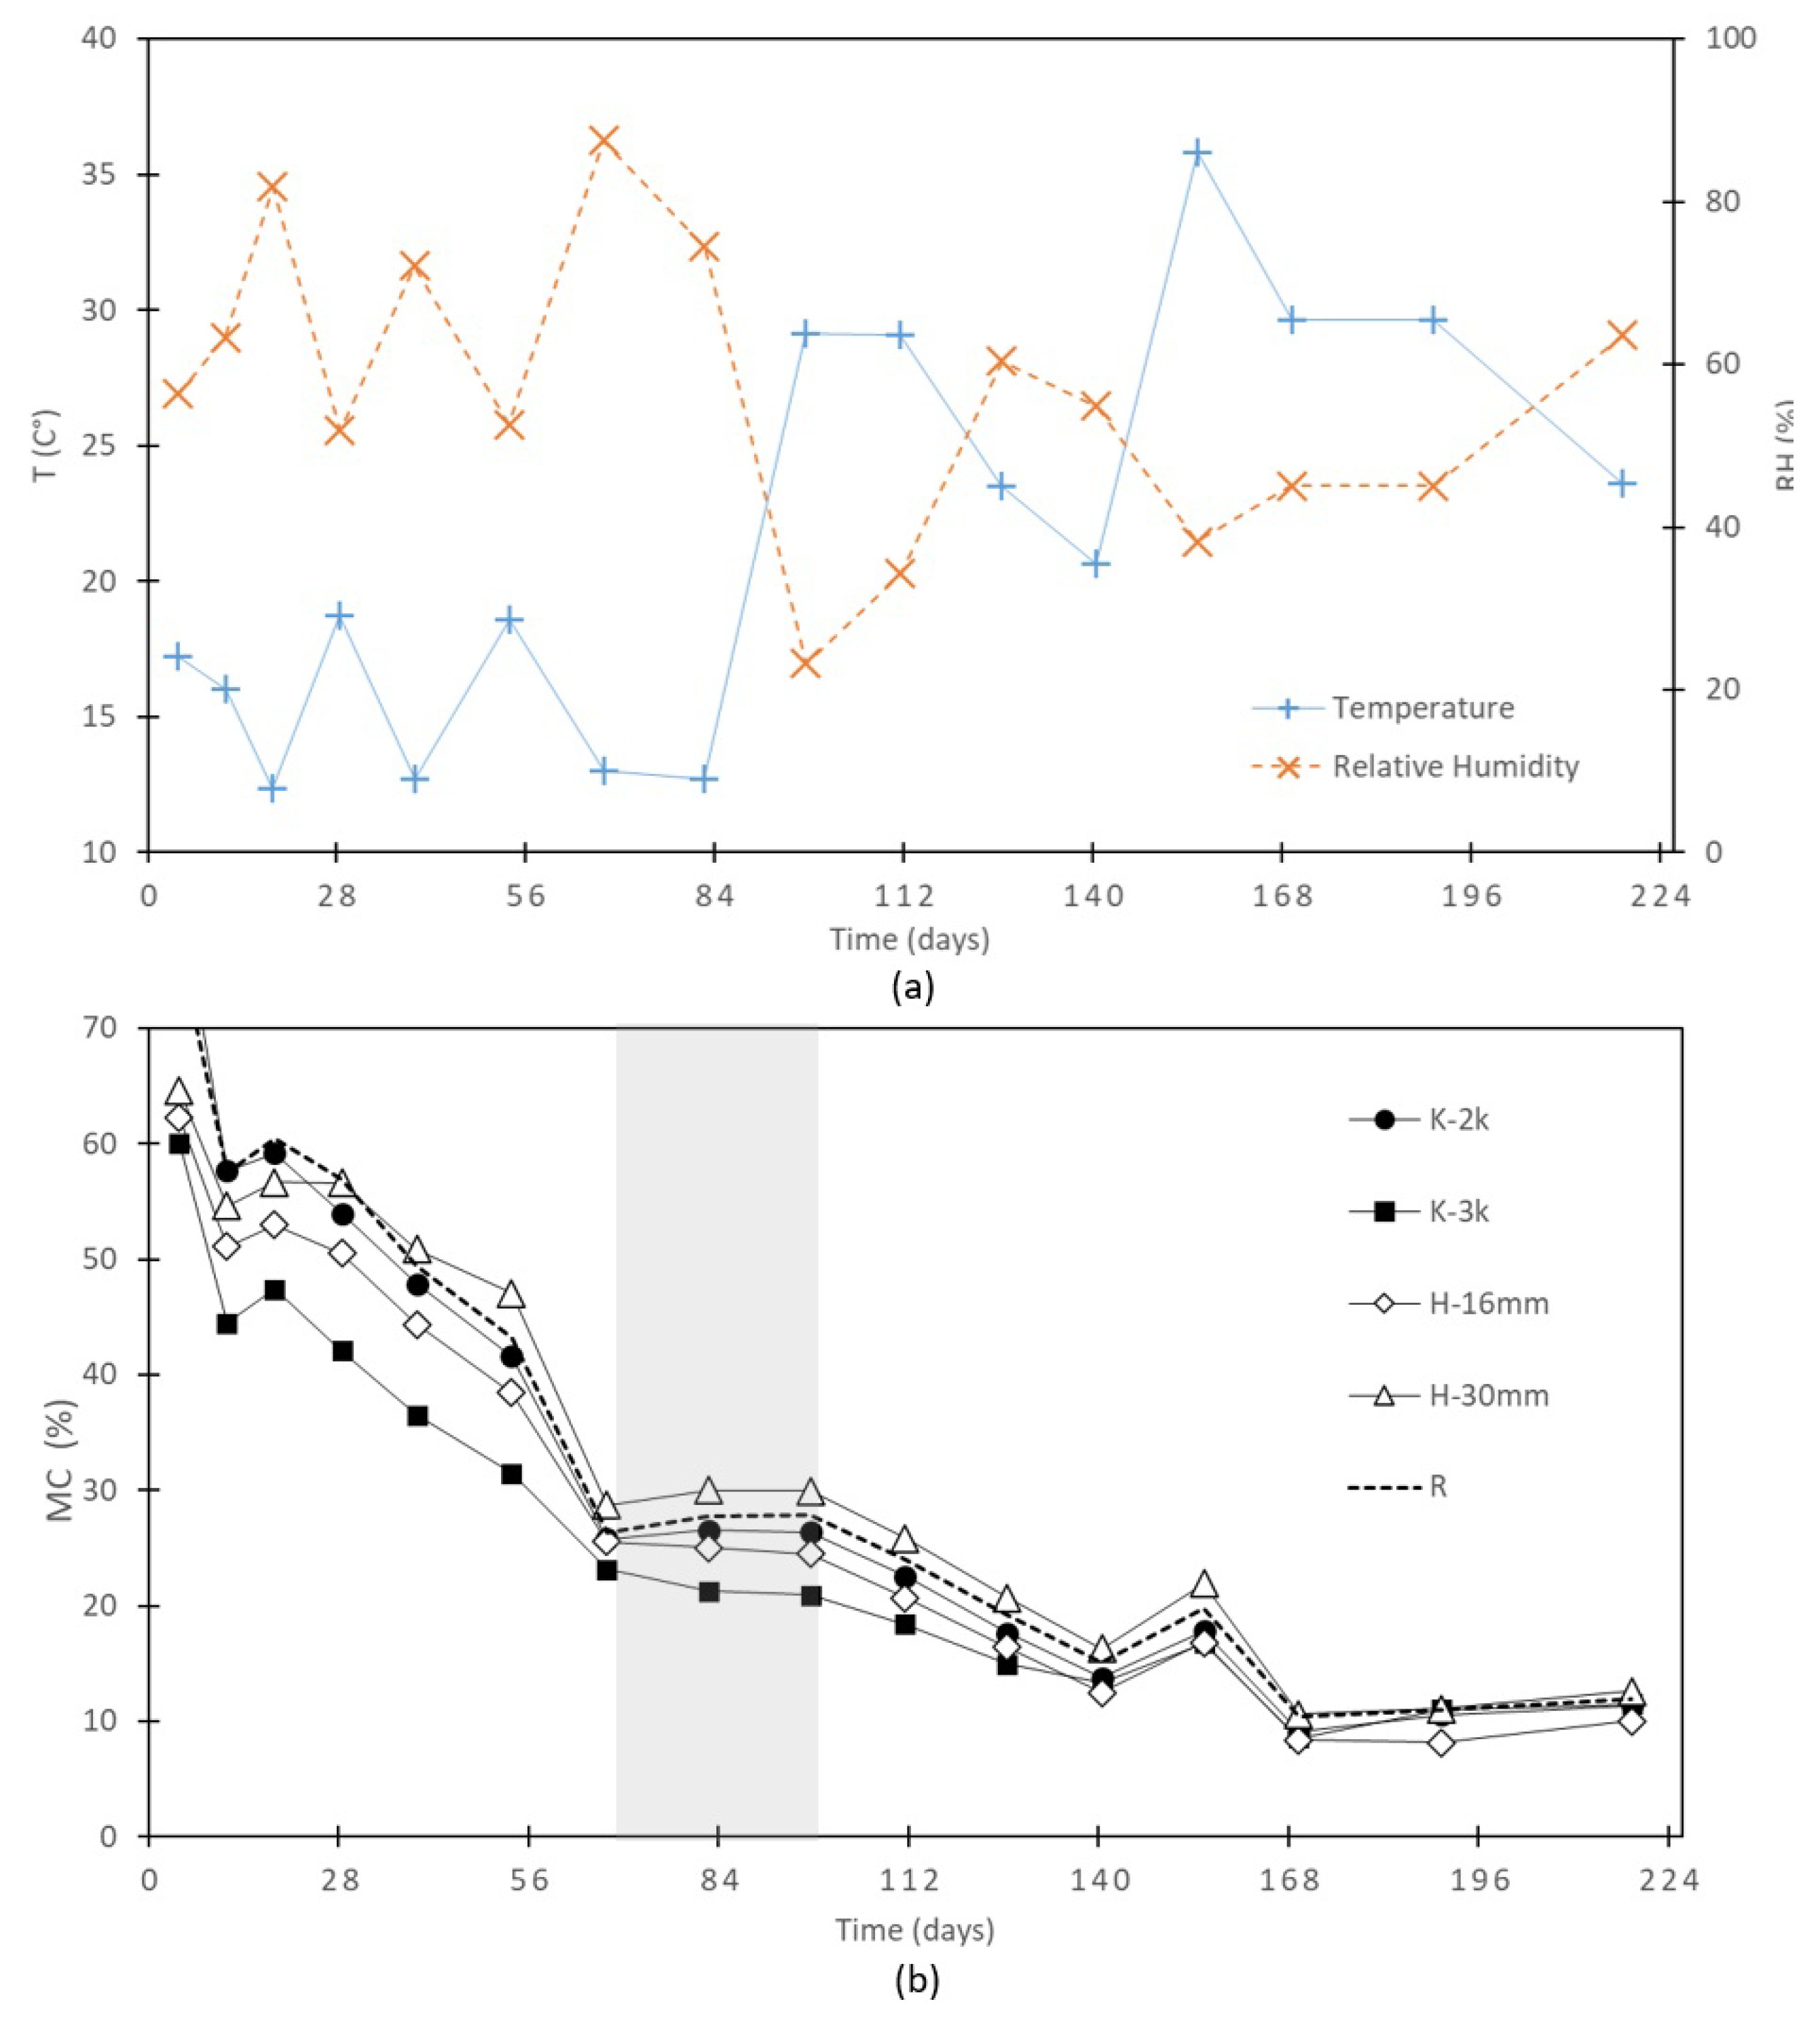
Figure 4(a) delineates the temporal evolution of environmental parameters, and Figure 4(b) shows the mean variation in Moisture Content. The calibrated Equilibrium Moisture Content (EMC) was achieved when a consistent value approximating 11.94% (standard deviation, SD = 2.18) was attained for reference samples and 11.45% (SD = 2.10) when treated specimens were included.
In the initial period by Figure 4(b), the saturated samples evaporated surface water. They reduced their moisture content (MC) until approaching the fibre saturation point, FSP (approximately 30%) at a rate of 4% to 6% every 10 days. Following this, the MC curves entered a relatively stable phase lasting about 30 days, which coincided with a change in environmental conditions characterized by an increase in temperature and a decrease in relative humidity. After this plateau, a decline in MC began at a slower rate of 1% to 2% every 10 days, eventually reaching values close to 15%. This transition period, between the loss of free water and the start of the loss of bound water, slows the air-drying process until the wood approaches equilibrium moisture content (EMC). In all samples, MC temporarily increased, coinciding with an exceptional temperature rise and a relative humidity decrease. After this event, MC continued to decline until reaching the EMC. This behaviour suggests that the drying environment’s characteristics and the wood’s hygroscopic properties determine the drying rate [39,40].
The density value adjusted to 12% humidity, ρ 12 , was 573.3 kg m 3 (SD = 31.76). Campos et al. [34] report a lower value, 495 kg m 3 (SD = 72.10), in Acacia dealbata logs of 360 mm diameter (dbh), around 15 years old, from the southern part of Chile. Although higher, another reference value is that indicated by Machado et al. [41], of 654.0 kg m 3 for Acacia melanoxylon Link logs between 33-51 years old, 400 mm diameter (dbh), from four sites in Portugal.
Figure 4. Time evolution graphs: (a) variation in environmental conditions, and (b) variation in mean moisture content (MC) for reference (R) and treatment samples. The grey area indicates the transition from an MC corresponding to the fibre saturation point (FSP) close to 30% until the drop below this value begins.
Preprints 108722 g004

3.1.2. Evolution of Cracking over end-faces

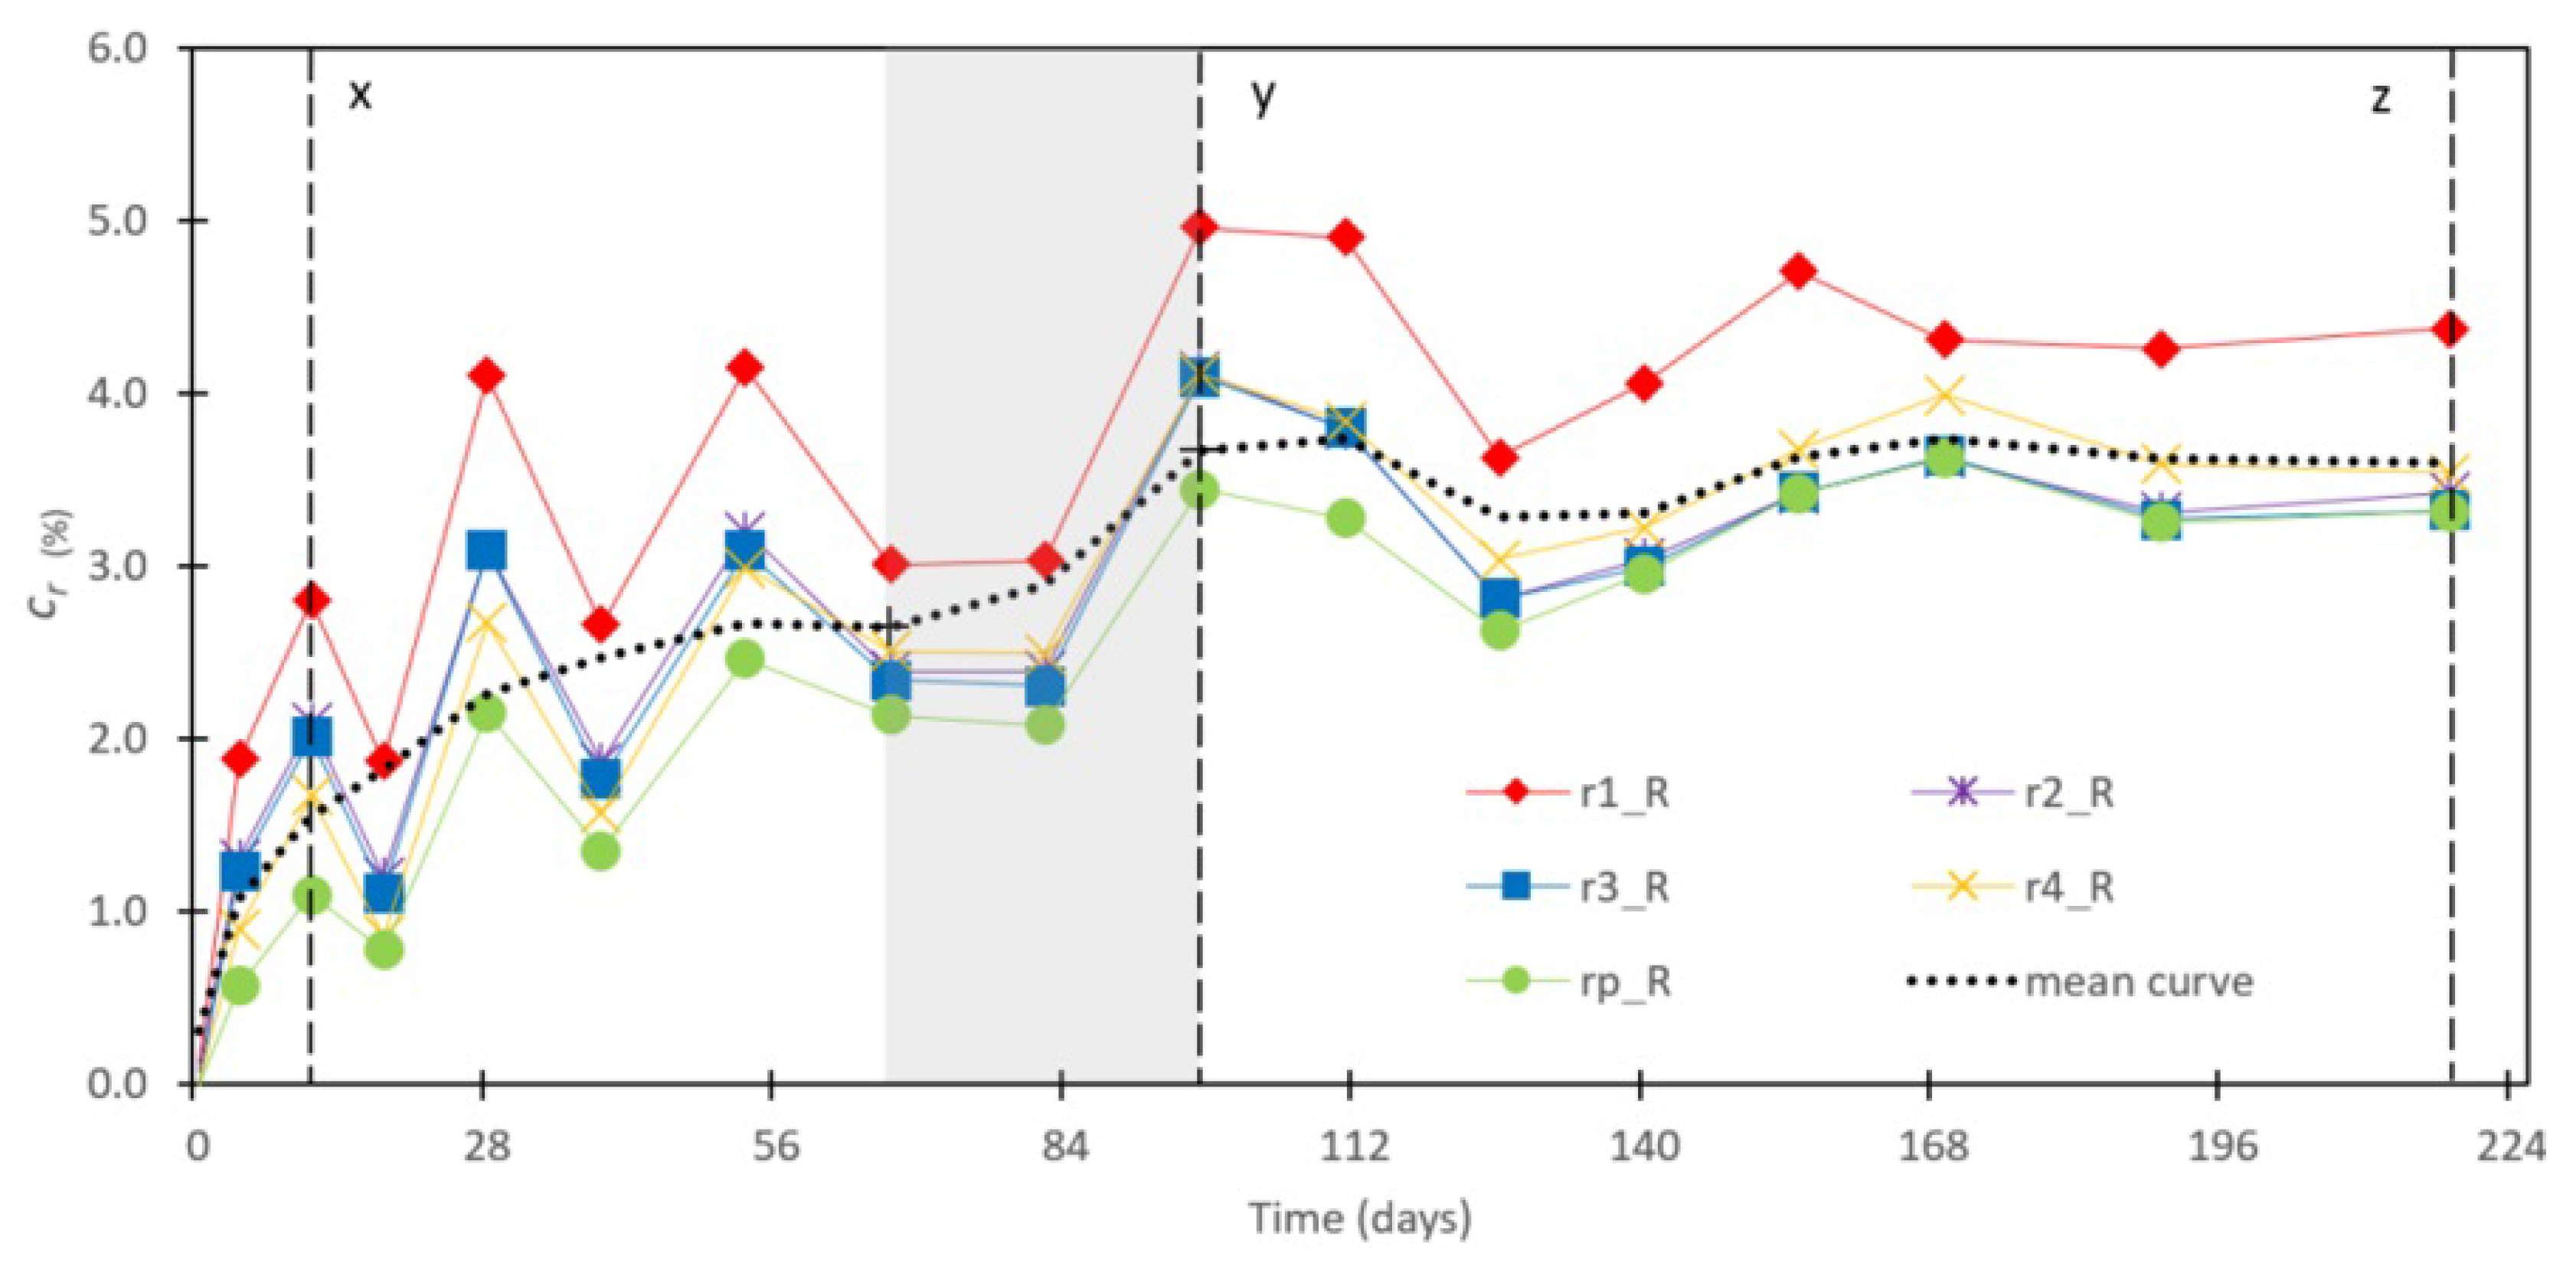
During the monitoring phase, visible macroscopic cracking manifested and progressed. Figure 5 illustrates the evolution of each ring’s mean relative cracking variable ( c r ) for 30 end-faces of fifteen reference samples (R). Log number 8 was excluded from all the c r analyses due to exceptional splitting-type cracking, likely associated with releasing growth stresses. Ring 4 ( r 4 ) measurements were restricted to the larger diameter logs, comprising half of the specimens, totalling eight samples and 16 end faces. Initial minor cracking was disregarded to ensure data comparability and align measurements with a zero-reference point.
Figure 5 exhibits a cracking pattern related to temperature fluctuations and inversely related to relative humidity levels. Peaks in c r coincide with the maximum temperatures and minimum relative humidity of Figure 4 (a). During these episodes, environmental conditions drive the water within the log to evaporate the surface water, which emerges in the exposed fibres of the log end-faces. The humidity differential between the exterior and interior causes the shrinkage of the external fibres, forming cracks. Subsequent temperature decreases and humidity increases reverse this process, causing the fibres and, consequently, the cracks to swell and close. Ultimately, these alternating cycles of shrinkage and tangential swelling reflect environmental fluctuations. Some of these cracks do not close and consolidate as permanent cracks on the end face of the log. The mean curve of Figure 5 shows a general upward development until the fibre saturation point, FSP (indicated in the figure with a grey transparent area), after which the cycle stabilizes in a more or less constant development until the end of the process when EMC is reached.
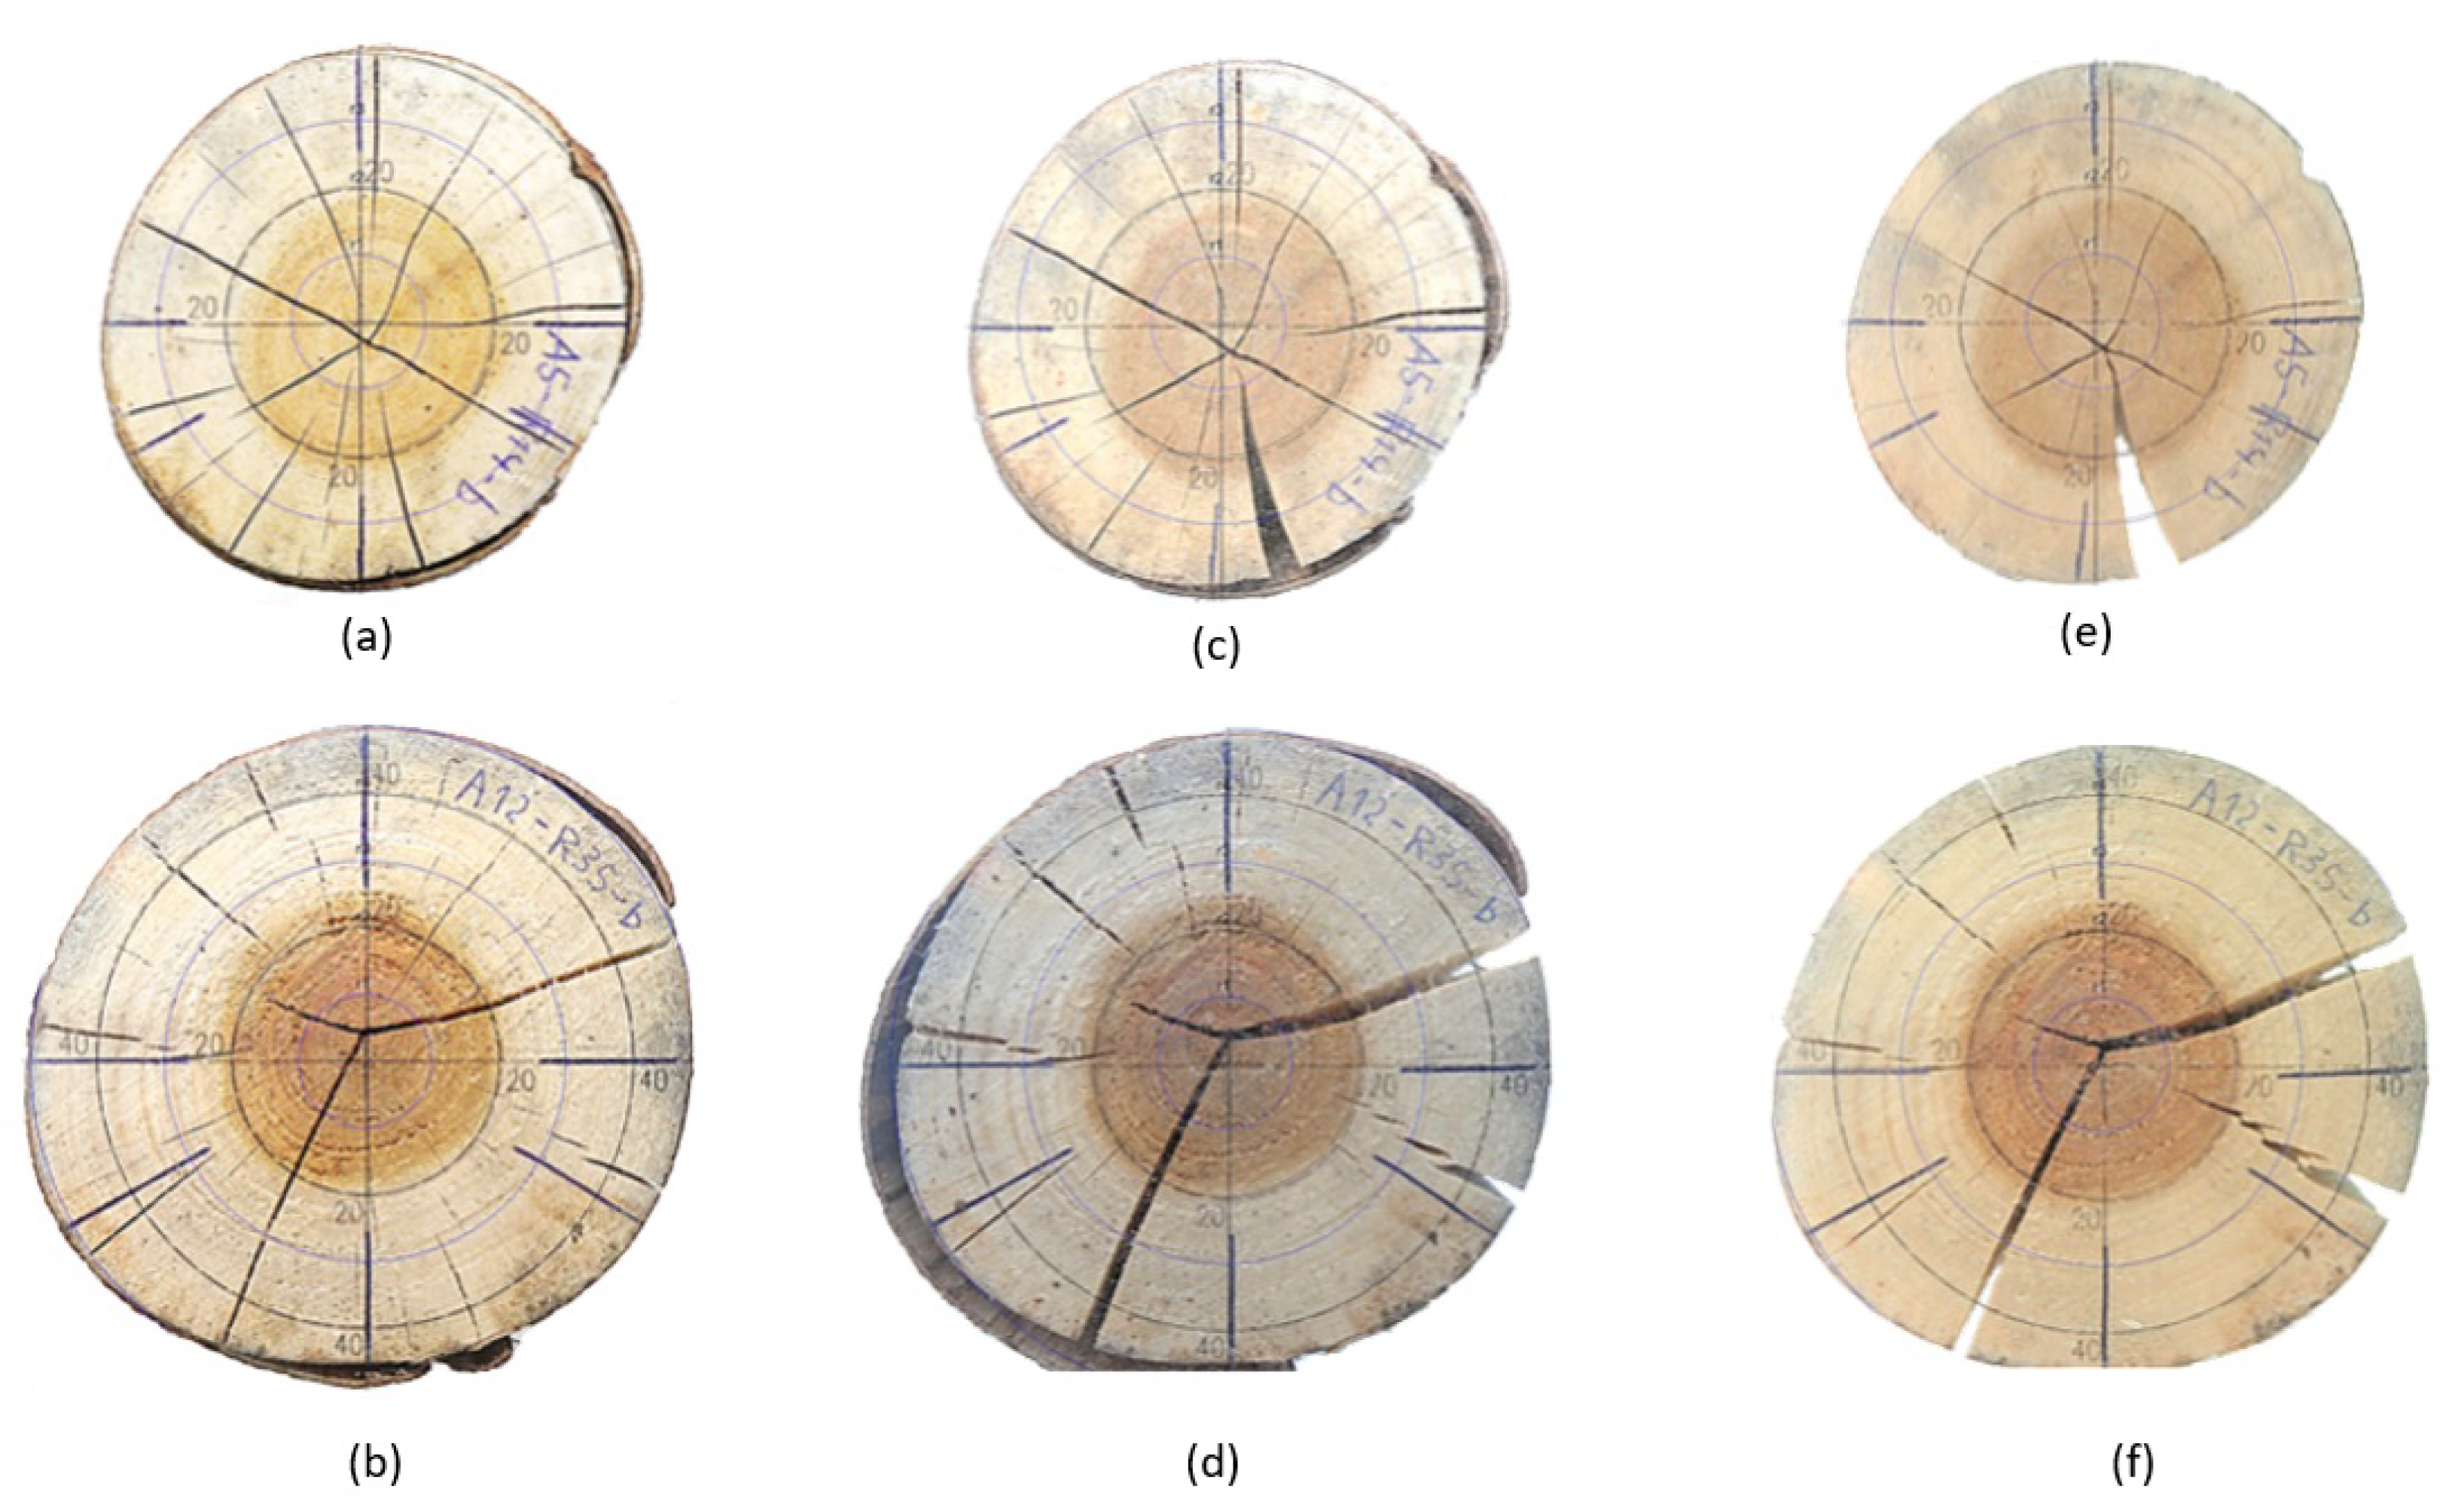
To illustrate crack formation over time, Figure 5 points three relevant measurement points, considering only reference samples (R). The three measurement moments are shown in Figure 5 as the "x," "y," and "z" axes. The initial point, "x," corresponds to ten days after the first measurement. The next point, "y," aligns with the peak of relative cracking (max c r ), which occurs almost one hundred days after the initial measurement. Point "z" represents the final measurement taken nearly two hundred and ten days after the initial measurement. These points are exemplified by pictures in Figure 6 of 2 representative specimens.
At the onset of the air-drying process, when moisture content surpasses the FSP, the exposed faces serve as the primary interfaces for moisture exchange, owing to some degree of bark confinement. Consequently, a moisture gradient initiates the formation of widespread radial cracks from the pith, as depicted in Figure 6 (a) and (b). As air-drying progresses and the bonded area of the bark gradually diminishes, some cracks undergo differentiation, forming splits or checks. As evidenced in Figure 6 (d) and (e), while some diminish to become imperceptible to the naked eye, others become more pronounced. With the loss of bark, this process is consolidated, and these biggest cracks capture a significant percentage of the total number of cracks, especially the smaller ones, as inferred from Figure 6 (g) and (h).

3.1.3. Treatment Performance

To compare the different treatments concerning their reference samples described above, a dimensionless reduction indicator, i r e d , is defined as the ratio:
i r e d = c r ( R ) c r ( K , H )
Where c r ( R ) is the relative cracking for the reference samples (R), and c r ( K , H ) corresponds to the mean c r value for their respective treated samples, either Kerfing (K) or Hollowing (H). Values close to unity indicate no differences between untreated and treated samples. Due to errors in sample preparation, the number of end-face pair variants for the central hollowing treatment (H) was adjusted, resulting in 10 treatment variations of H-16 mm and 6 of H-30 mm.
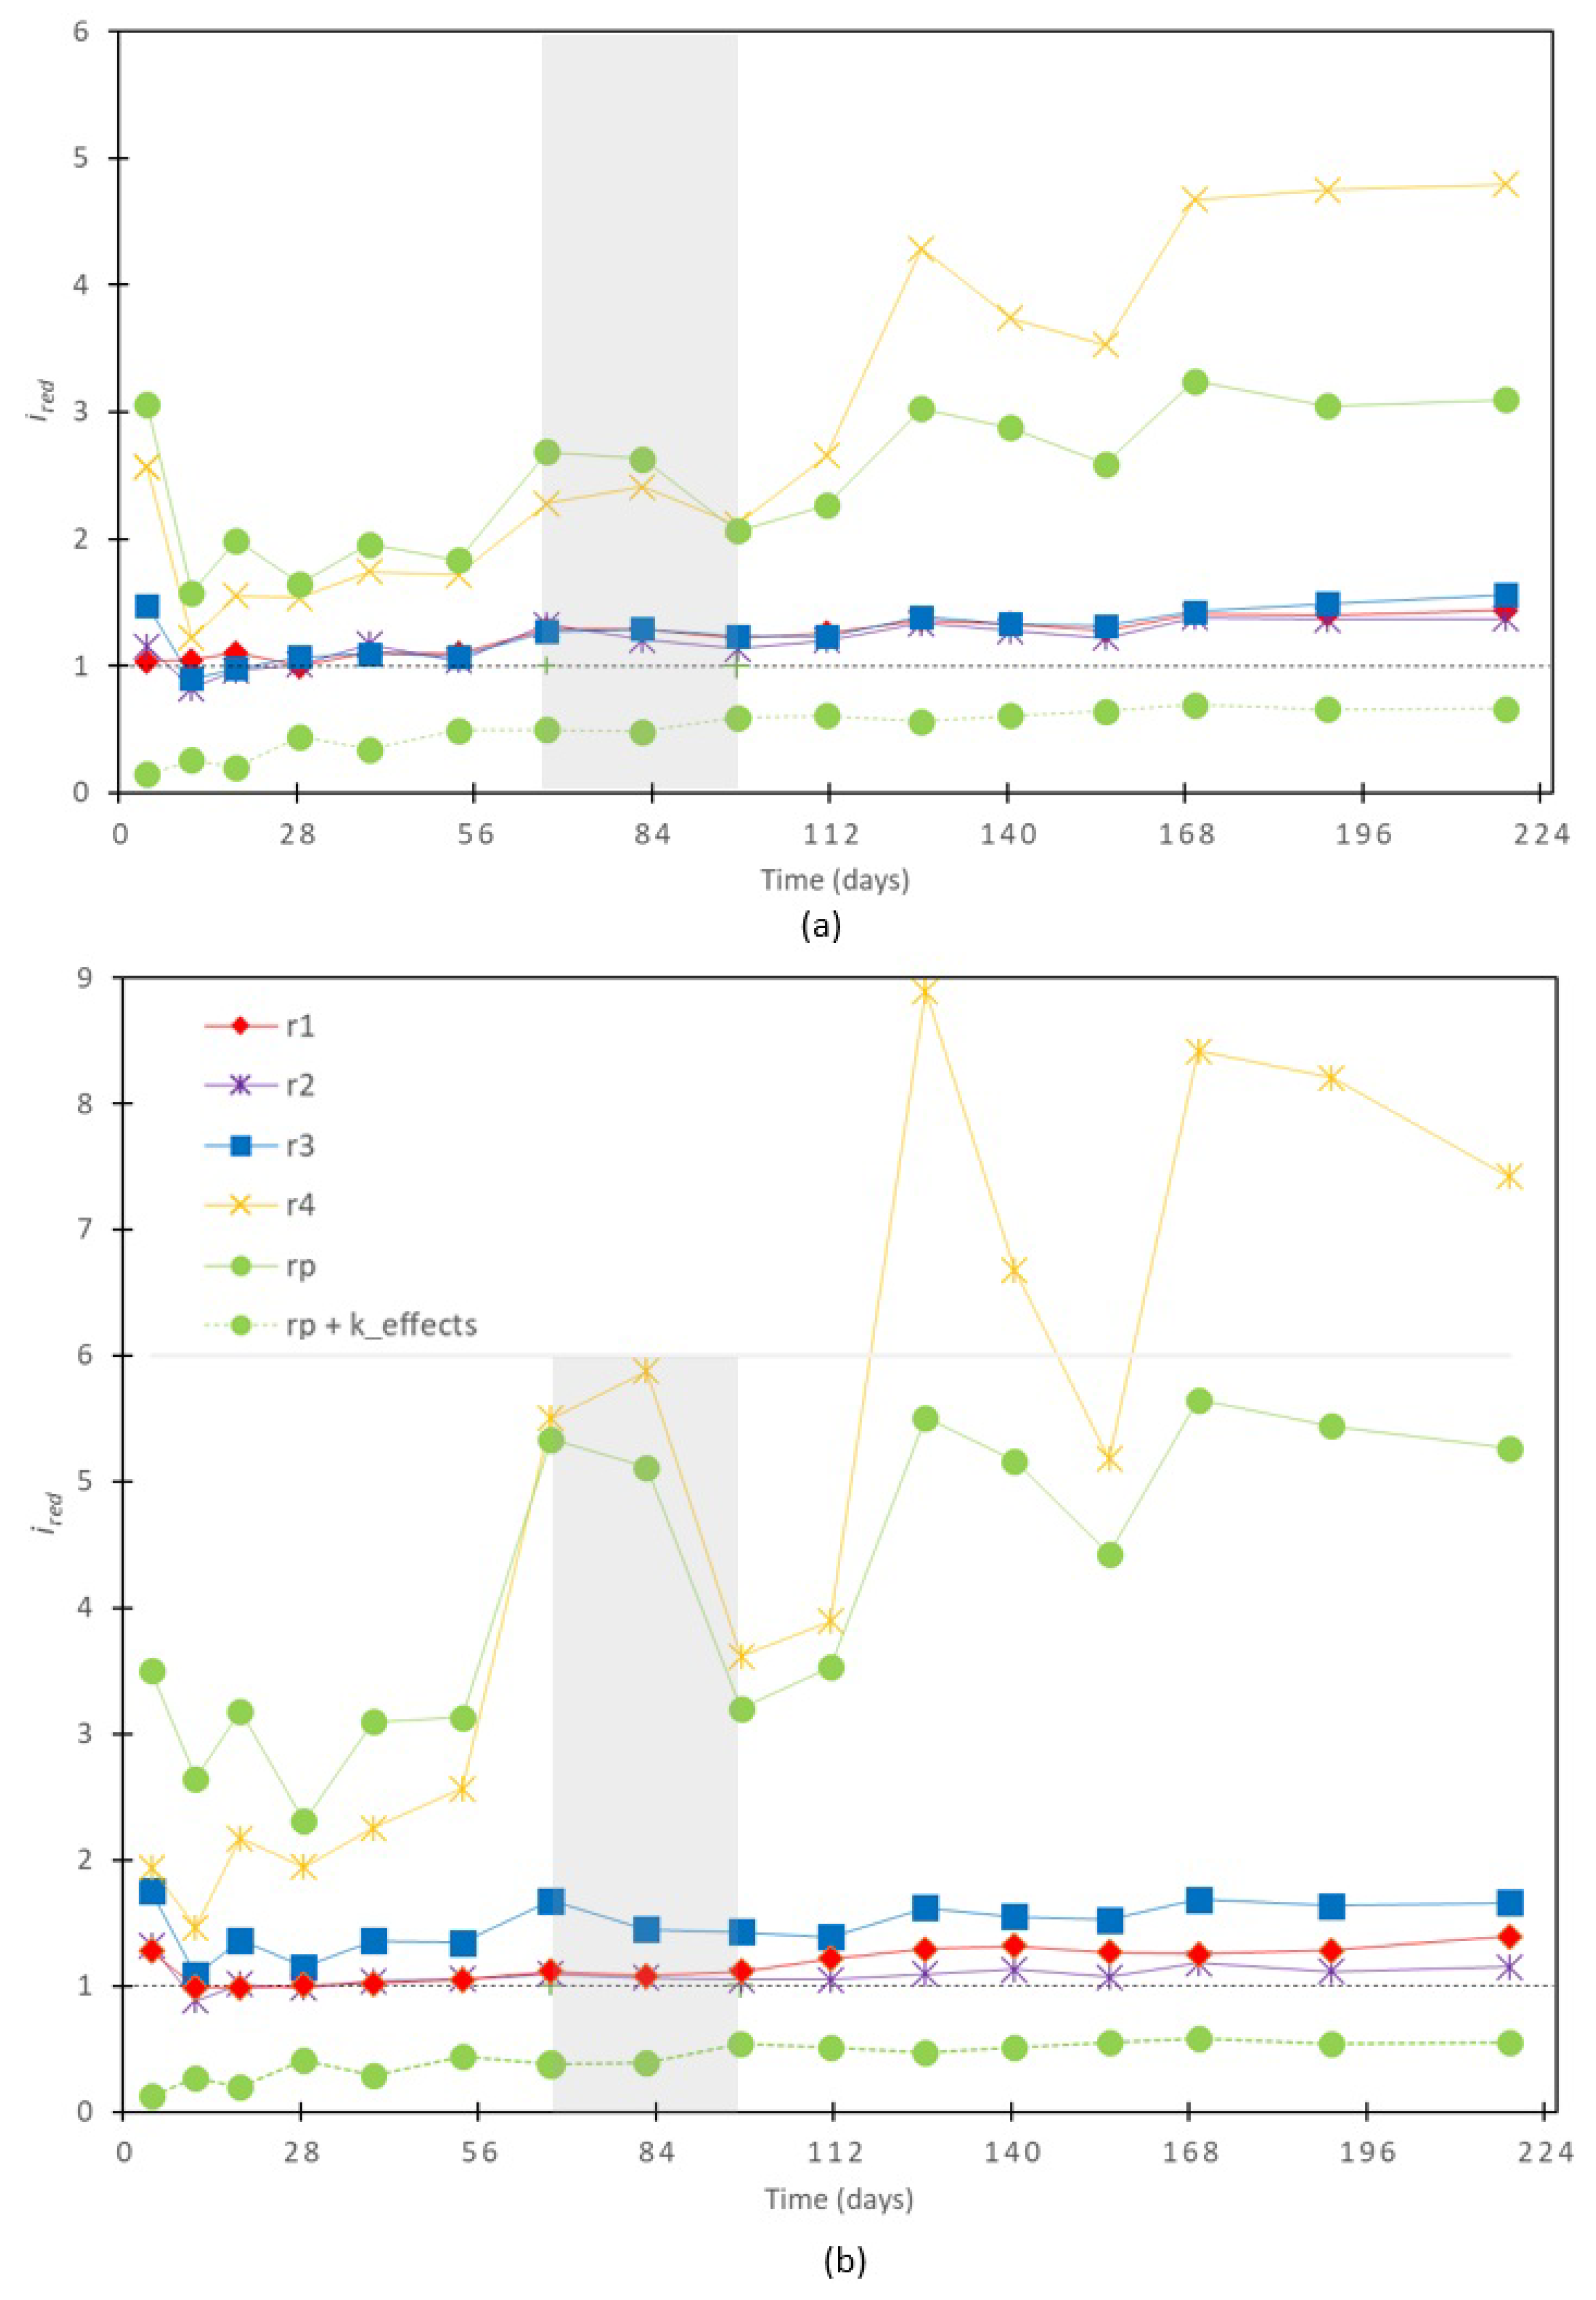
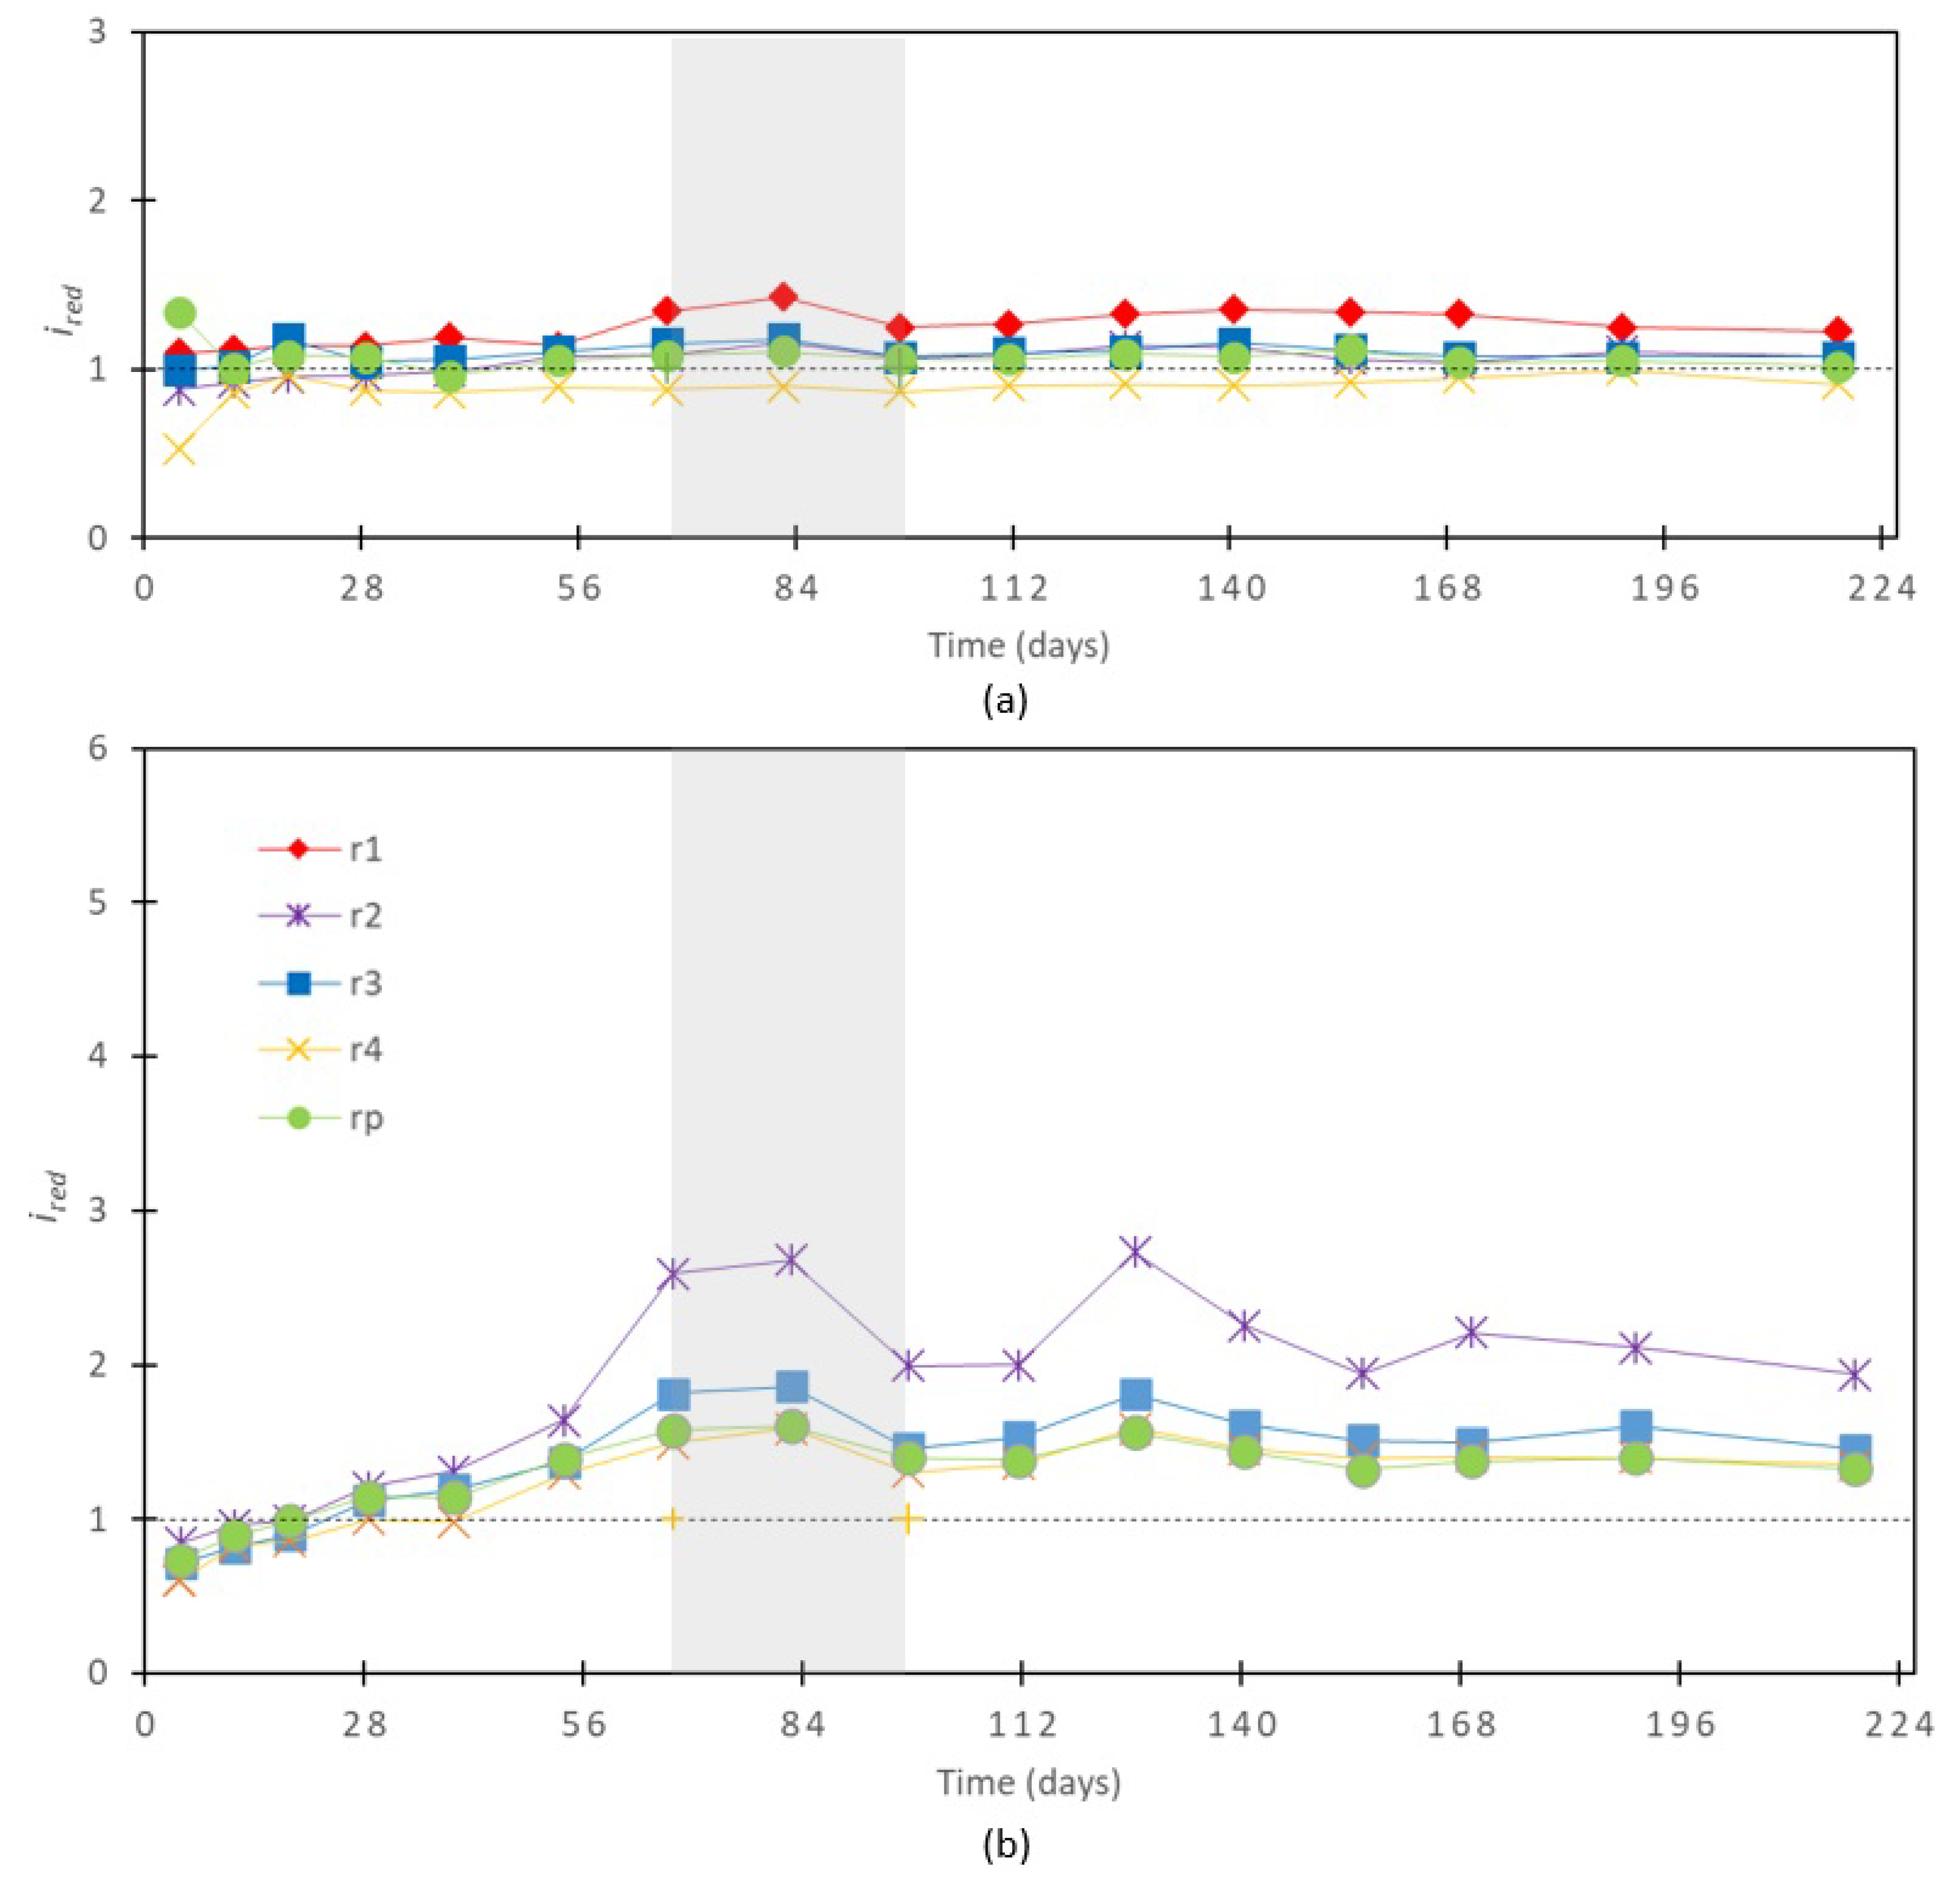
The curves in Figure 7 (a) and (b) illustrate the evolution of the reduction indicator ( i r e d ) variable for the Kerfing treatment, indicating that in the outer rings ( r 4 and r p ) —excluding the effects of the kerfs— the treated pieces exhibit consistently lower relative cracking throughout the process. Besides, for r3, there is a reduction in cracking between 1.0% and 2.0% compared to the reference for K-3k and less than 1.5% for K-2k. Differences in cracking are minimal for the inner rings ( r 1 and r 2 ).
Figure 7 also reveals a similar temporal variation pattern for the treated and reference samples. Both curves begin with an initial segment of approximately 50 days (preceding the indicated area in Figure 6), during which the relative cracking in the reference samples is about 2.0 times higher for K-2k and 3.0 times higher for K-3k. During this period, the saturated logs, with a moisture content (MC) well above the FSP, lose moisture until approaching an MC of 30%. The kerfs act as additional interfaces for water exchange alongside the end faces, facilitating the evaporation of free water and potentially reducing surface stress at the log end-faces.
Following this initial stage, the relative cracking in the reference samples increases to nearly three times that of K-2k and over five times that of K-3k compared to the treated logs. This subsequent stage, marked within the indicated area of Figure 7, lasts approximately 30 days, with the MC ranging between 20% and 30%, corresponding to the transition from above to below the FSP. This significant difference is attributed to the additional checks and splitting that appear and consolidate during this period, contributing to the increase in the relative cracking value, c r .
In the kerfing-treated pieces, this difference is absorbed by the kerfs in the superficial rings. The striped curves for r p + k e f f e c t s in Figure 7 (a) and (b) show the reduction indicator ( i r e d ) for r p , including the contribution from the kerfs’ total width after subtracting the saw blades’ thickness. It is observed that general cracking is reduced, and additional cracks generated from the kerfs result in values below unity (approximately 0.6). This pattern actively counteracts the formation of cracks, as indicated by the consistent line formed in Figure 7 (a) and (b). This demonstrates that the kerfing treatment effectively mitigates cracking by redistributing stress and providing controlled release points, thus lowering the overall cracking observed.
Figure 8 (a) and (b) show the reduction curves for the two hollowing treatment variants, H-16mm and H-30mm. The general trend is the opposite of the Kerfing treatment. Toward the interior, in the rings closest to the central perforation, a reduction in relative cracking is observed, as indicated by the r 1 curves in Figure 8 (a) and r 2 in Figure 8 (b). In contrast, the reduction is minimal in the outer rings, which are very close to unity. The reduction in the H-16mm variant is very small, never exceeding 1.5 times the reference. However, the difference is more pronounced with H-30mm. In r 2 , after the PSF, the cracking is reduced by 2 and almost 3 times compared to the reference.

3.2. Log End-Face Final Cracks

3.2.1. Characteristics of Cracking

Table 2 provides descriptive statistical data for the relative cracking ( c r ) and the relative number of cracks ( n ° r ) of the end faces of all samples: treated and untreated. The results are presented for each ring (r1, r2, r3, r4 and rp), considering the last measurement, that is, for the equilibrium moisture content (EMC). Differences are observed between rings, and to evaluate them, an ANOVA was applied to the faces of the reference samples (R). Table 3 presents the results. Significant differences are observed between rings for both variables: p < 0.0001 and F values of 6.969 and 51.29, respectively.
When observed exclusively in the reference samples (R), the recorded total tangential cracking ( c r ) aligns with existing literature. For reference, Dinwoodie [42] reports tangential shrinkage ranging from 2.5% to 7.5% for hardwood species such as Tectona grandis and Quercus robusta, respectively, transitioning from a green state (over 30% moisture content) to 12% moisture content, typical for service conditions. Comparable reference values for the number of cracks ( n r ) over the end face are unavailable in the literature. Nevertheless, the data from the relative number of cracks ( n r ) were comparable with relative cracking values ( c r ): rings closer to the pith of the log exhibited a higher relative number of cracks, while the remaining values were similar.
For the relative cracking ( c r ) variable, the Tukey test reveals differences between r 1 and the remaining rings. Comparisons with r 3 and r p show a significantly higher level (p < 0.001), while the significance decreases for r 2 (p < 0.01) and r4 (p < 0.05). No significant differences are observed between the remaining rings r 2 , r 3 , r 4 , and r p , with all p-values above 0.05.
Regarding the number of cracks ( n r ), very significant differences are observed in r 1 against all rings, with p-values < 0.001. There are no significant differences between rings r 2 and r 3 . These two rings differ very significantly from r p (p < 0.001) and at a lower level of significance from r 4 (p < 0.05).

3.2.2. Effectiveness of Treatments

Relative cracking, c r
Table 2 corroborates the findings of section 3.1.3. The mean values of Kerfing treatments (K) are effective compared to the reference (R), reducing cracking outside the areas adjacent to the kerfs and showing a gradual decrease in effectiveness towards the interior. Significant variability in the data was observed, especially in K-3k, due to differences between specimens with exceptional cracks (checking/splitting) and those with no cracks outside the kerfs when the relative cracking ( c r ) approached zero. For instance, the maximum value for K-3k was 3.20 %, while the minimum was 0.00 %.
Table 2 shows that both K variants, 2k and 3k, reduce relative cracking ( c r ) to less than 25% of the reference in the perimeter ( r p ). However, these results are less pronounced towards the interior, with values similar to the reference but with higher variability. In r 1 , the treated samples reached mean values close to 86% and 80% of the reference for 2k and 3k, respectively.
For the central hollowing treatment (H), the relative cracking ( c r ) at the perimeter ( r p ) was scarcely distinguishable from the reference (R). Table 2 indicates that H-16mm and H-30mm variants reach 90% and 93% of their reference values, respectively. Towards the interior, as shown in Table 2, the cr of the rings adjacent to the perforations is reduced to almost 70% of the reference, corresponding to r 1 for H-16mm and r 2 for H-30mm. This reduction may be due to the perforation itself, which reduced the proportion of less permeable heartwood and exposed the more permeable sapwood, facilitating smoother water circulation and causing fewer tensions on the hollow inner surface.
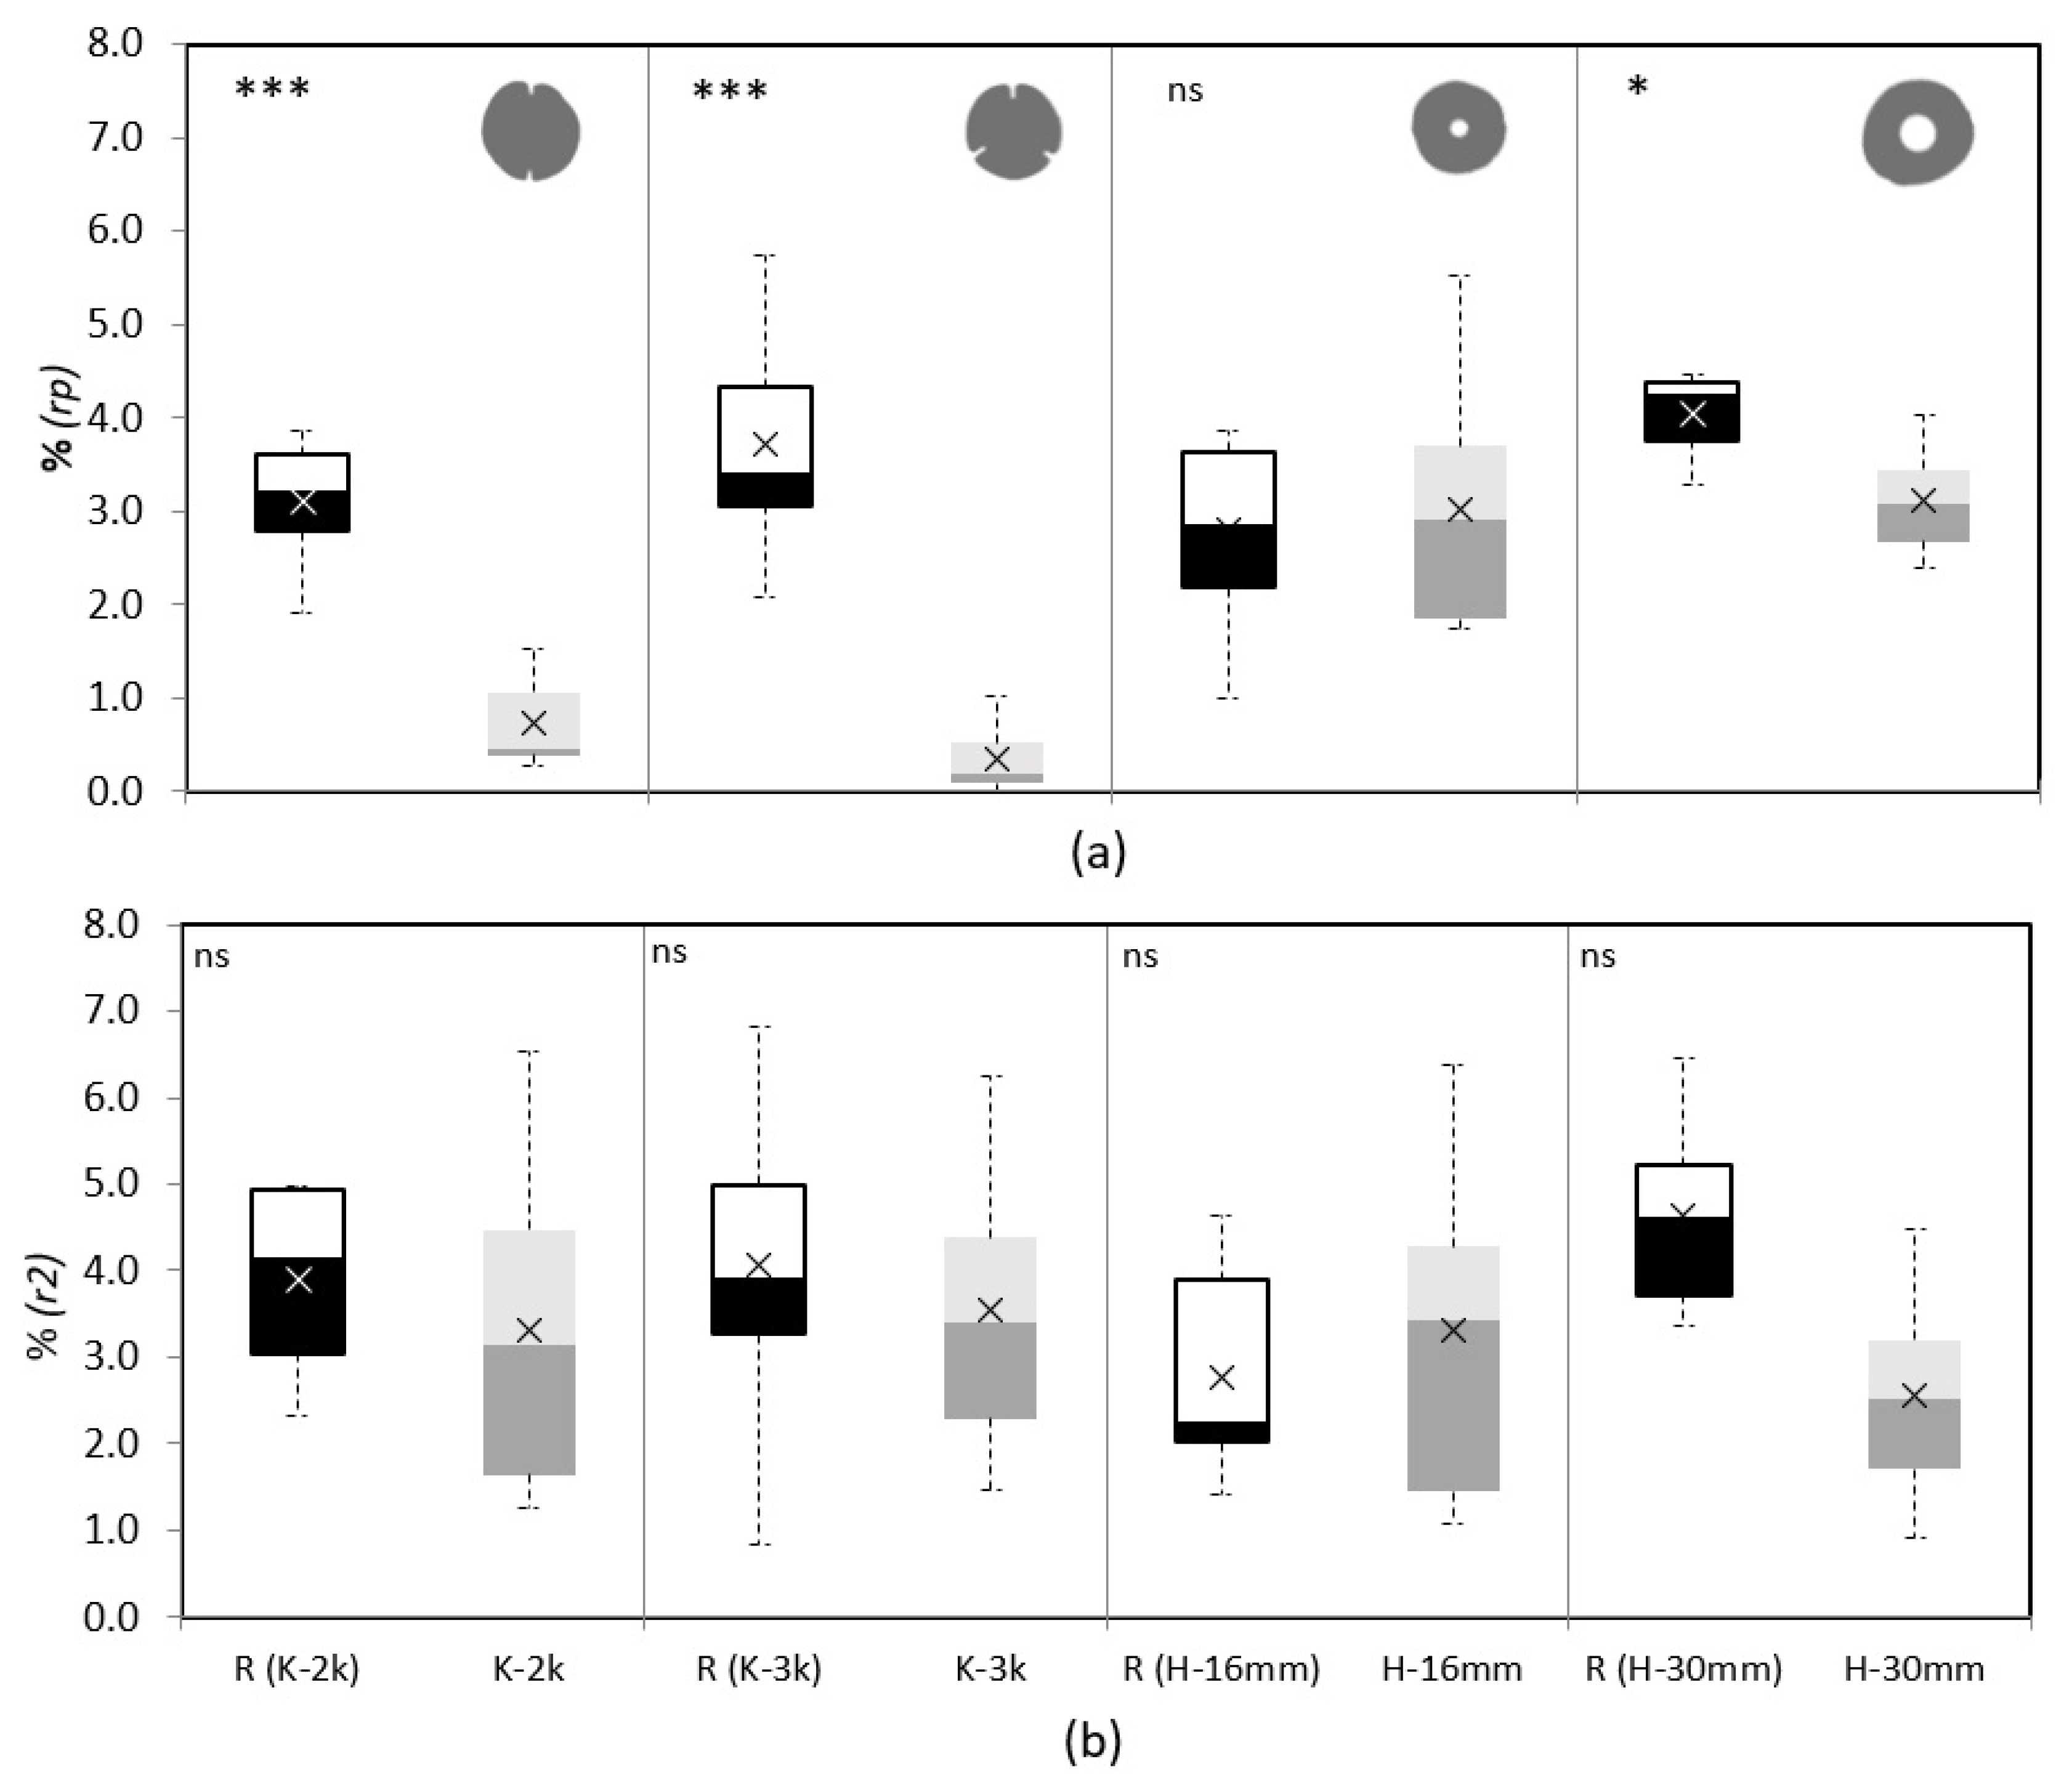
Figure 9 presents boxplots comparing the reference (R) with their respective treated faces: K-2k, K-3k, H-16mm, and H-30mm. The analysis focuses on rings where trends were more evident ( r 2 and r p ), discarding r1 due to different performance observed with ANOVA and non-compliance with the normality criterion. A t-test for related samples was also performed to compare the significance levels between means.
Regarding c r , Figure 9 (a) confirms the effectiveness of both Kerfing treatments (K), K-2k and K-3k in significantly reducing the relative total crack on the perimeter compared to the reference, with a high level of significance (p < 0.00). Figure 9 (b) shows these treatments are ineffective in the inner rings.
For the central hollowing treatment (H), the H-30mm variant effectively reduces relative cracking ( c r ) with a significance level of p=0.06, while the H-16mm variant is ineffective. The 30mm perforation reduces the total size of cracks around the perforation ( r 2 ), as corroborated graphically in Figure 9 (b). The t-test indicates its effectiveness on the perimeter ( r p ) as well. This observation suggests that a larger perforation exposes more sapwood, facilitating log drying.
Relative number of cracking, n r
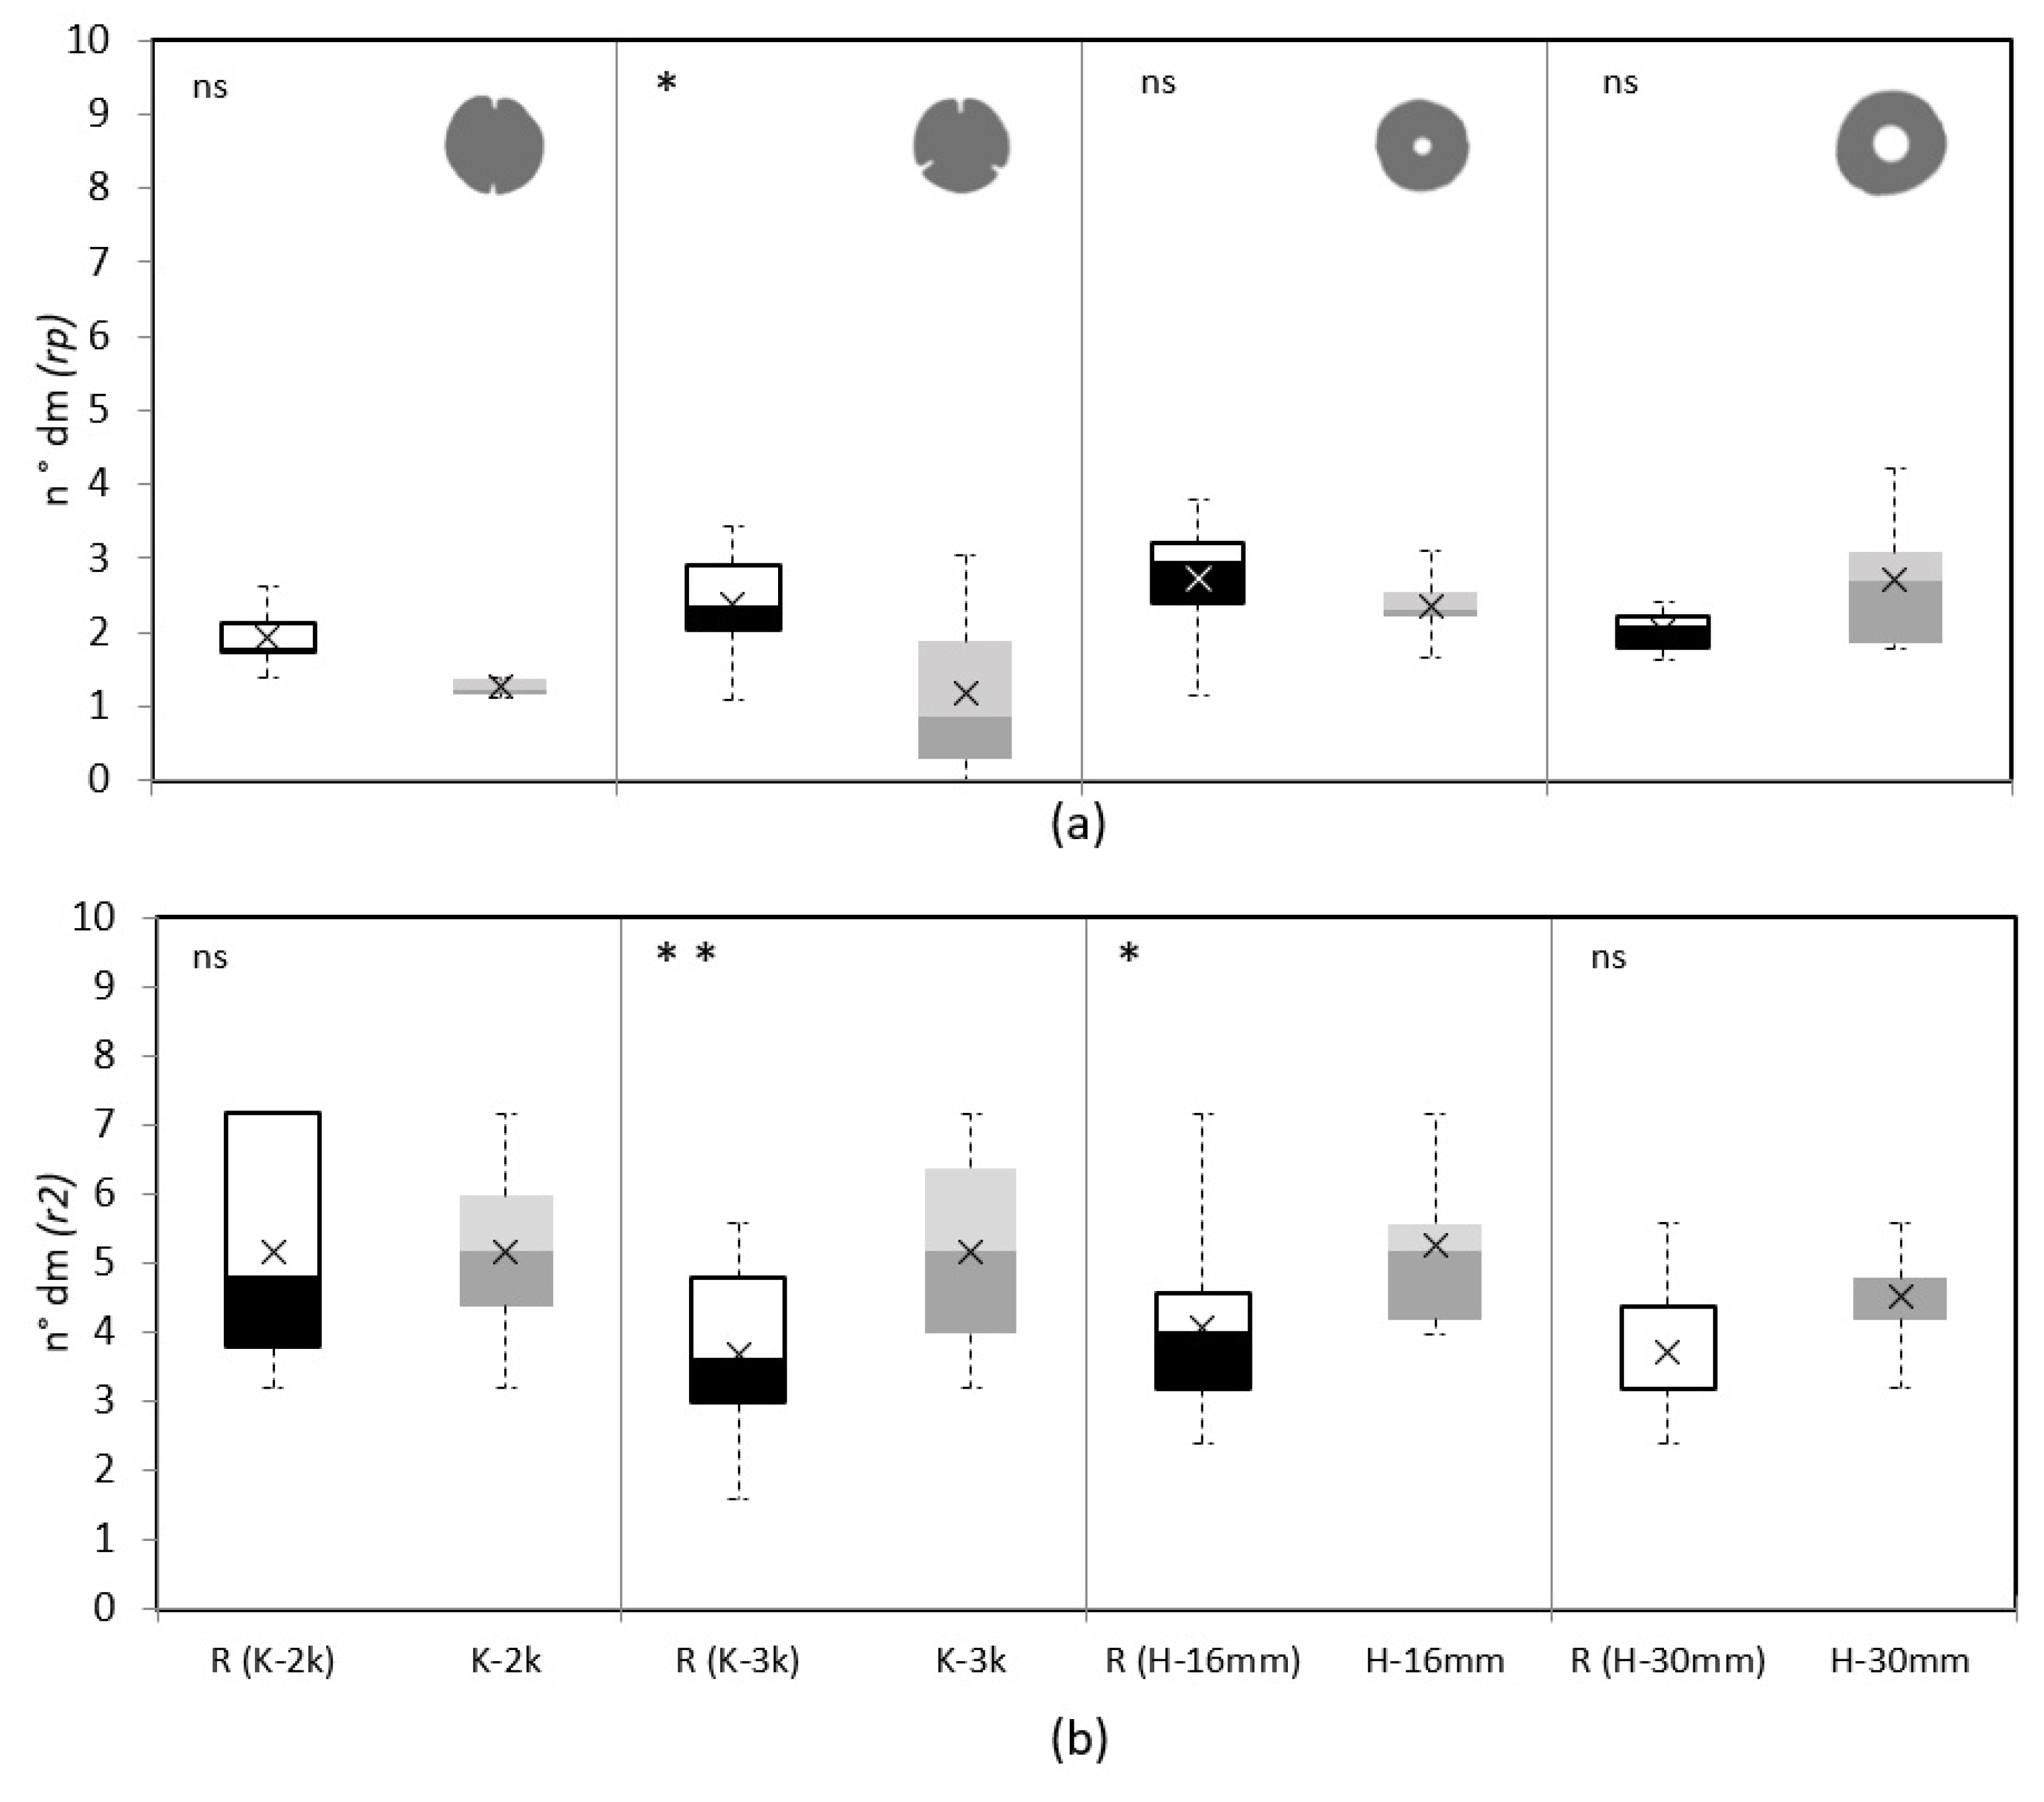
Regarding the relative number of cracks n r , Table 2 shows similar trends but weaker ones, with a reduction in mean values of cracks in outer rings but similar values towards the interior. As c r , extreme values also affected the variability of the data; for example, the maximum value for K-3k was 3.06 n°/dm, while the minimum was 0.00 n°/dm. Table 2 indicates that the number of cracks ( n r ) at the treated samples’ perimeter level ( r p ) corresponds to 60% and 50% of the reference samples for K-2k and K-3k, respectively. In contrast, in r 1 , these percentages are close to 100%.
No trend differences were observed for either variation of the hollowing treatment (H). Indeed, the H-30mm variant exhibited a greater number of cracks than its reference. Boxplots in Figure 10 compare untreated and treated pairs of end faces. After reviewing assumptions, a t-test for related samples was performed to compare the significance levels between mean values.
Similarly, it is confirmed that the Kerfing treatment (K) reduces the relative number of cracks on the perimeter. Still, this reduction is significant only for K-3k, as shown in Figure 10 (a). However, the t-test also reveals a negative secondary effect of the K-3k technique, visible in Figure 10 (b). In the inner ring ( r 2 ), the number of cracks increased significantly (p < 0.01). On the other hand, the central hollowing treatment (H) does not affect the number of cracks in either ring; in fact, it significantly increases with the H-16mm variant, as seen in Figure 10 (b).

3.2.3. Kerfing as a Crack Control

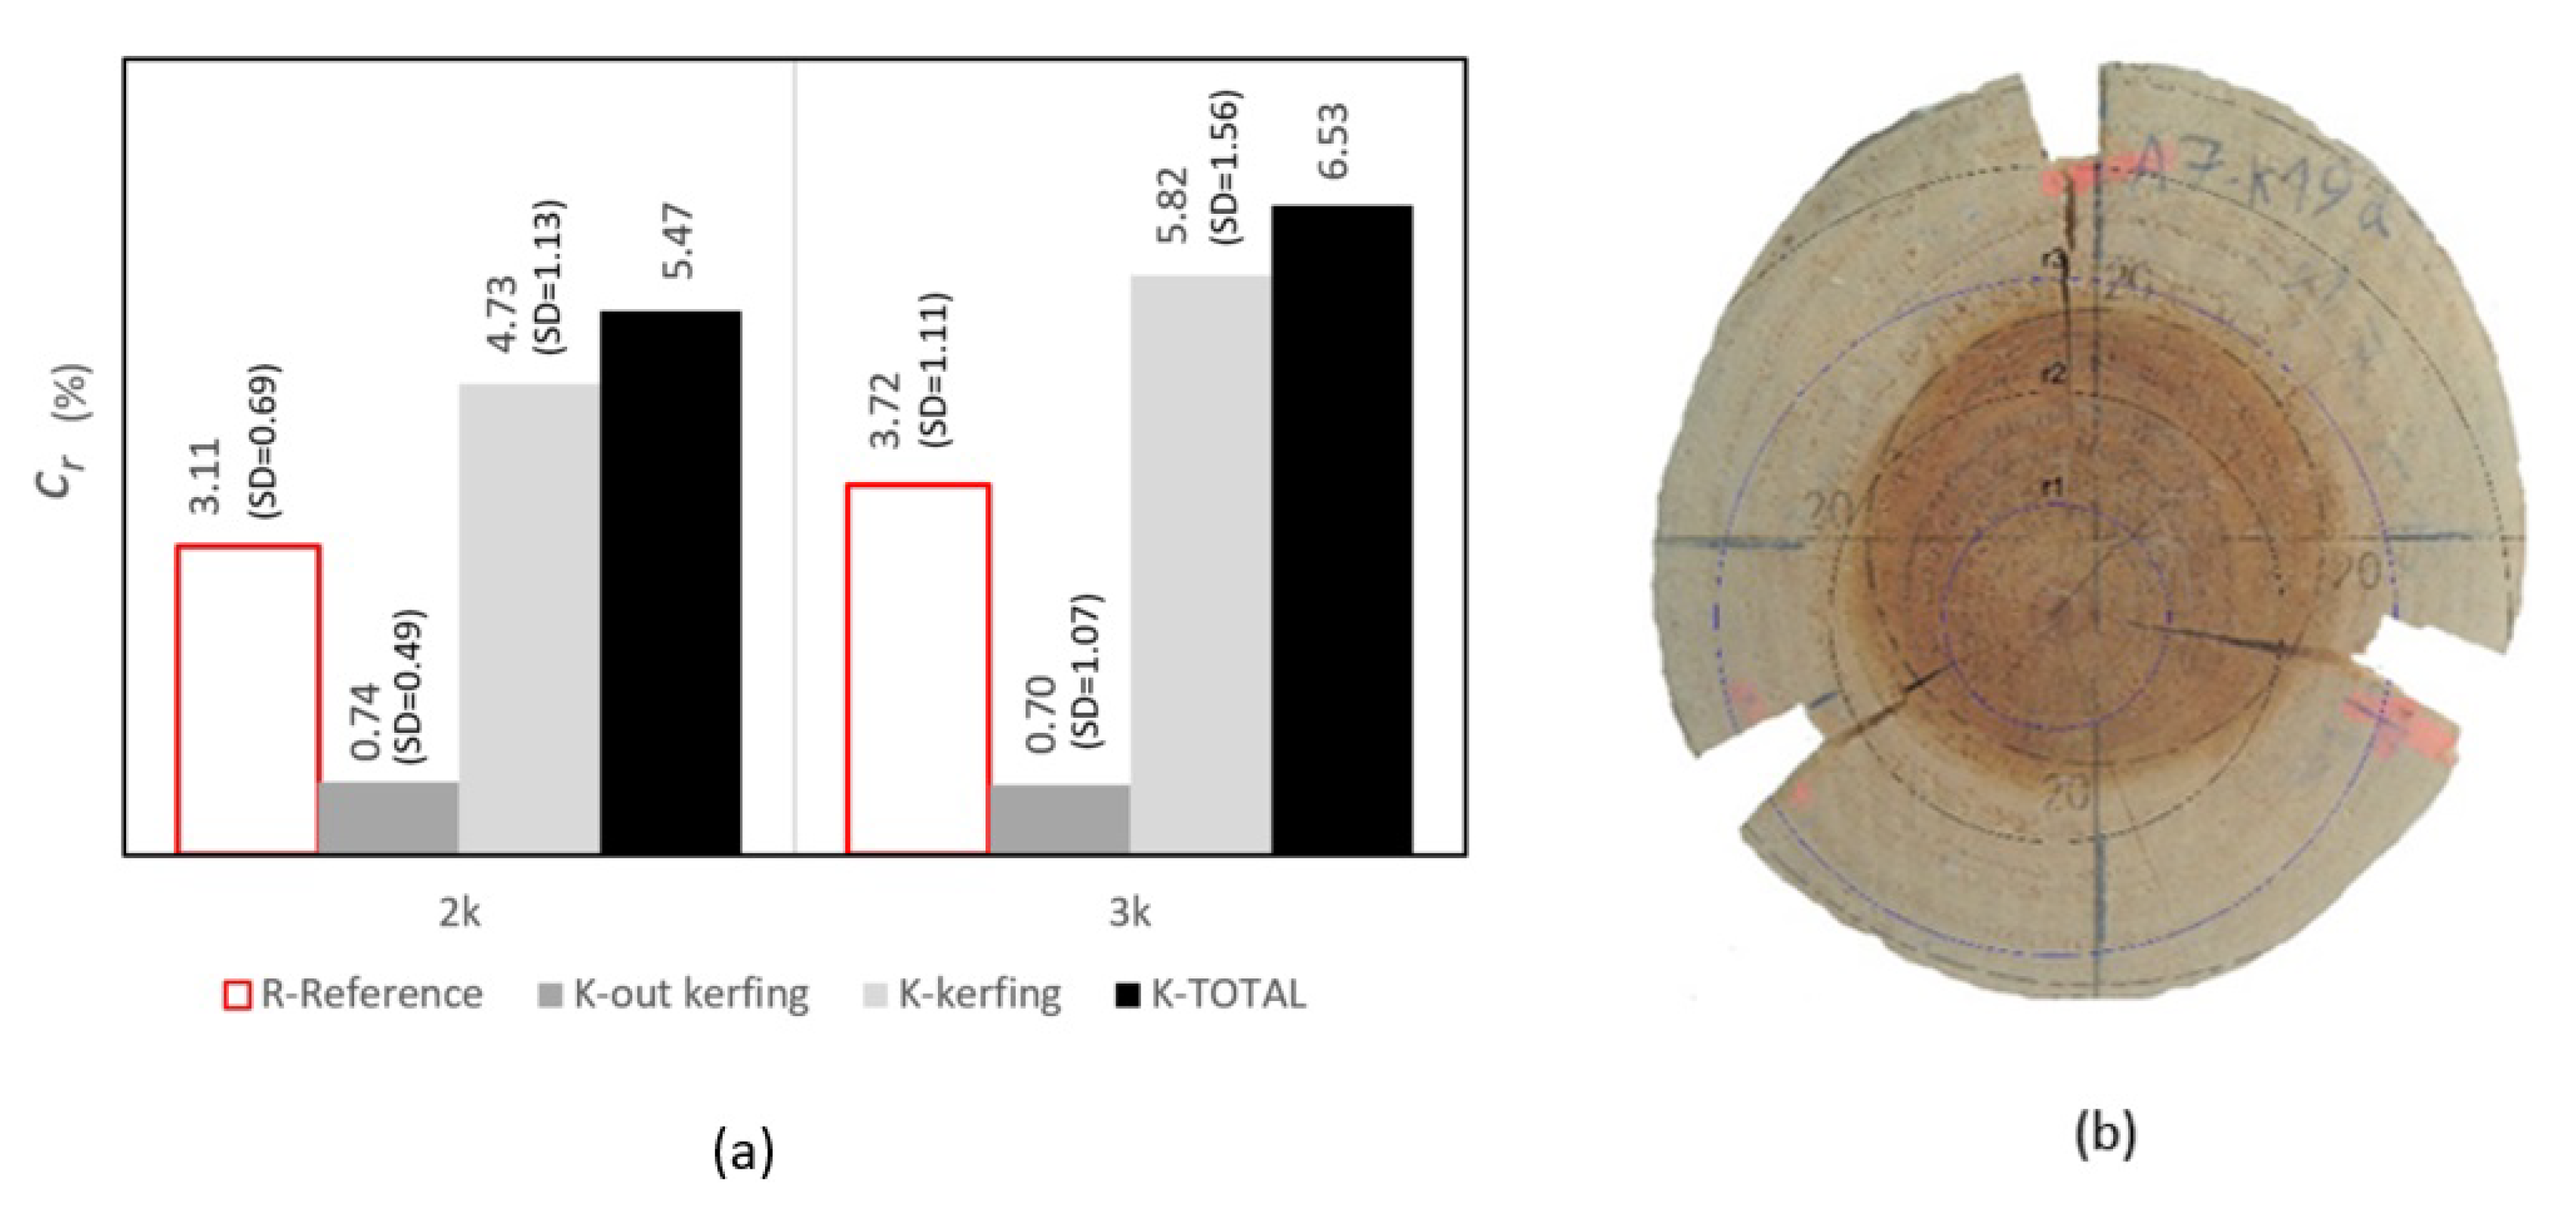
Another pertinent aspect to consider is whether the treatments contributed to controlling or partially predicting the occurrence of cracking. Regarding the Kerfing treatment, it is noteworthy that the zone adjacent to the kerfs captures a higher percentage of total cracking, potentially promoting its occurrence. Figure 11 (a) compares the final relative cracking ( c r ) over the perimetral ring ( r p ) of the reference samples (in red) with the treated samples for the two variants, 2k and 3k (black bars). The central grey columns also distinguish between the area within the kerfs (light grey) and outside the kerfs (dark grey).
Notably, a significant reduction in cracking is observed outside the Kerfing zone, with less than a third of the reference for 2k and less than a quarter for 3k. The kerfs absorbed the difference to the reference (red line transparent bars), resulting in a 60% increase in the total c r of the treated pieces (black bars). After a specific count, it was observed that most cracks originated at the kerfs, with 75% and 67% in the 2k and 3k treatments, respectively. Moreover, the kerfs acted as driving elements in crack formation, determining the formation of "quadrants" between kerfs, as shown in Figure 11 (b).
However, as noted earlier, this can be a negative side effect. While external cracks may be reduced towards the interior of the ends of the logs, the number of cracks is not significantly reduced due to the additional cracks "promoted" by the kerfs.

4. Discussion

In air-drying logs, moisture content varies according to environmental conditions [27]. Due to the element’s size and the logs’ anatomical characteristics, an internal moisture gradient forms, creating an uneven distribution of internal stresses. Exacerbated by anisotropic shrinkage, these stresses affect the weaker different tangential planes, leading to tangential cracking [21].
In this study, the moisture content removal rate pattern matches the descriptions in the literature: above the fibre saturation point (FSP), free water is rapidly eliminated until the moisture content (MC) approaches 30%, after which the bound water in the tissue is removed at a slower rate ([27,43].
The cracking formation profile overlaid on the described pattern demonstrates that cracks form directly related to environmental conditions. By observing the reduction curves, we can confirm that the treatments partially mitigate crack formation, thereby reducing the impact of environmental factors. The treatments contributed to reducing cracking, although their effectiveness varied depending on the specific treatment and the location observed. Regarding total cracks, both kerfing treatments were significantly effective in the outer rings (Figure 12). In contrast, the larger perforation (H-30mm) treatment was moderately effective in the inner rings adjacent to the perforation (Figure 12). About the number of cracks, no differences were observed compared to the references, except for the K-3k, which reduced the number at the external level of the log but simultaneously significantly increased the number of cracks in an inner ring, which can be associated with the "promoter" effect of the kerfs: the number of naturally occurring cracks is augmented by those artificially triggered by the kerfs, leading to an overall increase in the total number of cracks.
When examining the performance over time, before reaching the FSP, the K-3k variant shows greater water loss than the reference, achieving MC values near 30% approximately 15 days earlier than the other samples. In line with Lee et al. [44], this suggests that incisions or cuts affect the moisture distribution within the log, influencing the formation of the moisture gradient. The three kerfs reduce the distance between the core and the outer wood, diminishing the moisture differential, facilitating water transport, and increasing the moisture exchange area along the entire piece. This results in greater effectiveness on the log’s exterior, as Figure 12 shows for the perimetral ring, rp.
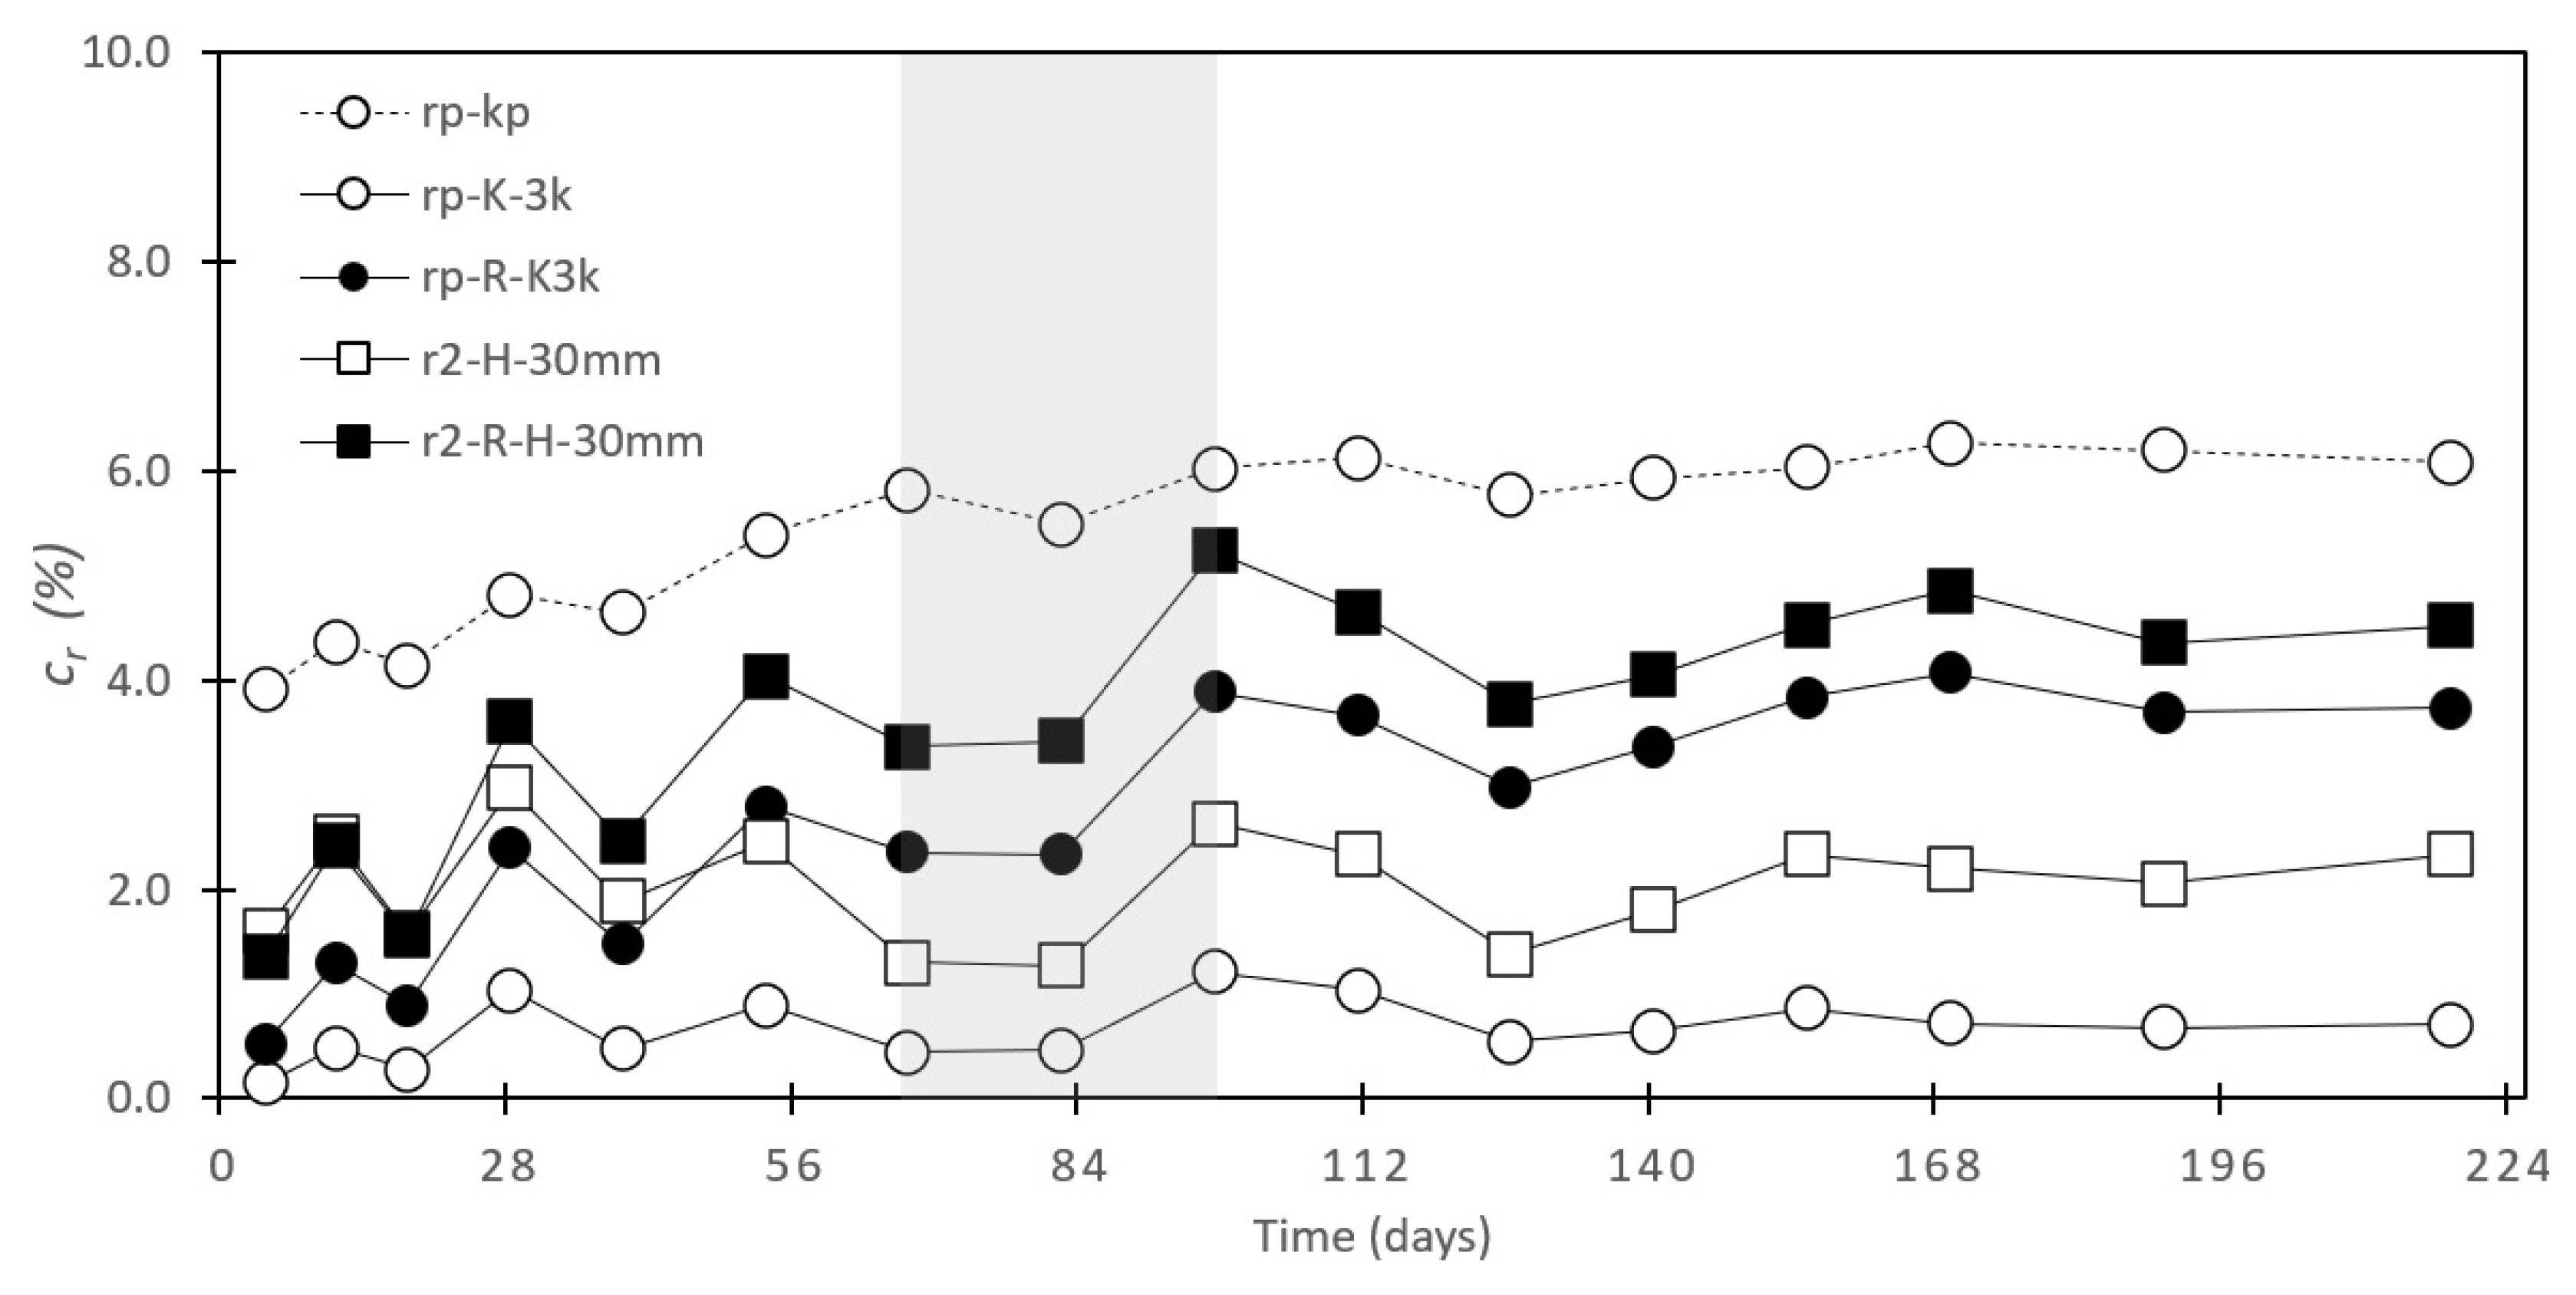
The results also indicate that, throughout the air-drying process, the kerfs itself not only absorb the tangential dimensional variations of the untreated areas but also actively capture more cracks: at the beginning of the process, an "instant" crack is activated adjacent to the notches, which affects almost 4% of the perimeter (Figure 12). Then, this percentage increases slowly but gradually and continues until it stabilizes after passing through the transition zone between above and below the FSP.
Figure 12. Relative cracking c r of K-3k over r p and H-30mm over r 2 . rp-kp: Over the perimeter r p of the treated piece, this includes the sum of the cracking in the untreated zone (between kerfs) plus the three notches (subtracting the thickness of the cutting discs); rp-K-3k: Over the perimeter r p , this includes only the contribution of cracking in the untreated zone (between the notches); rp-R-K-3k: The cracking over the perimeter r p of the respective untreated reference pieces; r2-H-30mm: On ring 2, r 2 , the cracking of the treated piece; r2-R-H-30mm: On ring 2, r 2 , the cracking of the untreated reference piece.
Preprints 108722 g012
Evans et al. [26] studied differences in the number and depth of kerfs and observed that two kerfs instead of one and deeper (20% of the diameter each) reduce the mean depth, width, and length of checks. In this study, due to variations in the logs’ shape and diameter, the kerf depth was 15 mm, ranging from 10% to 20% of the diameter per kerf. However, although the total perimeter cracks were significantly reduced, the K-2k variant did not show a difference in water loss compared to the reference. This suggests that the number of kerfs might be a variable to consider for MC reduction in future research.
The MC curve for the H-30mm variant remained mostly above the reference, indicating it was less effective in transporting and eliminating free and bound water. This may be due to a lack of air circulation within the central hollow, potentially accumulating water vapour. This contrasts with studies such as Park et al. [31], which showed that a complete hollowing treatment and sealing of the ends reduce the moisture gradient and, consequently, the surface tensions that trigger cracking.
However, a significant reduction in total cracking in the ring adjacent to the perforation was observed for H-30mm (Figure 12). One reason is the reduction in heartwood due to the larger perforation diameter. In all studied logs, heartwood accounted for 31.05% (SD=8.63) of the total area in the reference pieces. According to Moore et al. [16] and others, heartwood has distinct characteristics from sapwood that influence its performance. It contains a high content of juvenile wood with lower density, modulus of elasticity, and rupture compared to mature outer wood, consistent with the larger size and number of relative cracks around ring 1, r 1 , near the pith.
Both treatments shorten the moisture gradient distance and, therefore, its steepness, locally reducing the stresses that trigger cracking. In untreated pieces, these stresses are abruptly released at the ends as checking and splitting. As described, these effects emerge, develop, and consolidate during drying, compromising the piece’s integrity. However, from a drying perspective, these cracks serve as moisture exchange interfaces, accelerating the drying process ([25]) and hypothetically "capturing" the tangential shrinkage/swelling variation at the log end.
In kiln drying, environmental variables (temperature and relative humidity) are controlled to prevent tangential stresses from exceeding the threshold that causes wood tissue failure [43]. In air drying, while some general aspects (using well-ventilated enclosures or protecting from rain and direct sunlight) can be controlled, this is not feasible to the same extent. Another strategy to evaluate is manipulating the drying effect, i.e., cracking. As observed with the kerfing treatment, the kerfs guided crack formation in more than two-thirds of the specimens, creating quadrants. In some cases, no visible cracks formed within these quadrants, while in others, cracks did appear—some minor and others severe, like checking.
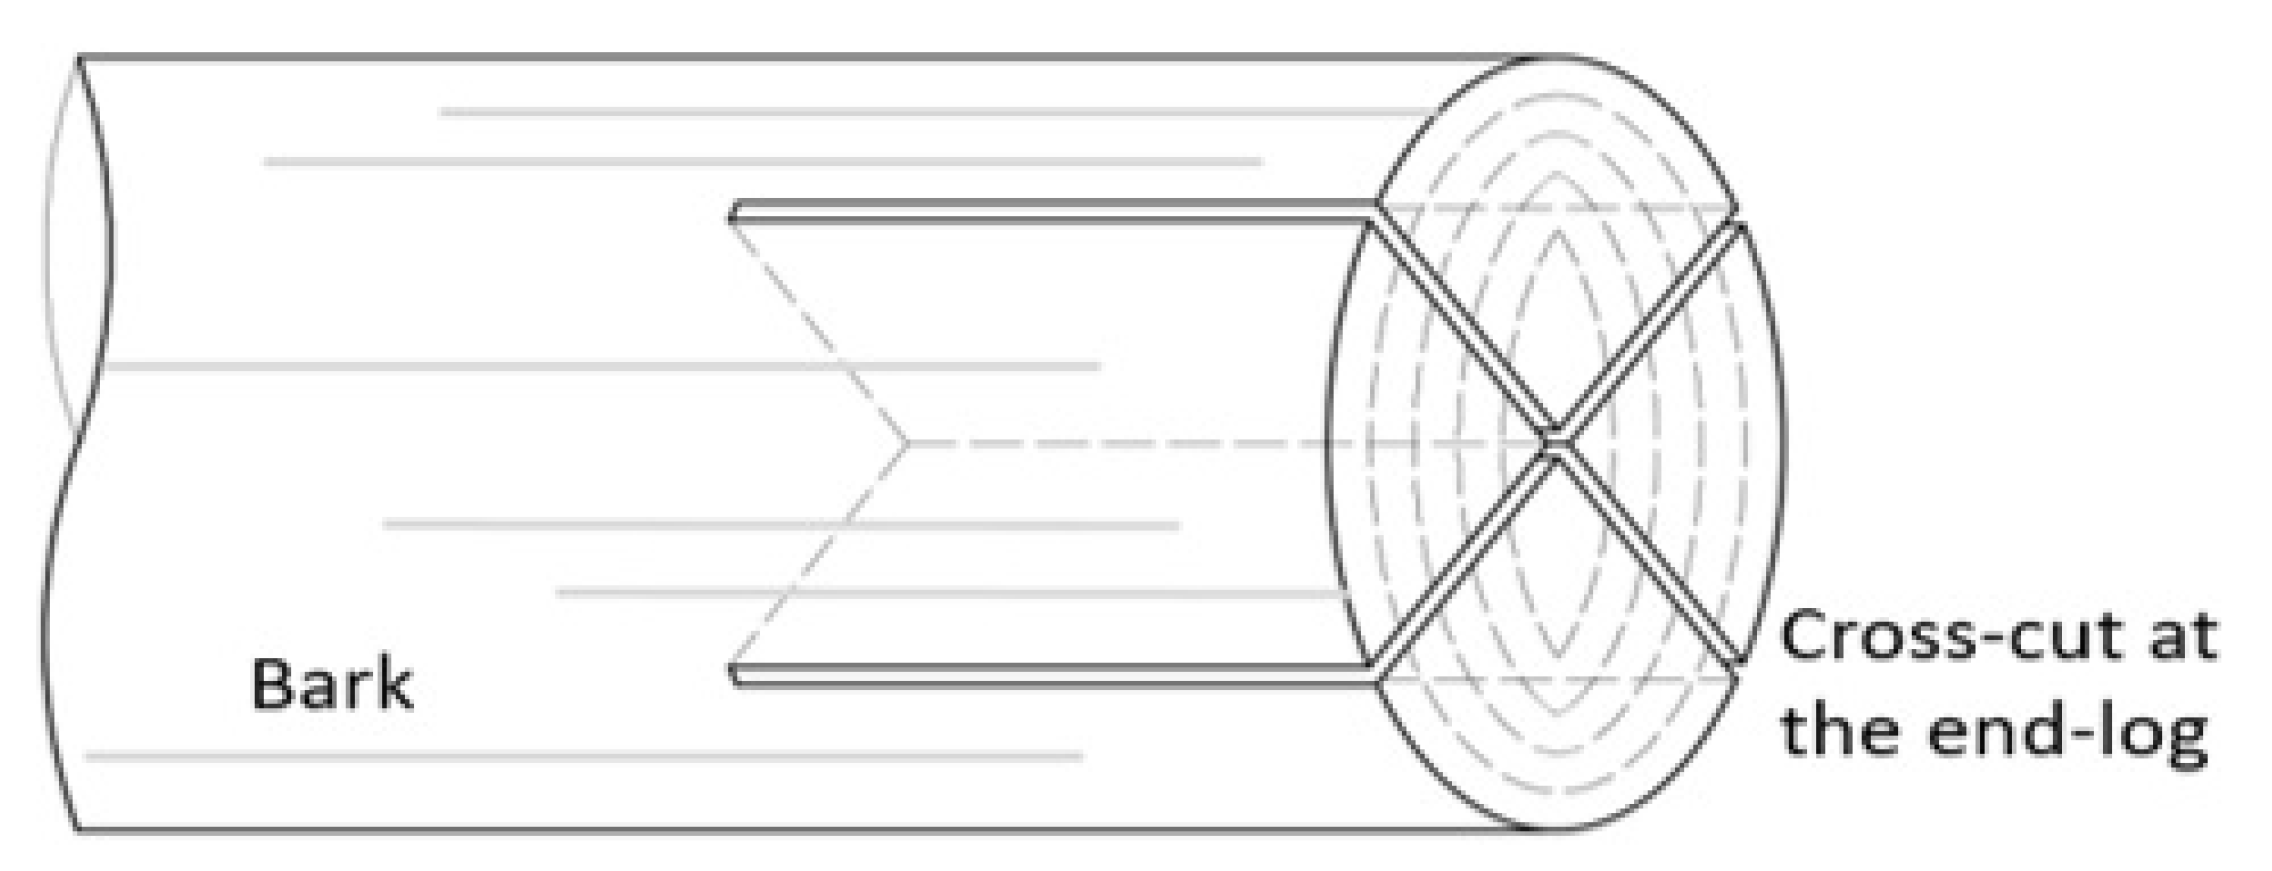
A proposed solution, hypothetically capturing tangential stresses in the kerfs, involves an artificial cross-splitting as Figure 13 exposes. These cross-knifings extend throughout the extreme section to a defined depth, combining the advantages of both treatments studied. The two diameters would capture naturally formed checks or splits, and the exposed area by the cut depth would accelerate log drying.
The four formed quadrants might house a connection. Dias et al. [45] demonstrated that using four glued bars arranged around the perimeter of round timber logs subjected to tension can achieve high structural performance. Fastener connections can also be evaluated, provided critical distances to loaded edges are measured from the end of the executed kerf. Additionally, the early work of Huybers [46]suggests a practical approach for controlling log end expansion using a wire lacing tool.

Acknowledgments

The authors gratefully acknowledge both ANID (National Research and Development Agency-Chile) and the UBB (University of Bío Bío-Chile) for their financial support. Also, the support by the National Fund by FCT (Portuguese Foundation for Science and Technology) under project UIDB/04033/2020; Project P4.4. Woodbuilding, from the Transform Agenda, approved under Notice No. 02/C05-i01/2022 (Investment supported by the PRR - Recovery and Resilience Plan and the NextGeneration EU European Funds); and the funding from Centro Nacional de Excelencia para la Industria de la Madera - Chile (CENAMAD, FB210015).

Conflicts of Interest

The authors have no competing interests to declare that are relevant to the content of this article.

References

  1. Raposo, M.A.; Pinto Gomes, C.J.; Nunes, L.J. Evaluation of Species Invasiveness: A Case Study with Acacia dealbata Link. on the Slopes of Cabeça (Seia-Portugal). Sustainability 2021, 13, 11233. [CrossRef]
  2. Guerrero, F.; Hernández, C.; Toledo, M.; Espinoza, L.; Carrasco, Y.; Arriagada, A.; Muñoz, A.; Taborga, L.; Bergmann, J.; Carmona, C. Leaf thermal and chemical properties as natural drivers of plant flammability of native and exotic tree species of the Valparaíso region, Chile. International journal of environmental research and public health 2021, 18, 7191. [CrossRef]
  3. Hirsch, H.; Richardson, D.M.; Pauchard, A.; Le Roux, J.J. Genetic analyses reveal complex introduction histories for the invasive tree Acaciadealbata Link around the world. Diversity and Distributions 2021, 27, 360–376. [CrossRef]
  4. IFN, I. 60◦ Inventário Florestal Nacional. Portugal: ICNF-Instituto da Conservação da Natureza e das Florestas 2015.
  5. Nunes, L.J.; Raposo, M.A.; Meireles, C.I.; Pinto Gomes, C.J.; Ribeiro, N.M.A. Control of invasive forest species through the creation of a value chain: Acacia dealbata biomass recovery. Environments 2020, 7, 39. [CrossRef]
  6. Santos, A.J.; Anjos, O.M.; Simoes, R.M. Papermaking potential of Acacia dealbata and Acacia melanoxylon. Appita: Technology, Innovation, Manufacturing, Environment 2006, 59, 58–64.
  7. Linhares, T.; de Amorim, M.T.P. LCA of textile dyeing with Acacia Dealbata tree bark: a case study research. Procedia engineering 2017, 200, 365–369. [CrossRef]
  8. Bukauskas, A.; Mayencourt, P.; Shepherd, P.; Sharma, B.; Mueller, C.; Walker, P.; Bregulla, J. Whole timber construction: A state of the art review. Construction and Building Materials 2019, 213, 748–769. [CrossRef]
  9. Burton, R.; Dickson, M.; Harris, R. The use of roundwood thinnings in buildings–a case study. Building Research & Information 1998, 26, 76–93. [CrossRef]
  10. Wolfe, R.; others. Research challenges for structural use of small-diameter round timbers. Forest Products Journal 2000, 50, 21–29.
  11. Ramage, M.H.; Burridge, H.; Busse-Wicher, M.; Fereday, G.; Reynolds, T.; Shah, D.U.; Wu, G.; Yu, L.; Fleming, P.; Densley-Tingley, D.; others. The wood from the trees: The use of timber in construction. Renewable and Sustainable Energy Reviews 2017, 68, 333–359. [CrossRef]
  12. Green, D.W. Mechanical grading of 6-inch-diameter lodgepole pine logs for the Traveler’s Rest and Rattlesnake Creek bridges; Vol. 297, US Department of Agriculture, Forest Service, Forest Products Laboratory, 2005.
  13. Larson, D.; Mirth, R.; Wolfe, R. Evaluation of small-diameter ponderosa pine logs in bending. Forest Products Journal and Index 2004, 54, 52–58.
  14. Mergny, E.; Mateo, R.; Esteban, M.; Descamps, T.; Latteur, P. Influence of cracks on the stiffness of timber structural elements. Proceedings of the World conference on timber engineering, Vienna, Austria, 2016.
  15. Eckelman, C. Exploratory study of high-strength, low-cost through-bolt with cross-pipe and nut connections for square and roundwood timber frame construction. Forest products journal 2004, 54, 29.
  16. Moore, J.R.; Cown, D.J. Corewood (juvenile wood) and its impact on wood utilisation. Current Forestry Reports 2017, 3, 107–118. [CrossRef]
  17. Evans, P. The effects of incising on the checking of wood: A review. International Wood Products Journal 2016, 7, 12–25. [CrossRef]
  18. (US), F.P.L. Air Drying of Lumber; Vol. 117, US Department of Agriculture, Forest Service, Forest Products Laboratory, 1999.
  19. Dickson, A.; Dawson, B. Using cell cross-section dimensions and digital image correlation to evaluate drying shrinkage and collapse in Eucalyptus nitens wood. BioResources 2020, 15, 6149–6164.
  20. Gonya, N.; Naghizadeh, Z.; Wessels, C. An investigation into collapse and shrinkage behaviour of Eucalyptus grandis and Eucalyptus grandis-urophylla wood. European Journal of Wood and Wood Products 2022, 80, 139–157. [CrossRef]
  21. Fu, Z.; Chen, J.; Zhang, Y.; Xie, F.; Lu, Y. Review on wood deformation and cracking during moisture loss. Polymers 2023, 15, 3295. [CrossRef]
  22. Gril, J.; Jullien, D.; Bardet, S.; Yamamoto, H. Tree growth stress and related problems. Journal of Wood Science 2017, 63, 411–432. [CrossRef]
  23. Mugabi, P.; Rypstra, T.; Vermaas, H.; Nel, D. Zusammenhänge zwischen Trocknungsfehlerparametern und ausgewählten Wachstumseigenschaften von technisch getrockneten, südafrikanischen Eucalyptus grandis Masten. European Journal of Wood and Wood Products 2010, 68, 329–340.
  24. Yin, Q.; Liu, H.H. Drying stress and strain of wood: A Review. Applied Sciences 2021, 11, 5023. [CrossRef]
  25. Tomczak, K.; Tomczak, A.; Jelonek, T. Effect of Natural Drying Methods on Moisture Content and Mass Change of Scots Pine Roundwood. Forests 2020, 11, 668. [CrossRef]
  26. Evans, P.D.; Wingate-Hill, R.; Barry, S.C. The Effects of Different Kerfing and Center-Boring Treatments on the Checking of... Forest products journal 2000, 50.
  27. Simpson, W.T.; Wang, X.; others. Estimating air-drying times of small-diameter ponderosa pine and Douglas-fir logs. Forest Products Journal and Index 2004, 54, 24–28.
  28. Lee, C.J.; Oh, S.W.; Lee, N.H.; Kang, C.W. Effect of the knife-incising pretreatment on the surface checks occurrence of red pine heavy timber after drying. European Journal of Wood and Wood Products 2017, 75, 143–145. [CrossRef]
  29. Yeo, H.; Eom, C.D.; Smith, W.B.; Shim, K.B.; Han, Y.; Park, J.H.; Lee, D.S.; Lee, H.W.; Park, M.J.; Park, J.S.; others. Effects of center boring and kerf treatment on kiln-drying of larch square and round timbers. Forest products journal 2007, 57.
  30. Lee, N.H.; Zhao, X.F.; Shin, I.H.; Lee, C.J. Air Circulating Oven-drying Characteristics of Hollowed Round-post for Korean Main Conifer Species-Part 2: For Korean red pine hollowed round-post. Journal of the Korean Wood Science and Technology 2012, 40, 61–70. [CrossRef]
  31. Park, J.; Park, Y.; Han, Y.; Choi, J.; Choi, I.; Lee, J.; Yeo, H. Effect of outer surface sealing treatment on the reduction of surface check occurrence during the drying of center-bored round timber. Drying technology 2014, 32, 236–243. [CrossRef]
  32. Lim, J.; Oh, J.K.; Yeo, H.; Lee, J.J. Behavior of center-bored round timber beams in center-point bending test. Journal of wood science 2013, 59, 389–395. [CrossRef]
  33. Martins, C.; Dias, A.M.; Cruz, H. Bonding performance of Portuguese Maritime pine glued laminated timber. Construction and Building Materials 2019, 223, 520–529. [CrossRef]
  34. Pinilla Suárez, J.C.; Vásquez, V.; Hernández, C.; Luengo Vergara, K.; Campos, P.; Elgueta, M.; Catalán, L.; Navarrete, T.; others. Tensiones admisibles de la madera aserrada de aromo (Acacia dealbata D. Link.) clasificada visualmente 2019.
  35. Ananías, R.A.; Salvo, L.; Estrada, R.; Briones, R. Estudio experimental del secado a temperaturas convencionales de acacias. Maderas. Ciencia y tecnología 2008, 10, 151–162. [CrossRef]
  36. Rocha-Sepúlveda, M.F.; Vega, M.; Gendvilas, V.; Williams, D.; Harrison, P.A.; Vaillancourt, R.E.; Potts, B.M. R-based image analysis to quantify checking and shrinkage from wood wedges. European Journal of Wood and Wood Products 2021, 79, 1269–1281. [CrossRef]
  37. Schneider, C.A.; Rasband, W.S.; Eliceiri, K.W. NIH Image to ImageJ: 25 years of image analysis. Nature methods 2012, 9, 671–675. [CrossRef]
  38. RStudio Team, U.; others. RStudio: integrated development for R, 2020.
  39. Tamarit-Urias, J.C.; Quintanar-Olguin, J.; Ordóñez-Prado, C.; Rodríguez-Acosta, M.; Fuentes-López, M.E. Evaluation of the solar drying process of Guadua aculeata Rupr. ex E. Fourn. culms. Revista mexicana de ciencias forestales 2023, 14, 141–164.
  40. Montero, C.; Rozas, C. Estudio exploratorio para la caracterización de la tasa de secado de la madera de Eucalyptus nitens, aplicando modelos de regresión múltiple. Scientia Forestalis Piracicaba 2019, 47, 105–113. [CrossRef]
  41. Machado, J.S.; Louzada, J.L.; Santos, A.J.; Nunes, L.; Anjos, O.; Rodrigues, J.; Simões, R.M.; Pereira, H. Variation of wood density and mechanical properties of blackwood (Acacia melanoxylon R. Br.). Materials & Design (1980-2015) 2014, 56, 975–980. [CrossRef]
  42. Dinwoodie, J. Timber. (No Title) 2000, p. 212.
  43. Botter-Kuisch, H.; Van den Bulcke, J.; Baetens, J.; Van Acker, J. Cracking the code: real-time monitoring of wood drying and the occurrence of cracks. Wood Science and Technology 2020, 54, 1029–1049. [CrossRef]
  44. Lee, C.J.; Eom, C.D. Effects of knife-incising and longitudinal kerfing pretreatments on high-temperature drying of red pine and pitch pine timbers. BioResources 2021, 16, 8184.
  45. Dias, A.; Morgado, T.; Negrão, J.; Saporiti Machado, J. Connection for round wood timber members using multiple glued-in rods 2014.
  46. Huybers, P. Timber pole space frames. International Journal of Space Structures 1987, 2, 77–86.
Figure 2. Samples Arrangement for the Air-Drying Process: (a) Kerfing treatment samples, (b) Reference samples and (c) Hollowing treatment samples.
Preprints 108722 g002
Figure 3. Measurement of Cracking on Log End-Faces: (a) Device used to maintain a distance of 200 mm, (b) Reference axes drawn over each log end-face, (c) Overlaid acrylic for orientation and scale purposes and (d) Description of the circular concentric rings overlaid on a log end-face
Preprints 108722 g003
Figure 5. Relative cracking (cr) evolution per each ring only over the 30 end faces of the Reference samples (R). The grey rectangular area indicates the pass from close to 30% MC until below this value. x: Early end-faces cracking; y: max cracking; z: final measurement.
Preprints 108722 g005
Figure 6. Typical cracking formation at three measurement points: Early end-face cracking with (a) and (b); Maximum cracking with (c), and (d); and Final cracking at EMC: (e), and (f). The pictures correspond to the end faces of logs 5b/12b.
Preprints 108722 g006
Figure 7. Curves of reduction indicator "ired" of both K-2k (a) and K-3k (b) treatment for each ring. The grey rectangular area indicates the pass from close to 30% MC until below this value.
Preprints 108722 g007
Figure 8. Curves of reduction indicator "ired" of both H-16mm (a) and H-30mm (b) treatment for each ring. The grey rectangular area indicates the pass from close to 30% MC until below this value.
Preprints 108722 g008
Figure 9. Boxplots comparing the end-faces of untreated samples in black/white, R, with their treated otherface in two shades of grey, K-2k, K-3k, H-16mm, and H-30mm, for the variable relative cracking, c r , on peripheral ring, r p (a) and ring 2, r 2 (b). In the top left corner, the significance level for the t-test is indicated, with: * = p < 0.05; ** = p < 0.01; *** = p < 0.001; ns = not significant. The cross on each box indicates the mean value.
Preprints 108722 g009
Figure 10. Boxplots comparing the end-faces of untreated samples in black/white, R, with their treated otherface in two shades of grey, K-2k, K-3k, H-16mm, and H-30mm, for the variable number of cracking ( n r ) on peripheral ring, r p (a) and ring 2, r 2 (b). In the top left corner, the significance level for the t-test is indicated, with: * = p < 0.05; ** = p < 0.01; *** = p < 0.001; ns = not significant. The cross on each box indicates the mean value.
Preprints 108722 g010
Figure 11. (a) Comparison of total cracking ( c r ) between the final reference face in red line (R) and the final face with Kerfing treatment (K) in black and its variants, K-2k and K-3k. The c r of the treatment (K) distinguishes between the area external to the kerfs in dark grey and the area absorbed by the kerf in light grey. (b) Image of the "promoter" effect of Kerfing on the end face of log A-7.
Preprints 108722 g011
Figure 13. Cross cutting scheme at the end-face of the log
Preprints 108722 g013
Table 1. Description of the sample sizes for this study. The pairs of ends in the second row refer to pairs formed by an untreated face and a treated face, and the third row indicates their specific variations.
Reference(R) Kerfing (K) Hollow (H)
Samples 16 16 16
End-faces pairs - 16 16
Variations - 8 (K-2k) 8 (K-3k) 8 (H-16mm) 8 (H-30mm)
Table 2. Descriptive statistics of en-face crack results: relative cracks ( c r ) and number of cracks ( n r ). Includes Mean, standard error (S.Error), standard deviation (SD), maximum (Max) and minimum (Min) values, and count (Count).
c r ( % ) n r ( n dm)
r1 r2 r3 r4 rp r1 r2 r3 r4 rp
Reference
Mean 5.36 3.75 3.68 3.79 3.36 6.86 4.18 3.68 2.93 2.37
S.Error 0.47 0.27 0.24 0.20 0.18 0.32 0.26 0.21 0.19 0.14
SD 2.55 1.48 1.34 0.75 0.96 1.83 1.49 1.21 0.73 0.79
Max 10.76 6.82 6.94 4.82 5.73 11.14 7.16 6.90 3.98 3.81
Min 1.03 0.84 1.13 2.63 1.01 4.77 1.59 1.59 1.99 0.77
Count (uts.) 30 30 30 14 30 32 32 32 14 32
K-2k
Mean 4.61 3.31 1.99 1.24 0.74 6.57 5.17 4.05 2.29 1.39
S.Error 1.50 0.75 0.64 0.33 0.18 0.87 0.54 0.55 0.59 0.20
SD 3.97 1.98 1.70 0.67 0.49 2.47 1.53 1.55 1.19 0.57
Max 11.55 6.54 5.48 1.84 1.52 9.55 7.16 6.90 3.98 2.44
Min 0.64 1.25 0.45 0.28 0.28 1.59 3.18 2.65 1.19 0.52
Count (uts.) 7 7 7 4 7 8 8 8 4 8
K-3k
Mean 4.28 3.54 2.15 1.08 0.70 6.17 5.17 3.65 2.92 1.16
S.Error 1.00 0.60 0.62 0.22 0.38 0.47 0.50 0.80 0.13 0.40
SD 2.82 1.70 1.76 0.38 1.07 1.33 1.41 2.28 0.23 1.14
Max 9.23 6.25 5.13 1.37 3.20 7.96 7.16 6.90 3.18 3.06
Min 0.89 1.45 0.33 0.66 0.00 4.77 3.18 0.53 2.79 0.00
Count (uts.) 8 8 8 3 8 8 8 8 3 8
H-16mm
Mean 3.78 3.31 3.22 3.33 3.03 6.68 5.25 4.24 4.24 2.36
S.Error 0.89 0.63 0.49 0.56 0.42 0.62 0.38 0.36 0.87 0.13
SD 2.68 1.88 1.48 0.97 1.26 1.96 1.20 1.15 1.51 0.41
Max 8.57 6.37 6.10 4.43 5.53 9.55 7.16 5.84 5.97 3.12
Min 0.65 1.08 1.71 2.62 1.75 4.77 3.98 2.65 3.18 1.66
Count (uts.) 9 9 9 3 9 10 10 10 3 10
H-30mm
Mean - 2.55 2.94 3.11 3.11 - 4.51 4.16 3.28 2.61
S.Error - 0.52 0.36 0.43 0.25 - 0.34 0.59 0.25 0.38
SD - 1.28 0.87 0.85 0.61 - 0.82 1.44 0.50 0.93
Max - 4.47 4.15 4.21 4.02 - 5.57 6.90 3.98 4.21
Min - 0.92 2.03 2.20 2.38 - 3.18 2.65 2.79 1.79
Count (uts.) - 6 6 4 6 - 6 6 4 6
Table 3. Analysis of Variance and Tukey’s mean comparison test to evaluate differences between the different radial positions for the variable relative cracking ( c r ) and number of cracks ( n r ).
c r n r
r1 r2 r3 r4 rp r1 r2 r3 r4 rp
r1 - - - - - - - - - -
r2 0.002 * - - - - < 0.001 * - - - -
r3 < 0.001 * 0.999   n s - - - < 0.001 * 0.569   n s - - -
r4 0.026 * 0.999   n s 0.999   n s - - < 0.001 * 0.032 * 0.039 * - -
rp < 0.001 * 0.884   n s 0.941   n s 0.927   n s - < 0.001 * < 0.001 * < 0.001 * 0.694   n s -
Value-F 6.96 51.29
Value-p < 0.001 ** < 0.001 **
14.1cm * Significative at significance level of 5 % using an HSD Tukey test.   n s No significantly different, at significance level 5% using an HSD Tukey test. ** Significant at 5% significance, using the F-test.
Disclaimer/Publisher’s Note: The statements, opinions and data contained in all publications are solely those of the individual author(s) and contributor(s) and not of MDPI and/or the editor(s). MDPI and/or the editor(s) disclaim responsibility for any injury to people or property resulting from any ideas, methods, instructions or products referred to in the content.
Copyright: This open access article is published under a Creative Commons CC BY 4.0 license, which permit the free download, distribution, and reuse, provided that the author and preprint are cited in any reuse.
Prerpints.org logo

Preprints.org is a free preprint server supported by MDPI in Basel, Switzerland.

Subscribe

© 2024 MDPI (Basel, Switzerland) unless otherwise stated