Submitted:
09 June 2024
Posted:
11 June 2024
You are already at the latest version
Abstract
This paper examines the marketing mix of rattan canes businesses, with a focus on small and medium enterprises (SMEs). Rattan cane enterprises rely on both domestic and international sources for raw materials, and the market is largely unorganized, with individual-level operations dominating the industry. The primary aim of this study is to evaluate the marketing mix in relation to the 7Ps framework, which includes price, product, place, promotion, people, process, and physical evidence. A simple random sampling method was employed to select participants from rattan processing enterprises. A questionnaire survey was then conducted among 46 rattan entrepreneurs, representing a total of 66 enterprises, including rattan processing industries, rattan traders, and Community Forest User Groups. The findings of the study indicate that, among the seven Ps, place and process are relatively stronger aspects of service delivery, while price and people are considered moderate. However, product, promotion, and physical evidence are identified as weak areas in terms of service delivery within the rattan business. It is concluded that rattan processing industries continue to rely on traditional tools and technologies, which has resulted in a lack of competitiveness in penetrating both national and international markets. Furthermore, poorly segmented distribution channels have hindered their sales efforts, while limited promotional activities have restricted awareness of their products among potential customers. In conclusion, the study highlights the need for rattan businesses to modernize their operations and adopt more effective marketing strategies in order to enhance their competitiveness and expand their market reach.
Keywords:
price
; product
; place
; promotion
; people
; process
; physical evidence
Introduction
Rattan is a valuable non-wood forest product (NWFP) in Nepal (Subedi 2006, Paudel and Chowdhary 2005), contributing to biodiversity and the local economy (Bystriakova et al., 2000; Belcher, 1995; Weinstock, 1983). It is used for various purposes, including furniture frames, basketry, ropes, mats, and bird cages (Sunderland, 1999, Chowdhary & Paudel, 2008). In Nepal, major rattan products are indoor handicrafts such as chairs, tables, sofa sets, hangers, tools, baskets, and decorative items. There are 57 processing enterprises in Nepal, with 70% of them using raw rattan cane from India and other countries, and the rest relying on domestic rattan (Chowdhary & Dutta, 2021). Rattan furniture industries create employment and income-generating opportunities for a wide range of people (Benton et al., 2011). Community-based rattan resource management approaches can be cost-effective and reliable, with total earnings by rattan entrepreneurs, CFUGs, and service providers accounting for 59.35 million in Nepal (Chowdhary, 2017; Chowdhary & Dutta, 2021).
Marketing strategies for rattan cane furniture can target consumers who are pro-environmentalists or those who want to use products to enhance their social image and attract price premiums (Amoah et al., 2015). Knowledge of consumer needs and desires is an integral part of marketing strategies (Karki & Chowdhary2018) if products are consumer-oriented (Pakarinen, 1999). Enterprise and marketing development is the commonly used approach of business planning adapted by development cooperation agencies for training and serving micro- and small-scale enterprises (Lecup et al., 1998; INBAR 2016).
The marketing mix is a foundation model for business, historically centered on product, price, place, and promotion (also known as the “4Ps”). However, in recent years, numerous modifications to the 4Ps framework have been proposed (Kotler, 1986; Mindak, 1981; Nickel, 1976). Booms and Bitner’s (1990) extended marketing mix for services into a 7Ps framework in the context of consumer goods, marketing situations, and demonstrates the clear advantages it has over the 4Ps framework. According to Kotler (1986) and Bitner (1990), the 7Ps include price, products, place, promotion, people, process, and physical evidence.
The elements of price are positioning, list, discounting, credit, payment method, and free value-added elements. Products include quality, image, branding, features, variants, support, customer service, availability, and warranty. The element of place includes trade channel, sales supports, channel number, and segmented channel. The promotion includes marketing communication, personal promotion, sales promotion, branding, and direct marketing. People include individuals on marketing activities, individuals on customer contacts, recruitment, cultural image, training and skills, and remuneration. The process includes customer-focused business-led design features, research and development. Lastly, physical evidence includes sales/staff contact experiences of the brand, product packaging, and online experiences.
The marketing mix is important for businesses to understand the products or services they can offer to customers through proper planning for a successful product offering, developing and executing effective marketing strategies, analyzing whether the product or service is suitable for customers, and learning when and how to promote the product or service to customers. This paper identifies the marketing mix of the rattan business, focusing on price, product, place, promotion, people, process, and physical evidence to capture the marketing scenario regulatory environment.
Methods and Material
Based on the information provided, the methodology used in the study involved a combination of simple random sampling and proportionate random sampling to select rattan Small and Medium Enterprises (SMEs) and Community Forest User Groups (CFUGs) in Nepal. The sample size was determined using the equation developed by Yamane (1967) at a 95% confidence level, based on the total availability of rattan processing enterprises in the target areas.
Data collection was conducted through face-to-face and self-administered questionnaires with marketing managers or owners of rattan processing SMEs. Out of the 57 SMEs operating in Nepal, 35 SMEs were surveyed, with 25 located in the Kathmandu Valley and the remaining situated in other major cities. The respondents consisted of marketing managers or owners of the SMEs, with a mix of men and women.
The survey encompassed 35 rattan processing and manufacturing SMEs, 526 households (HHs), 10 executive members of the CFUGs, and 3 Key Informant Interviewees (KIs). Two types of SMEs were selected: private rattan processing SMEs and community-managed rattan forests representing various geographical locations.
The marketing mix elements - Price, Product, Place, Promotion, People, and Process - were analyzed to understand the strengths and weaknesses of the companies’ marketing strategies. Each element was scored based on the number of service deliveries and the weightage of the element. For example, the element “Price” was analyzed based on six delivery services with scores ranging from 1.5 to 3.5. The total score obtained for each element was then provided.
Overall, the study employed a combination of sampling methods to gather data from a diverse set of respondents and utilized a structured approach to analyze the marketing mix elements in order to assess the marketing strategies of the rattan processing SMEs.
Data Analysis
The qualitative data collected from transcripts of personal observations and voice recordings were categorized into themes, and detailed notes were compiled. The themes were then examined to establish connections among the data, concepts, and theories. The quantitative data were assessed using descriptive statistics such as mean and median with the Statistical Package for the Social Sciences (SPSS) version 20. The 7Ps components were evaluated in terms of service provision, with each component assigned a score ranging from 13 to 15 based on the frequency of service deliveries, where 13 represented the minimum score and 15 the maximum. Additionally, the service delivery itself was rated between 1.5 and 3.25 based on the range of delivery services provided.
Result and Discussion
Marketing of rattan has been analysed using marketing mix tools.
1. Price
The prices of rattan products were typically determined by entrepreneurs based on the cost of production and the market price. Out of the 35 rattan processing industries/entrepreneurs surveyed, 33 (94.3%) indicated that the cost of rattan products was fixed based on the cost of production, while two entrepreneurs (5.7%) mentioned that the market price played a role.
Payment methods for rattan items depended on the types of customers and the volume of products they purchased. Rattan items were typically sold using cash, advance, and lending payment methods. Cash payment was commonly used for small transactions and new customers, while advance payment was practiced for large-volume sales, especially for bulk orders from hotels or other establishments. Lending payment was used for small transactions with trustworthy customers. The processing centers usually took 10 to 15 days to supply the products.
There was generally a 10 to 15 percent annual increment in the cost of rattan products due to production costs, primarily driven by the increasing price of raw materials by 5-15 percent per year. Rattan furniture was relatively more expensive than other items due to the cost of raw materials. Nigalo (Drepanostachyum khasianum), a local raw material, was used in combination with rattan cane to reduce production costs.
Customers were primarily concerned about the latest designs and good quality furniture, with price being a significant consideration (MDBRPP/DFRS, 2010). However, only a few rattan processors were competent in producing quality furniture due to a lack of skilled labor availability. This had led to a decrease in the overall quality of rattan furniture in recent times.
Rattan furniture was mainly sold through outlets, with customers preferring affordable, high-quality, and attractive options. While some customers preferred strong furniture, there were complaints about quality, leading some to bring furniture for repair to the processing centers.
2. Products
When ordering rattan furniture items, customers tended to prioritize modern designs and high-quality products based on their preferences. Some customers even brought photos and catalogs to place an order, which the processing industries fulfilled accordingly (A. Pradhan, personal communication, December 1, 2015). More than 32 (91.4%) entrepreneurs reported that customers preferred high-quality products at a lower price point, and design variation was crucial in their decision-making process. They tended to favor attractive designs that blended new looks with practicality and durability. However, entrepreneurs also noted that Nepalese rattan furniture was less competitive in the market due to its association with luxury and high cost, leading to less frequent use for household purposes in Nepal. According to Peter (1989), the design brief for rattan furniture should have considered factors such as the intended user’s size, space, product shape and color preferences, coordination with existing décor, price point, expected lifespan and replacement cycle, degree of comfort, and visible quality to ensure customer satisfaction. Mokhtar et al. (2014) has strongly supported the fact that mix relationship among the components of market orientation critical success factors in SMEs performance.
Despite the potential for branding rattan products, Nepalese rattan entrepreneurs were generally less aware of its importance. Only 2 (5.7%) entrepreneurs recognized the need for branding, whereas 33 (94.3%) had no idea about it. Even in community forests, where production branding could have been beneficial, none of the entrepreneurs had realized its potential.
Furthermore, rattan furniture generally had no guarantee or warranty after sale, and customer care systems and feedback collection were not well-integrated into rattan furniture businesses. Only 8 (23%) entrepreneurs had received feedback from customers after selling their products, with most feedback relating to product defects and replacements. The rest, 27 (77%) entrepreneurs, had not received any feedback. Of those who received feedback, 9 (26%) entrepreneurs had improved their product quality, and 3% had revised their prices. However, the majority of entrepreneurs, 20 (57.4%), had not made any changes based on customer feedback (Table 1).
Among the Rattan entrepreneurs, 22 (63%) have not taken steps to inform customers about their products, while 13 (37%) have advertised through various methods. Nepalese rattan products are not standardized to national and international standards, with only 1 (2.9%) entrepreneur planning to register with Nepal Standard and ISO. The cost of production and selling price can vary up to 50% due to long-term storage, impacting potential profits. Additionally, the combination of rattan and Nigalo is popular in Kathmandu for cost reduction in production.
3. Place
The trade channels for community-produced rattan were constrained, involving producers, district-level traders, and processors. Rattan finished products were primarily distributed through outlets and processing centers, with 49% of entrepreneurs selling through outlets and 51% directly from factories, some utilizing shared outlets. Rattan from Kailali and Bardia districts was traded to major cities in western Nepal, including Surkhet, Nepalganj, and Dang, as well as Indian cities along the border. Nepalganj constituted about 90% of the total rattan business from Kailali and Bardia, with Indian cities holding the remaining 10%. Other Nepalese cities had a minimal share in the overall rattan business. Key stakeholders in community-managed rattan marketing included CFUGs/producers, entrepreneurs, district-level traders, and contractors/buyers.
4. Promotion
Rattan entrepreneurs traditionally did not rely on aggressive promotion in media or social media, arguing that their products did not require it. Only a small percentage of enterprises used promotional activities to advertise their products, with methods such as business leaflets, business cards, and social media like Facebook. In some cases, media personnel such as TV and newspaper correspondents contacted the enterprises for feature news, but they did not actively promote them. Some entrepreneurs took to promoting their products on social media, with a few also using printed leaflets. Visiting cards were commonly used to share with customers who visited their outlets. Despite the lack of aggressive promotion, rattan entrepreneurs (43%) were striving to become more competitive followed by premium price (26%). This included paying attention to attractive design, maintaining a premium price, and focusing on quality.

Table 2.
What have you made your furniture more competitive?
| SN | Description | Frequency | Percent |
| 1 | Attractive design | 15 | 43 |
| 2 | Premium price | 9 | 26 |
| 3 | Good quality | 6 | 17 |
| 4 | Nothing has thought yet | 5 | 14 |
| Total | 35 | 100 | |
5. People
In Nepal, rattan enterprises were categorized into two types: community forest user groups (CFUGs) and individual rattan processing industries or entrepreneurs. CFUGs were member-based networks of community people institutionalized for forestry development, and they were actively involved in marketing rattan from community forests. On the other hand, processing industries and enterprises were independently owned and operated by individuals.
While there were various training institutions that provided technical training for manufacturing bamboo and rattan handicrafts, there was a lack of trainers specializing in rattan management. The Council for Technical Education and Vocational Training (CTEVT) affiliated training institutes offered training to entrepreneurs, and the Cottage and Small Industry Offices (CSIO) were government institutions responsible for providing training and monitoring these enterprises.
6. Process
Rattan enterprises employed two types of labor: item count-based and monthly wage-based. Approximately 15 (40%) of processing industries paid their workers based on monthly wages, while 20 (57%) paid based on the piece count. Payment on a piece count basis was determined by the number of items prepared, with the rate depending on the size of the items, as it required time and skill. On average, these enterprises employed three laborers, although some had more than 30.
Rattan products were sold both at retail and wholesale levels, but they were not yet sold through online business. According to S.Katuwal (personal communication, 2 December 2017), the wages of skilled laborers depended on the work they performed. Wages were fixed based on the size and number of items, following an item basis wage practice. For instance, a sofa, which required tedious weaving work and took a week to complete, paid between Rs 5000-8000 per piece, while preparing a sitting stool yielded about NRS 150.
Most rattan enterprises had employed women laborers, with women generally earning between Rs 10,000 to 15,000 per month, depending on their skills. Some skilled women earned more than Rs 20,000 per month. Typically, women artisans handled lighter tasks such as piece cutting, scrapping, and nailing, while men took on heavier work such as framing, bending, molding, and shaping. Technical work was handled by specialized artisans. Industry owners encouraged women laborers to work more and earn more. The profit margin was 20-30 percent per item.
7. Physical Evidence
Rattan products were sold either as a set or on a piece-by-piece basis, depending on the customer’s preference. The majority, 25 (67%) of enterprises, sold their products according to the customers’ interest (Table 3).
For example, a customer might want to purchase a complete rattan furniture set, including a sofa, chairs, and a coffee table. In this case, the enterprise would sell the entire set as one unit. On the other hand, another customer might only be interested in purchasing individual rattan chairs for their patio. In this scenario, the enterprise would sell the chairs separately, on a piece-by-piece basis, allowing the customer to buy only what they need. This flexibility in sales options allowed the enterprises to cater to a diverse range of customer preferences and needs.
Rattan products are sold flexibly, either as complete sets or individual pieces, based on customer preference. The majority of enterprises (25, or 67%) follow this approach, tailoring sales to customer interest. For example, customers can buy complete furniture sets or individual pieces like chairs, showing the enterprises’ ability to meet diverse customer needs.
Details of Elements and Service Delivery
Based on the information provided, the marketing mix element of Price includes six service delivery aspects: Positioning, List, Discounting, Credit, Payment method, and Free of value-added methods. Each of these delivery services has a score of 2.33, and the total score obtained is 7.5.
This indicates that each service delivery aspect within the Price element has been evaluated and scored equally at 2.33, contributing to the total score of 7.5. (See Table A1 for details). This suggests a relatively balanced performance across the various aspects of the Price element in the marketing mix.
Further analysis would involve understanding the specific criteria and parameters used to assess each service delivery aspect and how these scores contribute to the overall effectiveness of the Price element in the marketing mix. Additionally, it would be important to consider how these scores compare to industry benchmarks or standards to gauge the performance more comprehensively. Overall performances of rattan enterprises based on marketing mix is presented in the Figure 1.
The analysis of the 35 rattan processing industries indicates that Nepalese rattan marketing mix results show significant areas for improvement across all elements. Particularly, the product element stands out as notably weaker, with design technology, branding, and warranty aspects being negligible. In contrast, the place element demonstrates relatively more progress compared to others, with a score of 25 percent.
Figure 2.
Percentage of score obtained by each elements.
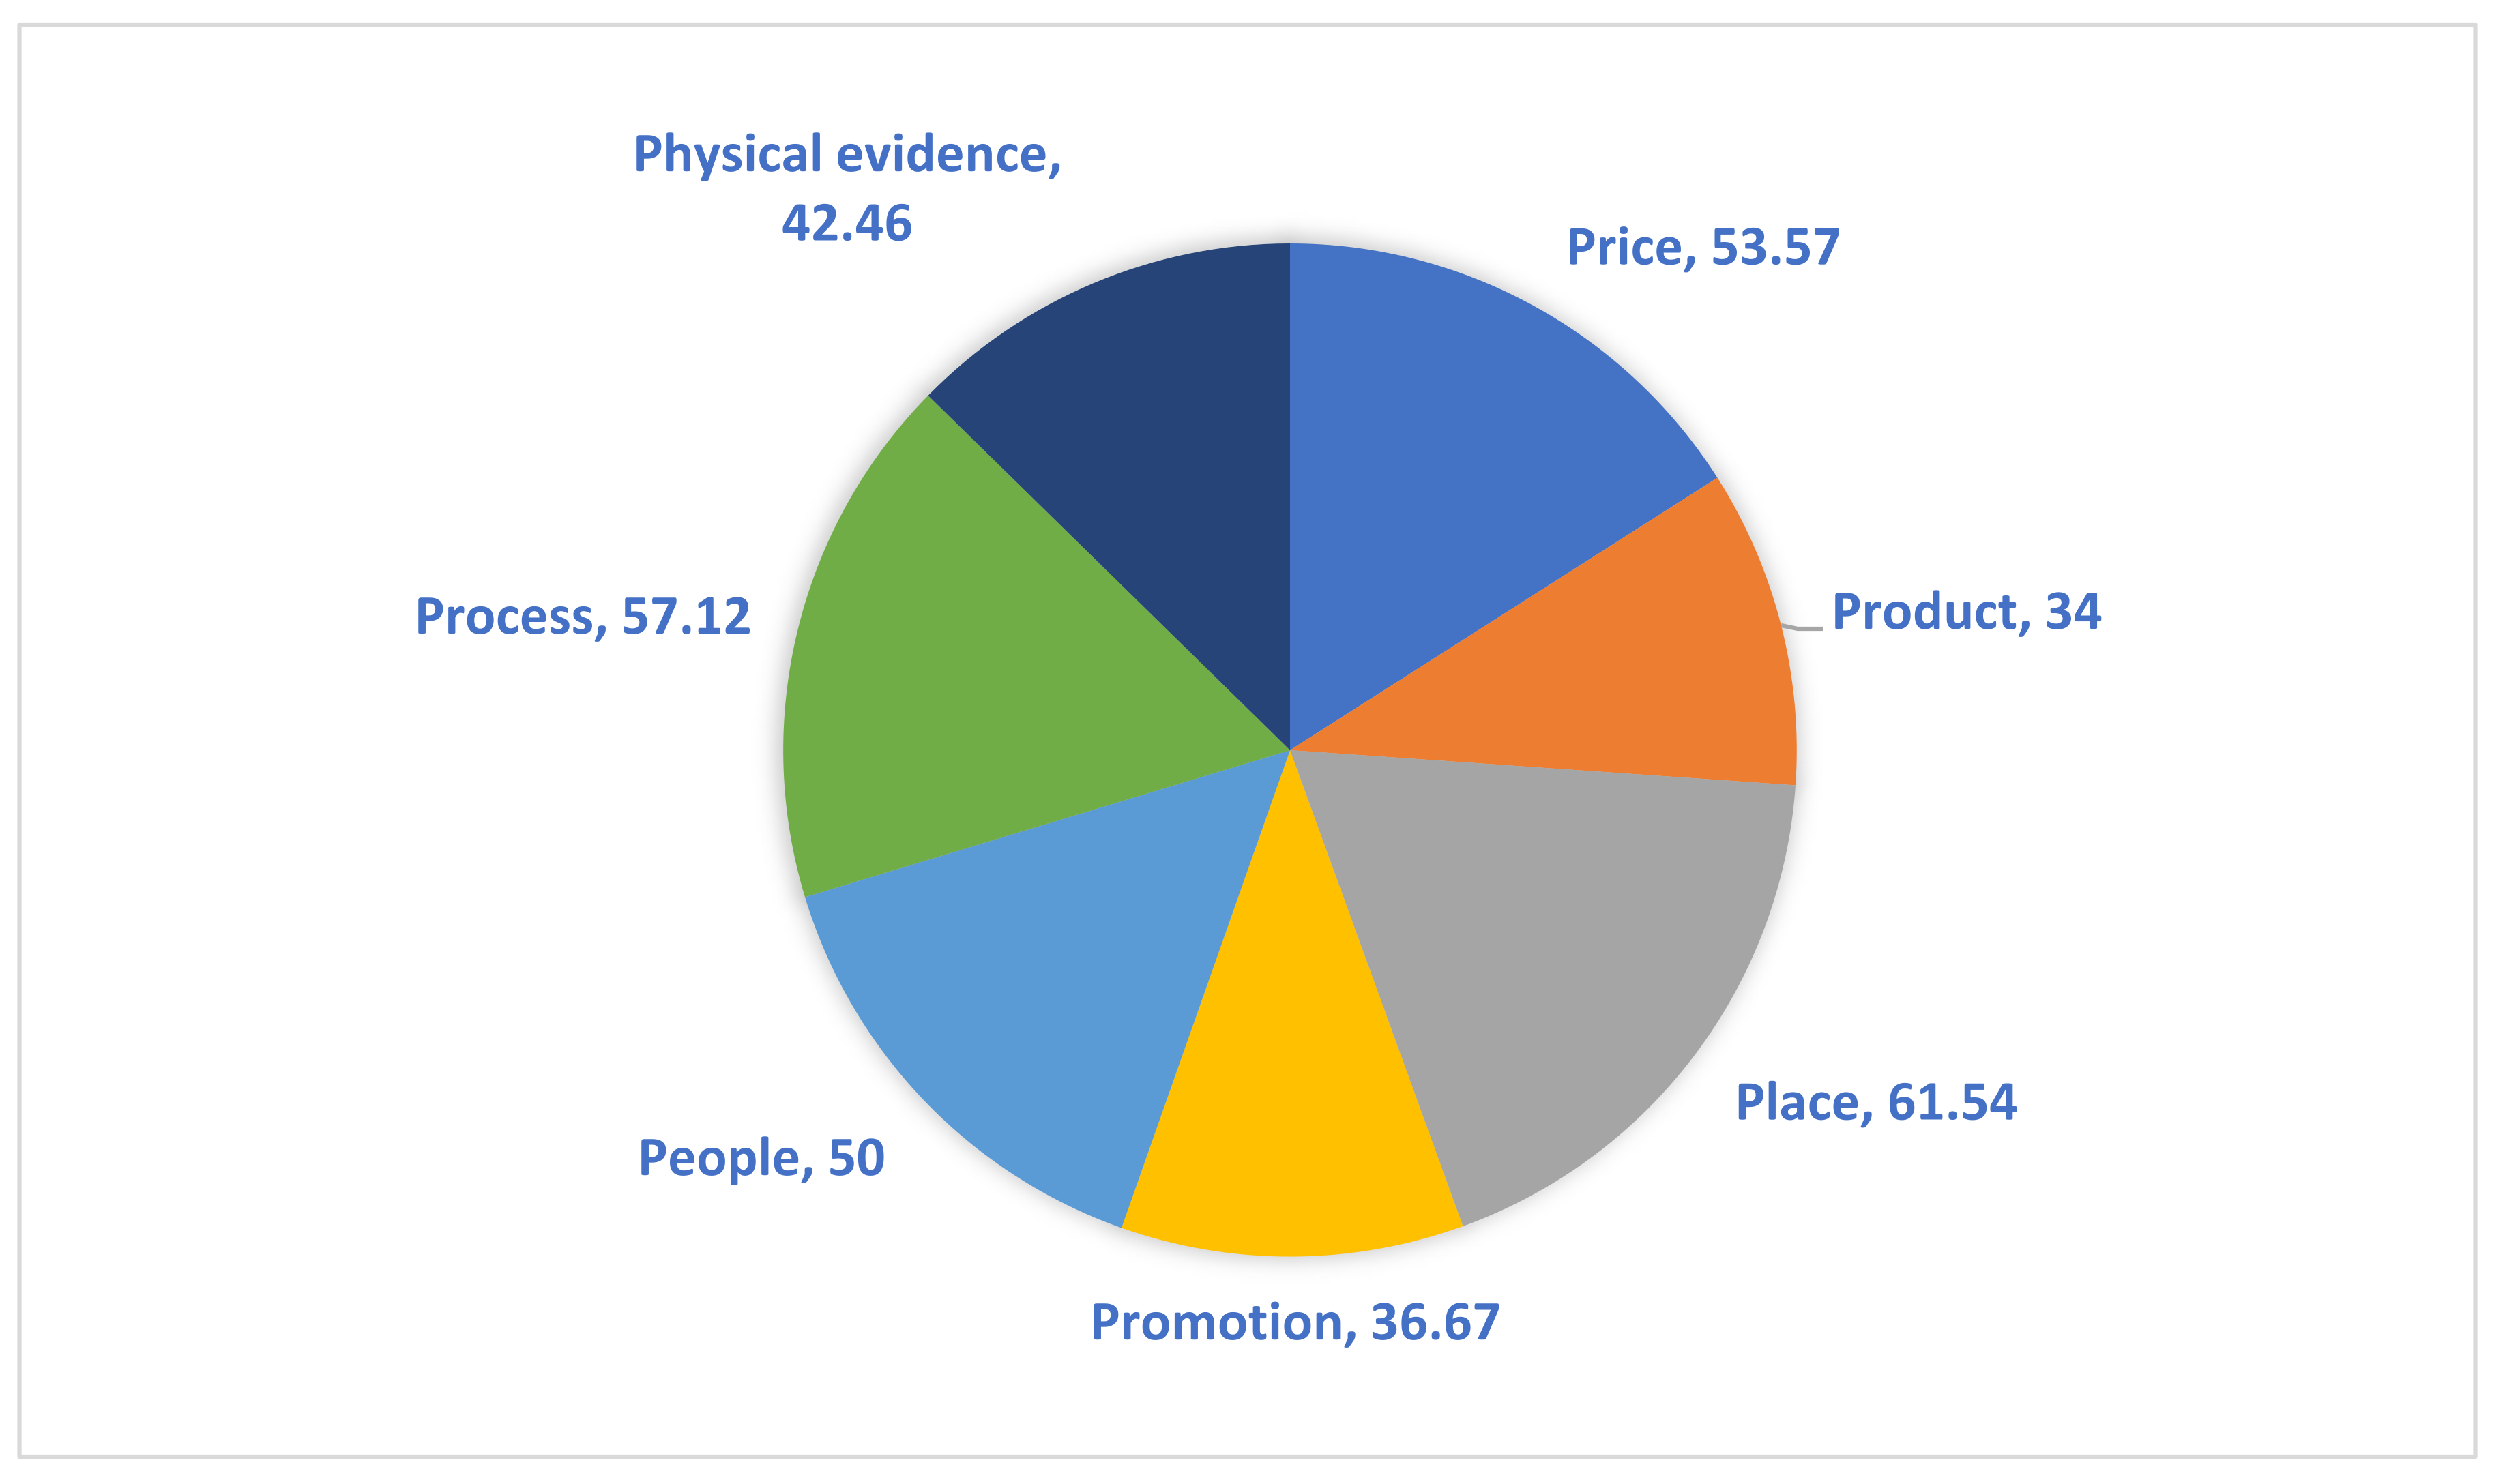
Based on the scores obtained by each element of the marketing mix, the following conclusions can be drawn:
- Price: The score for the price element is 53.57, indicating a relatively strong performance in this area. This suggests that the pricing strategies employed by the rattan processing industries are effective and competitive.
- Product: The product element scored 34, signifying a weaker performance. This indicates that there are areas such as design technology, branding, and warranty that need significant improvement in the products offered by the rattan processing industries.
- Place: The place element scored 61.54, demonstrating a comparatively strong performance. This suggests that the distribution and placement strategies for rattan products are effective and efficient.
- Promotion: The promotion element scored 36.67, indicating a weaker performance. This suggests that there is room for improvement in the promotional strategies used to market rattan products.
- People: The people element scored 50, indicating a moderate performance. This suggests that the human resources and customer service aspects within the rattan processing industries are fairly satisfactory but could benefit from further enhancement.
- Process: The process element scored 57.12, indicating a relatively strong performance. This suggests that the operational processes and systems employed by the rattan processing industries are efficient and well-structured.
- Physical Evidence: The physical evidence element scored 42.46, indicating a moderate performance. This suggests that the tangible aspects of the rattan products, such as packaging and presentation, could be improved.
Strengths and Weaknesses:
- Strengths: The strengths lie in the pricing strategies, distribution channels, operational processes, and human resources within the rattan processing industries.
- Weaknesses: The weaknesses are evident in product design technology, branding, warranty, promotional strategies, and physical evidence.
Recommendations:
- Focus on enhancing product design and technology to improve the overall quality and appeal of rattan products.
- Strengthen branding efforts to create a distinct identity for the products in the market.
- Improve promotional strategies to increase visibility and awareness of rattan products.
- Enhance physical evidence, such as packaging and presentation, to create a more appealing product display.
Overall, by addressing these areas of improvement, the rattan processing industries can further enhance their marketing mix and competitive position in the market.
The Nepalese rattan marketing mix analysis indicates a need for significant improvement across all elements. Specifically, the product element appears notably weaker, with design technology, branding, and warranty aspects being negligible. In contrast, the place element shows relatively more progress compared to others, with a score of 25 percent.
Appendix A
Table A1.
Details of Elements and service delivery.
| Elements | Score provided | Service Delivery | Score of each delivery services | Score obtained |
| Price | 14 | Positioning List Discounting Credit Payment method Free of value added methods |
2.33 | 7.5 |
| Product | 15 | Design Technology Usefulness Convenience Value Quality Packaging Branding Accessories Warranty |
1.5 | 5.1 |
| Place | 13 | Trade channel Sales support Channel number Segmented channel |
3.25 | 8 |
| promotion | 15 | Marketing communication Personal promotion Sales promotion Direct mailing Leaflet / posters Free gift |
2.5 | 5.5 |
| People | 15 | Individual on marketing activities Individual on customer contacts Recruitment Cultural image Training and skills Remuneration |
2.5 | 7.5 |
| Process | 14 | Retails Whole sales Mail order Direct sale Internet Peer to peer Multi-channel |
2 | 8 |
| Physical evidence | 14 | Websites Product packaging Online experiences Signage Business card Paper work |
2.33 | 6. |
References
- Amoah, M., P.K.Dadziet, F.K.Bih, & E.D.Wiafe. (2015). Consumers preference and purchase intentions for rattanb furniture. Wood and Fibre Science, 47, 225-239.
- Belcher, B. (1995). Bamboo and Rattan Production to Consumption Sytem: A framework for assessing development options.
- Benton, A., Cronin, T., Frith, O., & Jolanda Jonkhart, W. J. (2011). Market Potential of Bamboo and Rattan Products. Beijing: International Network for Bamboo and Rattan Organization (INBAR).
- Bitner, M., (1990). Evaluating Services Encounters: The effect of surroundings and employee response. Journal of Marketing, 69-82, Vol 54 (2). [CrossRef]
- Bystriakova, N., Dransfield, J., Kapo, V., & Lysenko, I. (2000). Potential distribution of rattans in Asia- Pacific and Africa. Cambridge: UNEP-WCMC.
- Chowdhary, C.L. & Dutta, I.C.(2021).Processing and marketing of rattan cane sin Nepal. Banko Jankari, Vol 31 No 2. PP 13- 25.
- Chowdhary, C.L. & Dutta, I.C.(2021). Contribution of rattan cane in livelihood resilience in relation to Community Forest User Groups and Rattan Processing Enterprises in Nepal. Nepal Journal of Multidisciplinary Research (NJMR), Vol 4, No 3, Septemebr 2021.Page PP 3- 23. ISSN: 2645-8470 (Print), ISSN: 2705-4691. [CrossRef]
- Chowdhary, C., & Paudel, S. (2008). Rattan Cultivation, Management and Development Initiatives in Nepal. Kathmandu: Kabita and Sunita.
- Chowdhary, C. (2017). Socio-economic and market study of rattan and its contribution to livelihood in Nepal. International Network for Bamboo and Rattan (INBAR). Beijing, China: INBAR.
- INBAR. (2016). An Overview 2016 on International Market of Bamboo and Rattan. International Bamboo and Rattan Organization. Beijing, China: International Bamboo and Rattan Organization.
- Karki, M. B., & Chowdhary, C. L. (2019). Non-Timber Forest Products (NTFPs) and Agroforestry Subsectors: Potential for Growth and Contribution in Agriculture Development. In A. K. Ganesh Thapa, Agriculture Transformation in Nepal: Trend, Prospects, and Policy Options (pp. 385-419). Springer Nature Singapore Pte Ltd.
- Katuwal, S. (2017, December 2). Gender and wage payment. (C.L.Chowdhary, Interviewer).
- Kotler, P. (1986, March/ April). Megamarketing. Harward Business Review, 4th, 117-124.
- Lecup, I., Nicholson, K., Purwandono, H., & Karki, S. (1998). Method for assessing the feasibility of Sustainable Non-Timber Forest Product based enterprises. In E. W. Ingels, Incomes from the Forest, Methods for the development and conservation of forest products for local communities (pp. 86-106). Indonesia: CIFOR and IUCN.
- McCarthy, E. Jerome, E., Perreault, W. 1984. Basic Marketing, Richard D Irwin, Homewood, IL. Available online: https://archive.org/details/basicmarketingma00mcca_1 (accessed on 6 June 2024).
- MDBRPP/DFRS. (2010). Review of Developed Western Markets for Bamboo and Rattan Commodities of Nepal. Department of Foret Research and Survey. Kathmandu: Market Development of Bamboo and Rattan Products with Potetnial (MDBRPP) Project.
- Mindak, W. a. (1981). A Fifth P: Public Relation. (J. a. Ins: Donnely, Ed.) Marketing of Services, 71-73.
- Mokhtar, S., Yusoff, R., & Ahmad, A. (2014). Key lements of market orientation on Malaysian SMEs performance. International Journal of Business and Society, 15(1), 49-64.
- Nickel, W. a. (1976, Winter). Packaging in the Fifth P in the Marketing Mix. Advanced Management Journal, 13-21.
- Pakarinen, T. (1999). Success factor of wood as a furniture material. Forest Product Journal, 49(9), 79-85.
- Paudel, S. & Chowdhary, C.L.1995. Managing Rattan as a Common Property: A case study of community rattan management in Nepal. Journal of Bamboo and Rattan. Environmentla Science Business. [CrossRef]
- Peters CM (1994) Sustainable harvest of non-timber plant resources in tropical moist forest: Anecological primer. Corporate, Landover, MD.
- Subedi, B. (2006). Linking Plant-based Enterprises and Local Communities to Biodiversity Conservation in Nepal Himalaya. New Delhi: Adwait Publishers.
- Sunderland, T.C. (2000). Rattan of West and Central Africa: An Overview. In T. C. Sunderland, & J. -P. Profizi (Ed.), Rattan of West and Central Africa: An Overview. Proceeding No 9, pp. 5-17. LImbe, Cameroon: INBAR.
- Weinstock, J. (1983). Rattan: Ecological balance in Borneo Rainforest Swidden. Economic Botany, 37(1), 58-68.
Figure 1.
Performances of rattan enterprises based on the marketing mix-7Ps.
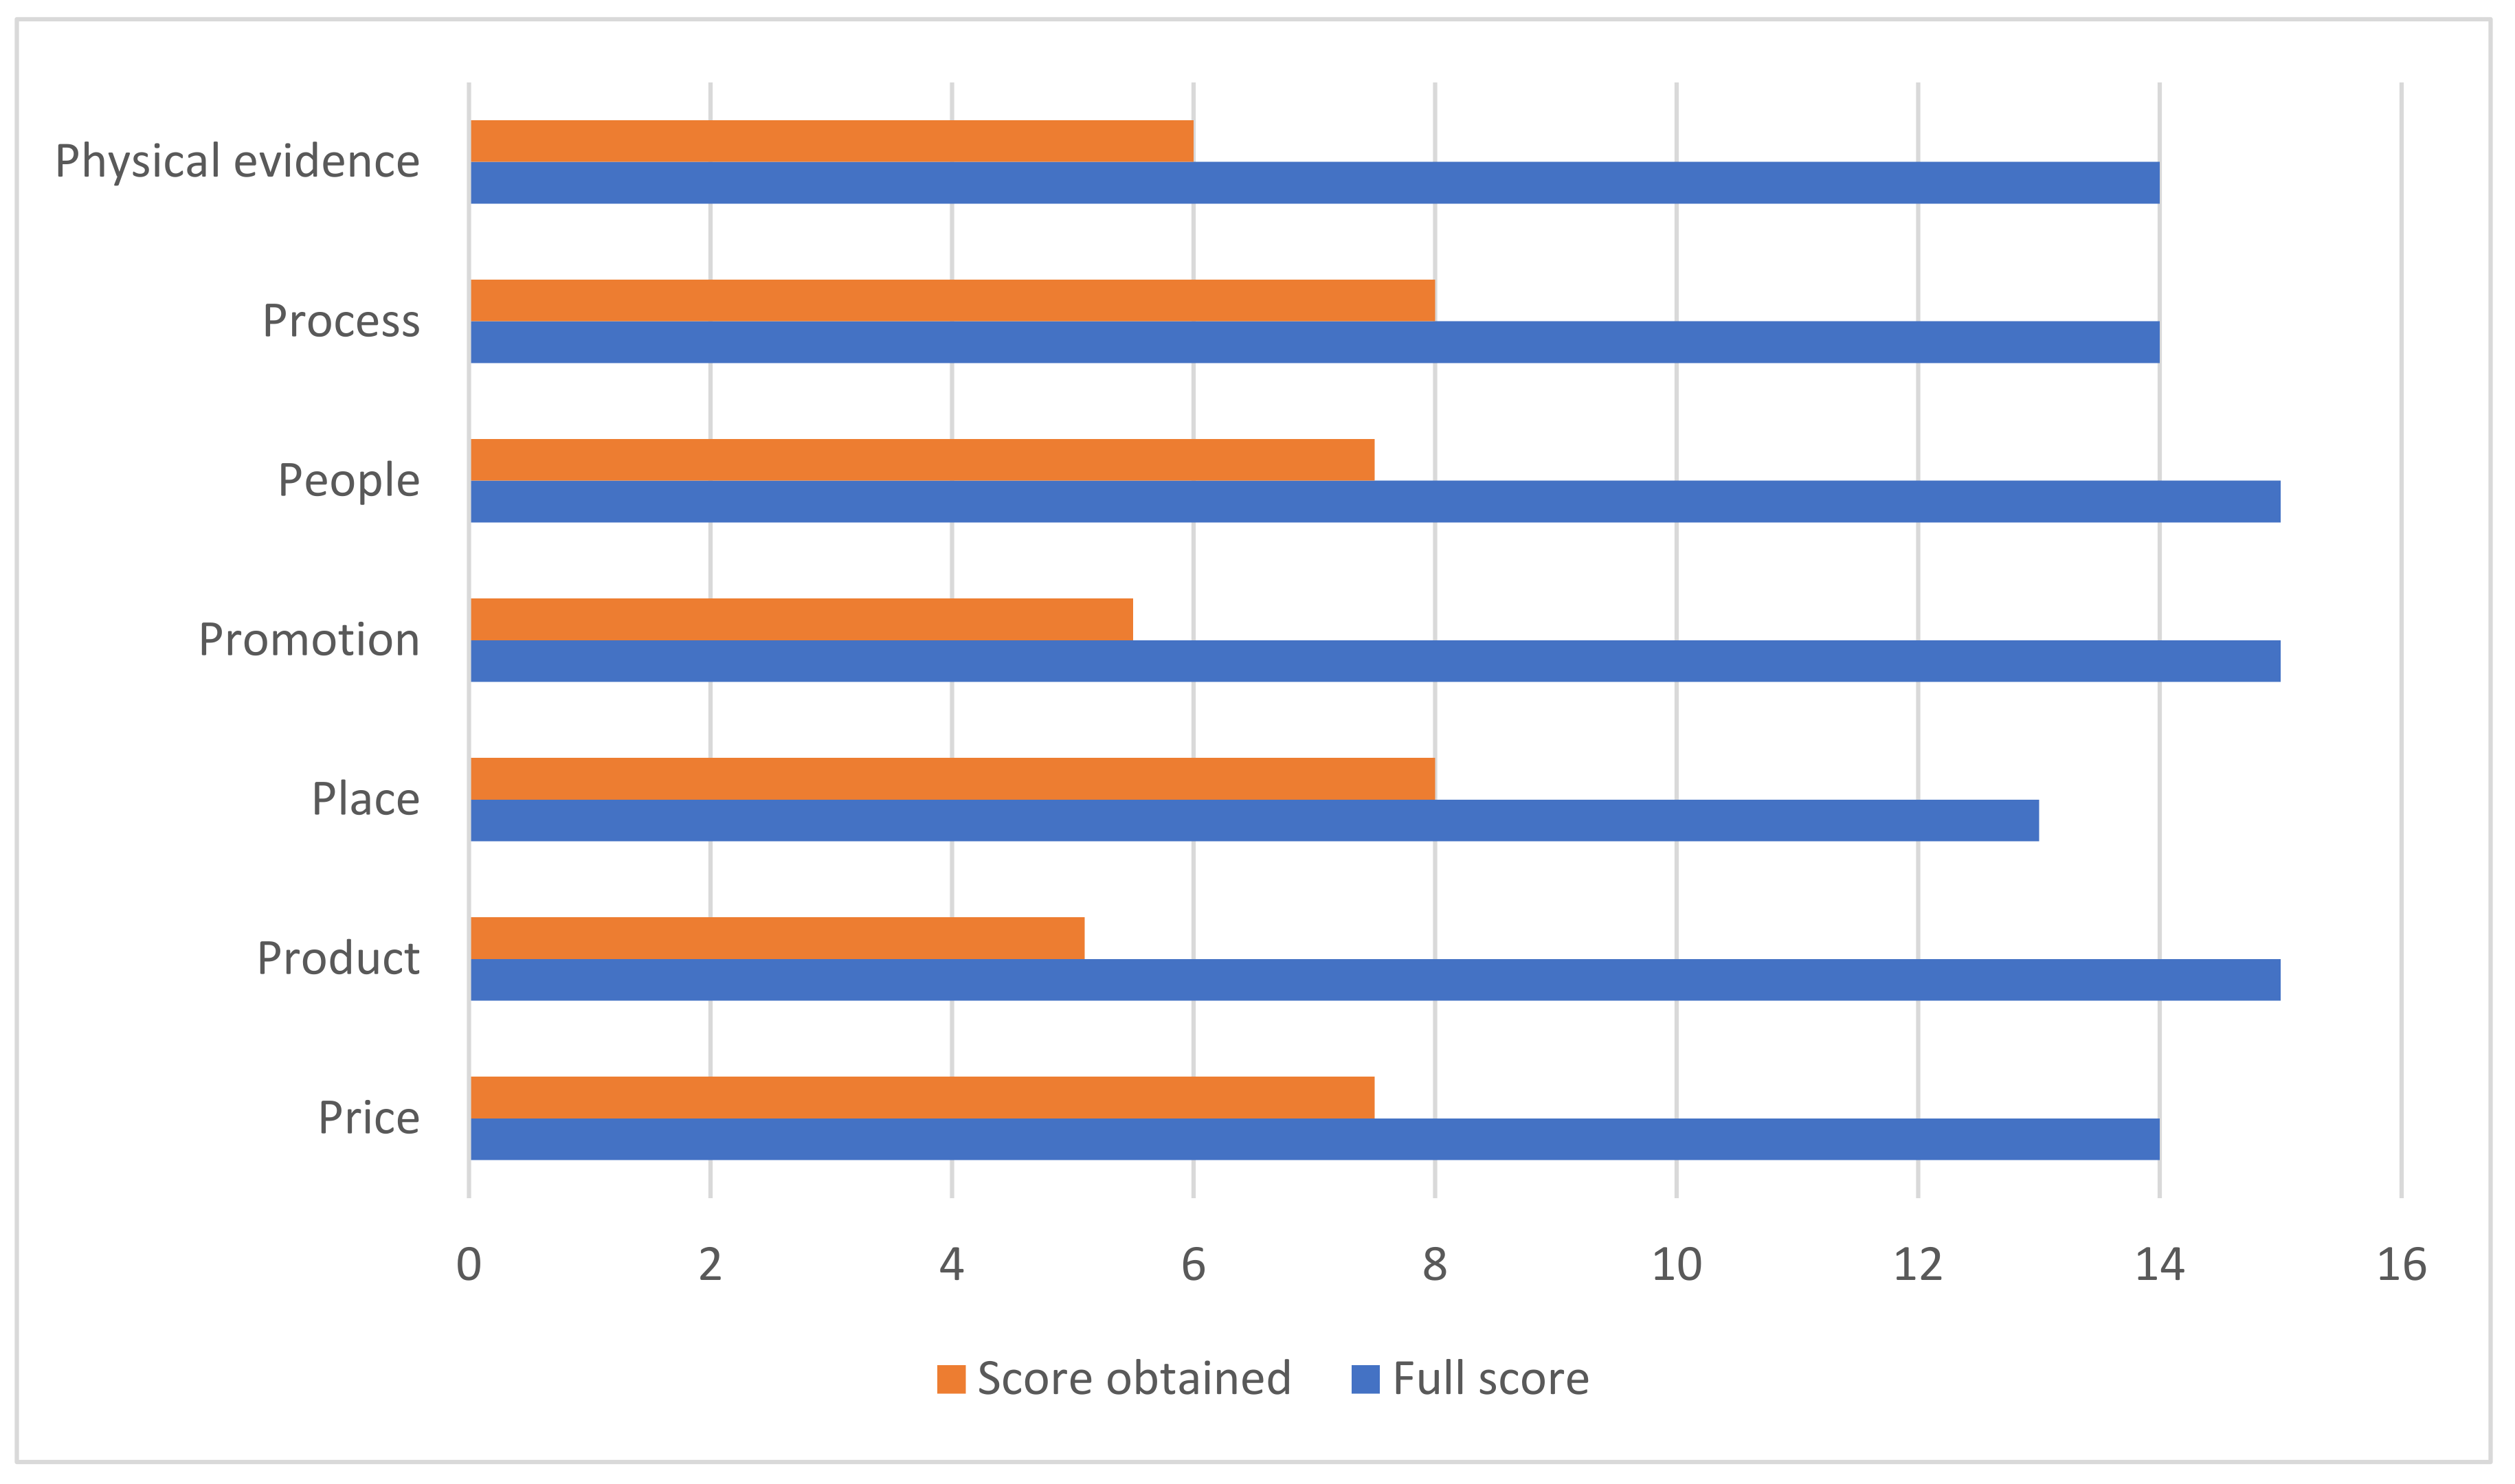
Table 1.
Settlement of customers complains after sale the products.
| Description | Frequency | Percent |
| Improving quality | 9 | 25.7 |
| Price revision | 3 | 8.6 |
| By discussion | 3 | 8.6 |
| Nothing had done | 20 | 57.4 |
| Total | 35 | 100 |
Table 3.
Mode of selling of rattan products.
| SN | Description | Frequency | Percent |
| 1 | In set | 3 | 7 |
| 2 | Piece basis | 7 | 20 |
| 3 | As per customers interest | 25 | 67 |
| Total | 35 | 100 |
Disclaimer/Publisher’s Note: The statements, opinions and data contained in all publications are solely those of the individual author(s) and contributor(s) and not of MDPI and/or the editor(s). MDPI and/or the editor(s) disclaim responsibility for any injury to people or property resulting from any ideas, methods, instructions or products referred to in the content. |
© 2024 by the author. Licensee MDPI, Basel, Switzerland. This article is an open access article distributed under the terms and conditions of the Creative Commons Attribution (CC BY) license (http://creativecommons.org/licenses/by/4.0/).
Copyright: This open access article is published under a Creative Commons CC BY 4.0 license, which permit the free download, distribution, and reuse, provided that the author and preprint are cited in any reuse.


