Preprint
Article

Improved Experimental Yield of Temperature Cycle Induced Deracemization (TCID) with Cooling and Crystal Washing: Application of TCID for the Industrial Scale.

Altmetrics

Downloads

110

Views

67

Comments

0

A peer-reviewed article of this preprint also exists.

Submitted:

07 June 2024

Posted:

11 June 2024

You are already at the latest version

Alerts
Abstract
Temperature Cycle Induced Deracemization (TCID) offers a promising approach to obtain enantiopure solids from racemic mixtures. By combining rapid racemization in solution and temperature swings, homochirality is theoretically achieved. Despite theoretical expectations of doubled yields compared to traditional chiral separation methods, such as in Preferential Crystallization, experimental validation remains lacking. We applied TCID to (1-(4-chlorophenyl)-4,4-dimethyl-2-(1H-1,2,4-triazol-1-yl) pentan-3-one) (Cl-TAK), introducing a post-TCID cooling step to enhance yield and a washing step to augment enantiopurity. This refinement yielded an 89.8% mass yield with 99.1% enantiomeric excess in the crystal phase (c.e.e.) within 24 hours on an 8.75g scale, showcasing improved performance with insignificant process duration extension. Additionally, we explored the stochasticity of deracemization, observing the development from low initial crystal enantiomeric excesses(1-6% c.e.e0) at a 2.5 g scale. Kinetic analysis revealed that a 2% c.e.e0 effectively mitigates chiral flipping risks and induction time in our system. Our study underscores the potential for reduced initial c.e.e. to expedite deracemization and presents a straightforward method to optimize yield and purity, facilitating industrial application.
Keywords: 
Subject: Chemistry and Materials Science  -   Other

1. Introduction

Chiral separation is of paramount importance across diverse sectors including pharmaceuticals, agrochemicals, and materials science due to the distinct properties exhibited by enantiomers of compounds [1]. Achieving high enantiopurity is crucial for optimizing the efficacy and performance of these compounds, and imperative for the synthesis of pharmaceutical compounds. Among a large variety of methods available for synthesizing and separating enantiopure compounds, crystallization-based (solid-state) deracemization techniques have garnered considerable attention owing to their ability to selectively reject impurities into the crystal lattice, thereby streamlining the purification process and reducing associated costs compared to alternative methods such as chromatography and asymmetric synthesis [2,3]. Temperature Cycle Induced Deracemization (TCID) [4,5,6], Attrition-enhanced deracemization (Viedma ripening) [7,8,9], Preferential Crystallization (PC) [10,11,12,13], and Second-Order Asymmetric Transformation (SOAT) [14] are among the prominent crystallization-based techniques that offer promising avenues for obtaining optically pure crystals with enhanced efficacy and selectivity.
This study investigates the sequential application of TCID followed by SOAT cooling, demonstrating that this approach can significantly enhance yield after achieving high c.e.e. Furthermore, it establishes the feasibility of implementing this process on an industrial scale, highlighting its potential for improving efficiency in deracemization and chiral separation techniques. Both TCID and SOAT entail suspending crystals in a solution where enantiomeric interconversion is permitted. In TCID, characterized by periodic temperature swings, starts from a racemic mixture, which over time, progresses towards a single enantiomer due to the compounding difference in crystal growth and dissolution of the two components. The asymmetric growth of one enantiomer over the other autocatalyzes the process, further accelerating it, allowing the system to reach enantiopurity rapidly. This was first demonstrated by Suwannasang et al. in 2013 with 1-(4-chlorophenyl)-4,4-dimethyl-2-(1H-1,2,4-triazol-1-yl) pentan-3-one (Cl-TAK) [4]. Conversely, SOAT involves cooling a suspension containing a crystal phase of only one enantiomer in a racemizing solution, promoting the selective crystal growth of the desired enantiomer while the undesired enantiomer in solution undergoes continuous conversion to the desired enantiomer until the conclusion of the cooling process. This process is similar to PC, where the main difference is that there is no racemization occurring in solution. While TCID may be performed by starting from a racemic mixture or one with a slight enantiomeric excess, SOAT requires the initial crystal phase to be a pure enantiomer to initiate the resolution process. In addition, as SOAT and TCID both involve racemization in the solution, the theoretical yield of the process is double that of PC where racemization is absent and the conversion of the counter enantiomer to the desired enantiomer does not occur.
Despite significant advancements in the understanding and practical applications of these methodologies, a comprehensive quantitative demonstration of experimental yield of these processes, particularly TCID, necessitates further investigation to fully understand and assess these processes. While reaching crystal enantiomeric excess (c.e.e.) of >95% has been reported with various systems, the amount of remaining dissolved solute at the end of the TCID process is one drawback. This could be overcome by performing a large cooling step at the end of TCID, based on the SOAT method, to minimize the solubility of the solute and therefore allowing it to crystallize further, increasing the final yield without significantly increasing the total process time. If the cooling rate does not promote primary nucleation, which would allow equal opportunity for the undesired enantiomer to grow, the c.e.e. should not be affected significantly, and the final yield of the solids should be optimized. Secondary nucleation, on the other hand, would enhance the overall c.e.e. by favoring the crystal growth of the major enantiomer. This simple cooling technique has been demonstrated by Palovics et al. and Hosseinalipour et al. however, neither team demonstrated favorable experimental mass yields [15,16].
Furthermore, the stochastic nature of TCID underscores the importance of studying kinetics and determining the minimum amount of pure enantiomer required to direct deracemization efficiently, which will be important to scaling up this process. As TCID progresses according with the difference between the two enantiomers, when starting from a racemic mixture, there is a significant induction period in which quantitatively nothing occurs before deracemization takes off. Without addition of an initial bias, the system will also not reliably convert towards the desired enantiomer. To overcome these issues, an initial c.e.e. (c.e.e0) of 20% is commonly employed to dictate the deracemization to progress towards the desired chirality and accelerate the process. However, this initial investment may not be desirable or even feasible for some processes, and especially on an industrial scale. If TCID with lower c.e.e0 can still direct the deracemization and overcome the induction time, this knowledge could be fruitful for deracemizations in the larger, industrial, scales and for high-cost compounds. However, if c.e.e0 is not sufficient, the small random changes in crystal growth and dissolution of both enantiomers may outweigh this bias as seen by chiral flipping, where the deracemization may sometimes tend towards the counter enantiomer of the bias added [17]. Therefore, a minimum c.e.e0 should exist, above which deracemization is ‘always’ successfully directed towards the desired enantiomer.
Central to this investigation is the selection of a suitable substrate as TCID cannot be successfully performed on any chiral molecule. For TCID to work normally, and in one batch, the compound of interest must form a conglomerate crystal (crystals with only one enantiomer in its lattice), racemize quickly in solution, and have a crystal growth rate greater than its rate of primary nucleation. Furthermore, depending on the temperature ranges applied, the compound and racemizing agent must be thermally stable at those temperatures and not exhibit any polymorphisms, to not disrupt the study of deracemization and yield. For these reasons, Cl-TAK (1) was chosen as an ideal compound for solid-state deracemization experiments. Its characteristics, including conglomerate crystal formation, rapid racemization kinetics with NaOH in solution, negligible solubility in water, rapid crystal growth, thermal stability, and absence of polymorphism, render it an exemplary model compound for elucidating the intricacies of deracemization processes. It is also a precursor of Paclobutrazol, a chiral plant growth inhibitor, which can be asymmetrically synthesized from enantiomerically pure 1, underscoring its relevance in the agrochemical industry. Furthermore, 1 has already been a model compound for multiple solid-state deracemization studies, successfully undergoing deracemization under various conditions [4,18,19,20].
Against this backdrop, the objective of this study crystallizes: to leverage TCID coupled with SOAT cooling to deracemize 1 and employing a facile washing method to elucidate the quantitative experimental yield of this integrated process at gram scale and to investigate the kinetics of deracemization from low initial enantiomeric excess (1-6% c.e.e0) to determine whether a lower c.e.e0 is sufficient to direct deracemization, thereby paving the way for the development of more efficient and effective deracemization techniques applicable for the industry.

2. Materials and Methods

2.1. Deracemization Experiments

TCID:
In a 50 mL jacketed round bottom flask with an oval-shaped magnetic stirrer set to 500rpm, 30g of 60 wt% methanol: water solution and 0.033g of NaOH were added. Then, 2.5g of 1 was added to the system with a predetermined c.e.e0 and stirred at 40 °C for 1 hour before the temperature cycle was started. This setup allowed 56% of the suspension to be dissolved and then recrystallized every cycle. (40 °C/55 °C = 1.72g/0.75g in suspension)
Temperature cycle: A LAUDA ECO RE 630 S (Germany) thermostat was programmed to undergo the following temperature cycle: Heating from 40 °C to 55 °C over 10 minutes (1.5 °C/min), an isothermal hold at 55 °C (10 minutes), cooling back to 40 °C over 30 minutes (0.5 °C/min), and a final isothermal hold for 10 minutes for a total cycle time of 60 minutes.
Sampling: Before starting the temperature program, and 5 minutes after starting the final isothermal hold at 40 °C, samples were taken by pipetting a small amount of suspension (approximately 7mg of solids) which were then vacuum filtered on a fritted glass funnel. The solids were washed with 2 mL of dilute (0.5 M) aqueous HCl solution to neutralize the base, and subsequently with 5mL of DI water. The solids were then dissolved in methanol and analyzed by cHPLC.
SOAT: Once TCID reached >95% c.e.e., the temperature was reduced to 10 °C over 33.3 minutes (0.9 °C/min) with the same stirring rate.
Filtration and clean-up: After SOAT cooling, the entire system was filtered, and any residual base neutralized with dilute aqueous HCl solution (2x 10 mL, 0.5M Solution), and subsequently washed with DI water (2x 20 mL). The vacuum pump was then turned off, and 30 mL of 50 wt% methanol: water solution at room temperature was added into the solids and stirred gently for 5 minutes before turning the pump back on. The solids were then placed into a 50 °C temperature-controlled vacuum desiccator overnight to dry before being weighed and analyzed by cHPLC to give the final yield and c.e.e.

2.2. Analysis Techniques

cHPLC analyses were performed on an Ultimate 3000 system fitted with a Chiralcel OD-H column from Daicel with a UV absorption at 220 nm. Samples were analyzed using a mobile phase of 1 mL/ min flow rate of n-heptane: IPA 80:20 v/v. Retention times were 7.4 and 9.2 mins for the R- and S- enantiomers, respectively.

3. Results

3.1. Isolated Mass Yield and Final c.e.e. from TCID Coupled with SOAT

Five TCID experiments of 1 in 2.5 g scale all progressed up to >95% c.e.e. within 10 cycles (10 hours). The deracemization followed an exponential growth trend and slowed down significantly after reaching 90% c.e.e., which corresponds to previously reported sigmoidal curves of deracemization processes [4,5,20,21]. The SOAT cooling step afterwards used a cooling rate of 0.9 °C/min, which is the fastest cooling rate available on this thermostat. This cooling rate did not alter the c.e.e. after cooling and gave comparable results with a slower cooling rate (0.5 °C /min), and therefore the faster rate was used for all other experiments. The extra washing step during the filtration step, using 50 wt% methanol-water solution allowed small amounts of both enantiomers to be dissolved, as expected thermodynamically to occur in a non-racemizing solution, further enhancing the c.e.e. The effectiveness of this method was verified by sampling the solids before and after washing in two experiments. The c.e.e. samples from two experiments increased from 97.8% and 98.0% to 99.1% and 99.9% respectively immediately after washing. This washing step allows rapid enantiomeric purification of the solid state without additional set up or glassware, as it can be done within the filtration set up, thereby sacrificing a small amount of total product in order to ensure a higher enantiopurity. This step not only removes the minor enantiomer present at the end of the deracemization, but also the minor enantiomer that may crystallize during filtration. Nucleation is difficult to avoid due to the addition of antisolvent (water) during the washing step, and this washing allows the enantiopurity to be preserved.
Final dry solids were obtained ranging between 90-93% mass yields with 99.0-99.9% e.e. as seen in Table 1. As approximately 5% of 1 is soluble and remains in the solution at 10 °C, the other sources of yield loss came from the few samples that were taken during the deracemization monitoring and from the difficulty of removing all of the solids from the flask at the end, and as well as the washing step used to purify the solids. However, considering the already high mass yields of 90% or greater, the washing method was preferred to obtain solids with greater e.e. rather than a marginally higher mass yield.
Due to the reproducibility of these experiments at 2.5g, to assess the scalability of this set up, an experiment scaled up by a factor of 3.5, to deracemize 8.75g of Cl-TAK, with the same TCID protocols was set up. After initial confirmation that deracemization had begun, the temperature cycle was allowed to continue for 20 cycles, after which, identical cooling and filtration steps were undertaken. For this experiment, 89.7% of the product (7.86g) was obtained with 99.1% e.e. starting from 4.2 e.e. %, showing the ease in scalability of this process, with little to no difference in the achievable mass yield% or c.e.e.

3.2. Kinetics of TCID with Low c.e.e0

To analyze the kinetics of deracemization starting from varying low c.e.e0, TCID experiments with c.e.e0 between 1-6% were set up and analyzed up to at least 60% c.e.e. to determine their induction time, overall deracemization kinetics and the direction of deracemization. All systems with an initial bias began their deracemization immediately with an absence of an induction time unlike when starting from a racemic mixture. There was an induction time of around 6 cycles where no observable changes in c.e.e. took place when starting from a racemic mixture. However, only systems with 2% c.e.e0 or greater deracemized in the same direction as the c.e.e0. One experiment with +1.4% c.e.e0 showed chiral flipping after initially increasing to +2.5% c.e.e. but then reversing to -97% c.e.e. (Figure 1). This was the only such case where the direction of deracemization ended contrary to the initial excess. Although this behavior has been seen previously, it was shown on a small scale (200 μL) with mechanical grinding (Viedma ripening) of sodium chlorate, similar principles should apply to larger TCID systems such as this [4].
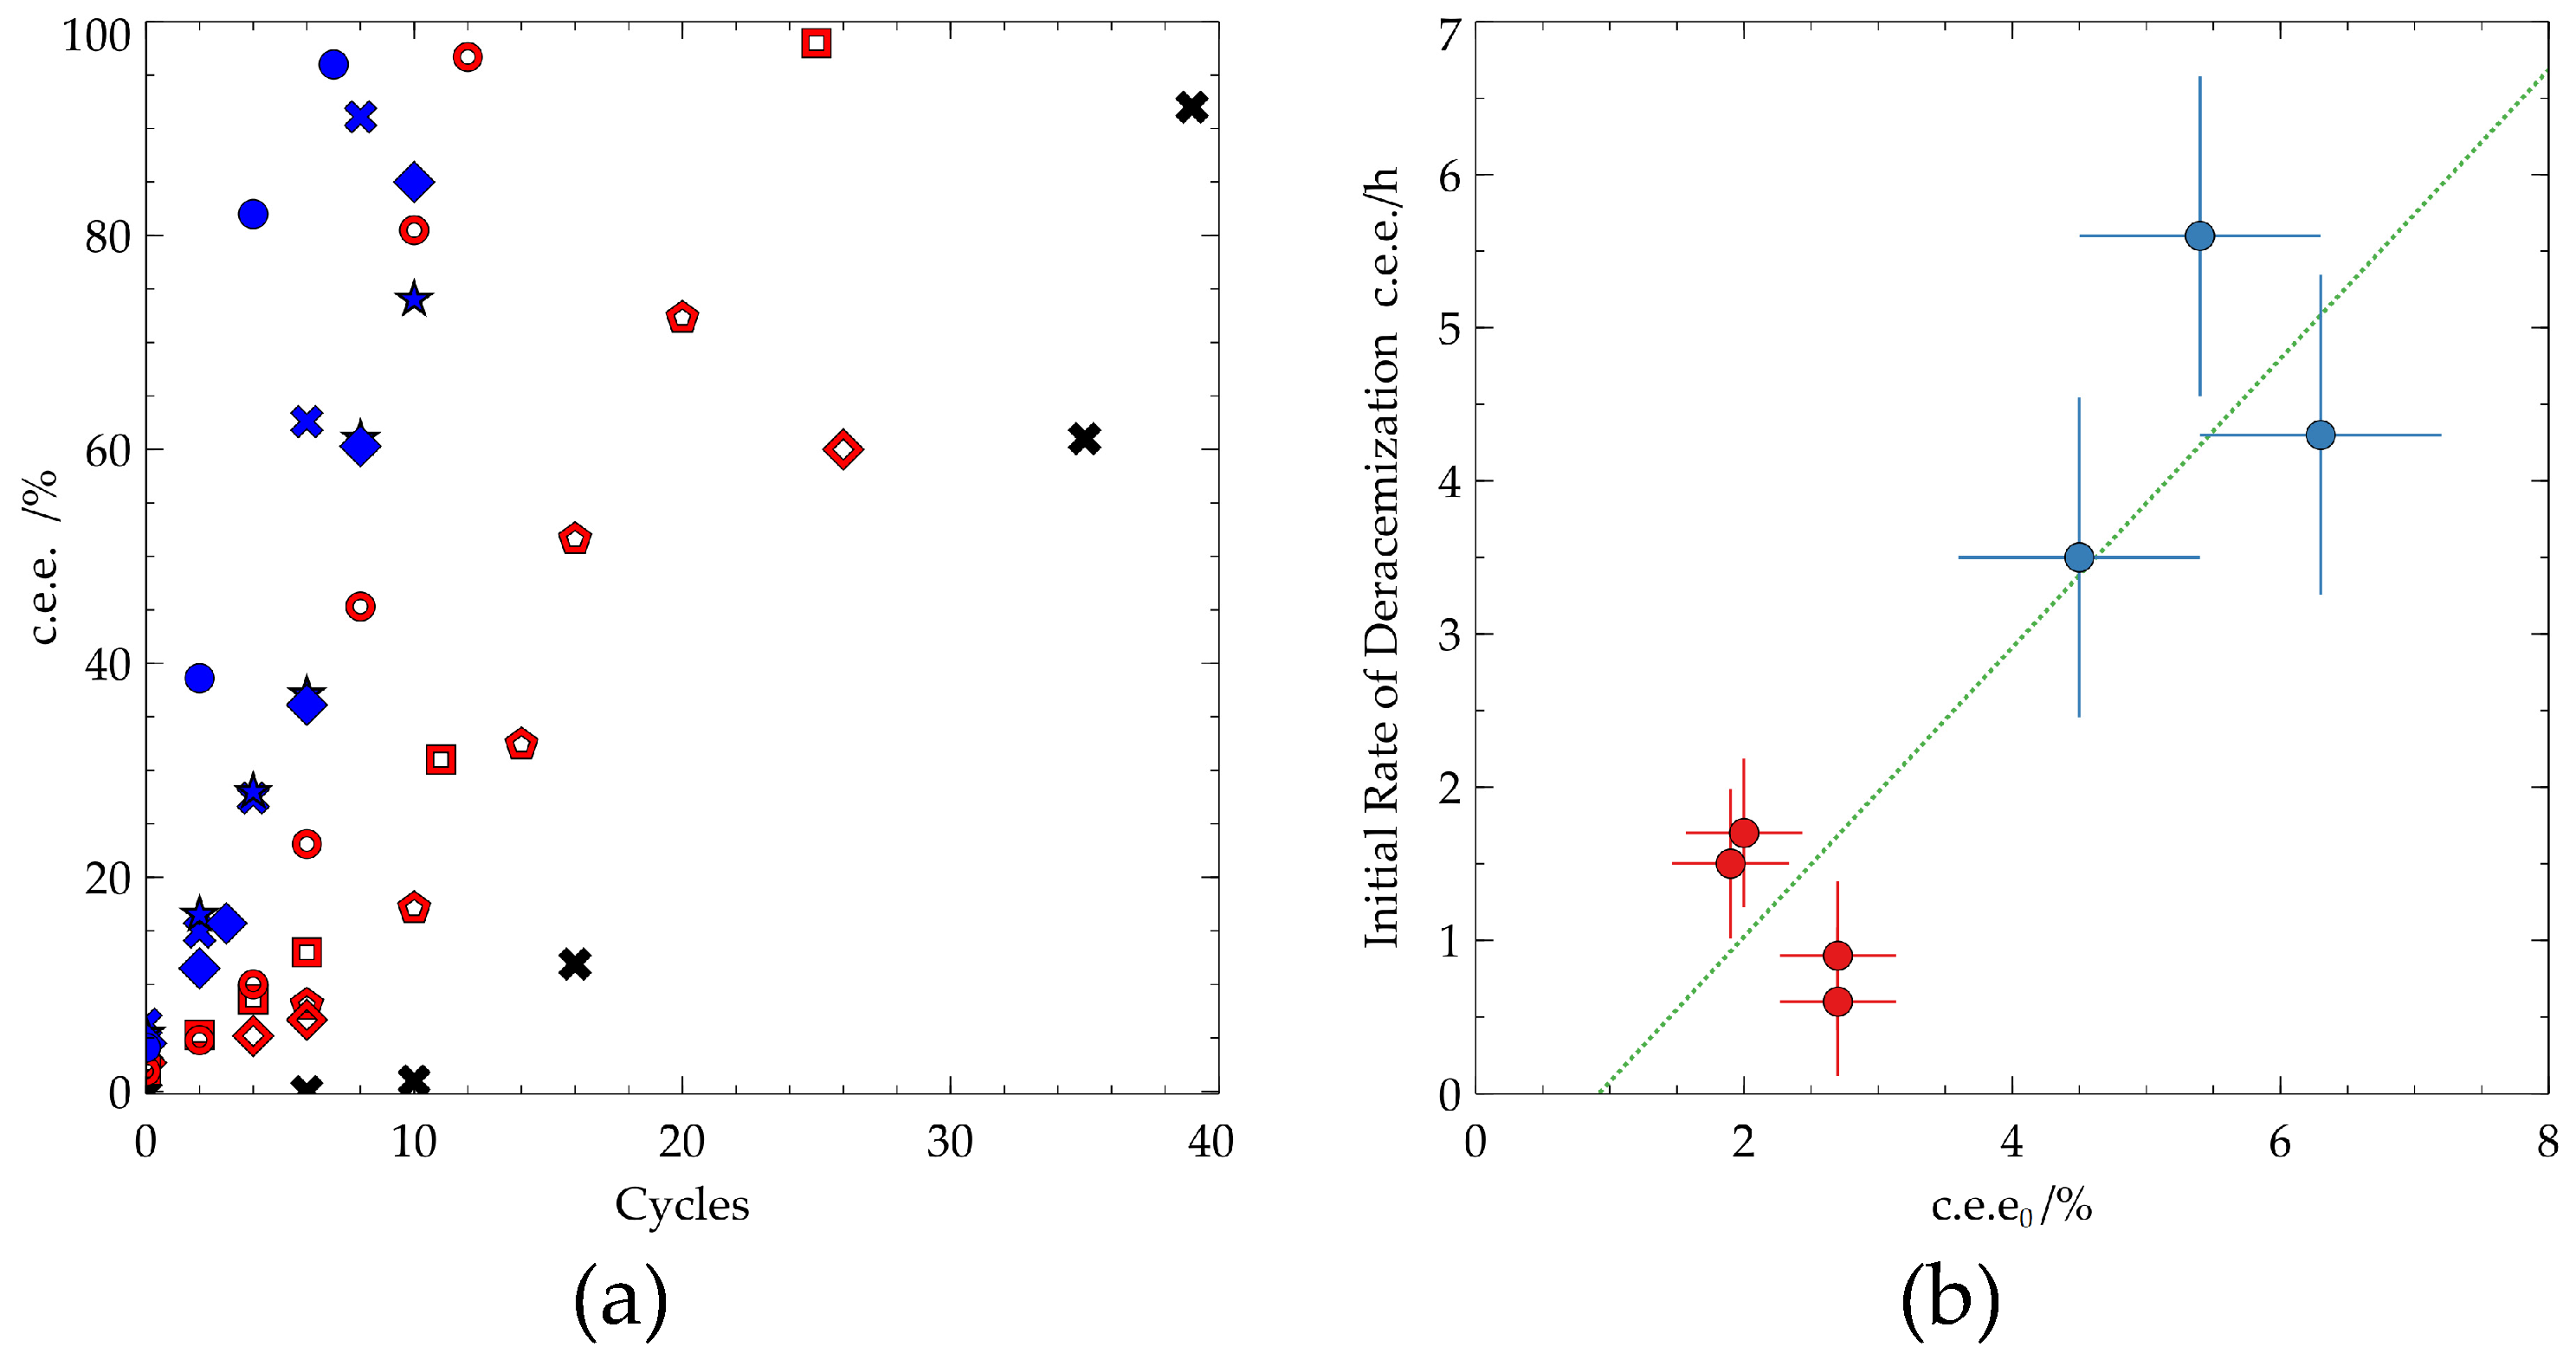
The kinetics of each system vary with a notable difference in rate when grouping the c.e.e0 into two groups, 2-3% (lower c.e.e0) and 4-6% (higher c.e.e0). The lower c.e.e0 systems exhibited a slower initial deracemization rate compared to the higher ee0 group. However, the system starting from 1.9% c.e.e. was able to reach 80% e.e. faster than the system with c.e.e0 of 5.4%. Showing the stochasticity of the evolution of c.e.e. in TCID (Figure 2).
While greater c.e.e0 may lead to faster initial rate of deracemization, due to the fundamentally stochastic nature of TCID, the overall kinetics throughout the process is not guaranteed. As many different factors affect the performance of TCID, from temperature range, racemization rate, heating/cooling rate, suspension density and compound specific effects, generalizations cannot be made on the importance of the minimum c.e.e0 required for directing TCID of 2% that we observe for Cl-TAK. However, this study shows the possibility of initiating TCID with much lower c.e.e0 than commonly employed.

4. Discussion

TCID Coupled with SOAT-Based Cooling

As performing TCID at higher temperature ranges accelerate the process compared to identical cycles at lower temperature, due to the increase in kinetics of racemization and other processes [21], the higher temperatures would usually result in higher solubility, and therefore more product required for the process. Not only does it require more solute to start the process, without a proper method to extract the remaining dissolved solute, the overall yield would be sacrificed. This SOAT-based cooling step at the end maximizes the rate of deracemization by performing at higher temperatures, and the yield by extracting as much solute as possible at the end. Once deracemization reaches a high c.e.e., further cooling mimics the mechanism of SOAT, which can be exploited to improve the overall yield of the process. If the cooling rate is suitable for crystal growth only, and negligible primary nucleation occurs, the c.e.e. should be preserved as the cooling process allows the major enantiomer to grow further. Secondary nucleation should not affect this phenomenon as it will produce more crystals of the same chirality. It is a simple and effective method to maximize yield, and no changes were necessary when scaling up from 2.5 g to 8.75 g of total solute. TCID, as a deracemization process, is known to have a theoretical yield of 100% of the mass with 100% enantiomeric excess, but as no practical evidence has been shown, this is the first instance where concise data is shown for the yield of TCID.
During the time of writing this work, two separate publications working on a similar principle of adding an extra cooling step at the end of TCID to extract the dissolved solute have been published. When the cooling rate is too high, primary nucleation was evident, decreasing the crystal enantiopurity, while by applying a slower cooling rate, the high c.e.e. was maintained. However, neither work presented promising yields to demonstrate the potential of this method. The compound specific effects are also clear, as 1 crystallizes differently to the other molecules studied, and do not undergo thermal decomposition, as seen for glutamic acid in the work by Pálovics et al., and the cooling rates that induced nucleation in the work of Hosseinalipour et al., was not observed for 1 [15,16].

Minimizing c.e.e0 for More Efficient TCID

Analyzing the performance of TCID starting from low c.e.e0, it is clear that induction time can be avoided for c.e.e0 even as low as 1%. When starting from a racemic mixture, (c.e.e0 = 0.0%) the system showed no changes up to 6 hours, which was more than half of the total time for most experiments. Starting from a racemic mixture, not only extends the process time due to the induction time, but due to the stochastic nature of deracemization, the direction is not assured. Commonly, the main goal of deracemization is to isolate a specific enantiomer over an undesired enantiomer, it is therefore essential to be able to choose the direction of deracemization to avoid producing enantiomerically pure product of the undesired enantiomer. If this is not the case, and the aim is to isolate either enantiomer, c.e.e0 could be set as low as 1% just to avoid the induction time. This result of deracemization from low c.e.e0 agrees with previous computational findings by Bodák et al. where the c.e.e0 vs. crystal size distribution was analyzed and showed the c.e.e0 even at low values should direct deracemization as long as the size distribution of both enantiomers are equal [22].
Within this study, no noticeable risk of chiral flipping was seen when c.e.e0 was greater than 2%. All experiments immediately began deracemization towards the same sign as the initial bias up to at least 60% c.e.e. within 24 cycles (hours). Only 1 experiment with c.e.e0 = +1.4% saw a significant, immediate flipping of chirality. It initially increased up to +2.5%, but then flipped to the other chirality until reaching -97% c.e.e. This phenomenon of chiral flipping has been studied by Choi et al. on a small scale with Viedma ripening. In systems starting with small amounts of bias, there can be statistically significant changes that occur which favor the symmetry breaking in one direction to gain momentum. As these solid-state deracemization techniques are driven by the difference in crystal growth and dissolution of the two enantiomers, minor changes may outweigh the bias introduced and become amplified and overpower the development of the desired enantiomer. Once the difference in population of the two enantiomers becomes large (i.e., greater c.e.e.), these small statistical changes that may occur become negligible, therefore, chiral flipping should only occur in the early stages, where the c.e.e. is low.

5. Conclusions

Herein, we present a facile method with experimental yield results to maximize the yield of deracemization of 1 using TCID with a SOAT-based final cooling step, and a simple washing technique. 89.7% mass yields with 99.1% c.e.e. was obtained on an 8.75g scale. Scaling up by a factor of 3.5 required no changes in the process method and gave equivalent results. Kinetic studies show that, for this system, c.e.e0 can be set as low as 2% without significant risk of chiral flipping, and induction time can be avoided to deracemize towards the desired enantiomer. TCID coupled with SOAT cooling could be a promising avenue to be used in industrial deracemization processes.

Author Contributions

Conceptualization, A.F and G.C.; methodology, investigation, and writing—original draft preparation, J.M.; writing—review and editing, A.F., P.C. and G.C; All authors have read and agreed to the published version of the manuscript.

Funding

This research was funded by the Normandy Regional Council (RIN Label 2020, ODICT n°20E02742) and a student grant from Vidyasirimedhi Institute of Science and Technology.

Data Availability Statement

Research data is available from the authors upon request.

Conflicts of Interest

The authors declare no conflicts of interest.

References

  1. Rekoske, J.E. Chiral separations. AIChE J 2001, 47, 2. [Google Scholar] [CrossRef]
  2. Beesley, T.E.; Scott, R.P. Chiral chromatography; John Wiley & Sons: England, 1999. [Google Scholar]
  3. Fogassy, E.; Nógrádi, M.; Kozma, D.; Egri, G.; Pálovics, E.; Kiss, V. Optical resolution methods. Org. Biomol. Chem. 2006, 4, 3011–3030. [Google Scholar] [CrossRef] [PubMed]
  4. Suwannasang, K.; Flood, A.; Rougeot, C.; Coquerel, G. Using Programmed Heating–Cooling Cycles with Racemization in Solution for Complete Symmetry Breaking of a Conglomerate Forming System. Cryst. Growth. Des. 2013, 13, 3498–3504. [Google Scholar] [CrossRef]
  5. Breveglieri, F.; Maggioni, G.M.; Mazzotti, M. Deracemization of NMPA via Temperature Cycles. Cryst. Growth. Des. 2018, 18, 1873–1881. [Google Scholar] [CrossRef]
  6. Cameli, F.; Xiouras, C.; Stefanidis, G.D. Intensified deracemization via rapid microwave-assisted temperature cycling. CrystEngComm 2018, 20, 2897–2901. [Google Scholar] [CrossRef]
  7. Viedma, C. Chiral symmetry breaking and complete chiral purity by thermodynamic-kinetic feedback near equilibrium: implications for the origin of biochirality. Astrobiology 2007, 7, 312–319. [Google Scholar] [CrossRef] [PubMed]
  8. Viedma, C. Chiral Symmetry Breaking During Crystallization: Complete Chiral Purity Induced by Nonlinear Autocatalysis and Recycling. Phys. Rev. Lett. 2005, 94, 065504. [Google Scholar] [CrossRef] [PubMed]
  9. Baglai, I.; Leeman, M.; Kellogg, R.M.; Noorduin, W.L. A Viedma ripening route to an enantiopure building block for Levetiracetam and Brivaracetam. Org. Biomol. Chem. 2019, 17, 35–38. [Google Scholar] [CrossRef] [PubMed]
  10. Lorenz, H.; Polenske, D.; Seidel-Morgenstern, A. Application of preferential crystallization to resolve racemic compounds in a hybrid process. Chirality 2006, 18, 828–840. [Google Scholar] [CrossRef]
  11. Levilain, G.; Coquerel, G. Pitfalls and rewards of preferential crystallization. CrystEngComm 2010, 12, 1983–1992. [Google Scholar] [CrossRef]
  12. Rougeot, C.; Hein, J.E. Application of continuous preferential crystallization to efficiently access enantiopure chemicals. Org. Process Res. Dev. 2015, 19, 1809–1819. [Google Scholar] [CrossRef]
  13. Dunn, A.S.; Svoboda, V.; Sefcik, J.; ter Horst, J.H. Resolution Control in a Continuous Preferential Crystallization Process. Org. Process Res. Dev. 2019, 23, 2031–2041. [Google Scholar] [CrossRef]
  14. Oketani, R.; Hoquante, M.; Brandel, C.; Cardinael, P.; Coquerel, G. Resolution of an Atropisomeric Naphthamide by Second-Order Asymmetric Transformation: A Highly Productive Technique. Org. Process Res. Dev. 2019, 23, 1197–1203. [Google Scholar] [CrossRef]
  15. Pálovics, E.; Bánhegyi, F.D.; Pataki, H.; Szilágyi, B. Enhancing temperature cycle-induced deracemization via combined cooling and antisolvent crystallization: A proof of concept study. Arab. J. Chem. 2024, 17, 105362. [Google Scholar] [CrossRef]
  16. Hosseinalipour, M.S.; Deck, L.-T.; Mazzotti, M. On Solute Recovery and Productivity in Chiral Resolution through Solid-State Deracemization by Temperature Cycling. Cryst. Growth. Des. 2024. [Google Scholar] [CrossRef] [PubMed]
  17. Choi, H.S.; Oh, I.H.; Zhang, B.; Coquerel, G.; Kim, W.-S.; Park, B.J. Chiral Flipping in Viedma Deracemization. J. Phys. Chem. Lett. 2024, 15, 4367–4374. [Google Scholar] [CrossRef] [PubMed]
  18. Rougeot, C.; Guillen, F.; Plaquevent, J.-C.; Coquerel, G. Ultrasound-Enhanced Deracemization: Toward the Existence of Agonist Effects in the Interpretation of Spontaneous Symmetry Breaking. Cryst. Growth. Des. 2015, 15, 2151–2155. [Google Scholar] [CrossRef]
  19. Suwannasang, K.; Flood, A.E.; Rougeot, C.; Coquerel, G. Use of Programmed Damped Temperature Cycles for the Deracemization of a Racemic Suspension of a Conglomerate Forming System. Org. Process Res. Dev. 2017, 21, 623–630. [Google Scholar] [CrossRef]
  20. Lopes, C.; Cartigny, Y.; Brandel, C.; Dupray, V.; Body, C.; Shemchuk, O.; Leyssens, T. A Greener Pathway to Enantiopurity: Mechanochemical Deracemization through Abrasive Grinding. Chem. Eur. J. 2023, 29, e202300585. [Google Scholar] [CrossRef] [PubMed]
  21. Li, W.W.; Spix, L.; de Reus, S.C.A.; Meekes, H.; Kramer, H.J.M.; Vlieg, E.; ter Horst, J.H. Deracemization of a Racemic Compound via Its Conglomerate-Forming Salt Using Temperature Cycling. Cryst. Growth. Des. 2016, 16, 5563–5570. [Google Scholar] [CrossRef]
  22. Bodák, B.; Maggioni, G.M.; Mazzotti, M. Effect of Initial Conditions on Solid-State Deracemization via Temperature Cycles: A Model-Based Study. Cryst. Growth. Des. 2019, 19, 6552–6559. [Google Scholar] [CrossRef]
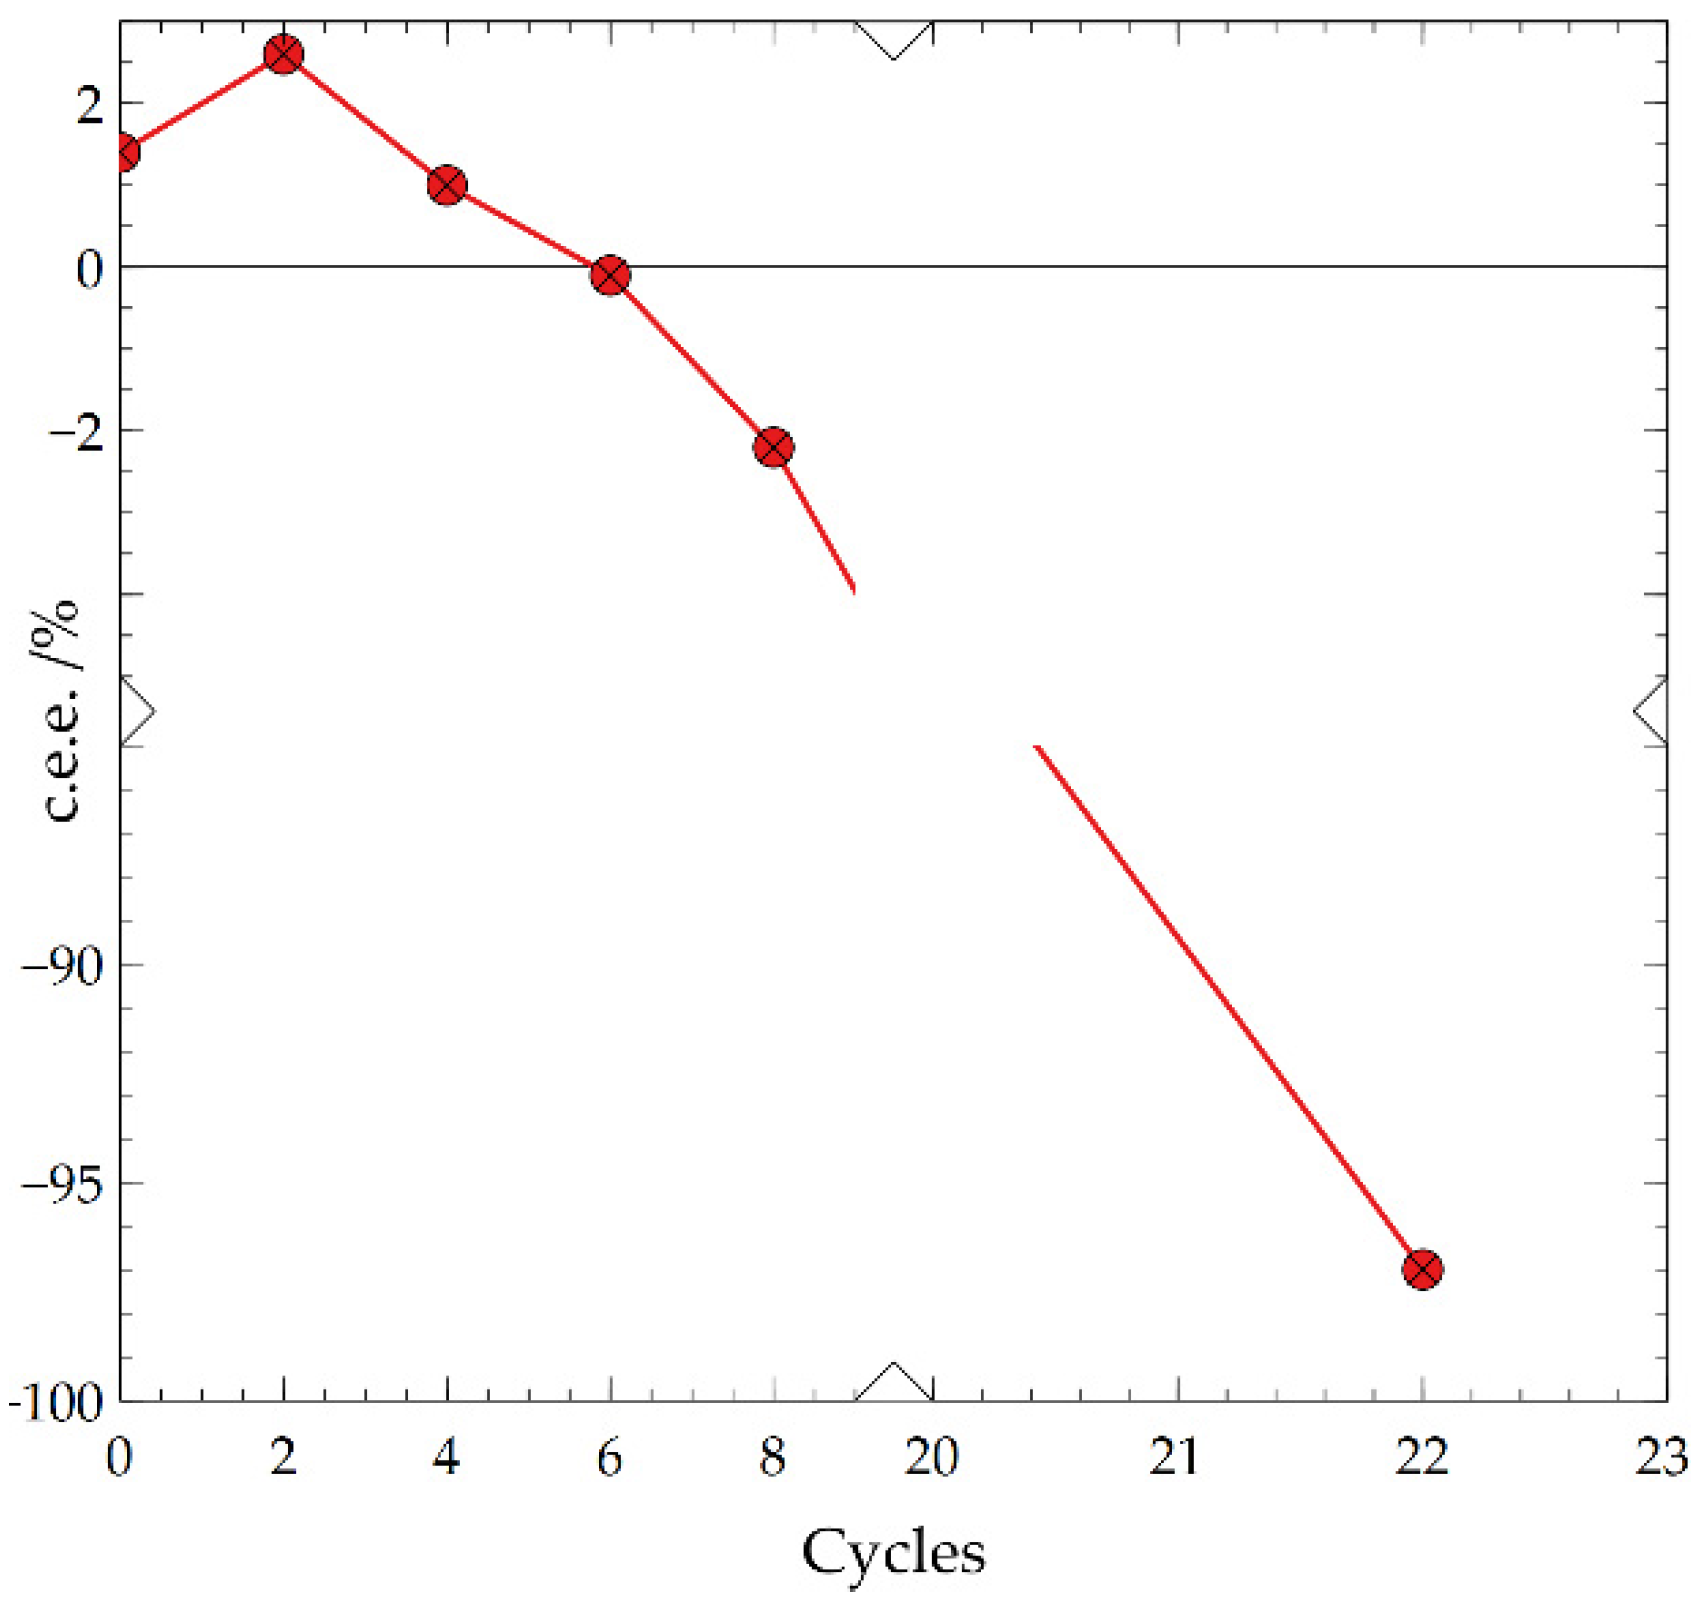
Figure 1. Evidence of Chiral Flipping: TCID with c.e.e0 = +1.4% ending with -97% c.e.e. over 22 cycles. The X and Y axes are broken to magnify the initial inversion of deracemization. Data points are connected by a line as a guide for the eyes.
Preprints 108700 g001
Figure 2. TCID experiments starting with low c.e.e0. Blue: c.e.e0= 4-6%, Red: c.e.e0 = 2-3%. Black: c.e.e0= 0.0% (a) Evolution of c.e.e. over the number of cycles up to 60% c.e.e. (b) The effect the c.e.e0 on the initial rate of deracemization, green line shows line of best fit for all data. Error bars shown are the standard deviation of the c.e.e0 in x-axis, and the initial rate of deracemization in the y-axis in each group.
Preprints 108700 g002
Table 1. Experimental data of TCID, initial and final, masses and c.e.e., of each experiment.
Experiment
Number
Initial Mass of 1
/g
c.e.e0
/%
Final Mass /g Final c.e.e.
/%
Yield
/%
1 2.44 4.0 2.25 99.9 92.2
2 2.51 5.0 2.29 99.9 91.2
3 2.46 4.1 2.24 99.6 91.1
4 2.56 4.5 2.31 99.4 90.3
5 2.50 1.6 2.32 99.9 92.8
6 8.76 4.2 7.86 99.1 89.7
Disclaimer/Publisher’s Note: The statements, opinions and data contained in all publications are solely those of the individual author(s) and contributor(s) and not of MDPI and/or the editor(s). MDPI and/or the editor(s) disclaim responsibility for any injury to people or property resulting from any ideas, methods, instructions or products referred to in the content.
Copyright: This open access article is published under a Creative Commons CC BY 4.0 license, which permit the free download, distribution, and reuse, provided that the author and preprint are cited in any reuse.
Prerpints.org logo

Preprints.org is a free preprint server supported by MDPI in Basel, Switzerland.

Subscribe

© 2024 MDPI (Basel, Switzerland) unless otherwise stated