1. Introduction
This document presents research on color vision in a virtual reality (VR) environment. Currently, color vision, as well as computer graphics and computer vision, is an integral part of information technology issues. We encounter computer graphics in almost all fields. At the same time, Computer graphics and Image processing use differ in each field and individual subdisciplines. With 3D graphics and three-dimensional space development, new approaches and solutions have emerged in this field. The basic principles of 2D graphics and analog technologies are smoothly reflected in digital 3D image processing. [
1] Awareness of these procedures makes it easier to work with images, colors, or materials so that they fully correspond to the perception of the environment by the human eye. [
2] All these principles are used today in the game industry, engineering, design, architecture, art, therapy, military, criminology, agriculture, psychology, chemistry, and other fields. [
3,
4,
5]
Currently, environments are usually created and simulated in 3D space, virtual, or augmented reality. [
6] For the human eye to perceive virtual objects, scenes, and environments realistically, the science of colors, color models, color spaces, light radiation, the anatomy of the human eye, and
Human vision is fully applied. [
7] These issues are summarized and described in more detail by the
Colorimetry and
Color management field. It is a vast field of science.
Colorimetry includes color calibration of display devices, issues of printing, light, sensing devices, analog and digital processing of image data and signals, color mixing, digital description of colors, tone, color psychology, and more. [
7,
8] The issue of
Colorimetry and
Color vision is currently the subject of extensive research in many scientific fields.
This manuscript describes the basic principles of mixing primary and secondary colors. These basic principles are experimentally applied in a virtual reality (VR) environment to observe the influence of colors and color changes on human color perception. The display and perception of colors in a VR environment have already been the subject of some research. [
9] However, the experiment described in this paper has not yet been performed. For these purposes, an art gallery was created in a virtual environment. In this virtual reality environment, real works of art by the painter Michal Pasma, which have been digitized, are presented. The experiment aims to capture the color changes of a user embedded in a virtual gallery environment. A lie detector was used to identify changes in color perception in the environment. Several scientific research experiments have already been conducted with this device as well. Mainly in the field of human psychology and perception. [
10,
11,
12]
This experiment explores the possibilities of working with color vision and the RGB (Red, Green, Blue) color model in a VR environment. This experiment can be the basis for further research in the field of Computer vision, Color vision, and the effect of the environment on the user embedded in VR. The practical use is possible in medicine, psychology, therapies, or educational programs, as well as in commercial fields. It is not known that a similar experiment has already been implemented and the issue of color vision applied in a VR environment using a lie detector for data analysis.
2. Digital Twins of the Artworks
A digitized image of actual works of art is used in this study. The art paintings were photographed with a
Pentax K-50 DSLR camera. The image was taken in an art gallery room without artificial lighting. The room was lit by natural daylight. The captured digital image was edited in the 2D software
Camera RAW 14.5 for photo editing. The digital image was edited with brightness, contrast, and exposure functions and then trimmed to the final display. Twelve artworks and one information panel about the exhibition's author were imported into the virtual art gallery.
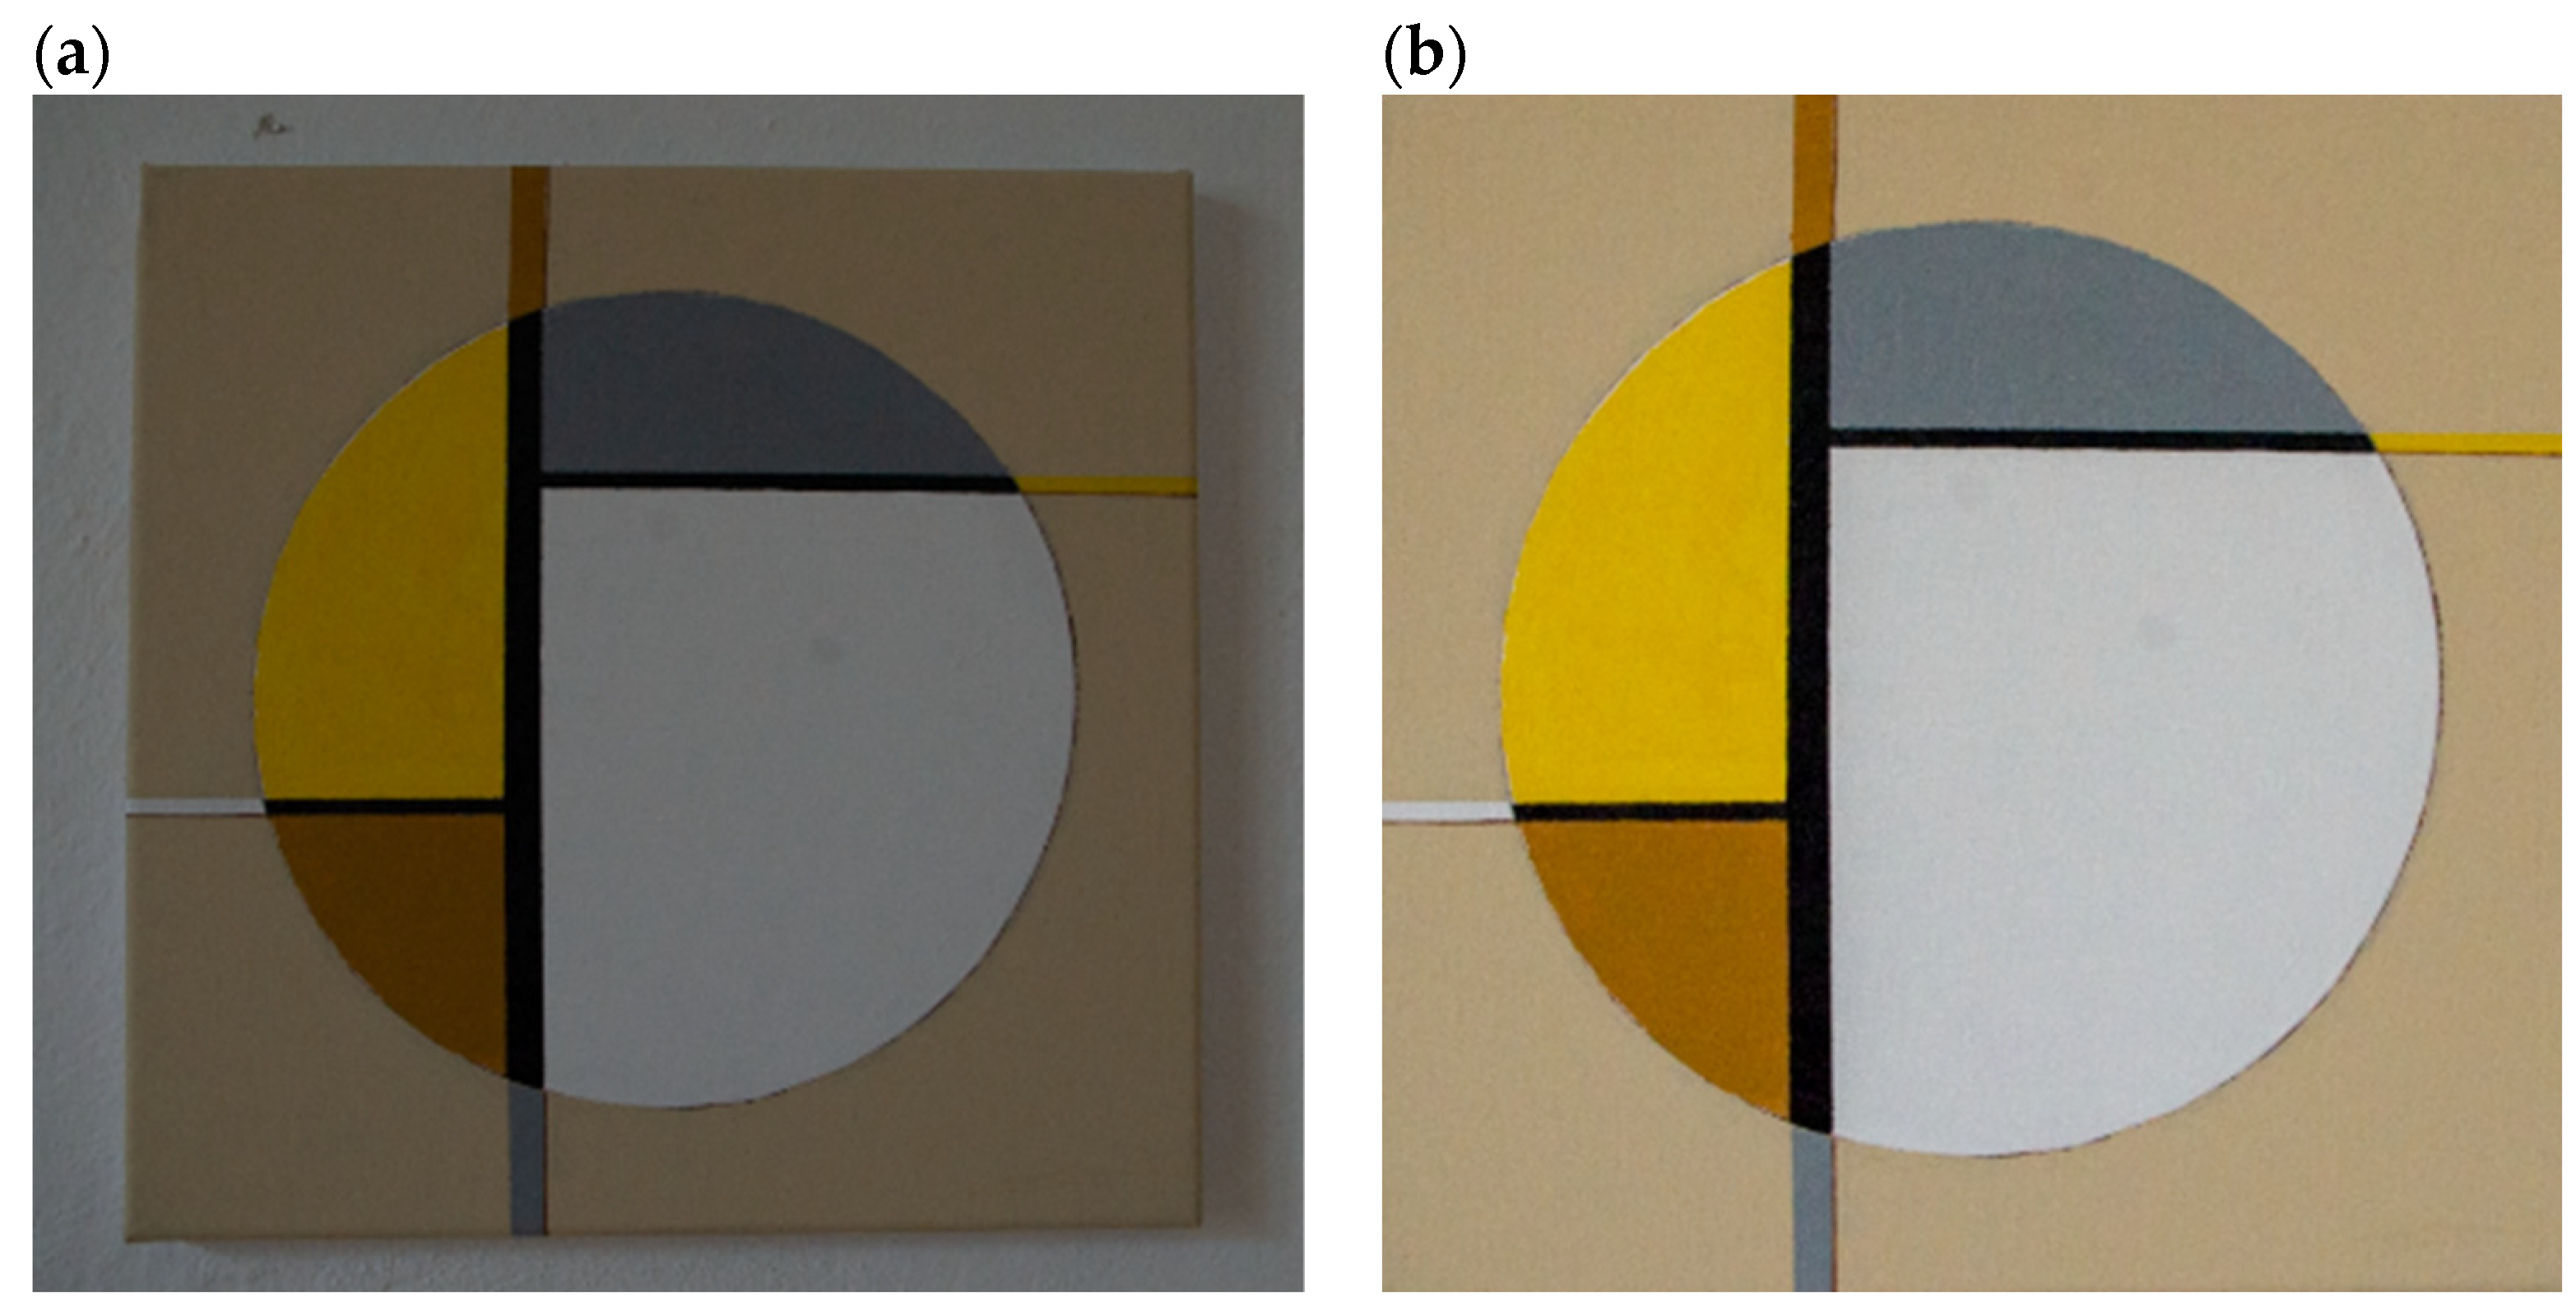
Figure 1 shows the reference artwork a) in the first capture step and b) the digitized and post-production edited artwork for application in the VR gallery environment.
The digital image editing procedure is not the subject of this experimental study. The works of art serve primarily as objects intended to focus the user's attention embedded in the created VR environment. The RGB color model was used as part of digital imaging in this image processing.
3. Color Model RGB and CMYK
Digital display devices use the
RGB (Red/Green/Blue) color model. [
13] The
CMYK (Cyan/Magenta/Yellow/Contrast) color model in turn represents the process of transferring colors to the material. [
14] Therefore, it is necessary to recalculate these color models. Compared to other research studies, this experiment performs the necessary recalculation of both mentioned color models. [
15,
16] Searching for a complex solution for the transformation of color models was unnecessary in this case. In this study, the primary colors of the
CMYK color model are supplemented in the display device. [
17]
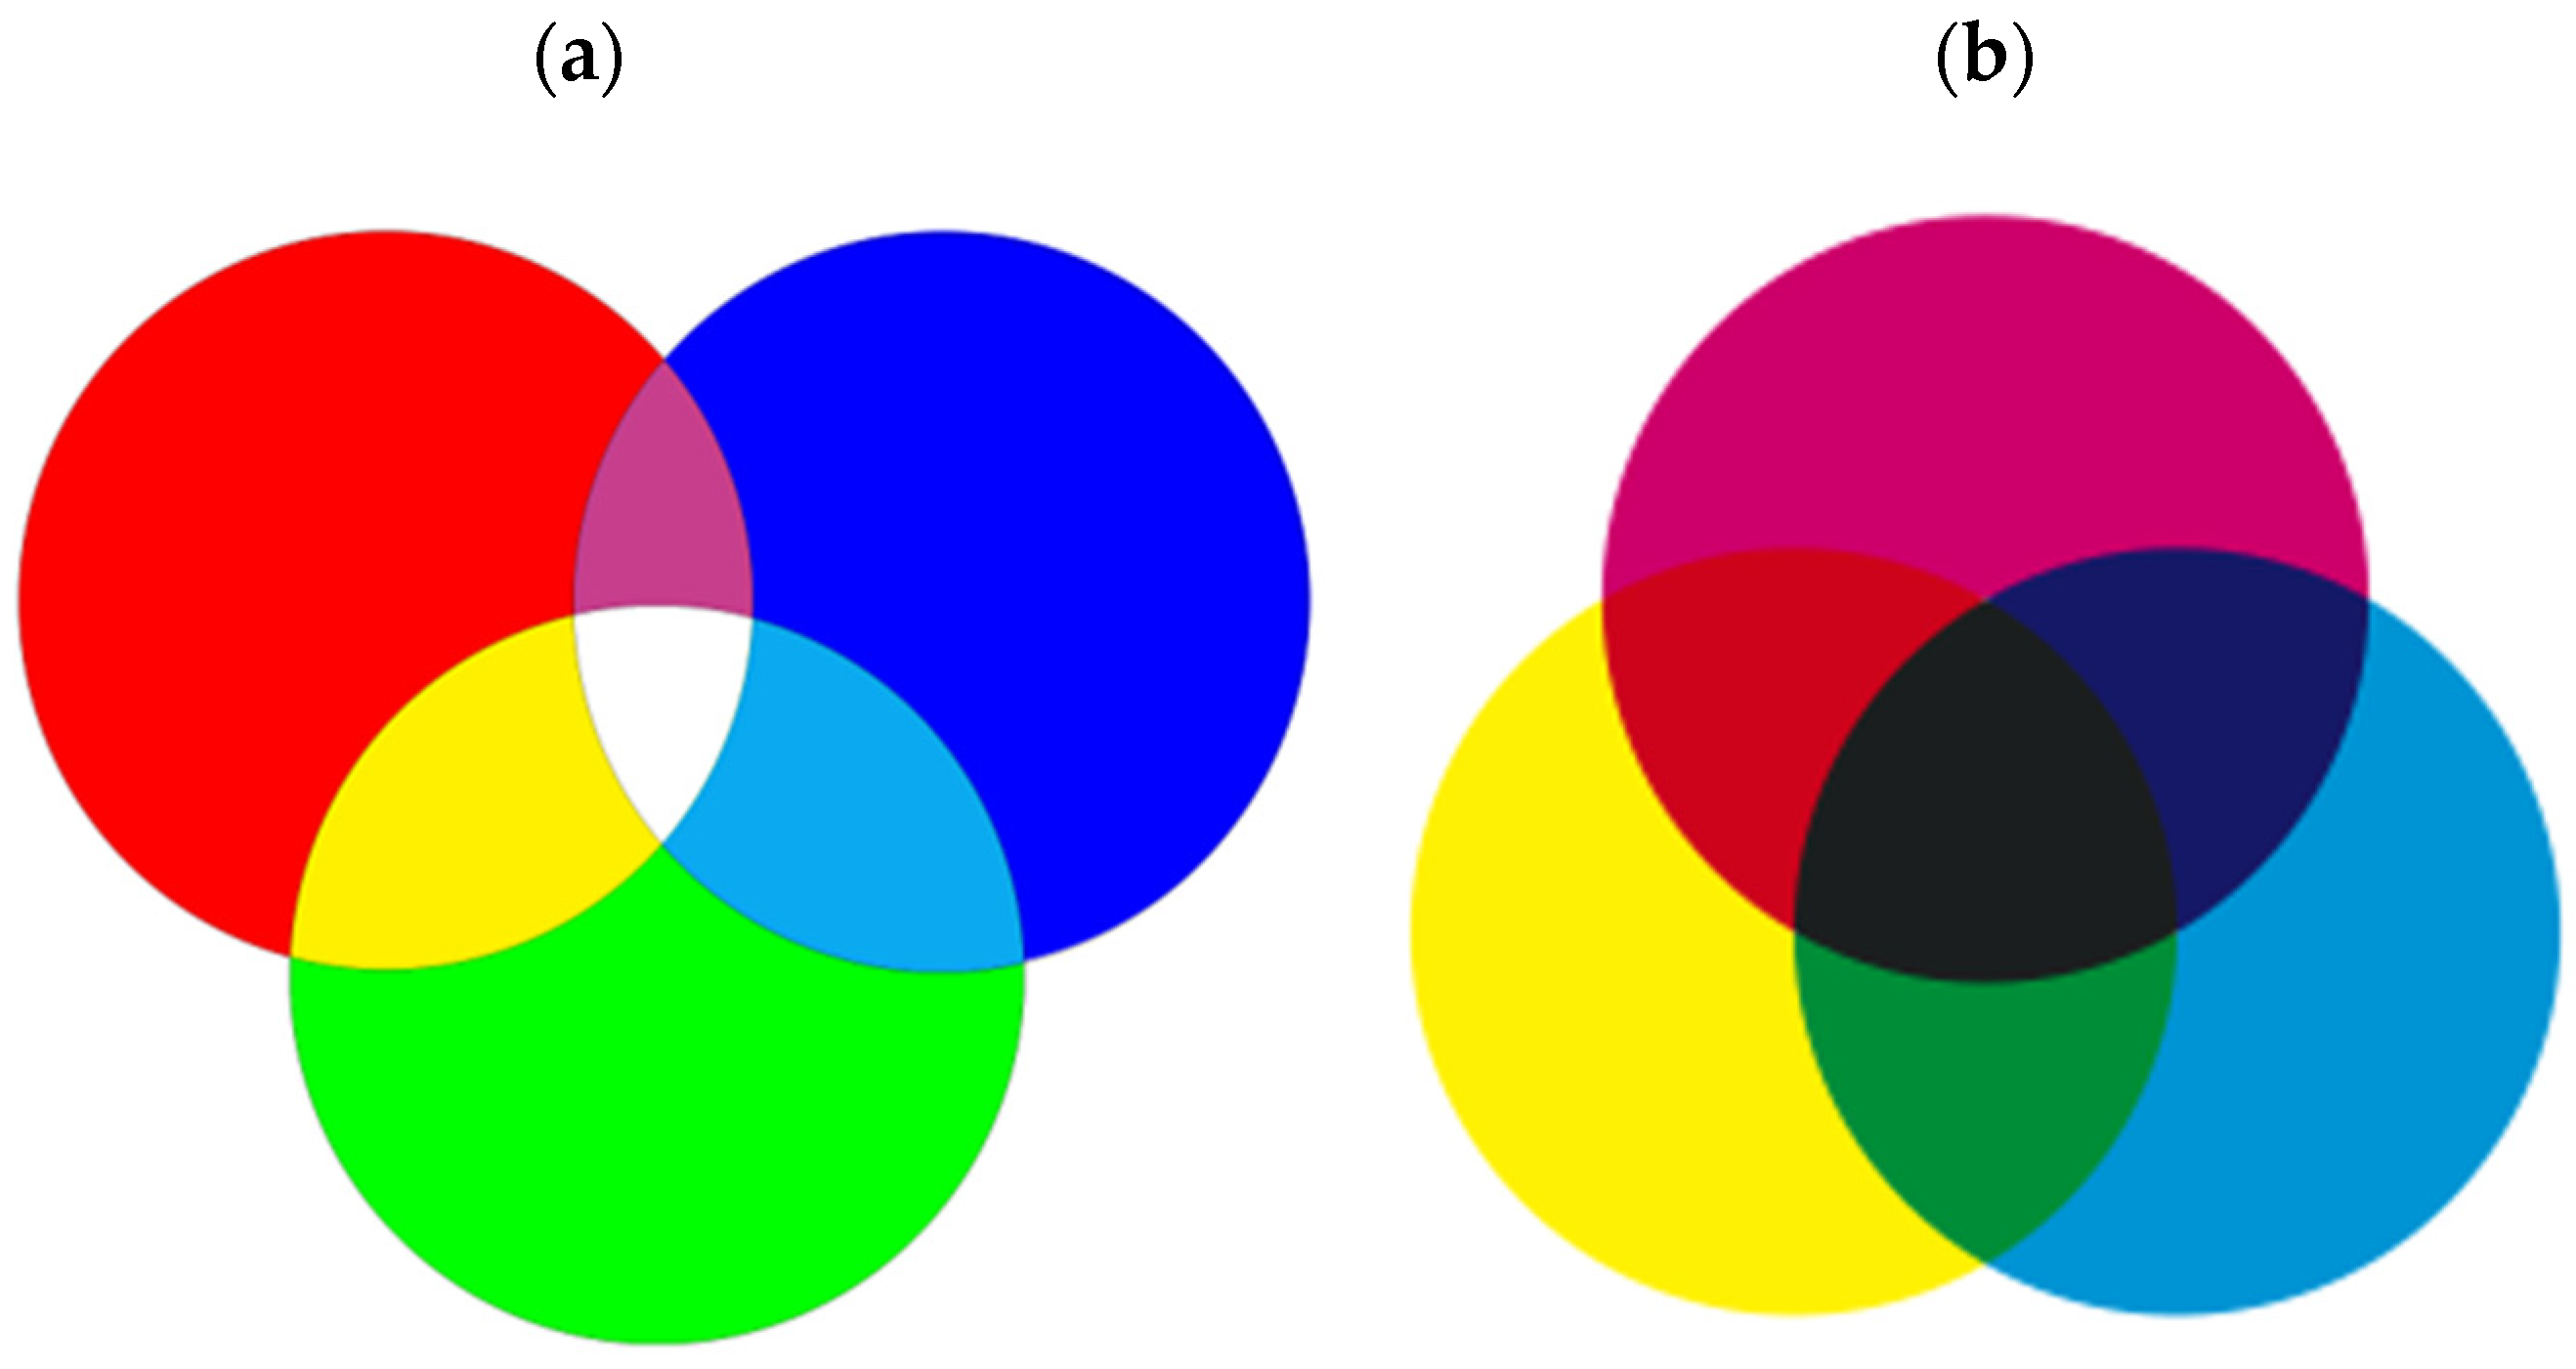
RGB and
CMYK color models are shown in
Figure 2.
The
RGB color model has values
0-255. The
CMYK color model is presented in the
0 and
1 systems. It is necessary to convert their values to work with the mentioned color models.
CMYK values must be changed from the
0.1 range to the range
0-255. In order to be able to define colors in this way, it is necessary to convert the
RGB colors from the
0-255 range to the
0.1 range in the first step:
The Contrast color (K) is calculated from Red (R'), Green (G'), and Blue (B'):
Formulas for converting CMY color values to RGB color model values:
The following
Table 1 shows the conversions of
RGB and
CMYK color values.
As mentioned above, the basic principles of working with
RGB and
CMYK color models and the basic definition of absolute color values in both models were applied in this research. The experiment also uses the value of white light, which is created when all three absolute
RGB colors are used. It is given as
1W in
Table 1. This absolute value of
1W (255,255,255) is also the starting point for a practical experiment with colors in the virtual environment of an art gallery. The following section is a description of creating a virtual art gallery environment. The study focuses on the changing color environment and the user's perception of these changes embedded in a VR art gallery environment. In this environment, converted color values to an
RGB color model are used.
4. The Virtual Art Gallery
In the software for creating 3D objects and VR environment
Unity engine (2021), a room is created in a virtual environment for the experiment's needs. [
18] Realistic art objects by the Czech artist Martin Pasma were presented in this virtual gallery. As
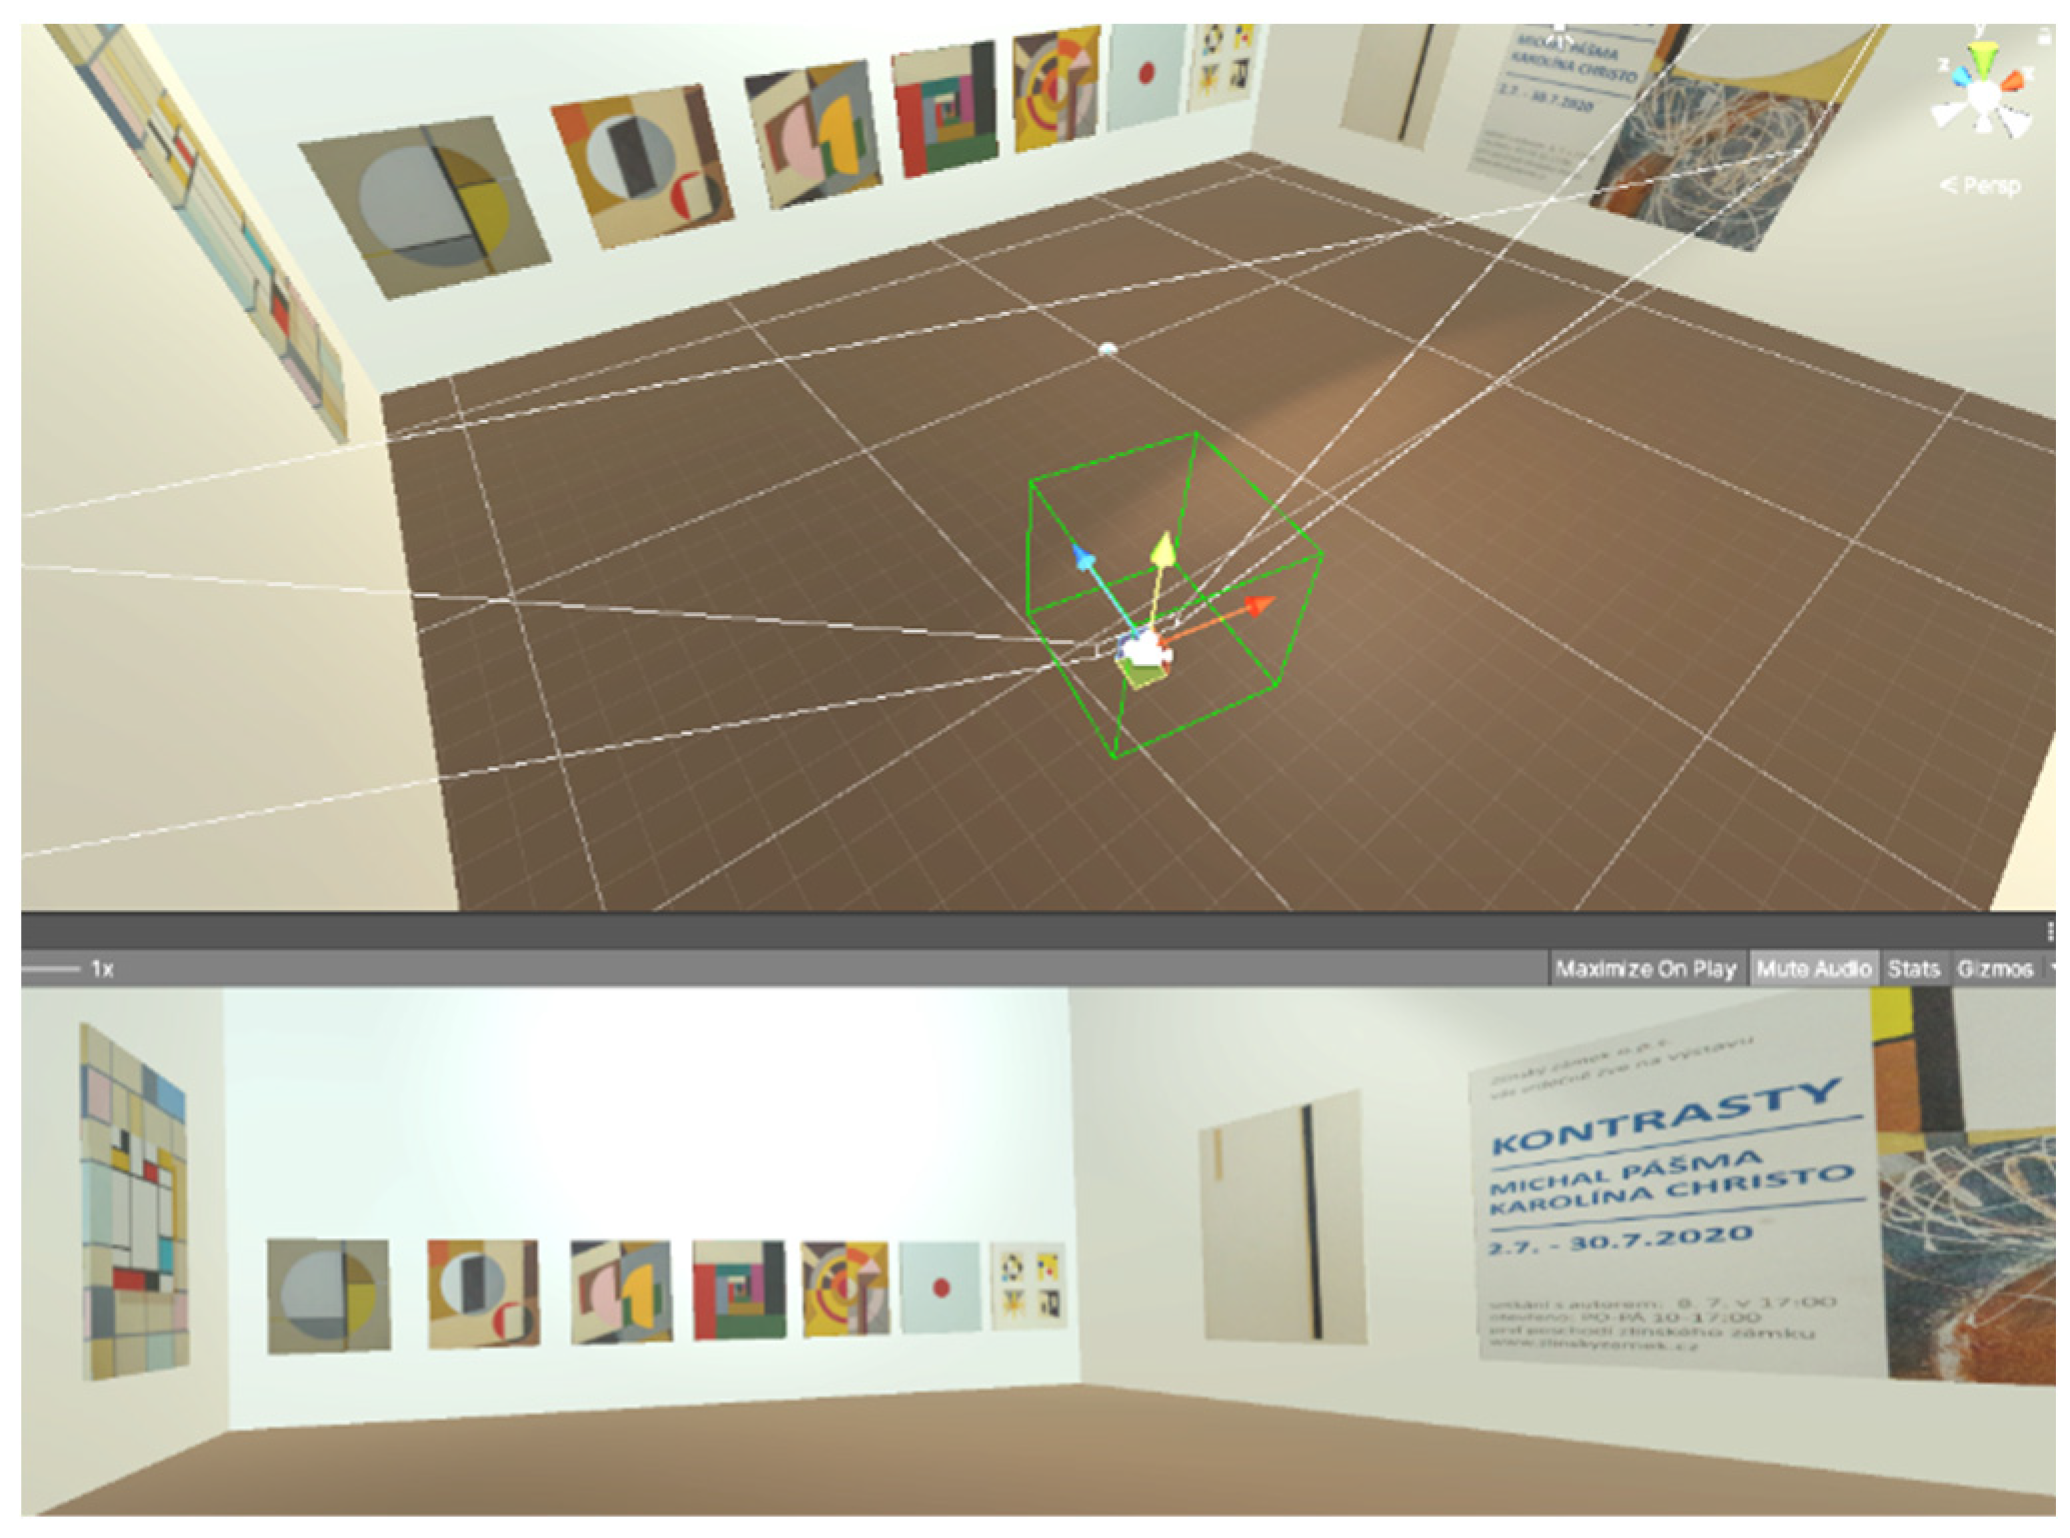
Figure 3 shows, the walls of the virtual room have a default color of
W (White), which has a value of
(255,255,255) in the
RGB color model. The color values of the virtual room's walls change during the user's embedding into the VR environment, as well as its tone. The essence of the color modification of the environment is (among other things) to record to what extent and when the user notices a change in the virtual environment. The artistic images presented in the virtual art gallery were crucial in directing and maintaining the user's immediate attention in the created environment. The user could actively move and study the details of the images up close or from any distance as a complete unit of the presented topic.
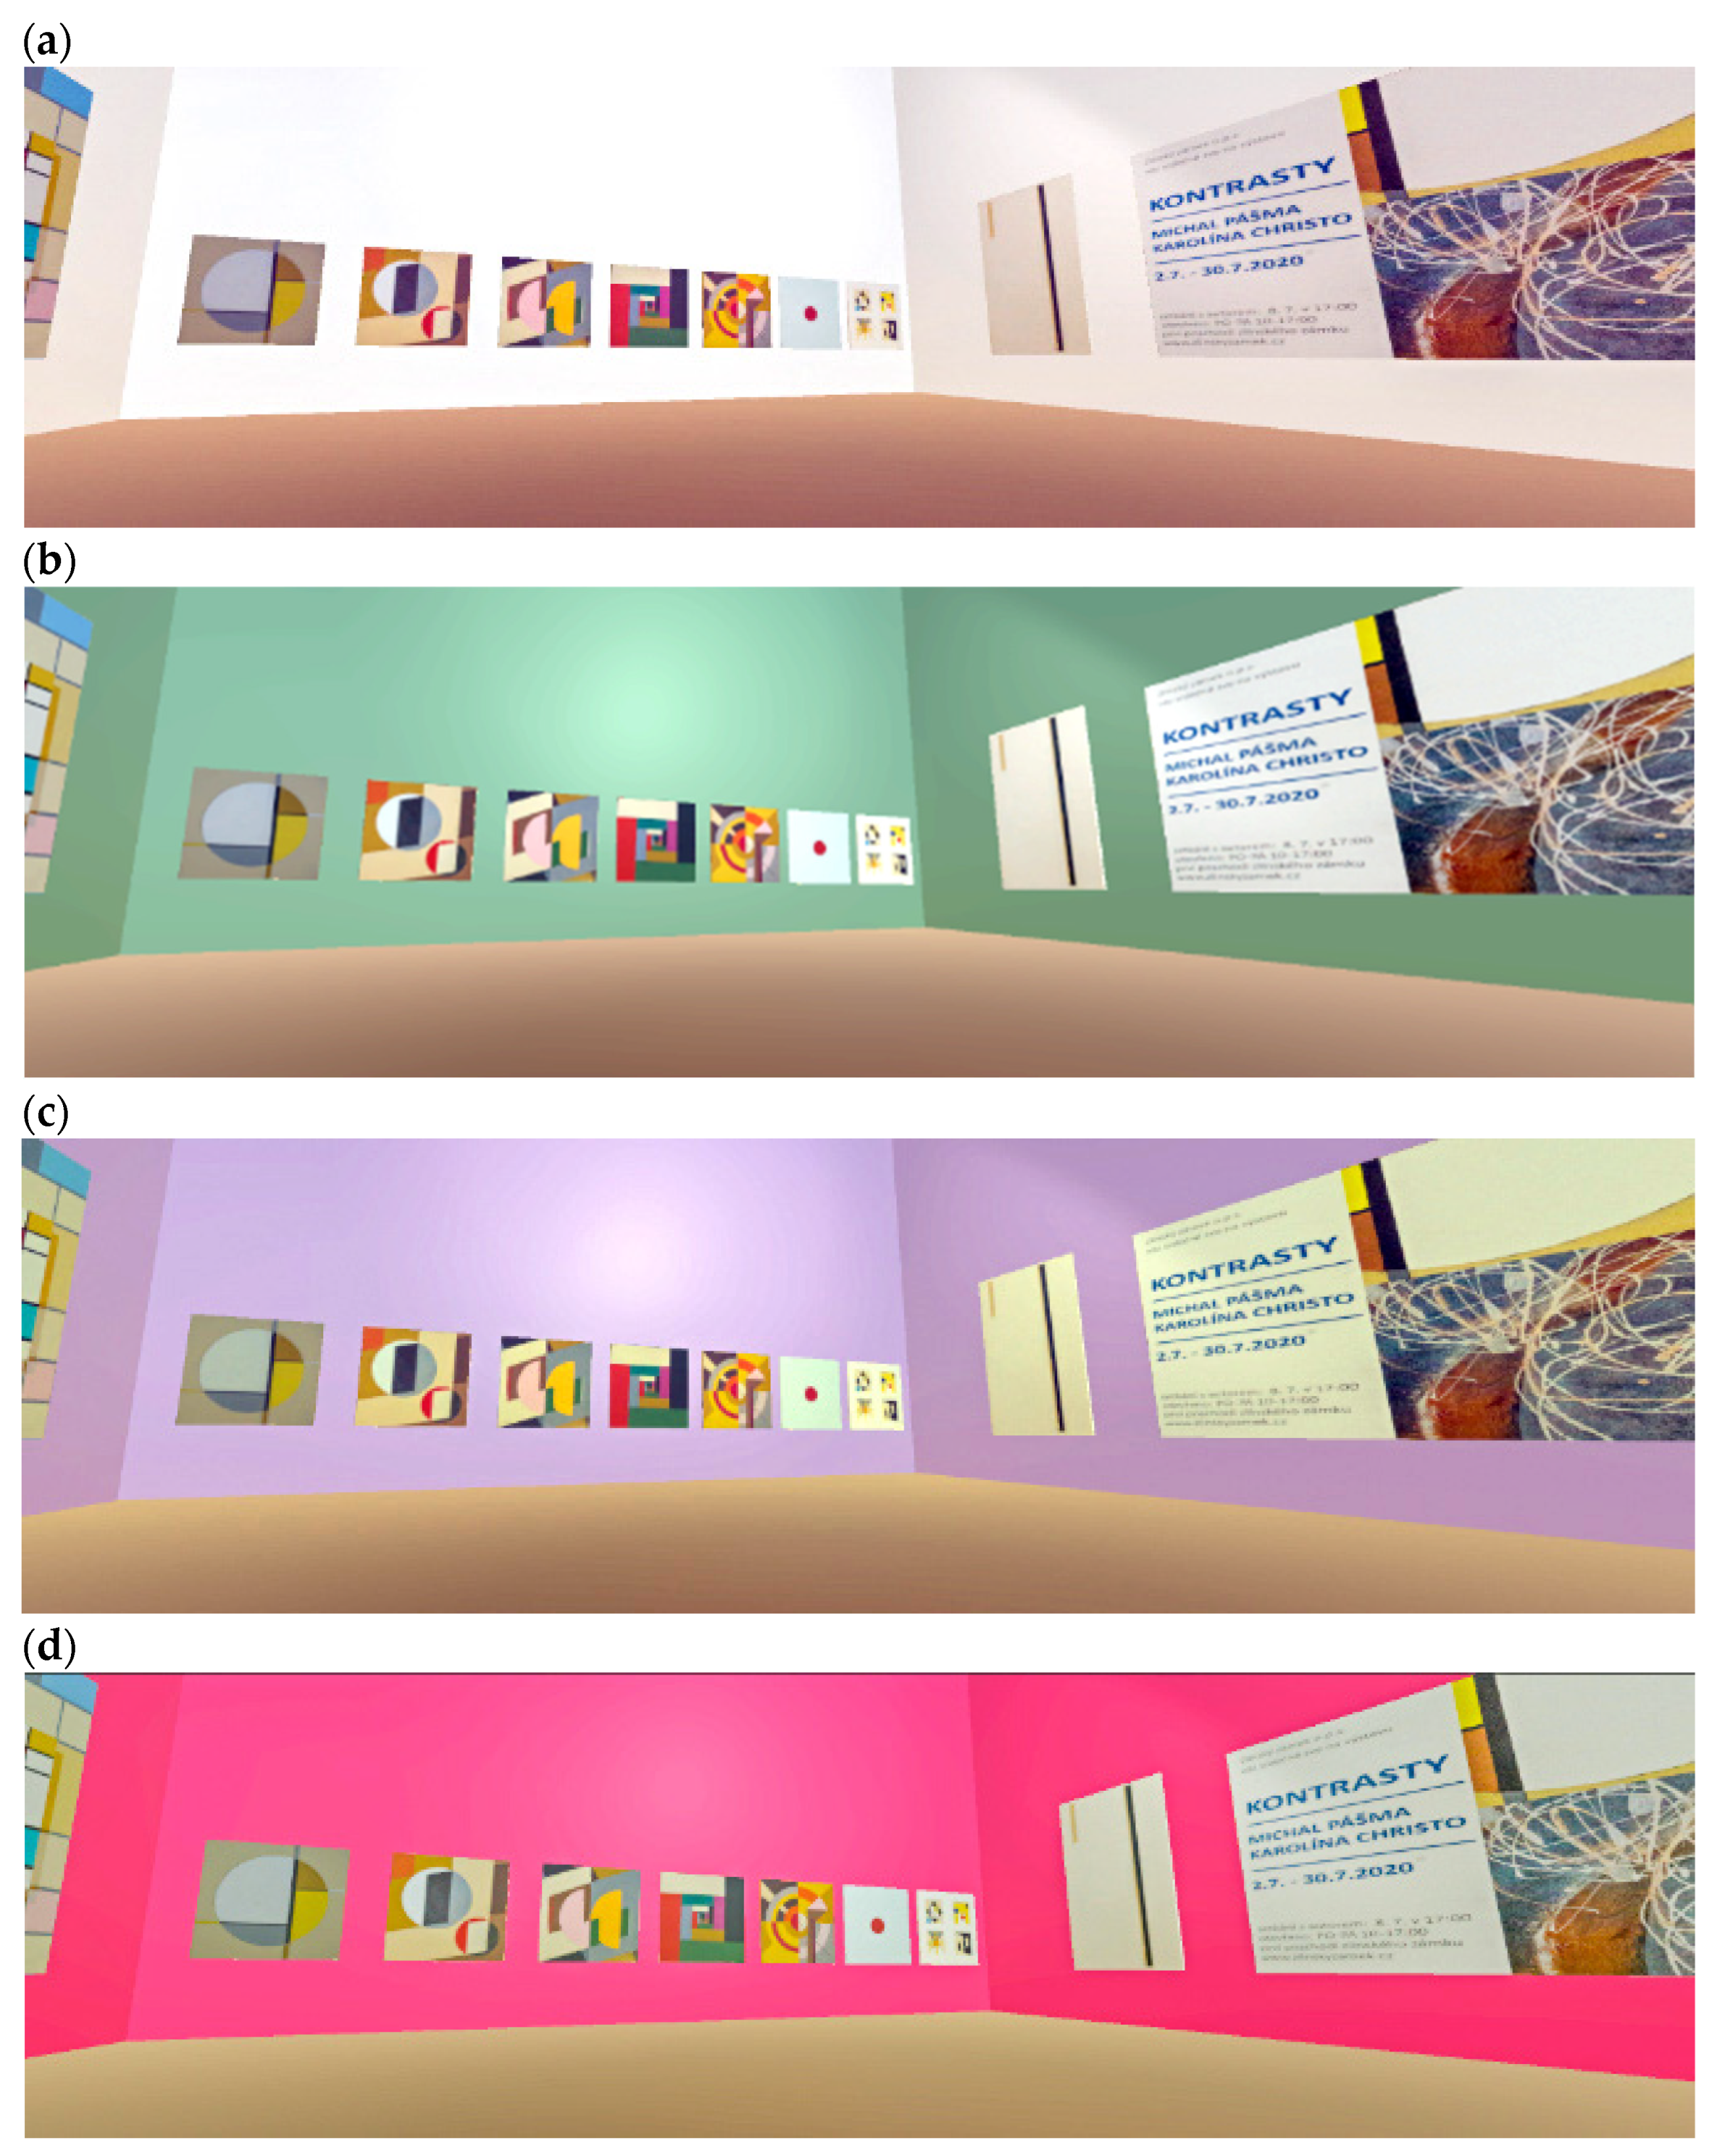
The white color of the room's walls, which highlighted the presented images, was static in the first minute after starting and embedding the user into the VR. After that, the walls began smoothly changing the color value to another tone and color. A range of pre-defined colors was used.
Figure 4 shows the VR environment and its reference color modifications.
In individual steps indistinguishable from the human eye, these color changes took place over 15 minutes until the first input value of the wall color
W (White), and then the cycle was repeated. However, three sudden intervals with a very contrasting change in the color of the environment were also defined during the cycle. The absolute values of the color model
R (255), G (255), and
B (255) were chosen to measure their influence on the user's physiological changes in VR. These colors were defined in the environment statically for 10 seconds.
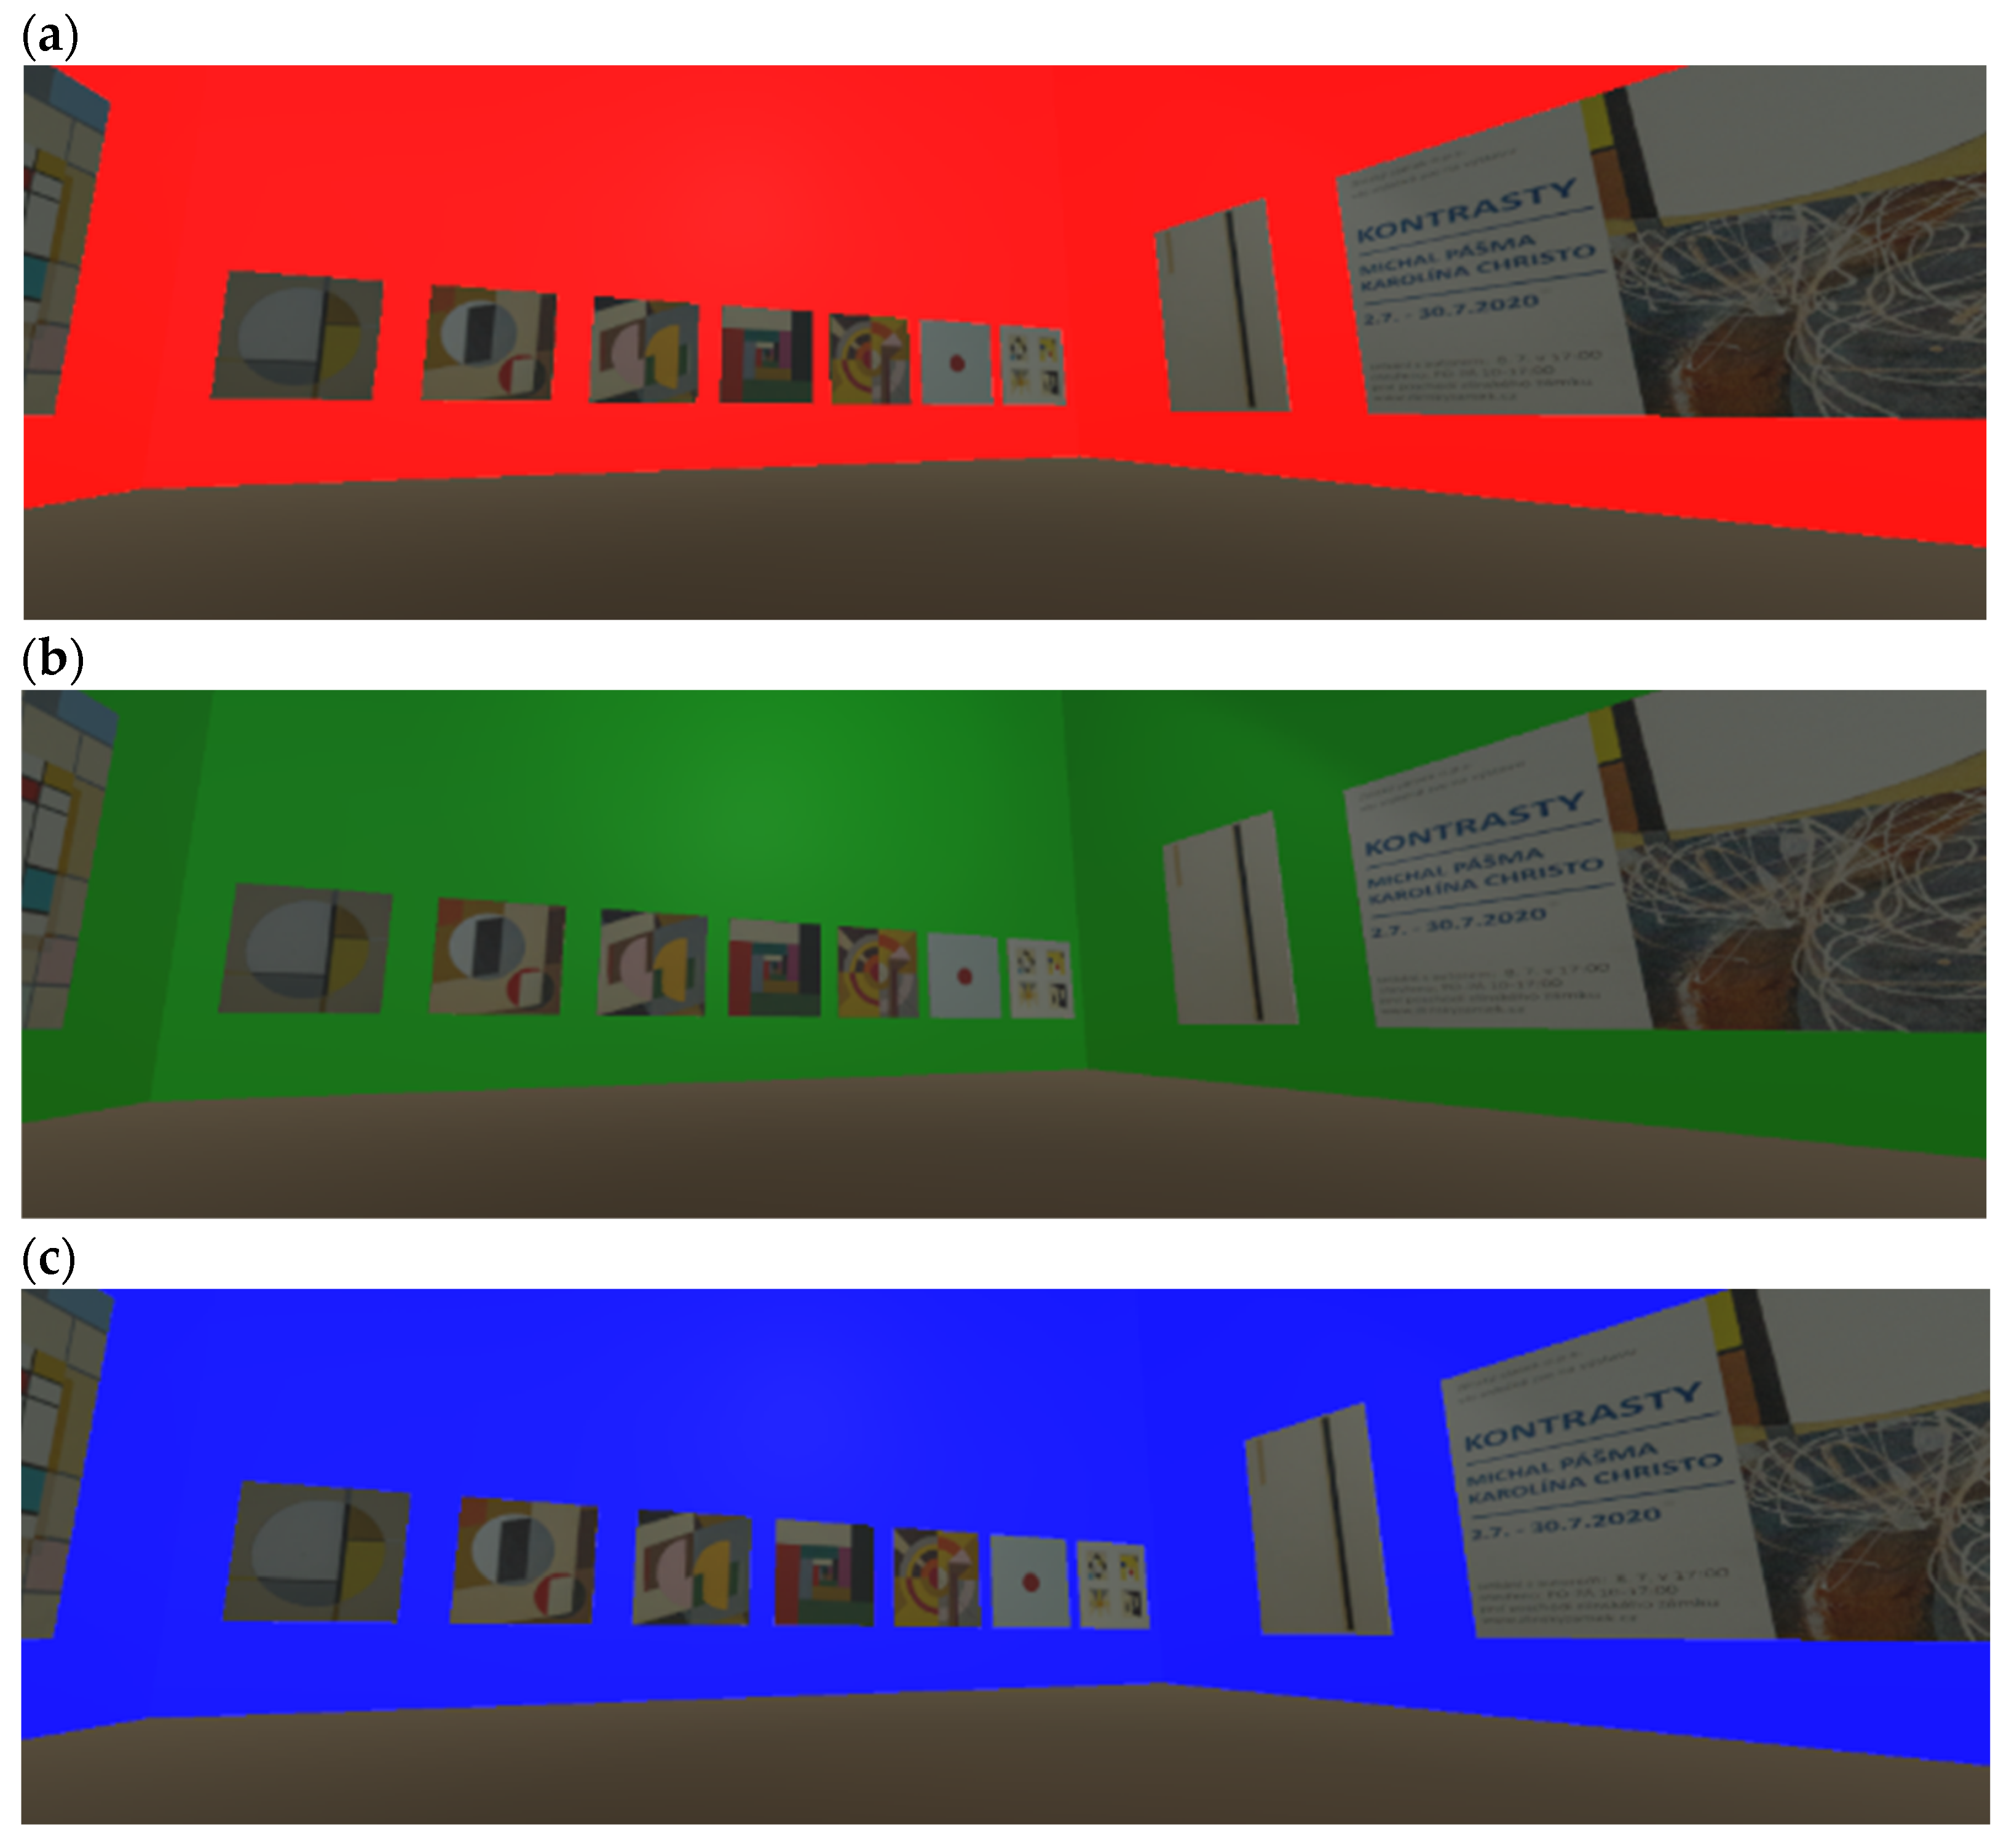
Figure 5 shows the VR environment in
R, G, and
B background color intervals.
As it was written in this text, the virtual environment of the gallery was created with a color-modifiable background. These color modifications were applied to the walls of the room in the VR environment. The starting background color was W (White), which varied smoothly by one tone across the entire color gamut in a 15-min time cycle. Into this cycle, step-by-step changes to the absolute colors of the RGB color model were applied. These change color modifications aimed to observe the user's physiological changes embedded in the VR environment. The lie detector recorded these changes. The following section describes applying color changes in the VR gallery.
5. C# Script Color Modification
One of the ways to achieve a smooth transition of an object's color to another color in the Unity engine is by using a C# script. Within the script, we can choose the object, its exact color, and the conditions under which this color will change. This project uses such a script for smooth transitions between 7 different colors. Initially, the desired colors are selected and written in 3 sheets, each containing one of the color components RGB (red, green, blue) in the same order in which the colors will be displayed and gradually modified:
publicint[] colR = { 0, 255, 147, 221, 255, 106, 255 };
publicint[] colG = { 255, 0, 112, 160, 0, 90, 255};
publicint[] colB = { 0, 255, 219, 221, 0, 205, 255};
Also need to specify 3 other colors:
The color that will change ("actualColor" variable).
The color will change to (variables "activeR", "activeG", "activeB").
The current color of the object (variables "nextR", "nextG", nextB").
First, using the "activeColor" variable from the sheets with color values, we call up the value of the color from which we want to start the modification. We save the individual color components in the variables "activeR", "activeG", "activeB":
activeR = colR[actualColor];
activeG = colG[actualColor];
activeB = colB[actualColor];
The color parameters of the next transition are obtained in a similar way. Next add 1 to the variable "actualColor", and the parameters of the following colors are obtained from the lists of color folders. These colors are stored in the variables "nextR", "nextG" and "nextB":
nextR = colR[actualColor+1];
nextG = colG[actualColor+1];
nextB = colB[actualColor+1];
In the next steps, the individual "activeX" variables are used to store the transition color parameters. The values of these variables are then numerically approximated to the "nextX" values. A value of 1 is chosen for one step of color approximation.
For each color component, a special method is used which it is decided:
void calculateR()
{
int split = activeR - nextR;
if (div > 0) { activeR = activeR - 1; doneR = false; }
if (div < 0) { activeR = activeR + 1; doneR = false; }
if (div == 0) { doneR = true; }
tempR = (float)sctiveR / 255;
}
Two more variables are also assigned to each color component:
- -
-
doneX
Variable of type Boolean.
Contains information whether the given color component has already reached the required value. In case the color folder variables "activeX" and "otherX" contain the same values, this variable is set to "true", otherwise it remains "false".
- -
-
tempX
In general, it is customary to use whole numbers in the range 0-255 to express individual color components, however, in the Unity engine, a decimal number with an interval of 0-1 is used for individual color components. Based on the logical continuity of the individual operations, a procedure was chosen where the individual colors between which we want to create a transition are entered in the usual values and the recalculation is only carried out within the running of the script.
Scripts used within the Unity engine, by their very nature, allow certain steps to be performed for each newly displayed image on the screen in the form of the "Update ()" method. The commands written in this method are then directly dependent on the number of frames per second (FPS). As part of the chosen procedure for modifying the color of objects, it is also necessary to determine at what speed the color transition will take place between individual colors and their color components. In this case, two numeric variables "counter" and "interval" were chosen:
Every time, when the "Update()" function is selected, the value of the "counter" variable is increased by 1. If the "contour" variable reaches the value of the "interval" variable, the new values are set in the "tempX" variables, these are applied to the requested object, and the value of the "interval" variable is set to 0 again.
if (counour == interval) { recountR(); recalculateG(); recalculateB();
zed.GetComponent<Renderer>().material.color = new Color(tempR, tempG, tempB); counter = 0; }
Achieving the desired color is detected using the "doneX" variables. Suppose these variables for all color components contain the value "true" it follows from the logical context that all color components have already reached the values of the color to which the original color was changed, and all variables can be set to values corresponding to the transition to the next color from the list. Otherwise, it is necessary to repeat the individual steps of the selected procedure until the mentioned condition is met.
if (doneR && doneG && doneB) {
actualColor++;
nextR = colR[actualColor + 1];
nextG = colG[actualColor + 1];
nextB = colB[actualColor + 1];
doneR = false;
doneG = false;
doneB = false;
}
6. C# Polygraph Sensor and Signals
The user's reaction is embedded in the VR gallery environment. A model situation is created using lie detector sensors (polygraph). Lie detectors are currently used in many fields, especially criminology, law, and psychology. At the same time, they are also the subject of unmeasured data analysis and evaluation. [
19,
20,
21,
22,
23,
24] It is usually a measurement of changes in physiological properties induced by a specific stimulus. However, an experiment measuring the effect of background color changes on a user embedded in a VR environment has not yet been carried out. Regarding
Human color vision, it can be assumed that a sudden change in the color of the virtual environment will be a stimulus for a change in physiological properties. The lie detector LX6 from the
Lafayette Instrument POLYGRAPH company was chosen for these purposes. [
25]
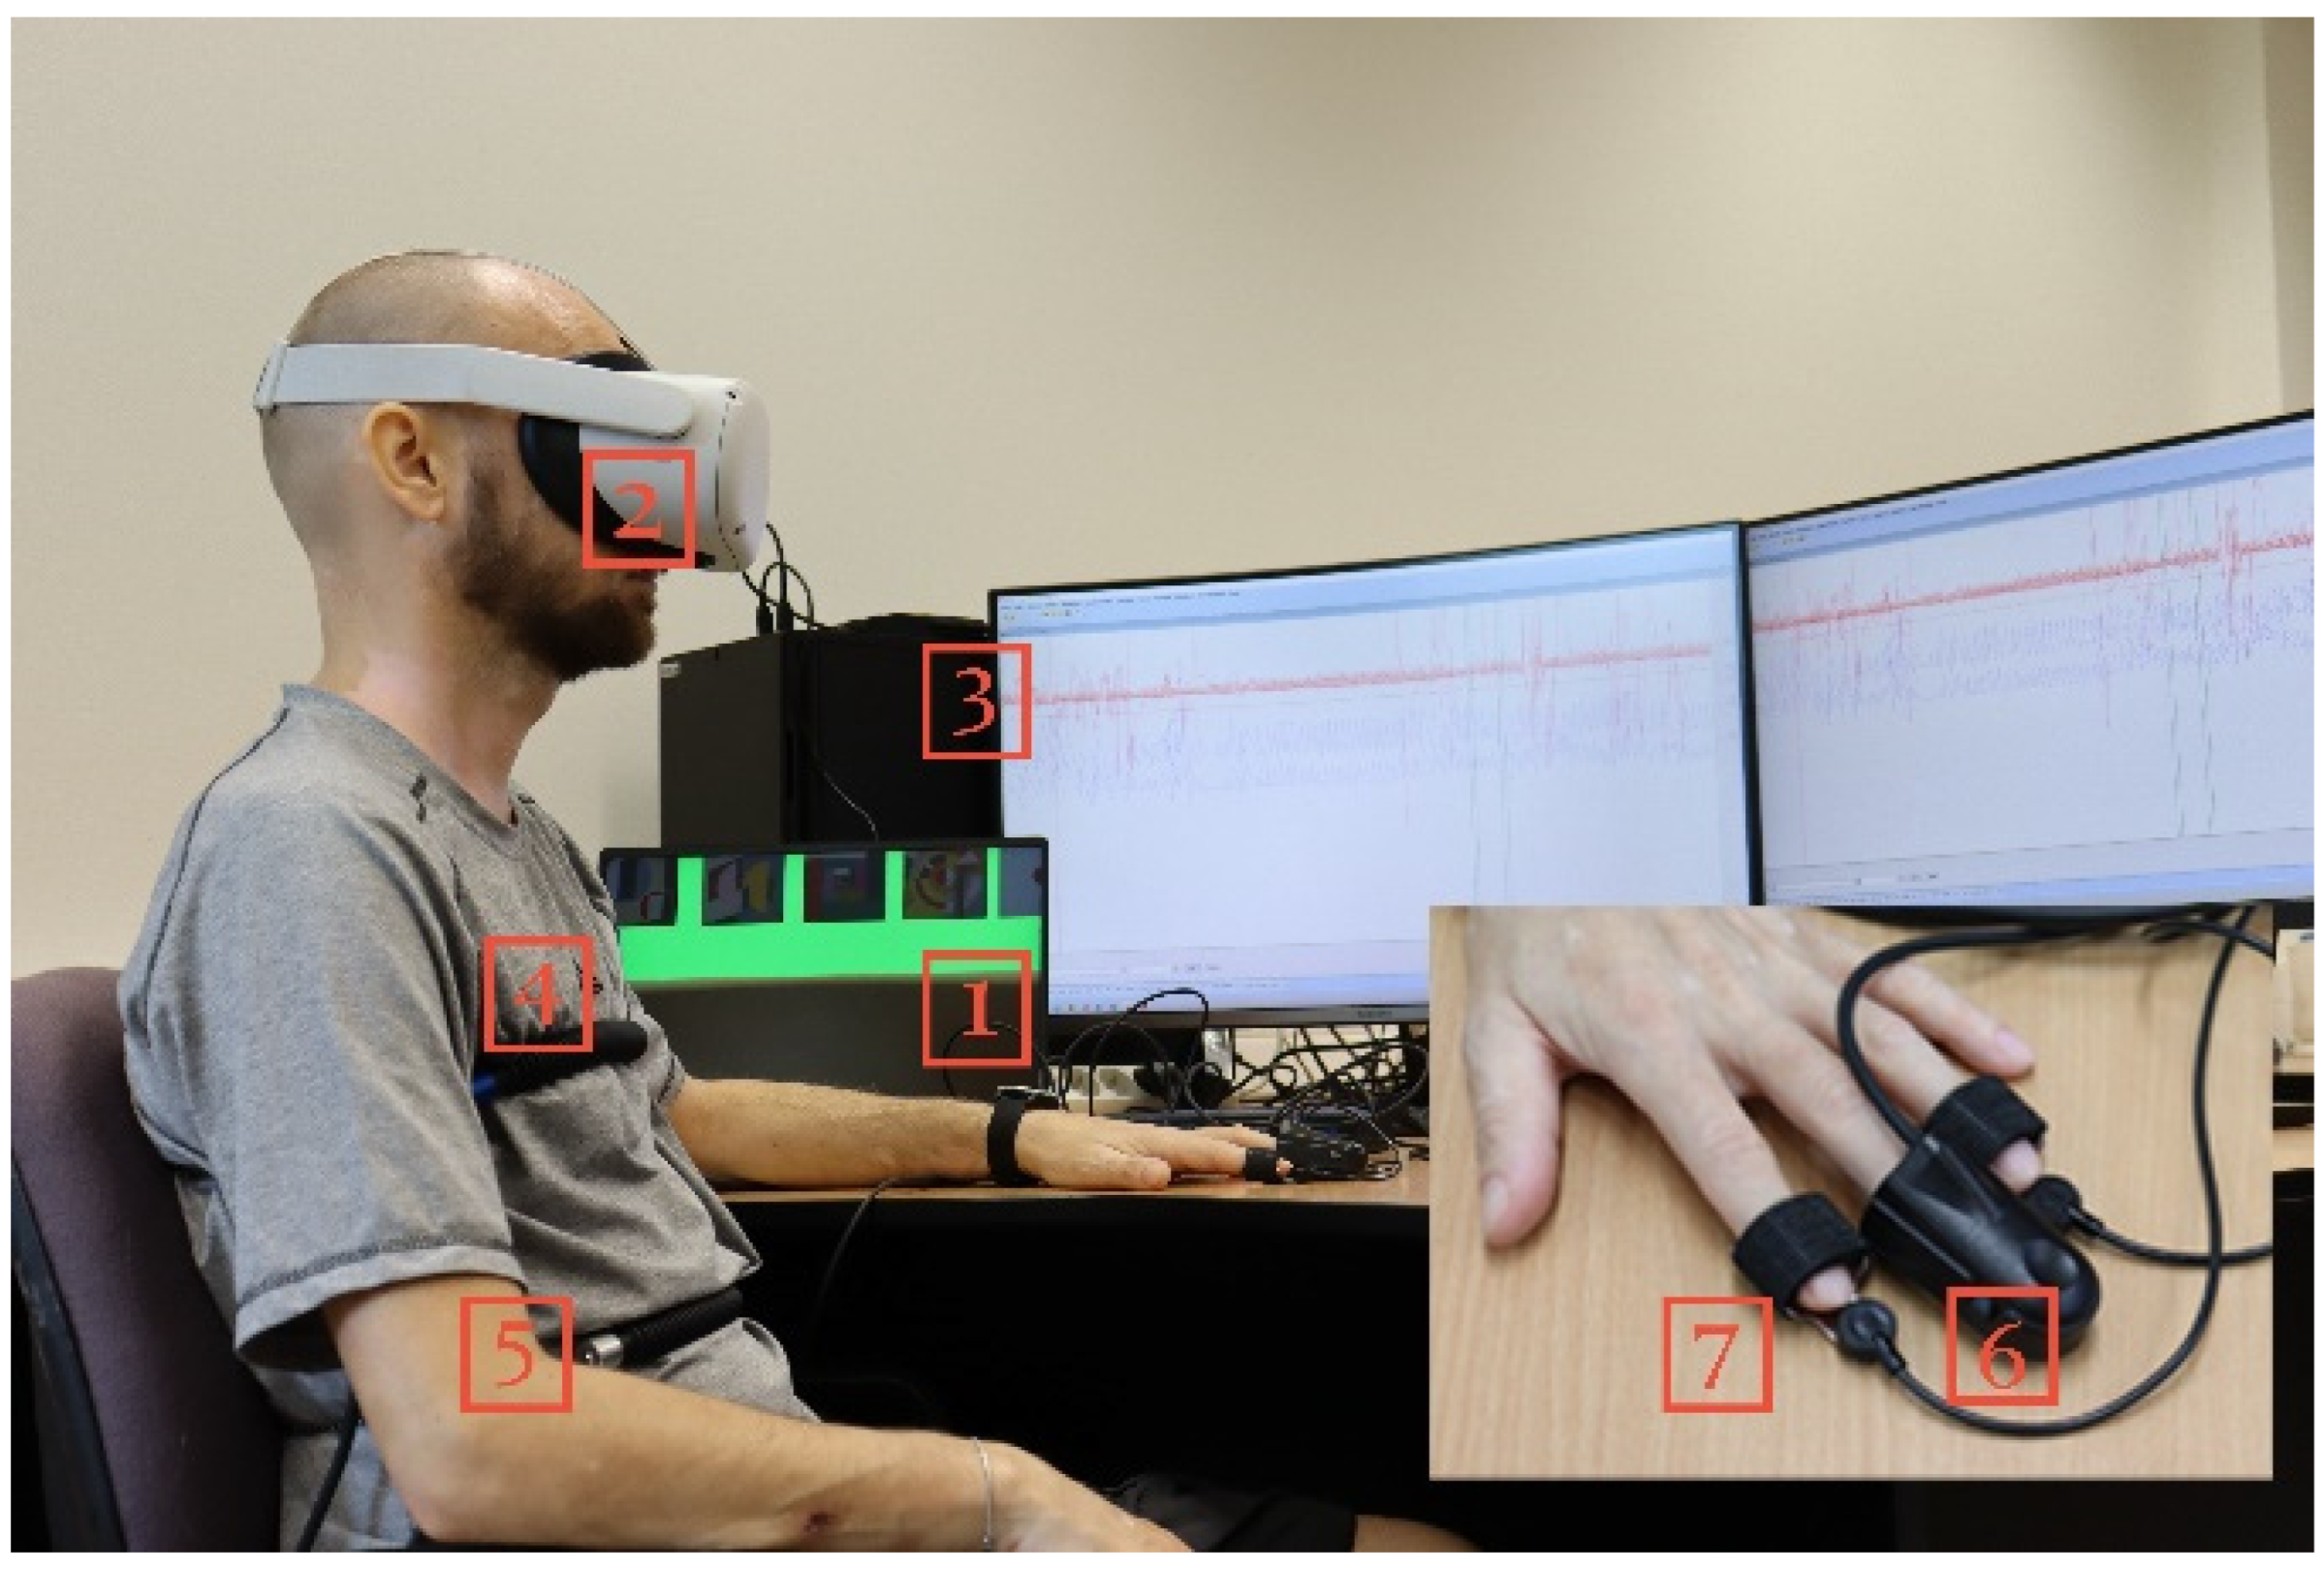
Figure 6 shows a user embedded in a VR environment and connected to sensors to measure changes in physiological properties using a lie detector.
Figure 6 shows a user nested in a gallery in a virtual reality environment. The numbers 1 and 3 in
Figure 6 define the computing devices used in this experiment.
Rectangle number 2 shows a device mediating the user's visual immersion in a virtual art gallery using the Oculus Quest2 VR headset. The user embedded in the VR environment is simultaneously connected to the sensors of the polygraph. Sensors for measuring physiological changes are marked in
Figure 6 in
rectangles 4-7: [
26,
27]
6.1. Pneumograph (Sensors 4 a 5)
Two sensors are attached to the user's body, measuring breathing in the chest and abdominal area. During breathing, the air is exchanged during inhalation and exhalation. Regular breathing can be defined by its frequency. This frequency can be determined by the number of breaths per minute. These are respiratory sensors, which are indicated by frames 4 and 5. Sensor 4 detects the frequency of breathing in the area of the upper respiratory tract, and sensor 5 in the vicinity of the diaphragm. These sensors have the task of monitoring changes in lung volume, breathing intensity, and breathing rhythm. The standard breathing rate for healthy adults is 16-20 breaths per minute. Analyzing data from pneumograph sensors is challenging. The user can arbitrarily change the frequency of the breath. Another factor influencing the resulting data can be natural factors, such as coughing, sneezing, swallowing, or talking.
6.2. Photoelectric Plethysmograph (Sensor 6)
This sensor records rapid changes in pulse blood volume. The sensor records the change through a photosensitive sensor that measures the light reflected or transmitted through the skin. The intensity of the red light falling on the sensor is directly related to the amount of blood. The sensor is, therefore, a blood flow sensor and is shown in
Figure 6 in box number 6. It is sometimes referred to as relative blood pressure (RBP), which is what is called "cardiovascular" or "relative blood volume." RBPs are shown in the waveforms as two types of signals, blood pressure and pulse change. It is therefore a capture of the amplitude in the duration of the change in blood pressure and the change in pulse waves.
6.3. Electrodermal Activity EDA (Sensor 7)
The galvanic skin response (GSR) sensor records a change in the skin's ability to conduct electricity, where skin conductivity is a prerequisite, and its change is a sign of excitement, nervousness, or psychological pressure. Skin conductance is measured using two stainless steel fingertip electrodes, and sweat gland activity is recorded. In this experiment, the change in skin resistance is measured based on sweat gland activity.
6.3. Activity Sensor
This sensor is not shown in
Figure 6. It is a pressure and movement sensor. The sensor is a chair pad that captures the movement of a seated user embedded in VR. This sensor can also be used on the hands or feet.
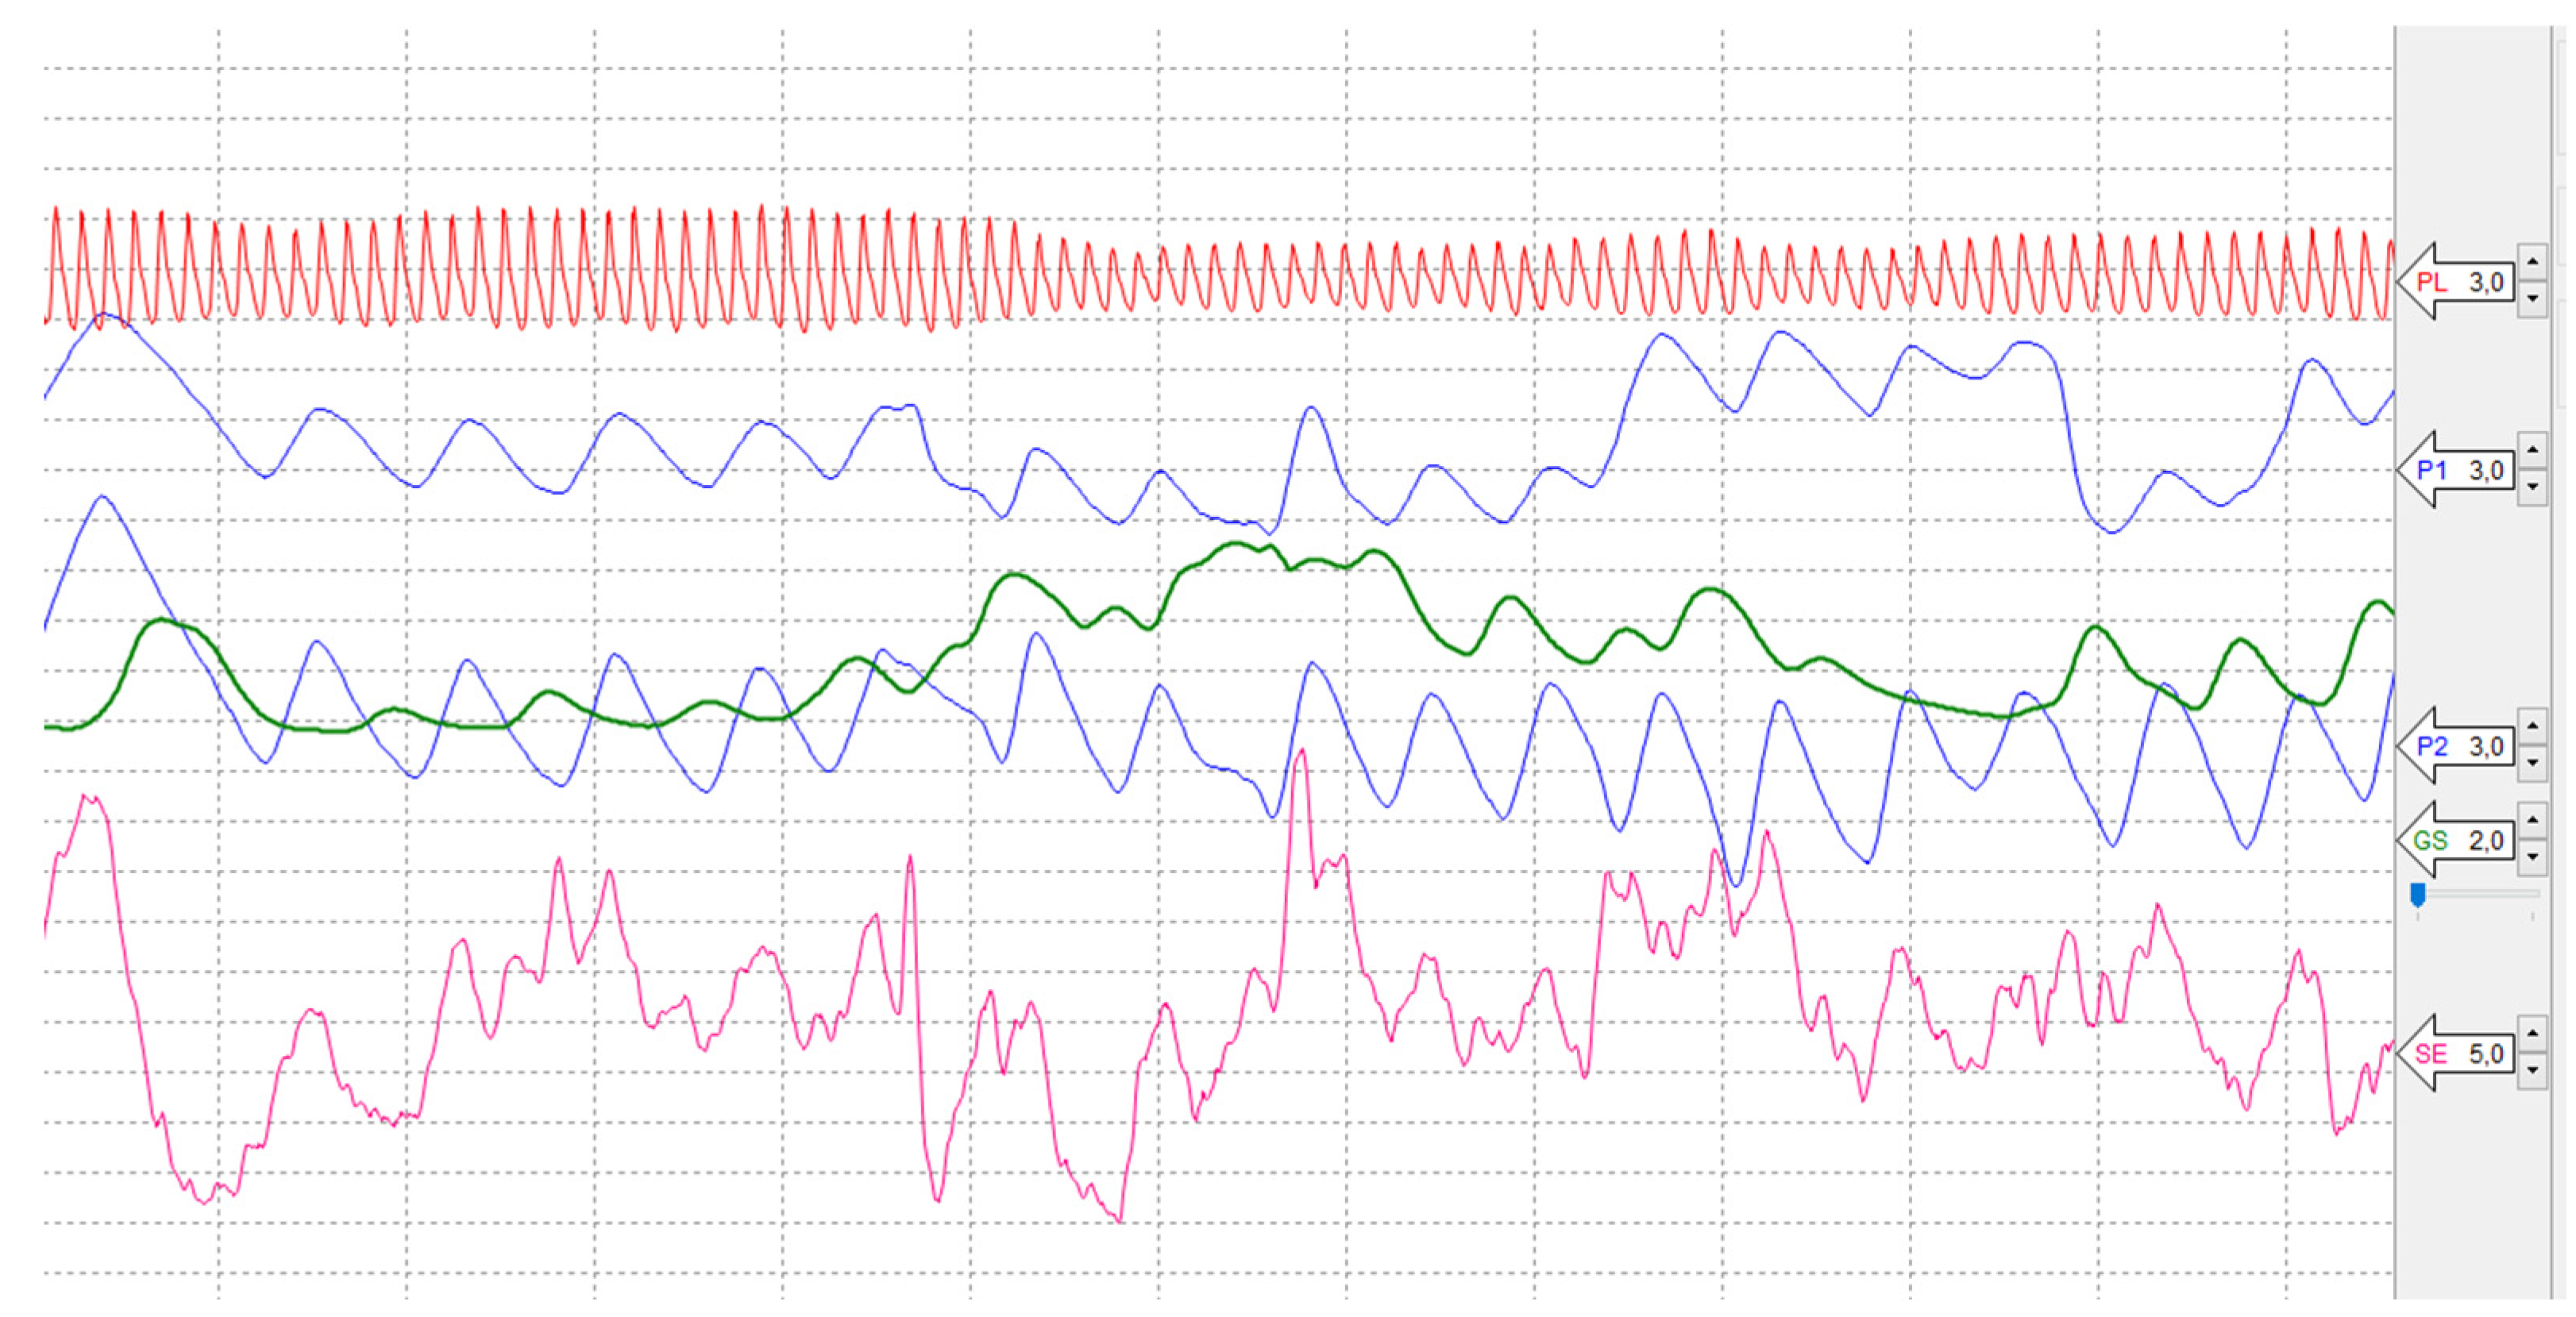
Figure 7 shows a reference recording of signals from individual sensors, which are listed under the following designation:
P1 Abdominal Respiration trace;
P2 Thoracic Respiration trace;
PL Photoelectric Plethysmograph;
SE Activity Sensor;
GS Electrodermal Activity (EDA).
Signals from lie detector sensors and their data are processed by software (SW) Lafayette Polygraph System 11.8.5. The processing of signals from all mentioned sensors and the analysis of the measured output data from the lie detector is described in more detail in the following chapter.
7. Results
There are many options for evaluating the measured data from the lie detector. The output measured data can be interpreted numerically and also with a graph. The methods used always depend on the purpose and goal of using the lie detector. [
26,
27,
28,
29,
30] In this experiment, a polygraph (lie detector) was used to record the physiological changes of a user embedded in a VR environment. Changing the colors of the VR environment was supposed to cause these physiological changes in the user. That involved a sudden change in color at a given interval when the user was embedded in a changing environment of a virtual art gallery. The measurement was carried out to detect physiological changes of the user to the reaction of three absolute process colors
RGB in the VR environment. Thus, the values of these
R(255)G(255)B(255) absolute colors formed a sudden color change in the background of the virtual gallery.
Recall that the RGB color model does not work with physical color but with colored light. That is how colors are applied in digital environments, devices, or digital output devices. There were using the principles of color and human vision. These changes were recorded using lie detector sensors, which are described in more detail in the previous chapter.
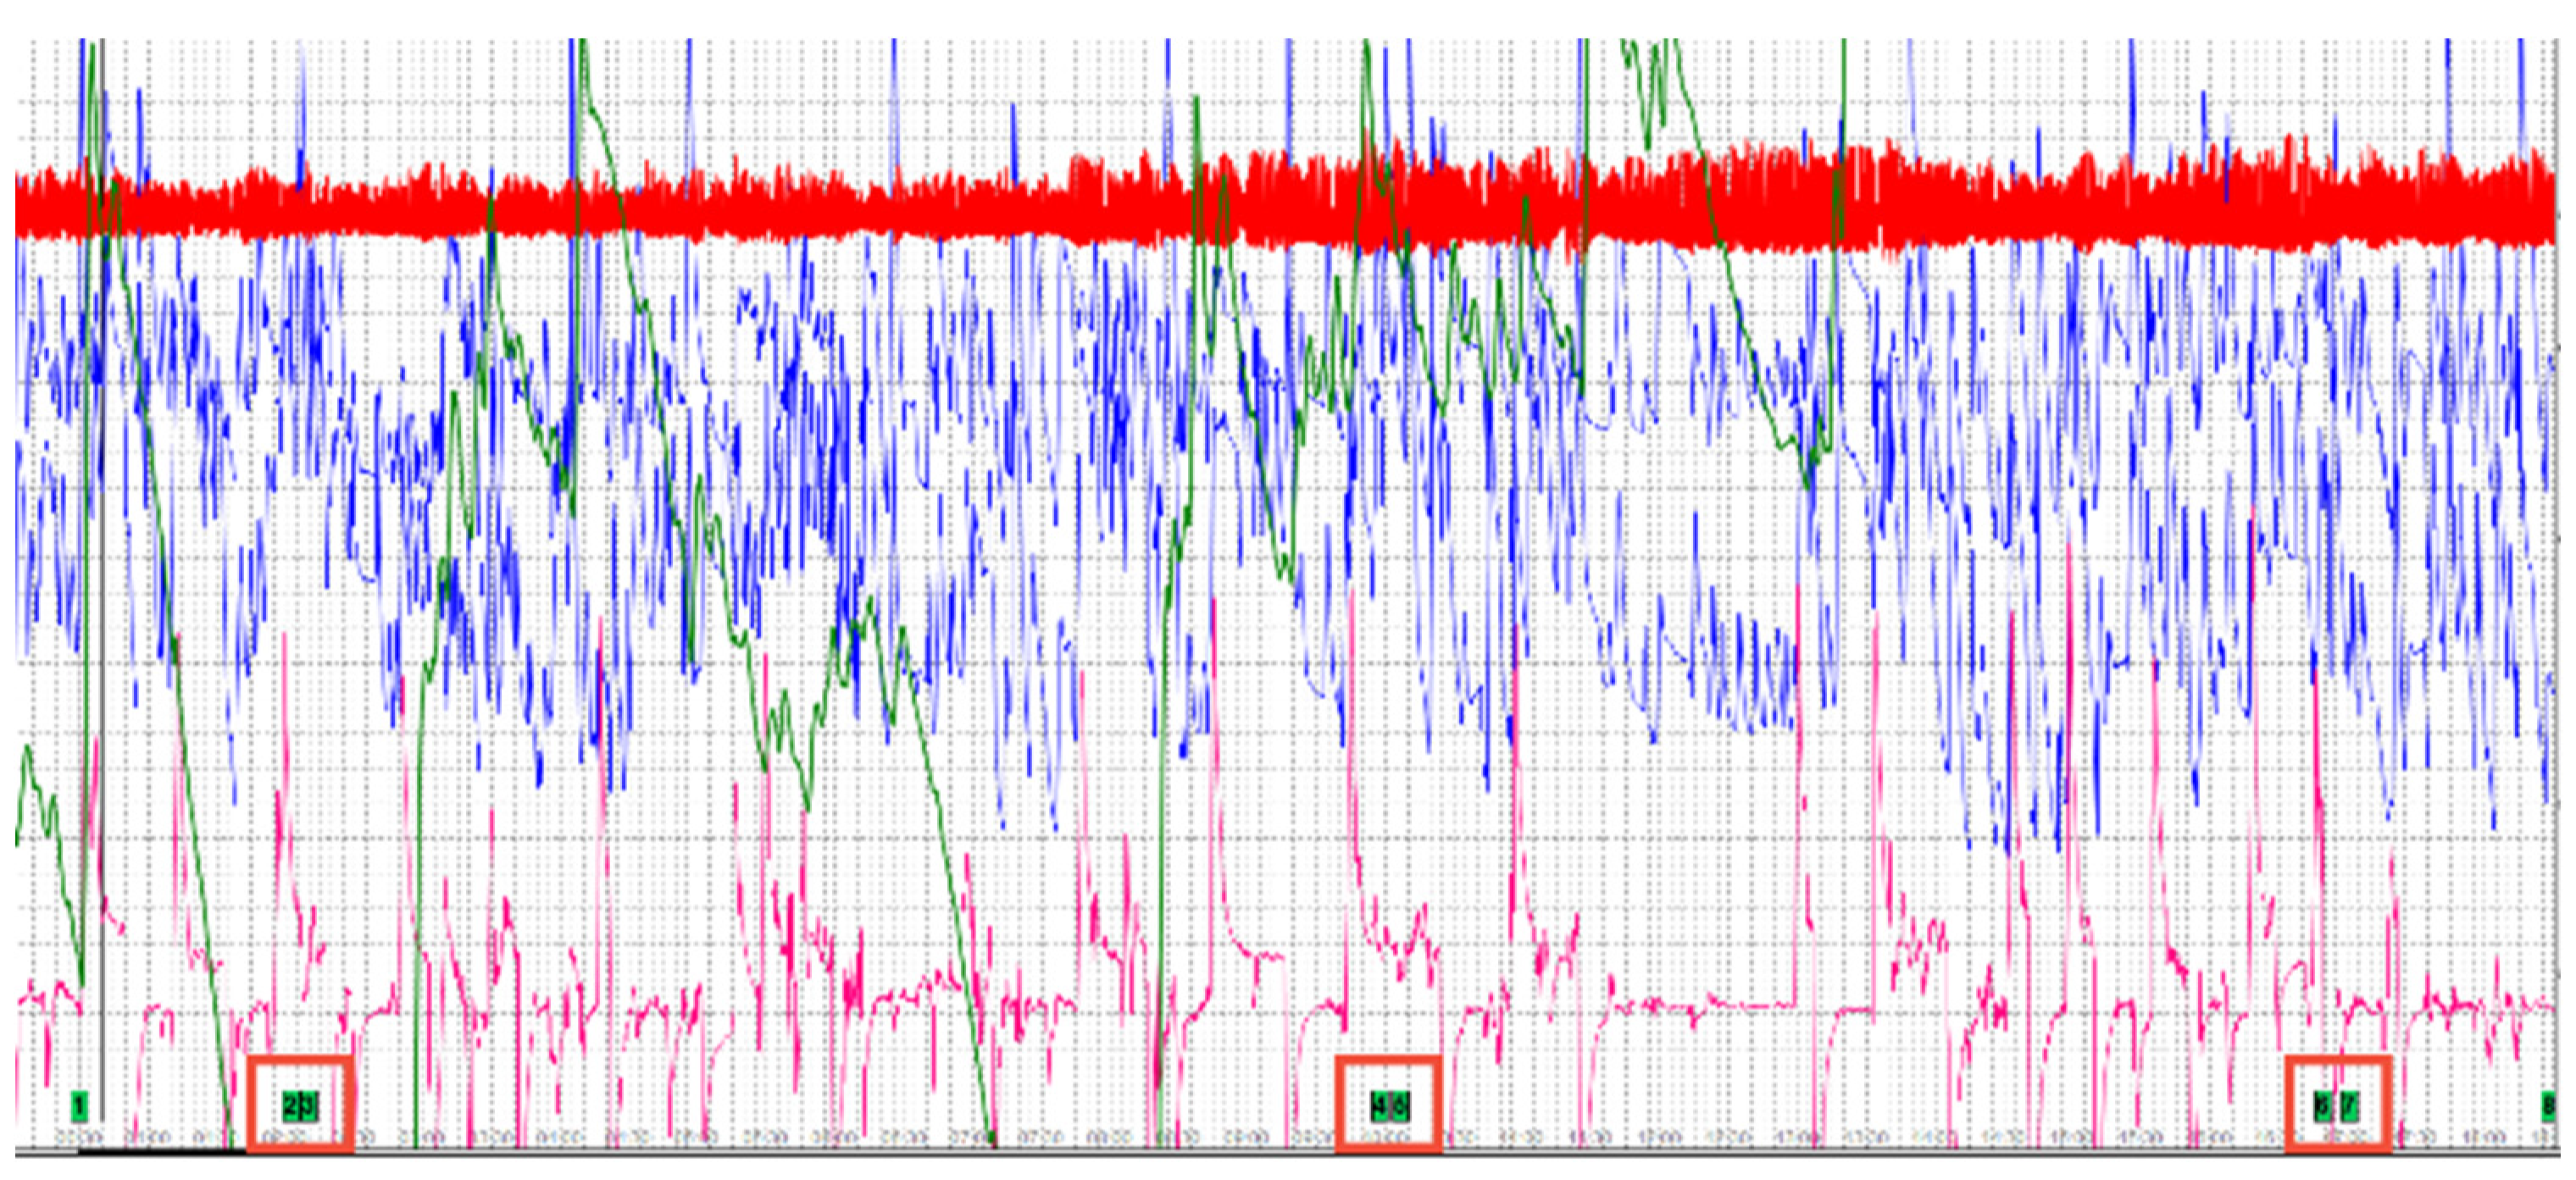
Figure 8 shows the entire time interval of the user's immersion in the VR gallery environment and the lie detector connected to the sensors. It is not known that a similar experiment has been conducted in the area of color and human vision in a VR environment. It was, therefore, not clear in advance whether the sensor detectors would detect the user's physiological changes. There are also no studies to back this experiment up.
Figure 8 shows the total recording of signals from all mentioned sensors in a time interval of 18 minutes. During this time, the user was embedded in the virtual gallery environment and connected to the sensors of the individual sensors.
As shown in
Figure 8, it is a recording of the signal of all the mentioned sensors in a time interval of 18 minutes. The red squares in the lower part of the measured data indicate the time intervals of the step change of the background color to absolute colors. The output of the sensor measurement was a large amount of measured data from all the listed sensors. This data was generated at an
interval of 0.03 seconds. Therefore, the output data had to be analyzed and simplified. For each type of sensor in the total measurement time, the following was determined:
These upper and lower bounds of the output recorded data were then defined in the interval of each absolute
RGB color, which represented the sudden change of the color environment for 10 seconds in the VR art gallery in the following order:
The following
Table 2 lists all the minimum and maximum values obtained from the total amount of measured data.
Table 2 also lists the individual sensors according to their designation in the
SW Lafayette Polygraph System, as described in
Figure 7. Individual sensors are represented by the following labels:
P1 Abdominal Respiration trace;
P2 Thoracic Respiration trace;
PL Photoelectric Plethysmograph;
SE Activity Sensor;
GS Electrodermal Activity (EDA).
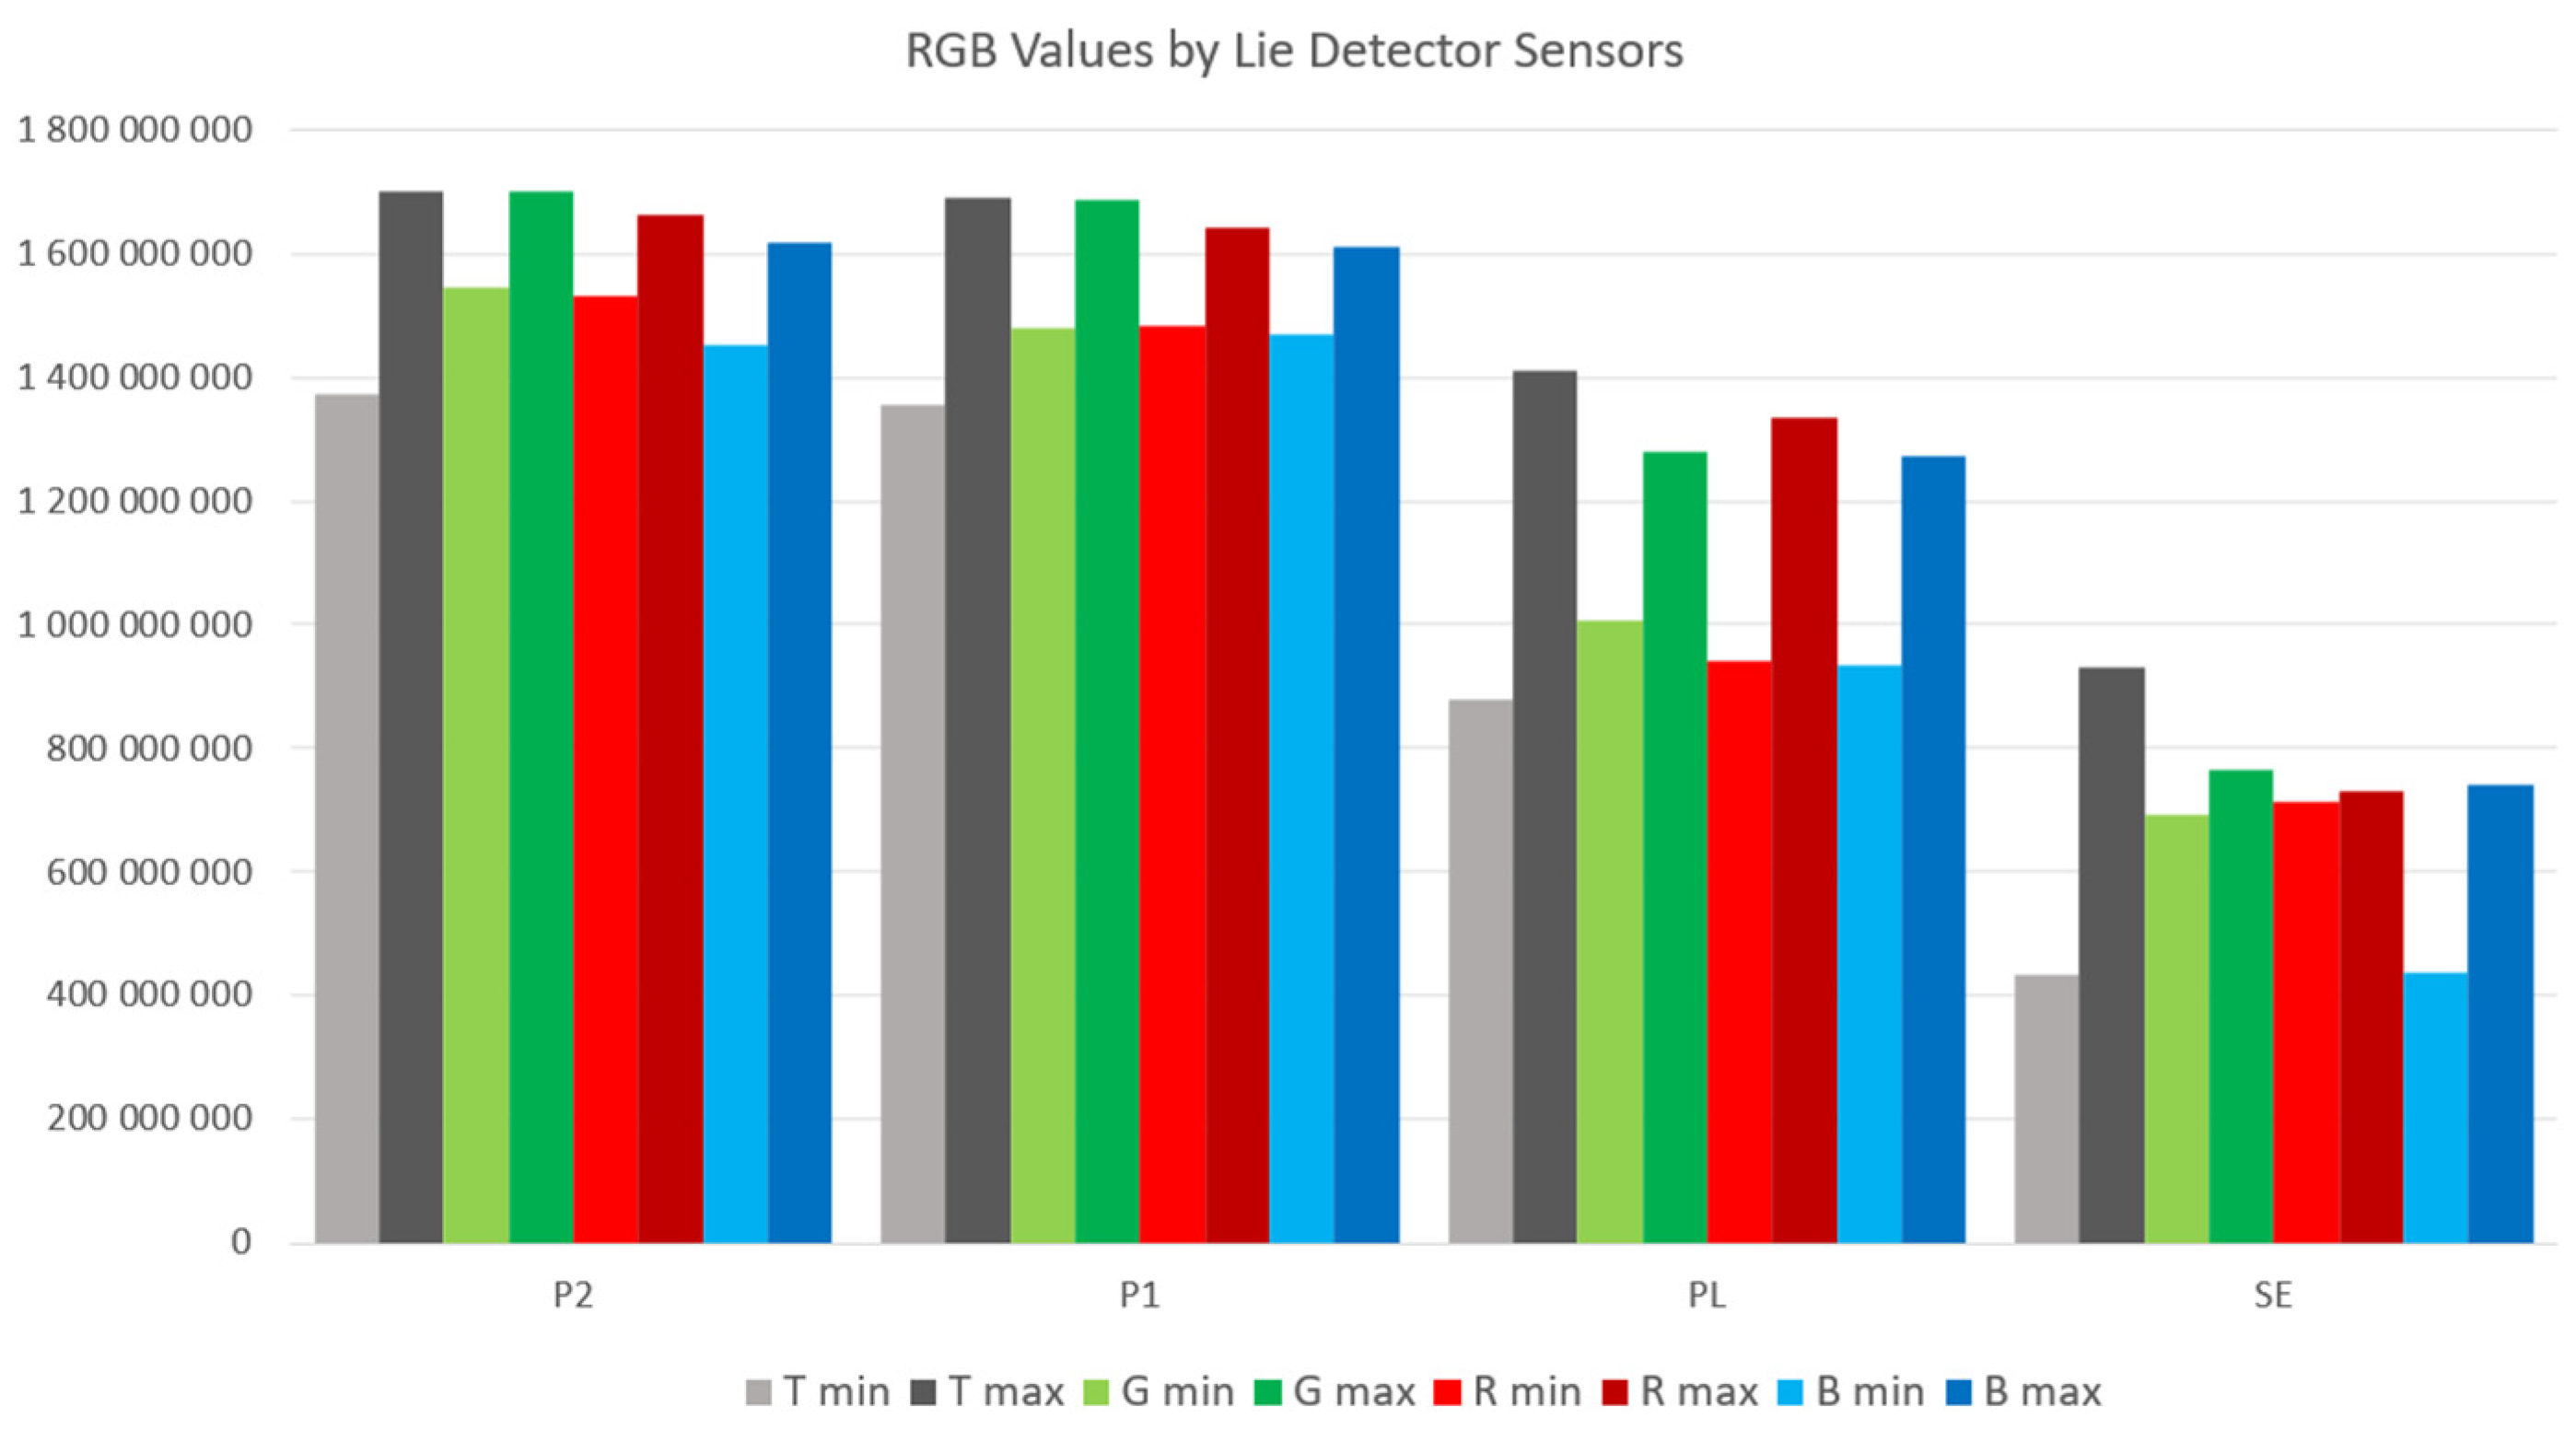
The following graphic processing in
Figure 9 shows this evaluated data for each of the individual colors compared with the minimum and maximum values from the total volume of data.
Figure 9 shows the differences in the output values of signals measured by individual sensors. It can be seen from the graphic representation that the user embedded in the VR environment of the art gallery perceived a sudden change in the color of the environment. The graph shows the values of sensors
P1 Abdominal Respiration trace,
P2 Thoracic Respiration trace,
PL Photoelectric Plethysmograph, and
SE Activity Sensor. The graph in
Figure 9 does not show the signal values from the
GS Electrodermal Activity (EDA) sensor. According to the values shown in
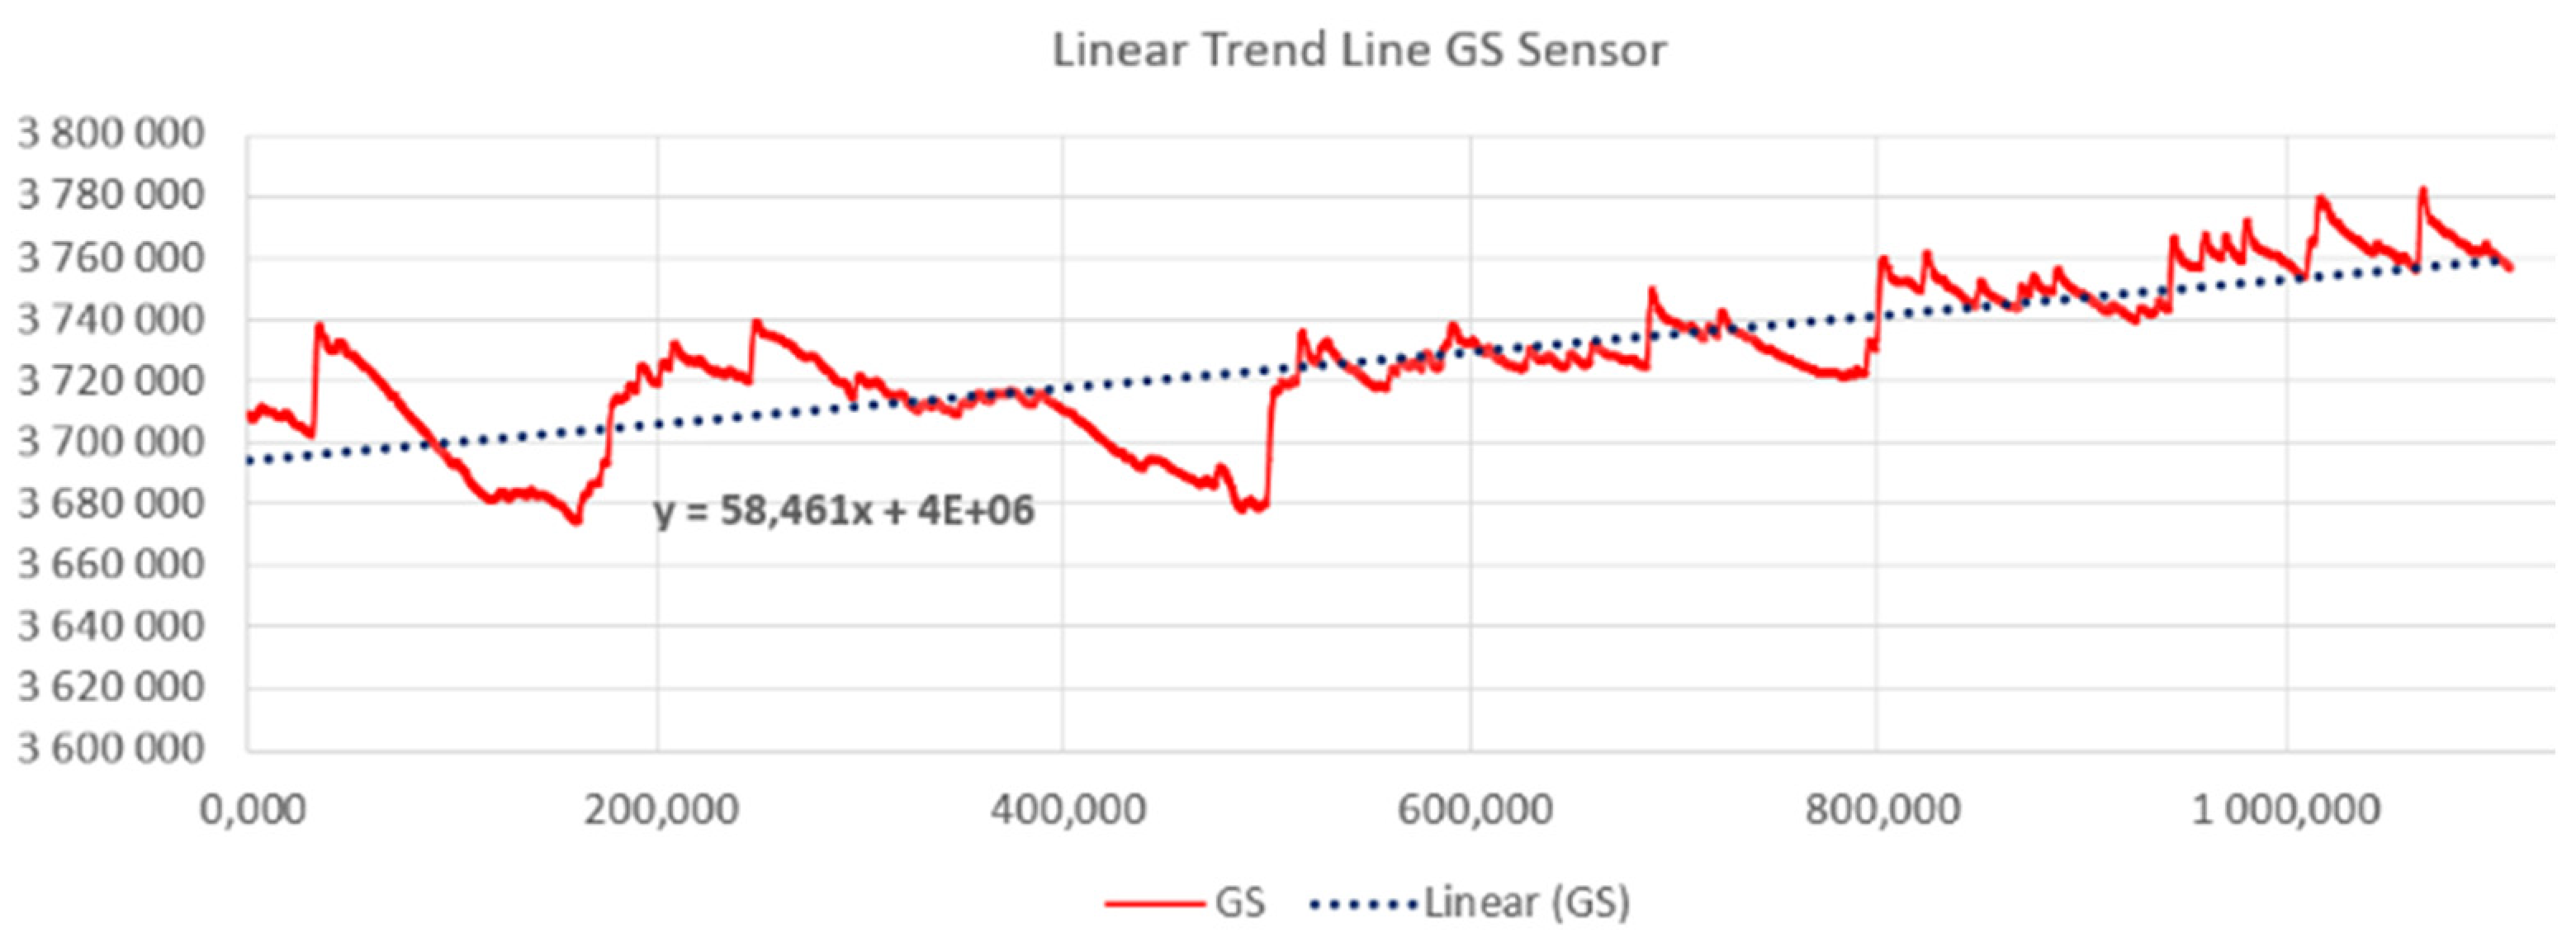
Table 2, it is evident that these values measured by this sensor are significantly lower. For this sensor, a statistical evaluation procedure using a statistical
“Time series method” was used, and a
continuous linear trend was calculated, which is shown in
Figure 10 and mathematically described:
From the waveform of the recorded signal from the GS sensor (EDA) and the linear function shown in
Figure 10, it can be seen that a physiological change of the user embedded in the VR environment occurred in the total time interval.
Table 3 shows the reaction to the individual absolute values of the RGB colors. The table below shows the differences in the measured values of all sensors in the individual intervals of the color change of the environment in connection with the total interval of the user's immersion in the VR environment:
Numerical values measured by all mentioned lie detector sensors show the physiological changes of the user in response to a sudden change of color in the virtual gallery environment, as shown in
Table 3 and
Figure 9 and
Figure 10. It is necessary to mention that other attributes affect the entire experiment during the measurement and subsequent analysis of the obtained data. That is a model situation to find out whether the sensors of the lie detector will capture the physiological changes of the user immersed in the VR art gallery. The evaluation of the measured values of the GS sensor is performed differently due to the order of magnitude lower values of the signal recorded by this sensor, as shown in
Figure 10. This procedure suggests a possible further evaluation of the entire variable environment in a smooth transition of color tone between intervals of sudden RGB color changes. This issue is described in chapters 3 and 4. For further research, linear functions were determined for all other sensors used in this experiment.
Figure 11 and
Figure 12 shows their graphic representation.
It can be assumed that the linear trend of the entire signal recording can help define the user's reactions to individual tones in a color-modified virtual gallery environment, especially in identifying individual points on the recorded curve. This procedure will be applied in future research that builds on this basic experiment. Other attributes that may affect the user's physiological changes and that are not considered in this practical research are discussed in the next chapter. In future research, attention will also be focused on individual aspects and analysis of work with individual lie detector sensors. However, the practical use of color and human vision in the VR environment described in this experiment can be assumed in many scientific and commercial fields.
8. Discussion and Conclusion
This experiment is the first to focus on the field of color vision and human vision in a virtual reality environment from the point of view of the color perception of a user embedded in a VR environment. The text mentions the creation of digital twins of actual works of art. Another topic is the realization of modifying the VR environment in terms of color. In a positive reaction, the stimulation of changes using an experiment to capture the color change of the environment of the sensors of the lie detector. There is high potential for different color and computer vision research in digital twin research. That is also related to work with color models and spaces (gamut), which significantly influence the final result of the reproduction of the work of art. [
31] HSV and HSB models are closest to human vision but can always be applied. [
32,
33] Two basic color models, CMYK and RGB, were applied in this research. Especially since the original artwork was created with physical colors and the digital display works with light in the RGB color model.
Table 1 subsequently shows their values used in other parts of the experiment.
The subject of this research is mainly working with the RGB color model, which is used to modify the color environment in VR. This environment contains digital twins of the artworks. In this VR environment, smooth transitions of color tones and sudden changes in the environment to absolute RGB values were created. In the Unity engine, a smooth transition of the object's color to another color was achieved using a C# Script. The required colors were entered in the form of 3 sheets. Each of the sheets contained one of the RGB color components in the same order in which these colors were displayed and modified in turn:
publicint[] colR = { 0, 255, 147, 221, 255, 106, 255 };
publicint[] colG = { 255, 0, 112, 160, 0, 90, 255};
publicint[] colB = { 0, 255, 219, 221, 0, 205, 255};
It was added to the 1 variable "currentColor" and the parameters of the following colors were obtained from the lists of colors that we store in the variables "nextR", "nextG" and "nextB".
Additional procedures are provided in this chapter. It is necessary to mention that this is one of the options for achieving the need for color modifications. In addition to using the #C Script, you can consider applying animation for color modification in the Unity engine.
The polygraph was chosen to measure a user's reaction embedded in a VR environment. Here was the premise of recording physiological changes in connection with the reaction to a color change in the environment. As part of a search of professional publications, similar use of a lie detector has not been found to date, as well as the measurement of a human reaction to a color change in a VR environment. Therefore, it was impossible to base the research on previous data in this experiment. So far, the research is mainly aimed at criminology, law, and psychology. [
34,
35,
36,
37] Although the field of color psychology is the focus of much research, none has yet been conducted in the context of this presented research. [
37,
38,
39,
40,
41] That research aimed to determine whether the measurement of human perceptions by the sensor lie detector in a VR environment can be evaluated and how the measured data can be evaluated. The
Polygraph LX6 from the
Lafayette Instrument POLYGRAPH company was used in the research.
SW Lafayette Polygraph System 11.8.5 was used to record sensor signals and their primary output. A user embedded in a VR environment of the virtual art gallery was scanned by the following sensors types: P1 Abdominal Respiration trace; P2 Thoracic Respiration trace; PL Photoelectric Plethysmograph; SE Activity Sensor; GS Electrodermal Activity (EDA). These sensors are specified in more detail in section 6. As part of the discussion, it is necessary to mention that the basic signal measurement of these sensors was carried out. A separate analysis of signals from these sensors and their other attributes represents another challenge for future research concerning color and human perception in a VR environment.
The results of this research are presented in section 5 and 7. The section dealing with the programming part of the color modification experiment in the VR environment describes the creation of a #C Script procedure created directly for this research. This pivotal part of the research is also the basis for the following measurement of physiological changes in the recorded physiological sensors. Due to the many possibilities of analysis, processing, and interpretation of the obtained data from the lie detector, extensive research was carried out on these possibilities. Currently, the subject of scientific research is various processing options rather than just the usual statistical methods of data set processing. [
42], [
42] In this work, however, classical statistical procedures were used to analyze lie detector data to find an essential procedure for this issue. In time interval of 18 minutes, the total minimum value of aT
min and maximum value bT
max for individual sensors were determined. The next step was the definition of intervals for individual modifications of absolute RGB colors: G(255) G
min | G
max ; R(255) R
min | R
max ; B(255) B
min | B
max . All these values were given in
Table 2 in this text. These values are also shown graphically in
Figure 9, which visually shows the differences of these values in the intervals of the individual displayed RGB colors and the total interval of the aT
min and bT
max of all lie detector sensors.
The differences in values were shown in
Table 3. In
Figure 9, the values of the GS Electrodermal Activity (EDA) sensor were not shown. The measured values of this sensor differ significantly from others. “Time series statistical methods” were used for this sensor and recording evaluation, which proved to be more suitable in the case of this sensor. Subsequently, a linear continuous trend was calculated: GS: y = 58,461x + 4E+06. This procedure of evaluating the measured data is illustrated in section 8 in
Figure 10.
The above procedures of data analysis and their interpretation proved to be suitable for evaluating the data in this experiment. This text describes the signal evaluation method for three intervals of sudden color change in a virtual gallery environment. That process makes it possible to evaluate such smooth color transitions in the VR environment's total time interval of color changes: GS: y = 58,461x + 4E+06; P1: y = 2075,7x + 1E+09; P2: y = -44509x + 2E+09; PL: y = 156,04x + 1E+09; SE: y = -2021,5x + 7E+08. These linear trends for all signal recordings from individual sensors will allow the user's reactions to individual changes in color tones to be evaluated according to their points on the recorded curve. These curves are shown in
Figure 10,
Figure 11 and
Figure 12 for individual lie detector sensors. It is likely that with these processes, it will be possible to more easily analyze other attributes associated with the measured signals of individual sensors and the physiological changes related to this. These additional procedures and analyses will be the subject of subsequent research, for which this experiment provides the basis.
In conclusion, it can be stated that measuring and analyzing user reactions to changes in the color environment in VR is possible. In this experiment, a lie detector was used as a detector of response to a change in the environment. This issue requires further research into color and human vision in a VR environment. This issue also calls for further research in sensors and signal processing. However, practical use in the field of research in medicine, psychology, physiotherapy, art, criminology, or forensic science can be assumed. At the same time, these procedures can also be applied in commercial use areas.
Author Contributions
Conceptualization, I.D.; methodology, I.D., P.V. and M.F.; validation, P.R.; formal analysis, I.D., M.F. and S.S.; resources, I.D.; data curation, P.V.; writing—original draft preparation, I.D.; writing—review and editing, P.R.; visualization, I.D. and P.V.; supervision, P.R. and M.A.; project administration, I.D.; funding acquisition, P.R. All authors have read and agreed to the published version of the manuscript.
Data Availability Statement
The data presented in this study are available on request from the author (I.D.).
Acknowledgments
This research was based on the support The Tomas Bata University in Zlin, and Grand Agency of Tomas Bata University in Zlin, IGA/CebiaTech/2024/004, and Laboratoire Angevin de Recherche en Ingénierie des Systèmes (LARIS), Polytech Angers, University of Angers, France. The authors thank the Vachlav Chad Gallery, Zlinsky zamek o.p.s., and the author of the artworks Michal Pasma for supporting research during the Kontrasty art exhibition.
Conflicts of Interest
The authors declare no conflict of interest. The funders had no role in the design of the study; in the collection, analyses, or interpretation of data; in the writing of the manuscript, or in the decision to publish the results.
References
- N. Hu, H. Zhou, A. A. Liu, X. Huang, S. Zhang, G. Jin, J. Guo, X. Li, “Collaborative Distribution Alignment for 2D image-based 3D shape retrieval,” Journal of Visual Communication and Image Representation, vol. 83, 103426., 2022. [CrossRef]
- N. Kojima, Y. G. Ichihara, T. Ikeda, M. G. Kamachi, K. Ito, “Color universal design: Analysis of color category dependency on colorvision type,” Proc. SPIE 8292, Color Imaging XVII: Displaying, Processing, Hardcopy, and Applications, 829206, 2012. [CrossRef]
- P. Ehkan, S. Soon, F. Zakaria, M. Warip, M. N. Bin, I. Mohd, “Comparative Study of Parallelism and Pipelining of RGB to HSL Colour Space Conversion Architecture on FPGA,” IOP Conference Series: Materials Science and Engineering, vol. 767, 012054, 2020. [CrossRef]
- E. Hołowko, K. Januszkiewicz, P. Bolewicki, R. Sitnik, J. Michoński, “Application of multi-resolution 3D techniques in crime scene documentation with bloodstain pattern analysis,” Forensic Science International, vol. 267, p. 218-227, ISSN 0379-0738, 2016. [CrossRef]
- R. Zhu, Z. Guo, X. Zhang, “Forest 3D Reconstruction and Individual Tree Parameter Extraction Combining Close-Range Photo Enhancement and Feature Matching,” Remote Sensing, vol. 13, 1633, 2021. [CrossRef]
- S. Hong, B. Mao and B. Li, “Preliminary Exploration of Three-Dimensional Visual Variables in Virtual Reality,” 2018 International Conference on Virtual Reality and Visualization (ICVRV), 2018, pp. 28-34. [CrossRef]
- F. Abd-Alhamid, M. Kent, C. Bennett, J. Calautit, Y Wu, “Developing an Innovative Method for Visual Perception Evaluation in a Physical-Based Virtual Environment,” Building and Environment, vol. 162, 106278, 2019. [CrossRef]
- Noor Azhar M, Bustam A, Naseem FS, et al, “Improving the reliability of smartphone-based urine colorimetry using a colour card calibration method,” Digital Health, 2023. [CrossRef]
- K. Inoue, M. Jiang, K. Hara, “Hue-Preserving Saturation Improvement in RGB Color Cube,” Journal of Imaging, vol. 7, 150, 2021. [CrossRef]
- M. Salinsky, Goins, Steven, Sutula, Thomas, D. Roscoe, S. Weber, “Comparison of Sleep Staging by Polygraph and Color Density Spectral Array,” Sleep, vol. 11, 131-8, 1988. [CrossRef]
- X. Mo, D. B. Luh, “Consumer emotional experience research on online clothing tactile attributes: Evidence from physiological polygraph,” Journal of Fashion Marketing and Management, Vol. ahead-of-print No. ahead-of-print, pp. 1-17, 2022. [CrossRef]
- E. Muravevskaia, Ch. Gardner-McCune, “Case Study on VR Empathy Game: Challenges with VR Games Development for Emotional Interactions with the VR Characters,” European Conference on Games Based Learning, vol. 16, 412-418, 2022. [CrossRef]
- L. Ciaccheri, B. Adinolfi, A. A. Mencaglia, A. G. Mignani, “Colorimetry by a Smartphone, Sensors and Microsystems,” AISEM 2022, Lecture Notes in Electrical Engineering, Springer, vol. 999, 2023. [CrossRef]
- E. Toshikj, B. Prangoski, “Textile Sublimation Printing: Impact of Total Ink Limiting Level and Sublimation Transfer Paper on Black Print Quality, Textile and Apparel, 2022. [CrossRef]
- M. Rodriguez, “A graphic arts perspective on RGB-to-CMYK conversion,” Proceedings., International Conference on Image Processing, Washington, DC, USA, 1995, pp. 319-322 vol.2. [CrossRef]
- E. Reinhard, M. Adhikhmin, B. Gooch and P. Shirley, “Color transfer between images,” in IEEE Computer Graphics and Applications, vol. 21, no. 5, pp. 34-41, 2001. [CrossRef]
- Drofova, M. Adamek, “Analysis of Counterfeits Using Color Models for the Presentation of Painting in Virtual Reality, Software Engineering Application in Informatics,” CoMeSySo 2021, Lecture Notes in Networks and Systems, Springer, vol. 232, 2021. [CrossRef]
- Unity Technologies, 2023, https://unity.com/.
- D. Asonov, M. Krylov, V. Omelyusik, A. Ryabikina, E. Litvinov, M. Mitrofanov, M. Mikhailov, A. Efimov, “Building a second-opinion tool for classical polygraph,” Scientific Reports, vol. 13, 2023. [CrossRef]
- X. Liu at all, “Research on the Polygraph: The CMOS Neural Amplifier. Highlights in Science,” Engineering and Technology, vol. 32, 128–134, 2023. [CrossRef]
- Motlyakh, V. Shapovalov, “The essence of polygraph test formats and requirements for their application. Ûridičnij časopis Nacìonalʹnoï akademìï vnutrìšnìh sprav. 12. [CrossRef]
- E. Elaad, G. Ben-Shakhar, “Finger pulse waveform length in the detection of concealed information,” International Journal of Psychophysiology, vol. 61, 2006, ISSN 0167-8760. [CrossRef]
- National Research Council, “The Polygraph and Lie Detection,” Washington, DC: The National Academies Press. [CrossRef]
- D. A. Pollina at al, “Comparison of Polygraph Data Obtained From Individuals Involved in Mock Crimes and Actual Criminal Investigations,” Journal of Applied Psychology, 89(6), 1099–1105, 2004. [CrossRef]
- Lafayette Instrument, 2023, https://lafayettepolygraph.com/products/lx6/.
- 2023; 26. Lafayette Instrument, Manuals, Lx95all, 2023.
- M. Rafaj, “Physical detection examination for the detection of criminal activity," Diploma Thesis, Tomas Bata University in Zlín, Faculty of Applied Informatics, Department of Electronics and Measurement, 2020, http://hdl.handle.net/10563/47933.
- E. Esoimeme, “Using the Lie Detector Test to Curb Corruption in the Nigeria Police Force,” Journal of Financial Crime, 2019. [CrossRef]
- J. Haudenschild, V Kafadar, H. Tschakert, L. Ullmann, “Lie Detector AI: Detecting Lies Through Fear,” (preprint), 2023. [CrossRef]
- N. Srivastava, S. Dubey, “Lie Detector: Measure Physiological Values,” International Frontier Science Letters, Vol. 4. 1-6, 2019. [CrossRef]
- K. Sim, J. Park, M. Hayashi, M. Kuwahara, M., “Artwork Reproduction Through Display Based on Hyperspectral Imaging,” Culture and Computing. HCII 2022, Lecture Notes in Computer Science, vol 13324. Springer, Cham., 2022. [CrossRef]
- E. Hassan, J. Saud, “HSV color model and logical filter for human skin detection,” AIP Conference Proceedings, 2457, 040003, 2023. [CrossRef]
- C. Bobbadi, E. Nalluri, J. Chukka, M. Wajahatullah, K. Sailaja, “HsvGvas: HSV Color Model to Recognize Greenness of Forest Land for the Estimation of Change in the Vegetation Areas,” Computer Vision and Robotics, Algorithms for Intelligent Systems, Springer, Singapore, 2022. [CrossRef]
- D.T. Wilcox, N. Collins, “Polygraph: The Use of Polygraphy in the Assessment and Treatment of Sex Offenders in the UK,” European Polygraph, vol. 14, pp.55–62. [CrossRef]
- J.S. Levenson, “Sex Offender Polygraph Examination: An Evidence-Based Case Management Tool for Social Workers,” Journal of Evidence-Based Social Work, vol. 6, pp.361–375, 2009. [CrossRef]
- E. Esoimeme, “Using the Lie Detector Test to Curb Corruption in the Nigeria Police Force,” Journal of Financial Crime, vol. 26. 2019. [CrossRef]
- “General Psychology Otherwise: A Decolonial Articulation,” Review of General Psychology, vol. 25, 2021. [CrossRef]
- I.J.D.M. Dantas at all., “The psychological dimension of colors: A systematic literature review on color psychology,” Research, Society and Development, vol. 11, 2022. [CrossRef]
- E. Szkody at all, “The differential impact of COVID-19 across health service psychology students of color: An embedded mixed-methods study,” Journal of Clinical Psychology, pp1-23, 2023. [CrossRef]
- E. Li, “Research on Visual Expression of Color Collocation in Art Education Based on Art Psychology,” International Journal of Education and Humanities, vol. 3, pp27–31, 2022. [CrossRef]
- S. Haider Ali, Y. Khan, M. Shah, “Color Psychology in Marketing,” Journal of Business & Tourism, vol. 4, pp183–190. [CrossRef]
- Yunianto, “PERANCANGAN LIE DETECTOR MENGGUNAKAN ARDUINO,” Jupiter: Journal of Computer & Information Technology, vol. 3, pp41-48, 2023. [CrossRef]
- Z. Chen, J. Wang, Z. Gong, Q. Liu, 2015. “Data processing of lie detector based on fuzzy clustering analysis,” in: Proceedings of the International Conference on Science and Engineering (ICSE-UIN-SUKA 2021), Proceedings of the International Conference on Science and Engineering, 2021. [CrossRef]
Figure 1.
Digitization and creation of a digital twin of a work of art: a) an original image in an art gallery environment and b) a digitized art image for a VR environment.
Figure 1.
Digitization and creation of a digital twin of a work of art: a) an original image in an art gallery environment and b) a digitized art image for a VR environment.
Figure 2.
Color Models: a) RGB color model and b) CMYK color model. [
16].
Figure 2.
Color Models: a) RGB color model and b) CMYK color model. [
16].
Figure 3.
The virtual art gallery environment.
Figure 3.
The virtual art gallery environment.
Figure 4.
The initial white background of the VR environment, b), c), d) reference images of the smooth color tone change of the VR gallery environment.
Figure 4.
The initial white background of the VR environment, b), c), d) reference images of the smooth color tone change of the VR gallery environment.
Figure 5.
Static direct absolute RGB process colors: a) direct absolute background color R(255), b) direct absolute background color G(255), c), direct absolute background color B(255).
Figure 5.
Static direct absolute RGB process colors: a) direct absolute background color R(255), b) direct absolute background color G(255), c), direct absolute background color B(255).
Figure 6.
User captured by lie detector sensors in a virtual gallery environment: 1) and 3) computing and display units, 2) VR Headset, 4) and 5) Pneumo Chest Assembly, 6), Photoelectric Plethysmograph 7) Electrodermal Activity (EDA).
Figure 6.
User captured by lie detector sensors in a virtual gallery environment: 1) and 3) computing and display units, 2) VR Headset, 4) and 5) Pneumo Chest Assembly, 6), Photoelectric Plethysmograph 7) Electrodermal Activity (EDA).
Figure 7.
User captured by lie detector sensors in a virtual gallery environment: 1) and 3) computing and display units, 2) VR Headset, 4) and 5) Pneumo Chest Assembly, 6), Photoelectric Plethysmograph 7) Electrodermal Activity (EDA).
Figure 7.
User captured by lie detector sensors in a virtual gallery environment: 1) and 3) computing and display units, 2) VR Headset, 4) and 5) Pneumo Chest Assembly, 6), Photoelectric Plethysmograph 7) Electrodermal Activity (EDA).
Figure 8.
Display of lie detector signals measured by sensors in the total measurement time interval.
Figure 8.
Display of lie detector signals measured by sensors in the total measurement time interval.
Figure 9.
Graphic representation of signals measured by polygraph sensors.
Figure 9.
Graphic representation of signals measured by polygraph sensors.
Figure 10.
Graphic representation of the GS sensor signal (EDA).
Figure 10.
Graphic representation of the GS sensor signal (EDA).
Figure 11.
Graphic representation of the signal from the sensor P1 Abdominal Respiration trace and P2 Thoracic Respiration trace.
Figure 11.
Graphic representation of the signal from the sensor P1 Abdominal Respiration trace and P2 Thoracic Respiration trace.
Figure 12.
Graphic representation of the signal from the PL Photoelectric Plethysmograph and SE Activity Sensor sensors.
Figure 12.
Graphic representation of the signal from the PL Photoelectric Plethysmograph and SE Activity Sensor sensors.
Table 1.
CMYK and RGB Absolut Color Value.
Table 1.
CMYK and RGB Absolut Color Value.
| COLOR |
CMYK VALUE |
RGB VALUE |
| R |
(0,1,1,0) |
(255,0,0) |
| G |
(1,0,1,0) |
(0,255,0) |
| B |
(1,1,0,0) |
(0,0,255) |
| C |
(1,0,0,0) |
(0,255,255) |
| M |
(0,1,0,0) |
(255,0,255) |
| Y |
(0,0,1,0) |
(255,255,0) |
| K |
(0,0,0,1) |
(0,0,0) |
| W1
|
(0,0,0,0) |
(255,255,255) |
Table 2.
Polygraph Sensors Signal Values.
Table 2.
Polygraph Sensors Signal Values.
| COLOR |
POLYGRAPH SENSORS |
| P2 |
P1 |
PL |
SE |
GS |
| aTmin
|
1 373 308 581 |
1 356 380 146 |
878 852 659 |
435 142 537 |
3 674 121 |
| bTmax
|
1 700 740 365 |
1 689 799 170 |
1 409 655 943 |
932 446 398 |
3 781 921 |
|
Gmin
|
1 544 195 568 |
1 480 290 055 |
1 007 992 714 |
693 660 008 |
3 681 374 |
|
Gmax
|
1 700 740 365 |
1 687 747 380 |
1 278 472 078 |
765 109 824 |
3 684 355 |
|
Rmin
|
1 530 578 442 |
1 484 640 044 |
942 374 819 |
711 869 260 |
3 729 730 |
|
Rmax
|
1 661 776 075 |
1 643 523 274 |
1 336 146 189 |
730 070 195 |
3 733 444 |
|
Bmin
|
1 453 597 565 |
1 467 732 400 |
934 089 157 |
438 385 740 |
3 753 788 |
|
Bmax
|
1 618 014 160 |
1 610 575 557 |
1 273 883 604 |
741 224 476 |
3 779 356 |
Table 3.
Differences of the Values RGB and aTmin | bTmax .
Table 3.
Differences of the Values RGB and aTmin | bTmax .
| COLOR |
POLYGRAPH SENSORS |
| P2 |
P1 |
PL |
SE |
GS |
| aTmin
|
1 373 308 581 |
1 356 380 146 |
878 852 659 |
435 142 537 |
3 674 121 |
| bTmax
|
1 700 740 365 |
1 689 799 170 |
1 409 655 943 |
932 446 398 |
3 781 921 |
|
Gmin
|
1 544 195 568 |
1 480 290 055 |
1 007 992 714 |
693 660 008 |
3 681 374 |
|
Gmax
|
1 700 740 365 |
1 687 747 380 |
1 278 472 078 |
765 109 824 |
3 684 355 |
|
Rmin
|
1 530 578 442 |
1 484 640 044 |
942 374 819 |
711 869 260 |
3 729 730 |
|
Rmax
|
1 661 776 075 |
1 643 523 274 |
1 336 146 189 |
730 070 195 |
3 733 444 |
|
Bmin
|
1 453 597 565 |
1 467 732 400 |
934 089 157 |
438 385 740 |
3 753 788 |
|
Bmax
|
1 618 014 160 |
1 610 575 557 |
1 273 883 604 |
741 224 476 |
3 779 356 |
|
Disclaimer/Publisher’s Note: The statements, opinions and data contained in all publications are solely those of the individual author(s) and contributor(s) and not of MDPI and/or the editor(s). MDPI and/or the editor(s) disclaim responsibility for any injury to people or property resulting from any ideas, methods, instructions or products referred to in the content. |
© 2024 by the authors. Licensee MDPI, Basel, Switzerland. This article is an open access article distributed under the terms and conditions of the Creative Commons Attribution (CC BY) license (http://creativecommons.org/licenses/by/4.0/).
