Submitted:
11 June 2024
Posted:
12 June 2024
You are already at the latest version
Abstract
Keywords:
1. Introduction
2. Materials and Methods
2.1. Feedstocks and Additional Materials
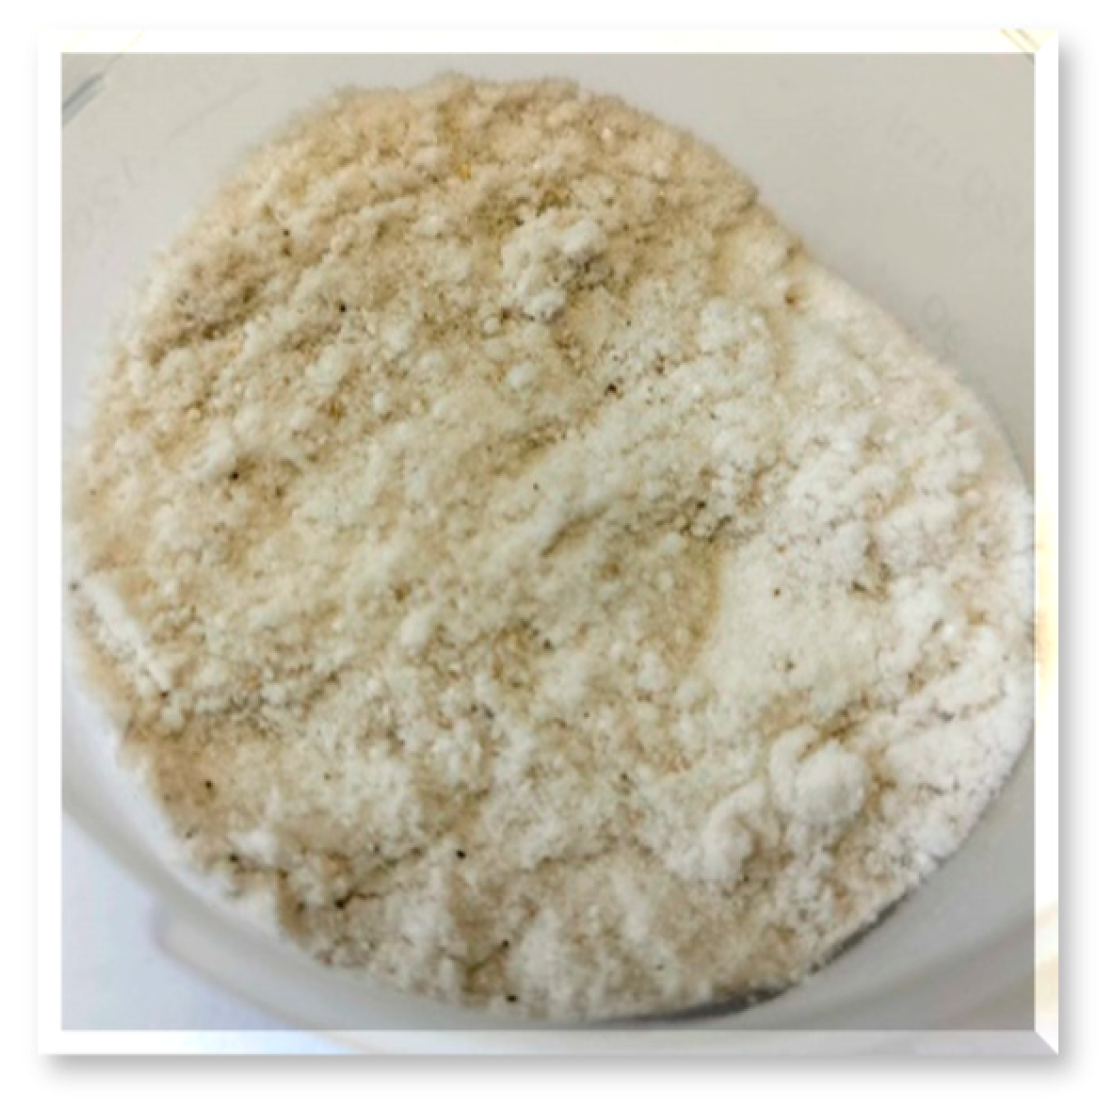
2.2. Physicochemical Analysis of Substrates and Carriers
2.2.1. Analysis of Feedstocks, Inoculum and Batches
2.2.2. Analysis of Carrier Materials
2.3. Biogas Production Set-Up
2.3.1. Batch Preparation
2.3.2. Anaerobic Digestion
2.3.3. Physicochemical Analysis of Samples Collected
2.3.4. Microbiological Analysis of Samples Collected
3. Results
3.1. Physicochemical Properties of Carrier Materials
3.1.1. Morphological and Microstructural Characteristics
3.1.2. BET Surface Area and Pore Structure
3.1.3. Elemental Analysis and FT–IR Spectra
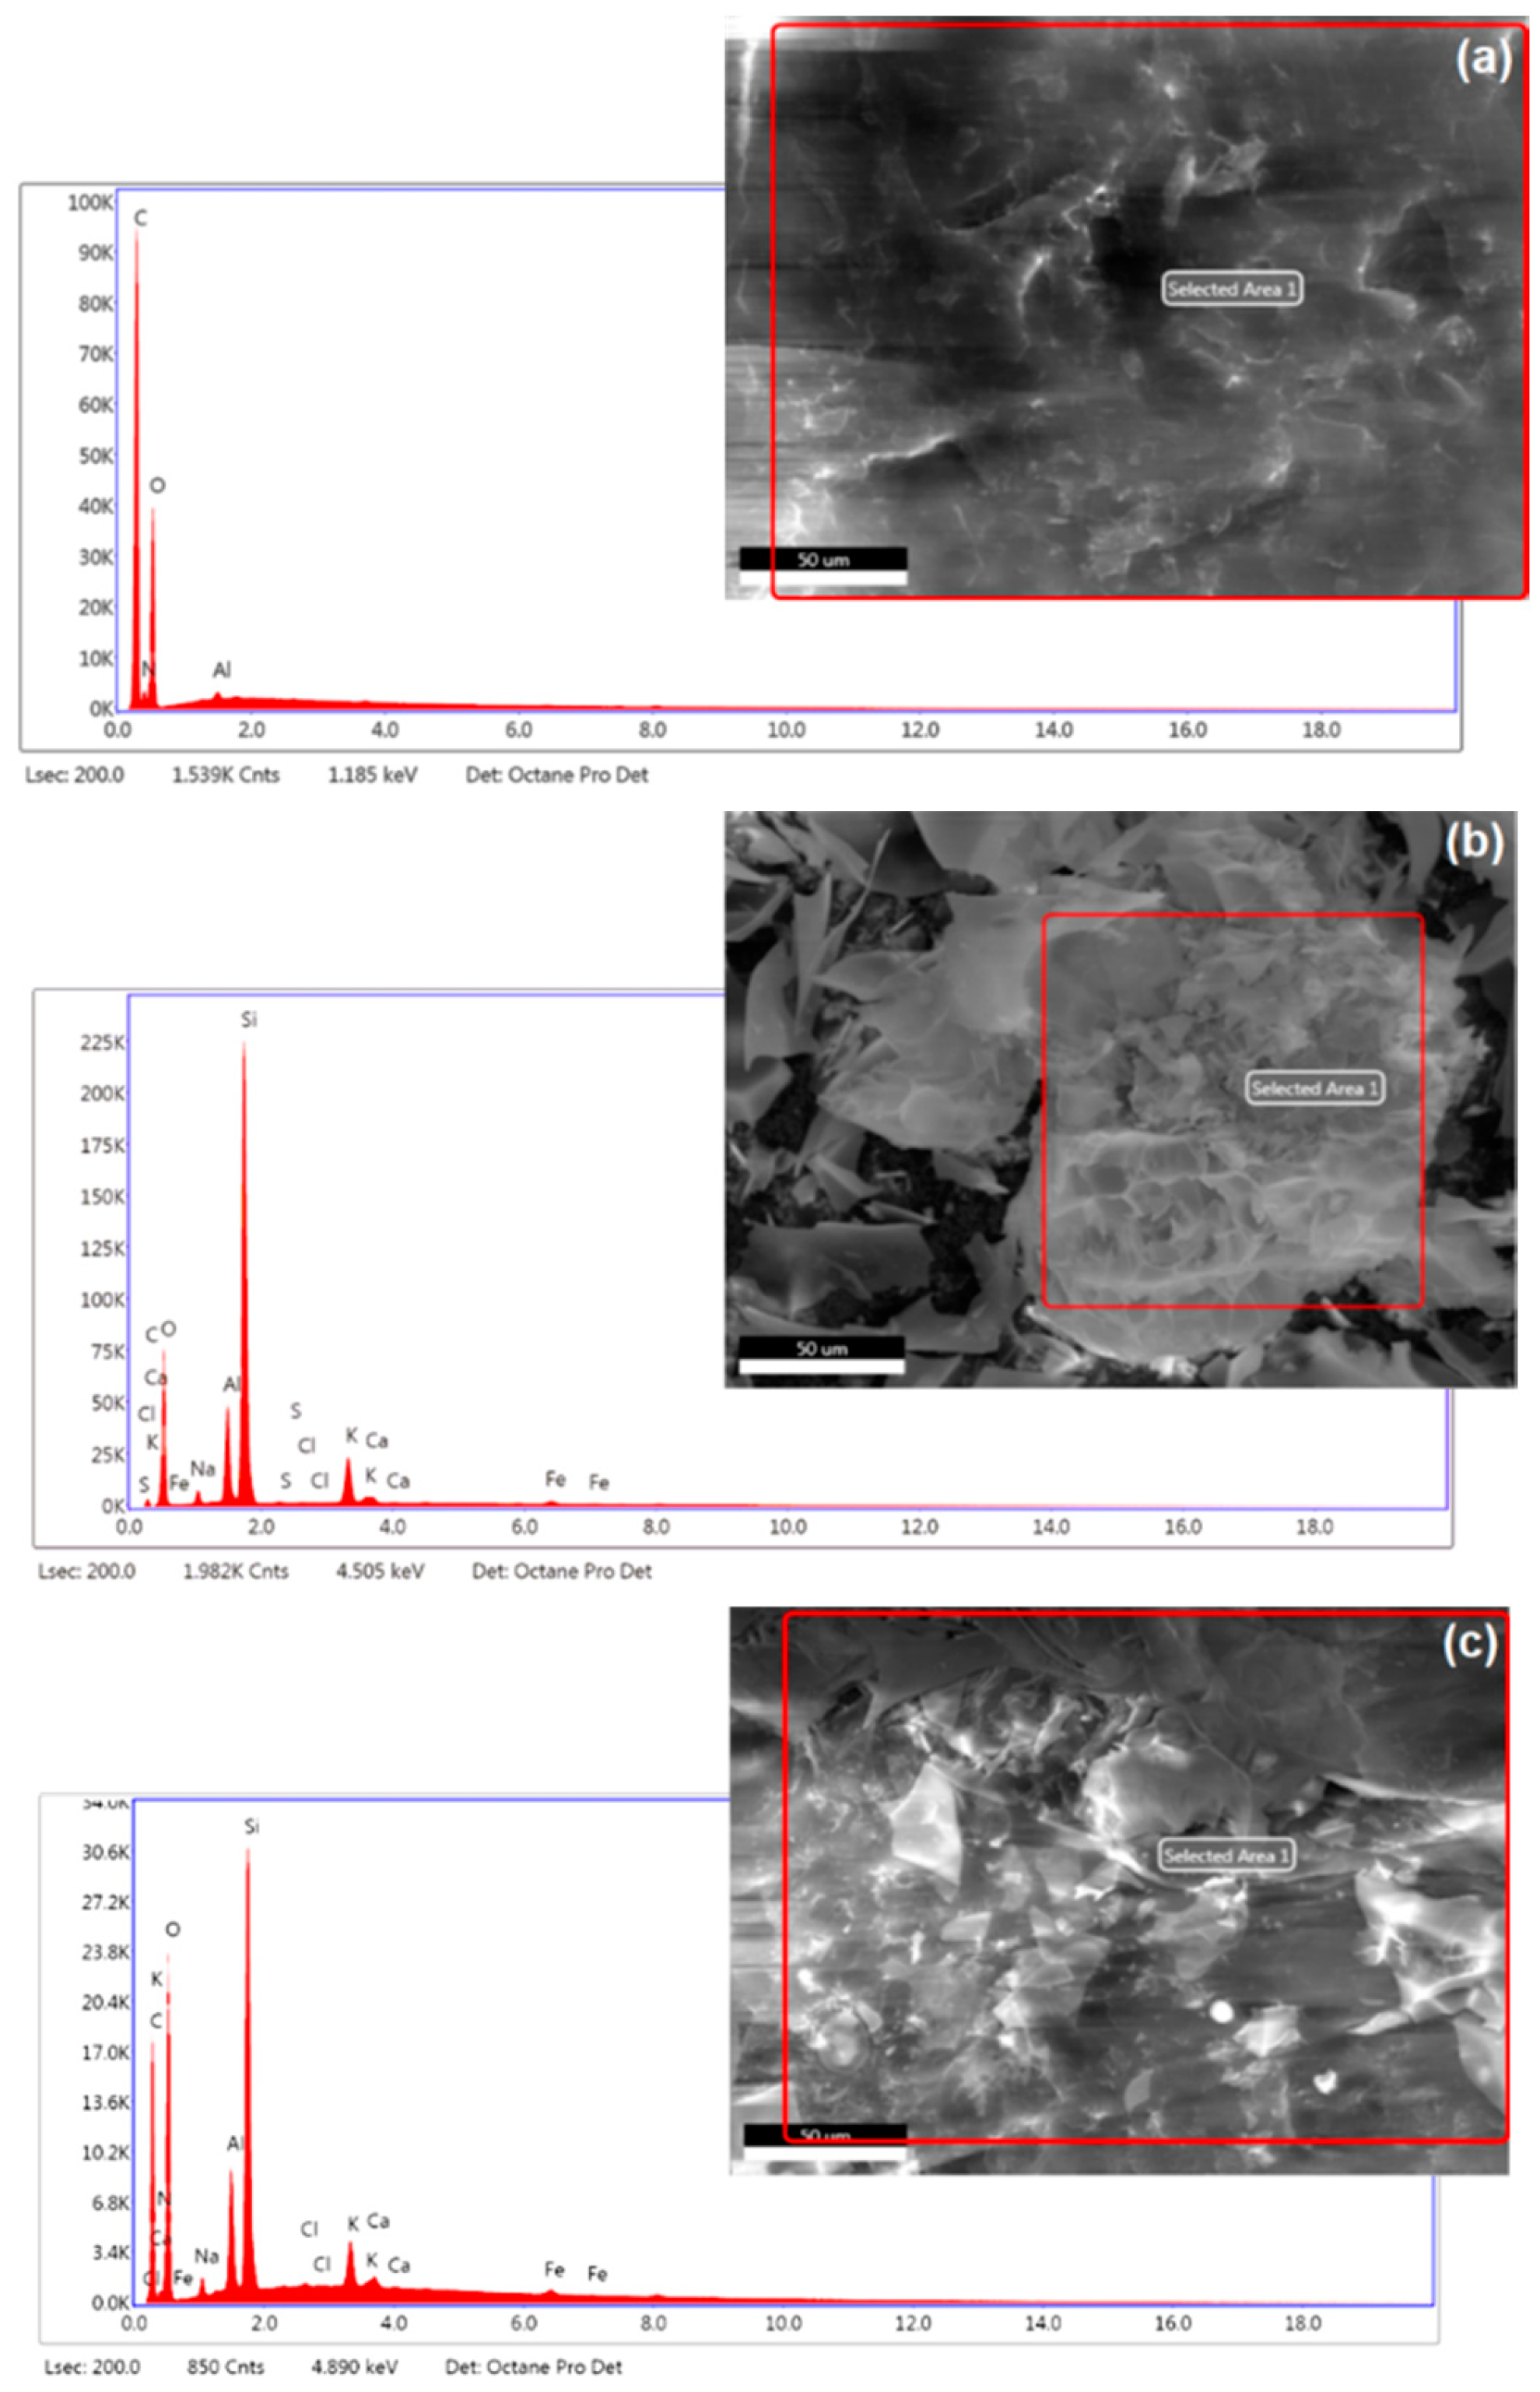
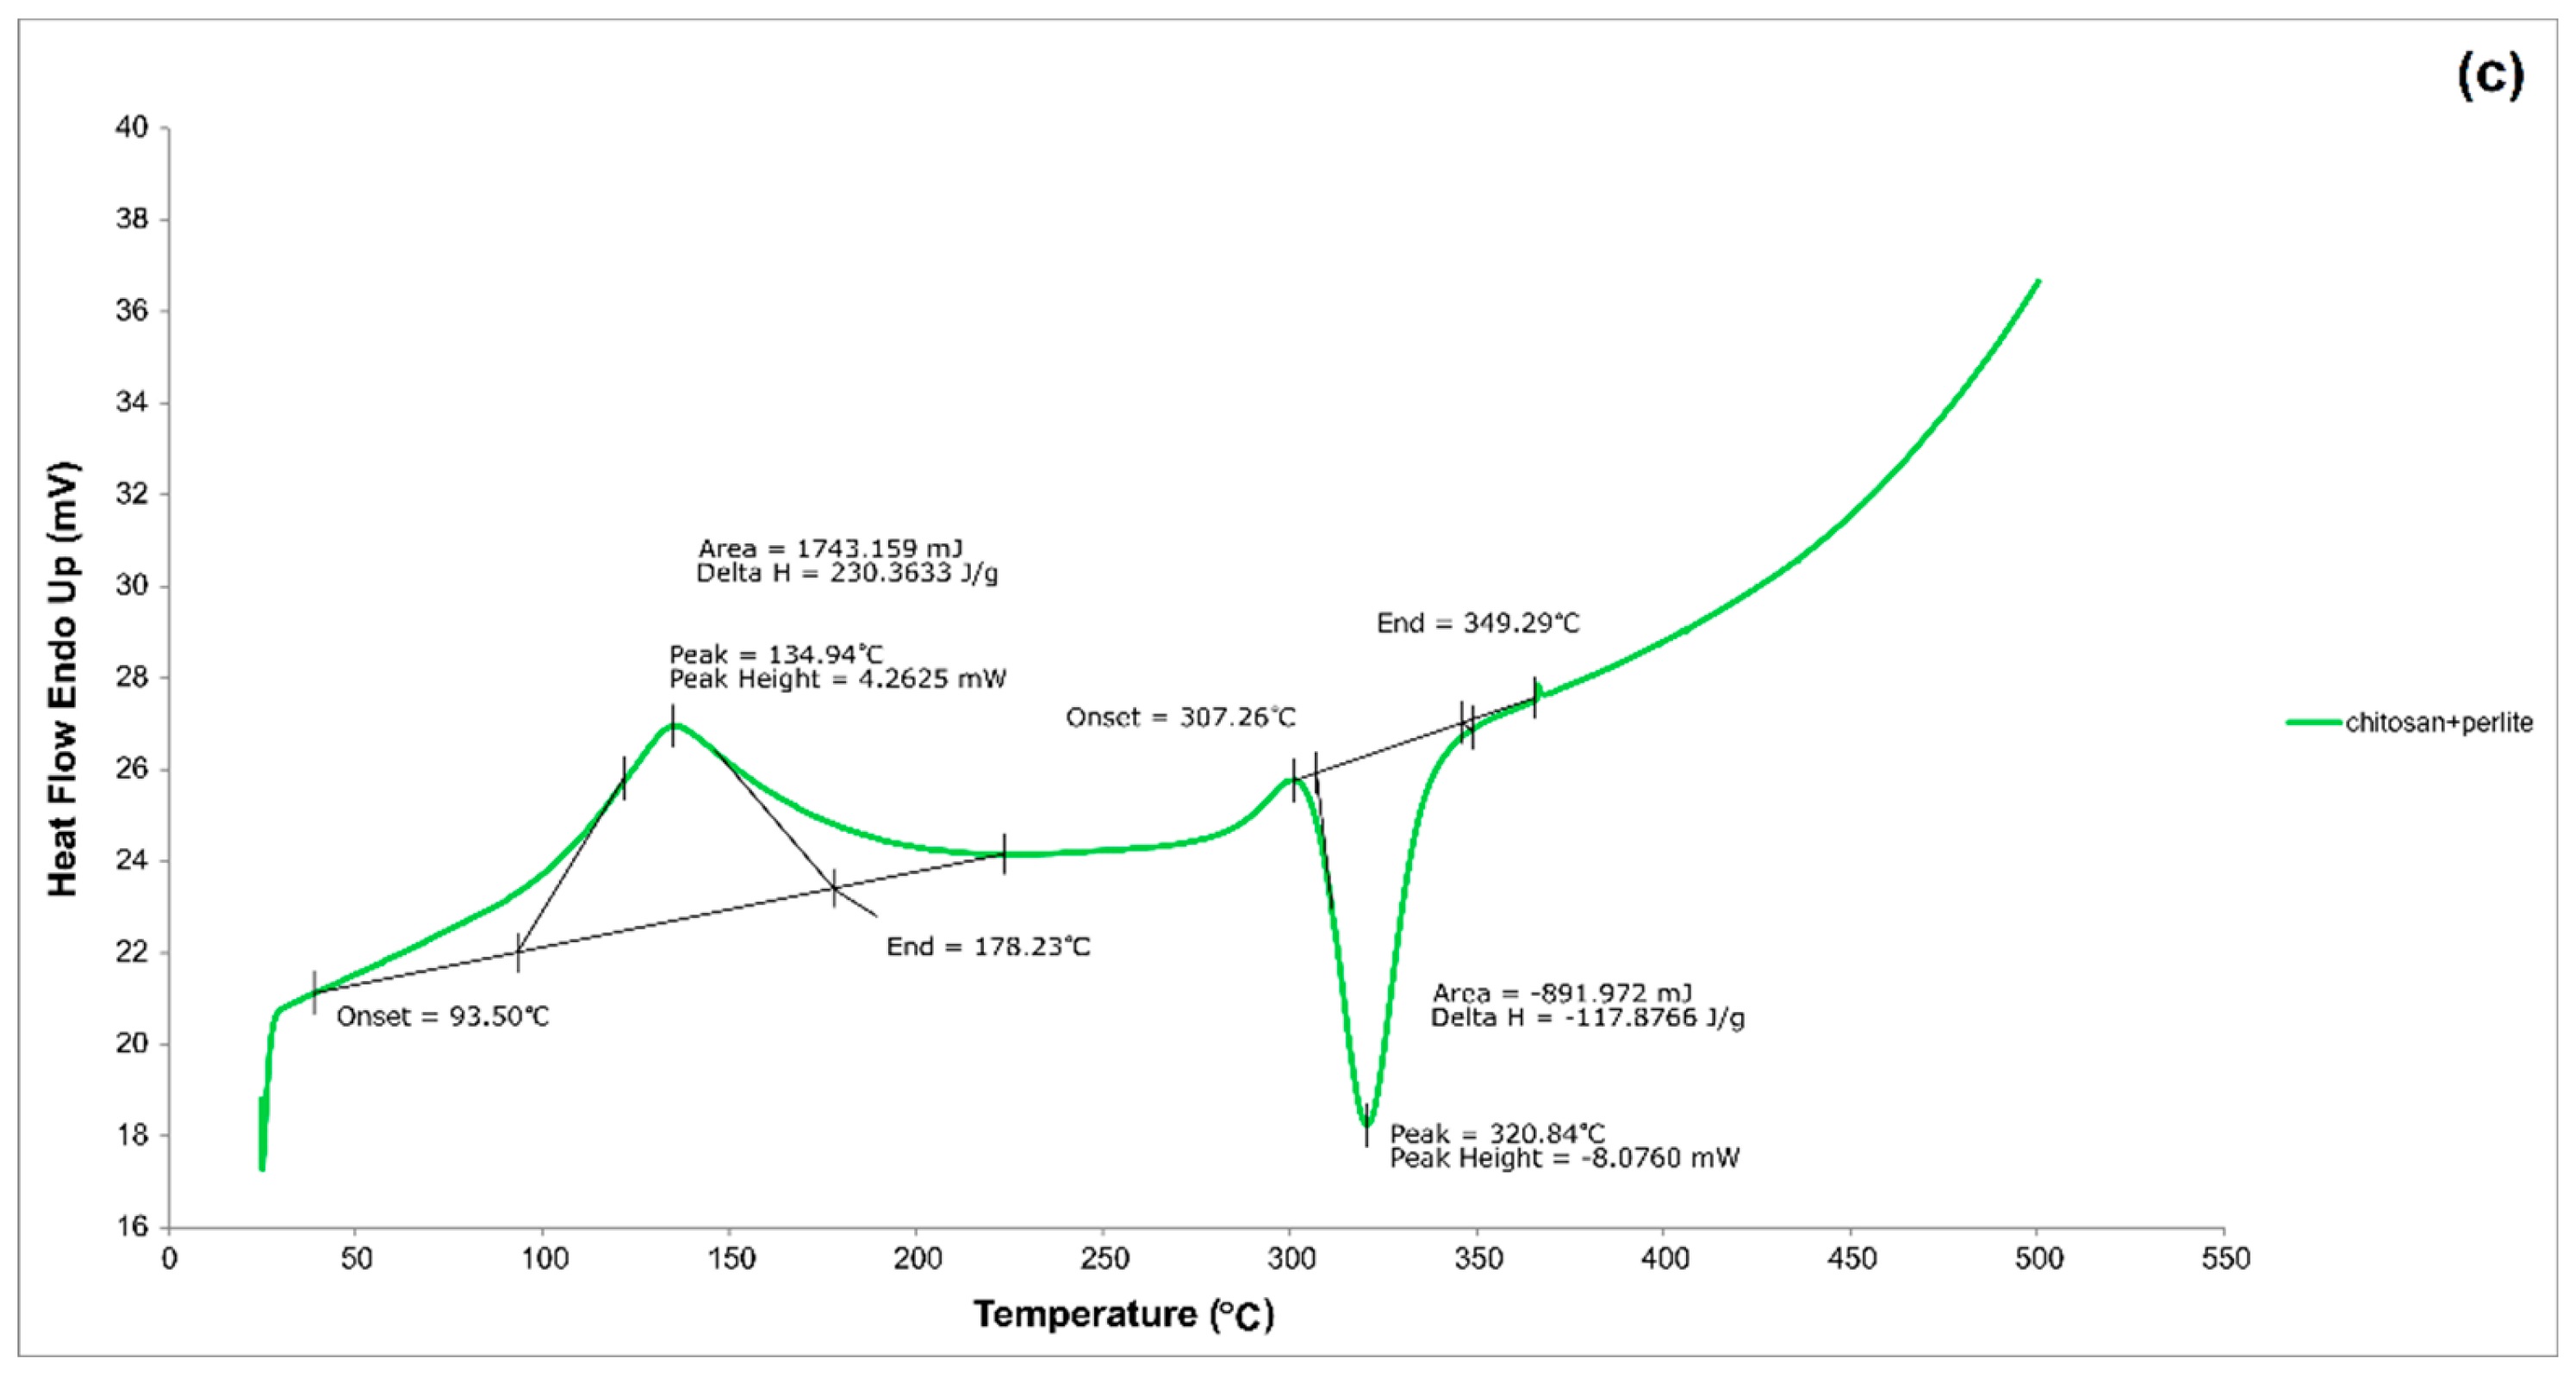
3.1.4. DSC analysis
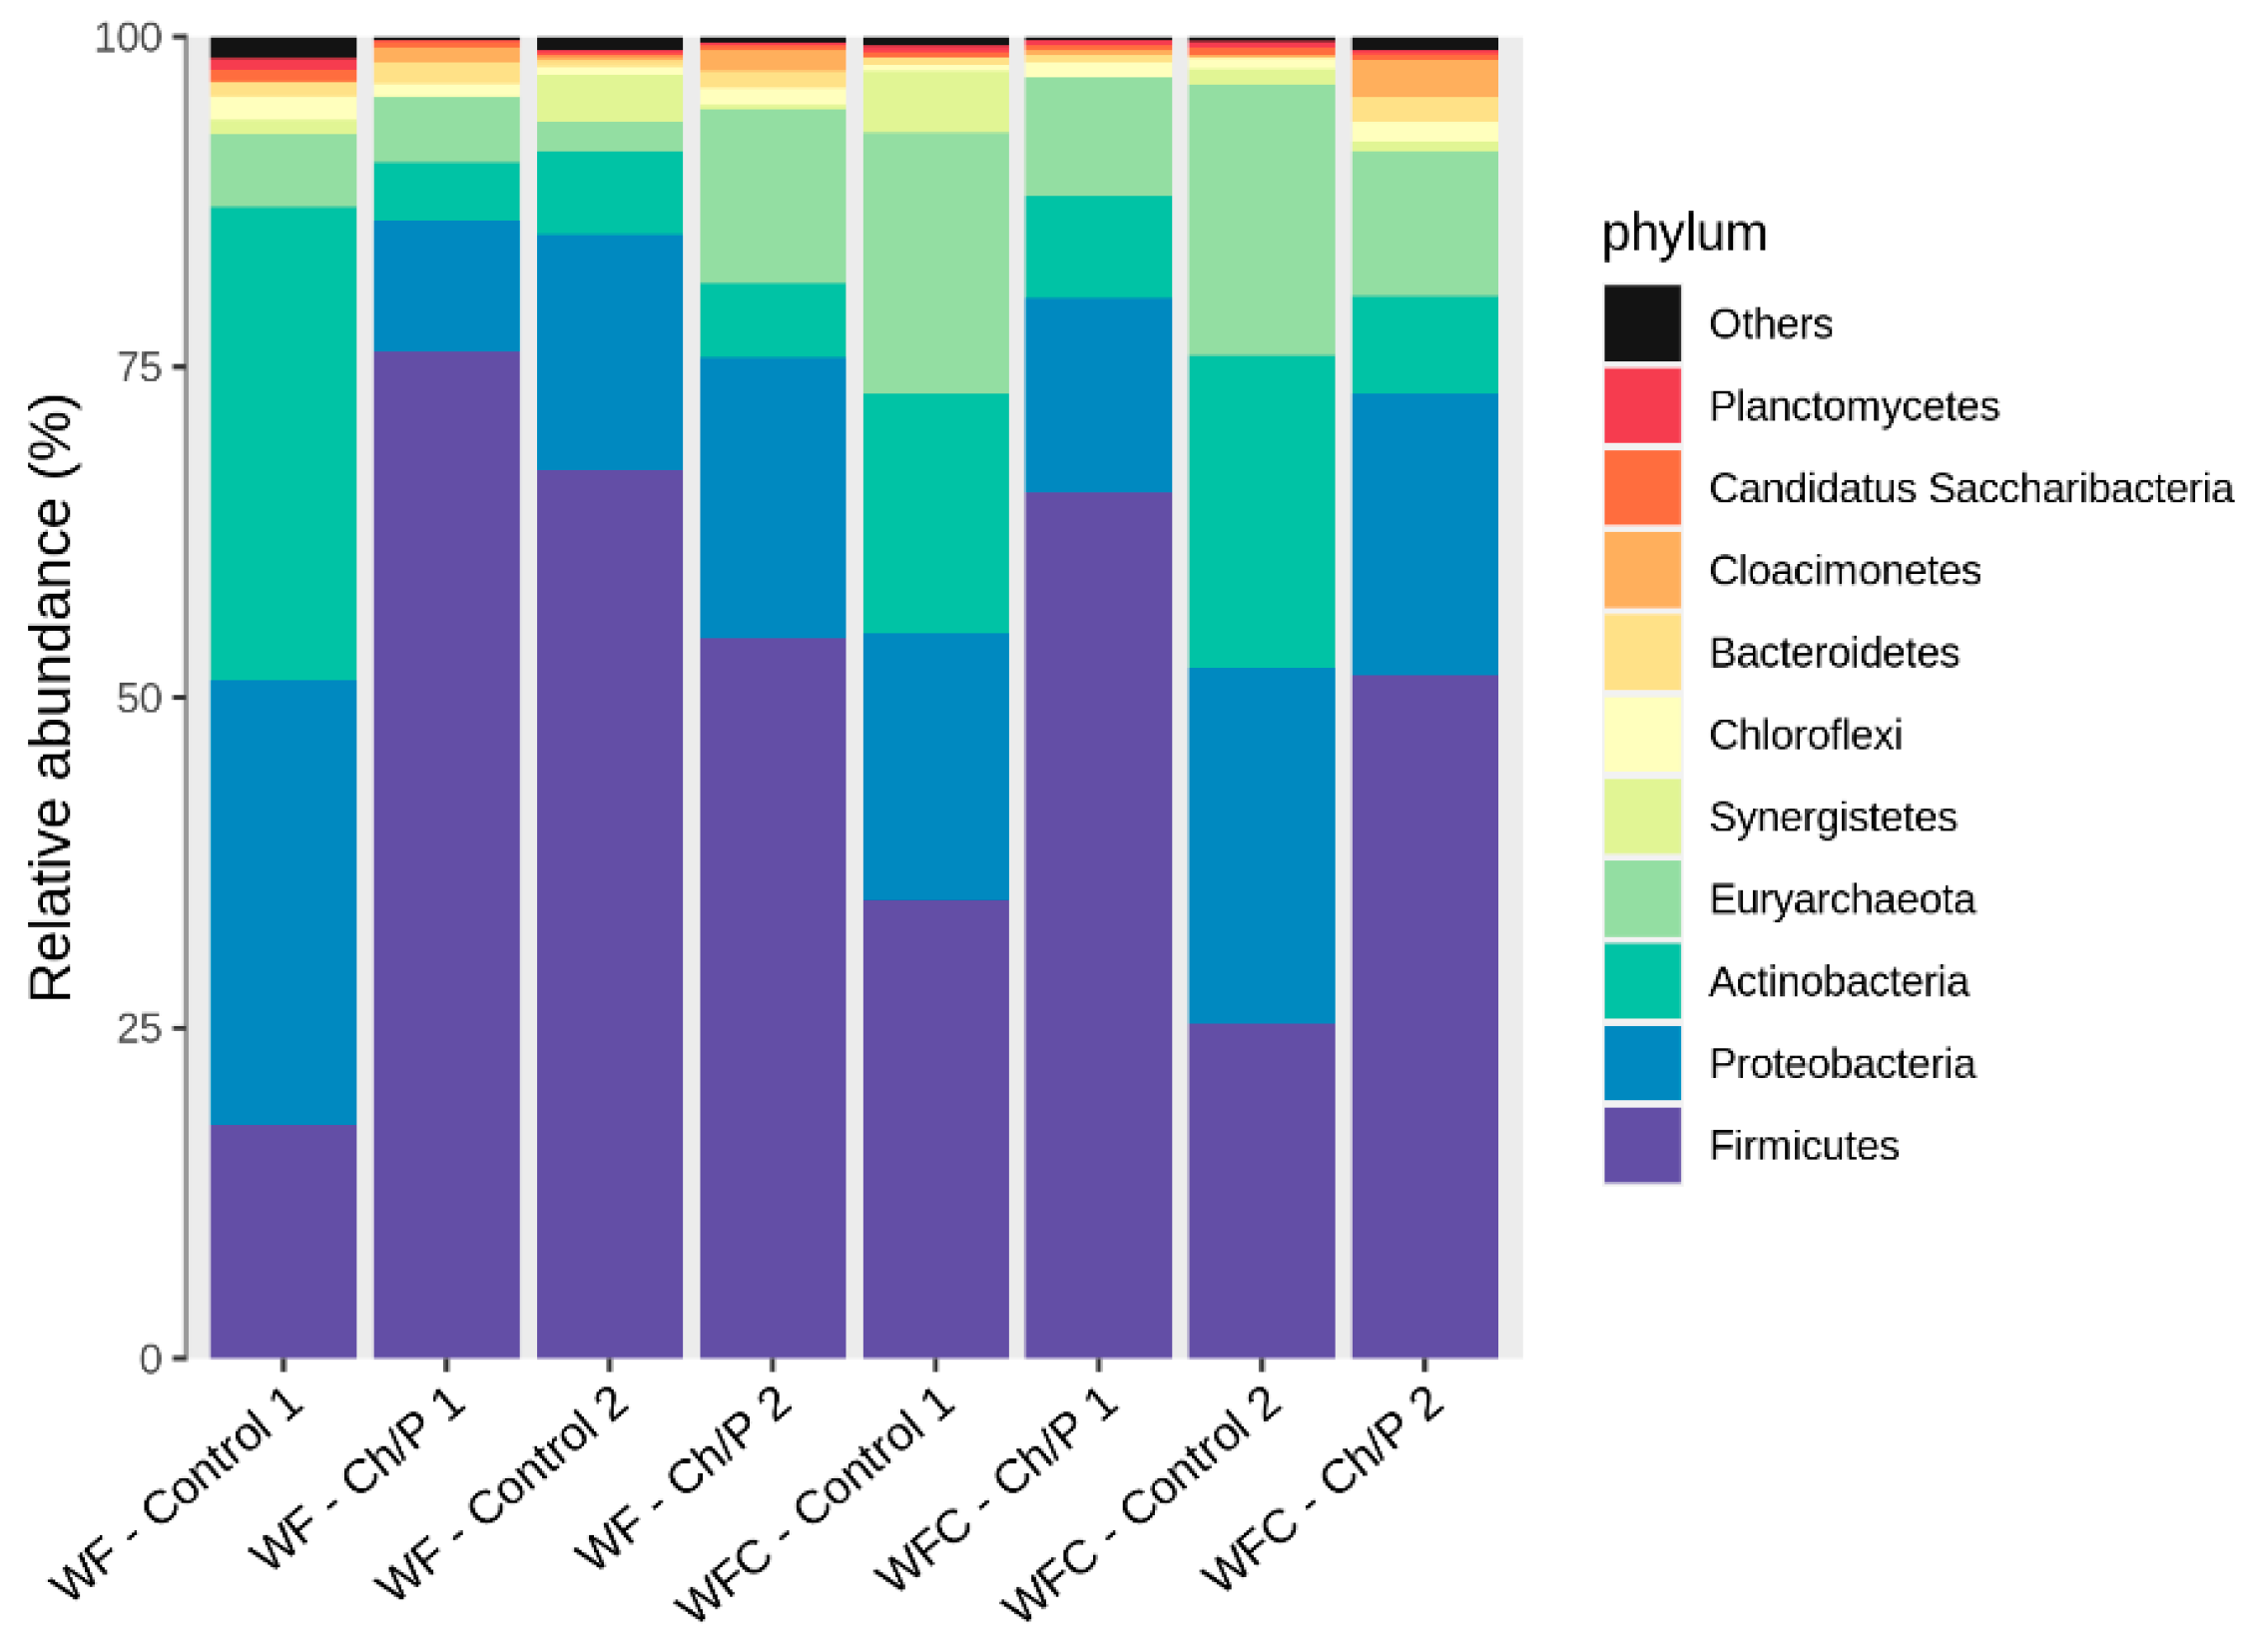
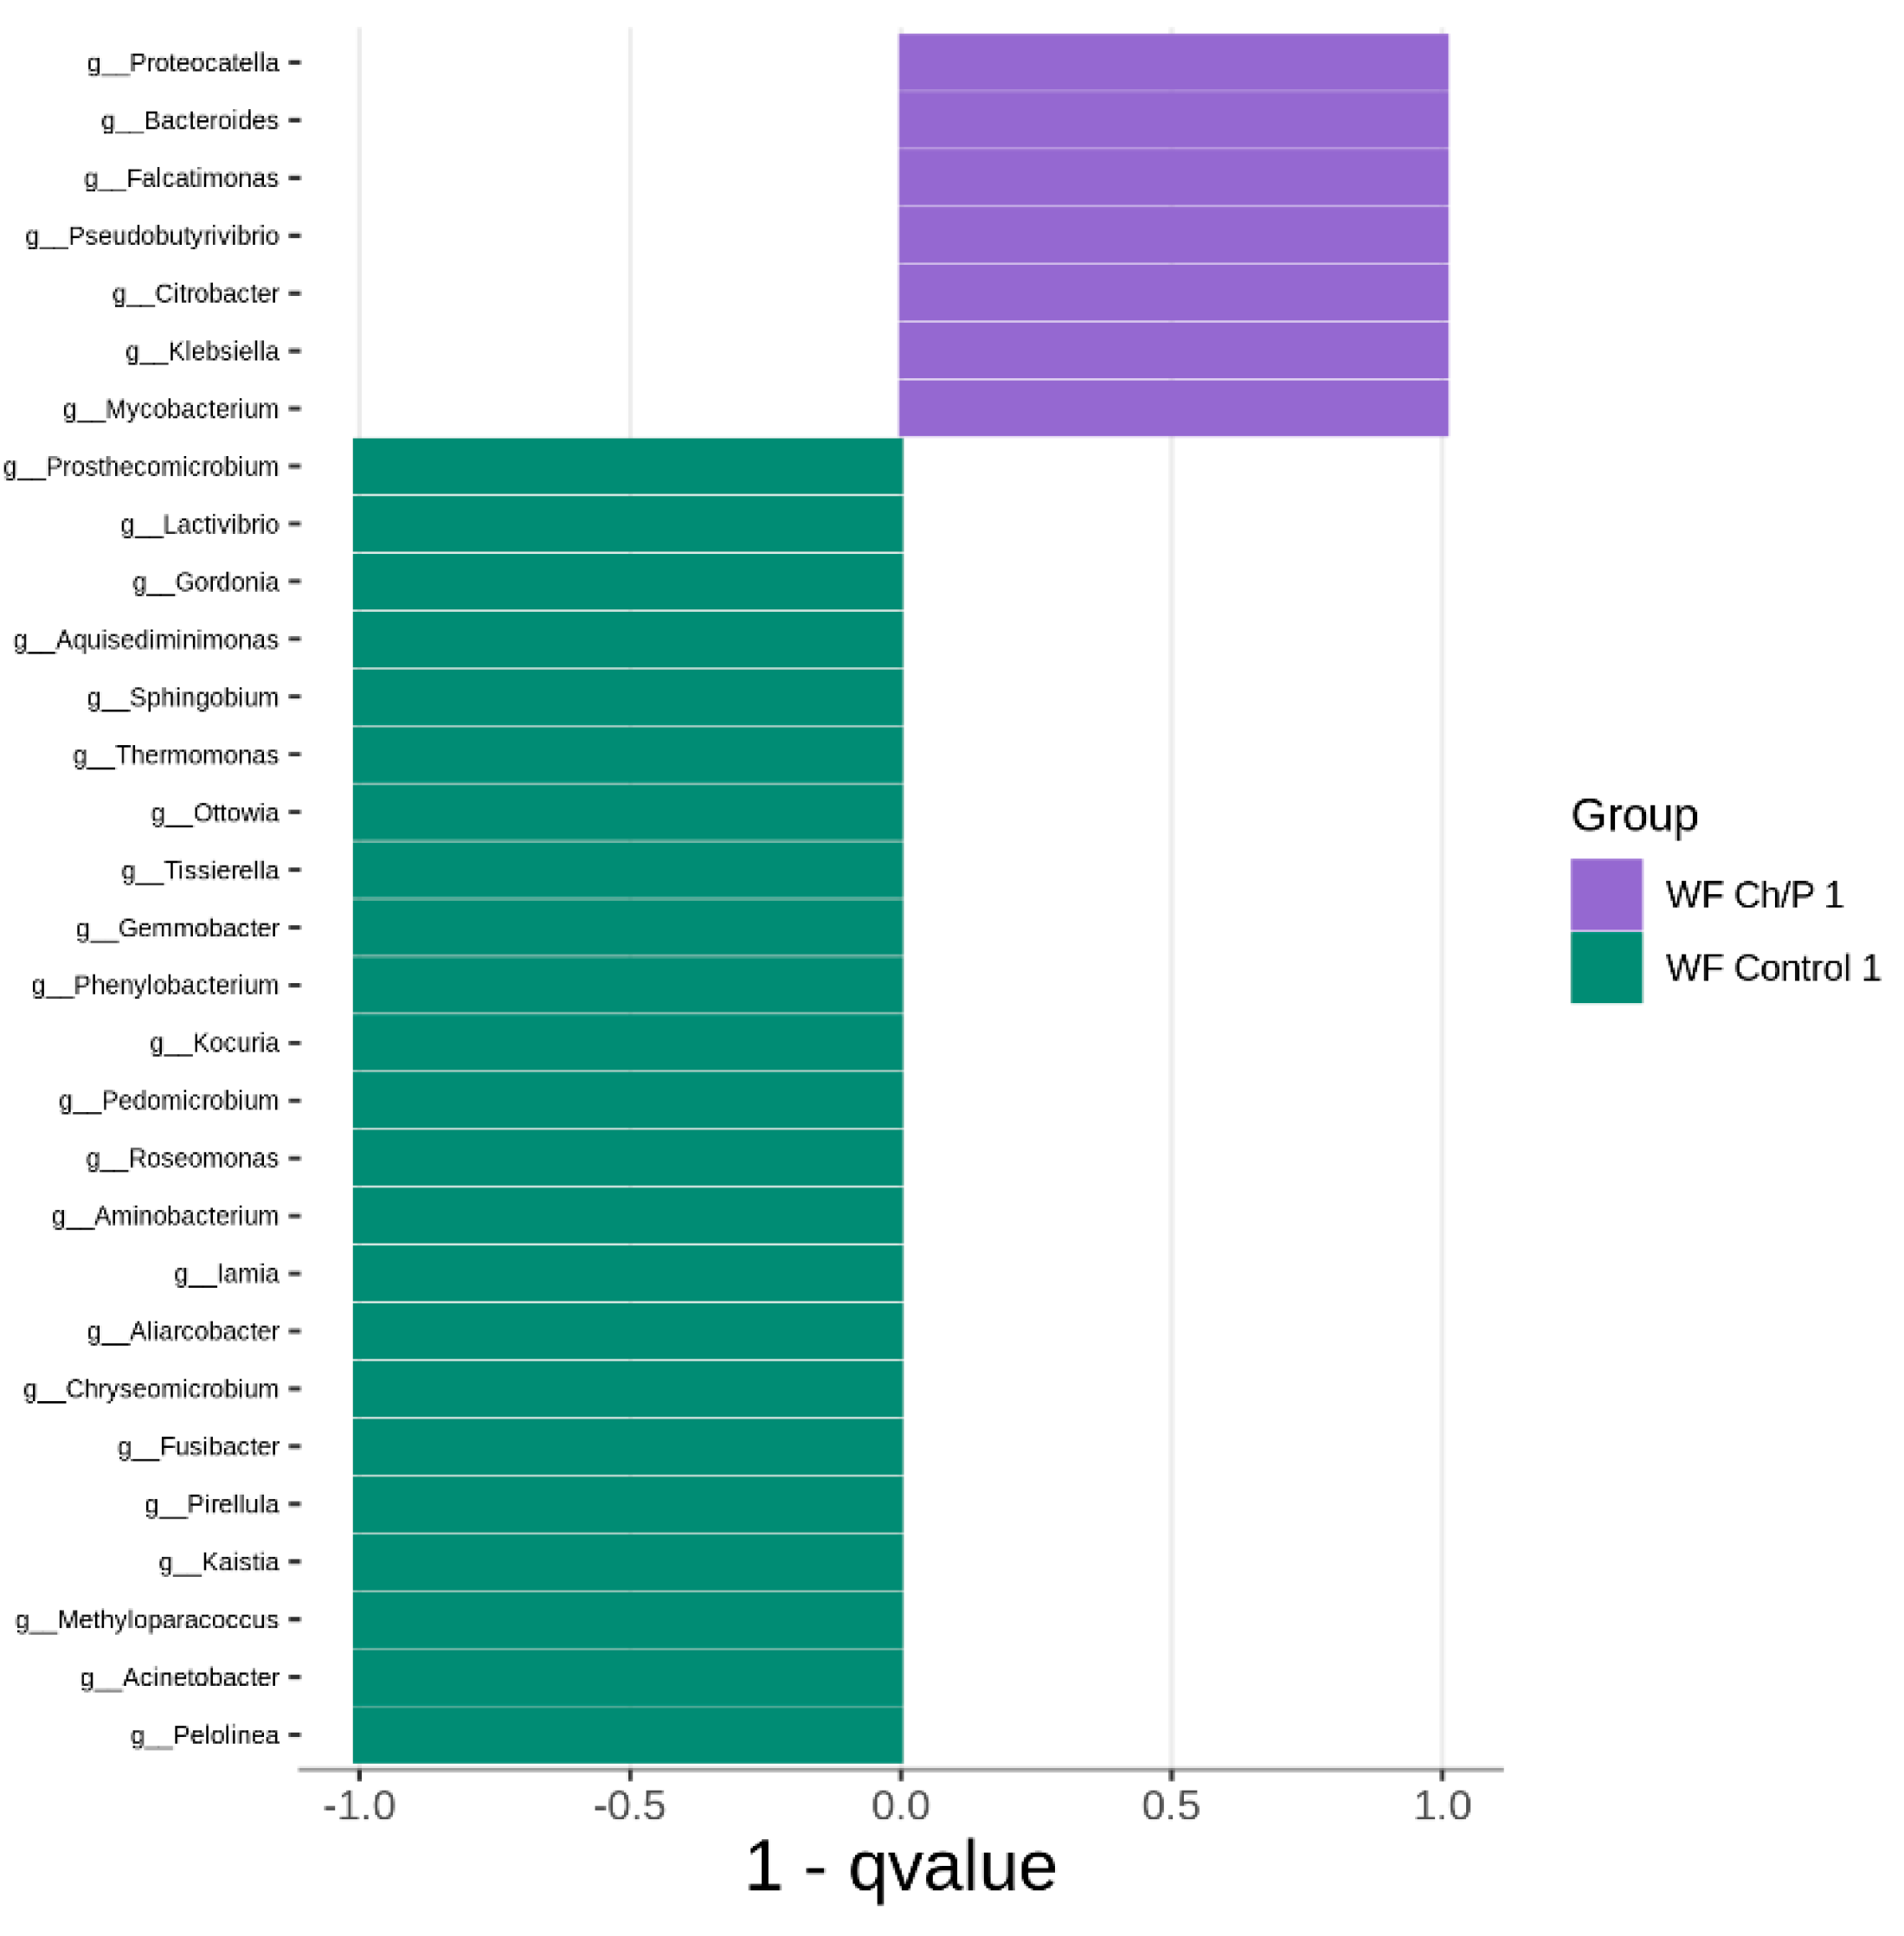
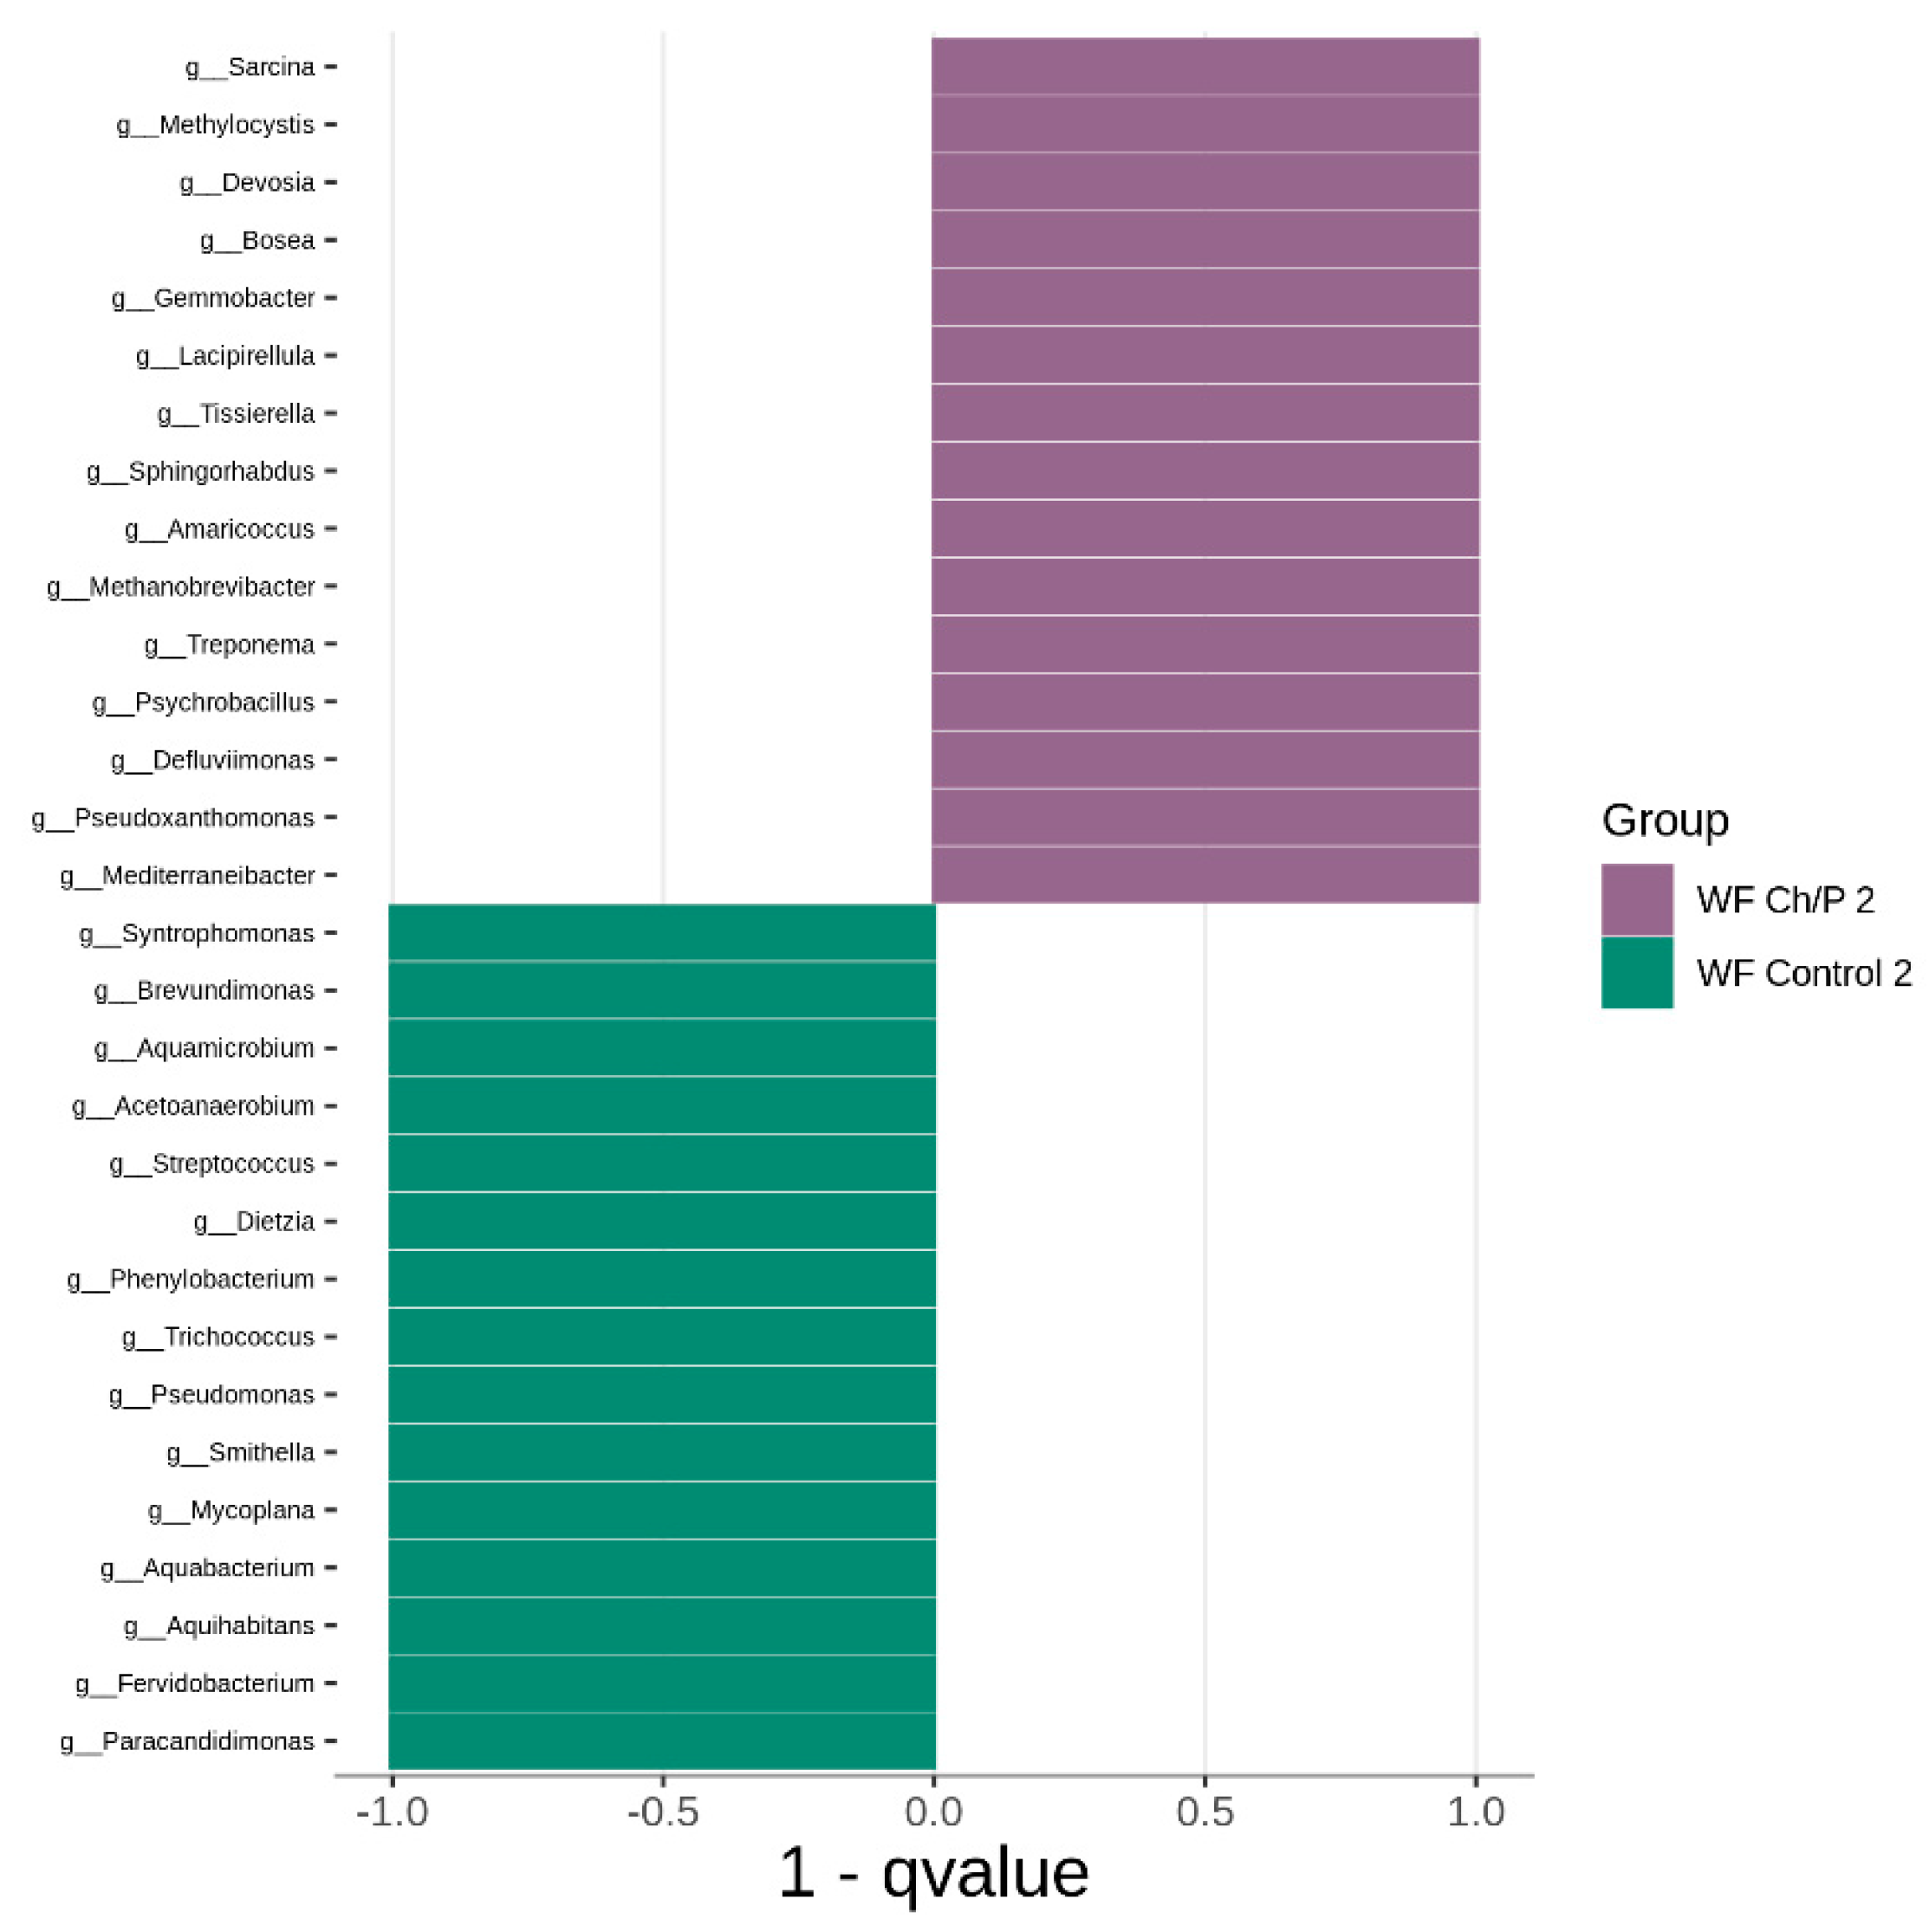
3.2. Bacterial Community Abundance and Composition

3.3. Physicochemical Analysis of Sludge Samples and Biogas Efficiency
4. Discussion
5. Conclusions
Author Contributions
Institutional Review Board Statement
Informed Consent Statement
Conflicts of Interest
References
- Ajayi-Banji, A.; Rahman, S. A review of process parameters influence in solid-state anaerobic digestion: Focus on performance stability thresholds. Renew. Sustain. Energy Rev. 2022, 167, 112756. [Google Scholar] [CrossRef]
- Assis, T.I.; Gonçalves, R.F. Valorization of food waste by anaerobic digestion: A bibliometric and systematic review focusing on optimization. J. Environ. Manage. 2022, 320, 115763. [Google Scholar] [CrossRef] [PubMed]
- Dompara, I.; Maragkaki, A.; Papastefanakis, N.; Floraki, C.; Vernardou, D.; Manios, T. Article effects of different materials on biogas production during anaerobic digestion of food waste. Sustainability 2023, 15, 5698. [Google Scholar] [CrossRef]
- Yadav, M.; Joshi, C.; Paritosh, K.; Thakur, J.; Pareek, N.; Masakapalli, S.K.; Vivekanand, V. Reprint of Organic waste conversion through anaerobic digestion: A critical insight into the metabolic pathways and microbial interactions. Metab. Eng. 2022, 17, 62–76. [Google Scholar] [CrossRef]
- Zhou, M.; Yang, H.; Zheng, D.; Pu, X.; Liu, Y.; Wang, L.; Zhang, Y.; Deng, L. Methanogenic activity and microbial communities characteristics in dry and wet anaerobic digestion sludges from swine manure. Biochem. Eng. J. 2019, 15, 107390. [Google Scholar] [CrossRef]
- Júnior, A.D.N.F.; Etchebehere, C.; Zaiat, M. Mesophilic hydrogen production in acidogenic packed-bed reactors (APBR) using raw sugarcane vinasse as substrate: influence of support materials. Anaerobe. 2015, 34, 94–105. [Google Scholar] [CrossRef]
- Gong, W.J.; Liang, H.; Li, W.Z.; Wang, Z.Z. Selection and evaluation of biofilm carrier in anaerobic digestion treatment of cattle manure. Energy 2011, 36, 3572–3578. [Google Scholar] [CrossRef]
- Liu, Y.; Zhu, Y.; Jia, H.; Yong, X.; Zhang, L.; Zhou, J.; Cao, Z.; Kruse, A.; Wei, P. Effects of different biofilm carriers on biogas production during anaerobic digestion of corn straw. Bioresour. Technol. 2017, 244, 445–451. [Google Scholar] [CrossRef] [PubMed]
- Weiß, S.; Zankel, A.; Lebuhn, M.; Petrak, S.; Somitsch, W.; Guebitz, G.M. Investigation of microorganisms colonising activated zeolites during anaerobic biogas production from grass silage. Bioresour. Technol. 2011, 102, 4353–4359. [Google Scholar] [CrossRef]
- Montalvo, S.; Guerrero, L.; Borja, R.; Sánchez, E.; Milán, Z.; Cortés, I.; de la Rubia, M.A. Application of natural zeolites in anaerobic digestion processes: A review. Appl. Clay Sci. 2012, 58, 125–133. [Google Scholar] [CrossRef]
- Weiß, S.; M. Lebuhn, M.; Andrade, D.; A. Zankel, A.; Cardinale, M.; Birner-Gruenberger, R.; Somitsch, W.; Ueberbacher, B.J.; Guebitz, G.M. Activated zeolite– suitable carriers for microorganisms in anaerobic digestion processes? Appl. Microbiol. Biotechnol. 2013, 97, 3225–3238. [Google Scholar] [CrossRef] [PubMed]
- Jin, H.J.; Yao, X.Y.; Tang, C.C.; Zhou, A.J.; Liu, W.; Ren, Y.X.; Li, Z.; Wang, A.; He, Z.W. Magnetite modified zeolite as an alternative additive to promote methane production from anaerobic digestion of waste activated sludge. Renew. Energy 2024, 224, 120181. [Google Scholar] [CrossRef]
- Langxian, S.; Lintong, Z.; Xin, Y.; Maoyou, Y.; Jialin, L.; Minchun, H.; Xidan, F.; Lianhua, L. Dual roles in interspecies electron transfer of carbon-based materials for accelerating anaerobic digestion of food waste. Biochem. Eng. J. 2024, 203, 109182. [Google Scholar] [CrossRef]
- Pilarska, A.A.; Pilarski, K.; Adamski, M.; Zaborowicz, M.; Dorota Cais-Sokolińska, D.; Wolna-Maruwka, A.; Niewiadomska, A. Eco-friendly and effective diatomaceous earth/peat (DEP) microbial carriers in the anaerobic biodegradation of food waste products. Energies 2022, 15, 3442. [Google Scholar] [CrossRef]
- Cayetano, R.D.A.; Kim, G.B.; Park, J.; Yang, Y.H.; Jeon, B.C.; Jang, M.; Kim, S.H. Biofilm formation as a method of improved treatment during anaerobic digestion of organic matter for biogas recovery. Bioresour. Technol. 2022, 344, 126309. [Google Scholar] [CrossRef] [PubMed]
- Ouboter, H.T.; Mesman, R.; Sleutels, T.; Postma, J.; Wissink, M.; Jetten, M.S.M.; Heijne, A.T.; Berben, T.; Welte, C.U. Mechanisms of extracellular electron transfer in anaerobic methanotrophic archaea. Nat. Commun. 2024, 15, 1477. [Google Scholar] [CrossRef] [PubMed]
- Pilarska, A.A.; Wolna-Maruwka, A.; Niewiadomska, A.; Jarosław Grządziel, J.; Gałązka, A.; Paluch, E.; Borowiak, K.; Pilarski, K. Quantitative and qualitative changes in the genetic diversity of bacterial communities in anaerobic bioreactors with the diatomaceous earth/peat cell carrier. Cells 2022, 11, 2571. [Google Scholar] [CrossRef] [PubMed]
- Popa, A.; Visa, A.; Maranescu, B.; Hulka, I.; Lupa, L. Chemical modification of chitosan for removal of Pb(II) ions from aqueous solutions. Materials 2021, 14, 7894. [Google Scholar] [CrossRef] [PubMed]
- Satitsri, S.; Muanprasat, C. Chitin and chitosan derivatives as biomaterial resources for biological and biomedical applications. Molecules 2020, 25, 5961. [Google Scholar] [CrossRef]
- Stefanowska, K.; Woźniak, M.; Dobrucka, R.; Ratajczak, I. Chitosan with natural additives as a potential food packaging. Materials 2023, 16, 1579. [Google Scholar] [CrossRef]
- Fenice, M.; Gorrasi, S. Advances in chitin and chitosan science. Molecules 2021, 26, 1805. [Google Scholar] [CrossRef]
- Olajire, A.A.; Bamigbade, L.A. Green synthesis of chitosan-based iron@silver nanocomposite as adsorbent for wastewater treatment. Water Res. Ind. 2021, 26, 100158. [Google Scholar] [CrossRef]
- Poureini, F.; Nikzad, M. Application of Chitosan for wastewater treatment. 2nd International Conference on Sustainable Development, Strategies and Challenges with a Focus on Agriculture, Natural Resources, Environment and Tourism, 23–25 Feb 2016, Tabriz, Iran.
- Yin, M.; Chen, H. Unveiling the dual faces of chitosan in anaerobic digestion of waste activated sludge. Bioresour. Technol. 2022, 344, 126182. [Google Scholar] [CrossRef] [PubMed]
- Nie, W.; Lin, Y.; Wu, X.; Wu, S.; Li, X.; Cheng, J.J.; Yang, C. Chitosan–Fe3O4 composites enhance anaerobic digestion of liquor wastewater under acidic stress. Bioresour. Technol. 2023, 377, 128927. [Google Scholar] [CrossRef] [PubMed]
- Tetteh, E.K.; Amo-Duodu, G.; Rathilal, S. Biogas production from wastewater: Comparing biostimulation impact of magnetised–chitosan and –titania chitosan. Mater. Today Proc. 2022, 62, S85–S90. [Google Scholar] [CrossRef]
- Yilmazer, S.; Ozdeniz, M.B. The effect of moisture content on sound absorption of expanded perlite plates. Build. Environ. 2005, 40, 311–318. [Google Scholar] [CrossRef]
- Aksoy, Ö.; Alyamaç, E.; Mocan, M.; Sütçü, M.; Uçar, N.Ö.; Seydibeyoğlu, M.Ö. Characterization of perlite powders from Izmir, Türkiye region. Physicochem. Probl. Miner. Process. 2022, 58, 155277. [Google Scholar] [CrossRef]
- Yan, Y.; Jia, G.; Zhang, Y.; Gao, Y.; Li, Z. The influence of expanded perlite as a bio-carrier on the freeze–thaw properties of self-healing concreto. Constr. Build. Mater. 2023, 409, 133891. [Google Scholar] [CrossRef]
- Yan, Y.; Liu, W.; Jia, G.; Zhang, Y.; Gao, Y.; Li, Z. Application of expanded perlite immobilized microorganisms in cementitious materials. J. Build. Eng. 2023, 76, 106834. [Google Scholar] [CrossRef]
- Porras, C.M.; Rodríguez, J.L.P.; Martínez, J.L. An evaluation of clay minerals as support materials in anaerobic digesters. Environ. Technol. 1998, 19, 811–819. [Google Scholar]
- Ivankovic, T.; Kontek, M.; Mihalic, V.; Ressler, A.; Jurisic, V. Perlite as a biocarrier for augmentation of biogas–producing reactors from olive (Olea europaea) waste Appl. Sci. 2022, 12, 8808. [Google Scholar]
- Pilarska, A.A.; Pilarski, K.; Waliszewska, B.; Zborowska, M.; Witaszek, K.; Waliszewska, H.; Kolasiński, M.; Szwarc-Rzepka, K. Evaluation of bio-methane yields for high-energy organic waste and sewage sludge: A pilot-scale study for a wastewater treatment plant. Environ. Eng. Manag. J. 2019, 18, 2019–2030. [Google Scholar] [CrossRef]
- Pilarska, A.A.; Pilarski, K.; Wolna-Maruwka, A. Cell immobilization on lignin–polyvinylpyrrolidone material used for anaerobic digestion of waste wafers and sewage sludge. Environ. Eng. Sci. 2019, 36, 478–490. [Google Scholar] [CrossRef]
- Pilarska, A.A. Anaerobic co-digestion of waste wafers from the confectionery production with sewage sludge. Polish J. Environ. Stud. 2018, 27, 237–245. [Google Scholar] [CrossRef] [PubMed]
- Pilarska, A.A.; Wolna-Maruwka, A.; Pilarski, K.; Janczak, D.; Przybył, K.; Gawrysiak-Witulska, M. The use of lignin as a microbial carrier in the co-digestion of cheese and wafer waste. Polymers, 2019, 11, 2073. [Google Scholar] [CrossRef]
- Pilarska, A.A.; Wolna-Maruwka, A.; Niewiadomska; Pilarski, K.; Adamski, M.; Grzyb, A.; Grządziel, J.; Gałązka, A. Silica/lignin carrier as a factor increasing the process performance and genetic diversity of microbial communities in laboratory-scale anaerobic digesters. Energies 2021, 14, 4429. [Google Scholar] [CrossRef]
- Pilarska, A.A.; Pilarski, K.; Wolna-Maruwka, A.; Boniecki, P.; Zaborowicz, M. Use of confectionery waste in biogas production by the anaerobic digestion process. Molecules 2019, 24, 37. [Google Scholar] [CrossRef]
- Pilarska, A.; Linda, I.; Wysokowski, M.; Paukszta, D.; Jesionowski, T. Synthesis of Mg(OH)2 from a magnesium salt and NH4OH with direct functionalisation with poly(ethylene glycols). Physicochem. Probl. Miner. Process. 2012, 48, 631–643. [Google Scholar]
- Pilarska, A.A.; Wolna-Maruwka, A.; Pilarski, K. Kraft lignin grafted with polyvinylpyrrolidone as a novel microbial carrier in biogas production. Energies 2018, 11, 3246–3268. [Google Scholar] [CrossRef]
- Pilarska, A.A.; Bula, K.; Pilarski, K.; Adamski, M.; Wolna-Maruwka, A.; Tomasz Kałuza, T.; Magda, P.; Boniecki, P. Polylactide (PLA) as a cell carrier in mesophilic anaerobic digestion–A new strategy in the management of PLA. Materials 2022, 15, 8113. [Google Scholar] [CrossRef]
- Norm VDI 4630. Fermentation of Organic Materials Characterization of the Substrate, Sampling, Collection of Material Data, Fermentation Tests; German Engineers Club: Düsseldorf, Germany, 2006.
- DIN Guideline 38 414-S8. Characterisation of the Substrate, Sampling, Collection of Material Data, Fermentation Tests; German Institute for Standardization: Berlin, Germany, 1985.
- Pilarska, A.A.; Marzec-Grządziel, A.; Paluch, E.; Pilarski, K.; Wolna-Maruwka, A.; Kubiak, A.; Kałuża, T.; Kulupa, T. Biofilm formation and genetic diversity of microbial communities in anaerobic batch reactor with polylactide (PLA) addition. Int. J. Mol. Sci. 2023, 24, 10042. [Google Scholar] [CrossRef]
- R Core Team. R: A Language and Environment for Statistical Computing; R Foundation for Statistical Computing: Vienna, Austria, 2016. [Google Scholar]
- Callahan, B.J.; McMurdie, P.J.; Rosen, M.J.; Han, A.W.; Johnson, A.J.A.; Holmes, S.P. DADA2: High-resolution sample inference from Illumina amplicon data. Nat. Methods 2016, 13, 581–583. [Google Scholar] [CrossRef]
- Wright, E.S. RDP v16 Modified Training Set for 16S rRNA Classification. 2019. Available online: http://www2.decipher.codes/ Classification/TrainingSets/RDP_v16-mod_March2018.RData (accessed on 2 January 2019).
- Murali, A.; Bhargava, A.; Wright, E.S. IDTAXA: A novel approach for accurate taxonomic classification of microbiome sequences. Microbiome 2018, 6, 140. [Google Scholar] [CrossRef]
- McMurdie, P.J.; Holmes, S. cPhyloseq: An R package for reproducible interactive analysis and graphics of microbiome census data. PLoS ONE 2013, 8, e61217. [Google Scholar] [CrossRef]
- Sweah, Z.J.; Malk, F.H.; Hussain, W.A. Determination of the optical parameter from chitosan doping with nicotine Cite as: AIP Conference Proceedings 2213, 020065 (2020); Published Online: 25 March 2020. [CrossRef]
- Khoshraftar, Z.; Masoumi, H.; Ghaemi, A. On the performance of perlite as a mineral adsorbent for heavy metals ions and dye removal from industrial wastewater: A review of the state of the art. Case Stud. Chem. Environ. Eng. 2023, 8, 100385. [Google Scholar] [CrossRef]
- Hasan, S.; Ghosh, T.K.; Boddu, V.M. Dispersion of chitosan on perlite for enhancement of copper(II) adsorption capacity. J. Hazard. Mater. 2008, 152, 826–837. [Google Scholar] [CrossRef]
- Farrokhi, Z.; Sadjadi, S.; Raouf, F.; Bahri-Laleh, N. Novel bio-based Pd/chitosan-perlite composite bead as an efficient catalyst for rapid decolorization of azo dye. Inorg. Chem. Commun. 2022, 143, 109734. [Google Scholar] [CrossRef]
- Swayampakula, K.; Boddu, V.M.; Abburi, K. Competitive adsorption of Cu (II), Co (II) and Ni (II) from their binary and tertiary aqueous solutions using chitosan-coated perlite beads as biosorbent. J. Hazard. Mater. 2009, 170, 680–689. [Google Scholar] [CrossRef]
- Demirçivi, P. Synthesis and characterization of Zr(IV) doped immobilized cross-linked chitosan/perlite composite for acid orange II adsorption. Int. J. Biol. Macromol. 2018, 118, 340–346. [Google Scholar] [CrossRef]
- Patil, S.B.; Sawant, K.K. Chitosan microspheres as a delivery system for nasal insufflation. Colloids Surf. B: Biointerfaces 2011, 84, 384–389. [Google Scholar] [CrossRef]
- Nguyen, T.V.; Nguyen, T.T.H.; Wang, S.L.; Vo, T.P.K.; Nguyen, A.D. Preparation of chitosan nanoparticles by TPP ionic gelation combined with spray drying, and the antibacterial activity of chitosan nanoparticles and a chitosan nanoparticle–amoxicillin complex. Res. Chem. Intermed. 2017, 43, 3527–3537. [Google Scholar] [CrossRef]
- Vaezifar, S.; Razavi, S.; Golozar, M.A.; Karbasi, S.; Morshed, M.; Kamali, M. Effects of some parameters on particle size distribution of chitosan nanoparticles prepared by ionic gelation method. J. Clust. Sci. 2013, 24, 891–903. [Google Scholar] [CrossRef]
- Reka, A.A.; Pavlovski, B.; Lisichkov, K.; Jashari, A.; Boev, B.; Boev, I.B.; Lazarova, M.; Eskizeybek, V.; Oral, A.; Jovanovski, G.; Makreski, P. Chemical, mineralogical and structural features of native and expanded perlite from Macedonia. Geol. Croat. 2019, 72, 215–221. [Google Scholar] [CrossRef]
- Dhawade, P.P.; Jagtap, R.N. Characterization of the glass transition temperature of chitosan and its oligomers by temperature modulated differential scanning calorimetry. Adv. Appl. Sci. Res. 2012, 3, 1372–1382. [Google Scholar]
- Acosta-Ferreira, S.; Castillo, O.S.; Madera-Santana, J.T.; Mendoza-García, D.A.; Núñez-Colín, C.A.; Grijalva-Verdugo, C.; Villa-Lerma, A.G.; Morales-Vargasa, A.T.; Rodríguez-Núñeza, J.R. Production and physicochemical characterization of chitosan for the harvesting of wild microalgae consortia. Biotechnol. Rep. 2020, 28, e00554. [Google Scholar] [CrossRef] [PubMed]
- Karaipekli, A.; Biçer, A.; Sarı, A.; Tyagi, V.V. Thermal characteristics of expanded perlite/paraffin composite phase change material with enhanced thermal conductivity using carbon nanotubes. Energy Conv. Manage. 2017, 134, 373–381. [Google Scholar] [CrossRef]
- Major, N.; Sørensen, S.J.S.J.; Ban, D.; Nesme, J.; Grosch, R.; Ban, S.G.; Schikora, A.; Cerne, M.; Schierstaedt, J. Influence of sewage sludge stabilization method on microbial community and the abundance of antibiotic resistance genes. Waste Manage. 2022, 154, 126–135. [Google Scholar] [CrossRef] [PubMed]
- Chen, Y.; Cheng, J.J.; Creamer, K.S. Inhibition of anaerobic digestion process: A review. Bioresour. Technol. 2008, 99, 4044–4064. [Google Scholar] [CrossRef] [PubMed]
- Grube, M.; Lin, J.; Lee, P.H.; Kokorevicha, S. Evaluation of sewage sludge-based compost by FT-IR 590 spectroscopy. Geoderma 2006, 130, 324–333. [Google Scholar] [CrossRef]
- Matheri, A.N.; Eloko, N.S.; Ntuli, F.; Ngila, J.C. Influence of pyrolyzed sludge use as an adsorbent in removal of selected trace metals from wastewater treatment. Case Stud. Chem. Environ. Eng. 2020, 2, 100018. [Google Scholar] [CrossRef]
- Pilarska, A.A.; Pilarski, K.; Witaszek, K.; Waliszewska, H.; Zborowska, M.; Waliszewska, B.; Kolasi’nski, M.; Szwarc-Rzepka, K. Treatment of dairy waste by anaerobic digestion with sewage sludge. Ecol. Chem. Eng. 2016, 23, 99–115. [Google Scholar] [CrossRef]
- Yang, H. , Yan, R., Chen, H., Lee, D.H., Zheng, C. Characteristics of hemicellulose, cellulose and lignin pyrolysis. Fuel 2007, 86, 1781–1788. [Google Scholar] [CrossRef]
- Hantoko, D.; Kanchanatip, A.E.; Yan, M.; Weng, Z.; Gao, Z.; Zhong, Y. Assessment of sewage sludge gasification in supercritical water for H2-rich syngas production. Process Saf. Environ. Prot. 2019, 131, 63–72. [Google Scholar] [CrossRef]
- Lalov, I.G.; Krysteva, M.A.; Phelouzat, J.L. Im provement of biogas production from vinasse via covalently immobilized methanogens. Bioresour. Technol. 2001, 79, 83. [Google Scholar] [CrossRef] [PubMed]
- Dhaked, R.K.; Ramana, K.V.; Tomar, A.; Waghmare, C.; Kamboj, D.V.; Singh, L. Immobilization of anaerobic bacteria on rubberized-coir for psychrophilic digestion of night soil. Anaerobe 2005, 11, 217–224. [Google Scholar] [CrossRef] [PubMed]
- Yang, Z.; Sun, H.; Kurbonova, M.; Zhou, L.; Arhin, S.G.; Papadakis, V.G.; Goula, M.A.; Liu, G.; Zhang, Y.; Wang, W. Simultaneous supplementation of magnetite and polyurethane foam carrier can reach a Pareto–optimal point to alleviate ammonia inhibition during anaerobic digestion. Renew. Energy 2022, 189, 104–116. [Google Scholar] [CrossRef]
- Zhang, Y.; Hu, Q.; Wang, T.; Jin, Z.; Luo, T.; Huang, J.; Xu, G.; Zhan, Y.; Wang, H. Pumice as biological carriers improve impact load resistance of UASB reactors during the treatment of raw incineration leachates. Pol. J. Environ. Stud. 2022, 31, 1975–1983. [Google Scholar] [CrossRef]
- Liu, Y.; Xi, Y.; Ye, X.; Zhang, Y.; Wang, C.; Jia, Z.; Cao, C.; Han, T.; Du, J.; Kong, X.; Chen, Z. Composite nanofiber membranes to enhance the performance of high solids anaerobic digestion of organic rural household waste resources. Renew. Energy 2024, 220, 119564. [Google Scholar] [CrossRef]
- Zhao, W.; Hu, T.; Ma, H.; Li, D.; Zhao, Q.; Jiang, J.; Wei, L. A review of microbial responses to biochar addition in anaerobic digestion system: Community, cellular and genetic level findings. Bioresour. Technol. 2024, 391, 129929. [Google Scholar] [CrossRef]
- Razak, N.A.F.Z.M.S.A.; Jaman, S.I.K.J.; Harun, M.R. Biogas production by integrating lava rock, red clay & ceramic bio ring as support carrier in treatment of landfill leachate with liquidised food waste. Biochem. Eng. J. 2024, 204, 109221. [Google Scholar]
- Yan, Y.; Jia, G.; Zhang, Y.; Gao, Y.; Li, Z. The influence of expanded perlite as a bio-carrier on the freeze–thaw properties of self-healing concreto. Constr. Build. Mater. 2023, 409, 133891. [Google Scholar] [CrossRef]
- Yan, Y.; Liu, W.; Jia, G.; Zhang, Y.; Gao, Y.; Li, Z. Application of expanded perlite immobilized microorganisms in cementitious materials. J. Build. Eng. 2023, 76, 106834. [Google Scholar] [CrossRef]
- Jiang, L.; Jia, G.; Jianga, C.; Li, Z. Sugar-coated expanded perlite as a bacterial carrier for crack-healing concrete applications. Constr. Build. Mater. 2020, 232, 117222. [Google Scholar] [CrossRef]
- Yan, Y.; Liu, W.; Li, Z.; Jia, G.; Zhang, Y.; Ma, G.; Gao, Y. Mechanical properties and frost resistance of self-healing concrete based on expanded perlite with different particle sizes as microbial carrier. Constr. Build. Mater. 2024, 422, 135450. [Google Scholar] [CrossRef]
- Ivankovic, Y.; Kontek, M.; Mihalic, V.; Ressler, A.; Jurisic, V. Perlite as a biocarrier for augmentation of biogas – Producing reactors from olive (Olea europaea) waste. Appl. Sci. 2022, 12, 8808. [Google Scholar] [CrossRef]
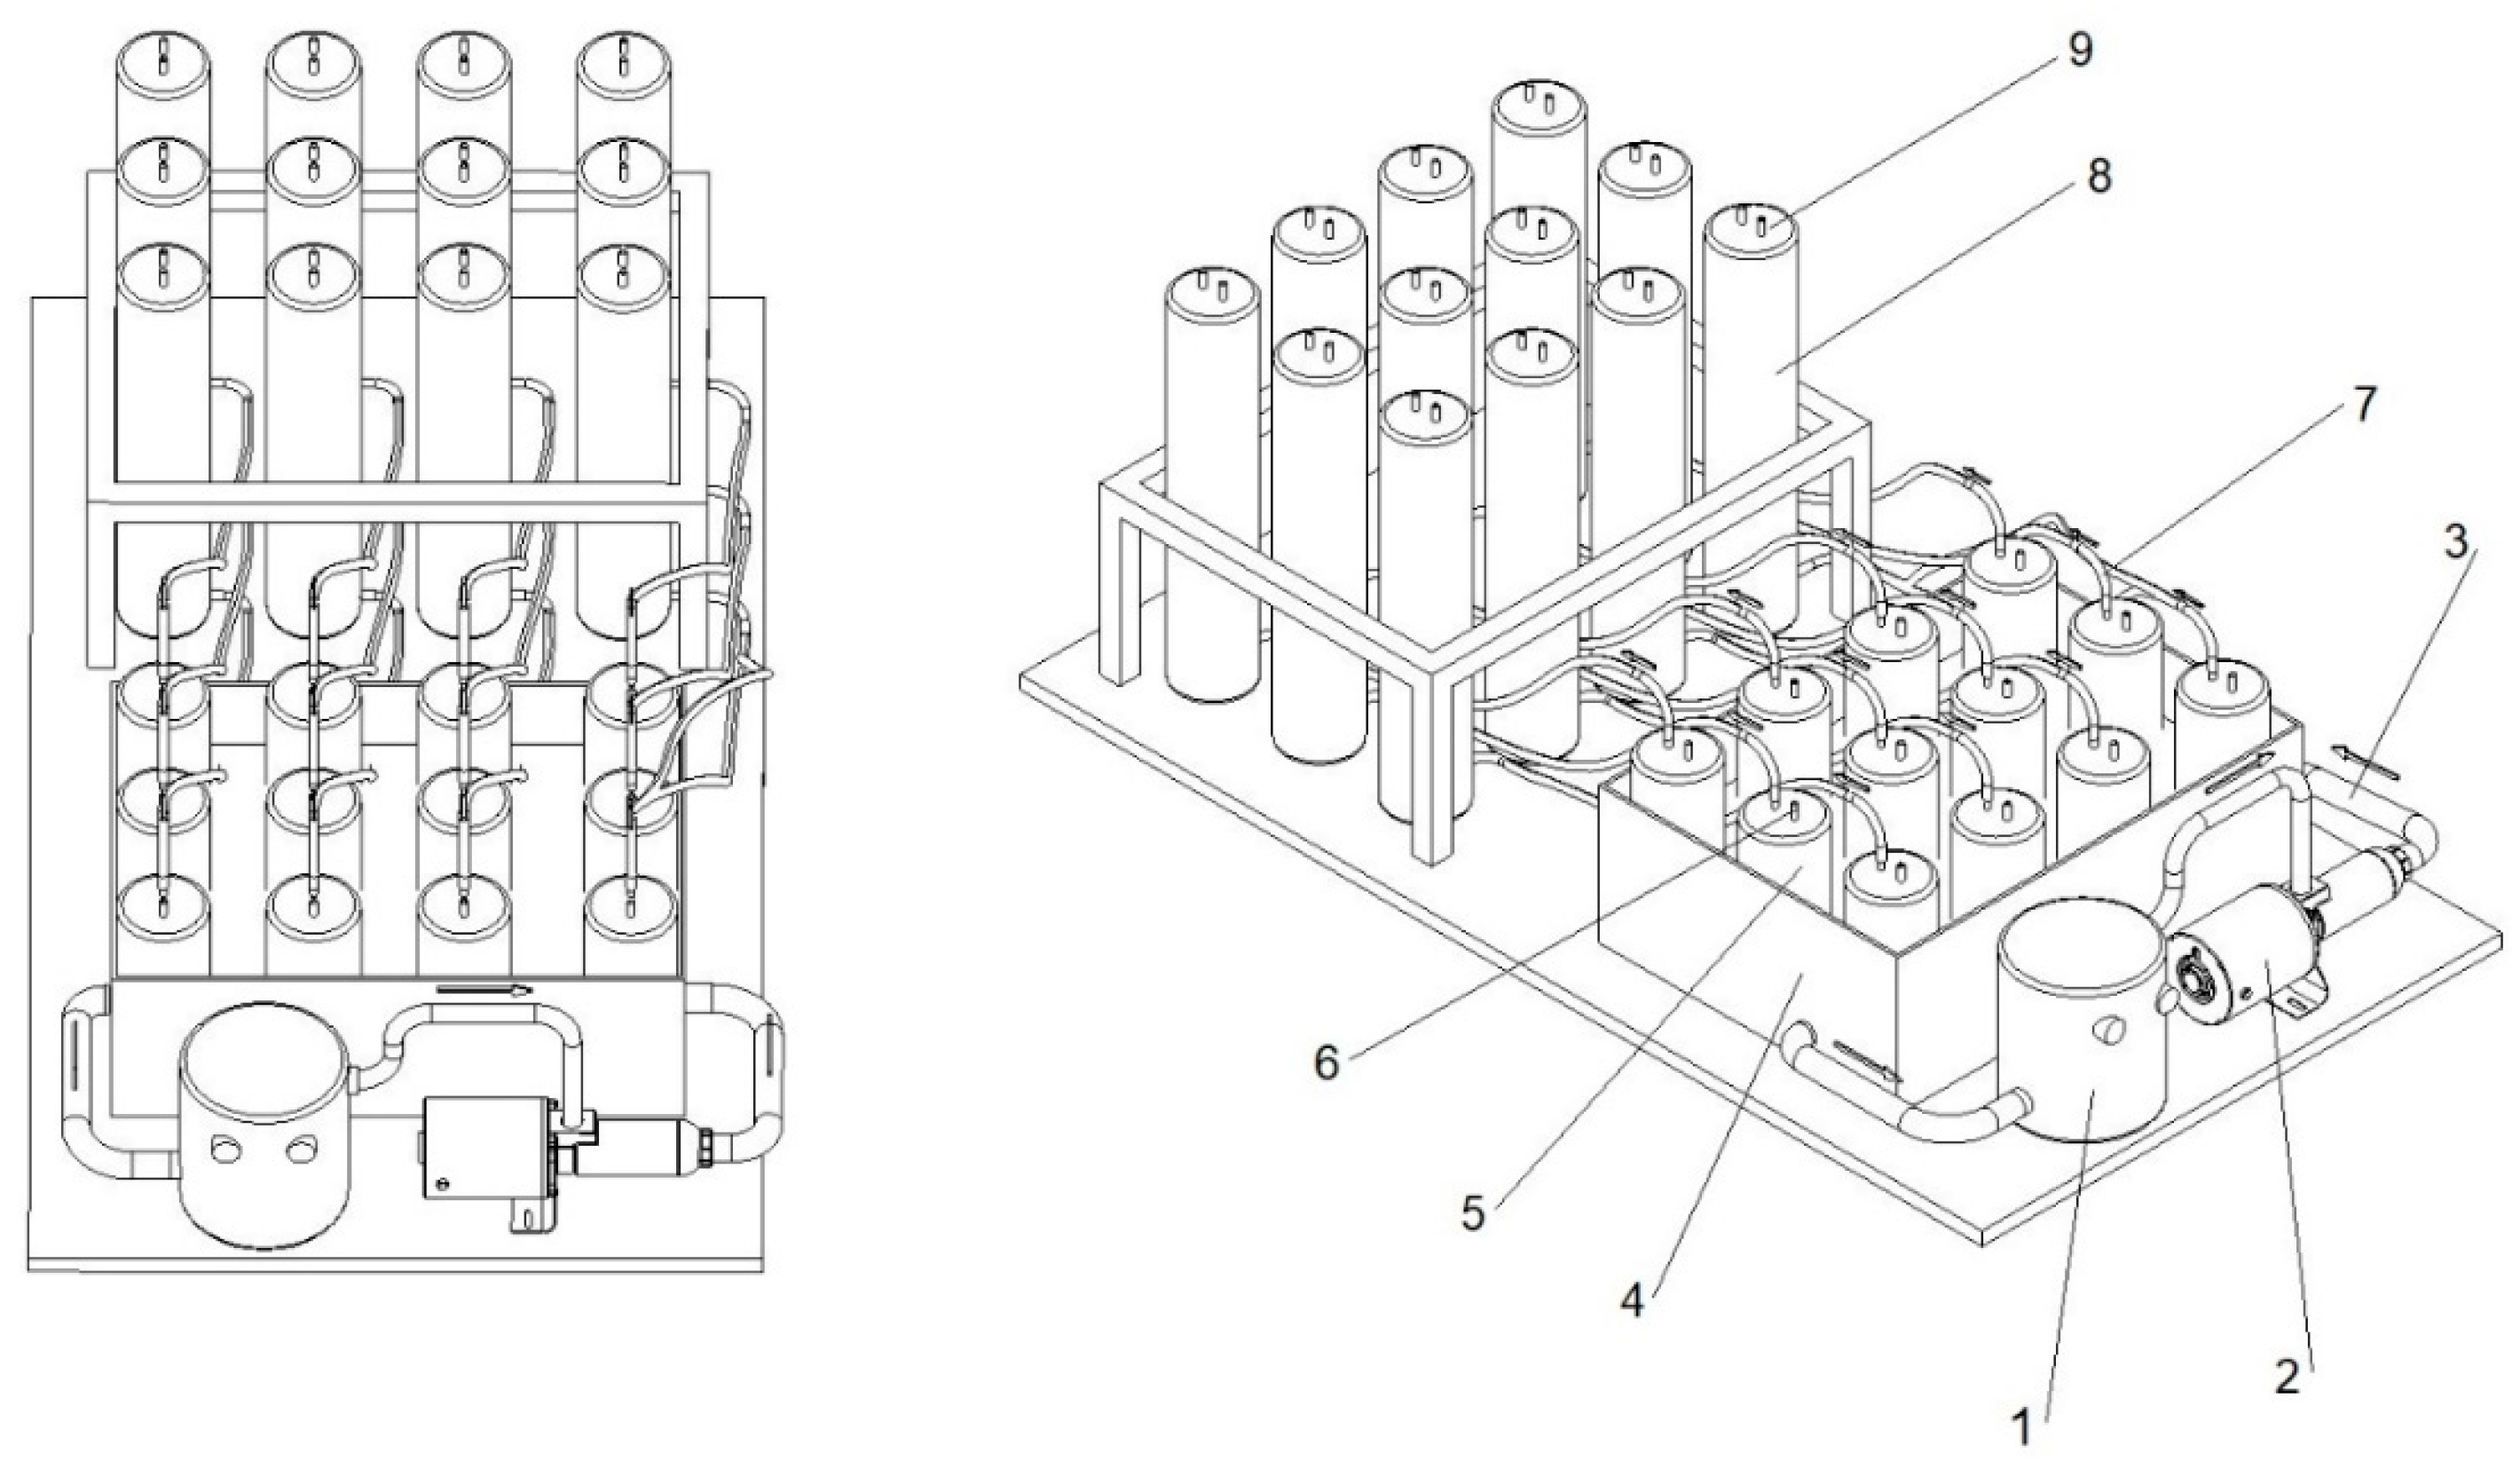
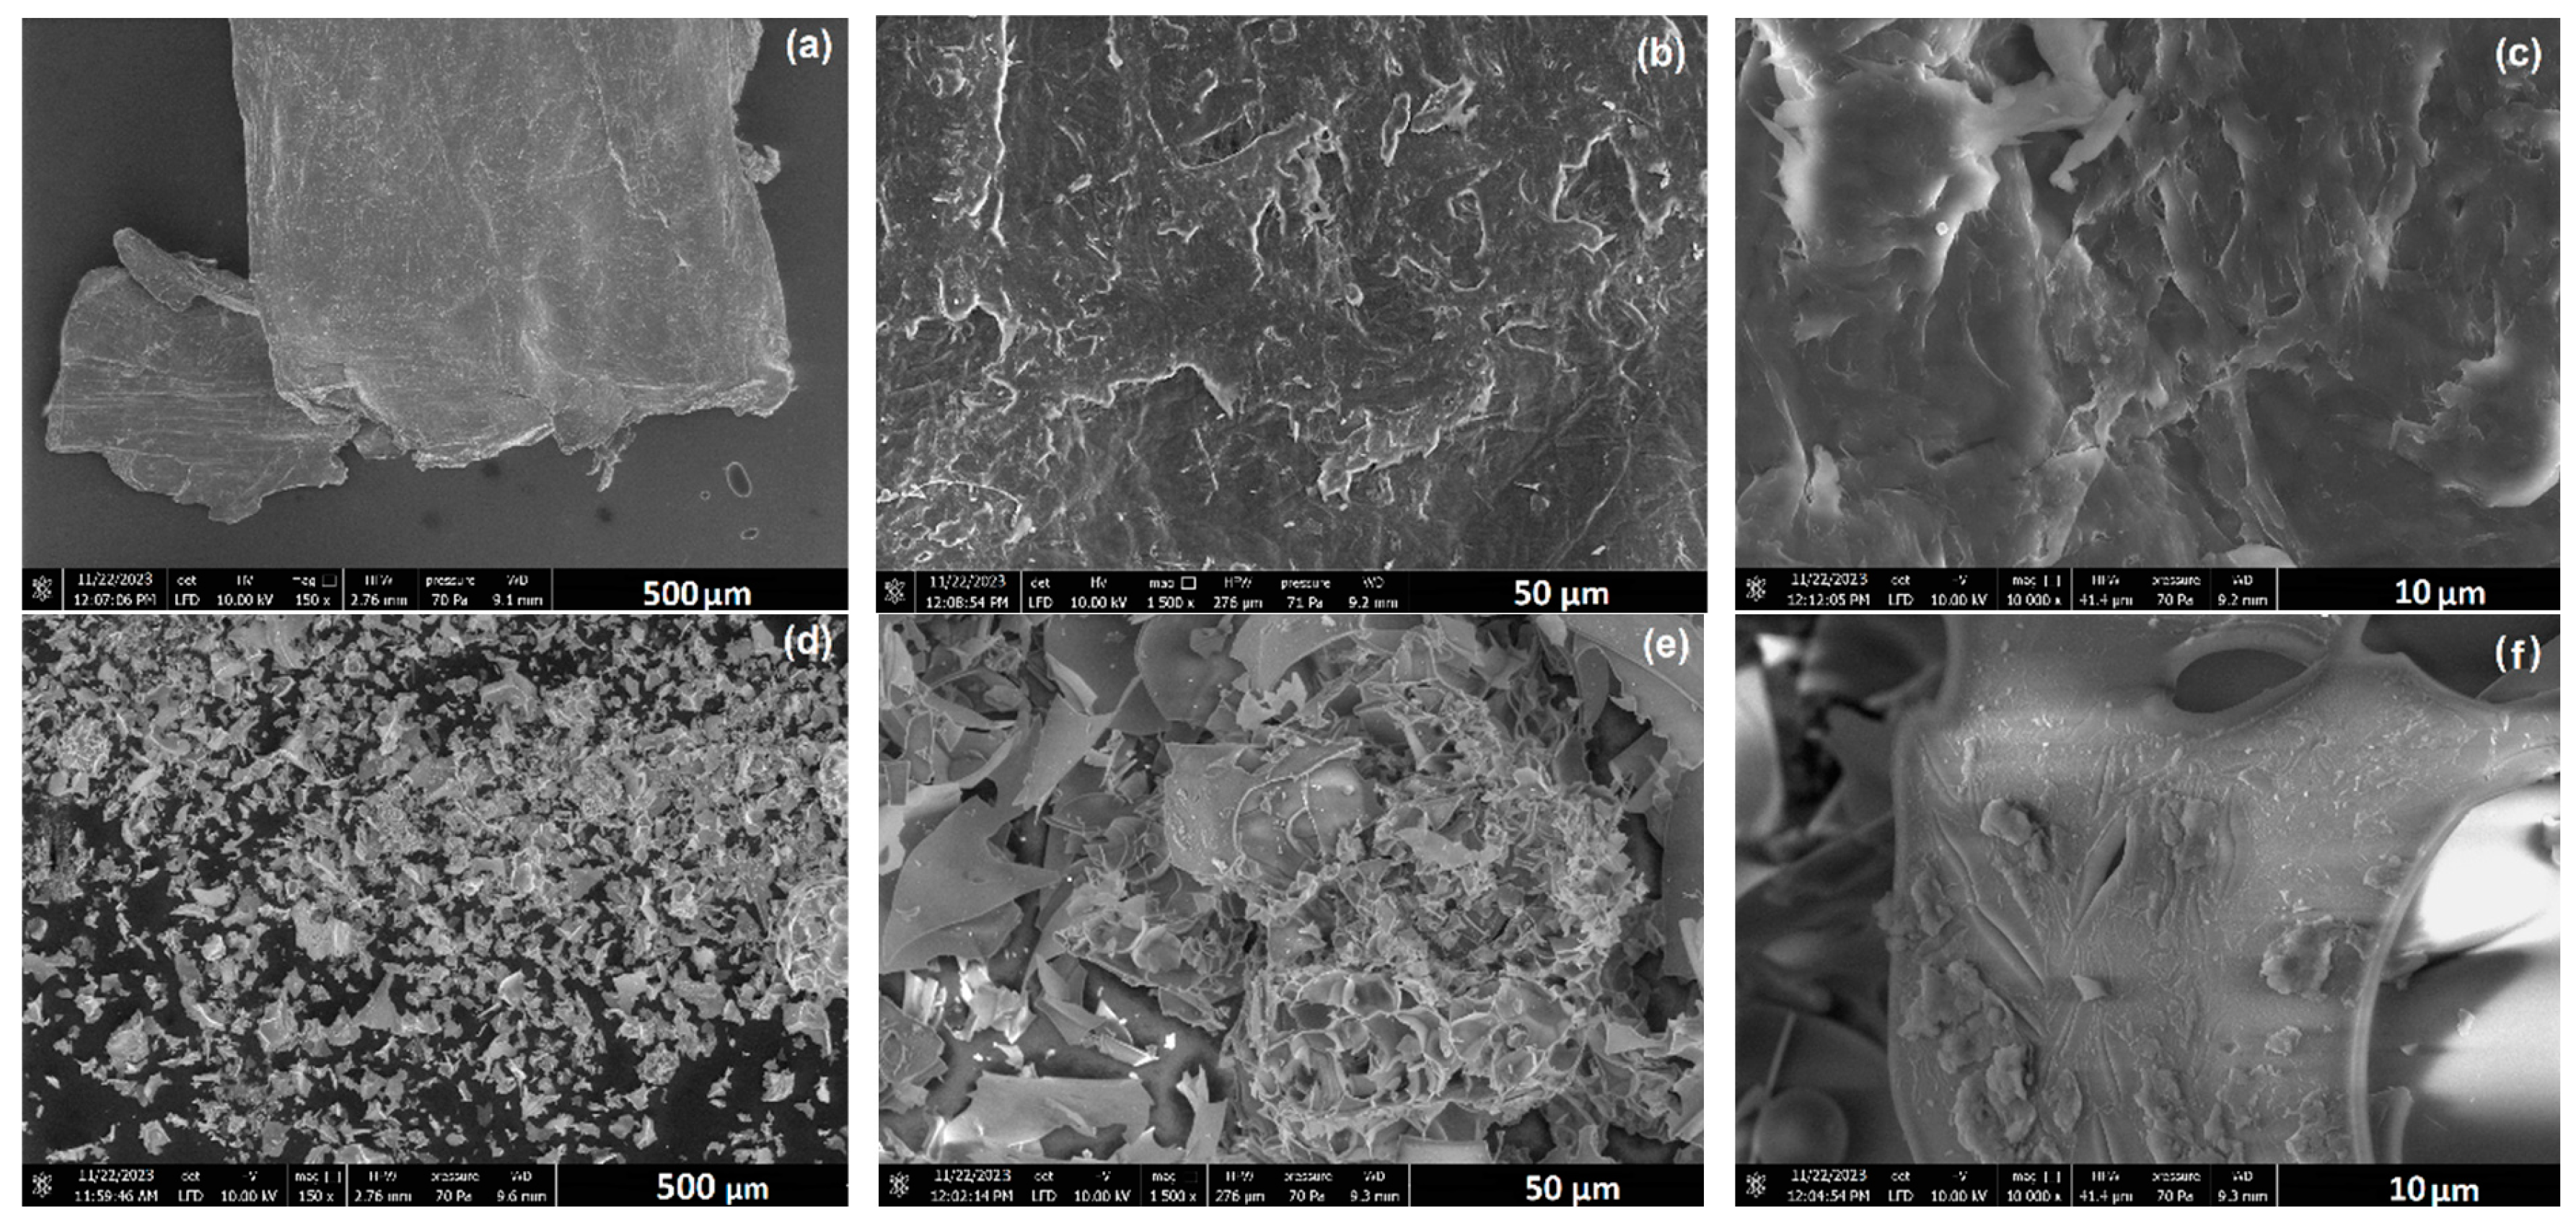


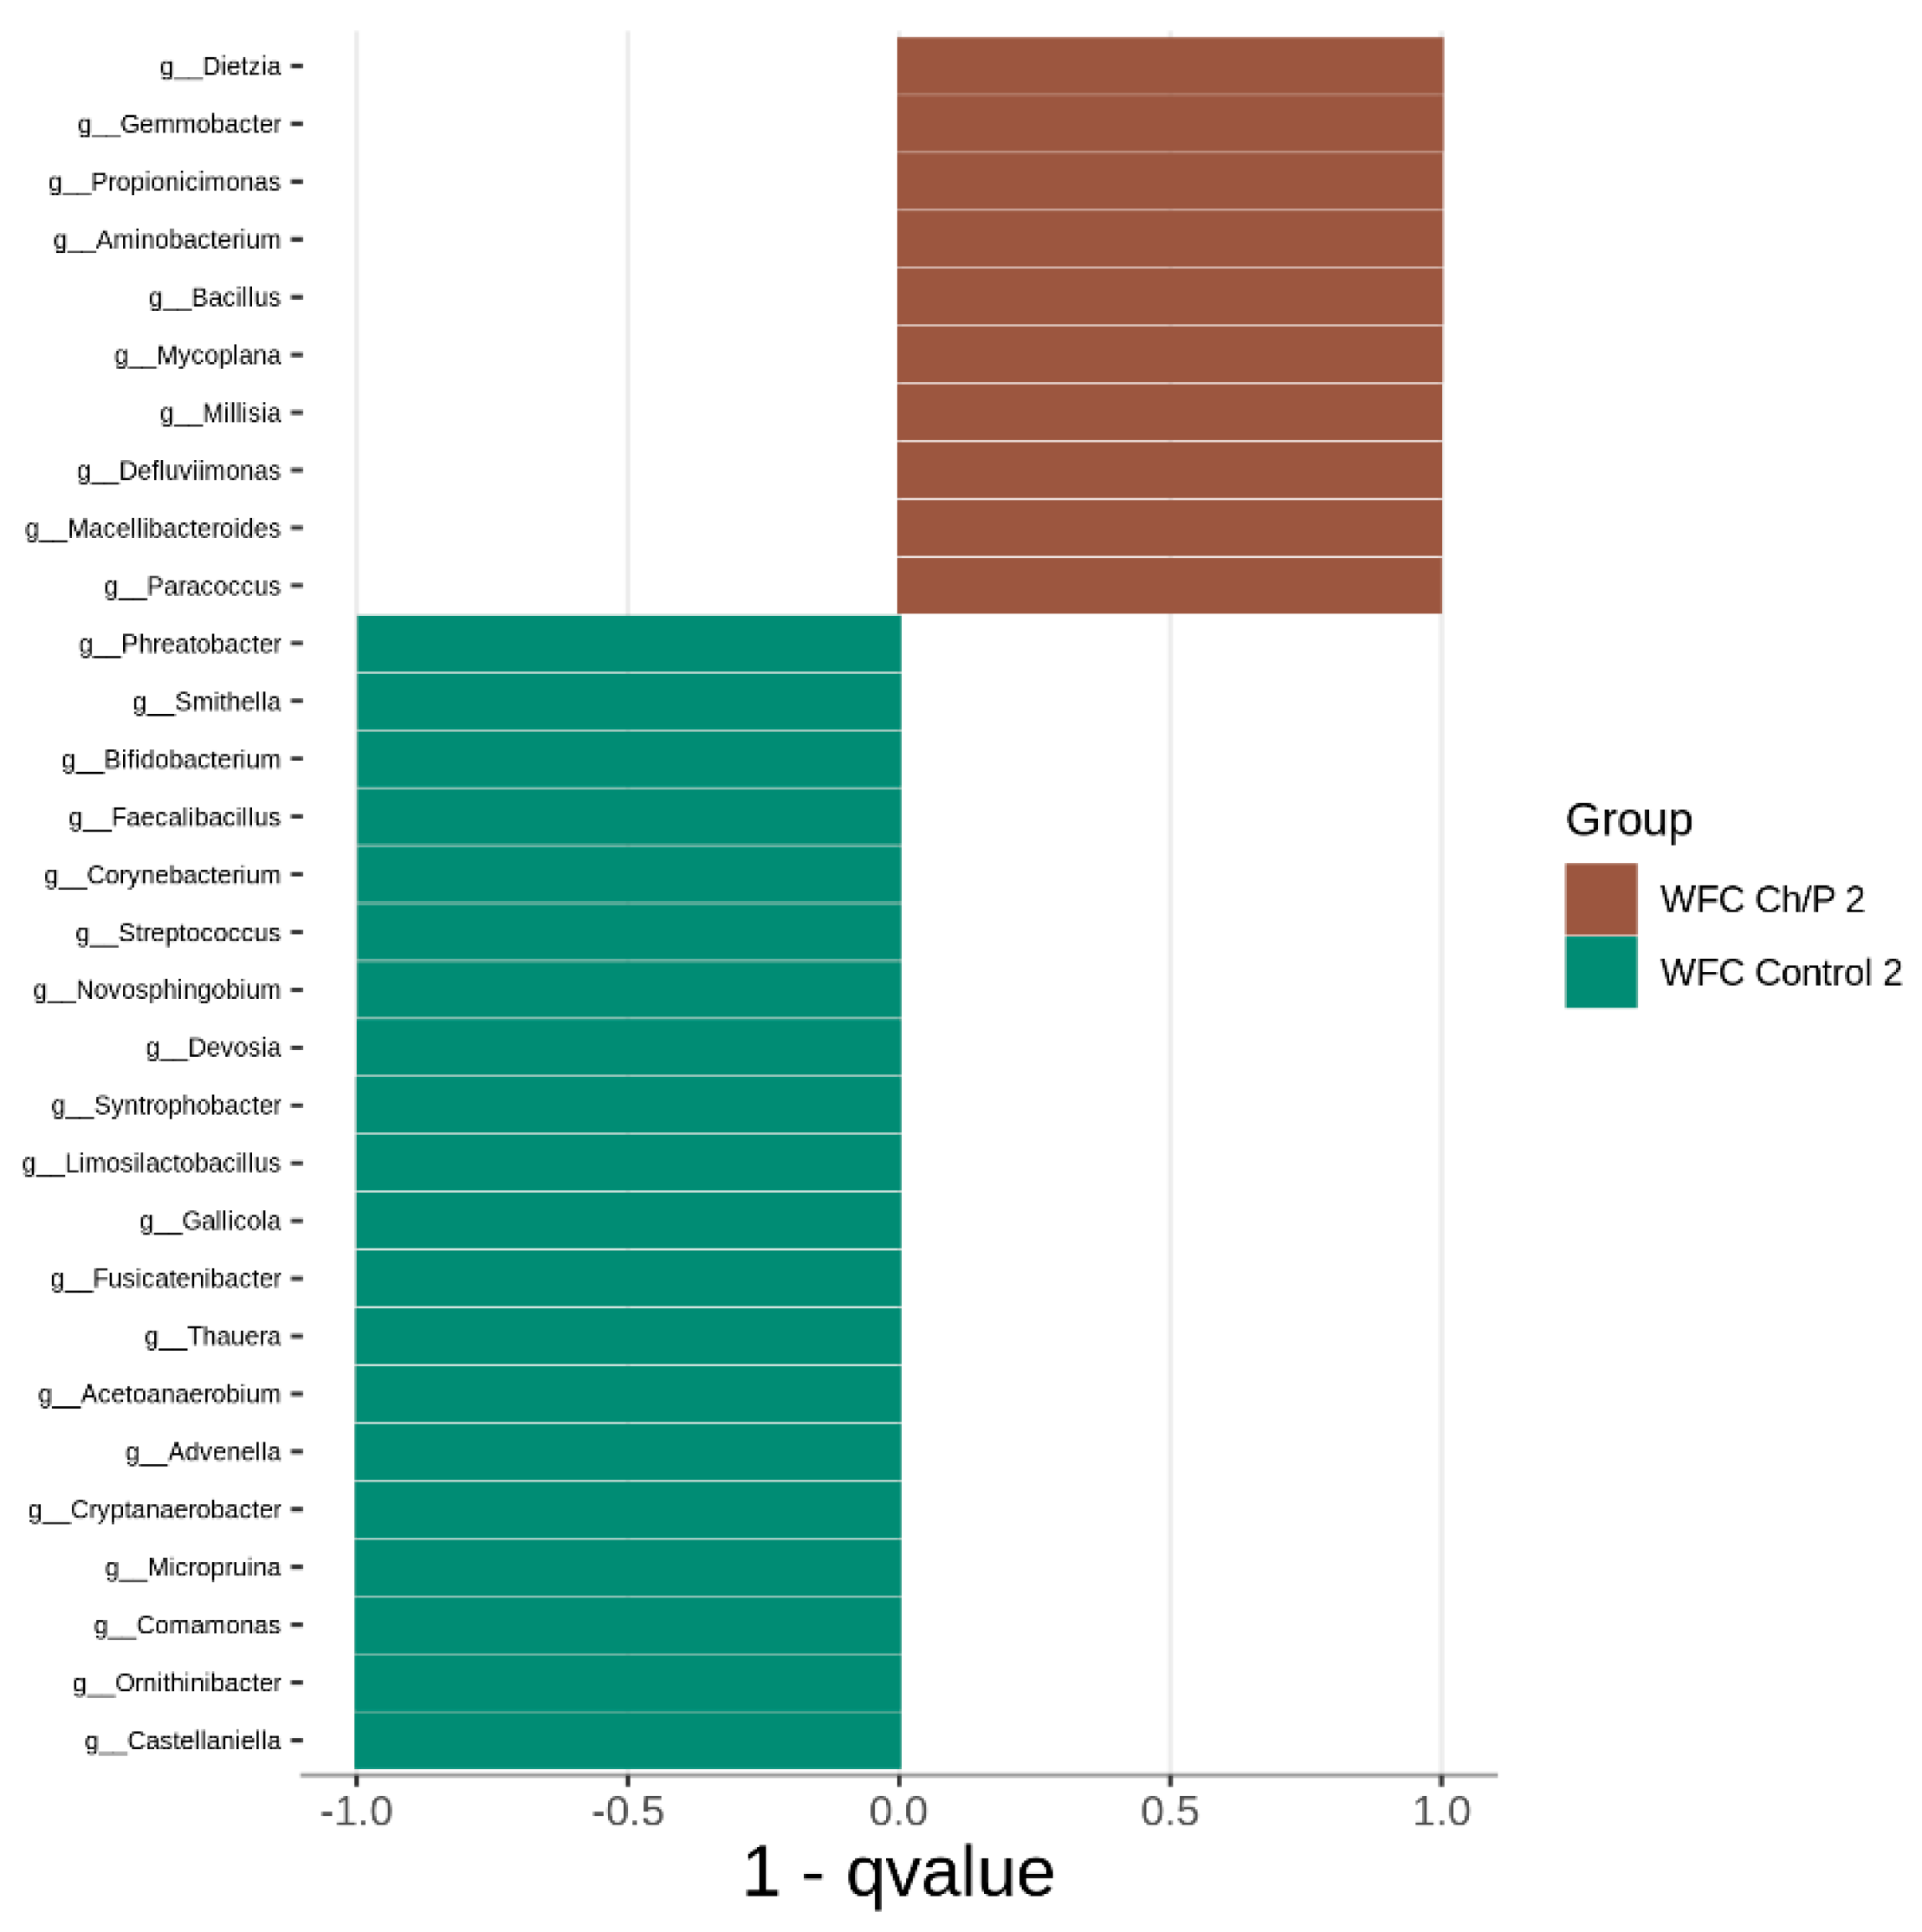
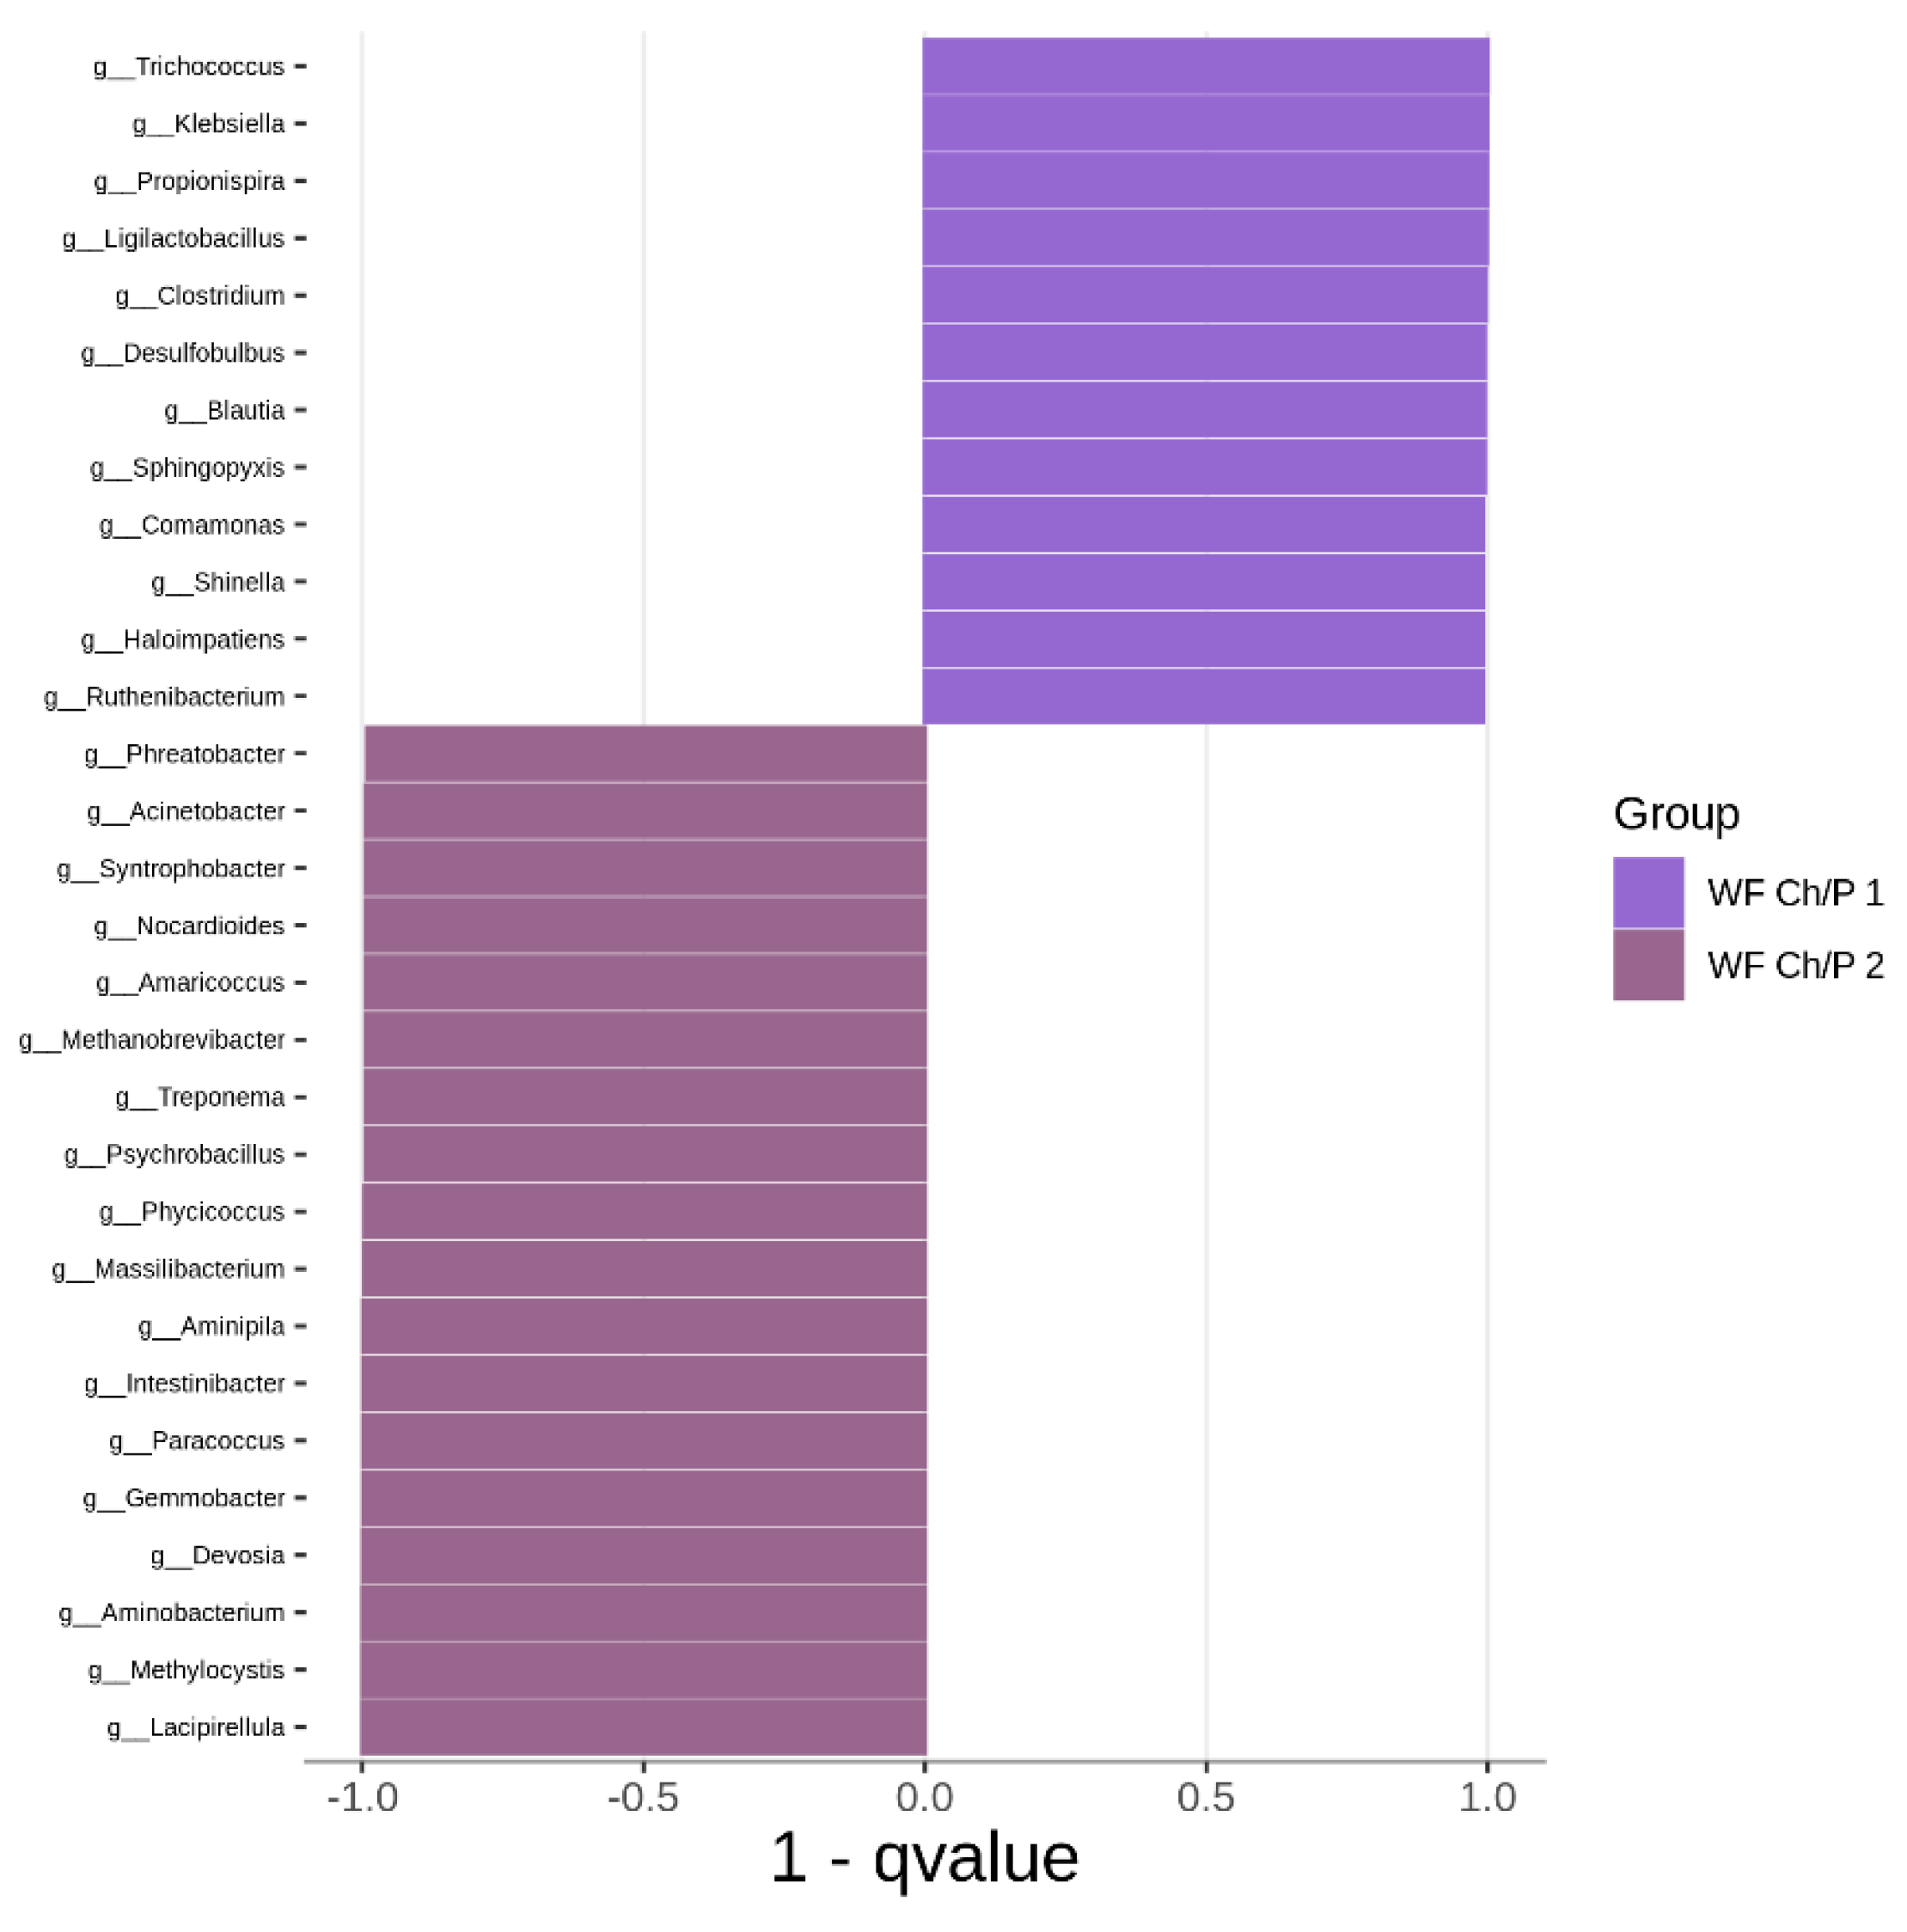
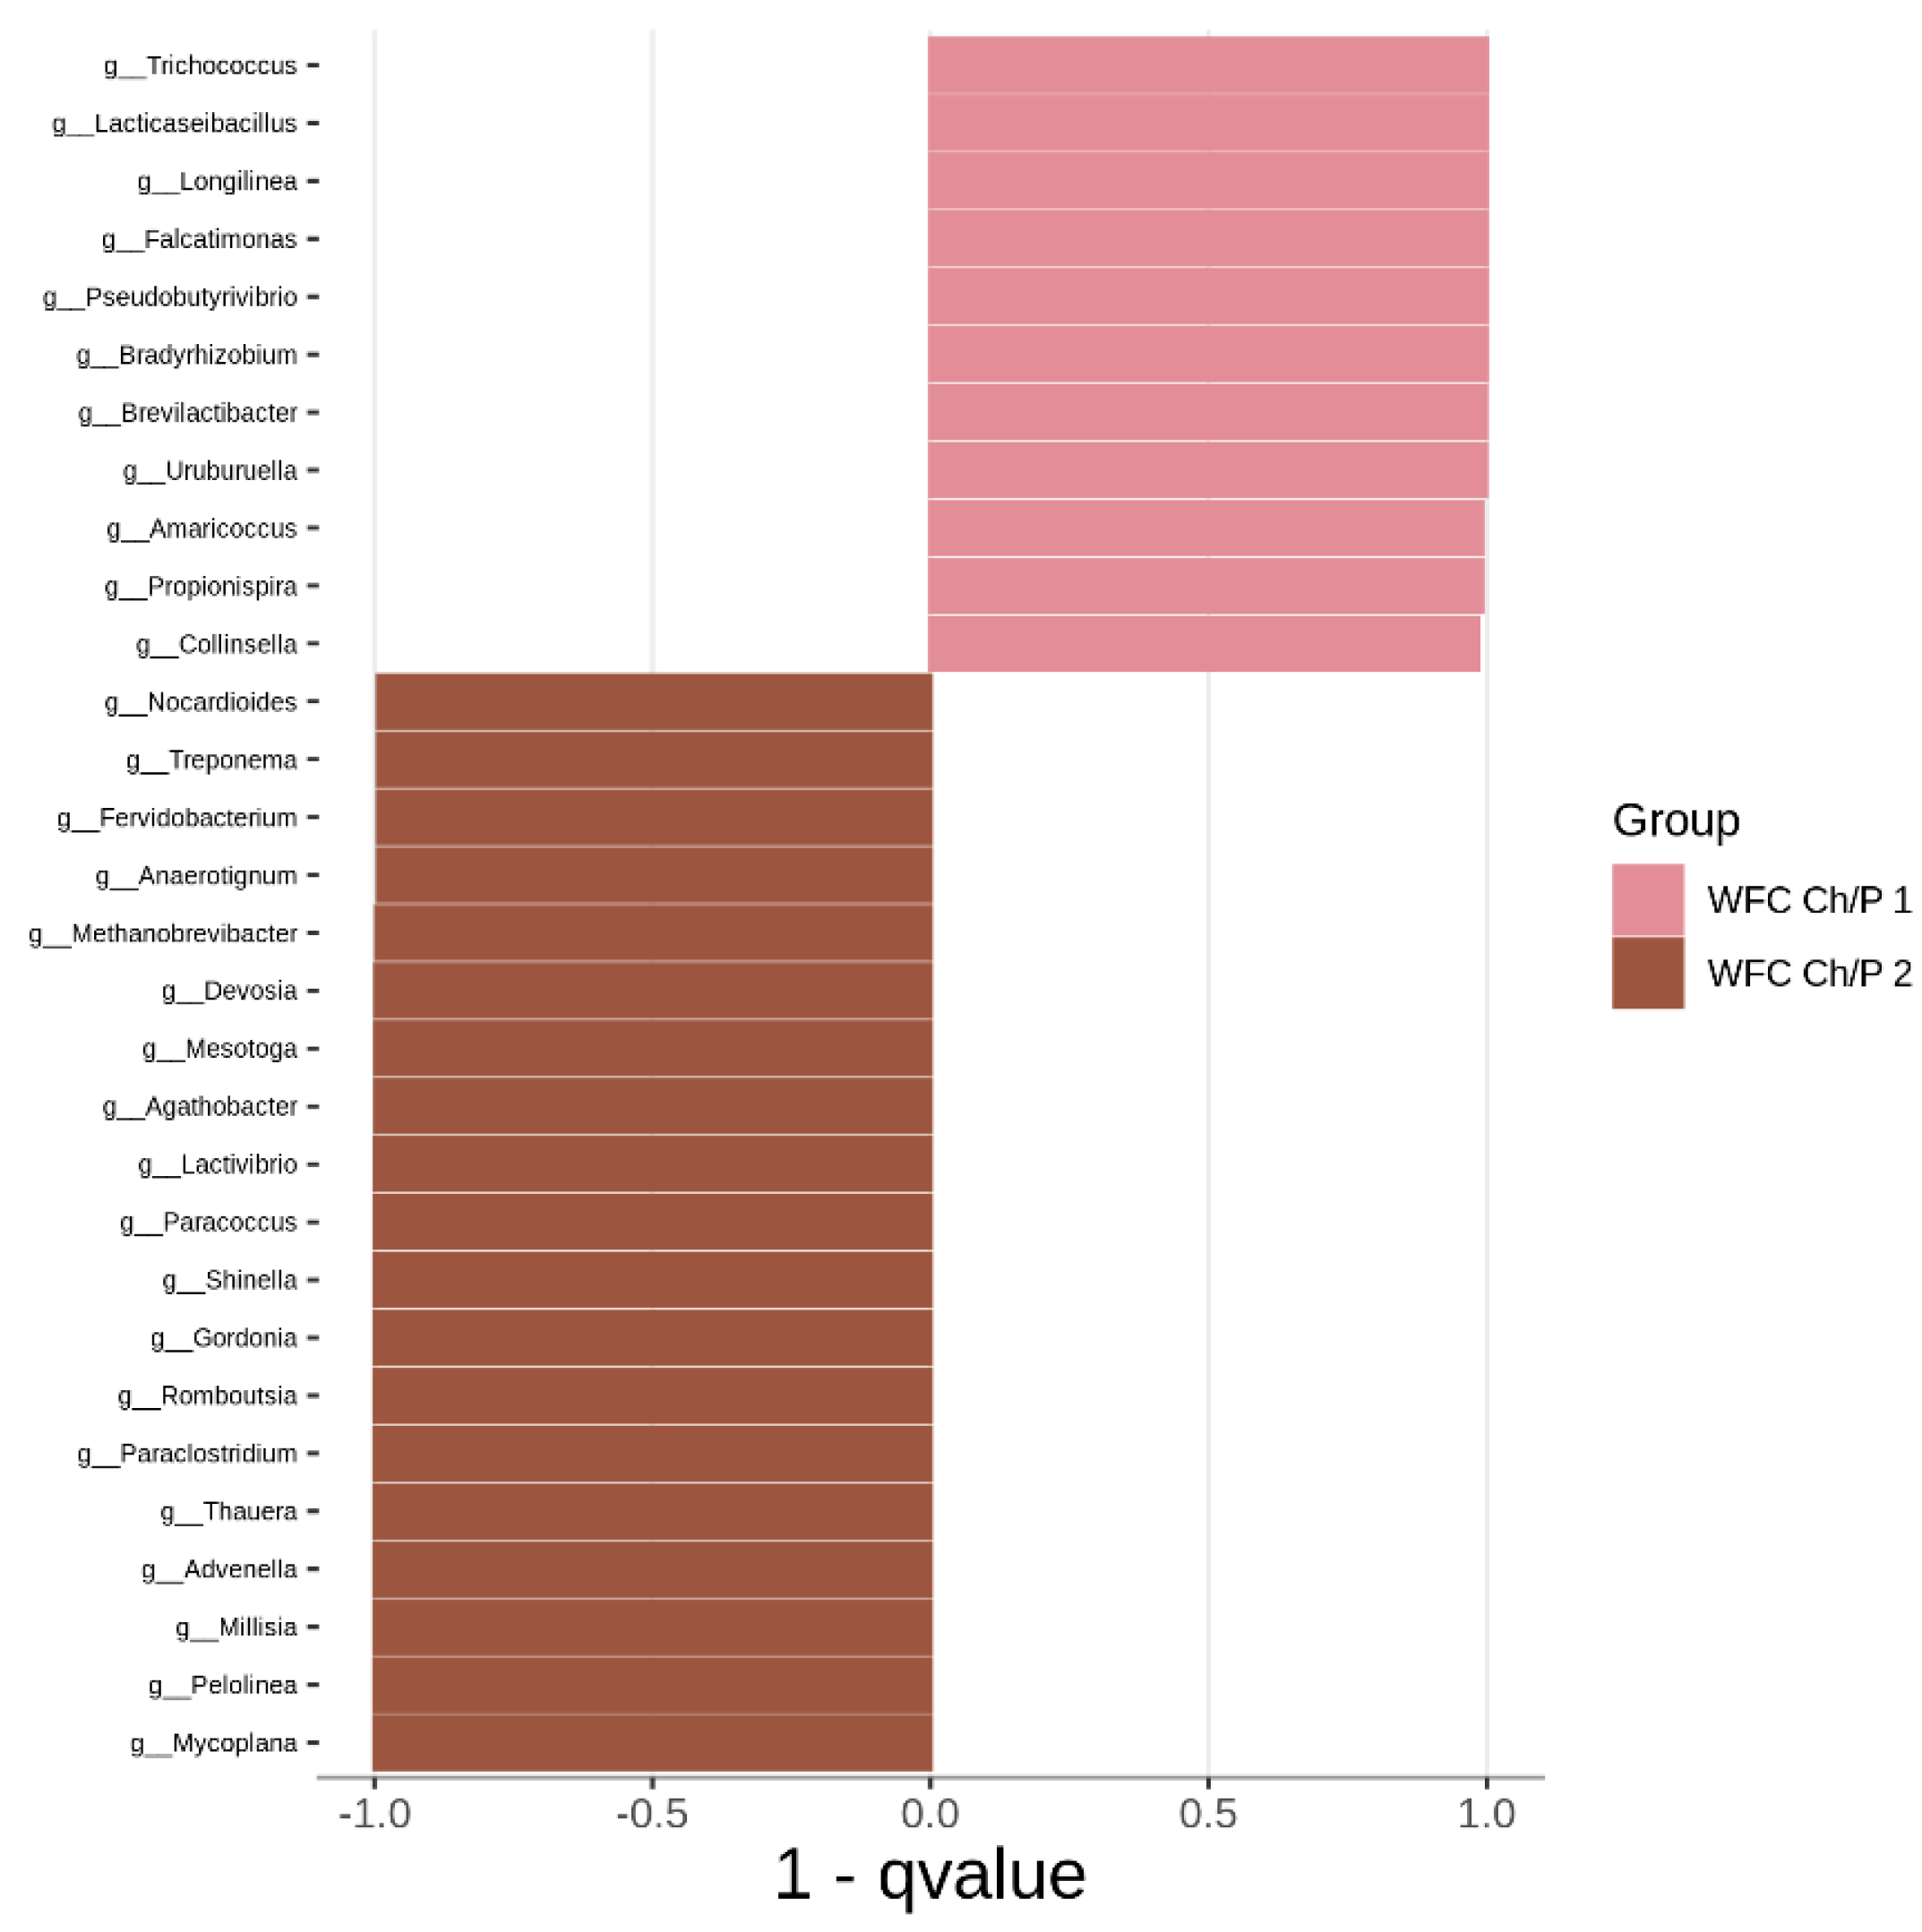

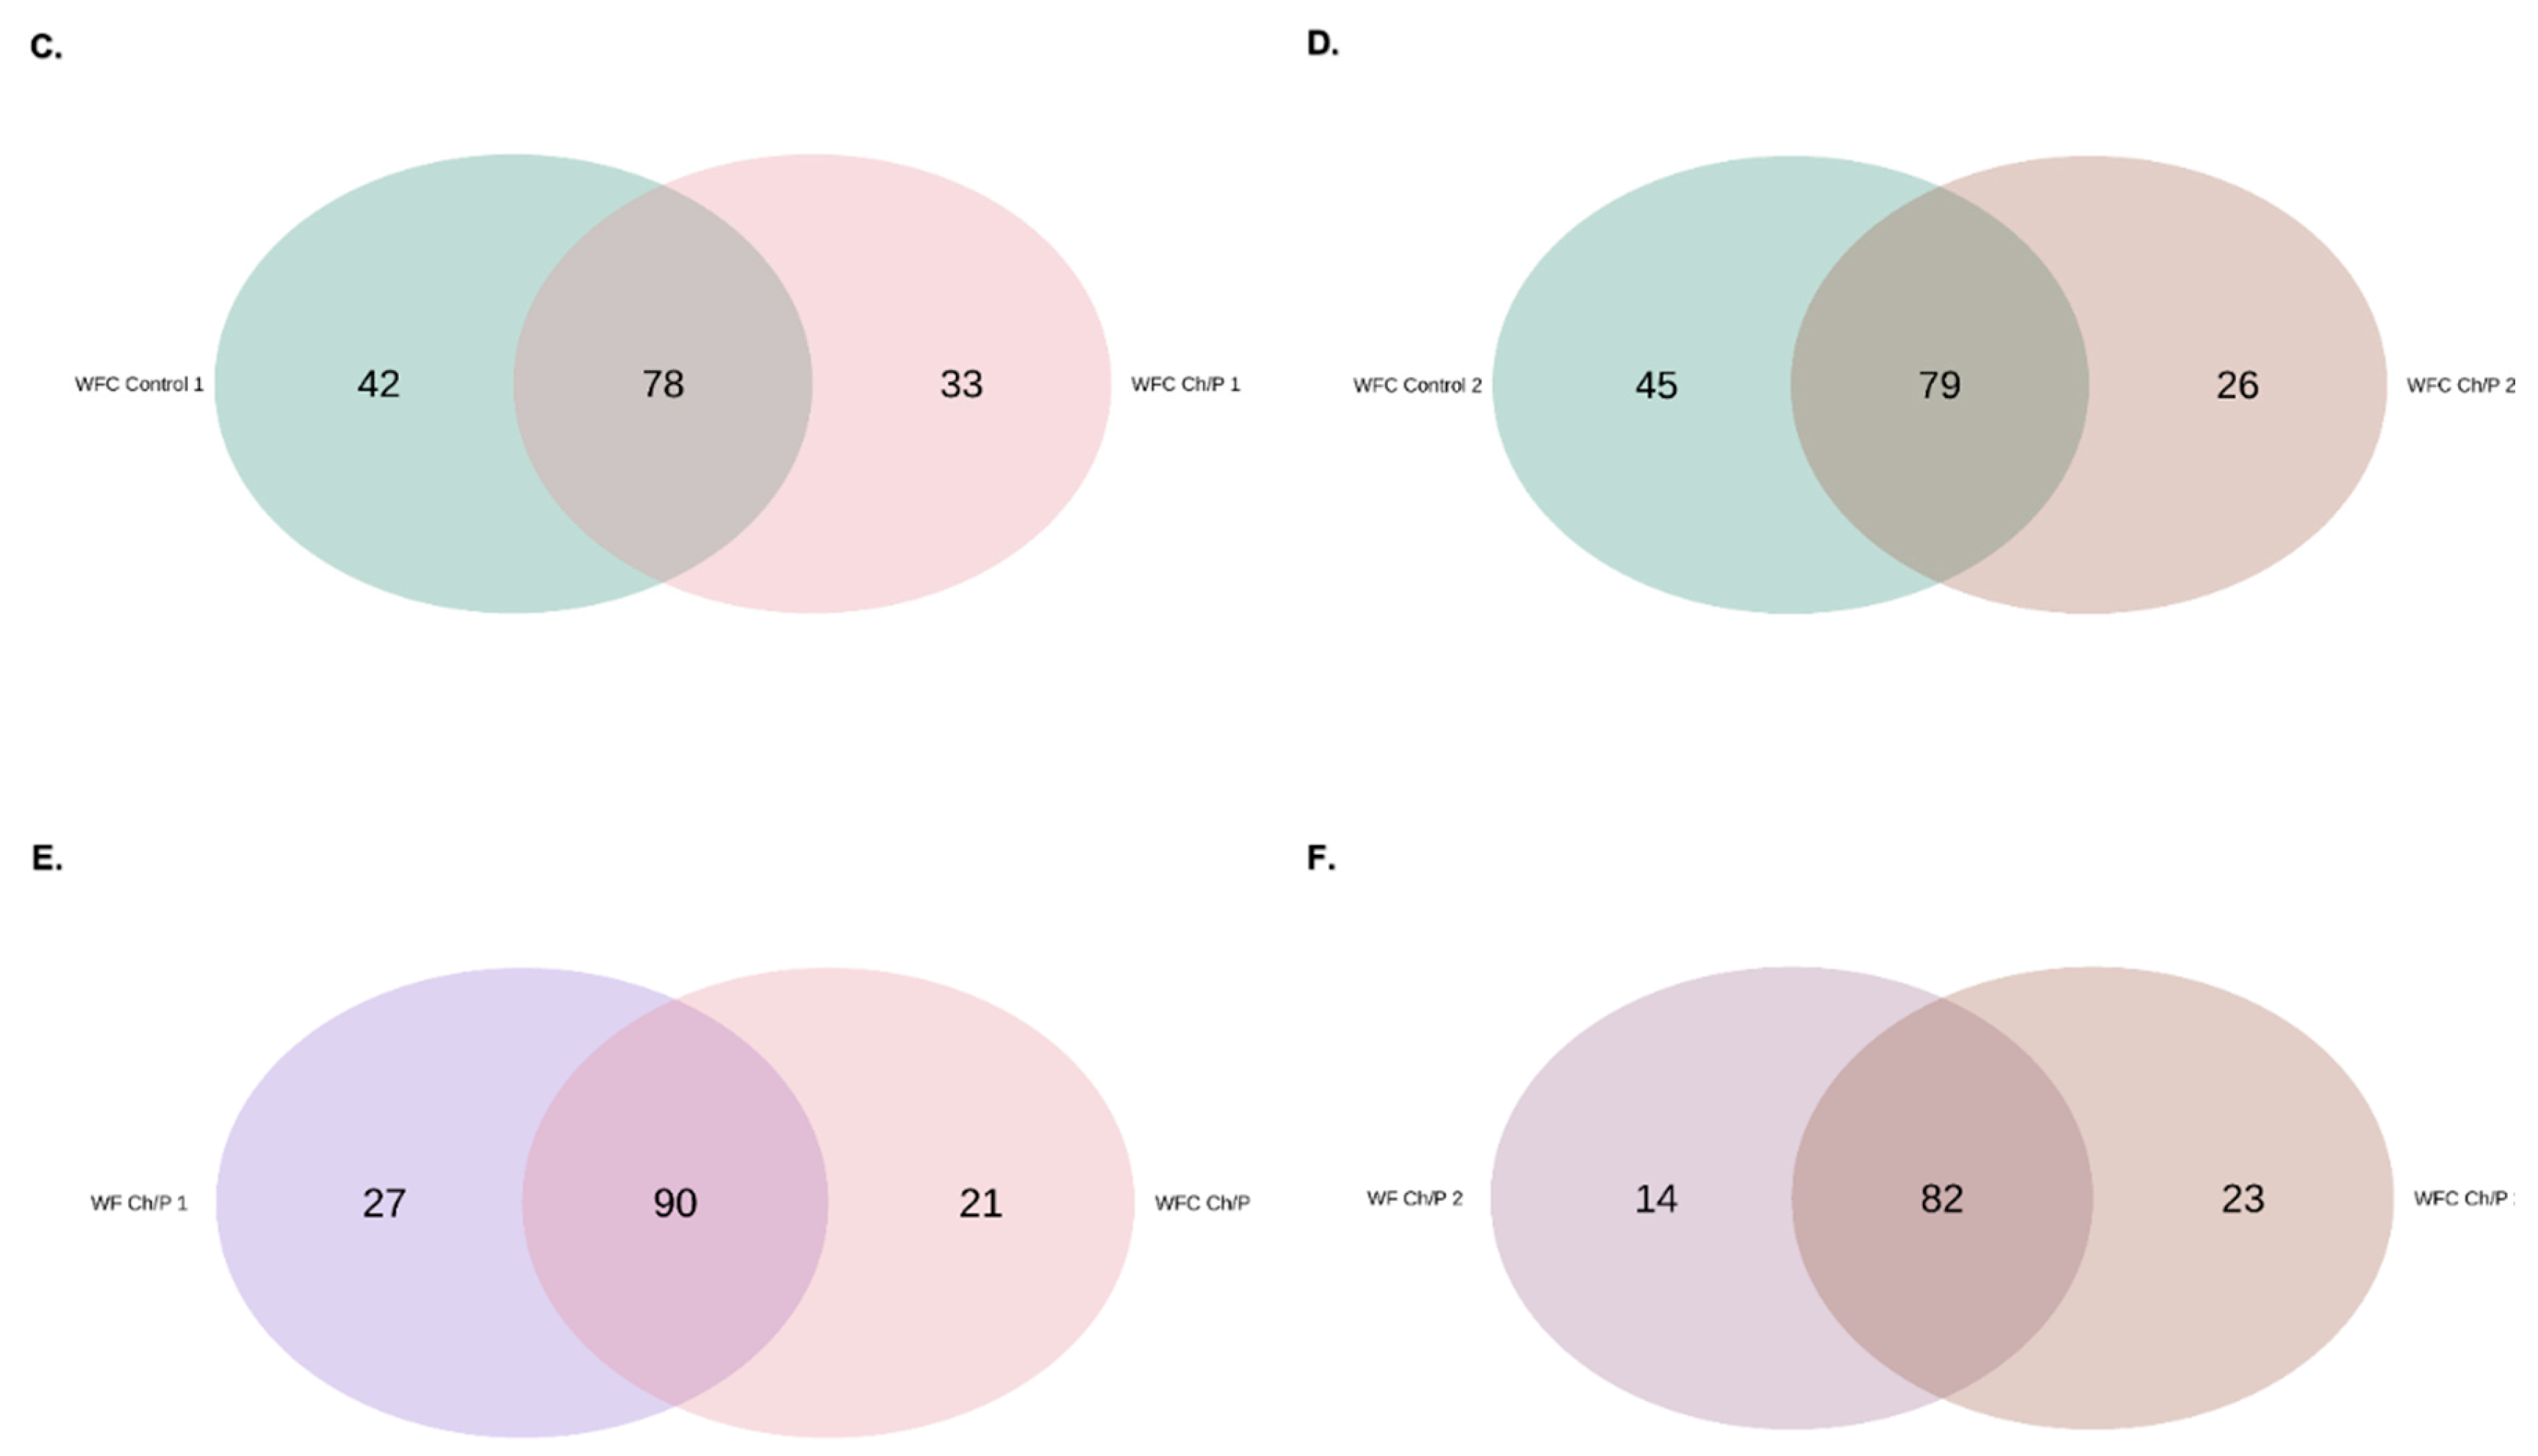
| Materials | pH | Cond. | TS | VS | C/N ratio | C | N | N–NH4+ |
Ptotal |
| ̶ | (mS cm-1) | (wt %) | (wt %TS) | ̶ | (wt %TS) | (wt %TS) | (wt %TS) | (wt %TS) | |
| Wafers | 7.02 | 1.62 | 73.24 | 96.81 | 37.50 | 42.37 | 1.13 | 0.36 | 0.15 |
| Cheese | 4.32 | 72.96 | 34.25 | 92.56 | 3.60 | 45.87 | 12.73 | 0.53 | 1.62 |
| Inoculum | 7.93 | 26.50 | 3.47 | 71.43 | 11.21 | 33.06 | 2.95 | 2.48 | 2.57 |
| Samples |
WF (g) |
CE (g) |
Ch/P (g) |
Inoc. (g) |
pH |
Cond. (mS cm-1) |
TS (%) |
VS (%) |
| WF – control | 9.5 | ̶ | ̶ | 835.5 | 7.16 | 62.95 | 4.08 | 73.46 |
| WF – Ch/P | 9.5 | ̶ | 20.0 | 835.5 | 7.03 | 69.25 | 3.97 | 72.62 |
| WFC – control | 6.5 | 3.0 | ̶ | 833.0 | 6.91 | 77.54 | 4.15 | 69.38 |
| WFC – Ch/P | 6.5 | 3.0 | 20.0 | 833.0 | 6.83 | 78.86 | 4.23 | 68.55 |
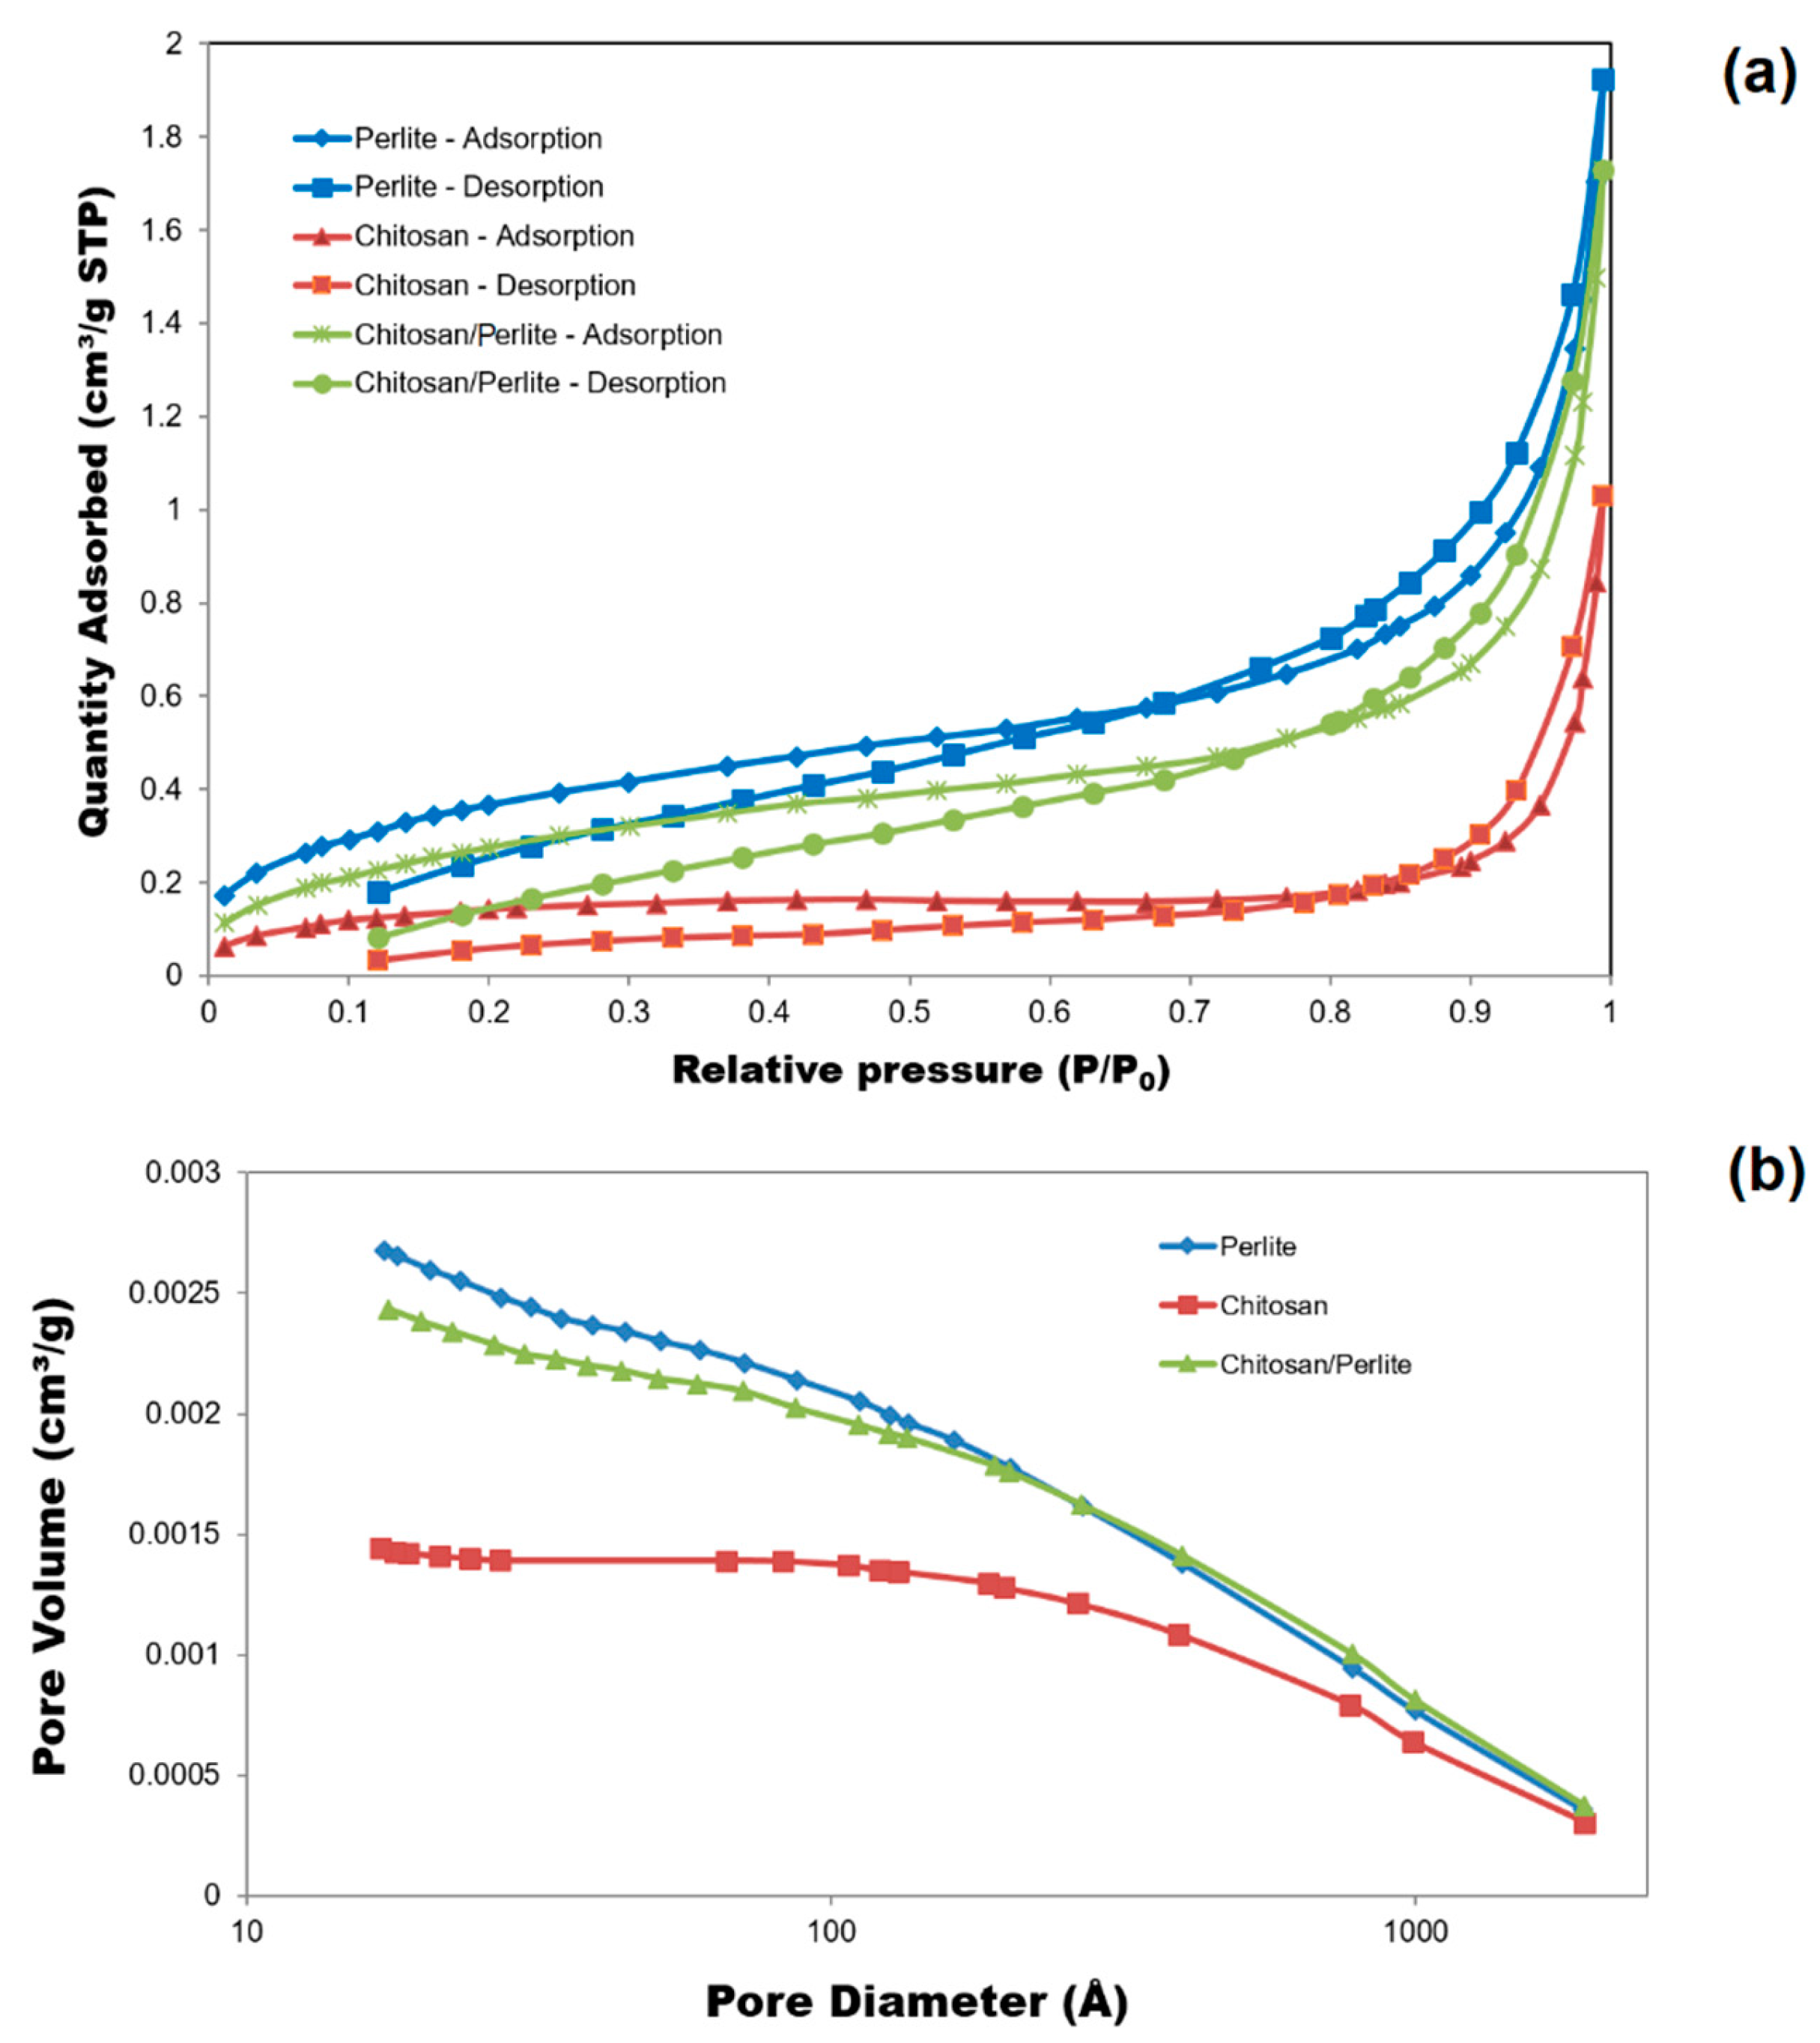
| Materials | ABET (m2/g) | Vp (cm3/g) | Sp (nm) |
|---|---|---|---|
| Chitosan | 0.5061 | 0.001441 | 27.366 |
| Perlite | 1.3730 | 0.002678 | 11.842 |
| Chitosan/Perlite | 1.0746 | 0.002432 | 13.714 |
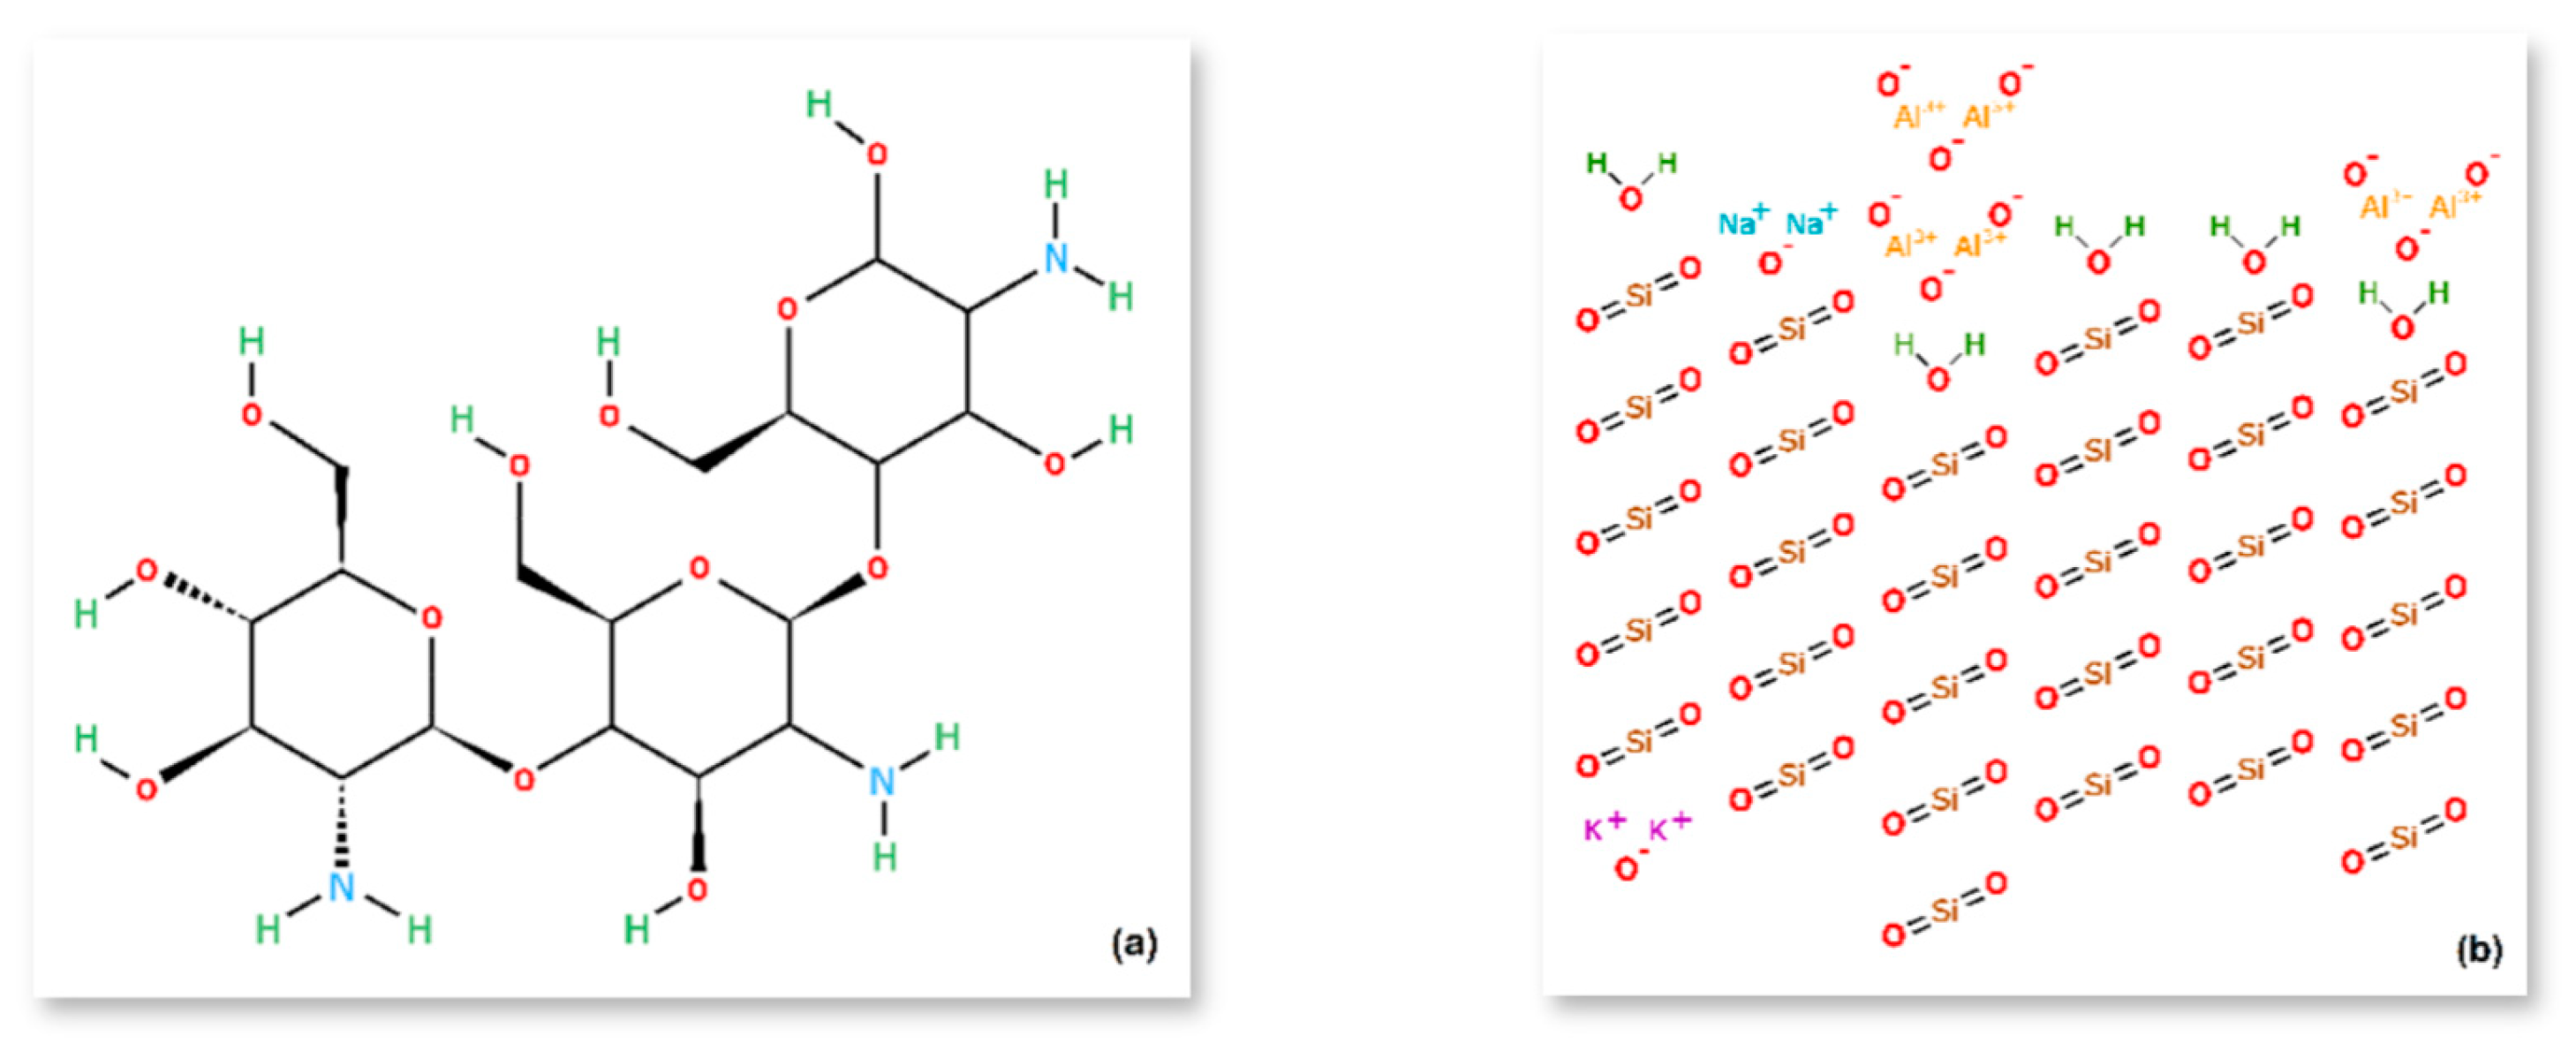
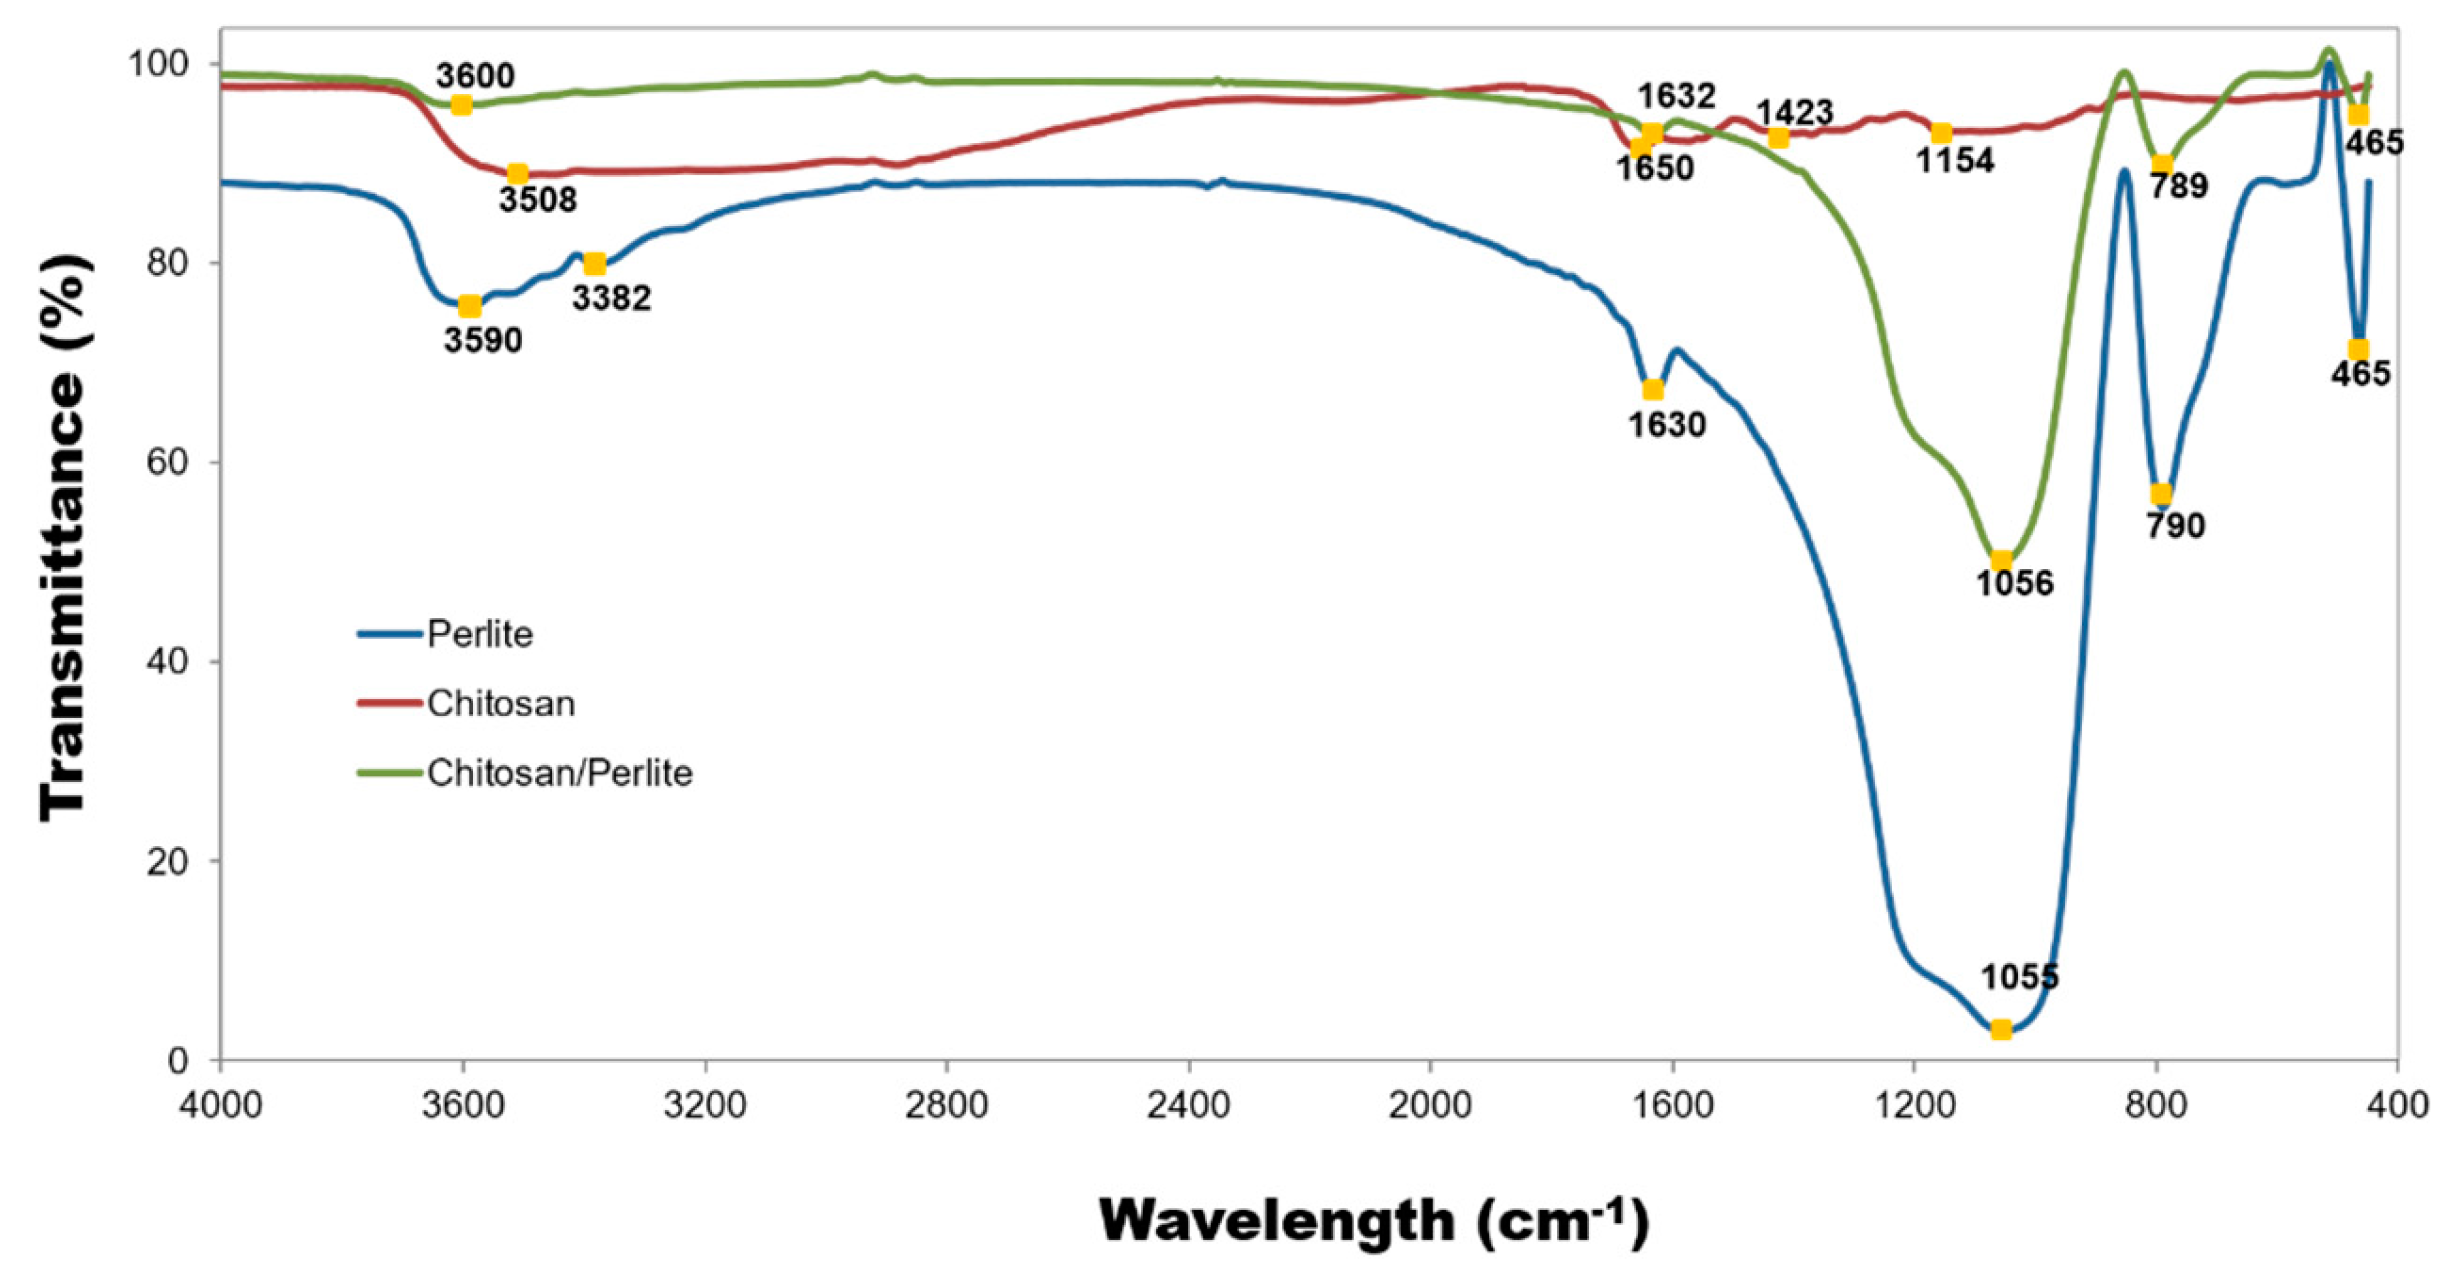
| Elemental content, weight (%) | |||||||||||
| Material | C K | N K | O K | Na K | Al K | Si K | S K | Cl K | K K | Ca K | Fe K |
| Chitosan | 41.10 | 5.22 | 53.55 | – | 0.13 | – | – | – | – | – | – |
| Perlite | 2.14 | – | 48.09 | 2.00 | 7.38 | 34.42 | 0.13 | 0.06 | 4.64 | 0.64 | 0.49 |
| Chitosan/Perlite | 24.43 | 3.56 | 60.66 | 0.79 | 2.27 | 7.20 | – | 0.05 | 0.72 | 0.20 | 0.13 |
| Chao1 | Shannon | Simpson | |
| WF – Control 1 | 140 | 3.773 | 0.956 |
| WF – Ch/P 1 | 117 | 2.994 | 0.88 |
| WF – Control 2 | 111 | 2.923 | 0.855 |
| WF – Ch/P 2 | 96 | 2.932 | 0.849 |
| WFC – Control 1 | 120 | 3.407 | 0.929 |
| WFC – Ch/P 1 | 111 | 3.154 | 0.903 |
| WFC – Control 2 | 124 | 3.36 | 0.926 |
| WFC – Ch/P 2 | 105 | 3.24 | 0.882 |
| Bray-Curtis index | |
| WF – Control 1 vs WF – Ch/P 1 | 0.749 |
| WF – Control 2 vs WF – Ch/P 2 | 0.466 |
| WFC – Control 1 vs WFC – Ch/P 1 | 0.532 |
| WFC – Control 2 vs WFC – Ch/P 2 | 0.468 |
| WF – Ch/P 1 vs WFC – Ch/P 1 | 0.264 |
| WF – Ch/P 2 vs WFC – Ch/P 2 | 0.228 |
| WF – Ch/P 1 vs WF – Ch/P 2 | 0.509 |
| WFC – Ch/P 1 vs WFC – Ch/P 2 | 0.451 |
| Samples | Biogas | Methane | CH4 | |||||||
| (m3 Mg-1 TS) | MU (±) |
(m3 Mg-1VS) | MU (±) |
(m3 Mg-1TS) | MU (±) |
(m3 Mg-1VS) | MU (±) |
(%) | MU (±) |
|
| WF–contr. | 468.19 | 16.68 | 661.13 | 26.15 | 249.08 | 8.80 | 351.72 | 14.03 | 53.2 | 2.2 |
| WF–Ch/P | 524.61 | 18.69 | 740.08 | 29.30 | 291.16 | 10.28 | 411.14 | 16.40 | 55.5 | 2.3 |
| WFC–contr. | 545.21 | 19.42 | 780.42 | 30.86 | 333.12 | 11.76 | 476.84 | 19.02 | 61.1 | 2.5 |
| WFC–Ch/P | 565.18 | 20.13 | 798.27 | 31.57 | 366.80 | 12.95 | 518.08 | 20.67 | 64.9 | 2.7 |
Disclaimer/Publisher’s Note: The statements, opinions and data contained in all publications are solely those of the individual author(s) and contributor(s) and not of MDPI and/or the editor(s). MDPI and/or the editor(s) disclaim responsibility for any injury to people or property resulting from any ideas, methods, instructions or products referred to in the content. |
© 2024 by the authors. Licensee MDPI, Basel, Switzerland. This article is an open access article distributed under the terms and conditions of the Creative Commons Attribution (CC BY) license (http://creativecommons.org/licenses/by/4.0/).


