Preprint
Article

Synthesis of New Complex Ferrite Li0.5MnFe1.5O4, Chemical – Physical and Electrophysical Research

Altmetrics

Downloads

77

Views

34

Comments

0

Submitted:

12 June 2024

Posted:

12 June 2024

You are already at the latest version

Alerts
Abstract
In this article, the sol-gel method was used as a synthesis method, which shows the physico –chemical nature of the synthesis of a new complex material ferrit Li0.5MnFe1.5O4. The synthesized structure and structure were determined by the method of X-ray phase analysis. According to the analysis indicators, it was found that our compound is single-phase, spinel-structured, and syngony - cubic type. The microstructure of the compound and the quantitative composition of the elements contained were analyzed under a scanning electron microscope (SEM). Through a scanning electron microscope, Microsystems were taken from different parts of l Li0.5MnFe1.5O4-type crystallite, the elemental composition of crystals was analyzed, and the general type of surface layer of complex ferrite was shown. As a result, the fact that the compound consists of a single phase, the clarity of its construction was determined by the topography and chemical composition of the compound. As a result, it was found that the newly synthesized complex ferrites correspond to the Formula Li0.5MnFe1.5O4. The particles of the formed compounds have a large size (between 50.0 μm, 20.0 μm and 10.0 μm). Electro physical measurements were carried out on the LCR - 800 unit at intervals of 293-483 K and at frequencies of 1.5 and 10 kHz. The increase in frequency to 10 kHz led to a decrease in the value ε in the range of the studied temperature (293-483 K).
Keywords: 
Subject: Chemistry and Materials Science  -   Materials Science and Technology

1. Introduction

Research in nanotechnology is a fast-growing field at the fore-front of physics and is attracting special interest from the scientific community [1]. Multifunctional materials, in particular, are investigated for their advantageous properties that are combined in one smart compound [2,3]. A broad range of intelli gent materials have been proposed and among them, ferrites have drawn significant attention and are deemed to be promoter hosts due to their extremely prominent features [4,5].
Doped mixed ferrites with impactful features like permeability, magnetic behavior, and magnetic transition at high temperatures are the soft ferrimagnetic compounds, which already mark their presence in the technology field. These materials are significant due to their imprudent magnetization at room environment [6,7].
The extensive use of spinel ferrites is due to their low price, easy fabrication and abundant use in technological and industrial applications [8]. The technological and industrial applications of these magnetic materials is because of their excellent electrical and magnetic properties, which leads to their use in magnetic memory devices, transformers, high frequency applications and electronic devices like cellular phones, video cameras, notebook computers [9].
Many researcher studied the structural, electrical and magnetic properties of various Li based ferrites like Li-Mn [10], Li-Ni [11], Li-Co [12], Li-Mg [13], Li-Cr [14], Li-Zn [15] and Li-Ti [16] prepared by ceramic method. However, Ferrite prepared by a ceramic method involves high calcination temperature synthesis for the completion of solid-state reaction between the constituent oxides or carbonates and the particles are obtained rather bigger and non-uniform in size. These non-uniform particles, on compacting, result in the formation of voids and subsequently the low density ferrites. To overcome these difficulties, the sol-gel method is the preferred method for synthesizing nanoferrit on a volumetric scale by obtaining homogeneous particles and the most convenient method for synthesizing nanoparticles. This is because the simplicity of this method, the low cost precursors, the fact that the annealing process is carried out in a short time, good control of the amount of crystallite and other properties of materials [17].
Nanoscale manganese ferrites exhibit interesting structural and magnetic properties. They have a wide range of applications, from basic research to industrial applications. In this work, the composition of ferrite nanoparticles is studied.

2. Materials and Methods

The sol - gel method was used as an effective way to synthesize a new mixed ferrite of a complex mixed composition. in order to determine the composition of a new complex mixed ferrite obtained by the sol - gel method, an X-ray phase study was carried out, and in order to conduct quantitative and qualitative analysis, an examination under a scanning electron microscope, a study of electrophysical properties (dielectric conductivity and electrical resistance) was carried out.
As a primary raw material, distilled water of the manganese (III) oxide (“chemical pure”) brand, Iron (III) oxide (“chemical pure”) brand and lithium conbanate (“chemical pure”) brand were used. Trihydric alcohol – glycerin and citric acid were used as gel-forming reagents. The raw materials obtained by stoichiometric calculation were weighed on an analytical balance with the highest accuracy of 0.0001 grams, mixed, ground in an agate sieve, placed in an Alund crucible and fired in a muffle furnace at a temperature of 1100ºС.
The resulting dried gel was fired in a muffle oven for 10 hours at a temperature of 600 ºC until a black powder was obtained. Finally, the resulting powder was fired in stages for 7 hours at a temperature of 700-1100 ºC in the air [18].
The pycnometric density of ferrites was determined by the method [19]. Toluene and distilled water were used as indifferent liquids. The density of composite materials was measured 5 times and the average values were calculated.

3. Results

3.1. X-ray Analysis

X-ray analysis was carried out at the Kazakh National Women’s Pedagogical University on the diffractometer Miniflex/600 (Rigaku). Analysis using a sika beam (U=30 KV, J=10 MA, rotation speed 1000 pulses per second, time constant t=5 sec., 2θ with an angle interval between 5 and 900) was carried out on the Miniflex 600 RIGAKU, filtered by a filter.,
During the X-ray observation of the synthesized mixed complex ferrite, it was observed that the amorphous state of the samples decreased, the crystallization process was complete, and the kinetics of the sol-gel reaction was low. In addition, it is proved from the diffractogram shown in Figure 1 below that the samples have changed from the amorphous state to the fully polycrystalline state, and the independent phase has been completely formed.
Below are the results of the Rietveld method of indexing the diffractogram of complex ferrite studied by X-ray analysis.
According to Scherrer’s formula, the average size of crystallites can be written as follows:
d = K λ β cos θ  
where
d - average size of crystals;
K - dimensionless particle shape coefficient (Scherrer constant);
λ - is the wavelength of X-ray radiation;
β - half-height reflex width (2θ in radians and units)
θ - diffraction angle (Bragg angle)
A new complex mixed ferrite synthesized by X-ray phase analysis method has unit number Z = 8, Li0,5MnFe1.5O4 is crystallized in cubic wall - centered cell, and space group is Fd ̅3m. Cell parameters a = 8.3677, b = 8.3677, c = 8.3677. The average size of crystallites according to Scherrer’s formula through the X-ray wavelength of ferrite is 40.6 µm, and the correctness of the results of X-ray studies was confirmed by the coincidence of the values of X-ray and pycnometric densities.

3.2. Scanning Electron Microscope

A study was carried out using a scanning electron microscope (SEM) (APPLICATION Note team, Brooker, Germany) to study the spectrum of distribution of the element, quantitative and qualitative analysis, and the percentage content of emenets.
A scanning electron microscope (SEM) is designed to obtain a magnified image of an object by scanning it with an electron beam directed at it and recording the signal generated by the interaction of electrons with a detector. The small diameter of the probe, even at low accelerating voltages and high currents, allows for elemental analysis of samples with dimensions of the analyzed area of several tens of nanometers. The beam current detector is located on the microscope column below the aperture of the objective lens, so that the beam current can be monitored at any time during the analysis.
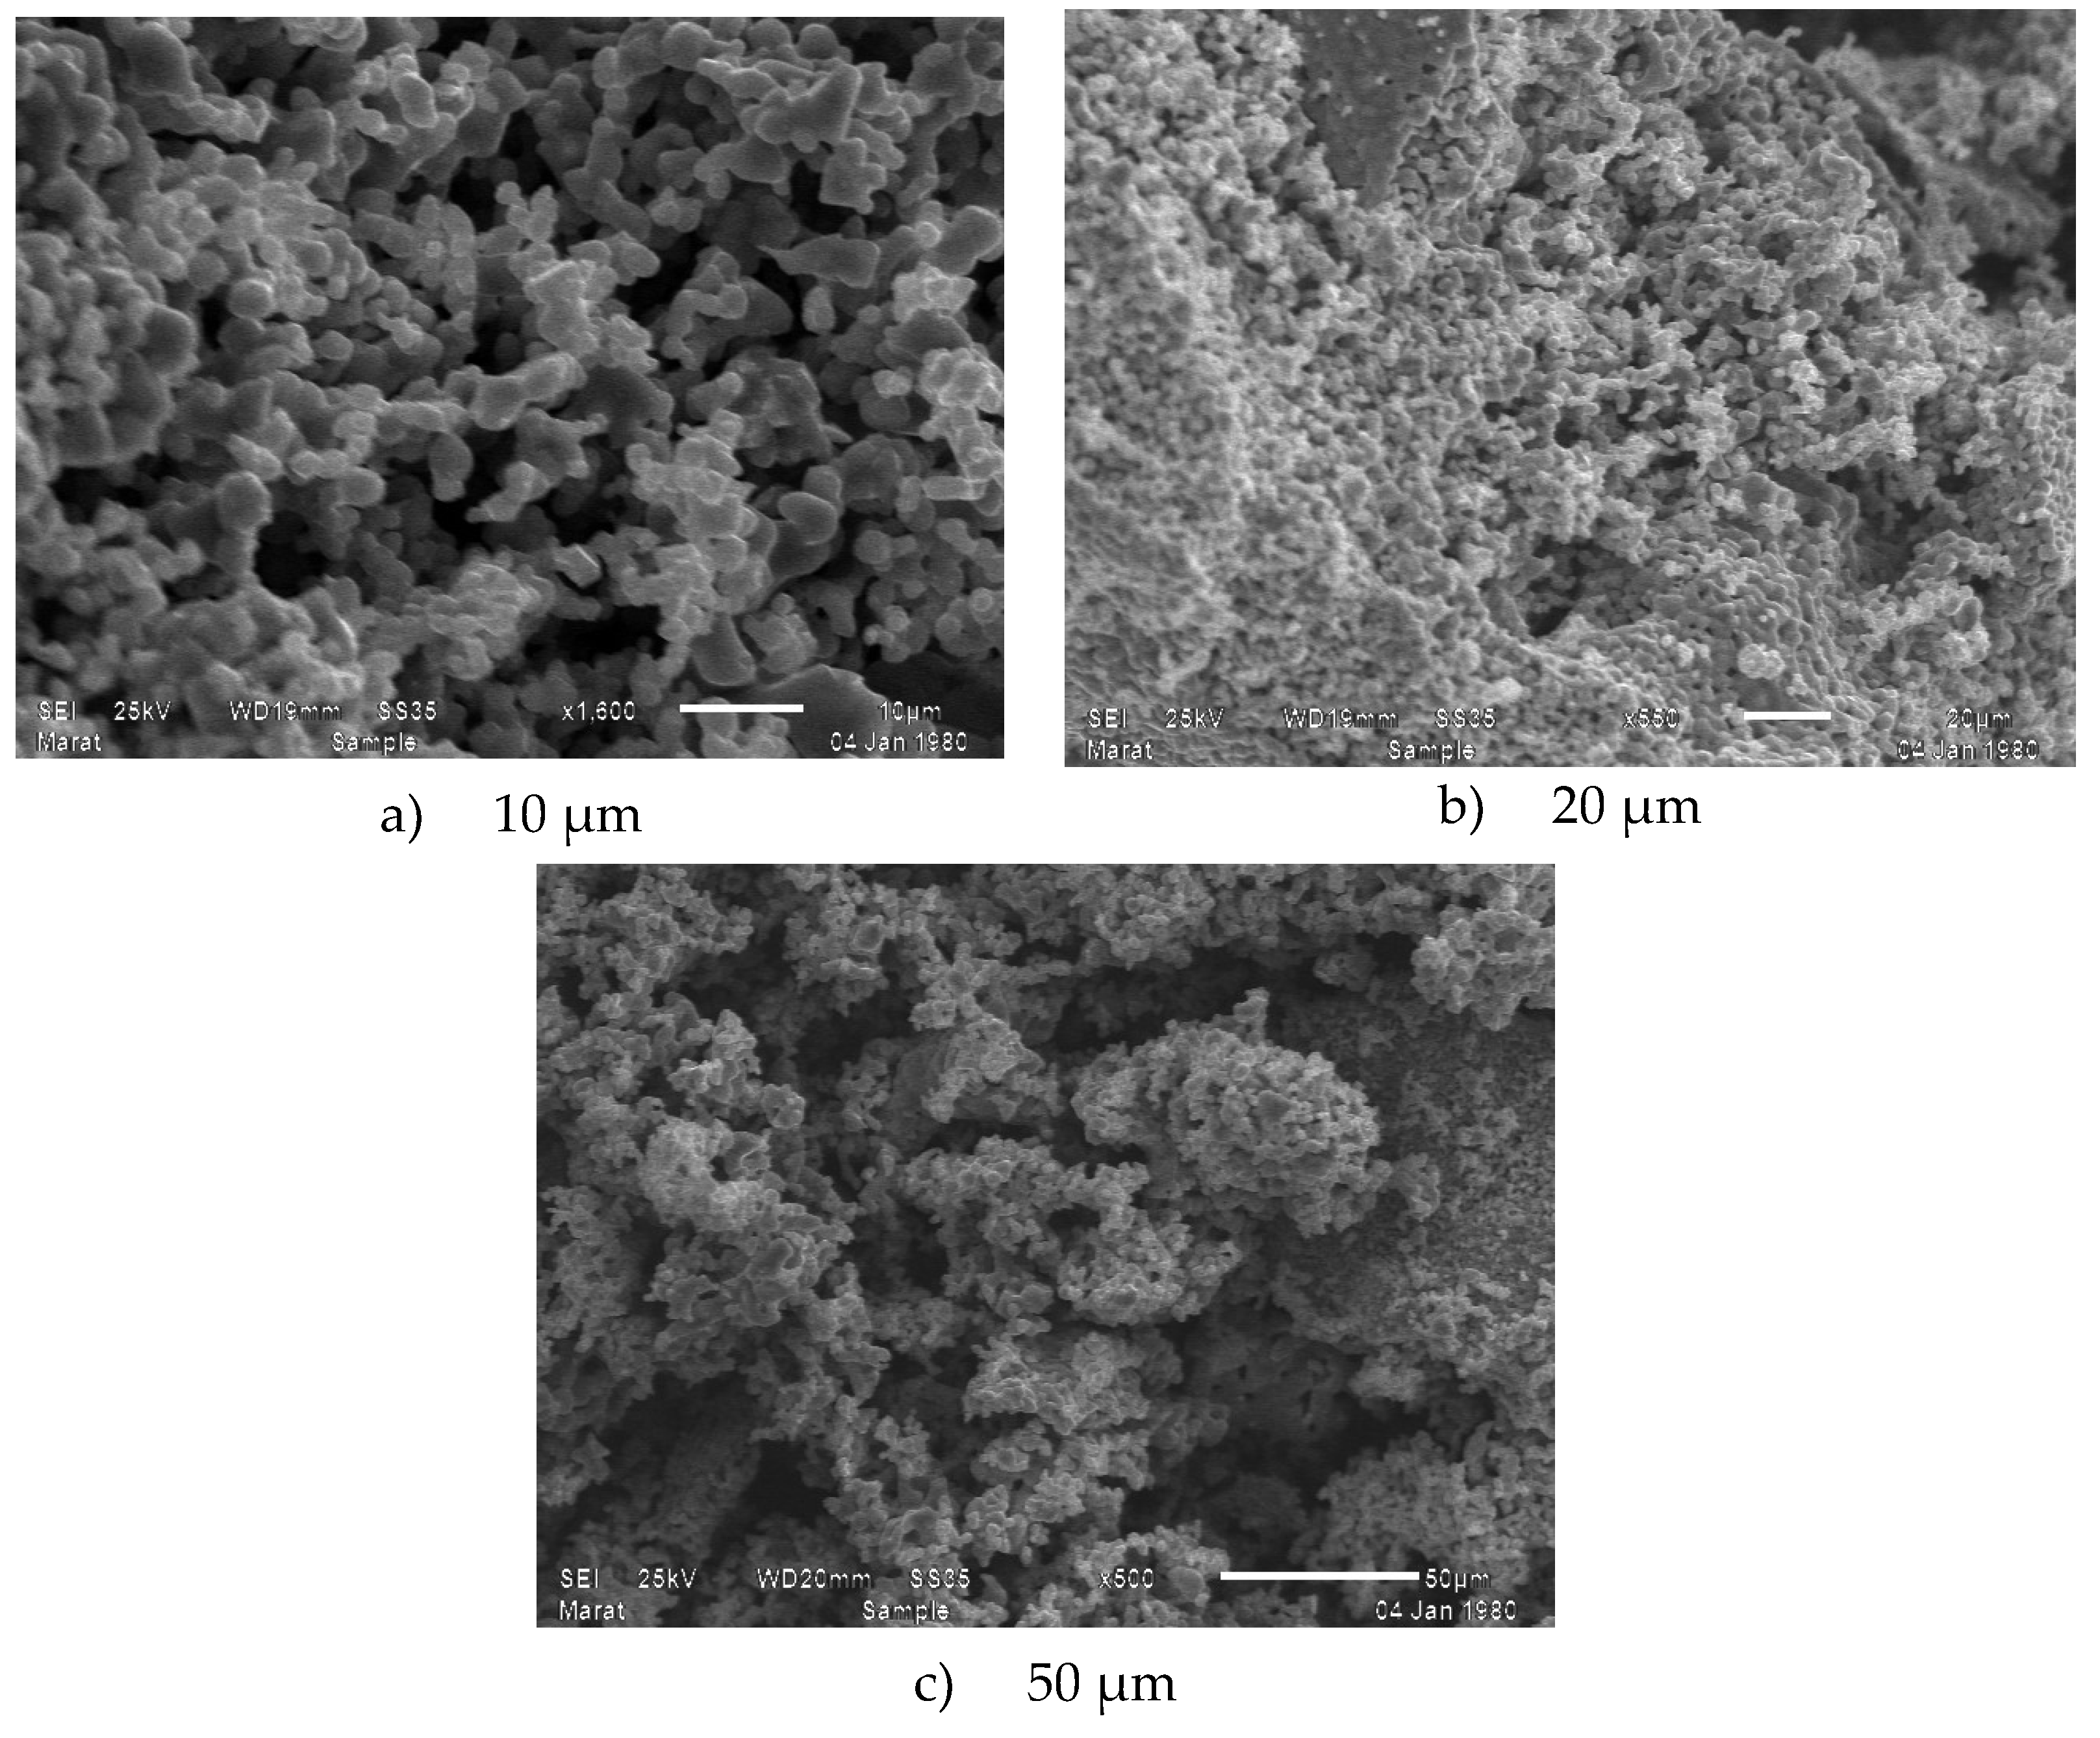
In order to study the morphology of the surface layer of the new complex mixed ferrite samples synthesized by the sol-gel method, a study was carried out using an electron microscope scanning the microstructures of the electric diffraction image. Electron monographs of the compound taken in an imaging electron microscope are given in Figure 2 a), b), c).
The above images show the results of micrographs taken at magnifications of 10.0μm, 20.0μm and 50.0μm, and also show the general appearance of the complex ferrite surface layer. As a result, the compound consists of one phase, the clarity of its structure was determined by the topography and chemical composition of the compound. Figure 3 shows the spectrum patterns of the newly synthesized mixed complex ferrite Li0,5MnFe1.5O4 and the elemental analysis results of the Li0,5MnFe1.5O4 compound.
Based on the distribution map of elements, on the basis of solving the nature of crystallization, the chemical composition with microstructure and distribution zones of chromium, iron, lithium, and oxygen atoms were studied. As a result of the numerical elemental composition study, it can be concluded that iron, chromium, lithium metals, oxygen, carbon atoms are distributed in the 10.0 μm regions (Figure 2 a). In an imaging electron microscope, it is possible to obtain nanoscale measurements of solids in powder form.
To study the spectrum of distribution of the element, quantitative and qualitative analysis, and the percentage content of emenets, a study was carried out using a scanning electron microscope. The spectrum samples of the synthesized new mixed complex Ferrite and the results of elemental analysis are shown in Figure 3.

3.3. Electrophysical Research

Measurements of electrophysical properties were carried out according to the methods [20,21].
The study of electrophysical properties (dielectric constant and electrical resistance) was carried out by measuring the electrical capacity of samples on a serial device LCR-800 (Taiwan) at an operating frequency of 1 kHz continuously in dry air in a thermostatic mode with a holding time at each fixed temperature.
Plane-parallel samples in the form of disks with a diameter of 10 mm and a thickness of 2-6 mm with a binder additive (1,5 %) were pre-manufactured. The pressing was carried out at a pressure of 20 kg/cm2. The resulting discs were fired in a laboratory furnace “SNOL” at 400 ° C for 6 hours. Then they were carefully double-sided sanded.
The dielectric constant was determined from the electrical capacity of the sample at known values of sample thickness and electrode surface area. The Sawyer-Tower scheme was used to obtain the relationship between the electric induction D and the electric field strength E. Visual observation of the D (E hysteresis loop) was carried out on an oscilloscope C1-83 with a voltage divider consisting of a resistance of 6 MOm and 700 kOm and a reference capacitor of 0.15 mcF. The frequency of the generator is 300 Hz. In all temperature studies, the samples were placed in an oven, the temperature was measured by a chromel-alumel thermocouple connected to a voltmeter B2-34 with an error of 0.1 mV. The rate of temperature change is 5 K/min. The value of the dielectric constant at each temperature was determined by the formula:
ε = C C 0
where С 0 = ε 0 S d is the capacitance of the capacitor without the test substance (air).
Calculation of the width of the forbidden zone (ΔE) of the substance under investigation is determined by the formula:
Δ E = 2 k T 1 T 2 0.43 ( T 2 T 1 ) lg R 1 R 2 ,
where k is the Boltzmann constant equal to 8,6173303·10-5 эВ·К-1, R1 is the resistance at T1, R2 is the resistance at T2.
To ensure the reliability of the data obtained, the dielectric constant of a standard substance, barium titanate BaTiO3, was measured at frequencies equal to 1 kHz, 5 kHz and 10 kHz. Table 1 below shows the results of measurements of the electrophysical characteristics of BaTiO3.
As can be seen from the data in Table 1, the values of dielectric constant at 293 K at frequencies of 1 kHz and 5 kHz are in satisfactory agreement with its recommended value of 1400 ± 250. In addition, the observed changes in the electrical conductivity of BaTiO3 at 383 K at all frequencies (1 kHz, 5 kHz and 10 kHz) are also consistent with its transition from the perovskite cubic phase Pm3m to the tetragonal (polar) ferroelectric phase with space group P4mm [26–28].
It should be noted that despite the reduced values of the dielectric constant of BaTiO3 at a frequency of 10 kHz, and at T equal to 293 K, 303 K, 313 K, all values of ε BaTiO3 at all three frequencies (1 kHz, 5 kHz and 10 kHz) in the range 313-483 K have approximately the same values up to 2150, which indicates that that the frequency change does not particularly affect the temperature dependence of the dielectric constant of BaTiO3 in the range 313-483 K.
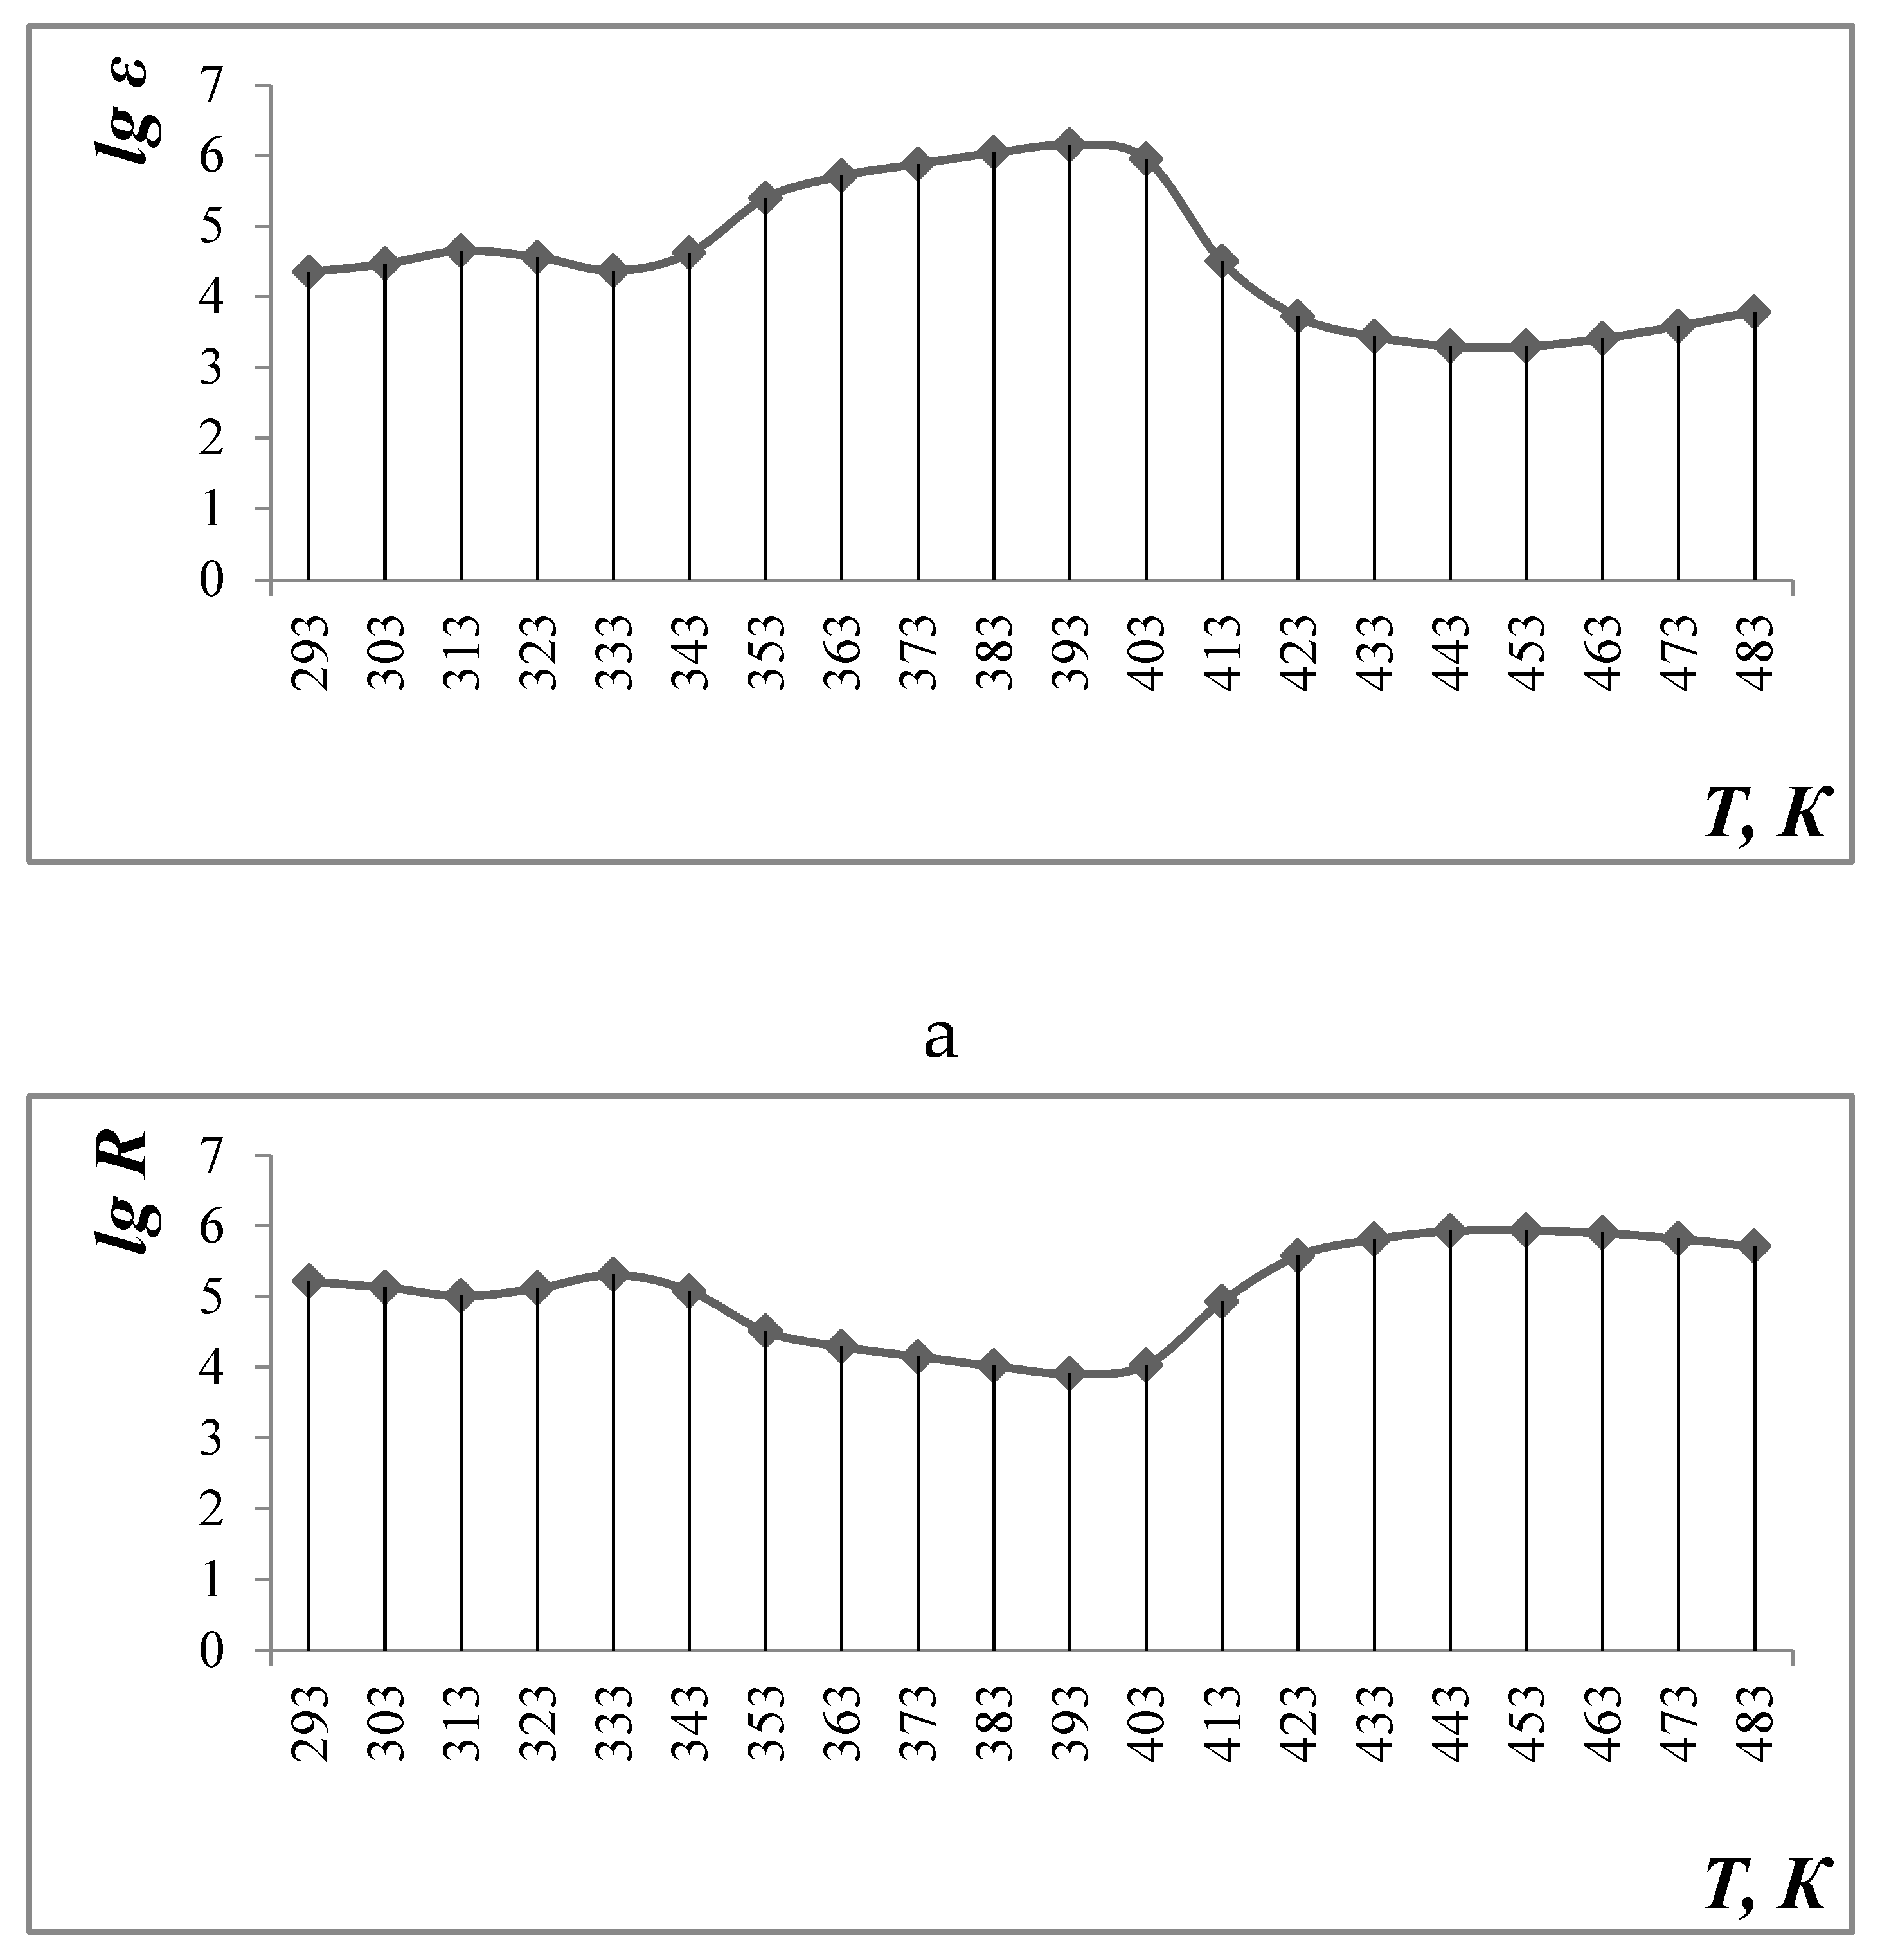
Electrophysical measurements of Li0.5MnFe1.5O4 in the range of 293-483 K and frequencies equal to 1, 5 and 10 kHz were carried out at the LCR installation (Table 3, Figure 4)
The data in Tables 3 and Figure 4 show that the value of the dielectric constant (ɛ) reaches a maximum value at 383 K, equal to 1.43·106 (1 kHz). Then they decrease to 6140 at 483 K (frequency 1 kHz). Increasing the frequency to 5 and 10 kHz leads to a decrease in ɛ in the entire temperature range under study (293-483 K).
The study of the temperature dependence of electrical resistance shows the complex nature of conductivity: at ∆T = 293-313 K – semiconductor, at ∆T = 313-333 K – metallic, at 333-393 K – semiconductor, at ∆T = 393-453 K – metallic and at ∆T = 453-483 K – again semiconductor.
a)
Calculation of the width of the forbidden zone (∆E) in the range 293-313 K:
Т, К lg R
293 5,22
313 5,01
Δ E = 2 × 0,000086173 × 293 × 313 0,43 ( 313 293 ) lg 5,22 5,01 = 1,91   э В
b)
Calculation of the width of the forbidden zone (∆E) in the range 333-393 K:
Т, К lg R
333 5,31
393 3,91
Δ E = 2 × 0,000086173 × 333 × 393 0,43 ( 393 333 ) lg 5,31 3,91 = 1,19   э В
c)
Calculation of the width of the forbidden zone (∆E) in the range 453-483 K:
Т, К lg R
453 5,94
483 5,71
Δ E = 2 × 0,000086173 × 453 × 483 0,43 ( 483 453 ) lg 5,94 5,71 = 3,04   э В
The band gap of the material 2 at ∆T = 293-313 K and 333-393 K are equal to 1.91 and 1.19 eV, respectively (narrow-band semiconductor), and at ∆T = 453-483 K is equal to 3.04 eV (wide-band semiconductor).

4. Conclusions

Summing up the results of the study, a new mixed complex ferrite with the composition Li0.5MnFe1.5O4 was synthesized for the first time by the Sol – gel method. In order to determine the composition of the resulting new complex mixed ferrite, an X-ray phase study was carried out, and in order to conduct quantitative and qualitative analysis, an examination under a scanning electron microscope, a study of electrophysical properties (dielectric conductivity and electrical resistance) was carried out.
For the first time, syngony types and parameters of elementary cells of a complex mixed Ferriter synthesized by the method of X-rayophase analysis were determined. Li0.5MnFe1.5O4 (cubic, a=8.3677(9), B= 8.3677(9), C=8.3677(9) Å , Z=8, denX-ray = 4.678 g/cm3, denPycno = 4.675 g/cm3); through the X-ray wavelength of Ferrite, the average size of crystallites according to Scherrer’s formula is 40.6 µm. The results of radiographic research showed that the synthesized compound is polycrystalline. The accuracy of crystallochemical data is evidenced by a satisfactory correspondence of X-ray and pycnometric densities.
Through a scanning electron microscope, Microsystems were taken from different parts of Li0.5MnFe1.5O4 type crystallite, the elemental composition of crystals was analyzed, and the general type of surface layer of complex ferrite was shown. As a result, the fact that the compound consists of a single phase, the clarity of its construction was determined by the topography and chemical composition of the compound. As a result, it was found that the newly synthesized complex ferrites correspond to the formula Li0.5MnFe1.5O4. The particles of the formed compounds have a large size (between 50.0 µm, 20.0 µm and 10.0 µm). The results of the elemental analysis were presented in the form of a table.
Electrophysical measurements of Li0.5MnFe1.5O4 on the LCR - 800 unit were carried out at intervals of 293-483 K and frequencies of 1.5 and 10 kHz.
The fact that 293 K is equal to a relatively high value of 2.69*105 at 1 kHz, the maximum value of 383 K reached 1.43*106. Next, they are reduced to 6140 at 483 K (frequency of 1 kHz). An increase in frequency to 5 and 10 kHz leads to a decrease in the entire test temperature interval (293-483 K).
The study of the dependence of electrical resistance on temperature shows the complex nature of conductivity: t = 293-313 K-semiconductor, t = 313-333 K – Metal, 333-393 K-semiconductor, t = 393-453 K-Metal and T = 453-483 K – semiconductor again.

Supplementary Materials

The following supporting information can be downloaded at the website of this paper posted on Preprints.org.

Funding

Please add: This research received no external funding.

Institutional Review Board Statement

Not applicable.

Informed Consent Statement

Not applicable.

Data Availability Statement

Data is contained within the article.

Conflicts of Interest

The authors declare no conflict of interest

References

  1. Hossain, M.D., Jamil, A. T. M. K., Hossain, M. S., Ahmed, S. J., Das, H. N., Rashid, R., Khan, M. N. I. Investigation on structure, thermodynamic and multifunctional properties of Ni–Zn–Co ferrite for Gd3+ substitution. RSC Adv., 2022. 12, 4656. [CrossRef]
  2. Gonçalves, J. M., Silva, M. N., Naik, K. K., Martins, P. R., Rocha, D. P., Nossol, E., Rout, C. S. Multifunctional spinel MnCo2O4 based materials for energy storage and conversion: a review on emerging trends, recent developments and future perspectives. J. Mater. Chem.,2021, 9, 3095. [CrossRef]
  3. Yao, C., Ismail, M., Hao, A., Thatikonda, S. K., Huang, W., Qin, N., Bao, D. Annealing atmosphere effect on the resistive switching and magnetic properties of spinel Co3O4 thin films prepared by a sol–gel technique. RSC Adv., 2019, 9, 12615. [CrossRef]
  4. Chandel, M., Moitra, D., Makkar, P., Sinha, H., Hora, H. S., Ghosh, N. N. Synthesis of multifunctional CuFe2O4–reduced graphene oxide nanocomposite: an efficient magnetically separable catalyst as well as high performance supercapacitor and first-principles calculations of its electronic structures. RSC Adv., 2018, 8, 27725. [CrossRef]
  5. Li, Z., Wang, Z. L., Wang, Z. In situ tuning of crystallization pathways by electron beam irradiation and heating in amorphous bismuth ferrite films. RSC Adv., 2018, 8, 23522. [CrossRef]
  6. Nilar, L., Fauzi, M.A.N., Sreekantan, S., Othman, R. Physical and electromagnetic properties of nanosized Gd substituted Mg–Mn ferrites by solution combustion method. PhysicaB. 2015 461, 134, . [CrossRef]
  7. XiuBo, X., Wang, B., Wang, Y., Ni, C., Sun, X., Du, W. Spinel structured MFe2O4 (M = Fe, Co, Ni, Mn, Zn) and their composites for microwave absorption: A review. Chem. Engg. Journ. 2022, 428 , 131160, . [CrossRef]
  8. Ahmad, I., Farid, M.T. Characterization of cobalt based spinel ferrites with small substitution of gadolinium. World Appl. Sci. J. 2012. 19, 464. [CrossRef]
  9. Fu, Y.P., Lin, C.H., Liu, C.W. Preparation and magnetic properties of Ni0.25Cu0.25Zn0.5 ferrite from microwave-induced combustion. J. Magn. Magn. Mater. 2004. 283, 59. [CrossRef]
  10. Ravinder, D., Balachander, L., Venudhar, Y. C. Electrical conductivity in manganese-substituted lithium ferrites. Mater. Lett. 2001. 49, 267. [CrossRef]
  11. Trivedi, U. N., Jani, K. H., Modi, K. B., Joshi, H. H. Study of cation distribution in lithium doped nickel ferrite. J. Mater. Sci. Lett. 2000. 19, 1271.
  12. Abo El Ata, A. M., Attia, S. M., El Kony, D., Al-Hammadi, A. H. Spectral, initial magnetic permeability and transport studies of Li0.5−0.5xCoxFe2.5−0.5xO4 spinel ferrite. J. Magn. Magn. Mater. 2005. 295, 28. [CrossRef]
  13. Ravinder, D., Reddy, P. V. B. Thermoelectric power studies of polycrystalline magnesium substituted lithium ferrites. J. Magn. Magn. Mater. 2003. 263, 127. [CrossRef]
  14. Laishram, R., Prakash, C. Magnetic properties of Cr3+ substituted Li–Sb ferrites. J. Magn. Magn. Mater. 2006. 305, 35. [CrossRef]
  15. Sattar, A.A., El-Sayed, H.M., Agami, W.R., Ghani, A.A. Magnetic properties and electrical resistivity of Zr4+ substituted Li-Zn ferrite. Am. J. Appl. Sci. 2007. 4 (2) 89. 16.
  16. Surzhikov, P., Pritulov, A. M., Ivanov, Yu F., Shabardin, R. S., Usmanov, R. U. Electron-Microscopic Study of Morphology and Phase Composition of Lithium-Titanium Ferrites. Russ. Phys. J. 2001. 44 (4) 420.
  17. Mataev, M.М., Madiyarova, A.M., Patrin , G.S., Abduraimova, М.R., Nurbekova, M.A., Tursunova, Zh.I. Synthesis and physico – chemical characteristics of complex ferrite CrNaFe2O5. Chem. J. Kaz., 2024, 1(85), 109-118. [CrossRef]
  18. Mataev, M.M., Mustafin, E. S., Kasenov, R. Z., Pudov, A. M., Kaikenov, D. A., Bogzhanova, Zh. K. X ray Diffraction Study of the YbMIIFe5O12 (MII = Mg, Ca, Sr) Ferrites. Inorganic Materials, 2014, Vol. 50, No. 6, pp. 622–624. [CrossRef]
  19. Mataev, M. M, Abdraimova, M.R., Saxena, S.X., Nuketaeva, D.Zh., Zheksembieva, B.T. Syntesis and X-Ray analysis of complex ferrites. Key Engineering Materials, -2017,-Vol.744? pp 393-398.
  20. Okazaki, K. Technology of ceramic dielectrics. − M.: Energiya, 1976. – 256 p.
  21. Kasenov, B.K.; Kasenova, S.B.; Sagintaeva, Z.I.; Baisanov, S.; Lu, N.Y.; Nukhuly, A.; Kuanyshbekov, E.E. Heat Capacity and Thermodynamic Functions of Titanium-Manganites of Lanthanum, Lithium and Sodium of LaLi2TiMnO6 and LaNa2TiMnO6. Molecules 2023, 28, 5194. [CrossRef]
  22. Fesenko, E.G. The perovskite family and ferroelectricity. M.: Atomizdat, 1972.
  23. Venevtsev, Yu.N., Politova, E.D., Ivanov, S.A. Ferroelectric and antisegnetoelectrics of the barium titanate family. Moscow: Chemistry, 1985.
  24. Lines, M., Glass, A. Ferroelectrics and related materials. Moscow: Mir, 1981.
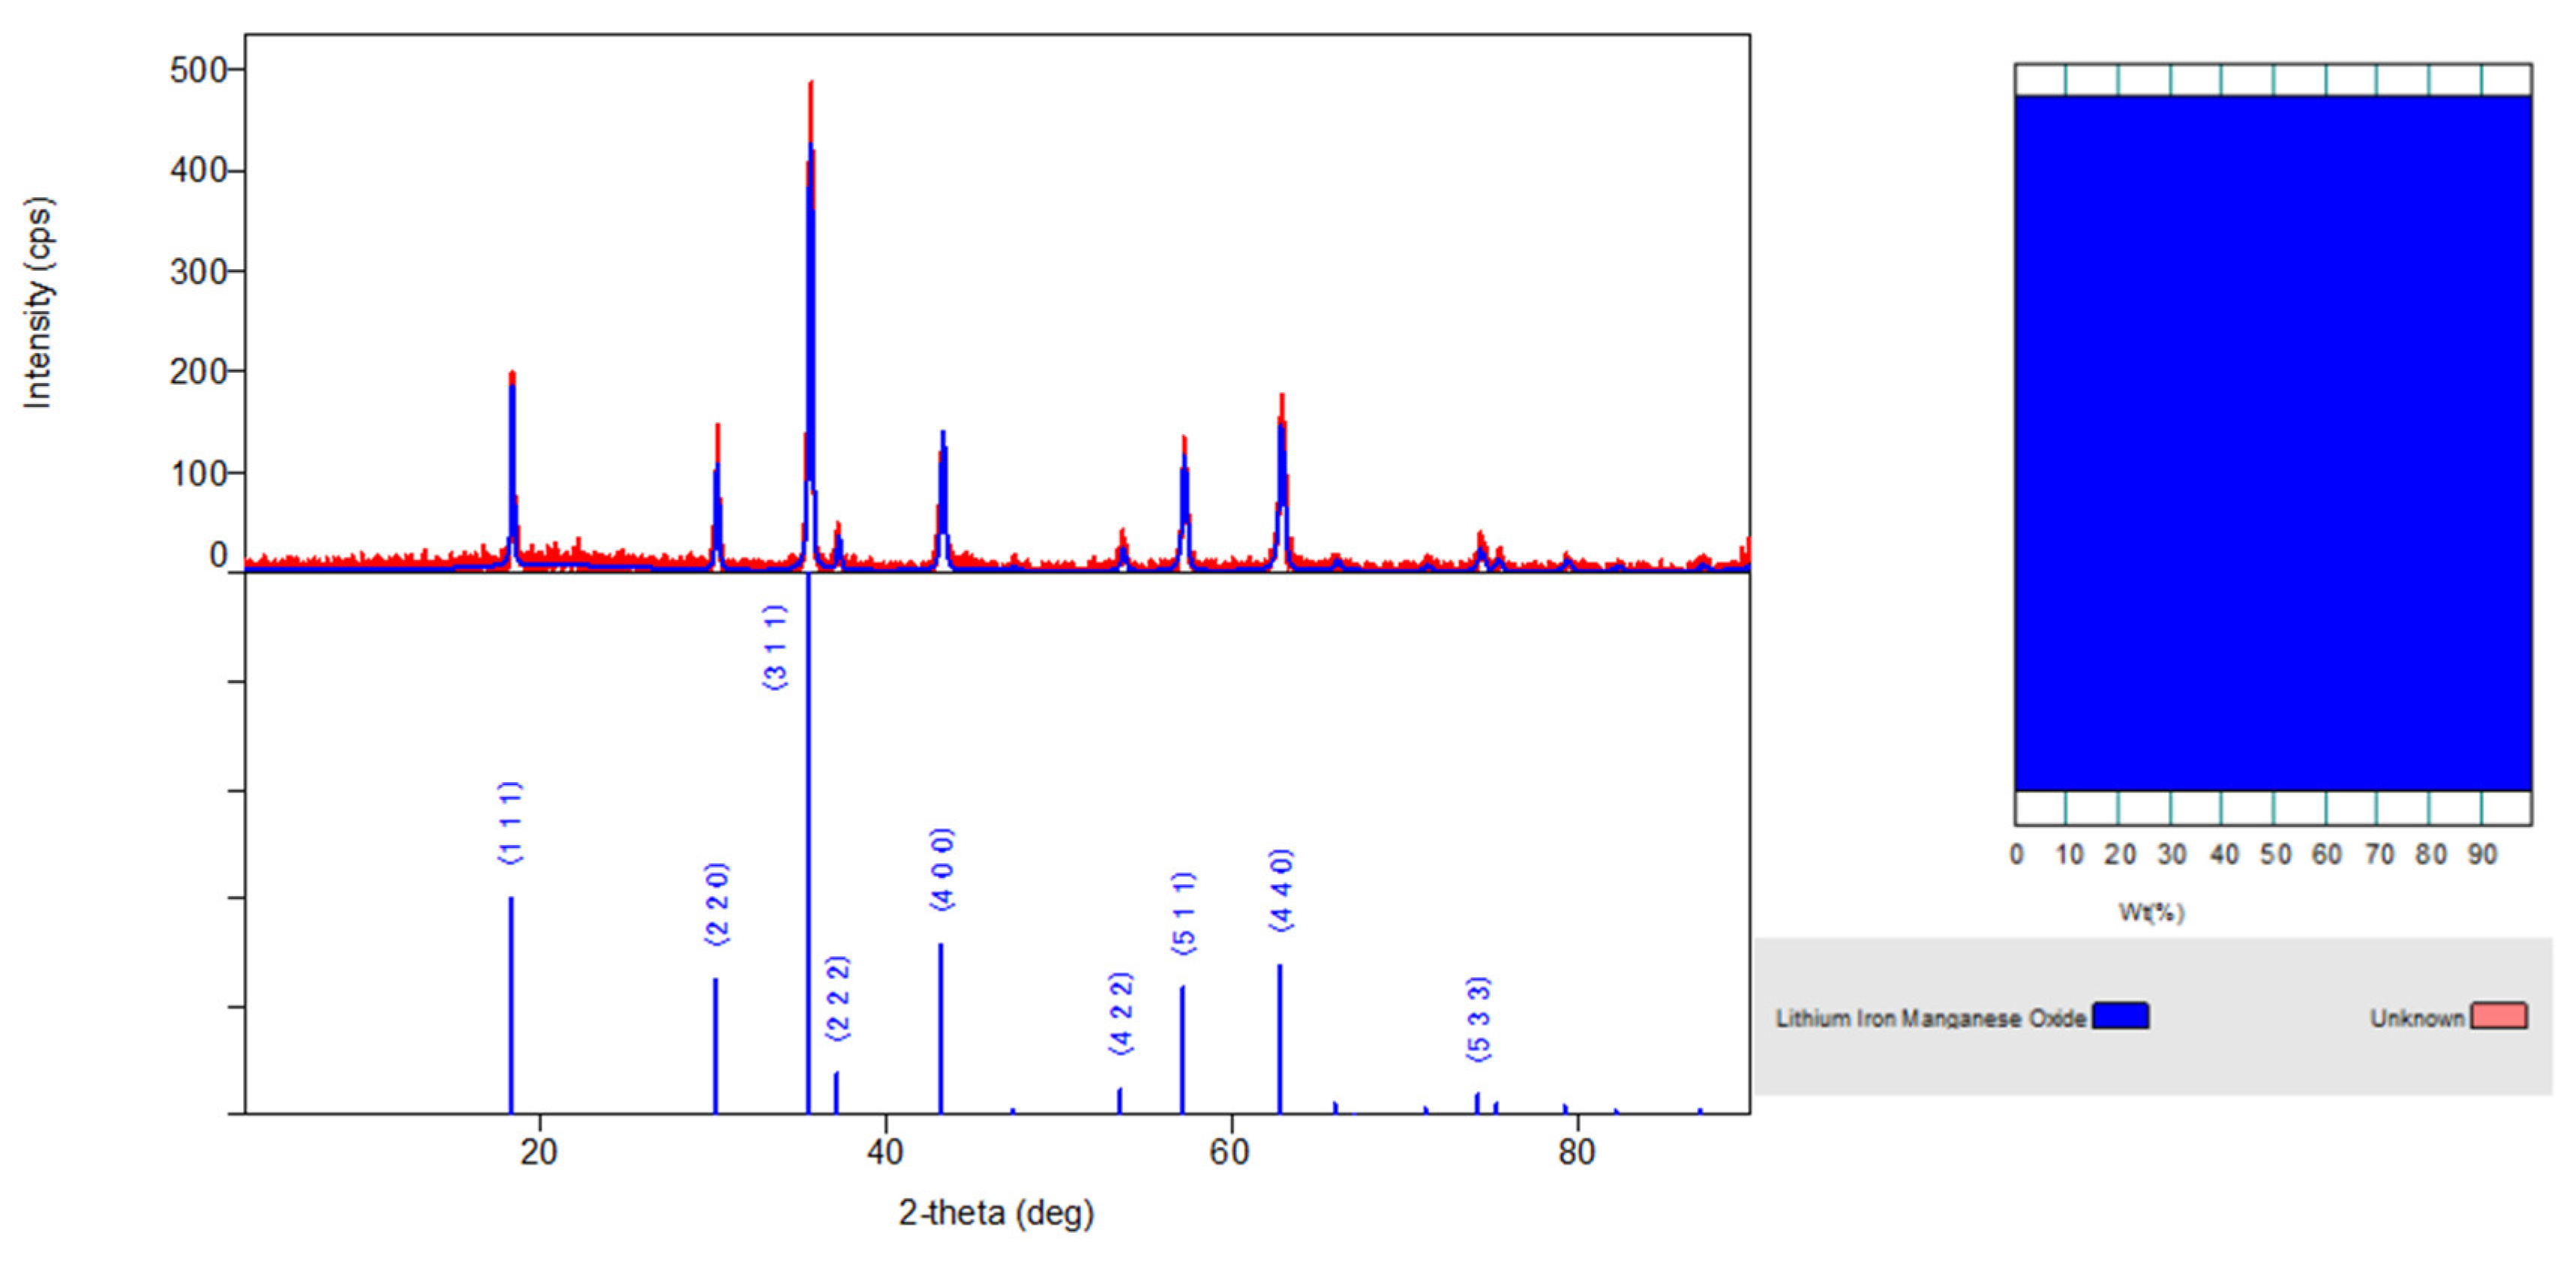
Figure 1. X-ray diffractogram of the complex ferrite Li0,5MnFe1.5O4. Insert: phase ratio diagram.
Preprints 109058 g001
Figure 2. Image of the new mixed complex ferrite Li0,5MnFe1.5O4 measured with three different micrometer accuracy.
Preprints 109058 g002
Figure 3. Spectrum samples of the Li0,5MnFe1.5O4 compound. The results of the element analysis are built-in.
Preprints 109058 g003
Figure 4. Dependence of dielectric constant (a) and electrical resistance (b) on temperature and frequency equal to 1 kHz.
Preprints 109058 g004
Table 1. Symmetry type and unit cell parameters of Li0,5MnFe1.5O4.
Sample Li0,5MnFe1.5O4
Space group F d ¯ 3 m , cubic side centered
Z
Parameter cell (Å)
a =
b =
c =
V(A^3)
α
β
γ
According to Scherrer’s formula, the average size of crystallites is
X-ray density (g/cm3)
Pycnometric density (g/cm3)*
8

8.3677(9)
8.3677(9)
8.3677(9)
585.90(11)
90
90
90
40.6 μm

4.678
4.675
Table 2. Dependence of electrical resistance (R), electrical capacity (C) and dielectric constant (ε) on BaTiO3 temperature.
Т, К C, nF R, Oм ε lgε lgR
Measurement frequency at 1 kHz
293
303
313
323
333
343
353
363
373
383
393
403
413
423
433
443
453
463
473
483
0,27278
0,27426
0,27715
0,28125
0,28772
0,29313
0,29916
0,30751
0,31202
0,31702
0,32255
0,32967
0,3423
0,35119
0,36668
0,38018
0,39802
0,4169
0,43147
0,45456
13400
13270
12910
12560
11890
11210
10290
9383
8831
9061
8814
7881
7098
6902
6153
6317
6010
5584
5149
4656
1296
1303
1316
1336
1367
1392
1421
1461
1482
1506
1532
1566
1626
1668
1742
1806
1891
1980
2050
2159
3,11
3,11
3,12
3,13
3,14
3,14
3,15
3,16
3,17
3,18
3,19
3,19
3,21
3,22
3,24
3,26
3,28
3,30
3,31
3,33
4,13
4,12
4,11
4,10
4,08
4,05
4,01
3,97
3,95
3,96
3,95
3,90
3,85
3,84
3,79
3,80
3,78
3,75
3,71
3,67
Measurement frequency at 5 kHz
293
303
313
323
333
343
353
363
373
383
393
403
413
423
433
443
453
463
473
483
0,25678
0,2683
0,2775
0,28638
0,29667
0,30226
0,30787
0,31283
0,31843
0,32148
0,32578
0,32976
0,33303
0,33948
0,35613
0,3713
0,3925
0,41682
0,44245
29630
21650
13080
5236
4301
4733
3296
2966
2805
2529
2669
3172
4434
6377
9644
11520
10430
8021
5978
3799
1220
1274
1318
1360
1389
1409
1436
1462
1486
1513
1527
1547
1566
1582
1613
1692
1764
1864
1980
2102
3,09
3,11
3,12
3,13
3,14
3,15
3,16
3,17
3,17
3,18
3,18
3,19
3,19
3,20
3,21
3,23
3,25
3,27
3,30
3,32
4,47
4,34
4,12
3,72
3,63
3,68
3,52
3,47
3,45
3,40
3,43
3,50
3,65
3,80
3,98
4,06
4,02
3,90
3,78
3,58
Measurement frequency at 10 kHz
293
303
313
323
333
343
353
363
373
383
393
403
413
423
433
443
453
463
473
483
0,11814
0,18494
0,22927
0,25954
0,27501
0,28531
0,29302
0,29988
0,30652
0,31215
0,31667
0,32294
0,32779
0,33406
0,34256
0,35658
0,378
0,39475
0,41687
0,44203
152300
70790
32200
11870
4842
3312
2689
2257
1946
1689
1737
3130
5945
8231
8805
8052
5967
4604
3343
2353
561
878
1089
1233
1306
1355
1392
1424
1456
1483
1504
1534
1557
1587
1627
1694
1796
1875
1980
2100
2,75
2,94
3,04
3,09
3,12
3,13
3,14
3,15
3,16
3,17
3,18
3,19
3,19
3,20
3,21
3,23
3,25
3,27
3,30
3,32
5,18
4,85
4,51
4,07
3,69
3,52
3,43
3,35
3,29
3,23
3,24
3,50
3,77
3,92
3,94
3,91
3,78
3,66
3,52
3,37
Table 3. Dependence of electrical capacity (C), electrical resistance (R) and dielectric constant (ε) of material 2 on temperature and frequency.
Т, К C, nF R, Oм ε lgε lgR
Measurement frequency at 1 kHz
293
303
313
323
333
343
353
363
373
383
393
403
413
423
433
443
453
463
473
483
7,7977
10,302
15,68
12,489
8,1684
14,516
86,933
176,65
265,14
378,56
495,27
312,87
11,039
1,8105
0,95809
0,68585
0,70009
0,89737
1,3483
2,1329
165700
135800
101700
131900
203600
121200
32510
19300
14110
10520
8184
10720
85500
379400
649900
843600
874900
796100
666100
511600
22448
29658
45140
35954
23515
41789
250266
508547
763295
1089813
1425802
900702
31779
5212
2758
1974
2015
2583
3882
6140
4,35
4,47
4,65
4,56
4,37
4,62
5,40
5,71
5,88
6,04
6,15
5,95
4,50
3,72
3,44
3,30
3,30
3,41
3,59
3,79
5,22
5,13
5,01
5,12
5,31
5,08
4,51
4,29
4,15
4,02
3,91
4,03
4,93
5,58
5,81
5,93
5,94
5,90
5,82
5,71
Measurement frequency at 5 kHz
293
303
313
323
333
343
353
363
373
383
393
403
413
423
433
443
453
463
473
483
1,3926
1,8886
2,728
1,517
0,9064
2,5719
15,47
31,031
45,909
64,608
82,944
40,501
1,7403
0,28075
0,13233
0,09429
0,09084
0,10483
0,13985
0,19866
140100
115400
89690
128100
184900
93070
29090
17900
13060
9799
7702
11420
79660
293500
455500
533500
555900
536400
477500
401900
4009
5437
7853
4367
2609
7404
44536
89333
132165
185996
238782
116596
5010
808
381
271
262
302
403
572
3,60
3,74
3,90
3,64
3,42
3,87
4,65
4,95
5,12
5,27
5,38
5,07
3,70
2,91
2,58
2,43
2,42
2,48
2,60
2,76
5,15
5,06
4,95
5,11
5,27
4,97
4,46
4,25
4,12
3,99
3,89
4,06
4,90
5,47
5,66
5,73
5,74
5,73
5,68
5,60
Measurement frequency at 10 kHz
293
303
313
323
333
343
353
363
373
383
393
403
413
423
433
443
453
463
473
483
0,62512
0,85581
1,188
0,50394
0,3238
1,2082
7,2162
14,584
21,676
30,192
39,355
14,483
0,64942
0,12128
0,06145
0,04865
0,04694
0,05137
0,06369
0,08415
126300
103700
83510
127500
169200
76460
26640
16680
12440
9304
7426
12940
83960
243700
329700
351900
362500
360400
339200
306100
1800
2464
3420
1451
932
3478
20774
41985
62402
86918
113297
41694
1870
349
177
140
135
148
183
242
3,26
3,39
3,53
3,16
2,97
3,54
4,32
4,62
4,80
4,94
5,05
4,62
3,27
2,54
2,25
2,15
2,13
2,17
2,26
2,38
5,10
5,02
4,92
5,11
5,23
4,88
4,43
4,22
4,09
3,97
3,87
4,11
4,92
5,39
5,52
5,55
5,56
5,56
5,53
5,49
Disclaimer/Publisher’s Note: The statements, opinions and data contained in all publications are solely those of the individual author(s) and contributor(s) and not of MDPI and/or the editor(s). MDPI and/or the editor(s) disclaim responsibility for any injury to people or property resulting from any ideas, methods, instructions or products referred to in the content.
Copyright: This open access article is published under a Creative Commons CC BY 4.0 license, which permit the free download, distribution, and reuse, provided that the author and preprint are cited in any reuse.
Prerpints.org logo

Preprints.org is a free preprint server supported by MDPI in Basel, Switzerland.

Subscribe

© 2024 MDPI (Basel, Switzerland) unless otherwise stated