
Submitted:
12 June 2024
Posted:
13 June 2024
You are already at the latest version
Abstract
This study focuses on a biogas dry reforming to produce H2. Biogas contains CO2 of 40 vol% approximately, indicating that the efficiency of the power generation is reduced because of the smaller heating value compared with a natural gas. The authors have proposed the combination system consisting of biogas dry reforming reactor and solid oxide fuel cell (SOFC). Since a biogas dry reforming is an endothermic reaction, this study adopts a membrane reactor which can be operated by causing the non-equilibrium state with H2 separation from the reaction space. This study aims to clarify the impact of thickness of Pd/Cu membrane on the characteristics of the biogas dry reforming membrane reactor using Pd/Cu membrane and Ni/Cr catalyst. The impact of the operation temperature, the molar ratio of CH4:CO2 and the differential pressure between the reaction chamber and the sweep chamber on the characteristics of the biogas dry reforming membrane reactor using Pd/Cu membrane and Ni/Cr catalyst is examined changing the thickness of Pd/Cu membrane. As a result, the highest concentration of H2 is 122711 ppmV which is obtained in case of CH4:CO2 =1:1 at the reaction temperature of 600 ℃ and the differential pressure of 0 MPa using the Pd/Cu membrane whose thickness of 40 m.
Keywords:
Biogas dry reforming
; Ni/Cr catalyst
; Thickness of Pd/Cu membrane
; Optimum experimental condition
1. Introduction
H2 is one of promising fuels to solve the global warming problem in the world. Many countries including Japan are trying to develop the technology to produce H2 as well as the system using H2 as a fuel. This study focuses on a biogas dry reforming to produce H2. Biogas is a fuel consisting of CH4 (55 – 75 vol%) and CO2 (25 – 45 vol%) [1]. It is generally produced from fermentation by the action of anaerobic microorganisms on raw materials, e.g. garbage, livestock excretion and sewage sludge. In 2020, 1.46 EJ of biogas was produced in the world, which was approximately five times larger than that produced in 2000 [2]. Therefore, this study thinks that the biogas can be expected a promising source to produce H2.
Biogas is generally utilized as a fuel for a gas engine or a micro gas turbine [3]. Biogas contains CO2 of 40 vol% approximately, indicating that the efficiency of the power generation is reduced because of the smaller heating value compared with a natural gas. The authors have proposed the combination system consisting of biogas dry reforming reactor and solid oxide fuel cell (SOFC) [4,5,6]. SOFC can use not only H2 but also CO which is a by-product from biogas dry reforming as a fuel. Therefore, this system can be available for wider operation range of the proposed system.
Biogas dry reforming was investigated by some researchers [7,8,9,10,11,12]. The catalyst used for biogas dry reforming is important. A Ni-based catalyst is the most popular catalyst type for biogas dry reforming. Ni/Ru bimetallic catalyst developed by Miao et al. [7] performed CO4 conversion and CH2 conversion of 100 % over 750 ℃ and H2/CO of 1.0 within the temperature range from 773 K to 800 ℃. Ni/Mg-Al2O3 developed by Shaffner et al. [8] performed CO4 conversion and CH2 conversion of 80 % at 500 ℃ and H2/CO ratio of approximately 1.0 within the temperature range from 350 ℃ to 800 ℃. Ni-SiO2@SiO2 core-shell developed by Kaviani et al. [9] performed the increase of CO4 conversion and CH2 conversion from 500 ℃ to 700 ℃ where CO4 conversion and CO2 conversion increased from 20 % to 70 % and from 30 % to 90 %, respectively. H2/CO ratio increased from 0.6 to 0.8 for the temperature increase from 450 ℃ to 700 ℃. Ni/MgO/Al2O3 with modifier (Gd, Sc, La) developed by Ha et al. [10] performed CH4 conversion of 50 % and CO2 conversion of 95 %. In addition, H2/CO ratio exhibited from 0.8 to 1.0. Ni/Co/Al2O3 developed by Hajizadeh et al. [11] performed the increase in CH4 conversion from 5 % to 100 % from 400 ℃ to 550 ℃. If the pressure is higher, the increase rate of CH4 conversion rises with the reaction temperature. Ni/Mg/La/Al catalyst developed by Calgaro et al. [12] performed CH4 conversion of 70 % and CO2 conversion of 80 % at 750 ℃. In addition, H2/CO ratio was 0.85 at 750 ℃.
Though several Ni-based bimetallic catalysts have been investigated, Ni/Cr catalyst is not investigated well without the authors’ previous study [5]. Consequently, this study adopts a Ni/Cr catalyst for a biogas dry reforming in order to clarify the performance of Ni/Cr catalyst.
Additionally, since a biogas dry reforming is an endothermic reaction, it is important to operate lower temperature for the improvement of the thermal energy efficiency of the biogas dry reforming process. For this purpose, using a membrane reactor is one effective procedure since the H2 production is promoted by causing the non-equilibrium state with H2 separation from the reaction space [5]. The authors previous study [5] reported the experimental investigation on the biogas dry reforming membrane reactor using Pd/Cu membrane and Ni/Cr catalyst. Compared to pure Ni catalyst, the concentration of produced H2 was higher when using Ni/Cr catalyst. Though the impact of operation temperature, the molar ratio of CH4:CO2, the differential pressure between the reaction chamber and the sweep chamber on the performance of the biogas dry reforming membrane reactor using Pd/Cu membrane and Ni/Cr catalyst was investigated [5], the effect of thickness of Pd/Cu membrane has not been investigated yet. In the previous study [5], the thickness of Pd/Cu membrane was 20 μm. The thinner H2 separation membrane can be expected the higher H2 separation performance due to lower H2 permeation resistance. However, we have to consider the strength of H2 separation membrane at the larger differential pressure between the reaction chamber and the sweep chamber as well as the higher temperature operation.
Therefore, this study aims to clarify the impact of thickness of Pd/Cu membrane on the characteristics of the biogas dry reforming membrane reactor using Pd/Cu membrane and Ni/Cr catalyst. The impact of the operation temperature, the molar ratio of CH4:CO2 and the differential pressure between the reaction chamber and the sweep chamber on the characteristics of the biogas dry reforming membrane reactor using Pd/Cu membrane and Ni/Cr catalyst is examined changing the thickness of Pd/Cu membrane. The molar ratio of CH4:CO2 = 1.5:1 simulates a biogas in this study.
The reaction scheme of CH4 dry reforming (DR) is described as follows:
CH4 + CO2 ↔ 2CO + 2H2 + 247 kJ/mol
Moreover, the following reaction schemes can be considered as the phenomena occurred in this study:
where Equation (2) is a reverse water gas shift reaction (RWGS), Equation (3) is a methanation reaction, and Equation (4) is a steam reforming of CH4. Regarding a carbon deposition, the following reaction schemes can be considered:
CO2 + H2 ↔ CO + H2O + 41 kJ/mol
CO2 + 4H2 ↔ CH4 + 2H2O - 164kJ/mol
CH4 + H2O ↔ CO + 3H2 - 41 kJ/mol
CH4 ↔ C + 2H2 + 75 kJ/mol
2CO ↔ C + CO2 - 173 kJ/mol
CO2 + 2H2 ↔ C + 2H2O - 90 kJ/mol
CO + H2 ↔ C + H2O - 131 kJ/mol
2. Experiment
2.1. Experimental Apparatus
Figure 1 shows the schematic drawing of the experimental apparatus of this study. The experimental apparatus consists of a gas cylinder, mass flow controllers (S48-32; HORIBA METRON INC.), pressure sensors (KM31), valves, a vacuum pump, a reactor composed of reaction chamber and sweep chamber, and gas sampling taps. The reactor is installed in an electric furnace. The temperature in the electric furnace is controlled by far-infrared heaters (MCHNNS1; MISUMI). CH4 gas with a purity over 99.4 vol% and CO2 gas with a purity over 99.9 vol% are controlled by mass flow controllers and mixed before flowing into the reaction chamber. The pressure of the mixed gas at the inlet of the reaction chamber is measured by pressure sensors. Ar gas with a purity over 99.99 vol% is controlled by a mass flow controller, and the pressure of Ar gas is measured by a presser sensor. Ar is provided as a sweep gas. The exhausted gas at the outlet of reaction chamber and sweep chamber is suctioned by a gas syringe via the gas sampling tap. The concentration of sampled gas is measured by TCD gas chromatograph (GL Science). The minimum resolution of TCD gas chromatograph and the methanizer is 1 ppmV. The gas pressure at the outlet of the reactor is measured by a pressure sensor. The gas concentration and pressure are measured at the outlet of reaction chamber and sweep chamber, respectively.
Figure 2 shows the detail of the reactor in this study. The reactor is composed of a reaction chamber, a sweep chamber and a H2 separation membrane. The reaction chamber and the sweep chamber are made of stainless steel with a size of 40 mm × 100 mm × 40 mm. The volume of reaction space is 16 × 10-5 m3. A porous Ni/Cr (Cr: 35 wt%) catalyst is changed in the reaction chamber. The mean hole diameter of Ni/Cr catalyst is 0.8 mm. We can know from the procedure brochure that the porosity of Ni/Cr catalyst is 0.93. The weight of charged Ni/Cr catalyst is 74.6 g.
Figure 3 shows a photo of the catalyst filled in the reactor of this study. Pd/Cu membrane (Cu of 40 wt%; Tanaka Kikinzoku) is selected as a H2 separation membrane. The thickness of Pd/Cu membrane is changed by 20 μm, 40 μm and 60 μm. This study thinks that the performance of membrane reactor depends on the balance between the reaction performance of catalyst and the separation performance of H2 separation membrane. Therefore, this study investigates the impact of thickness of Pd/Cu membrane on the characteristics of membrane reactor changing the initial reaction temperature, the molar ratio of CH4:CO2 and the differential pressure between the reaction chamber and the sweep chamber. Figure 4 shows a photo of Pd/Cu membrane with the thickness of 60 μm. The temperatures at the inlet, the middle and the outlet of the reaction and the sweep chamber are measured by K-type thermocouples. The initial reaction temperature is controlled and set by far-infrared heater which is confirmed by the thermocouples. The measured temperature and pressures are collected by a data logger (GL240; Graphic Corporation).
Table 1 lists the experimental parameters in this study. The molar ratio of provided CH4:CO2 is changed by 1.5:1, 1.1 and 1:1.5. The molar ratio of CH4:CO2 simulates a biogas in this study. According to the authors’ previous study [13], the feed ratio of sweep gas to supply gas defined as the flow rate of sweep gas divided by the flow rate of supply gas composing of CH4 and CO2 has been set at 1.0, which is the optimum feed ratio of sweep gas to supply gas [13]. The differential pressure between the reaction chamber and the sweep chamber is varied to 0 MPa, 0.010 MPa and 0.020 MPa. This differential pressure is measured and confirmed by the pressure sensors installed at the outlet of the reaction chamber and the outlet of sweep chamber. The initial reaction temperature which is the initial temperature of the reactor is varied to 400 ℃, 500 ℃ and 600 ℃. The initial reaction temperature is measured by thermocouples before suppling the mixed gas of CH4 and CO2 as well as the sweep gas into the reactor. The gas concentrations at the outlet of the reaction chamber and the sweep chamber are detected by an FID gas chromatograph (GC3220; GL Science) and a methanizer (MT221; GL Science). This study shows the average data of five trials for each experimental condition in the following figures. The distribution of each gas concentration is below 10 %.
2.2. Assessment Factor to Evaluate the Performance of Membrane Reactor
This study evaluates the performance of proposed membrane reactor by the gas concentration at the outlet of the reaction chamber and the sweep chamber. Using these data, CH4 conversion (XCH4), CO2 conversion (XCO2), H2 yield (YH2), H2 selectivity (SH2) and CO selectivity (SCO) are evaluated. These assessment factors are defined as follows:
where CCH4, in means a concentration of CH4 at the inlet of reaction chamber [ppmV], CCH4, out means a concentration of CH4 at the outlet of reaction chamber [ppmV], CCO2, in means a concentration of CO2 at the inlet of reaction chamber [ppmV], CCO2, out is a concentration of CO2 at the outlet of reaction chamber [ppmV], CH2, out means a concentration of H2 at the outlet of reaction chamber and sweep chamber [ppmV], and CCO, out means a concentration of CO at the outlet of reaction chamber [ppmV].
XCH4 = (CCH4, in-CCH4, out)/(CCH4, in) × 100
XCO2 = (CCO2, in-CCO2, out)/(CCO2, in) × 100
YH2 = (1/2)(CH2, out)/(CCH4, in) × 100
SH2 = (CH2, out)/(CH2, out + CCO, out) × 100
SCO = (CCO, out)/(CH2, out + CCO, out) × 100
Moreover, H2 permeability (H) and permeation flux (F) are evaluated as follows:
where CH2, out, sweep means a concentration of H2 at the outlet of sweep chamber [ppmV], CH2, out, react means a concentration of H2 at the outlet of reaction chamber [ppmV], P means a permeation factor [mol/(m・s・Pa0.5)], Preact, ave means an average pressure of the reaction chamber [MPa], Psweep, ave means an average pressure of sweep chamber [MPa] and δ means the thickness of Pd/Cu alloy membrane [m].
H = (CH2, out, sweep)/(CH2, out, sweep + CH2, out, react) × 100
Furthermore, the thermal efficiency of the membrane reactor (η) is also evaluated, which is defined as follows:
where QH2 means the heating value of produced H2 based on the lower heating value [W], WR.C. means the amount of pre-heat of supply gas for the reaction chamber [W], WS.C. means the amount of pre-heat of the sweep gas for the sweep chamber [W], and Wp is the pump power to give the differential pressure between the reaction chamber and the sweep chamber [W].
3. Results and Discussion
3.1. Impact of Initial Reaction Tempreature and Molar Ratio of CH4:CO2
To investigate the impact of thickness of Pd/Cu membrane on the reaction characteristics in the reaction chamber, Figure 5, Figure 7 and Figure 9 [M1] show the concentration of H2, CO, CH4 and CO2 at the outlet of reaction chamber at the differential pressure of 0 MPa, 0.010 MPa and 0.020 MPa, respectively. In these figures, the initial reaction temperature (reaction temperature) is changed by 400 ℃, 500 ℃ and 600 ℃. In addition, the molar ratio of CH4:CO2 is changed by 1.5:1, 1:1 and 1:1.5. Moreover, Figure 6, Figure 8 and Figure 10 show the concentration of H2 at the outlet of the sweep chamber to investigate the impact of thickness of Pd/Cu membrane on the H2 separation characteristics at the differential pressure of 0 MPa, 0.010 MPa and 0.020 MPa, respectively. In these figures, the initial reaction temperature (reaction temperature) is changed by 400 ℃, 500 ℃ and 600 ℃. In addition, the molar ratio of CH4:CO2 is changed by 1.5:1, 1:1 and 1:1.5.
According to Figure 5, Figure 7 and Figure 9, it is seen that the concentration of H2 at the outlet of reaction chamber increases with the increase in the reaction temperature. Since DR is an endothermic reaction as shown in Equation (1), the reaction is progressed with the increase in the reaction temperature well. H2 production rate of DR increases with the increase in reaction temperature according to the theoretical kinetic study [14]. This tendency is obtained irrespective of the molar ratio of CH4:CO2, the thickness of Pd/Cu membrane and the differential pressure between the reaction chamber and the sweep chamber.
It is seen from Figure 6, Figure 8 and Figure 10 that the concentration of H2 at the outlet of the sweep chamber increases with the increase in the reaction temperature. Since the concentration of H2 at the outlet of the reaction chamber is higher at higher reaction temperature, it is thought that the driving force to penetrate Pd/Cu membrane is bigger due to the large H2 partial pressure difference between the reaction chamber and the sweep chamber, i.e. large concentration difference of H2 between the reaction chamber and the sweep chamber, resulting in the higher concentration of H2 at the outlet of the sweep chamber.
According to Figure 5, Figure 7 and Figure 9 and Figure 6, Figure 8 and Figure 10, the thickness of Pd/Cu membrane which exhibits the highest concentration of H2 at the outlet of the reaction chamber and the sweep chamber depends on the differential pressure between the reaction chamber and the sweep chamber. Generally speaking, the penetration resistance of H2 is lower when the thickness of Pd/Cu membrane is thinner, resulting that H2 is separated well. At the differential pressure of 0 MPa, the highest concentration of H2 in the reaction chamber as well as the sweep chamber is obtained for the thickness of 40 μm irrespective of molar ratio of CH4:CO2. Since the differential pressure of 0 MPa means the permeation flux of 0 mol/(m2・s), the driving force of H2 separation is the concentration difference of H2 between the reaction chamber and the sweep chamber mainly. At the differential pressure of 0.020 MPa, the concentration of H2 in the sweep chamber for the thickness of 20 μm is the highest among the investigated thicknesses, while the concentration of H2 at the outlet of the reaction chamber for the thickness of 20 μm is the lowest among the investigated thicknesses irrespective of the molar ratio of CH4:CO2 as shown in Figure 9. The permeation flux at the differential pressure of 0.020 MPa is 7.07×10⁻⁴ mol/(m2・s) which is the largest among the investigated differential pressures, resulting that the effect of pressure on the H2 separation performance is the largest. In addition, since the thickness of 20 μm is the thinnest among the investigated thicknesses, the penetration resistance of H2 of Pd/Cu membrane is the smallest. As a result, it can be claimed that the H2 produced in the reaction chamber penetrates via Pd/Cu membrane well under the combination condition of the differential pressure of 0.020 MPa and thickness of 20 μm. As to the differential pressure of 0.010 MPa, the optimum thickness of Pd/Cu membrane which obtains the highest concentration of H2 in the reaction chamber as well as that in the sweep chamber is not clear. It is also influenced by the molar ratio of CH4:CO2. The impact of H2 separation performance on the reaction mechanism including DR as well as the other reactions as shown in Equations (2) – (3) is thought to be existed. The kinetic study considering the gas separation is the future work in this study.
Comparing the molar ratio of CH4:CO2, the concentration of H2 in case of the molar ratio of CH4:CO2 = 1:1 is the highest among the investigated conditions. Since the molar ratio of CH4:CO2 = 1:1 is the stoichiometric ratio of FR as shown in Equation (1), it is thought that H2 is produced easily. The kinetic pressure in case of CH4:CO2 = 1.5:1 and 1:1.5 is 3.18×10⁻⁴ Pa, while that in case of CH4:CO2 = 1:1 is 2.03×10⁻⁴ Pa. Since the differential pressure between the reaction chamber and the sweep chamber is much larger than the kinetic pressure, it is thought that the impact of increase in static pressure with the decrease in kinetic pressure on the H2 separation performance is small.
It is seen from Figure 6, Figure 8 and Figure 10 that the concentration of H2 at the outlet of the sweep chamber in case of the molar ratio of CH4:CO2 = 1:1 is higher compared to the other molar ratios except for the differential pressure of 0.020 MPa. Since the concentration of H2 in the reaction chamber is higher at higher reaction temperature, it is thought the driving force to penetrate Pd/Cu membrane is bigger, resulting in the higher concentration of H2 in the sweep chamber. As to the differential pressure of 0.020 MPa, the differential pressure is too high, resulting that the separation rate of H2 might be higher than the production rate of H2 by Ni/Cr catalyst in the reaction chamber. As a result, it is thought that the effective non-equilibrium sate can not be obtained. Comparing the concentration of H2 at the outlet of the reaction chamber shown in Figure 5, Figure 7 and Figure 9, the concentration of H2 at the differential pressure of 0.020 MPa is relatively lower than that at the other differential pressures. We can also know the lower production performance of H2 at the differential pressure of 0.020 MPa according to this tendency.
3.2. Impact of Differential Pressure between the Reaction Chamber and the Sweep Chamber
To investigate the impact of thickness of Pd/Cu membrane on the reaction characteristics in the reaction chamber, Figure 11 shows the concentration of H2, CO, CH4 and CO2 for the differential molar ratio of CH4:CO2. In this figure, the reaction temperature is 600 ℃. In addition, the differential pressure between the reaction chamber and the sweep chamber is changed by 0 MPa, 0.010 MPa and 0.020 MPa. Moreover, Figure 12 shows the concentration of H2 in the sweep chamber to investigate the impact of thickness of Pd/Cu membrane on the H2 separation characteristics for the different molar ratio of CH4:CO2. In this figure, the reaction temperature is 600 ℃. In addition, the differential pressure between the reaction chamber and the sweep chamber is changed by 0 MPa, 0.010 MPa and 0.020 MPa.
According to Figure 11, the concentration of H2 at the outlet of the reaction chamber relatively increases with the decrease in the differential pressure between the reaction chamber and the sweep chamber irrespective of the molar ratio of CH4:CO2. In addition, we can see from Figure 12 that the concentration of H2 at the outlet of the sweep chamber increases with the decrease in the differential pressure between the reaction chamber and the sweep chamber irrespective of the molar ratio of CH4:CO2, which follows the tendency observed in Figure 11. Moreover, the highest concentration of H2 at the differential pressure of 0 MPa is obtained for the thickness of Pd/Cu membrane of 40 μm for the reaction chamber as well as the sweep chamber. The kinetic pressure in case of CH4:CO2 = 1.5:1 and 1:1.5 is 3.18×10⁻⁴ Pa, while that in case of CH4:CO2 = 1:1 is 2.03×10⁻⁴ Pa. Since the differential pressure between the reaction chamber and the sweep chamber is much larger than the kinetic pressure, it is thought that the impact of increase in static pressure with the decrease in kinetic pressure on the H2 separation performance is small. Since the differential pressure of 0 MPa means the permeation flux of 0 mol/(m2・s), the driving force of H2 separation is the concentration difference of H2 between the reaction chamber and the sweep chamber mainly. Since the concentration of H2 at the outlet of the reaction chamber for the thickness of 40 μm is the highest among the investigated thicknesses shown in Figure 11, it is thought that the concentration of H2 at the outlet of the sweep chamber for the thickness of 40 μm is the highest, as shown in Figure 12, after the penetration of H2 through Pd/Cu membrane.
3.3. Comparison of Assessment Factor among the Investigated Experimental Conditions
To investigate the performance of proposed membrane reactor using Ni/Cr catalyst and Pd/Cu membrane, Table 2 lists comparison of CH4 conversion, CO2 conversion, H2 yield, H2 selectivity, CO selectivity, H2 permeability, permeation flux and thermal efficiency for the different reaction temperature, the molar ratio of CH4:CO2 and the differential pressure between the reaction chamber and the sweep chamber.
According to Table 2, we can see that CH4 conversion and CO2 conversion exhibits the positive value and the negative value, respectively. From this result, it can be claimed that the reaction consuming CH4 and that producing CO2 are occurred. In addition, it is seen from Table 2 that CO selectivity is higher than 90 %, indicating that CO is produced more compared to H2. These phenomena can be explained as follows:
- (i)
- H2 is produced by Equation (1) or Equation (5).
- (ii)
- CO is produced after consuming H2 via Equation (2).
- (iii)
- Carbon and CO2 are produced after consuming a part of CO via Equation (6).
Since Equation (6) shown in (iii) is an exothermal reaction, CO can be produced easily. After the experiments in this study, the carbon was observed which can be explained as shown in Figure 13. The weight of Ni/Cr catalyst used in this study has been increased by 9.1 g after experiments, compared to the initial weight of 74.6 g. This is due to a carbon deposition shown in Equation (6). As to H2O formation shown in Equation (2), this study has confirmed it by the observation using the gas bag shown in Figure 14. The colored part, which is different from the other area in the red circle shown in Figure 14, indicates H2O formation. In addition, the numerical simulation result using the commercial software COMSOL Multiphysics which includes the simulation codes on Equations (1), (2), (3) and (4) with 3D model indicates H2O formation. For example, the concentration of H2O at the outlet of reactor in case of the molar ratio of CH4:CO2 = 1.5:1 at 400 ℃, 500 ℃ and 600 ℃ is 6228 ppmV, 28946 ppmV and 33614 ppmV, respectively. The authors would like to report the detail of the numerical simulation in the near future.
According to the investigation in this study, the highest concentration of H2 is 122711 ppmV in case of CH4:CO2 =1:1 at the reaction temperature of 600 ℃ and the differential pressure of 0 MPa using the Pd/Cu membrane whose thickness of 40 μm. Under this condition, the kinetic rate is 0.86 mol/(m3・s) and the permeation flux is 0 mol/(m2・s). In addition, CH4 conversion, CO2 conversion, H2 yield, H2 selectivity, CO selectivity, H2 permeability and thermal efficiency is 13.7 %, -5.73 %, 1.51 %, 2.84 %, 97.2 %, 1.06×10⁻¹ % and 11.0 %, respectively. To improve the performance of H2 production as well as thermal efficiency of the proposed membrane reactor, this study proposes using the other type of catalyst. This study has investigated Ni/Cr alloy catalyst. Though Ni is a popular catalyst for DR, Ru is also used for DR [15,16,17]. There is no report on Ni/Ru/Cr alloy catalyst used for not only DR but also membrane reactor. This study would like to study Ni/Ru/Cr catalyst in order to enhance the performance of DR in the near future.
4. Conclusions
This study has investigated to clarify the impact of thickness of Pd/Cu membrane on the characteristics of the biogas dry reforming membrane reactor using Pd/Cu membrane and Ni/Cr catalyst. The impact of the operation temperature, the molar ratio of CH4:CO2 and the differential pressure between the reaction chamber and the sweep chamber on the characteristics of the biogas dry reforming membrane reactor using Pd/Cu membrane and Ni/Cr catalyst has been examined changing the thickness of Pd/Cu membrane. As a result, the following conclusions are obtained:
- (1)
- The concentration of H2 at the outlet of reaction chamber increases with the increase in the reaction temperature irrespective of the molar ratio of CH4:CO2, the thickness of Pd/Cu membrane and the differential pressure between the reaction chamber and the sweep chamber. In addition, the concentration of H2 at the outlet of the sweep chamber also increases with the increase in the reaction temperature.
- (2)
- At the differential pressure of 0 MPa, the highest concentration of H2 in the reaction chamber as well as the sweep chamber is obtained for the thickness of 40 m irrespective of molar ratio of CH4:CO2. At the differential pressure of 0.020 MPa, the concentration of H2 in the sweep chamber for the thickness of 20 m is the highest among the investigated thicknesses, while the concentration of H2 at the outlet of the reaction chamber for the thickness of 20 m is the lowest among the investigated thicknesses irrespective of the molar ratio of CH4:CO2. On the other hand, at the differential pressure of 0.010 MPa, the optimum thickness of Pd/Cu membrane obtaining the highest concentration of H2 in the reaction chamber as well as that in the sweep chamber is not clear.
- (3)
- The concentration of H2 at the outlet of the reaction chamber and the sweep chamber increases with the decrease in the differential pressure between the reaction chamber and the sweep chamber relatively irrespective of the molar ratio of CH4:CO2, respectively.
- (4)
- The reaction performed in this study can be proposed as follows: (i) H2 is produced by Equation (1) or Equation (5). (ii) CO is produced after consuming H2 via Equation (2). (iii) Carbon and CO2 are produced after consuming a part of CO via Equation (6).
- (5)
- The highest concentration of H2 is 122711 ppmV which is obtained in case of CH4:CO2 =1:1 at the reaction temperature of 600 ℃ and the differential pressure of 0 MPa using the Pd/Cu membrane whose thickness of 40 m. Under this condition, the kinetic rate is 0.86 mol/(m3・s) and the permeation flux is 0 mol/(m2・s). In addition, CH4 conversion, CO2 conversion, H2 yield, H2 selectivity, CO selectivity, H2 permeability and thermal efficiency is 13.7 %, -5.73 %, 1.51 %, 2.84 %, 97.2 %, 1.06×10⁻¹ % and 11.0 %, respectively.
Author Contributions
Conceptualization and writing—original draft preparation, A.N.; methodology and data curation, S.I. and M. I.; writing—review and editing, M.L.K.
Funding
This research was funded by the Iwatani Naoji Foundation.
Data Availability Statement
The authors agree to share the data of the article published in this journal.
Acknowledgments
The authors agree acknowledge the financial support from the Iwatani Naoji Foundation.
Conflicts of Interest
The authors declare no conflicts of interest.
References
- Kalai, D. Y.; Stangeland, K.; Jin, Y.; Tucho, W. M.; Yu, Z. Biogas dry reforming for syngas production on La promoted hydrotalcite-derived Ni catalyst. International Journal of Hydrogen Energy 2018, 43, 19438–19450. [Google Scholar] [CrossRef]
- World Bioenergy Association. Global Bioenergy Statistics. Available online: https://worldbioenergy.org./global-bioenergy-statistics (accessed on 2 June 2024).
- The Japan Gas Association. Available online: https://www.gas.or.jp/gas-life/biogas/ (accessed on 2 June 2024).
- Nishimura, A.; Takada, T.; Ohata, S.; Kolhe, M. L. Biogas dry reforming for hydrogen through membrane reactor utilizing negative pressure. fuels 2021, 2. [Google Scholar]
- Nishimura, A.; Hayashi, Y.; Ito, S.; Kolhe, M. L. Performance analysis of hydrogen production for a solid oxide fuel cell system using a biogas dry reforming membrane reactor with Ni and Ni/Cr catalysts. fuels 2023, 4. [Google Scholar] [CrossRef]
- Nishimura, A.; Sato, R.; Hu, E. An energy production system powered by solar heat with biogas dry reforming reactor and solid oxide fuel cell. Smart Grid and Renewable Energy 2023, 14, 85–106. [Google Scholar] [CrossRef]
- Miao, C.; Chen, S.; Shang, K.; Liang, L.; Ouyang, J. Highly active Ni-Ru bimetallic catalyst integrated with MFI zeolite loaded cerium zirconium oxide for dry reforming of methane. ACS Applied Materials & Interfaces 2022, 14, 47616–47632. [Google Scholar]
- Schaffner, R. A.; Schwengber, C. A.; Kowalski, R. L.; Assis, N. S. G.; Domingues, R. C. P. R.; Yamamoto, C. I. , Alves, H. J. Dry reforming of methane: effect of different calcination temperatures of Al2O3 and Mg-Al2O3 supports on Ni catalysts. The Canadian Journal of Chemical Engineering 2021, 100, 3345–3356. [Google Scholar] [CrossRef]
- Kaviani, M.; Rezaei, M.; Alavi, S. M.; Akbari, E. High coke resistance Ni-SiO2@SiO2 core-shell catalyst for biogas dry reforming: effects of Ni loading and calcination temperature. Fuel 2022, 330. [Google Scholar] [CrossRef]
- Ha, Q. L. M.; Atia, H.; Kreyenschulte, C.; Lund, H.; Bartling, S.; Lisak, G.; Wohlrab, S.; Armbruster, U. Effects of modifier (Gd, Sc, La) addition on the stability of low Ni content catalyst for dry reforming of model biogas. Fuel 2022, 312. [Google Scholar]
- Hajizadeh, A.; Mohamadi-Baghmolaei, M.; Saady, N. M. C.; Zendehboudi, S. Hydrogen production from biomass through integration of anaerobic digestion and biogas dry reforming. Applied Energy 2022, 309. [Google Scholar] [CrossRef]
- Calgaro, C. O.; Lima, D. S.; Tonetto, R.; Perez-Lopez; O. W. Biogas dry reforming over Ni-Mg-La-Al catalysts: influence of La/Mg ratio. Catalysis Letters 2021, 151, 267–280. [Google Scholar] [CrossRef]
- Nishimura, A.; Ohata, S.; Okukura, K.; Hu, E. The impact of operating conditions on the performance of a CH4 dry reforming membrane reactor for H2 production. Journal of Energy Power Technologies 2020, 2. [Google Scholar] [CrossRef]
- Cherbanski, R.; Kotkowski, T.; Molga, E. Thermogravimetric analysis of coking during dry reforming of methane. International Journal of Hydrogen Energy 2023, 48, 7346–7360. [Google Scholar] [CrossRef]
- Pakhare, D.; Spivey, J. A review of dry (CO2) reforming of methane over noble metal catalyst. The Royal Society of Chemistry 2014, 43, 7813–7837. [Google Scholar] [CrossRef] [PubMed]
- Fontana, A. D.; Faroldi, B.; Cornaglia, L. M.; Tarditi, A. M. Development of catalytic membranes over PdAu selective films for hydrogen production through the dry reforming of methane. Molecular Catalysis 2020, 481. [Google Scholar] [CrossRef]
- Brunetti, A.; Fontananova, E. CO2 conversion by methane reactors. Journal of Nanoscience and Nanotechnology 2019, 19, 3124–3134. [Google Scholar] [CrossRef] [PubMed]
Figure 1.
Schematic drawing of experimental apparatus [5].
Figure 1.
Schematic drawing of experimental apparatus [5].
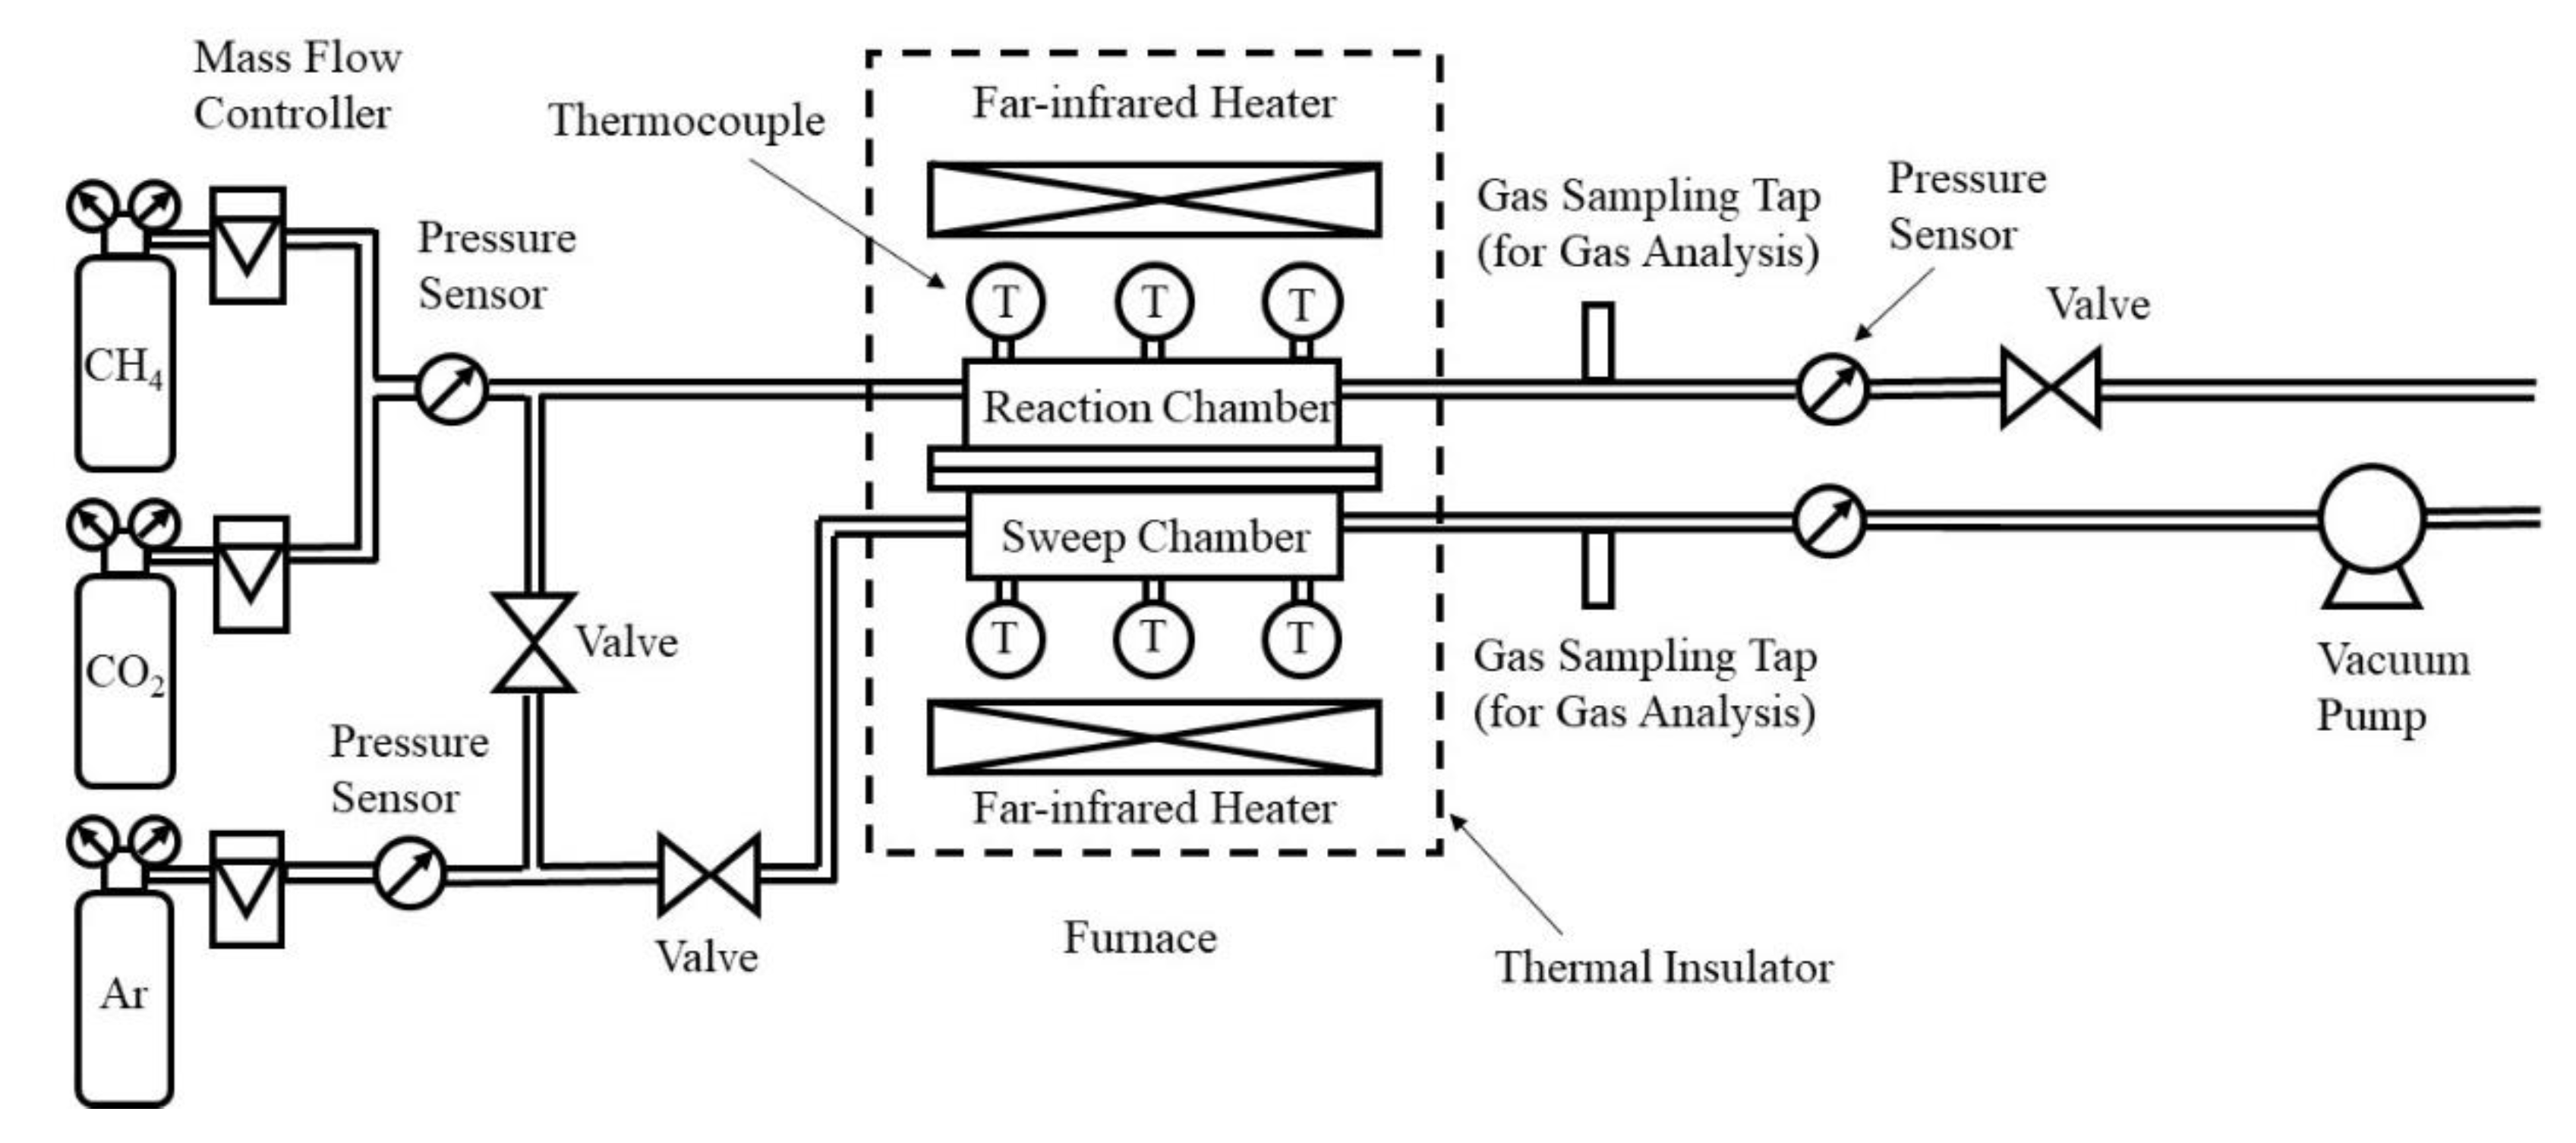
Figure 2.
Schematic drawing of detail of the reactor.
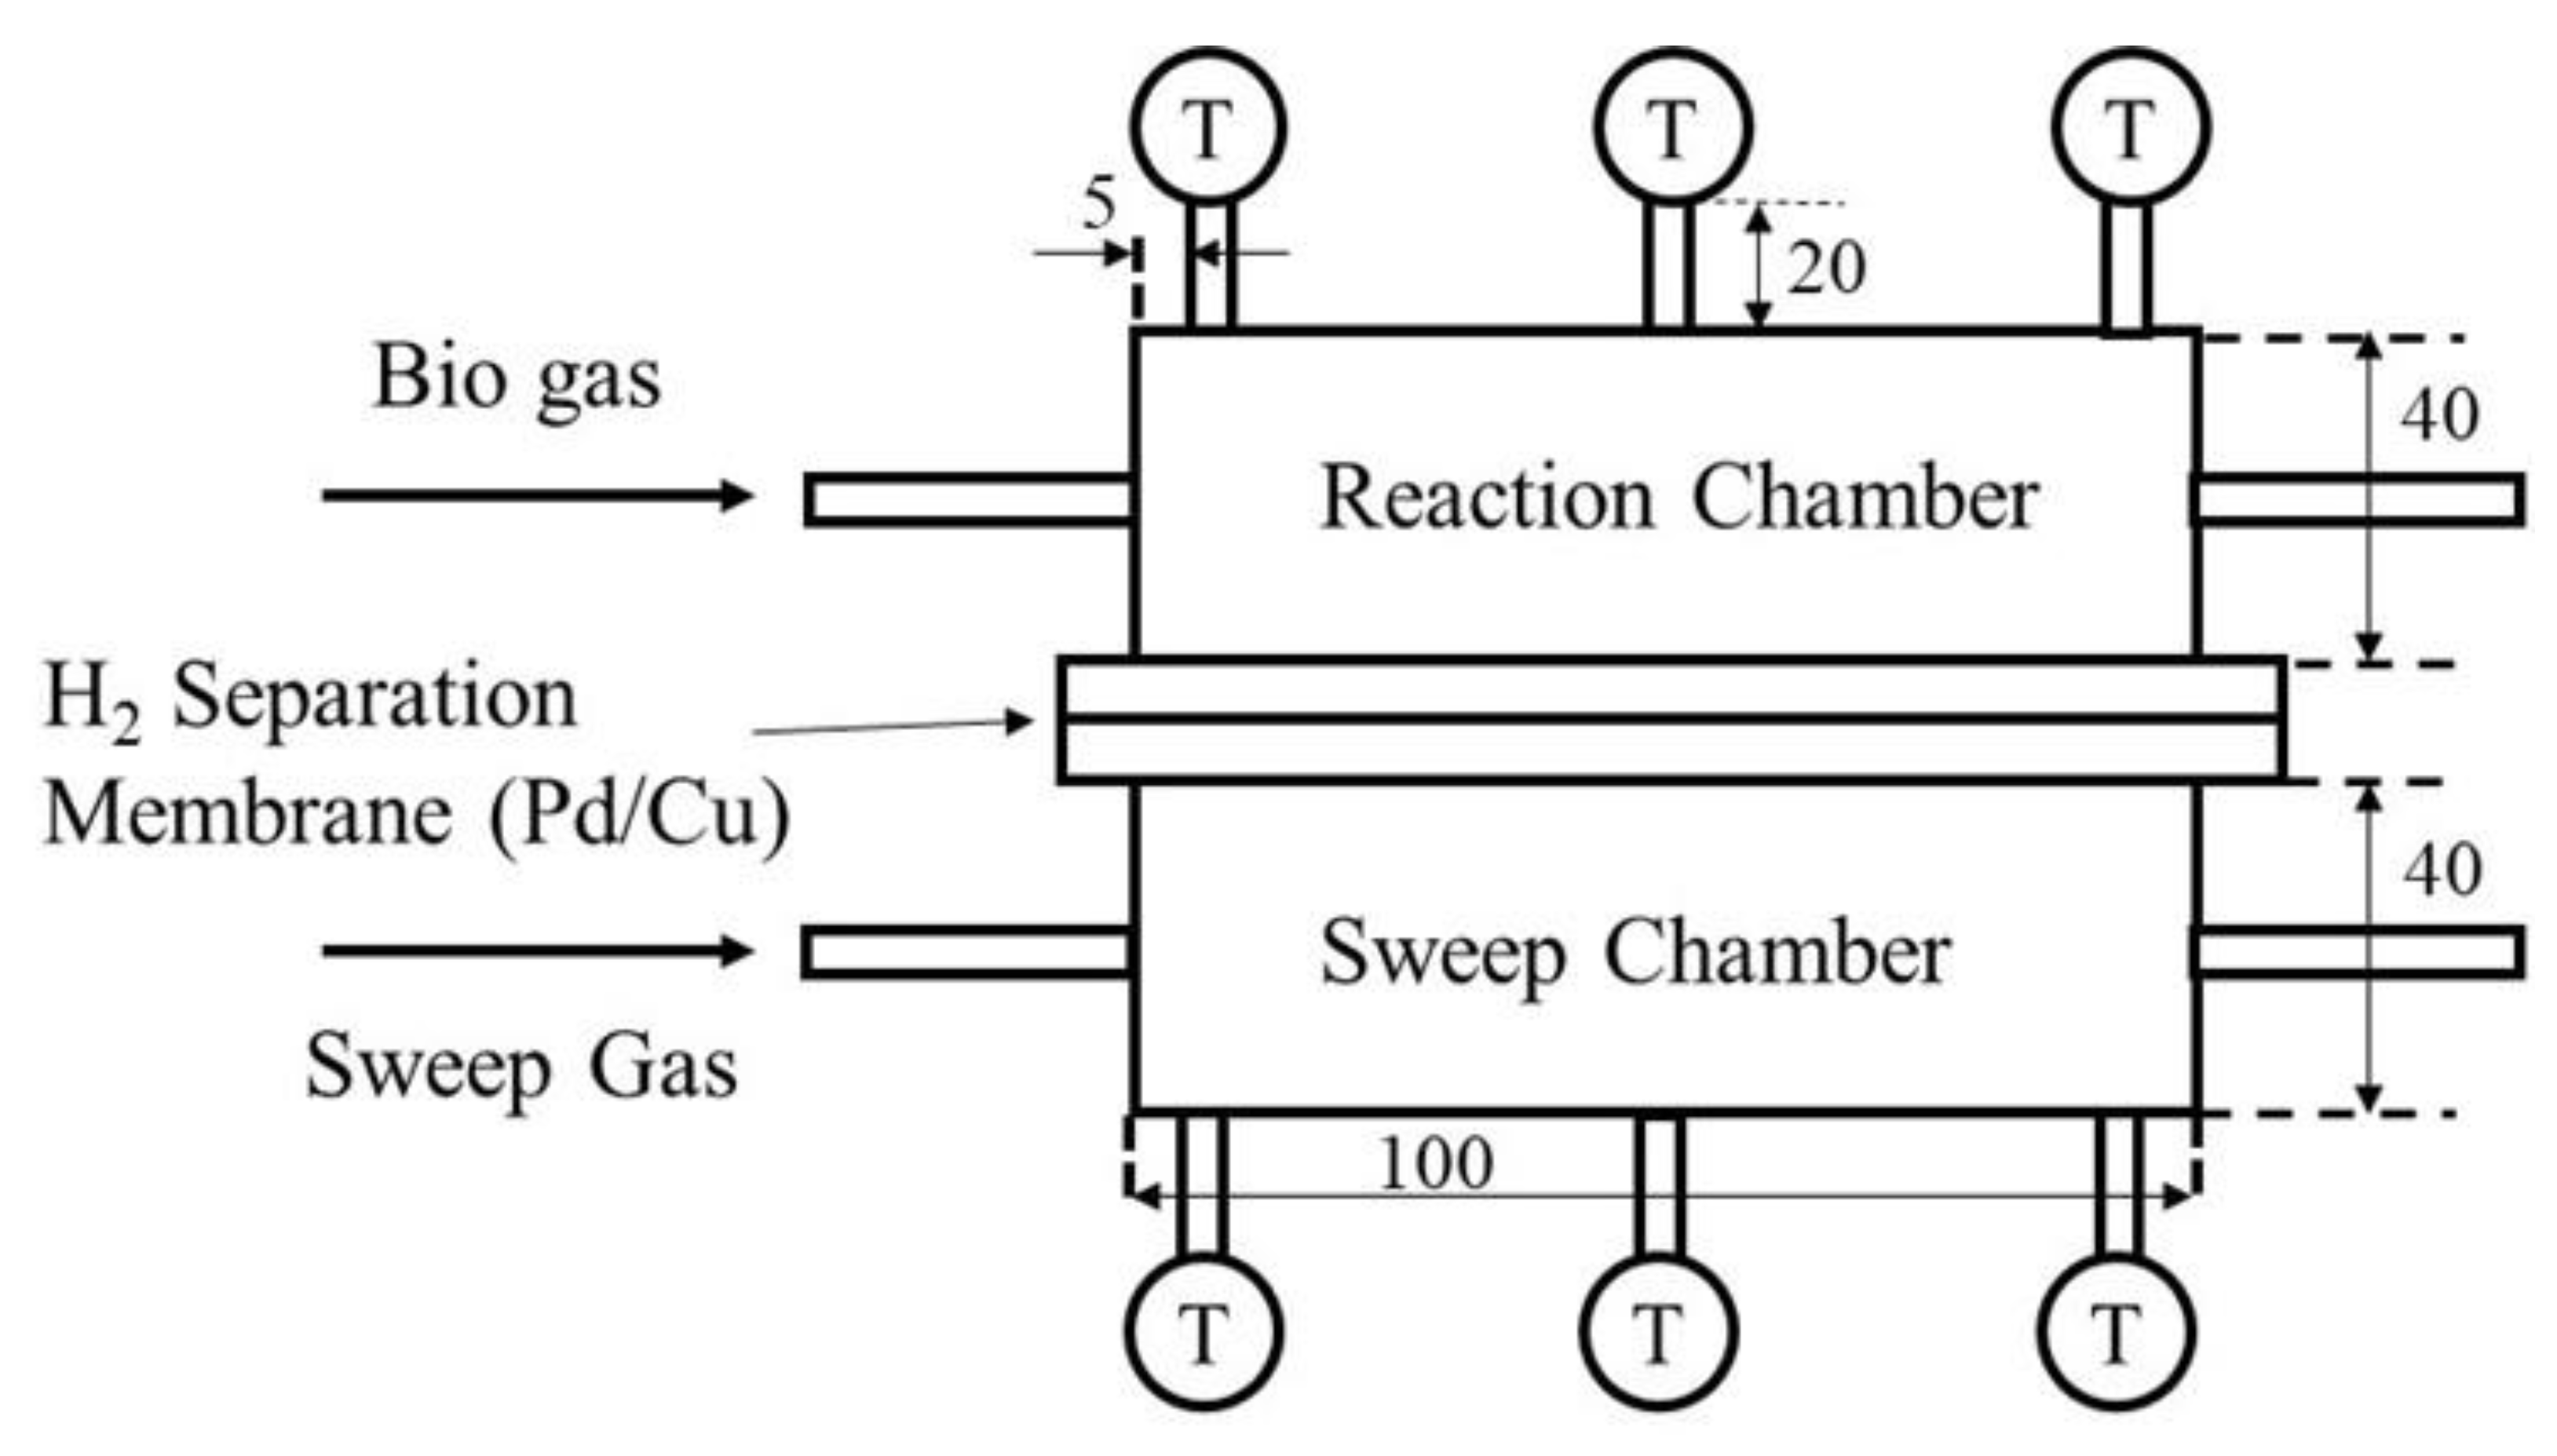
Figure 3.
Photo of charged Ni/Cr catalyst in the reactor.
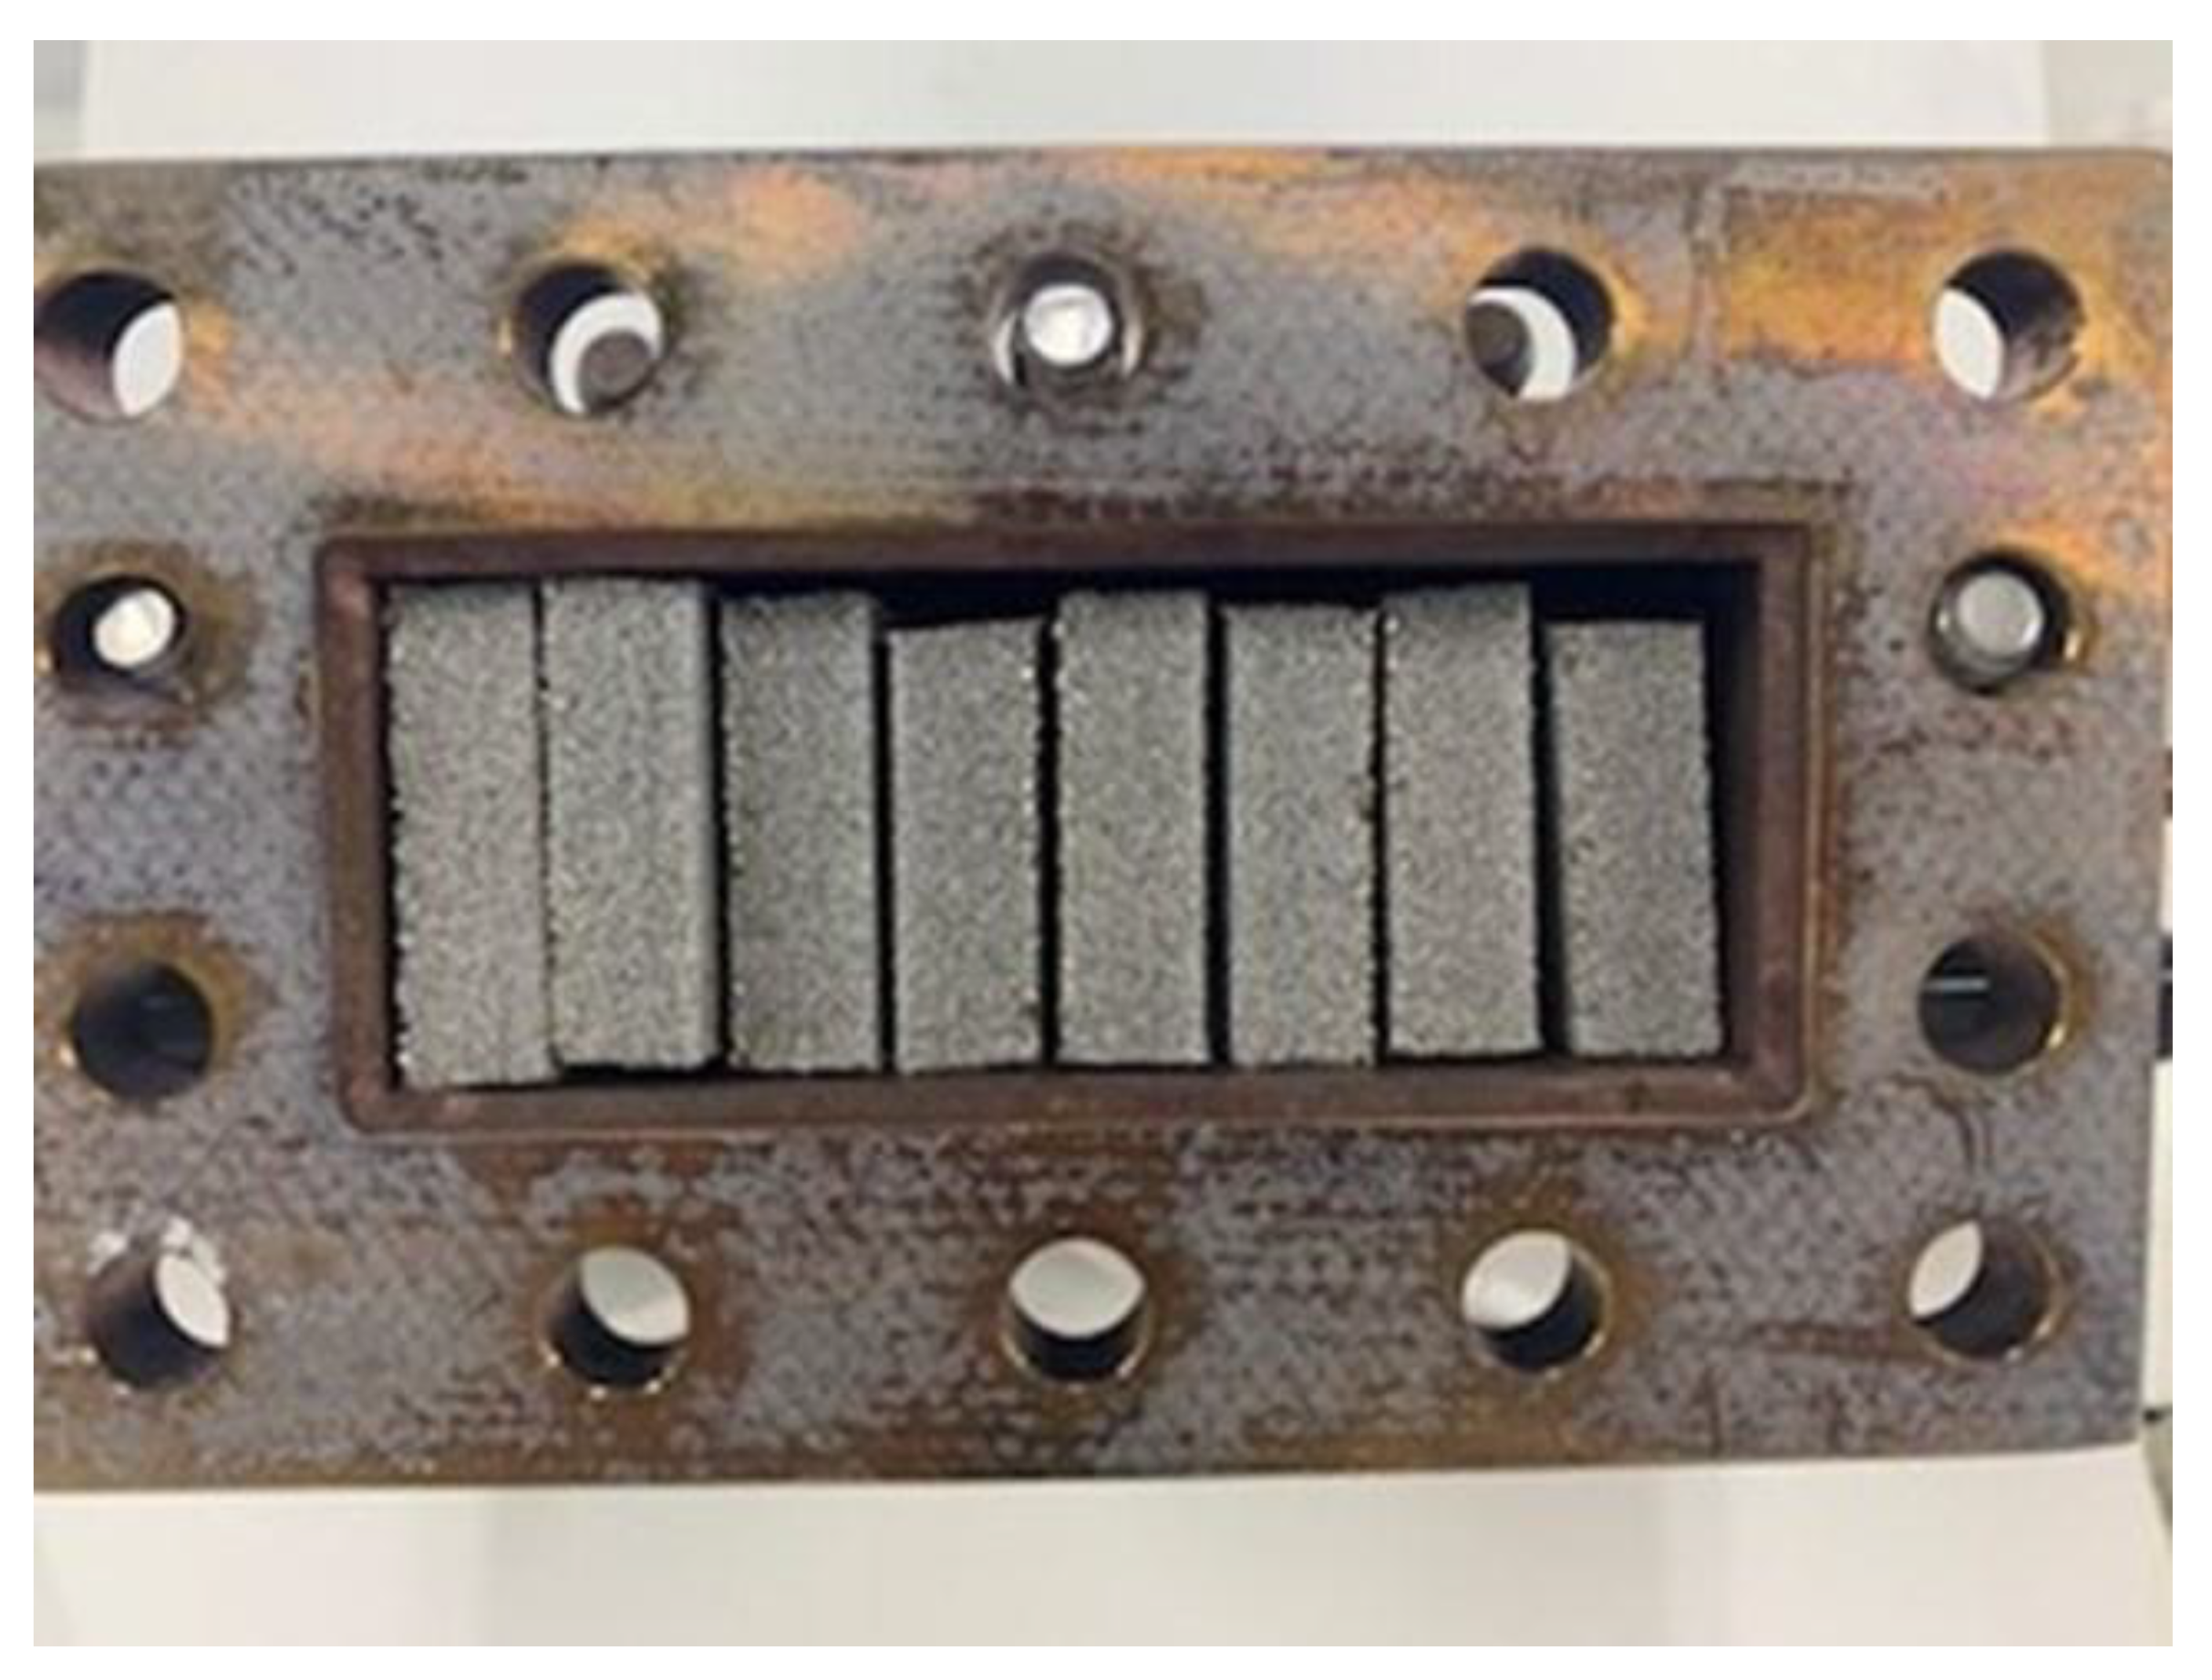
Figure 4.
Photo of Pd/Cu membrane with the thickness of 60 μm.

Figure 5.
Impact of Pd/Cu membrane on the reaction characteristics in the reaction chamber changing the initial reaction temperature and the molar ratio of CH4:CO2 (differential pressure: 0 MPa; a): CH4:CO2 = 1.5:1, b): CH4:CO2 = 1:1, c): CH4:CO2 = 1:1.5).
Figure 5.
Impact of Pd/Cu membrane on the reaction characteristics in the reaction chamber changing the initial reaction temperature and the molar ratio of CH4:CO2 (differential pressure: 0 MPa; a): CH4:CO2 = 1.5:1, b): CH4:CO2 = 1:1, c): CH4:CO2 = 1:1.5).
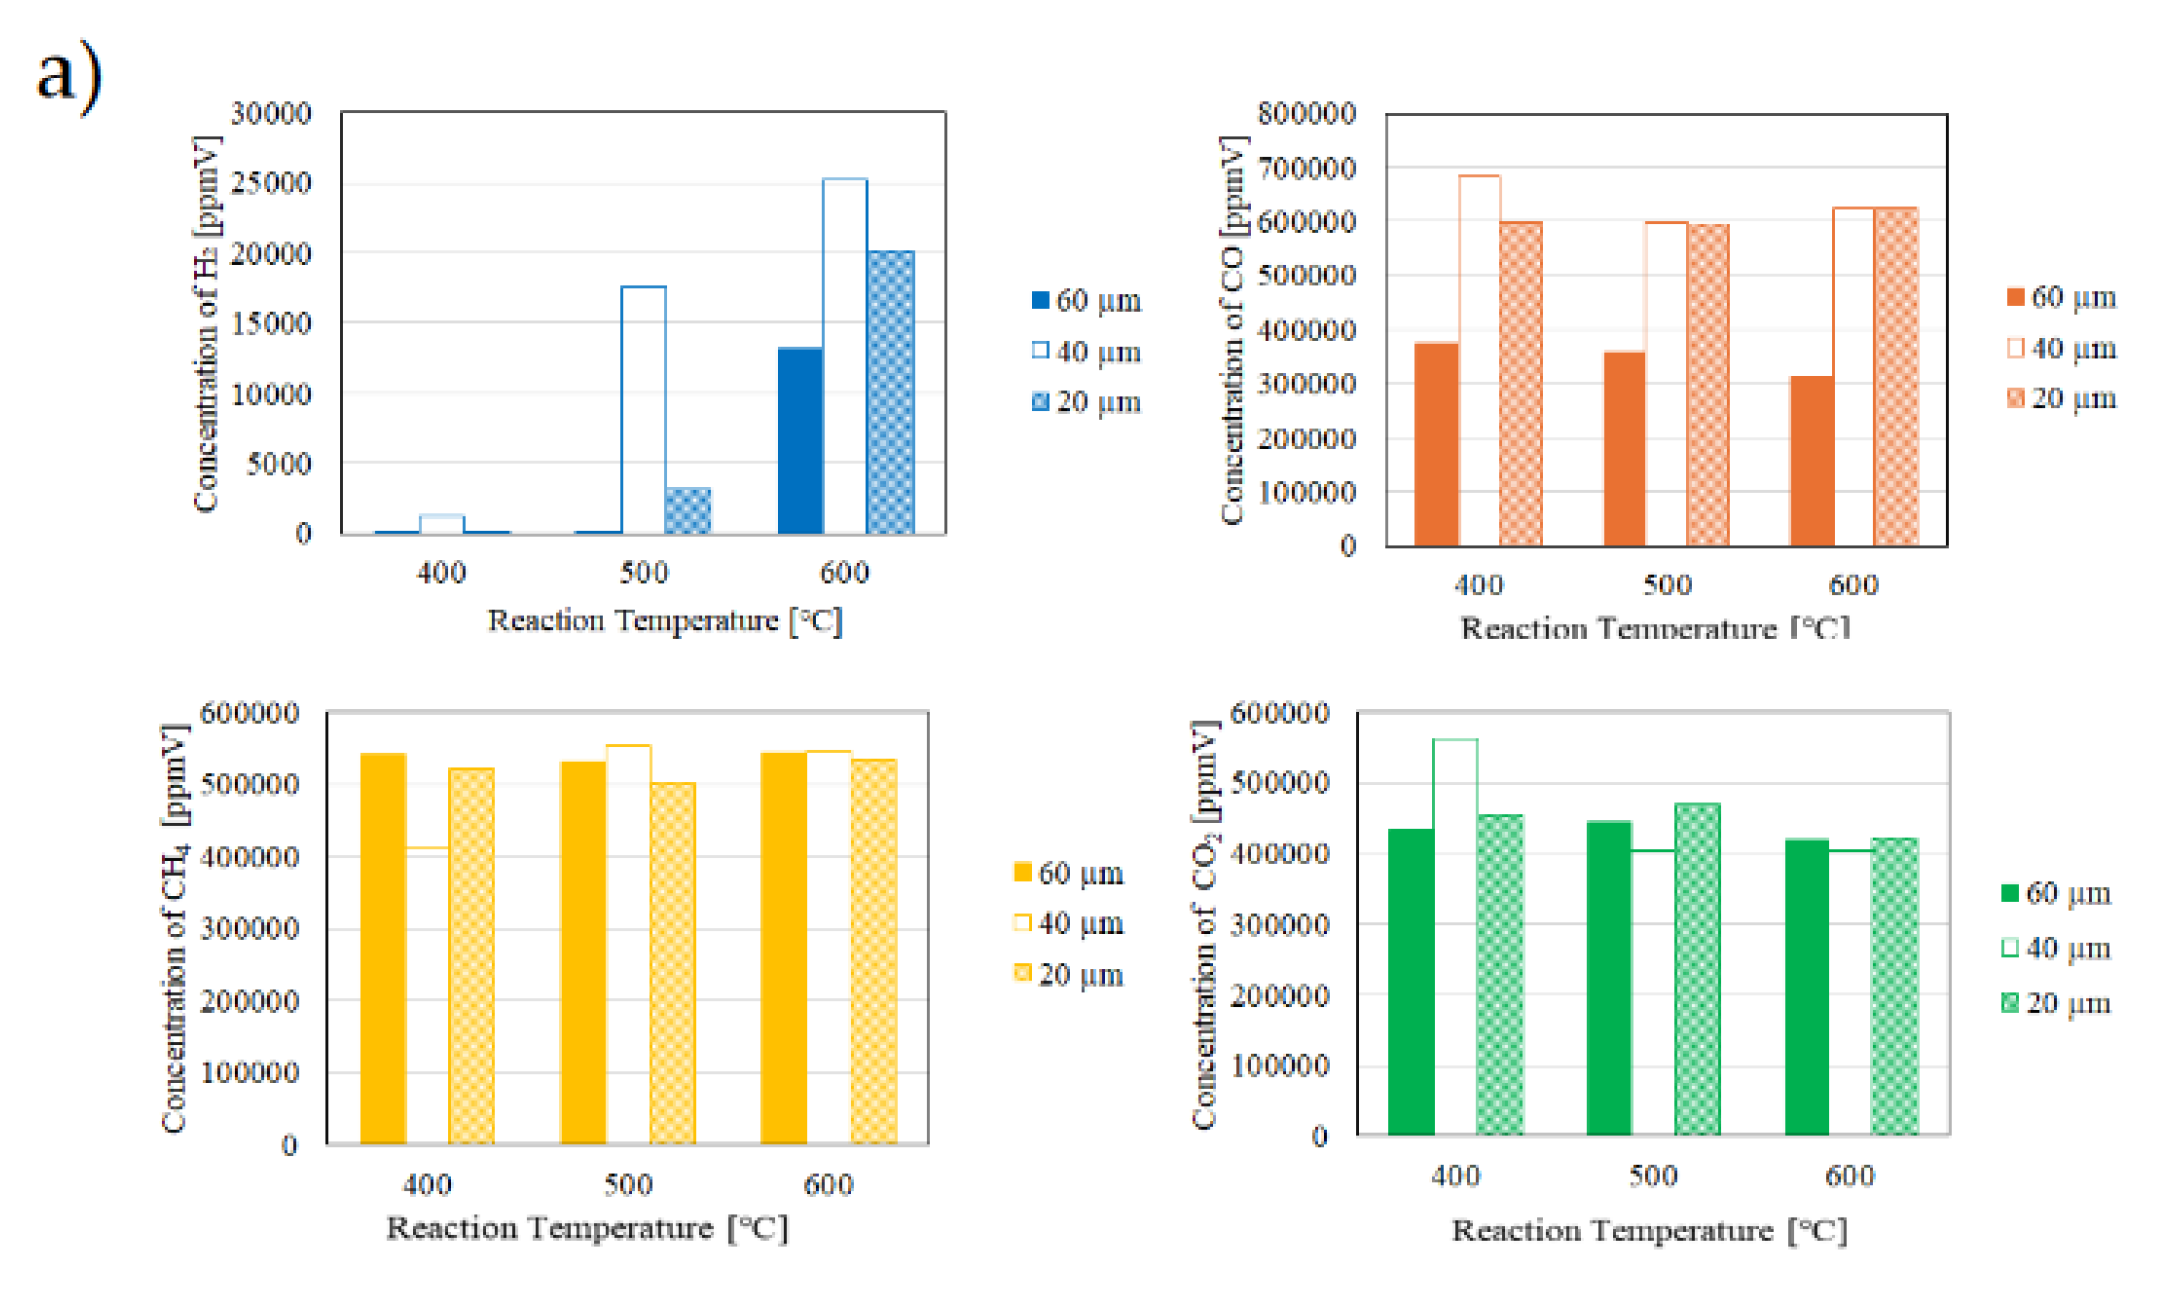
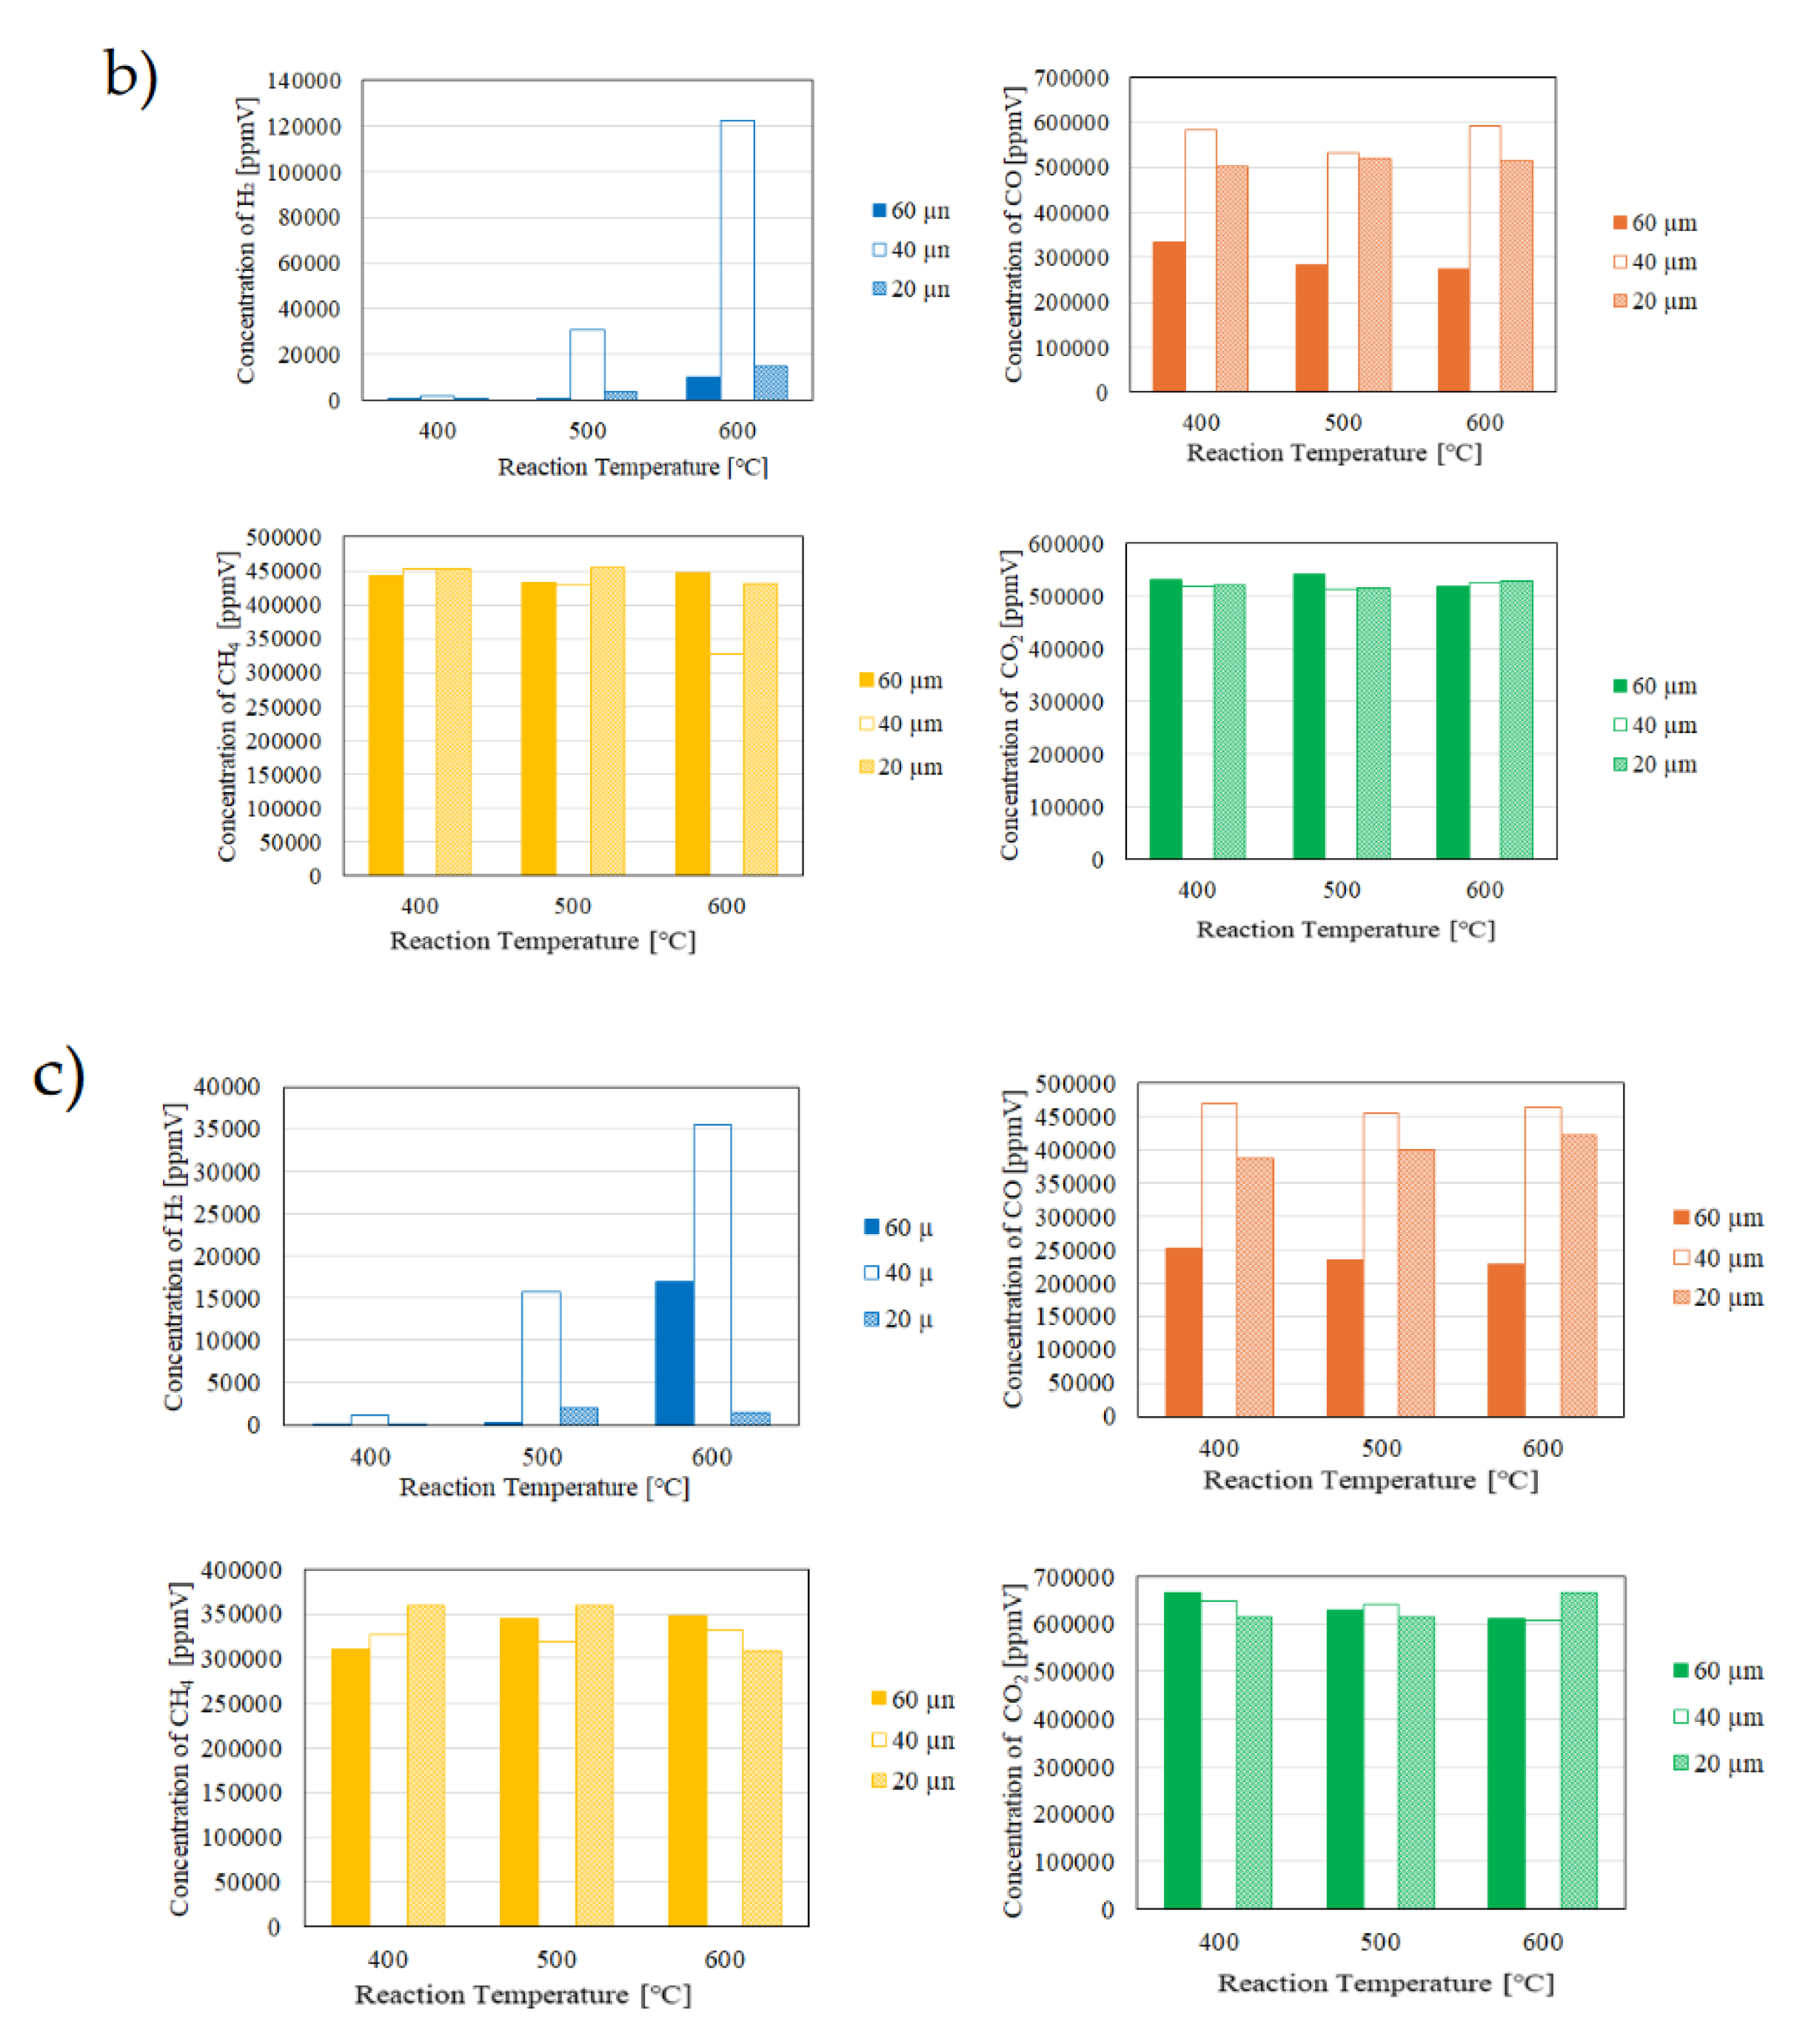
Figure 6.
Impact of thickness of Pd/Cu membrane on the H2 separation characteristics in the sweep chamber changing the initial reaction temperature and the molar ratio of CH4:CO2 (differential pressure: 0 MPa; a): CH4:CO2 = 1.5:1, b): CH4:CO2 = 1:1, c): CH4:CO2 = 1:1.5).
Figure 6.
Impact of thickness of Pd/Cu membrane on the H2 separation characteristics in the sweep chamber changing the initial reaction temperature and the molar ratio of CH4:CO2 (differential pressure: 0 MPa; a): CH4:CO2 = 1.5:1, b): CH4:CO2 = 1:1, c): CH4:CO2 = 1:1.5).
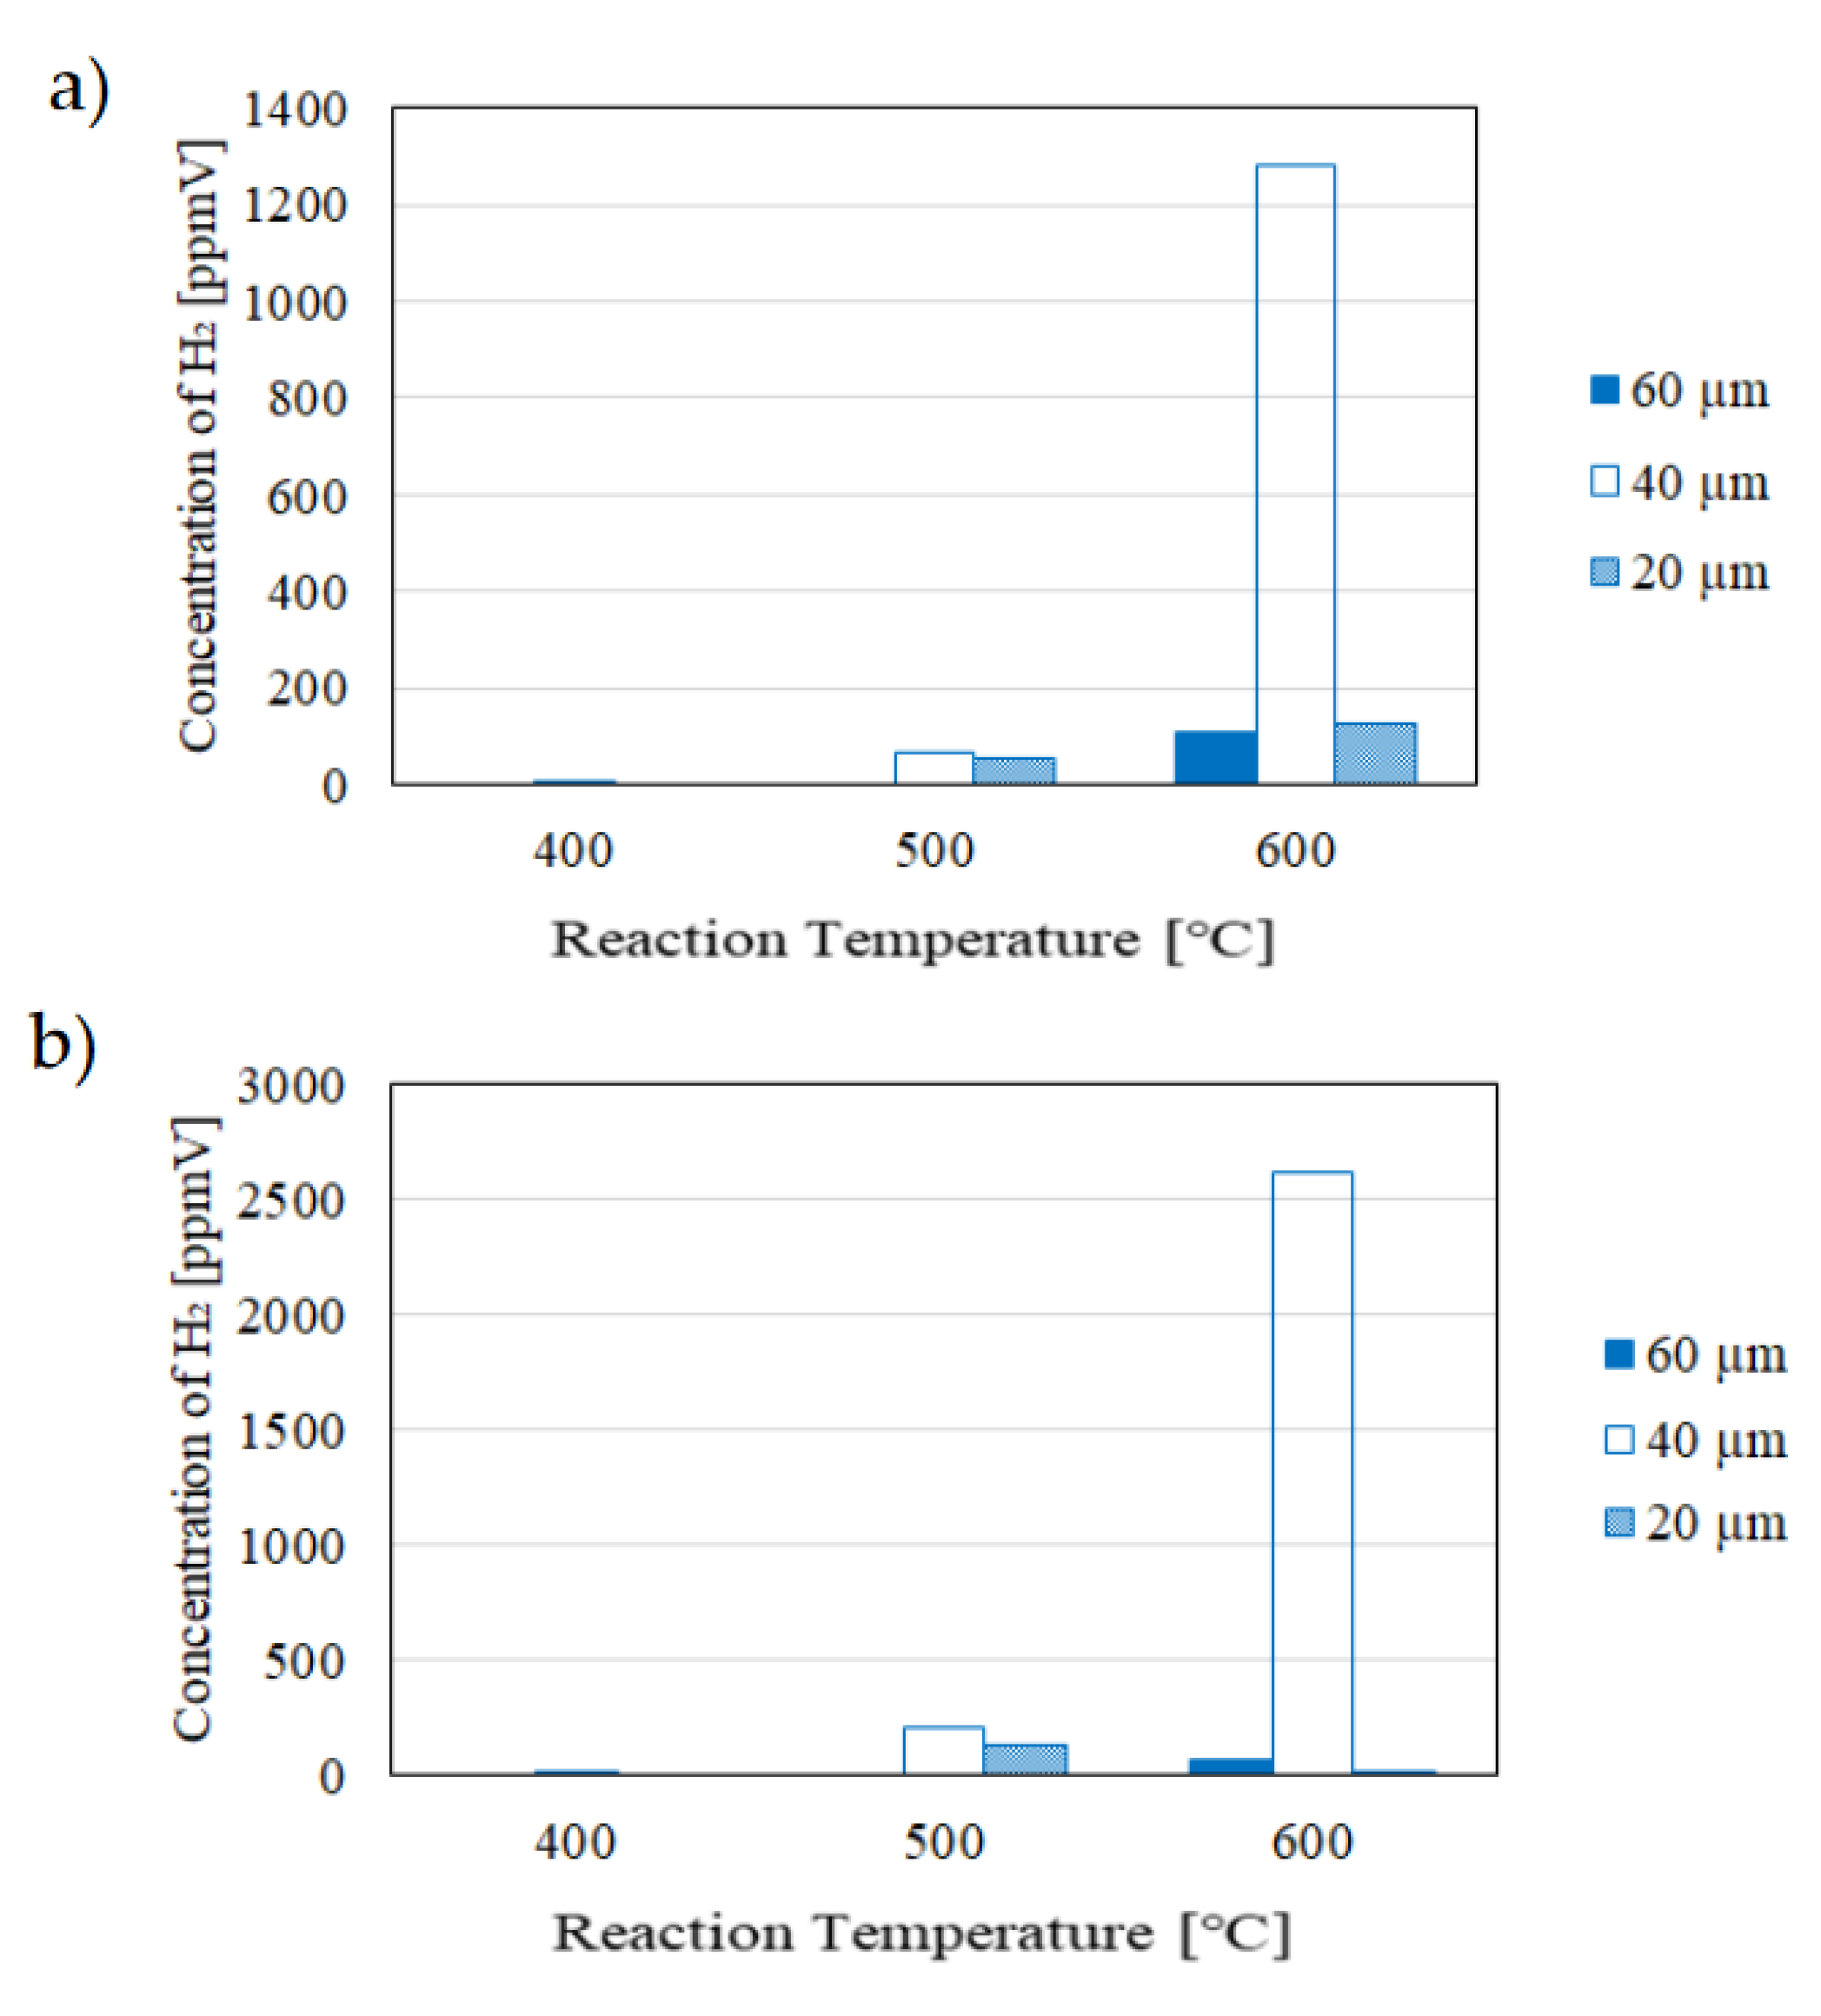
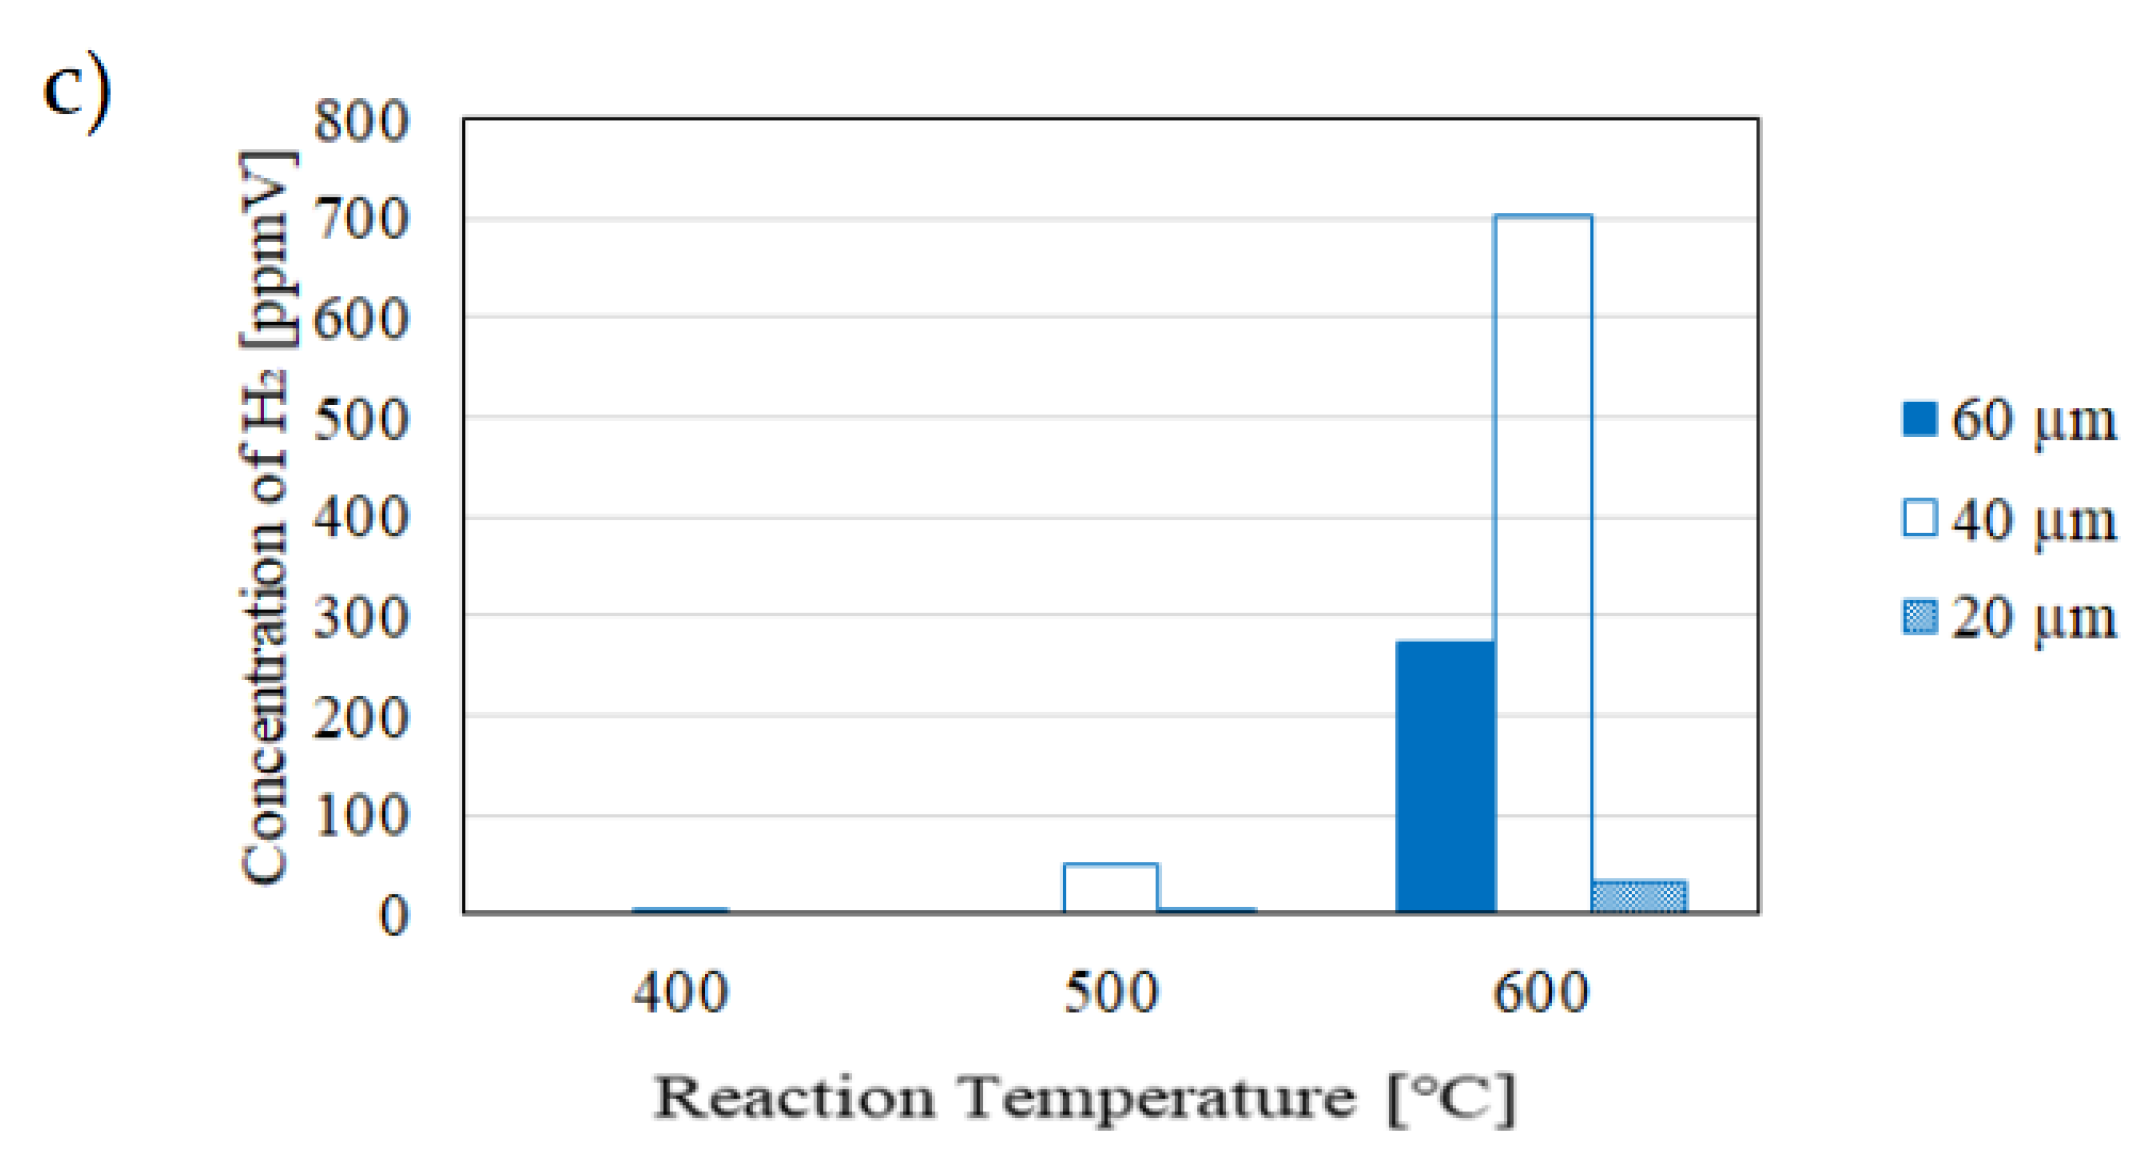
Figure 7.
Impact of thickness of Pd/Cu membrane on the reaction characteristics in the reaction chamber changing the initial reaction temperature and the molar ratio of CH4:CO2 (differential pressure: 0.010 MPa; a): CH4:CO2 = 1.5:1, b): CH4:CO2 = 1:1, c): CH4:CO2 = 1:1.5).
Figure 7.
Impact of thickness of Pd/Cu membrane on the reaction characteristics in the reaction chamber changing the initial reaction temperature and the molar ratio of CH4:CO2 (differential pressure: 0.010 MPa; a): CH4:CO2 = 1.5:1, b): CH4:CO2 = 1:1, c): CH4:CO2 = 1:1.5).
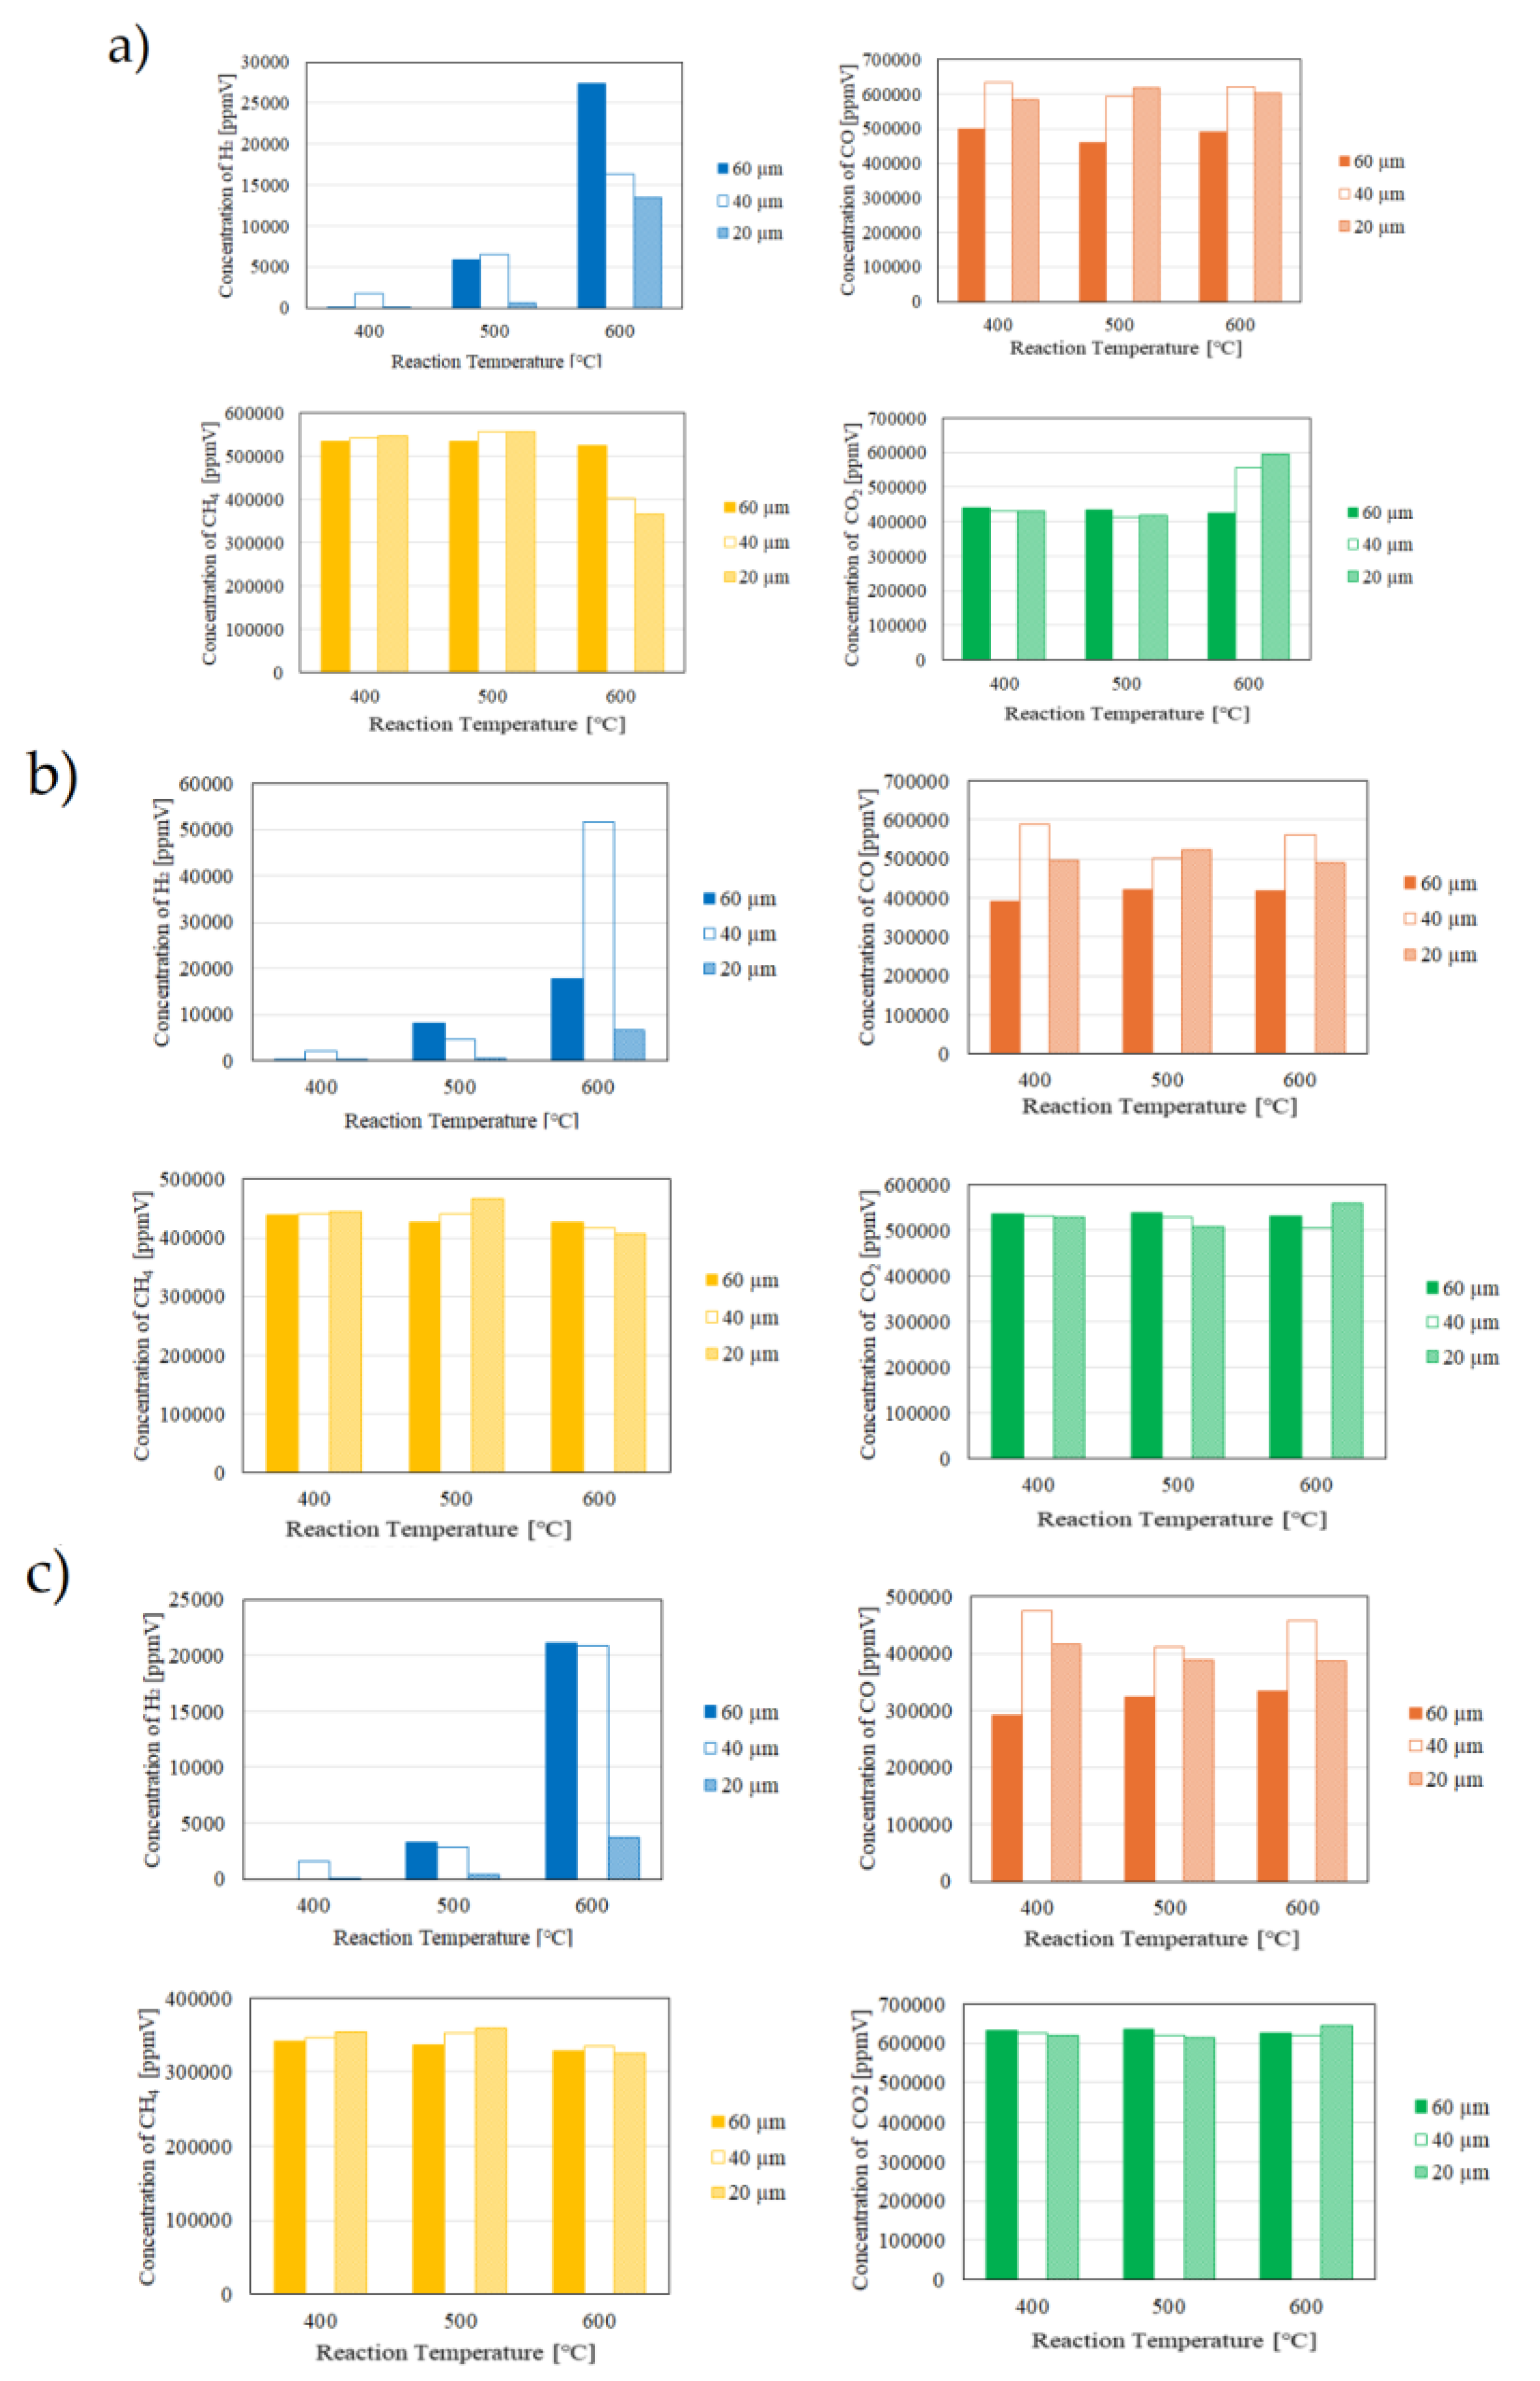
Figure 8.
Impact of Pd/Cu membrane on the H2 separation characteristics in the sweep chamber changing the initial reaction temperature and the molar ratio of CH4:CO2 (differential pressure: 0.010 MPa; a): CH4:CO2 = 1.5:1, b): CH4:CO2 = 1:1, c): CH4:CO2 = 1:1.5).
Figure 8.
Impact of Pd/Cu membrane on the H2 separation characteristics in the sweep chamber changing the initial reaction temperature and the molar ratio of CH4:CO2 (differential pressure: 0.010 MPa; a): CH4:CO2 = 1.5:1, b): CH4:CO2 = 1:1, c): CH4:CO2 = 1:1.5).
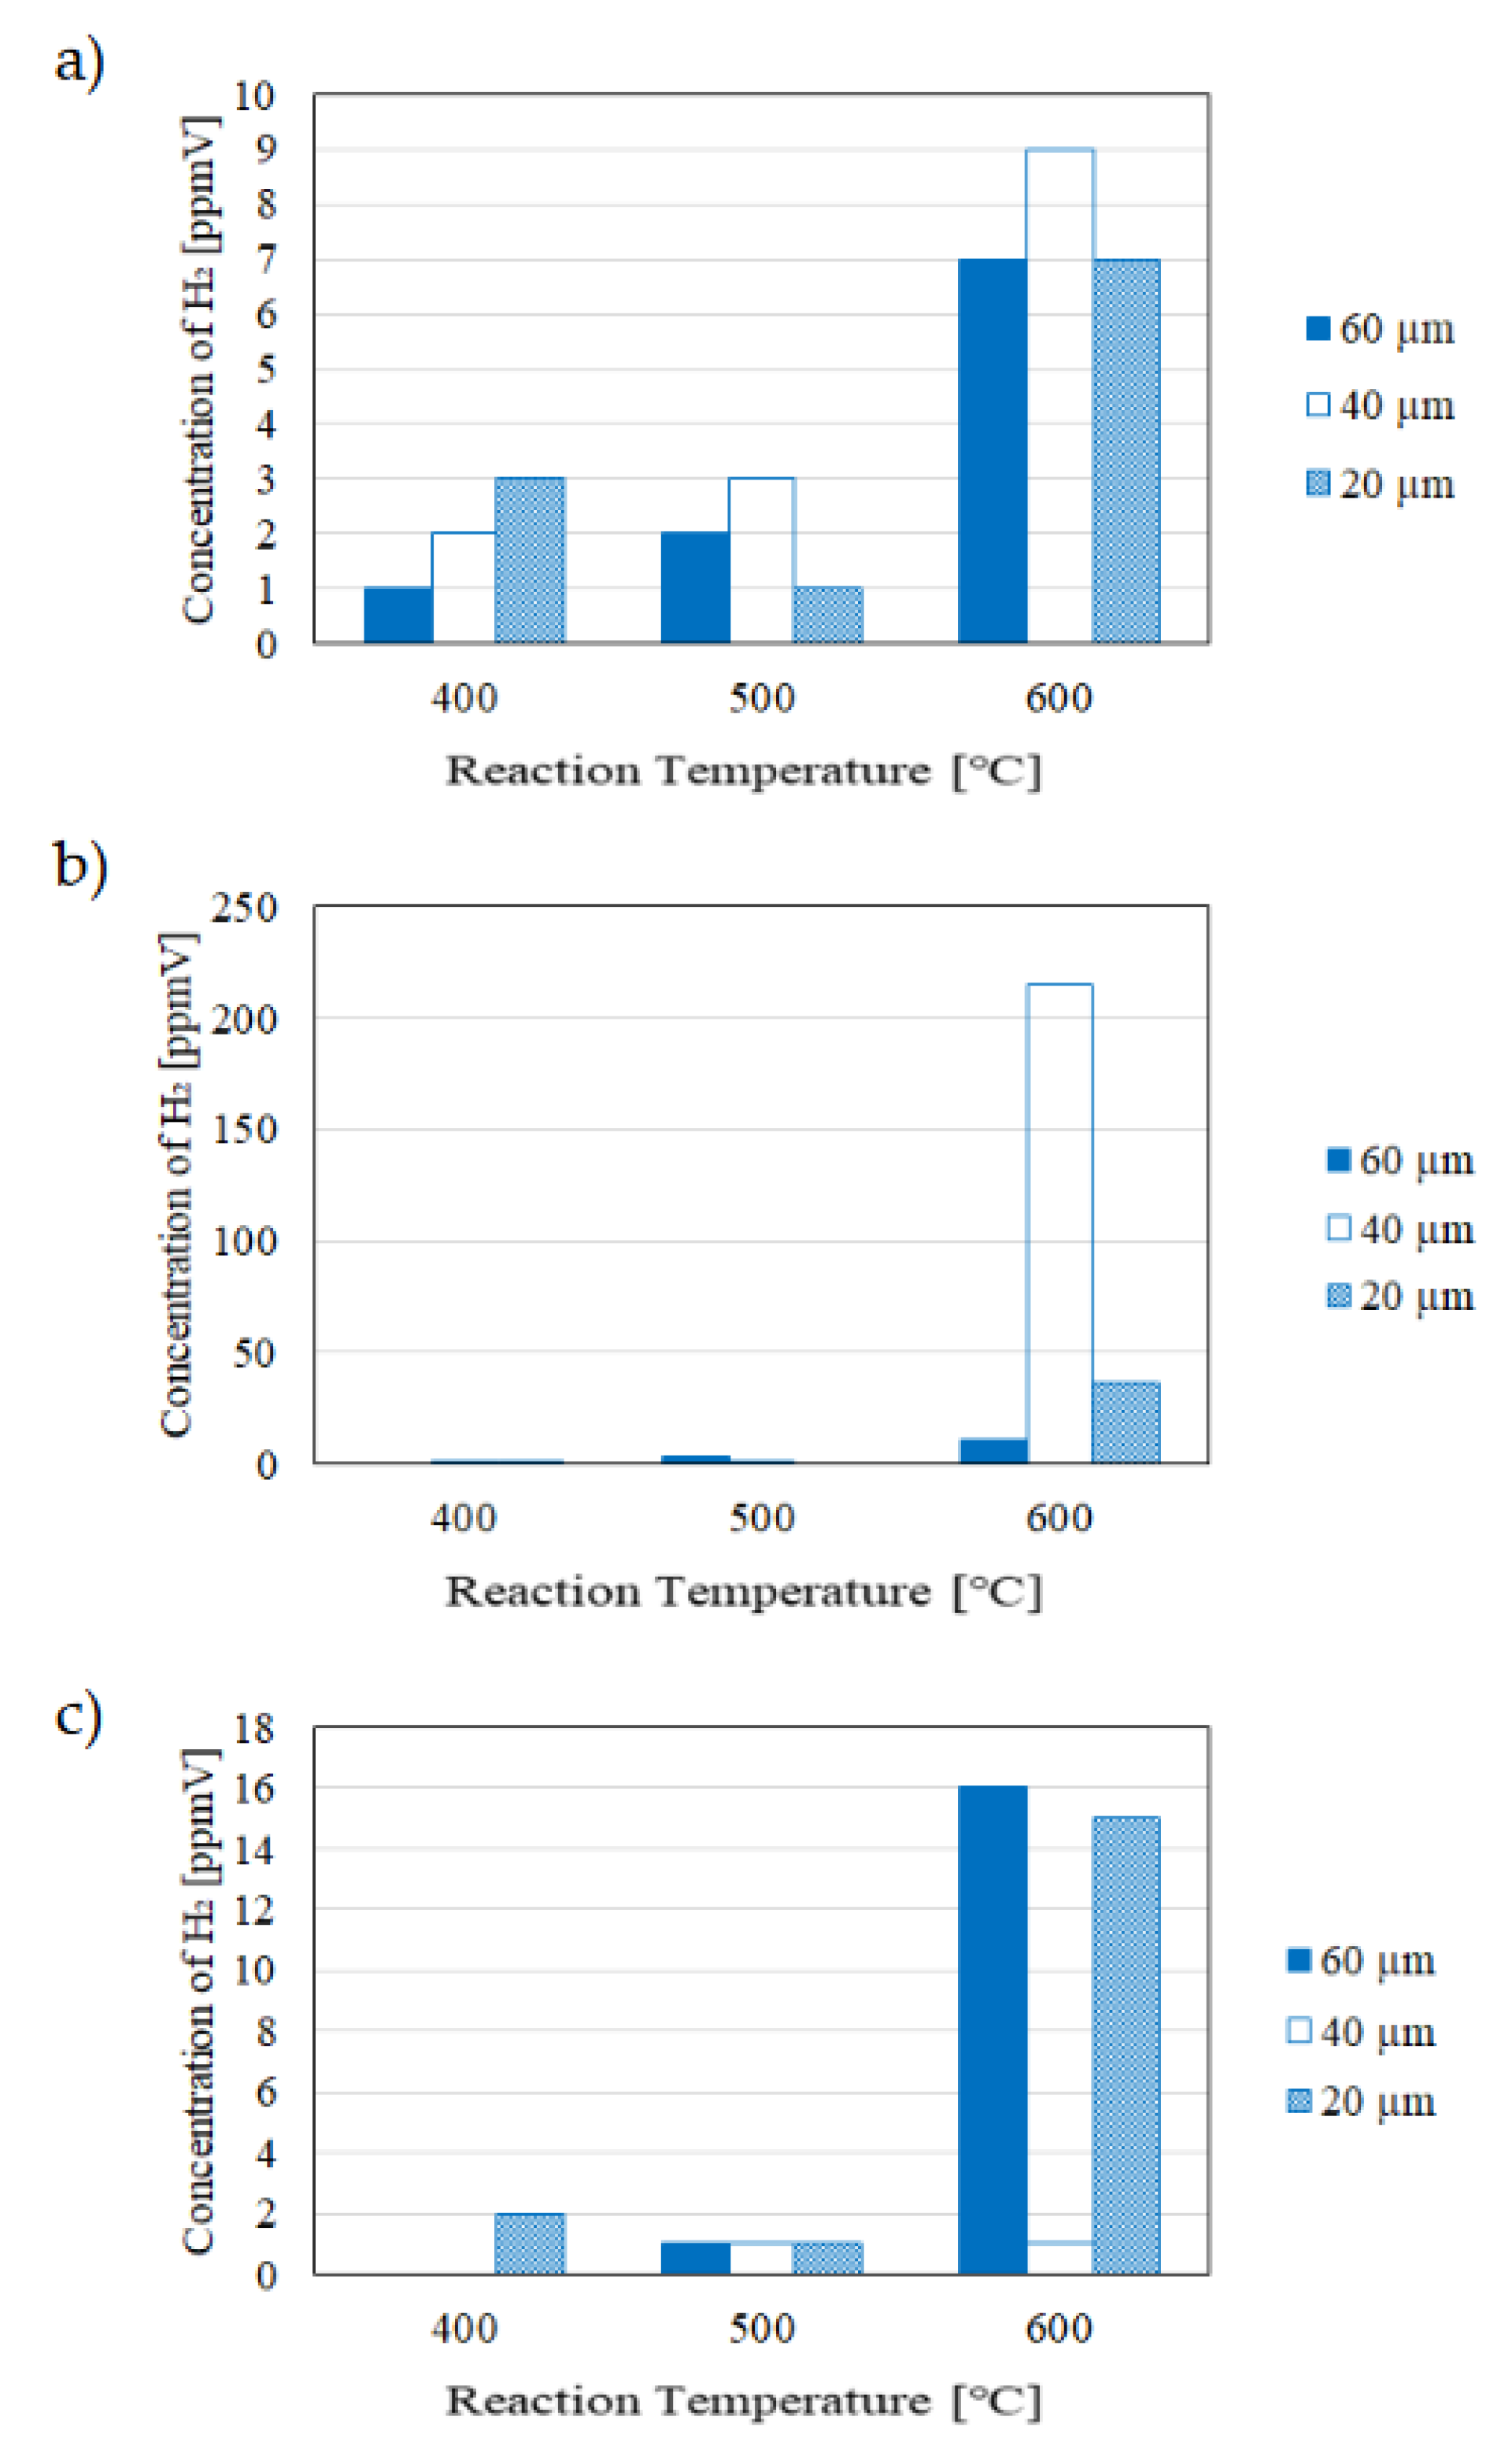
Figure 9.
Impact of thickness of Pd/Cu membrane on the reaction characteristics in the reaction chamber changing the initial reaction temperature and the molar ratio of CH4:CO2 (differential pressure: 0.020 MPa; a): CH4:CO2 = 1.5:1, b): CH4:CO2 = 1:1, c): CH4:CO2 = 1:1.5).
Figure 9.
Impact of thickness of Pd/Cu membrane on the reaction characteristics in the reaction chamber changing the initial reaction temperature and the molar ratio of CH4:CO2 (differential pressure: 0.020 MPa; a): CH4:CO2 = 1.5:1, b): CH4:CO2 = 1:1, c): CH4:CO2 = 1:1.5).
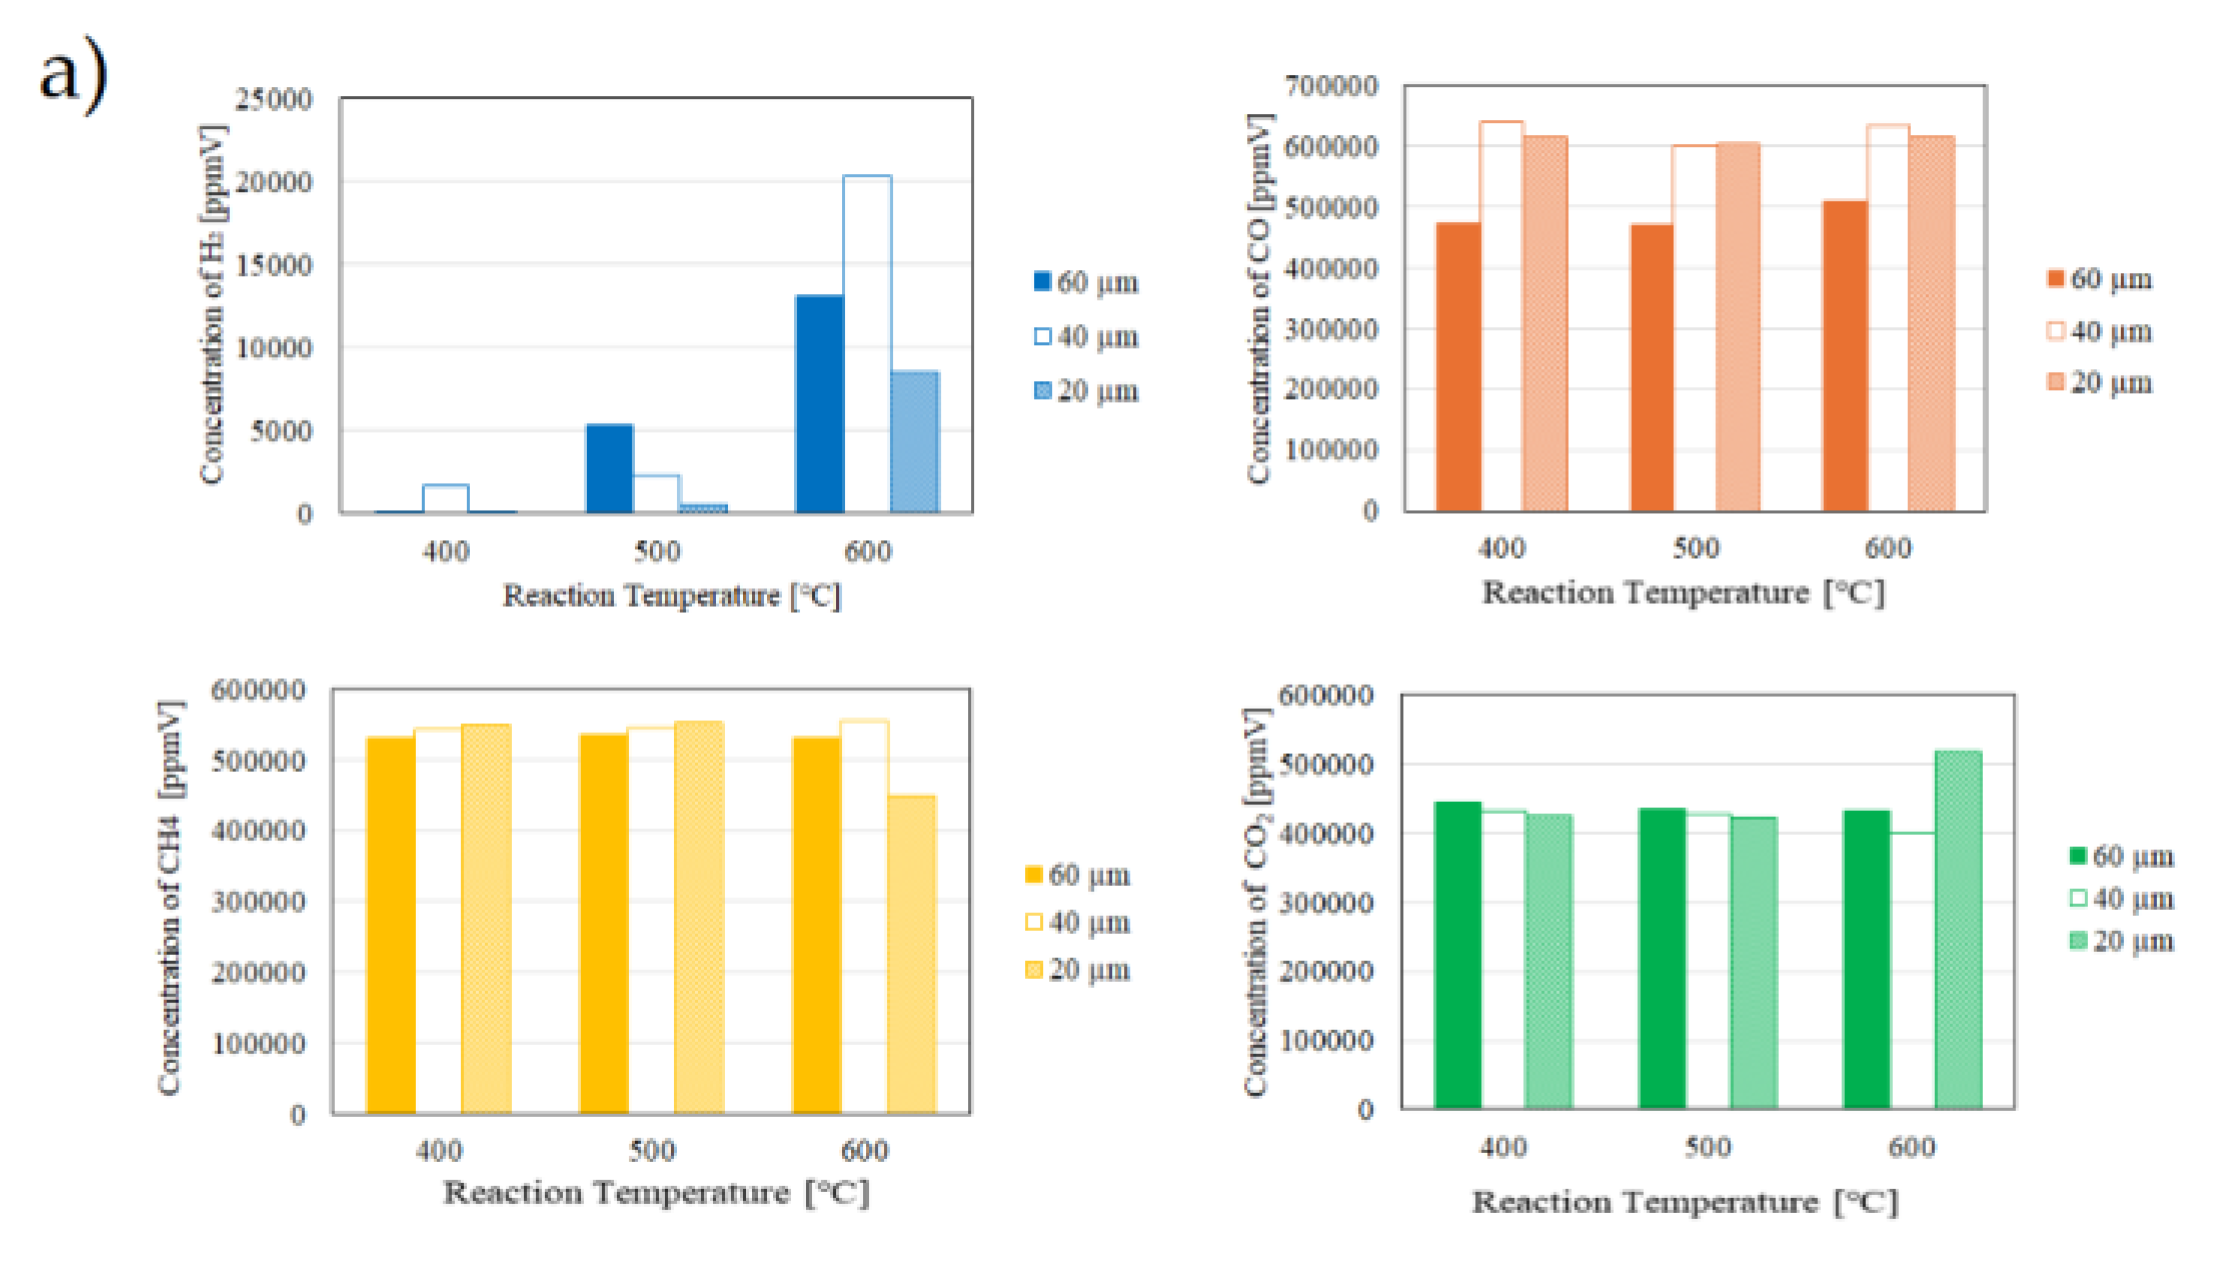
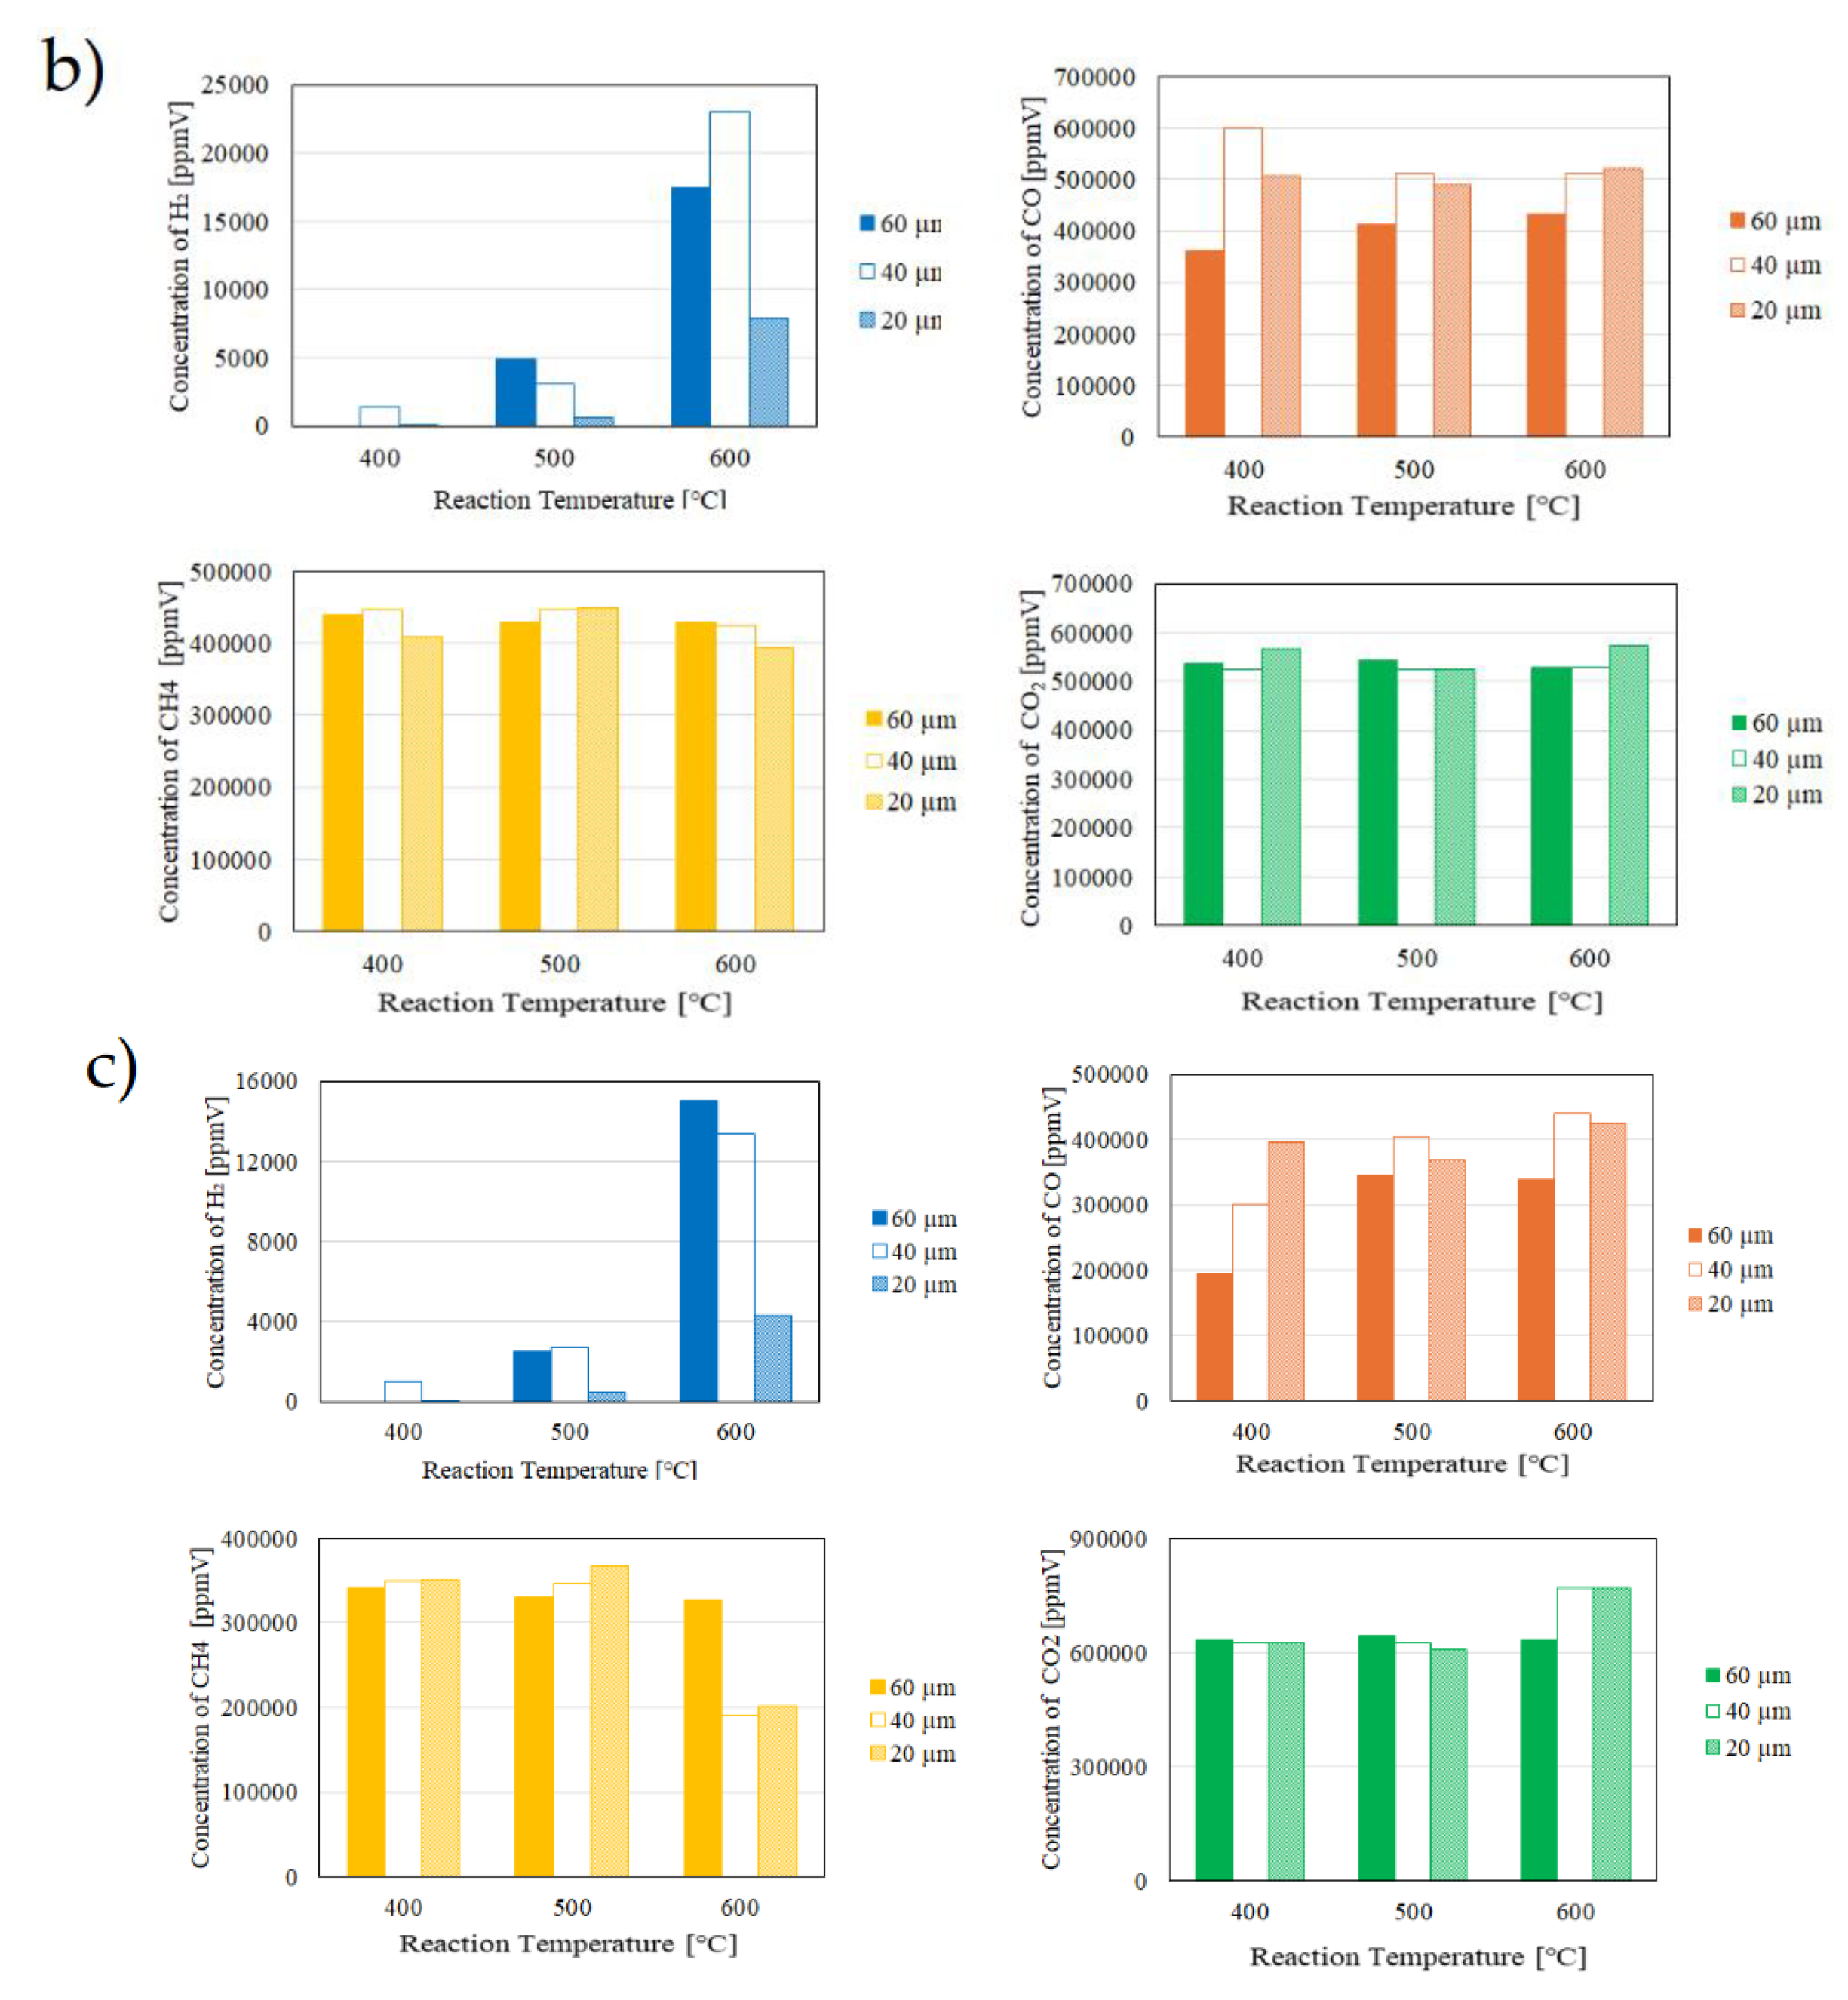
Figure 10.
Impact of thickness of Pd/Cu membrane on the H2 separation characteristics in the sweep chamber changing the initial reaction temperature and the molar ratio of CH4:CO2 (differential pressure: 0.020 MPa; a): CH4:CO2 = 1.5:1, b): CH4:CO2 = 1:1, c): CH4:CO2 = 1:1.5).
Figure 10.
Impact of thickness of Pd/Cu membrane on the H2 separation characteristics in the sweep chamber changing the initial reaction temperature and the molar ratio of CH4:CO2 (differential pressure: 0.020 MPa; a): CH4:CO2 = 1.5:1, b): CH4:CO2 = 1:1, c): CH4:CO2 = 1:1.5).
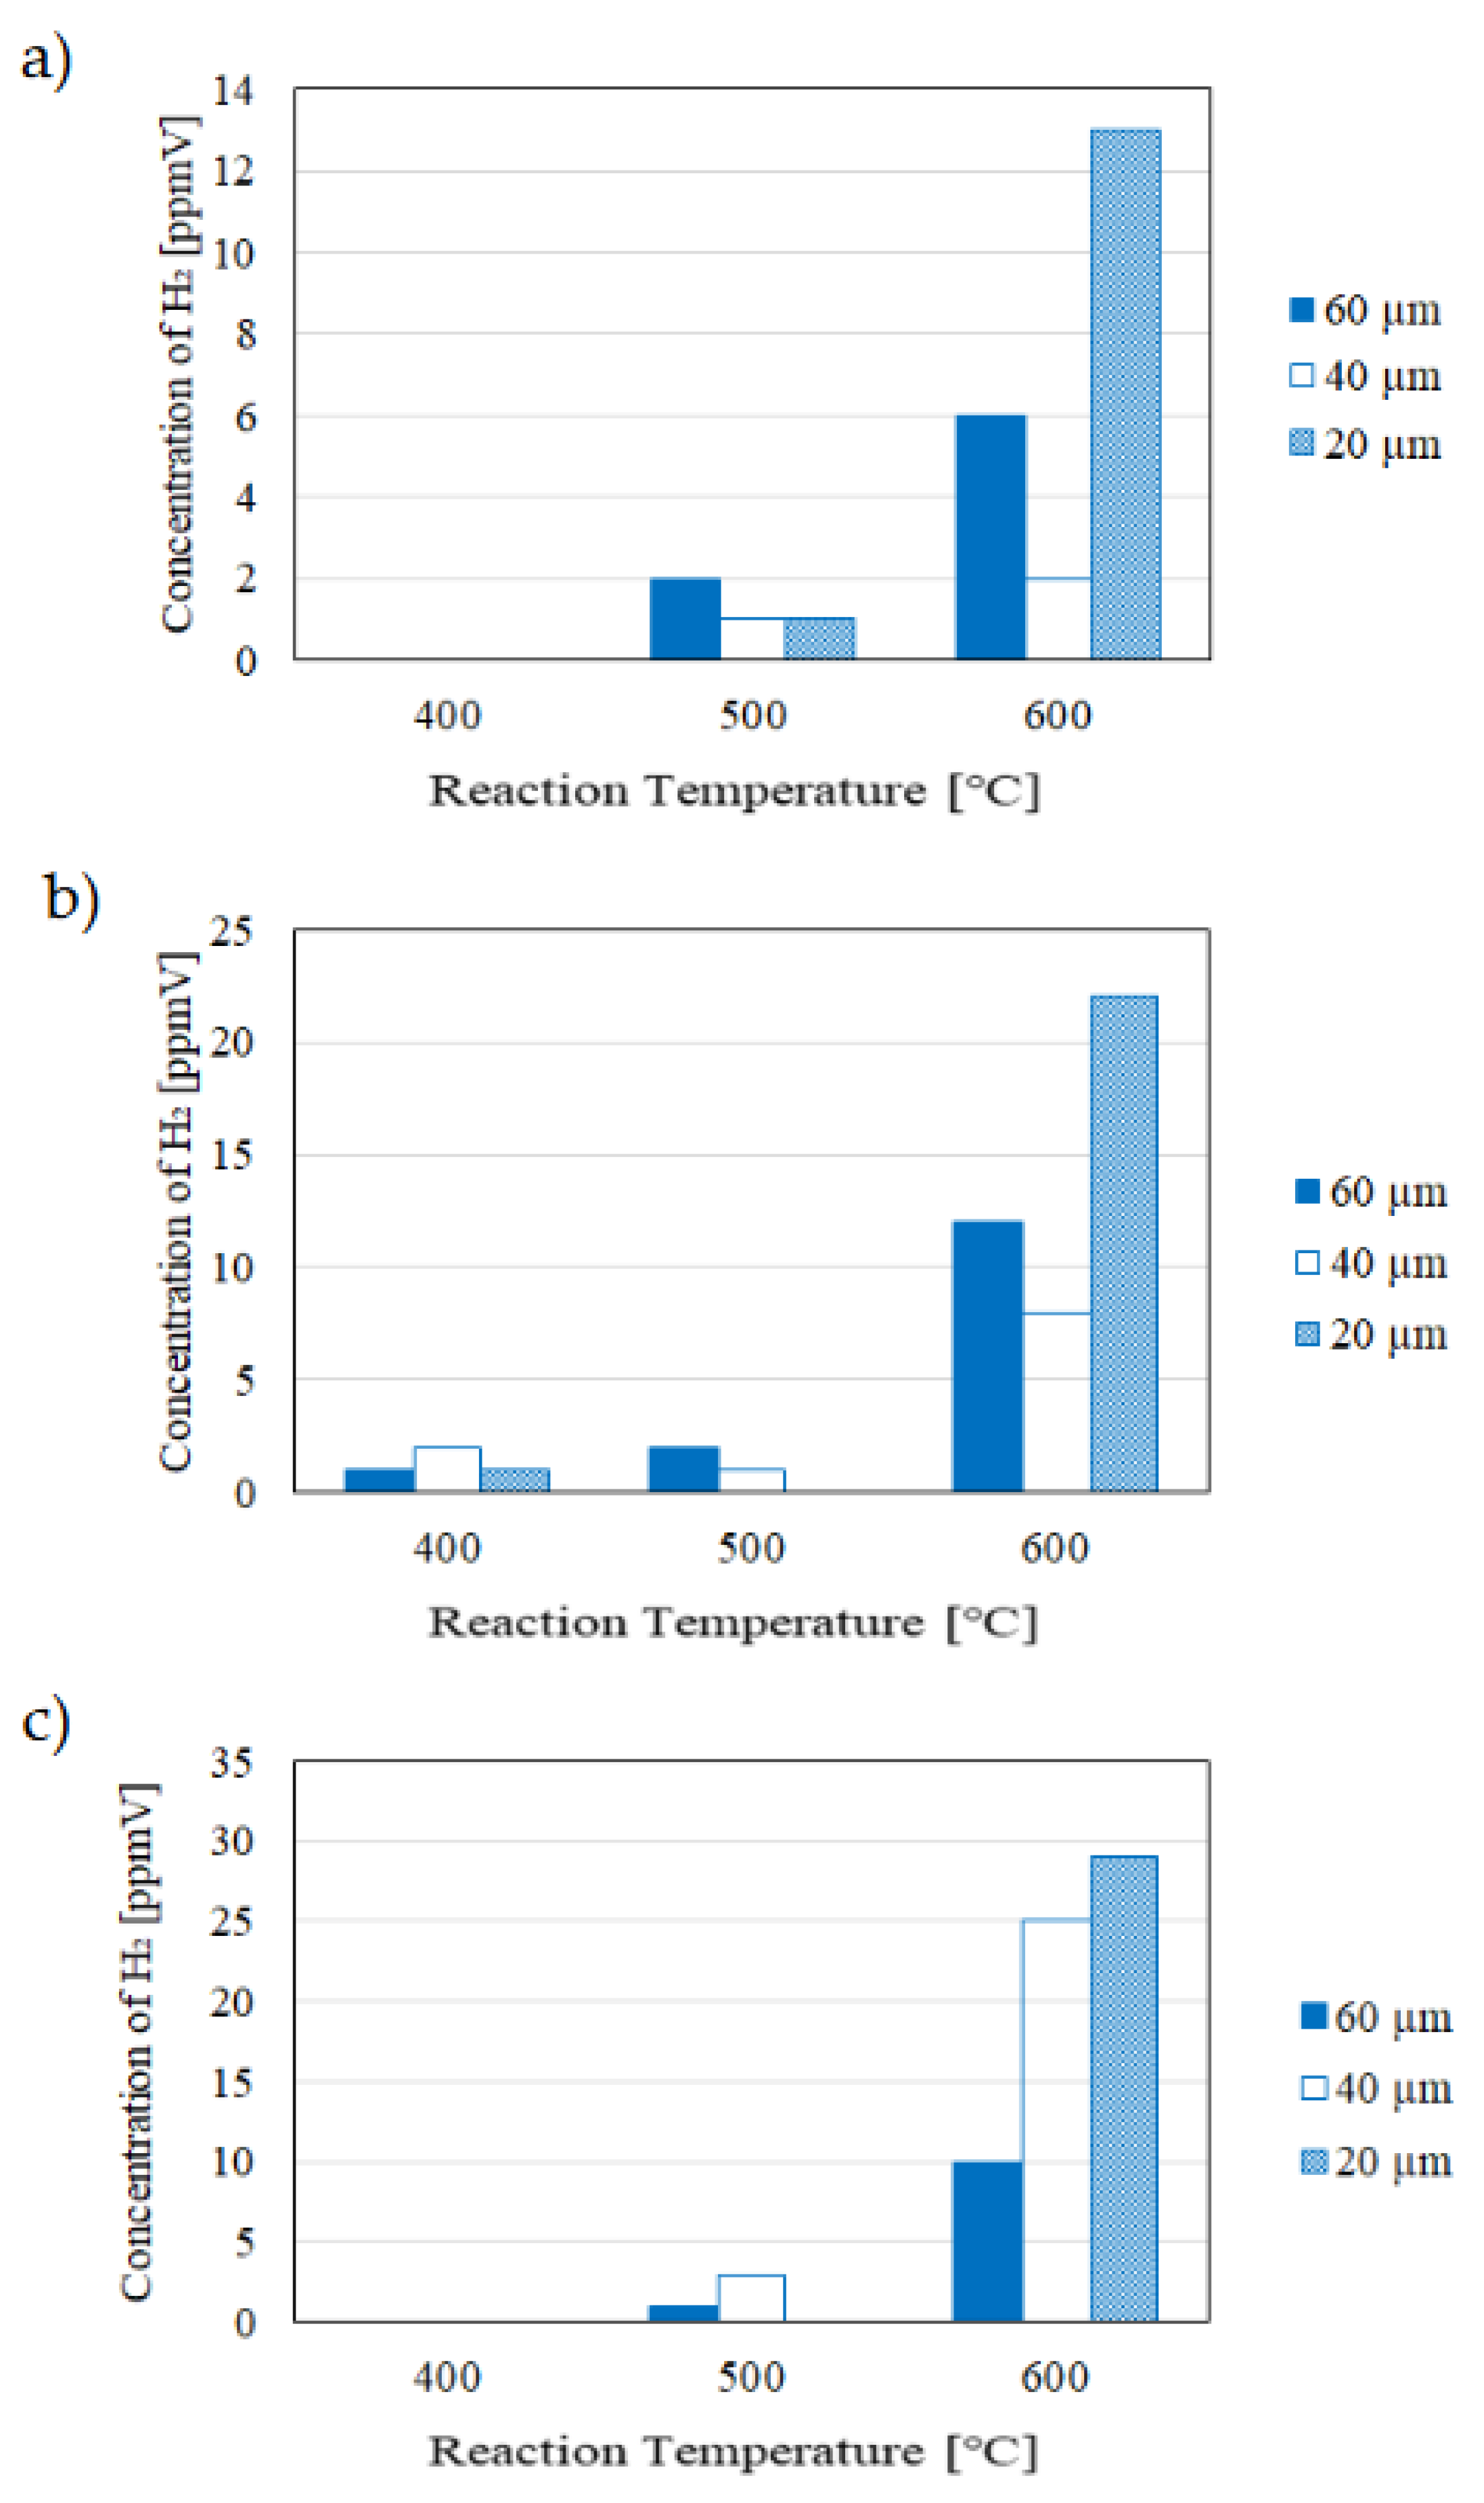
Figure 11.
Impact of thickness of Pd/Cu membrane on the reaction characteristics in the reaction chamber changing the differential pressure (reaction temperature: 600 ℃; a): CH4:CO2 = 1.5:1, b): CH4:CO2 = 1:1, c): CH4:CO2 = 1:1.5).
Figure 11.
Impact of thickness of Pd/Cu membrane on the reaction characteristics in the reaction chamber changing the differential pressure (reaction temperature: 600 ℃; a): CH4:CO2 = 1.5:1, b): CH4:CO2 = 1:1, c): CH4:CO2 = 1:1.5).
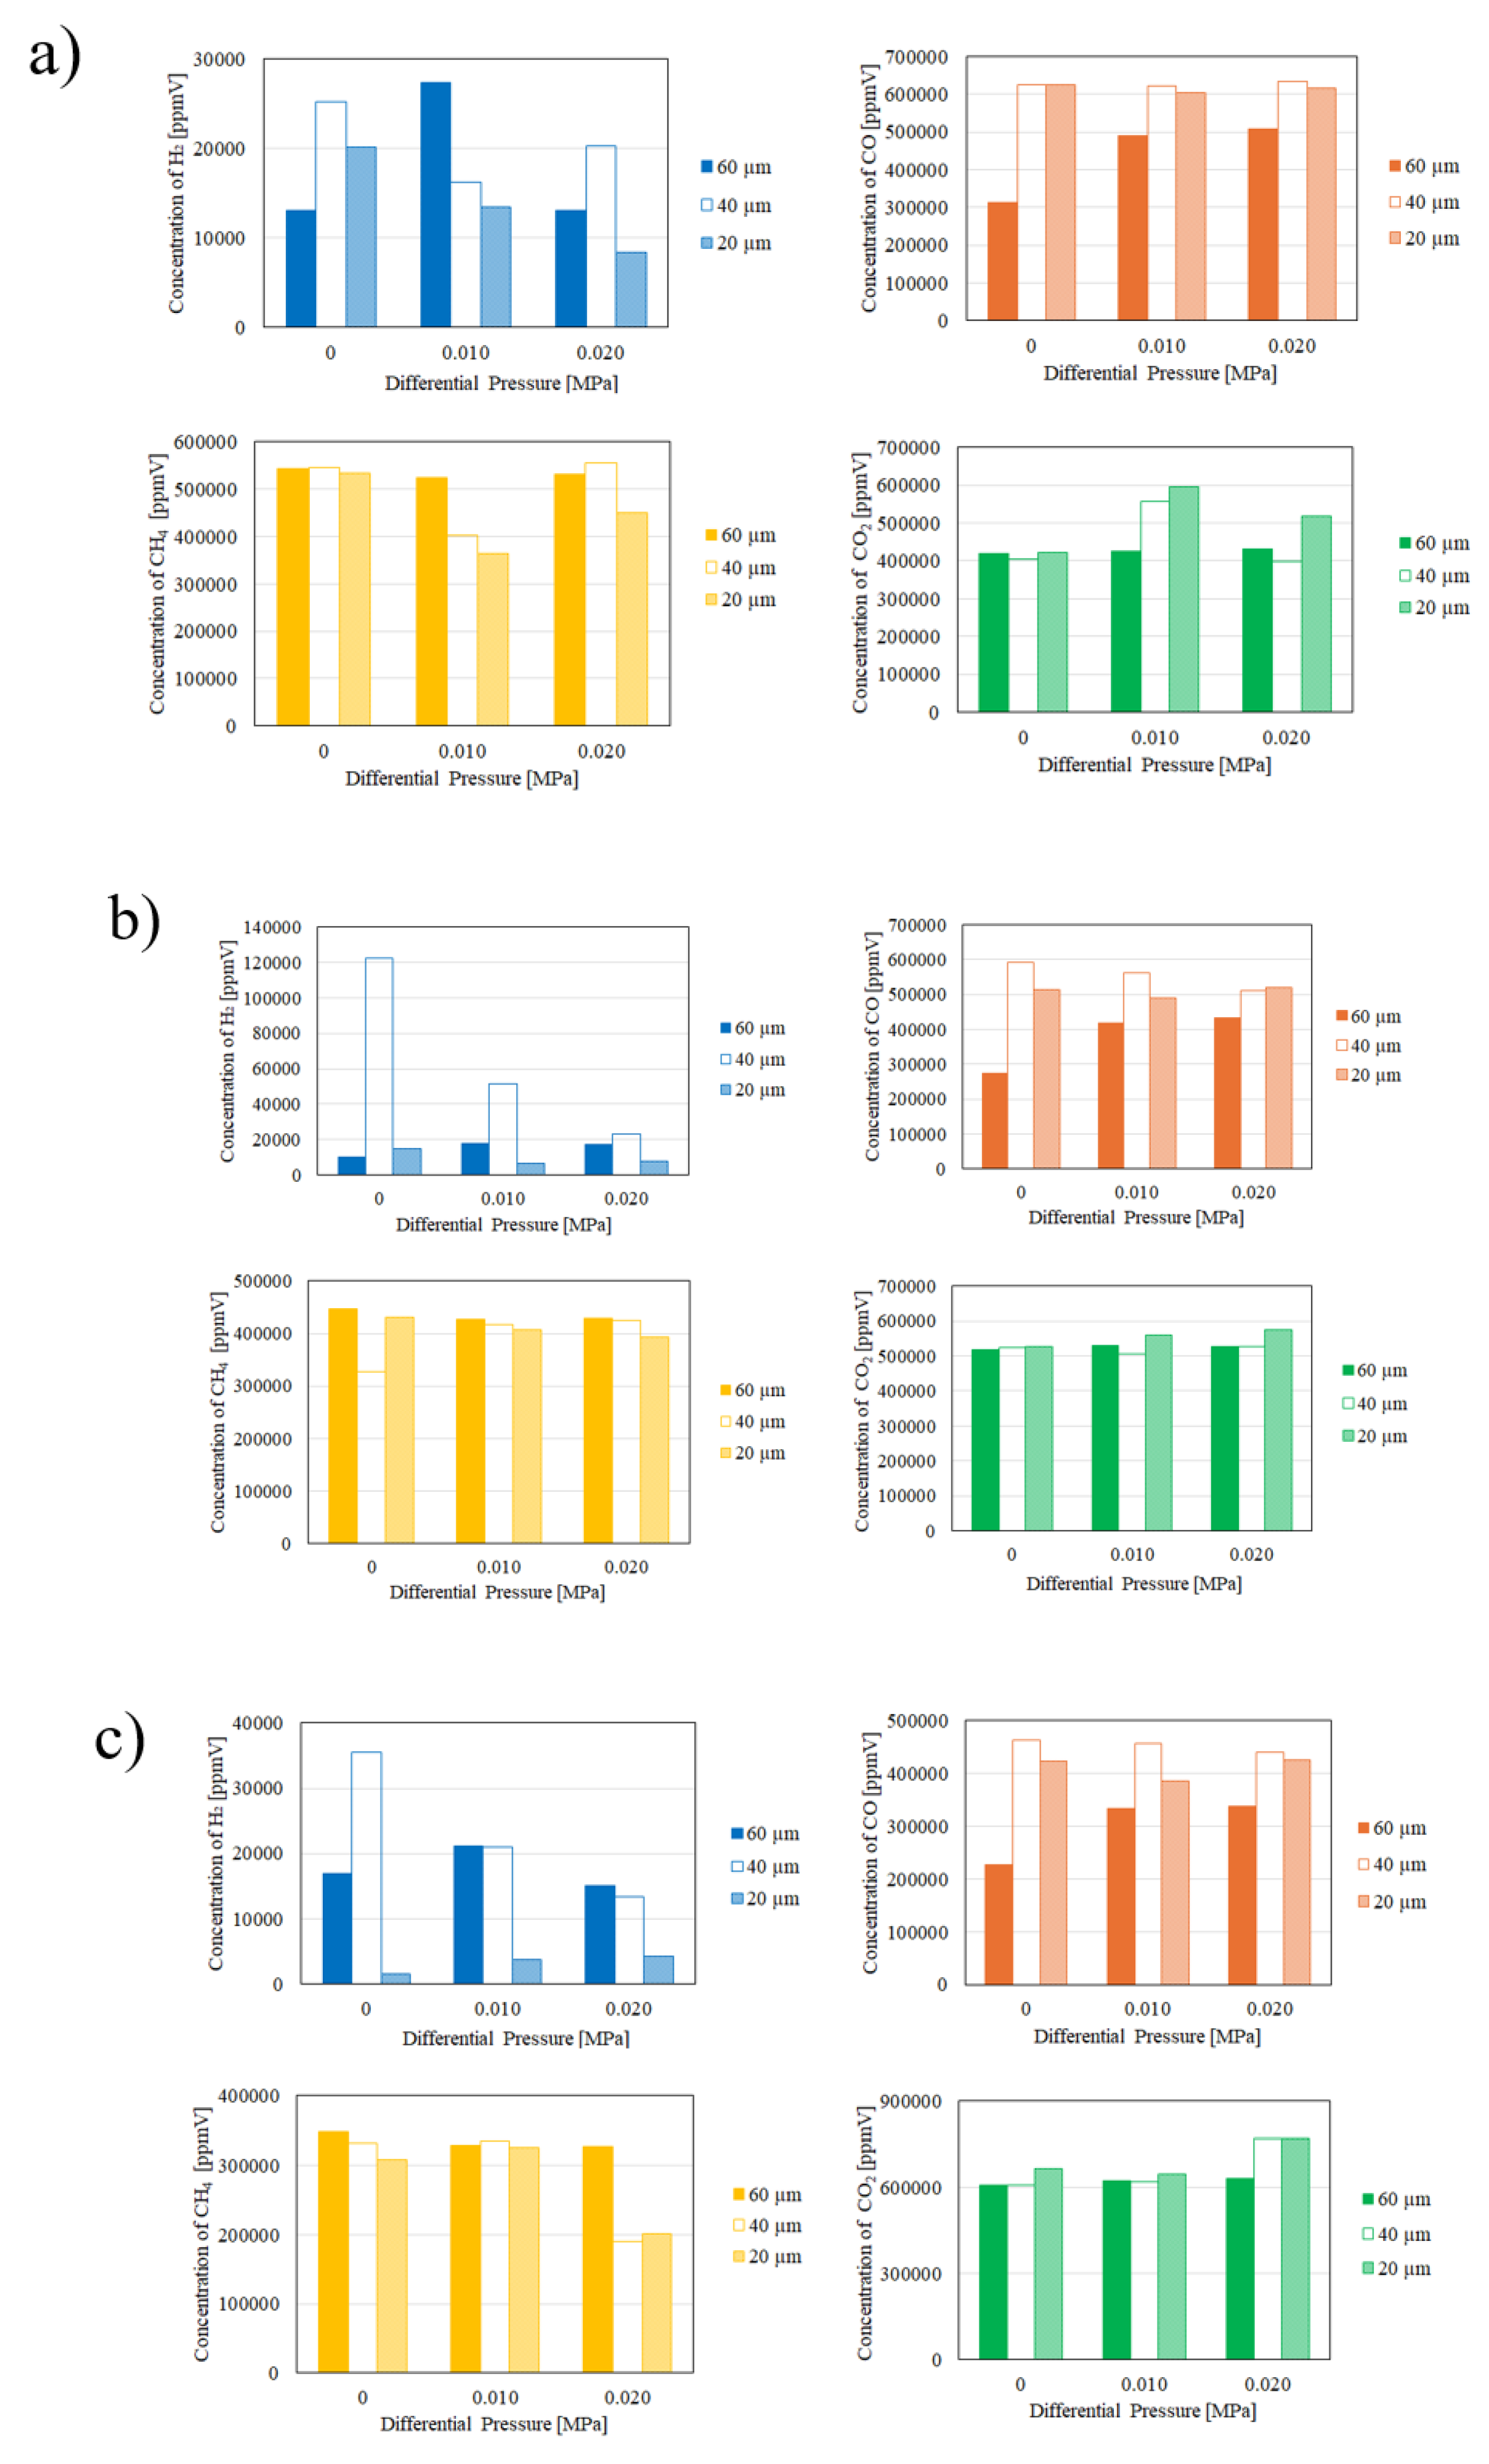
Figure 12.
Impact of thickness of Pd/Cu membrane on the H2 separation characteristics in the sweep chamber changing the differential pressure (reaction temperature: 600 ℃; a): CH4:CO2 = 1.5:1, b): CH4:CO2 = 1:1, c): CH4:CO2 = 1:1.5).
Figure 12.
Impact of thickness of Pd/Cu membrane on the H2 separation characteristics in the sweep chamber changing the differential pressure (reaction temperature: 600 ℃; a): CH4:CO2 = 1.5:1, b): CH4:CO2 = 1:1, c): CH4:CO2 = 1:1.5).
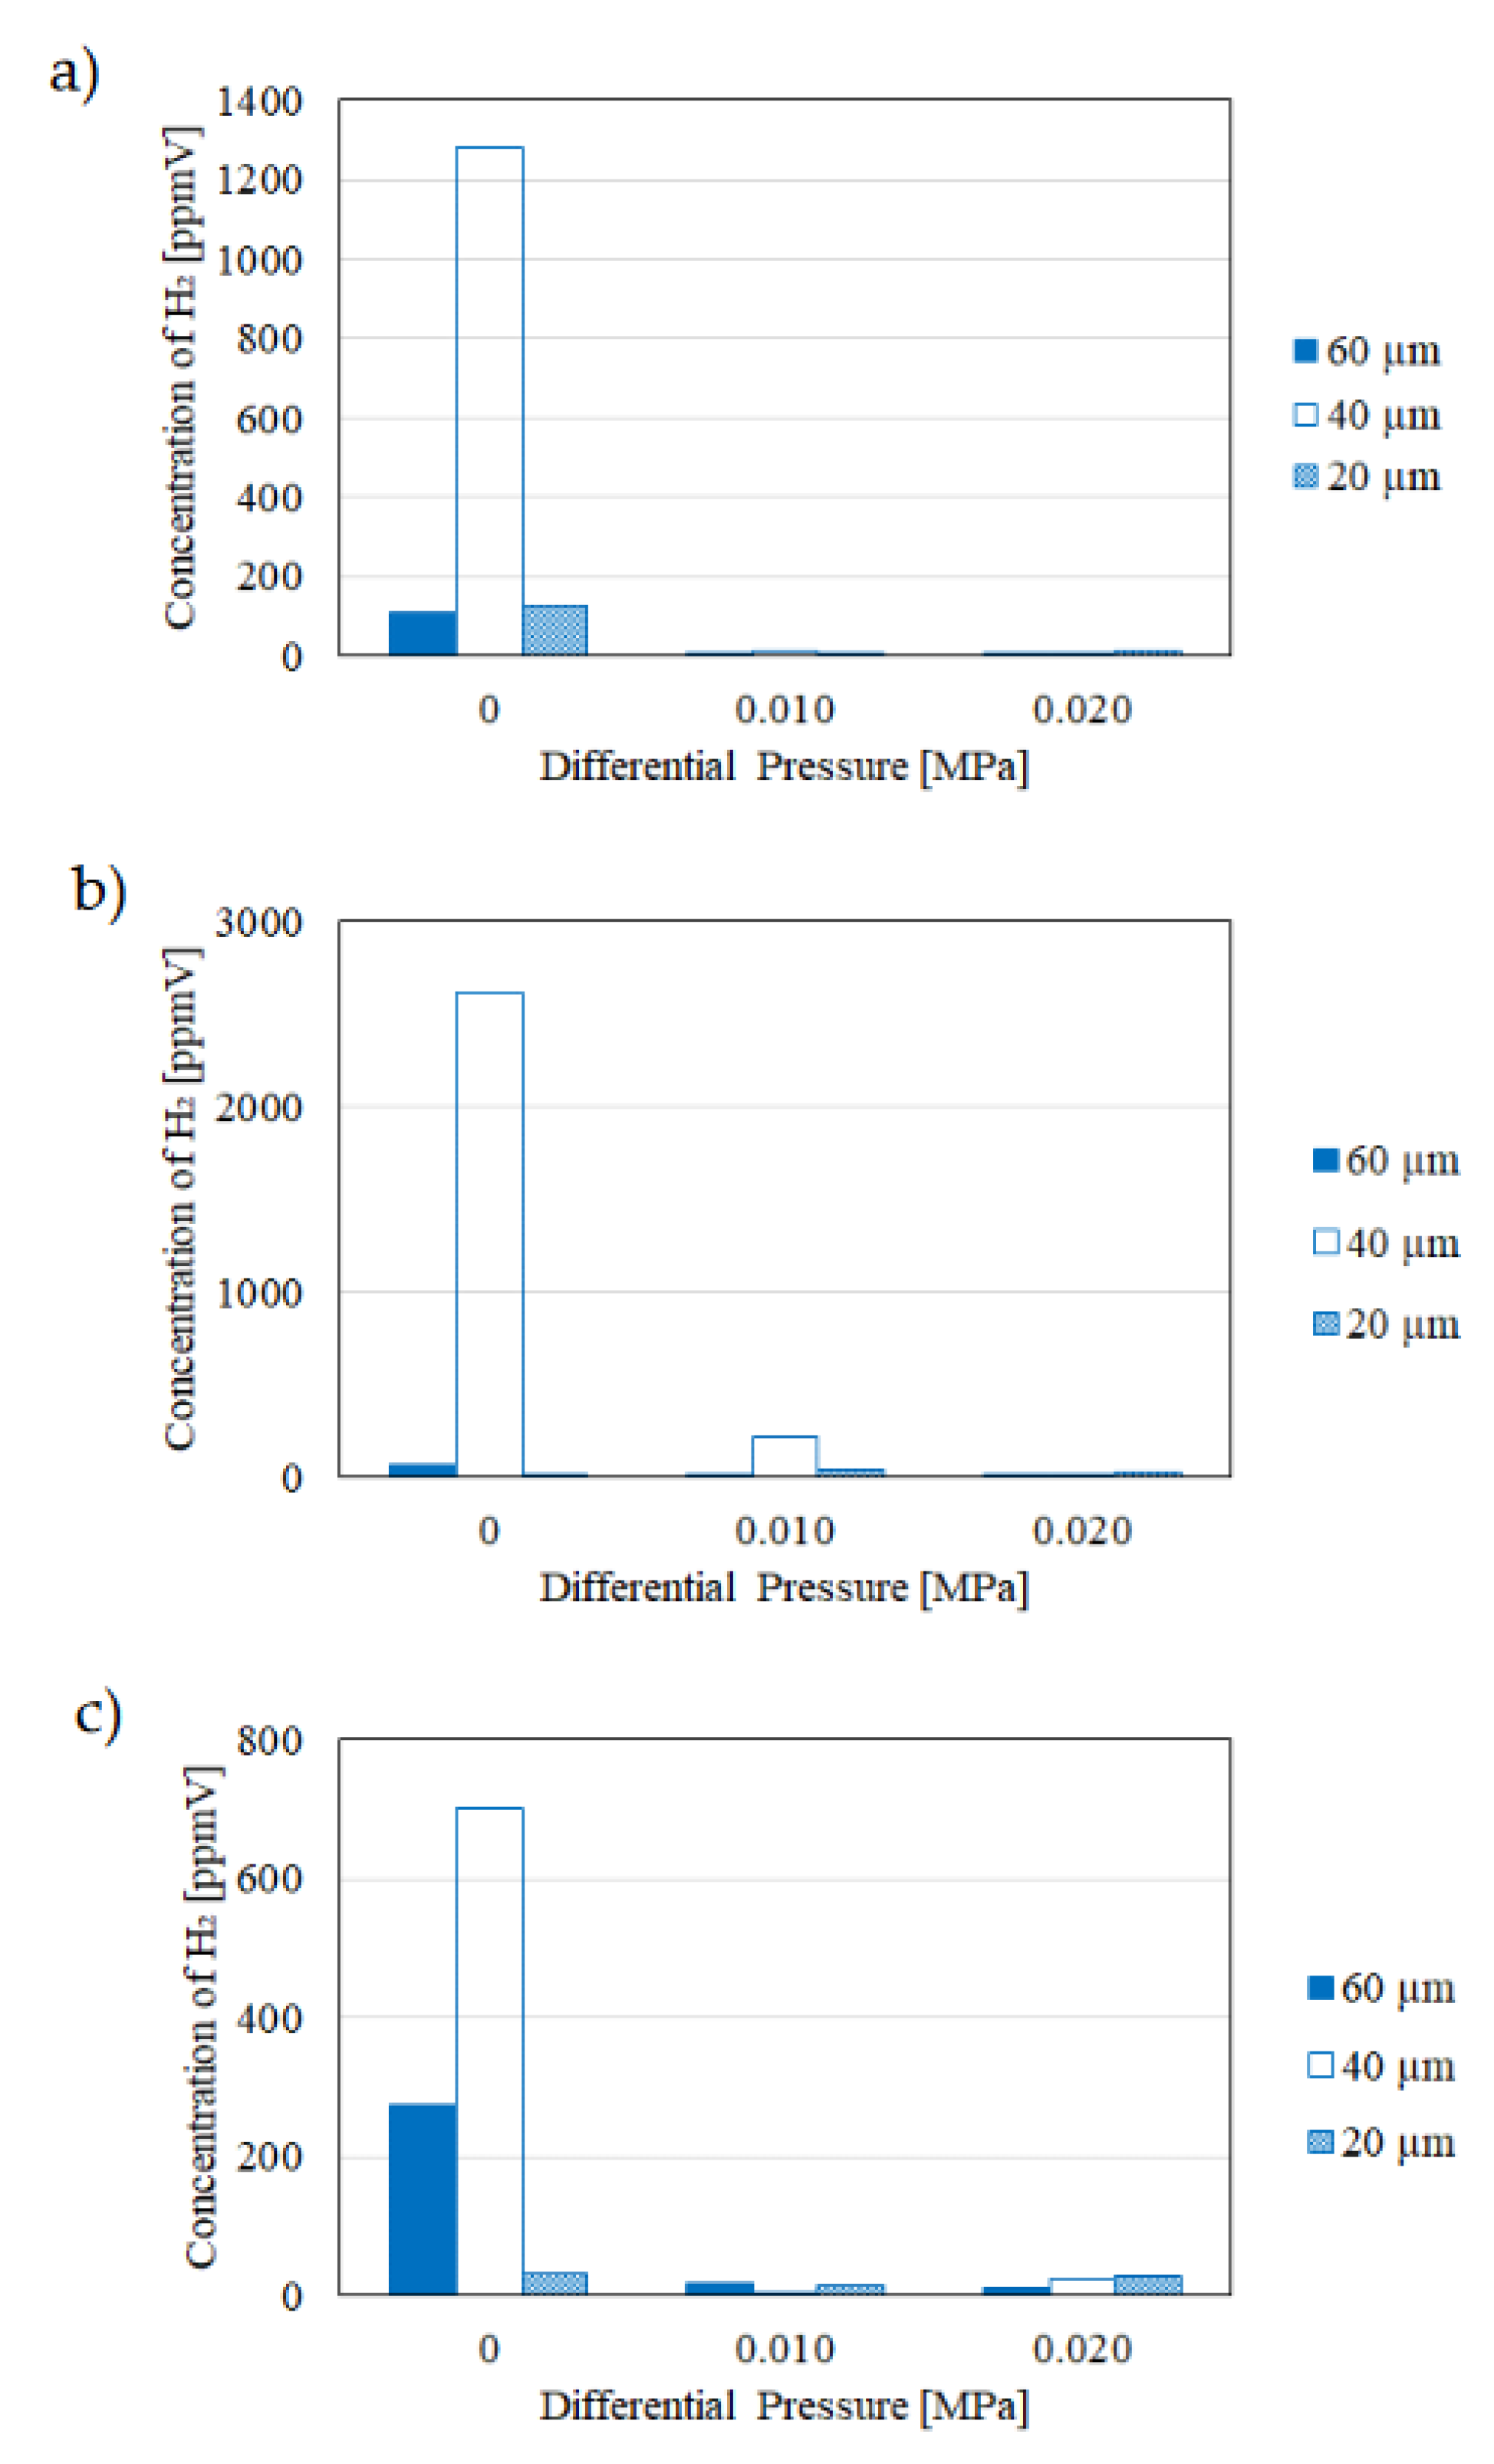
Figure 13.
Photo of Ni/Cr catalyst before and after experiments (left: before experiment, right: after experiment).
Figure 13.
Photo of Ni/Cr catalyst before and after experiments (left: before experiment, right: after experiment).
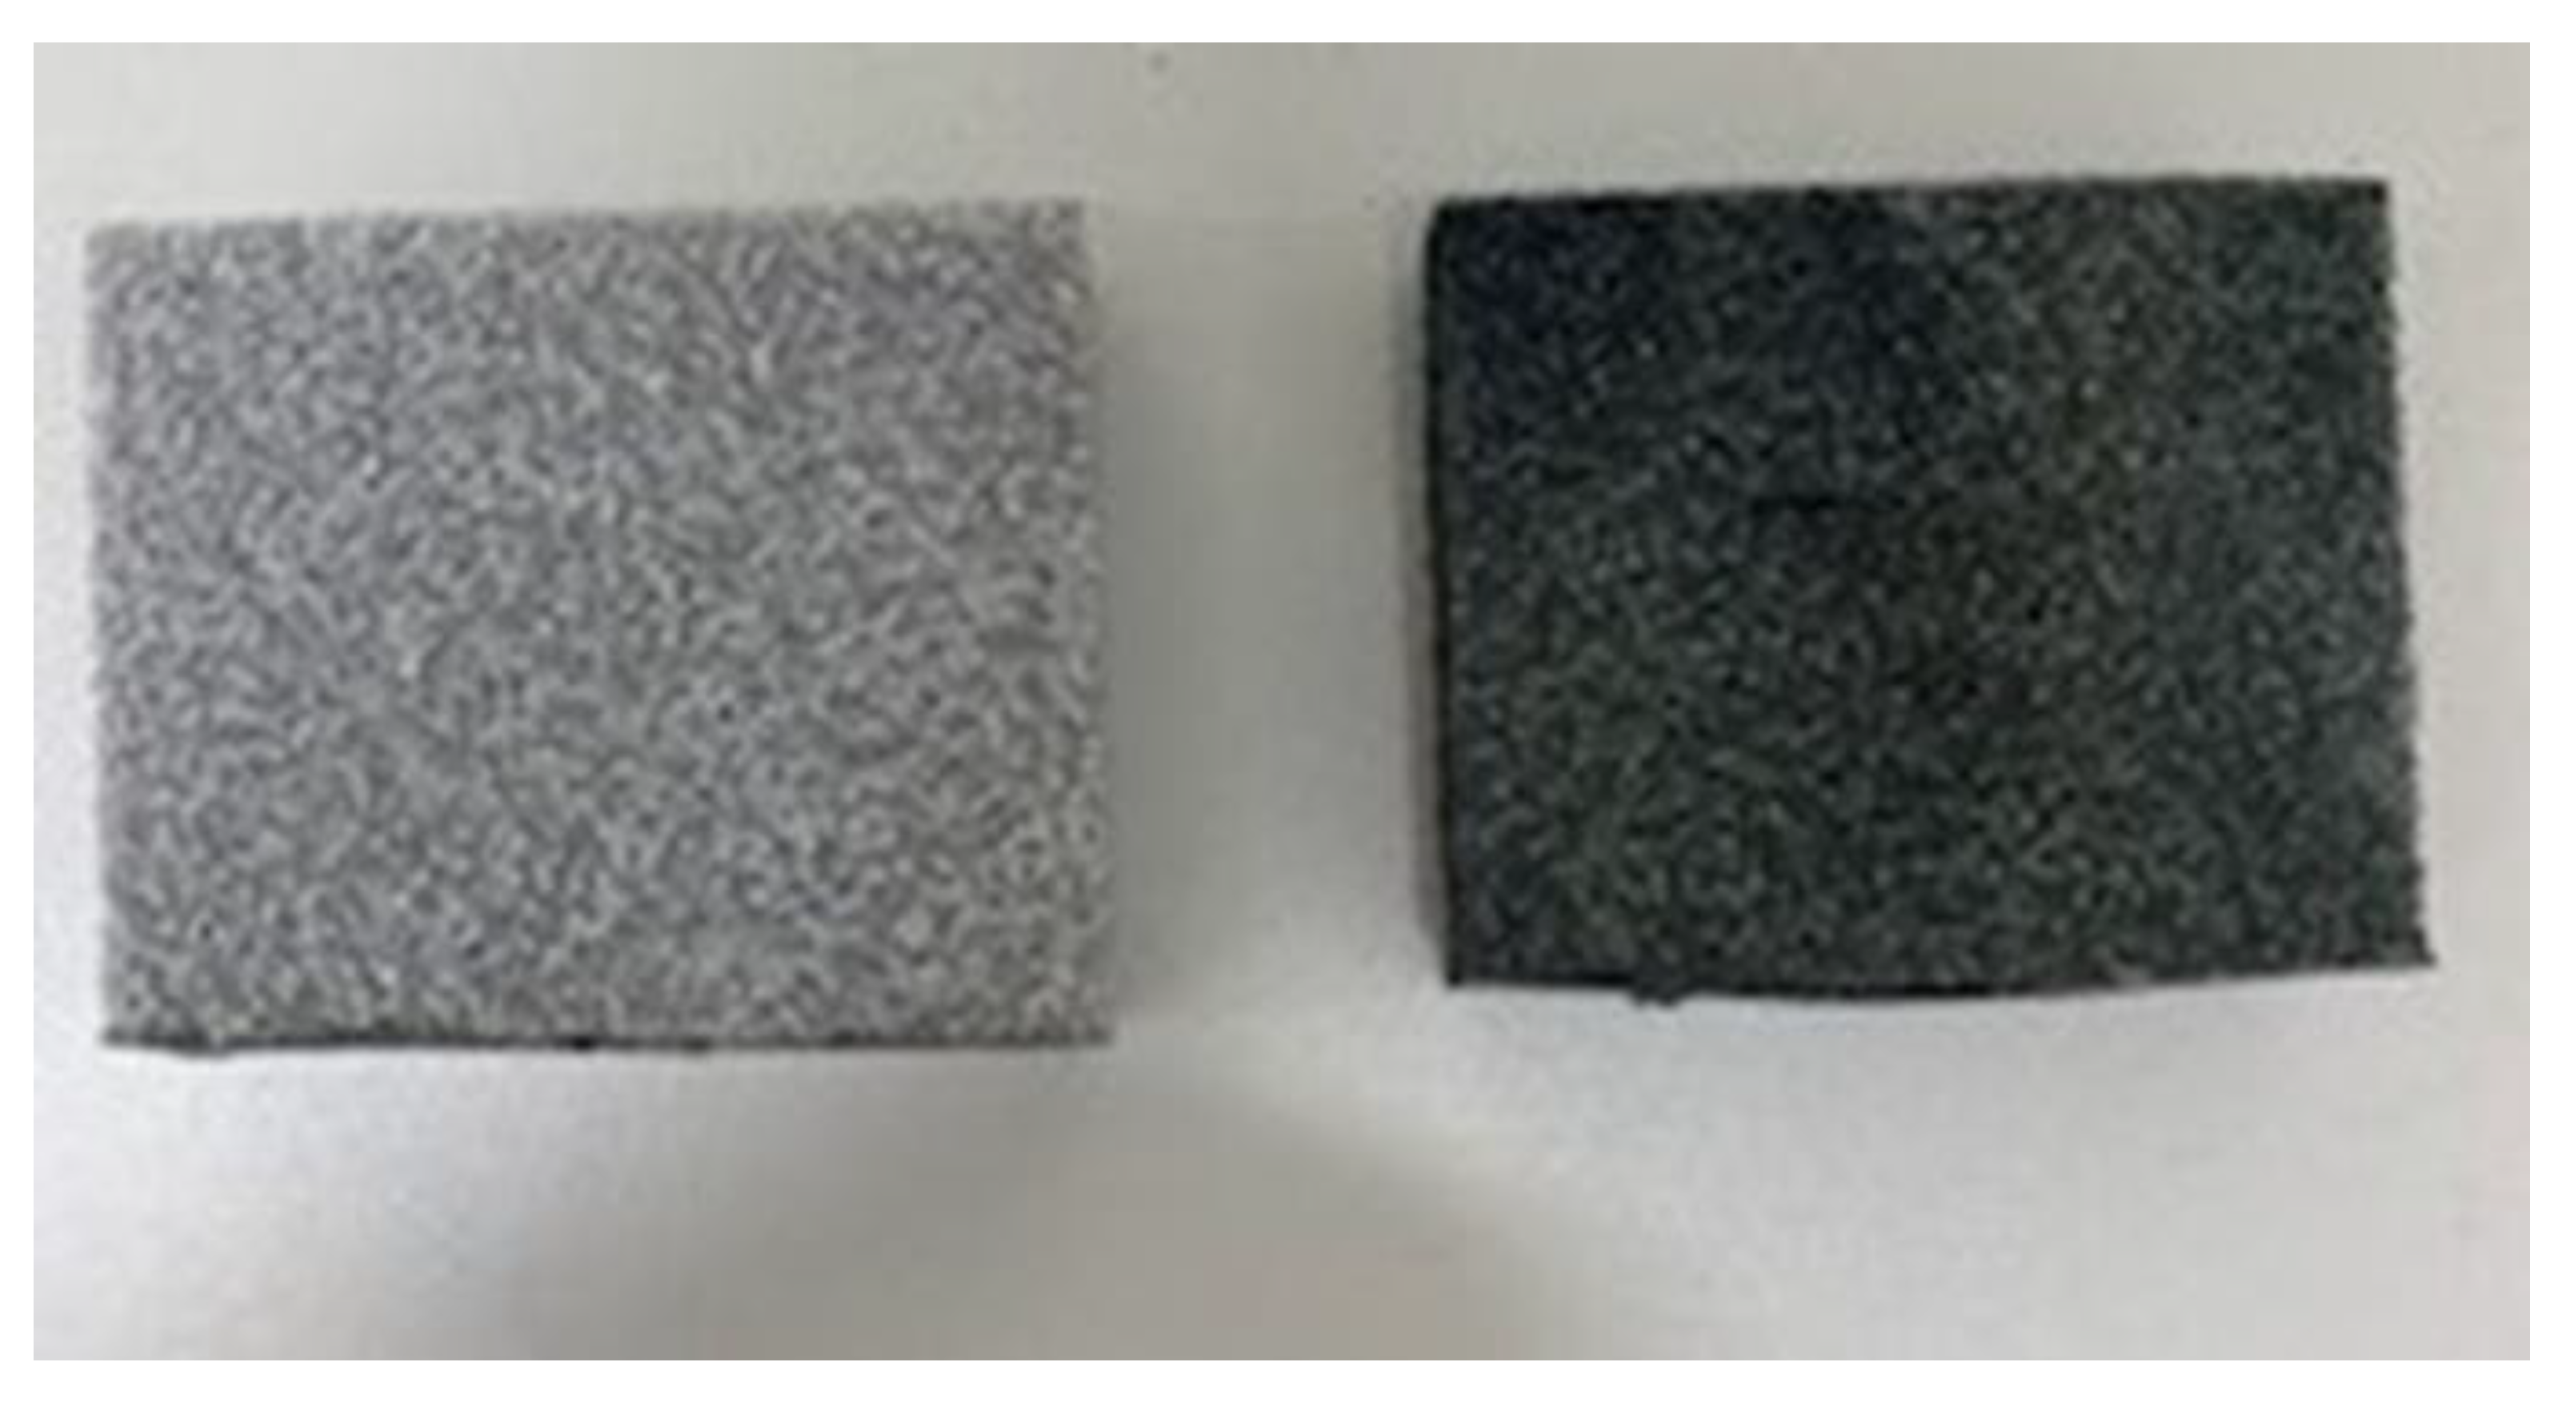
Figure 14.
Photo of produced H2O which is observed by gas bag (H2O is trapped in the red circle).
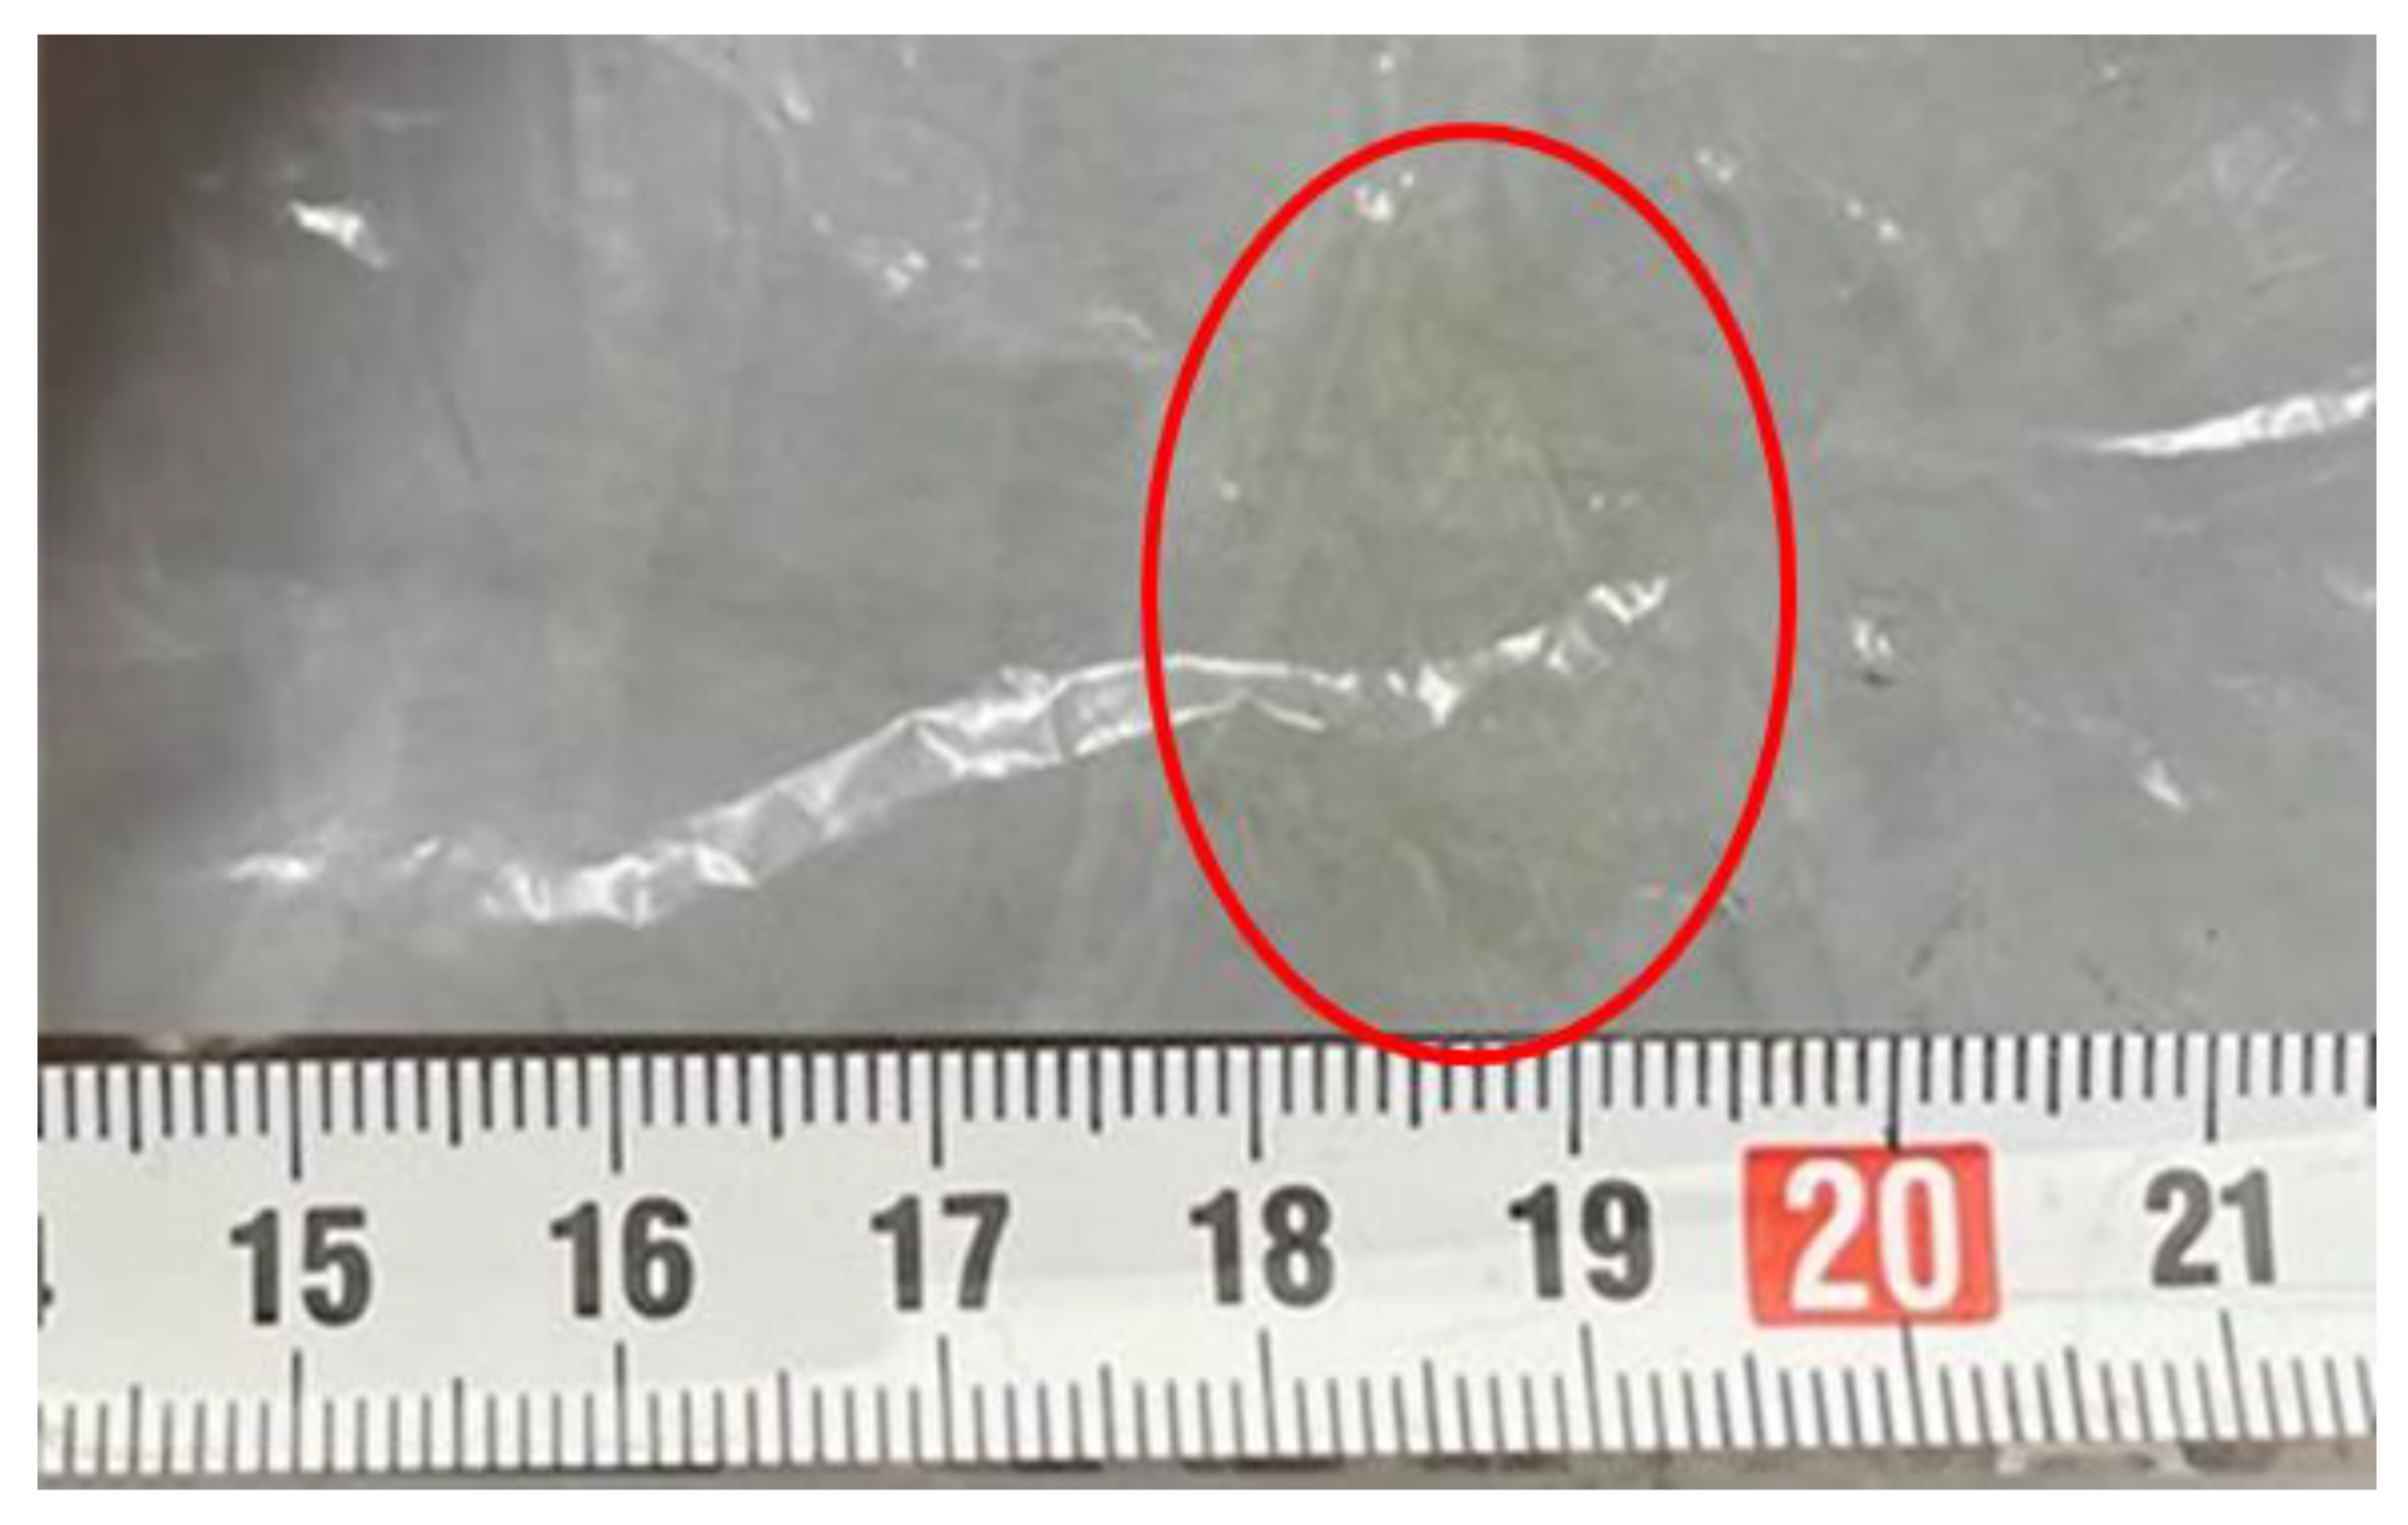

Table 1.
Parameters of experimental conditions.
| Parameter | Information |
| Initial reaction temperature (Pre-set reaction temperature) [℃] | 400, 500, 600 |
| Pressure of supply gas [MPa] | 0.10 |
| Differential pressure between the reaction chamber and the sweep chamber [MPa] | 0, 0.010 and 0.020 |
| Molar ratio of provided CH4 : CO2 (Flow rate of provided CH4 : CO2 [NL/min]) | 1.5:1, 1:1 and 1:1.5 (1.088:0.725, 0.725:0.725, 0.725:1.088) |
| Feed ratio of sweep gas to supply gas [-] | 1.0 |
Table 2.
Comparison of CH4 conversion, CO2 conversion, H2 yield, H2 selectivity, CO selectivity, H2 permeability, permeation flux and thermal efficiency (a): CH4:CO2 = 1.5:1, b): CH4:CO2 = 1:1, c): CH4:CO2 = 1:1.5).
Table 2.
Comparison of CH4 conversion, CO2 conversion, H2 yield, H2 selectivity, CO selectivity, H2 permeability, permeation flux and thermal efficiency (a): CH4:CO2 = 1.5:1, b): CH4:CO2 = 1:1, c): CH4:CO2 = 1:1.5).
| (a) | |||||||
| CH4 conversion [%] | CO2 conversion [%] | H2 yield [%] | H2 selectivity [%] | CO selectivity [%] | H2 permeability [%] | Permeation flux [mol/(m2・s)] | Thermal efficiency [%] |
| 400 ℃ | |||||||
| 0 MPa | |||||||
| 12.9 | -13.1 | 1.00×10⁻³ | 2.02×10⁻³ | 100 | 0 | 0 | 1.36×10⁻² |
| 0.010 MPa | |||||||
| 9.14 | -7.46 | 4.28×10⁻⁴ | 8.77×10⁻⁴ | 100 | 58.5 | 5.00×10⁻³ | 2.40×10⁻³ |
| 0.020 MPa | |||||||
| 8.30 | -6.19 | 1.78×10⁻⁴ | 3.47×10⁻⁴ | 100 | 0 | 7.07×10⁻³ | 2.40×10⁻³ |
| 500 ℃ | |||||||
| 0 MPa | |||||||
| 16.2 | -17.3 | 2.62×10⁻¹ | 5.24×10⁻¹ | 99.5 | 1.62 | 0 | 2.74 |
| 0.010 MPa | |||||||
| 7.44 | -4.76 | 5.06×10⁻² | 9.48×10⁻² | 99.9 | 1.65×10⁻¹ | 2.50×10⁻³ | 5.39×10⁻¹ |
| 0.020 MPa | |||||||
| 8.05 | -5.69 | 4.34×10⁻² | 8.65×10⁻² | 99.9 | 1.92×10⁻¹ | 3.54×10⁻³ | 4.62×10⁻¹ |
| 600 ℃ | |||||||
| 0 MPa | |||||||
| 11.1 | -5.40 | 1.69 | 3.15 | 96.9 | 6.22×10⁻¹ | 0 | 14.8 |
| 0.010 MPa | |||||||
| 39.2 | -49.1 | 1.12 | 2.19 | 97.8 | 5.19×10⁻² | 5.00×10⁻⁴ | 9.90 |
| 0.020 MPa | |||||||
| 25.1 | -29.3 | 7.04×10⁻¹ | 1.33 | 98.7 | 1.54×10⁻¹ | 7.07×10⁻⁴ | 6.20 |
| (b) | |||||||
| 400 ℃ | |||||||
| 0 MPa | |||||||
| 9.37 | -4.37 | 1.51×10⁻³ | 3.03×10⁻³ | 100 | 0 | 0 | 1.70×10⁻² |
| 0.010 MPa | |||||||
| 11.0 | -6.02 | 2.07×10⁻⁴ | 4.19×10⁻⁴ | 100 | 48.3 | 5.00×10⁻³ | 1.20×10⁻³ |
| 0.020 MPa | |||||||
| 18.2 | -13.2 | 3.49×10⁻⁴ | 6.90×10⁻⁴ | 100 | 28.6 | 7.07×10⁻³ | 2.80×10⁻³ |
| 500 ℃ | |||||||
| 0 MPa | |||||||
| 9.09 | -3.33 | 3.93×10⁻¹ | 7.51×10⁻¹ | 99.2 | 3.38 | 0 | 3.37 |
| 0.010 MPa | |||||||
| 6.73 | -1.60 | 6.26×10⁻² | 1.20×10⁻¹ | 99.9 | 0 | 2.50×10⁻³ | 5.54×10⁻¹ |
| 0.020 MPa | |||||||
| 10.0 | -4.92 | 5.41×10⁻² | 1.10×10⁻¹ | 99.9 | 0 | 3.54×10⁻³ | 4.79×10⁻¹ |
| 600 ℃ | |||||||
| 0 MPa | |||||||
| 13.7 | -5.73 | 1.51 | 2.84 | 97.2 | 1.06×10⁻¹ | 0 | 11.0 |
| 0.010 MPa | |||||||
| 18.4 | -12.1 | 6.56×10⁻¹ | 1.32 | 98.7 | 5.49×10⁻¹ | 5.00×10⁻⁴ | 4.78 |
| 0.020 MPa | |||||||
| 21.4 | -14.8 | 7.97×10⁻¹ | 1.51 | 98.5 | 2.76×10⁻¹ | 7.07×10⁻⁴ | 5.82 |
| (c) | |||||||
| 400 ℃ | |||||||
| 0 MPa | |||||||
| 10.0 | -2.50 | 1.34×10⁻⁴ | 2.76×10⁻⁴ | 100 | 0 | 0 | 1.20×10⁻³ |
| 0.010 MPa | |||||||
| 11.4 | -3.40 | 5.15×10⁻⁴ | 9.89×10⁻⁴ | 100 | 48.6 | 5.00×10⁻³ | 2.37×10⁻³ |
| 0.020 MPa | |||||||
| 12.3 | -4.03 | 2.75×10⁻⁴ | 5.56×10⁻⁴ | 100 | 0 | 7.07×10⁻³ | 2.47×10⁻³ |
| 500 ℃ | |||||||
| 0 MPa | |||||||
| 10.1 | -2.20 | 2.57×10⁻¹ | 5.11×10⁻¹ | 99.5 | 1.46×10⁻¹ | 0 | 1.82 |
| 0.010 MPa | |||||||
| 10.0 | -2.43 | 5.15×10⁻² | 1.06×10⁻¹ | 99.9 | 2.43×10⁻¹ | 2.50×10⁻³ | 3.64×10⁻¹ |
| 0.020 MPa | |||||||
| 8.21 | -1.23 | 5.87×10⁻² | 1.27×10⁻¹ | 99.9 | 0 | 3.54×10⁻³ | 4.16×10⁻¹ |
| 600 ℃ | |||||||
| 0 MPa | |||||||
| 22.9 | -10.9 | 1.95×10⁻¹ | 3.68×10⁻¹ | 99.6 | 2.05 | 0 | 1.12 |
| 0.010 MPa | |||||||
| 18.7 | -7.66 | 4.60×10⁻¹ | 9.44×10⁻¹ | 99.1 | 4.07×10⁻¹ | 5.00×10⁻⁴ | 2.68 |
| 0.020 MPa | |||||||
| 49.5 | -28.1 | 5.38×10⁻¹ | 1.00 | 99.0 | 6.74×10⁻⁴ | 7.07×10⁻⁴ | 3.12 |
Disclaimer/Publisher’s Note: The statements, opinions and data contained in all publications are solely those of the individual author(s) and contributor(s) and not of MDPI and/or the editor(s). MDPI and/or the editor(s) disclaim responsibility for any injury to people or property resulting from any ideas, methods, instructions or products referred to in the content. |
© 2024 by the authors. Licensee MDPI, Basel, Switzerland. This article is an open access article distributed under the terms and conditions of the Creative Commons Attribution (CC BY) license (http://creativecommons.org/licenses/by/4.0/).
Copyright: This open access article is published under a Creative Commons CC BY 4.0 license, which permit the free download, distribution, and reuse, provided that the author and preprint are cited in any reuse.


