1. Introduction
Extreme environmental conditions can shape specific microbial communities. Temperature constitutes a significant factor influencing biomolecule functions and the preservation of their biological structures. The upper-temperature threshold for eukaryotes has been documented at 62 °C, and only a limited number of fungal species are recognized as genuinely thermophilic [
1]. Thermotolerant and thermophilic fungi (TTF) grow above 45–50 °C, the latter are unable to grow below 20 °C. The growth temperature record (up to 60 °C) belongs to
Chaetomium thermophilum, isolated from dung/compost [
2]. More than 30 species have been identified as TTF [
3,
4].
Endophytic fungi are organisms that inhabit plant tissues which they colonize through balanced antagonistic interactions, that is, they need to activate virulence mechanisms that trigger a defensive response in plants [
5]. Plant Growth-Promoting Fungi (PGPF) play a central ecological role by contributing to both plant health and soil fertility. Among the mechanisms used by PGPF are enhancing nutrient availability (such as nitrogen, phosphorus, potassium, magnesium, iron, etc.), production of plant hormones, and augmenting water absorption rates, in addition, some PGPF also induce systemic resistance (ISR) against phytopathogens. The well-known fungal genera
Aspergillus,
Fusarium,
Penicillium,
Piriformospora,
Phoma, and
Trichoderma are the most frequently reported PGPF[
6].
Using plant growth-promoting fungi in sustainable agriculture represents an environmentally friendly alternative since they can contribute by reducing the use of polluting compounds such as chemical fertilizers and pesticides. PGPF can also increase resistance and tolerance in plants against biotic and abiotic stresses. Thermophilic and thermotolerant PGPF are frequently associated with plants that live in environments with high temperatures such as geothermal soils. Likewise, they have been successfully applied as agents both for biofertilization and to confer tolerance to heat stress in different plant species. An example of the above is the fungal endophyte
Curvularia protuberate, which was isolated from
Dichanthelium lanuginosum, a grass that thrives in Lassen Volcanic and Yellowstone National Parks [
7]. This fungus has the capacity to confer resistance to elevated soil temperatures within the range of 38–65 °C both in the host plant and many other crop plants such as tomato, watermelon, and wheat [
8].
Aspergilli are cosmopolitan ascomycetes and one of the most studied fungal genus after yeasts. Aspergilli have been frequently studied regarding degradation of plant biomass, secondary metabolism, and signal transduction [
9]. Due to its versatility and relative ease of cultivation, Aspergilli have been used for several decades in various biotechnological applications that include foods, pharmaceuticals, materials, agroindustry, and environmental issues. Recently, this genus has gained popularity as a cell factory to produce recombinant proteins due to its native ability to secrete proteins with high yields [
10]. Some
Aspergillus species have been recognized as thermophilic or have been documented to be capable of producing thermostable enzymes [
11,
12,
13,
14]. Likewise, several plant growth-promoting traits have been observed in Aspergilli, including the production of extracellular phytases, which mineralize phosphate from inaccessible organic sources, siderophores, and phytohormones such as IAA [
15,
16,
17].
Whole-genome studies constitute a suitable approach for the identification of sequence-based features associated with certain capabilities such as plant growth-promoting traits. In fungi, there is a growing tendency to complement research on plant growth promotion with genomic studies, in part due to the feasibility of accessing the complete repertoire of biocatalysts and metabolic pathways associated with the functions of interest [
18,
19]. However, functional genomics in fungi still presents certain limitations such as the difficulty in reconstructing sequences at a chromosomal level or the identification of novel proteins, many of which still lack a functional assignment. In addition to the above, the taxonomic classification of new fungal species requires more solid evidence, supported by genomic coherence parameters. In the past, assignment based on DNA barcoding of popular markers such as the Internal transcribed spacer (ITS) or translation elongation factors (TEF) were considered to be robust and accurate; however, given the growing number of documented species, the accuracy and resolution of such markers are unable to avoid ambiguity when identifying new taxa [
20].
Fungi from extreme environments, especially those isolated from high-temperature exposed regions (i.e. volcanos), offer promising avenues for developing innovative strategies to promote plant growth in the context of global climate change [
7]. These fungi have adapted to thrive under harsh conditions, such as high temperatures, which makes them inherently resilient and capable of withstanding environmental stresses that are increasingly prevalent due to climate change [
21]. This resilience can be harnessed to enhance plant tolerance to heat stress, which is critical as rising global temperatures threaten agricultural productivity. Moreover, thermophilic and thermotolerant fungi often possess unique metabolic pathways and enzymes that facilitate nutrient uptake and stress resistance in plants [
22]. For instance, these fungi can produce heat-stable enzymes, such as phytases and siderophores, that improve nutrient availability and uptake even under adverse conditions. Additionally, the production of phytohormone-like compounds by these fungi can promote plant growth and development, further enhancing their potential as biofertilizers [
7]. By leveraging the robust capabilities of these extremophiles, it is possible to develop sustainable agricultural practices that not only improve crop yields but also reduce reliance on chemical fertilizers and pesticides, mitigating their environmental impact. Thus, the study and application of fungi from extreme environments represent a forward-thinking approach to addressing the challenges posed by global climate change on agriculture.
In this work, we present a thorough phylogenomic analysis to determine the identity of an endophytic fungus of the genus Aspergillus which can solubilize phosphate as well as produce siderophores and phytohormones, which we complement with the functional annotation of the coding sequences of its whole genome oriented towards plant-growth promoting traits, CAZymes, and Biosynthetic gene clusters (BGCs). Up to date all the reported Aspergillus brasiliensis strains are rhizospheric and mesophilic. This is the first report of an endophytic and thermophilic A. brasiliensis strain, which, besides being a good plant growth promoter, protects the plant from heat stress. It produces thermostable enzymes which could be of potential biotechnological use. Secondary metabolite genes, such as the antitumoral compound clavaric acid were also found. The experimental data agree with the phylogenomic study of this novel strain.
2. Materials and Methods
2.1. Isolation of Fungal Strains
The Chichonal volcano (17.36 °N, 93.23 °W) is located in the northwestern State of Chiapas, Mexico, at an altitude of 1100 meters above sea level and it still active. A lake has formed inside the crater with huge temperature and pH, variations from the volcano vent to other more distant places within the crater. Three endophytic strains were isolated, one from an Andropogon sp. (as determined by its morphological characters) and two from an (until now) unidentified dicotyledonous plant (probably from the genus Gaulheria sp., according to the PlantNet application; manuscript in process). From the three isolates strain E_15.1 was selected for further characterization due to its preliminary characterization (see below).
Fresh roots were collected from the plants, at one specific location (designated as SP15) within the Chichonal volcano crater (
Supplementary Figure S1).
It is worth to note that the
Andropogon sp. plants were alive and submerged in the shore of the lake inside of the crater. Three samples of fresh roots were taken for each set of specimens. Samples were collected in pre-sterilized glass jars using a sterile spatula. A temperature-regulated container at approximately 8-10 °C was used to place the jars on-site, which were then transported to the laboratory. For the isolation of endophytic fungi, a surface sterilization procedure was carried out to avoid the growth of rhizospheric fungi [
23]. To disinfect the collected root samples, they were first surface cleaned with running tap water for ten minutes, followed by a rinse with sterile distilled water for five minutes. Subsequently, the roots were immersed in a 70% v/v ethanol solution for three minutes in a laminar flow cabin, and then treated with a 4% v/v NaClO solution supplemented with Tween 80® (0.1% v/v) for five minutes. Finally, the roots were rinsed with sterile distilled water for 1 minute and dried on sterile paper towels. Pieces of 4 x 0.5 cm and 1.5 x 0.5 cm were cut from the disinfected tissues under aseptic conditions and placed on potato dextrose agar (PDA) culture medium. The Petri dishes were supplemented with 50 μg/ml of chloramphenicol (Clor) and 100 μg/mL of ampicillin (Am) to prevent bacterial growth. The "leaf imprints" test was used as a control to ensure the success of the surface sterilization process [
23]. For this, the disinfected roots were gently pressed against a Petri dish with PDA Am/Clor medium, and after 1 minute, they were removed. The surface sterilization process was considered effective if no growth was observed on these dishes. To emphasize the endophytic nature of the fungi, only the tips of the hyphae protruding from the roots were selected. The tips of individual hyphae were subcultured and transferred three times to Petri dishes with PDA Am/Clor medium to ensure the purity of the isolates.
2.2. Determination of Optimal Growth Temperature and Morphological Characterization
The optimal growth temperature was determined by growing the isolates in liquid MEA medium. The starting point was a pre-inoculum grown for 72 hours at 28°C. The optical density (OD) was adjusted to 0.2 (600 nm) and the flasks were incubated at 28, 40 and 70 °C, with shaking at 150 revolutions per minute (rpm). Samples were taken at 24, 36, 48, 60, 72, 84 and 96 hours and the optical density was read with a spectrophotometer at 600 nm, in triplicate, at the three temperatures. The speed or growth rate (ϻ) was calculated with the following formula:
ϻ= Xf/ Xi * (t2-t1)
where:
µ = speed or growth rate (h-1)
Xf= final biomass concentration (given in optical density)
Xi= initial biomass concentration
t2= final time in hours
t1=initial time in hours
The growth of the endophytic fungus E_15.1 was also evaluated by plate growth, on solid medium (MEA), inoculated with a 5mm portion of fresh mycelium, with incubation at 28 and 40 °C. The diameter of the colony was recorded, monitored for 96h. The results were expressed as mycelial growth (cm).
To conduct the morphological characterization of strain E_15.1, a segment of mycelium was introduced into a liquid medium consisting of malt extract, glucose, and peptone. These media were then agitated and incubated for 2 days at 28 °C. On the second day of fungal growth, 9 µL of each liquid medium was inoculated, forming a triangular pattern with 3 drops of 3 µL each on three solid media types: PDA, MEA, and CYA (
Supplementary Table S1). Petri dishes with a diameter of 9 cm were used to culture these samples. The cultures were observed for the growth of the respective fungus on the three different media, and photographs were taken at intervals of 1, 2, 3, 7, and 14 days. For the microscopic analysis, a culture loop was employed, and a sample was placed on a microscope slide. A drop of lactophenol cotton blue stain (a solution containing 20 % lactophenol and 10 % cotton blue) was added for examination under a phase-contrast and bright-field optical microscope. This allowed the description of the type of mycelium and the structures involved in asexual reproduction.
2.3. Culturing and Extraction of Genomic DNA
E_15.1 strain was cultured in Petri dishes containing solid MEA medium for 5 days at 28 °C. The mycelium was collected and genomic DNA extraction was performed following the protocol proposed by Kuhad et al. (2004) [
24]. To assess the quality of the DNA, agarose gel electrophoresis was conducted, and the sample was measured using a "NanoDrop" spectrophotometer (Thermo Scientific, USA), before it was sent to Macrogen Inc., Korea for whole genome sequencing.
2.4. Genome Sequencing, Assembly, and Functional Annotation
For the whole genome sequencing of strain E_15., the Illumina MiSeq platform was adopted. The raw sequence data coming from the high throughput sequencing pipelines were applied to the program FastQC (
http://www.bioinformatics.babraham.ac.uk/projects/fastqc) and MultiQC [
25], tools for quality control of the sequencing. After filtering readings by quality. Two versions of genomic assemblies MEGAHIT (v1.0) [
26] and SPAdes were created Antipov et al. (2016)[
27], then assembly fusion was performed with Quickmerge [
28] generating a more contiguous final assembly. Finally, the contigs were polished using Pilon (v1.22) [
29] and with the RagTag tool (v2.1.0) [
30] an assembly at the level of scaffold the SeqKit tool [
31] was employed to generate the assembly statistics including N50 and N90. After having the complete genome data of strain E_15.1. The predicted set of coding DNA sequences (CDS’s) performed with the AUGUSTUS tool (v3.2) [
32]. Protein sequences were annotated using the BLASTKOALA tool [
33]. This was done to identify functional orthologs associated with different metabolic pathways based on Kyoto Encyclopedia of Genes and Genomes categories (KEGG). Similarly, the predicted set of genome proteins was annotated using the PANNZER2 web server (URL:
http://ekhidna2.biocenter.helsinki.fi/sanspanz/)[
34] to classify the protein set into functional categories according to the Gene Ontology (GO). Finally, the assignation of Cluster of Orthologs Groups (COG) was performed by the eggNOG-mapper in its web-server (URL:
http://eggnog-mapper.embl.de/)[
35].
For comparative genomic analysis, the genomes of ten Aspergilli species were downloaded from the NCBI database, including (i) strains beneficial for plants: A. brasiliensis (CBS101740); (ii) strains used as biological control for plants: A. piperis (CBS112811); (iii) pathogenic strains: A. fumigatus (AF 293); A. viridinutans (IFM47045), A. pseudoviridinutans (IFM55266); (iiii) enzyme-producing strains with important industrial applications: A. tubingensis (WU223-L), A. vadensis (CBS113365), A. luchuensis (IFO 4308), A. aculeatus (ATCC 16872) and A. carbonarius (ITEM 5010).
Furthermore, fungal proteins were annotated according to the Carbohydrate-Active enZymes (CAZy) database version 12 (releasing date: 2023-08-02) downloaded from the dbCAN web server (URL:
https://bcb.unl.edu/dbCAN2/)[
36]. In order to identify sequences related to plant growth promotion, proteins from the E_15.1 genome were annotated using HMMER3 [
37] using a set of Hidden Markov Model (HMM) profiles corresponding to protein families in the Pfam database [
38] associated with relevant functions (See Table 3) were employed for this purpose. Finally, a global annotation of the whole set of predicted proteins in the E_15.1 genome was carried out by aligning them against the NCBI non-redundant protein database (nr) using DIAMOND [
39].
2.5. Phylogenetic Analysis
Phylogenetic analyses were conducted using 68 genome assemblies of the
Aspergillus genus, with 2 genome assemblies of
Penicillium genus as an outgroup. Various phylogenetic analysis programs were executed, starting with JolyTree (v.1.1b.191021ac) [
40], which employs a distance-based alignment-free procedure to infer phylogenetic trees. Subsequently, the OrthoFinder program (v2.5.4) [
41] was used for high-precision phylogenetic orthology inference and provides phylogenetic inferences of orthologs. Input data for this program included predicted protein sequences generated by the Augustus tool (v3.2) [
32]. Finally, the UFCG program (v1.0.3) (Universal Fungal Core Genes), which utilizes a database of canonical genes and core fungal genes [
42], was employed for genome analysis and inferring the species phylogenomic tree.
We conducted species delimitation using distance-based models (Bayesian Poisson tree processes (bPTP) and Multirate Poisson tree processes (mPTP)). Furthermore, tests were carried out for Tests species delimitation using bPTP version 0.51 [
43], implemented in Python and adjusted to accept non-ultrametric trees as input files (
https://github.com/zhangjiajie/PTP). Similarly, the mPTP model (
https://github.com/Pas-Kapli/mptp) which models speciation events considering lineage-specific coalescence rates and a speciation parameter.
The phylogenetic trees (JolyTree, OrthoFinder, and UFCG) generated in Newick format were used as inputs in separate runs. Convergence was assessed through 106 iterations of Markov Chain Monte Carlo (MCMC) chains, with the number of seeds set to 4.
Subsequently, we evaluated the mutational genomic distance (D) using the Mash program v2.3 [
44] and the average nucleotide identity (ANI) was calculated using FastANI v1.33 [
45].
2.6. Identification of Metabolic Pathways and Specialized Metabolites
Genomic analyses were performed for the determination of metabolic pathways associated with PGP traits (gibberellin, indole acetic acid (IAA) production, siderophore production, and iron and phosphate uptake) with KEGG and complemented with KofamKOALA [
46]. Additionally, the full genome of the compared eleven strains was submitted to fungal version AntiSMASH v6.0.1 [
47] for secondary metabolite biosynthetic gene cluster (BGC). Furthermore, it compared the genetic diversity of the biosynthetic clusters of clavaric acid, a triterpene with antitumor activity due to its ability to inhibit Farnesyl-protein transferase-producing BGC components against the antiSMASH database.
2.7. In Vitro Assays for PGP Traits and Hydrolytic Enzymatic Activity
Different culture media were used to determine seven PGP traits and some hydrolytic activities of strain E_15.1. The activity of cellulases, xylanases, and chitinases was evaluated in solid Vogel's minimal medium supplemented with 1 % carboxymethylcellulose (CMC), beechwood xylan, or colloidal chitin as the sole carbon source for each assay. Clear halos around the colonies indicated the presence of cellulases, xylanase, or chitinase activity [
48]. The siderophore production detection test involved inoculating double-layered agar plates with Chromium Azurol S (CAS), following Louden et al. (2011)[
49]. The appearance of a yellow-orange or purple halo around the colony was considered positive siderophore producers. The phosphate solubilization assays were conducted using the PKV (Pikovskayas agar) culture media, where growth is associated with the capacity to use inorganic phosphate in the form of Ca
3(PO
4)
2 as a sole phosphate source. This method is considered to show positive results when a transparent halo is observed in the plates. The production of Indole 3 acetic acid (IAA), was determined following the methodology described by Ignatova et al. (2015)[
50] with some modifications. The isolates were cultured in MEA liquid medium at pH 5.6 with 400 or 1000 μg/ml of L-tryptophan as the precursor for IAA biosynthesis. Cultures without tryptophan were used as negative controls. The cultures were incubated at 28 °C for three days. Subsequently, 1 mL was extracted from each culture and centrifuged at 8000 rpm for five minutes. The supernatant (0.5 mL) was taken and mixed with 0.5 mL of Salkowski's reagent (2 mL of FeCl
3 (0.5 M) and 98 mL of H
2SO
4 (38%). They were then incubated for 30 min at room temperature in the dark. The color intensity of the reaction was measured at a wavelength of 530 nm, using an Epoch microplate spectrophotometer (BioTek). Equivalent mixtures with non-inoculated media served as blanks for the spectrophotometry readings. A calibration curve was performed with standard IAA (0 - 40 µg/ml) (Sigma Catalog No. 6505-45-9) to quantify the concentration of IAA. Finally, the evaluation of gibberellin production was determined using a protocol described by Candau et al. (1992)[
51]. Czapek culture medium (without inoculation) was used as a negative control and tubes to which 2 µg gibberellic acid (GA3) (Sigma) were added as a positive control. Samples showing green fluorescence were considered positive for gibberellin production.
2.8. Plant Responses to E_15 Interaction in Greenhouse Conditions
The effect of strain E_15.1 on the growth of tomato plants was assessed. The plants were cultivated in a greenhouse from the early vegetative stage to the onset of the reproductive phase (see below) between March and May 2023, a period outside the optimal tomato cultivation season (July-September). For this study, 20 plants were utilized for each treatment. Two additional groups were included for comparison: one group was inoculated with sterile distilled water (Negative Control), and the other group was inoculated with Trichoderma atroviride (Positive Control). All the analyzed plants originated from Saladette variety tomato seeds, specifically the Hortaflor brand, and were initially germinated in trays with 200 compartments. Two-week-old plants were then transplanted into pots containing autoclave-sterilized Peat moss® substrate. Seven days after transplantation into the pots, the plants were inoculated with a suspension of 1 x 10⁶ spores/ml of strains E_15.1 and Trichoderma atroviridae, each suspended in 4 ml of sterile distilled water. Control plants were treated with 4 ml of sterile distilled water. The inoculation took place at the substrate level, after it had been previously watered and was still moist. Subsequently, the plants were placed in a greenhouse of the Faculty of Agricultural Sciences (UAEM, Morelos, México), where they were exposed to natural light from March (12 light/12 dark, approximately) to May (14 light/10 dark, approximately). Regular watering was carried out every third day. The study assessed the effects of growth promotion mediated by strain E_15.1 on the following parameters: stem length (cm): from the longest apical leaf to the root neck; root length (cm): measurement from the apex of the primary root to the neck root of each sampled plant; biomass/dry weight (g): plants were dried in an oven at 60 °C for 72 h until constant dry weight was achieved and fresh weight biomass (g) was immediately measured after collecting the roots.
2.9. Effect of Temperature on the Activity of Xylanases and Cellulases by E_15.1 Strain
The extracellular enzymatic activity of the E_15.1 strain was measured based on the amount of released reducing sugars using the 3,5-dinitrosalicylic acid (DNS) method [
52]. Calibration curves were performed using glucose and xylose, as standards. One unit of xylanase and cellulase activity (U) is defined as the amount of enzyme releasing 1 µmol reducing sugar per min. For the assessment of cellulase activity, a 1% solution of carboxymethylcellulose (CMC) was used as substrate, while a 1 % solution of beechwood xylan (SIGMA) was used for xylanase activity determination. These substrates were dissolved in a 50 mM citrate buffer solution at pH 5 (cellulase activity) and 30 μL of sodium phosphate buffer (0.1 M) at pH 8.0 (xylanase activity). The enzymatic reaction was established, comprising 250 µL of the substrate solution, 200 µL of a 50 mM citrate buffer solution at pH 5 or 30 μL of potassium phosphate buffer (0.1 M) at pH 8.0 and 50 µL of the culture supernatant of strain E_15.1, grown in Vogel's minimal medium supplemented with 2 % wheat straw as the sole carbon source. To determine the temperature optima, the reaction mixtures were incubated at various temperatures (30, 40, 50, 60, and 70 °C) for 15 minutes. Samples of 25 µL were withdrawn, mixed with 25 µL of DNS, boiled for 5 minutes, and allowed to cool for 5 minutes to terminate the reaction. Subsequently, 50 µL of distilled water was added. The absorbance was measured using a spectrophotometer at 540 nm. The reaction blank consists of a water-adjusted volume of the reaction mixture without the culture supernatant. Each sample was analyzed in three experimental replicates. The thermostability of hydrolytic enzymes was also tested by incubating the supernatants of each condition at 70, 80, and 90 °C for one hour with the same reaction proportions described above. The residual enzyme activity (RA) was calculated from the relationship between the enzyme activity after treatment and the initial activity without treatment. Its calculation was carried out using equation 1, reported by Riener et al. (2009)[
53] in percentage terms:
RA (%) = (At/A0) * 100
In equation (1), At is the activity of the enzyme after heat treatment and A0 is the activity of the enzyme without heat treatment.
2.10. Statistical Analysis
For the greenhouse plant growth parameter experiment of S. lycopersicum, the treatments consisted of plants inoculated with the endophytic fungus (E_15.1) strain, a positive control (plants inoculated with Trichoderma atroviridae), and a negative control (plants inoculated with sterile distilled water). The dependent variables were root length (RL), stem height (SH), total plant fresh weight (FW), and total dry weight (DW). Experimental units were randomly distributed. Results were analyzed using a one-way ANOVA, and assumptions on residuals were checked. All analyses were performed using the R 4.3.2. generic version (R Core Team 2017) and Python (3.12.0) version. Tukey test was used for mean separation. The analyses were conducted at a significance level (*p≤0.05, **p˂0.01).
To determine the similarities between the genomes of the compared strains regarding genomic functional annotations, a non-metric multidimensional scaling (NMDS) analysis was conducted. All analyses were performed using the VEGAN package in the R programming language version 3.2.2 (R Core Team 2017). The data were normalized, and a Euclidean distance was chosen to carry out the analysis.
3. Results
3.1. Isolation, Optimal Growth Temperature and Morphological Characterization
Endophytic fungal isolates obtained from disinfected root tissues of an
Andropogon sp. were cultivated as described in the methodology, and mycelial growth was observed after seven days of incubation (
Figure 1A). No mycelial growth was observed in the control root imprint dishes (
Figure 1B).
The endophytic fungus E_15.1 grew in solid medium at the lowest temperature tested (28 °C) and at the highest (40 °C) (
Figure 1M-N), showing a higher growth rate at 40 °C, where their mycelial growth at 96h ranged between 7.5 to 8 cm (
Figure 1N), while for this same time, mycelial growth at 28°C, was 5 cm (
Figure 1N). Similarly, it grew in liquid medium at the three temperatures evaluated, showing a higher growth rate at 40 °C (0.06 h-1), which classifies it as thermophilic (
Figure 1O). Morphological characterization was performed, considering the morphology exhibited by the mycelium (size, shape, colony color) in the different culture media (CYA, MEA, and PDA) used for morphological characterization at seven days of incubation. The endophytic fungus E_15.1 was characterized by the presence of large colonies on day 7 in all three types of culture media: MEA, PDA, and CYA (
Figure 1D-F). The colonies were round with filamentous edges in all three media (
Figure 1D-F). In PDA and CYA, the colony surface appeared powdery (
Figure 1E-F), while in MEA, it appeared cottony (
Figure 1D). MEA, PDA, and CYA exhibited black pigmentation with white tones on the front and beige tones on the back (
Figure 1D-F). PDA displayed beige pigmentation with brown and white tones, and it was yellow on the back (
Figure 1F). In CYA a surface with regular radiating lines and a wrinkled texture with cream coloration on the back was observed (
Figure 1E). In all three media, the colonies exhibited a convex elevation (
Figure 1D-F). The microscopic characterization with lactophenol staining of mycelium grown in MEA culture medium after five days of incubation at 28 °C, the presence of conidiophores with phialides and conidia with light green pigmentation could be observed (
Figure 1G, I, K) as well as septate hyphae. (
Figure 1H, J, L).
3.2. Genome Sequencing, Assembly, and Functional Annotation
The genome of strain E_15.1 was sequenced using the Illumina MiSeq platform, yielding a total genome size of approximately 36.9 Mb with an N50 length of 1,968,182 bp (
Supplementary Table S2). This genome size is comparable to that of
A. brasiliensis,
A. carbonarius,
A. aculeatus, and
A. pseudoviridinutans, indicating a significant difference from other
Aspergillus species (
Table 1). A total of 17,182,281 paired-end reads were obtained, each with a sequence length of 150 bp. Among these, 10,926 protein sequences (99.4%) aligned successfully with the nr database, with 8,553 (77.81%) showing the highest similarity to proteins from
Aspergillus brasiliensis CBS 101740. This high level of similarity strongly suggests that strain E_15.1 is closely related to
A. brasiliensis in taxonomic terms.
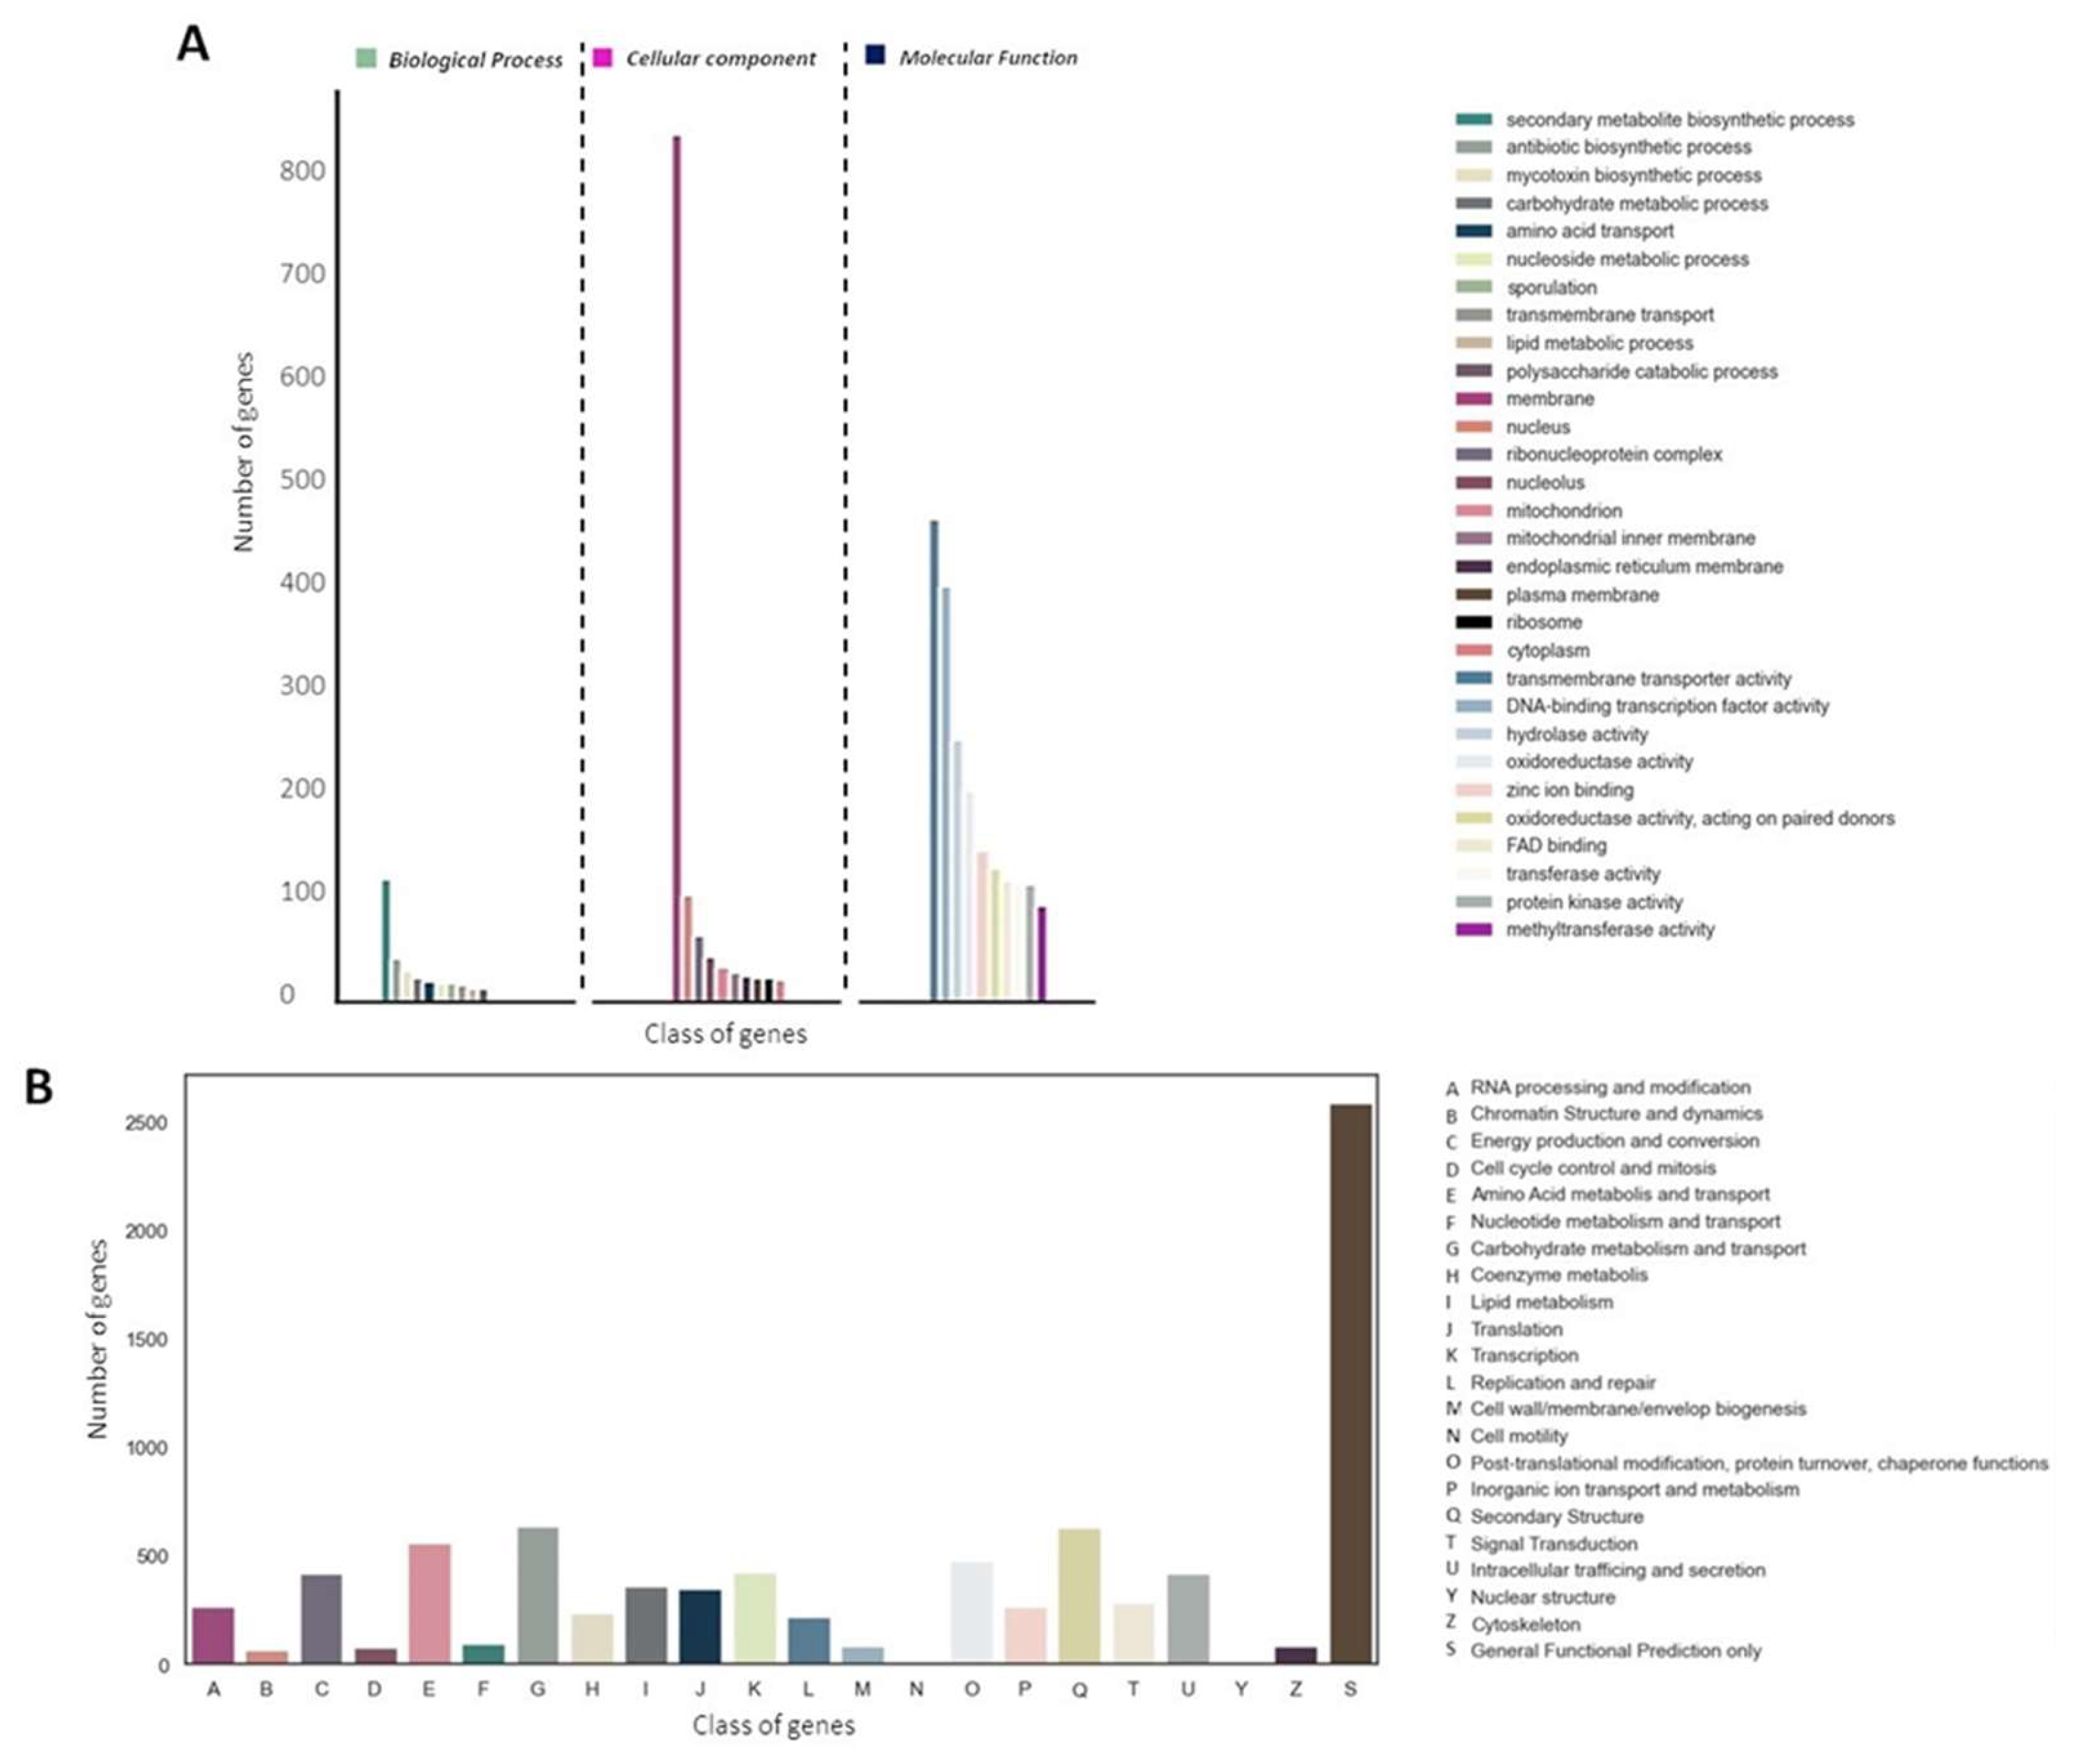
A total of 9,101 proteins (82.79%) were assigned to at least one of the three main GO categories (
Figure 2A). We also identified 10,361 sequences (94.25%) associated with COG functions (
Figure 2B). Interestingly, in both COG and GO annotation, abundant protein sequences associated with secondary metabolism were observed (
Figure 2A-B).
Similarly, a total of 4,130 proteins (37.57%) were designated as KEGG orthologs (KO). The functional annotation by KEGG of the proteins predicted by AUGUSTUS from the fungal genome E_15.1 and 10 strains belonging to the
Aspergillus genus, in relation to key pathways of secondary metabolism, xenobiotic degradation, lipid, and carbohydrate metabolism, as well as orthologs associated with amino sugar and nucleotide sugar metabolism, is depicted in
Figure 3.
The most abundant KEGG categories were represented by glycan biosynthesis and metabolism, carbohydrate and lipid metabolism, and metabolism of terpenoids and polyketides (
Figure 3A). Regarding the orthologs related to the amino sugars metabolism, the largest number of orthologs was represented by K01183 (chitinase), followed by K00698 (chitin synthase) (
Figure 3B), results that could be related to the degradation mainly of chitooligosaccharides perhaps involved in cell wall biosynthesis in E_15.1 strain.
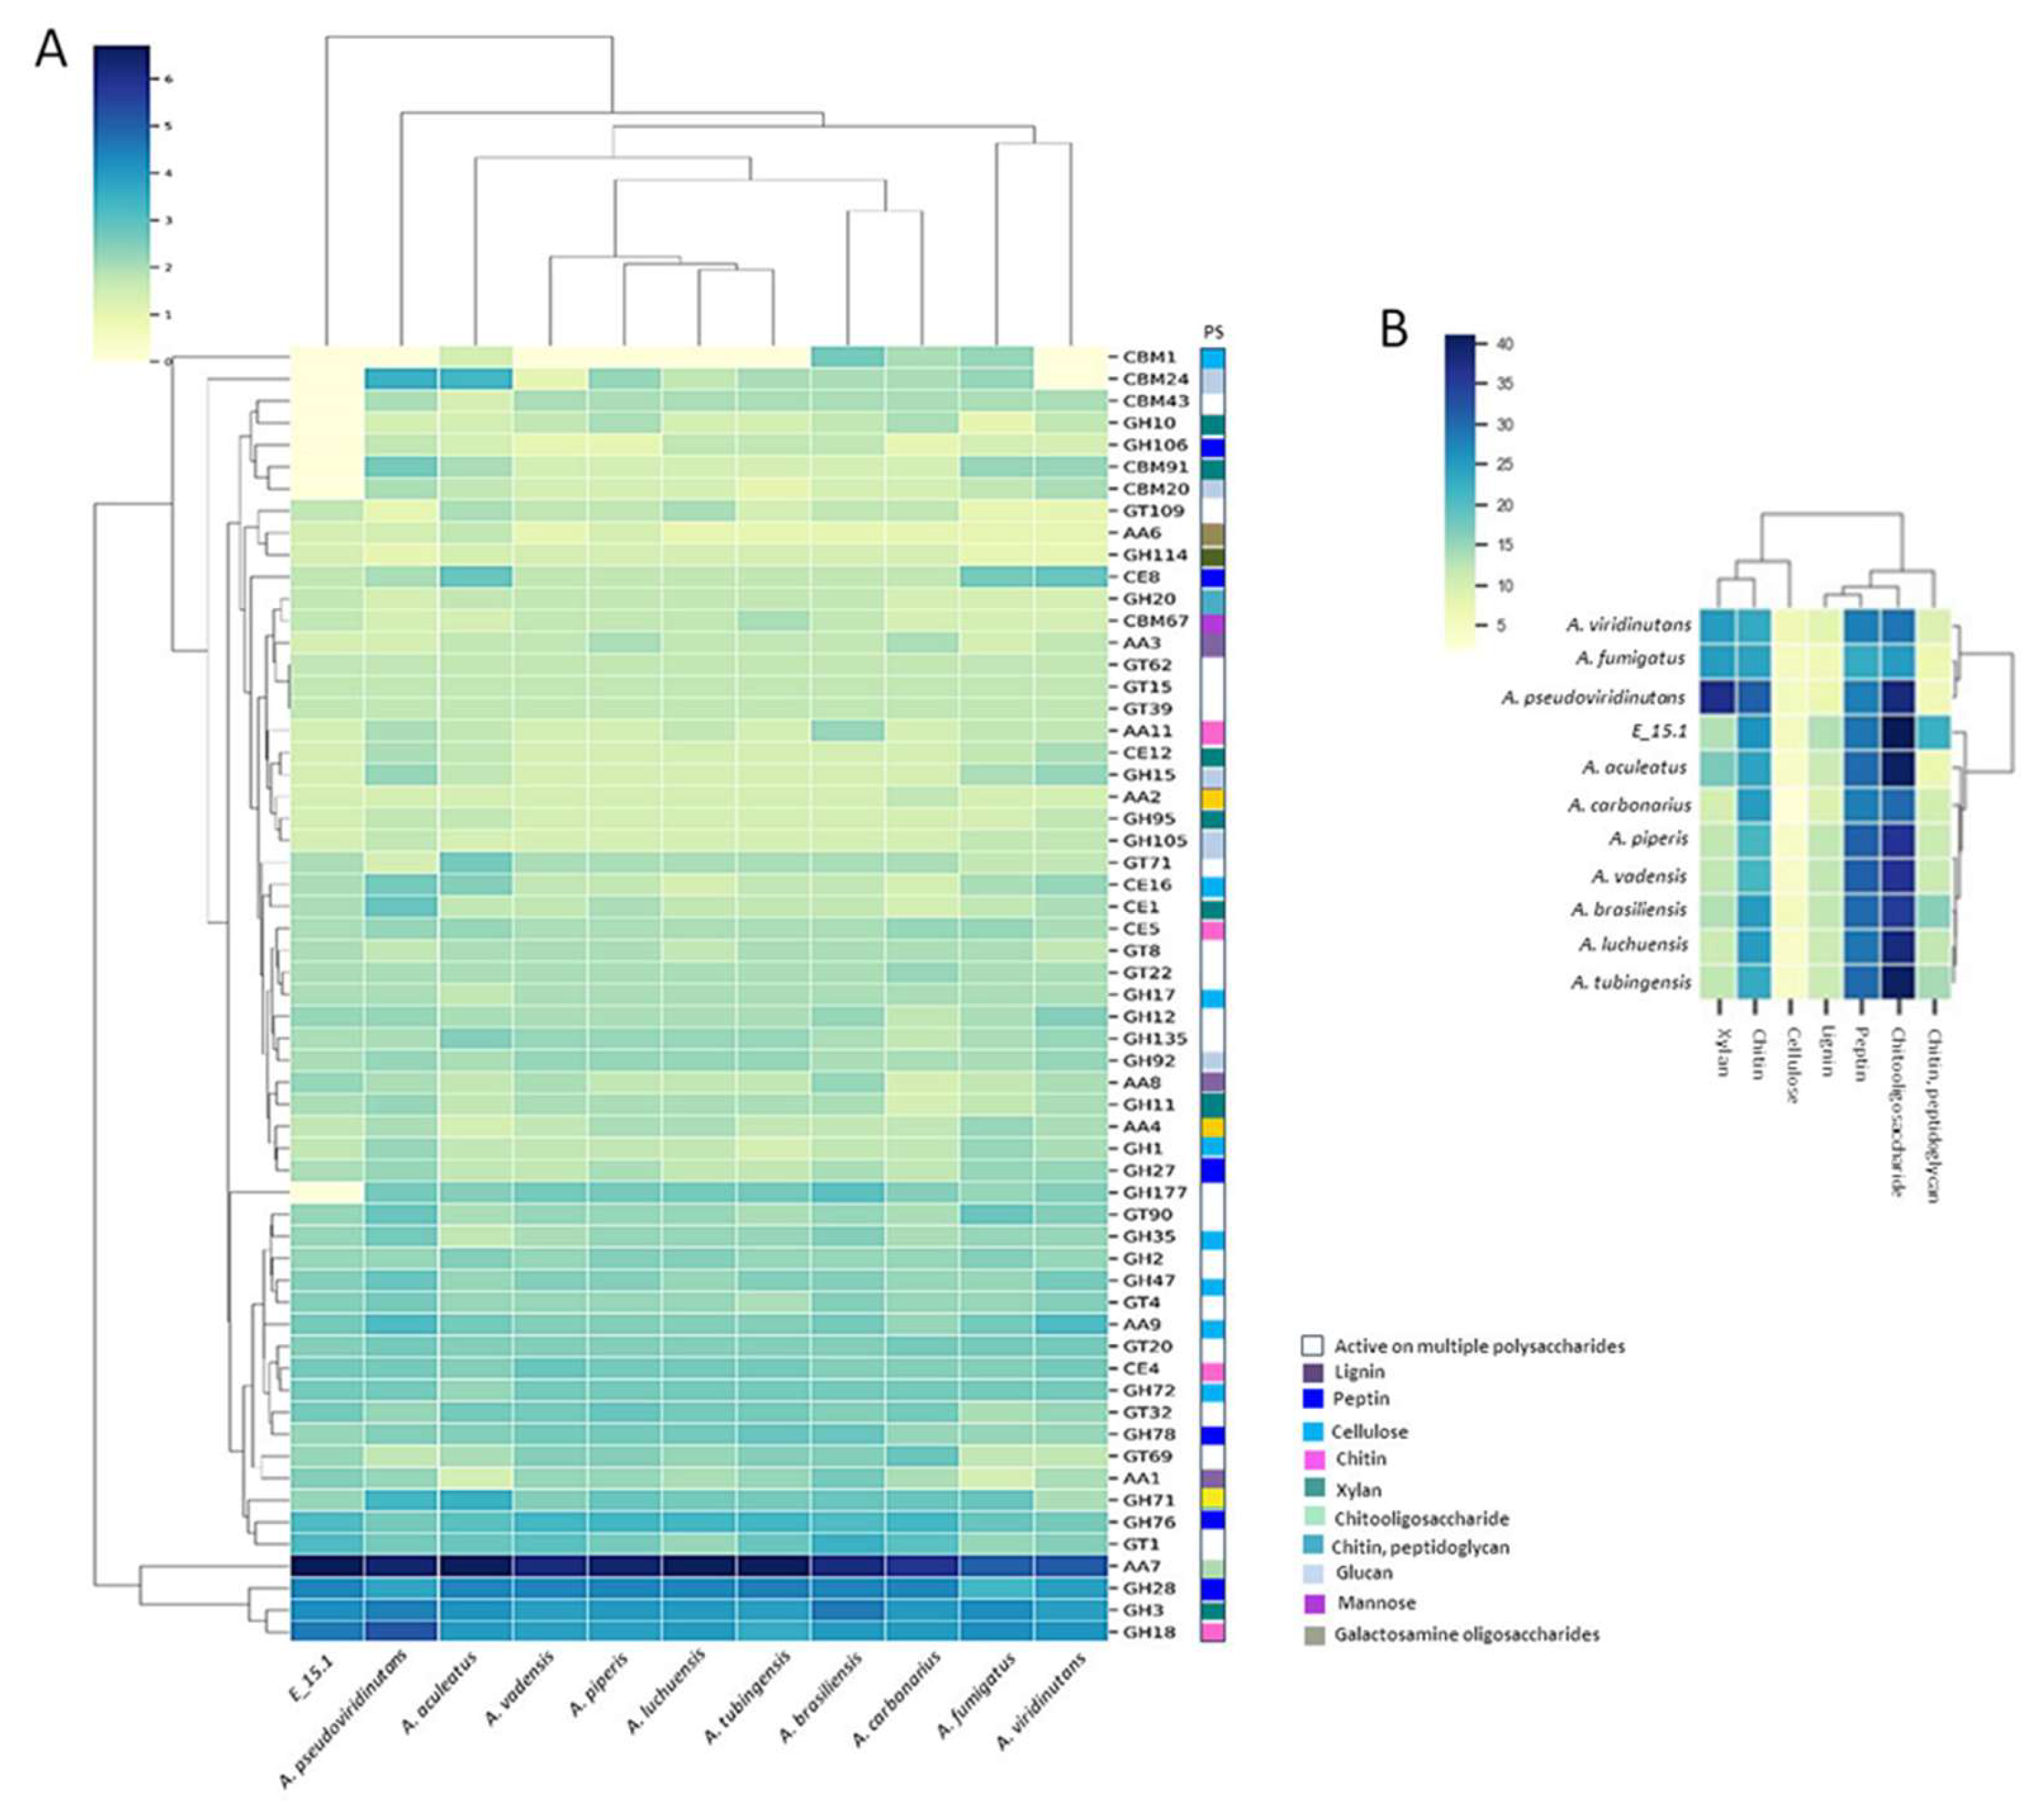
A total of 919 proteins (8.36%) were annotated as CAZymes or proteins related to such functions, such as carbohydrate-binding modules (CBM) and auxiliary activities (AA) (
Figure 4A). Additionally, they were categorized into CAZy protein families with catalytic activities on various substrates (
Figure 4B). Approximately one-third of the predicted CAZy proteins were linked to the degradation or chemical modification of specific substrates, with the highest proportion observed in relation to chito oligosaccharides (
Figure 4B).
3.3. Phylogenetic Analysis
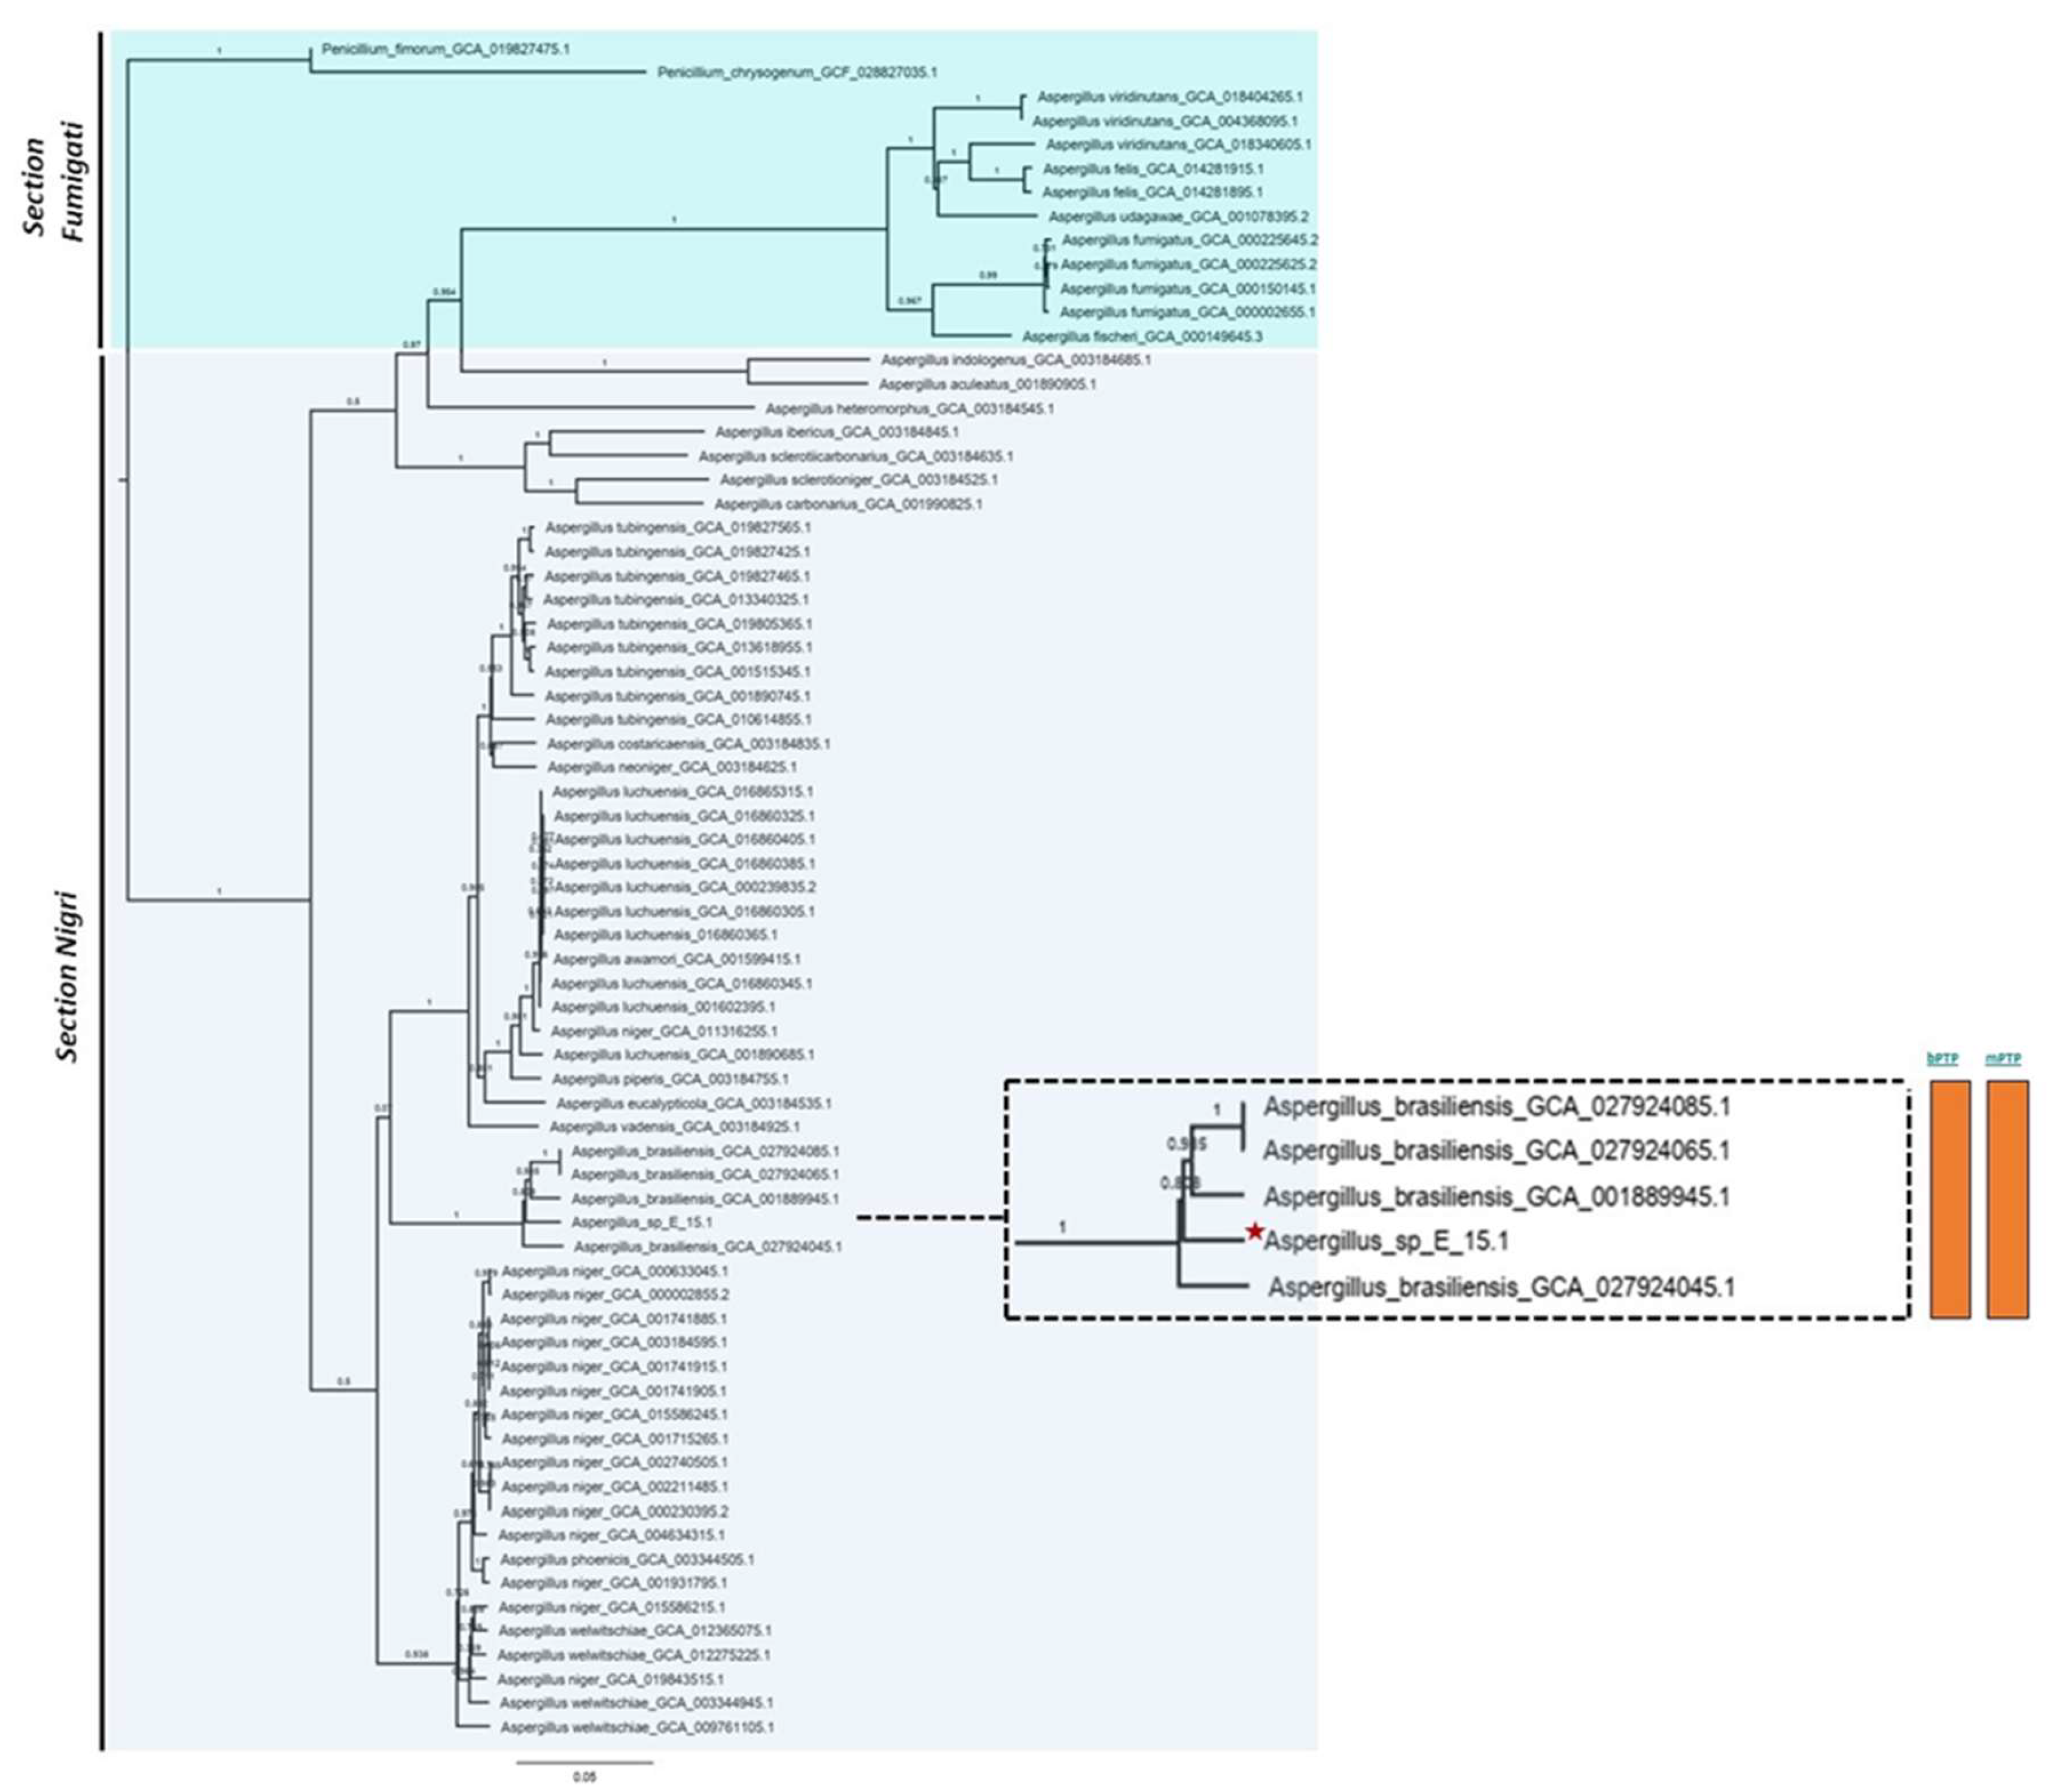
Phylogenomic analysis based on mutational distances resulting from the comparison of 68 fungal genomes from RefSeq categories within the
Aspergillus genus in JolyTree it shows
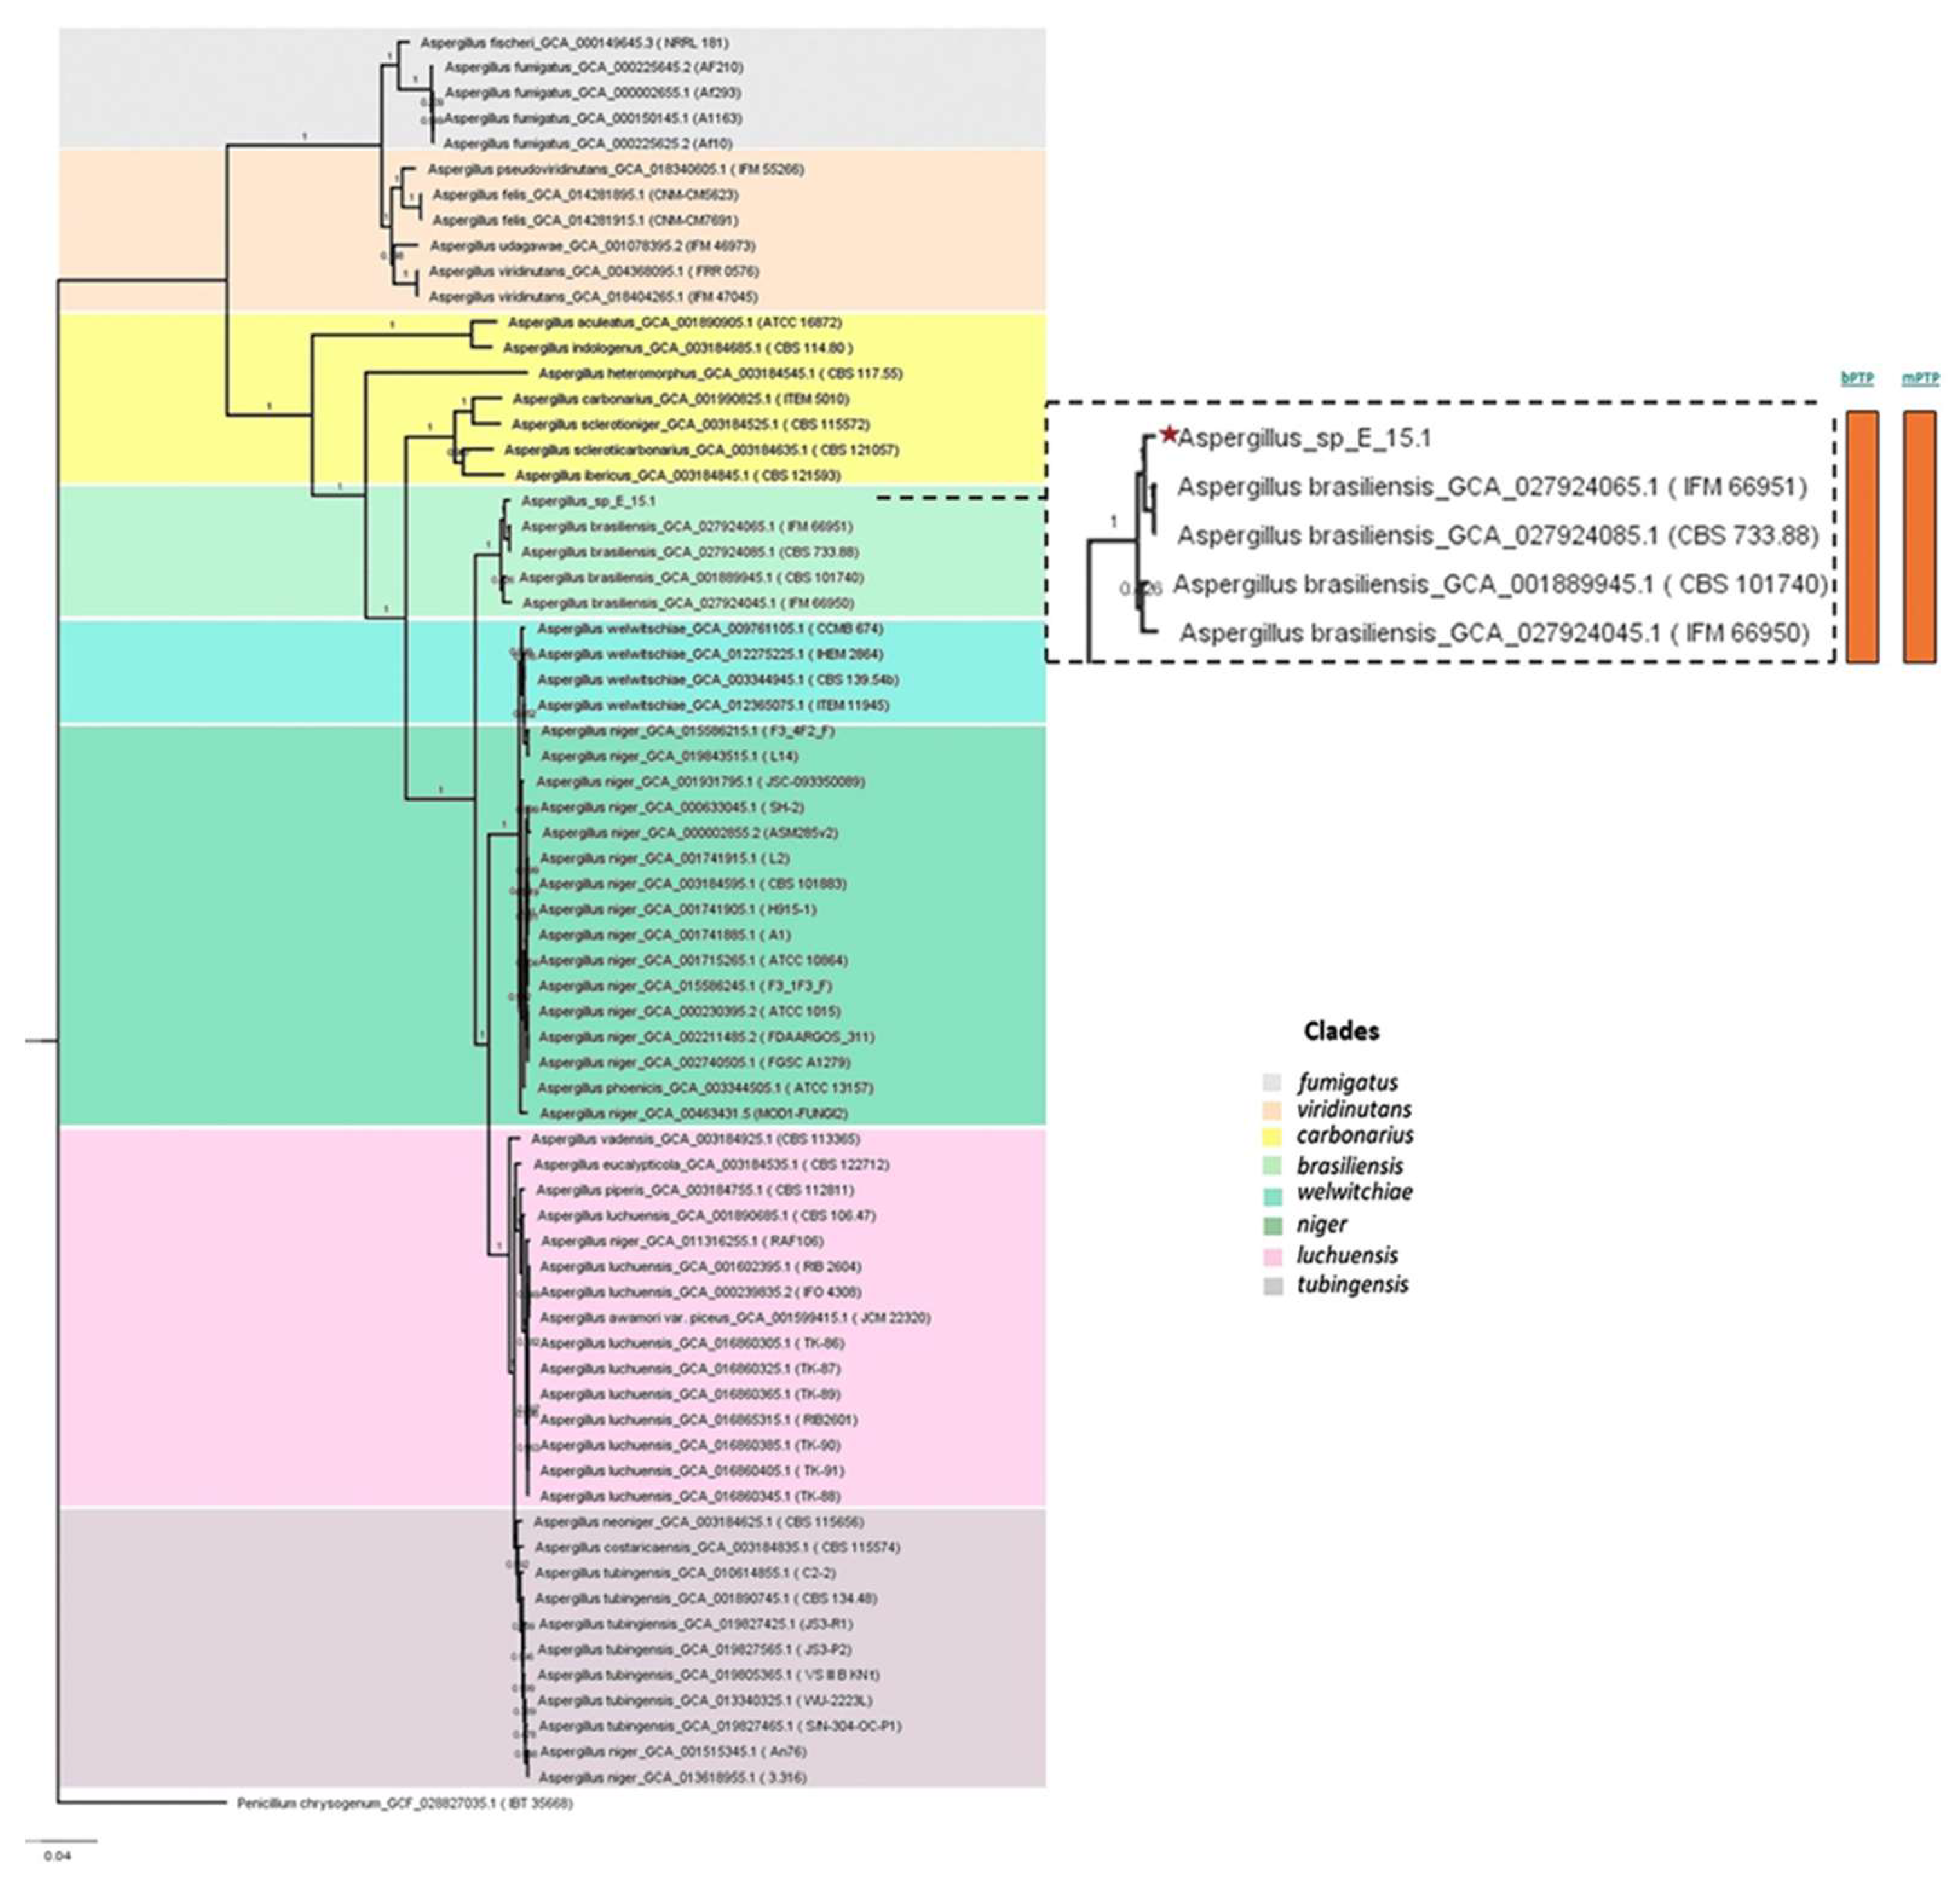
Figure 5. The phylogenomic relationship of strain E_15.1 was found to be closely related to the genome of strain GCA001889945.1 (CBS 101740T), classified as
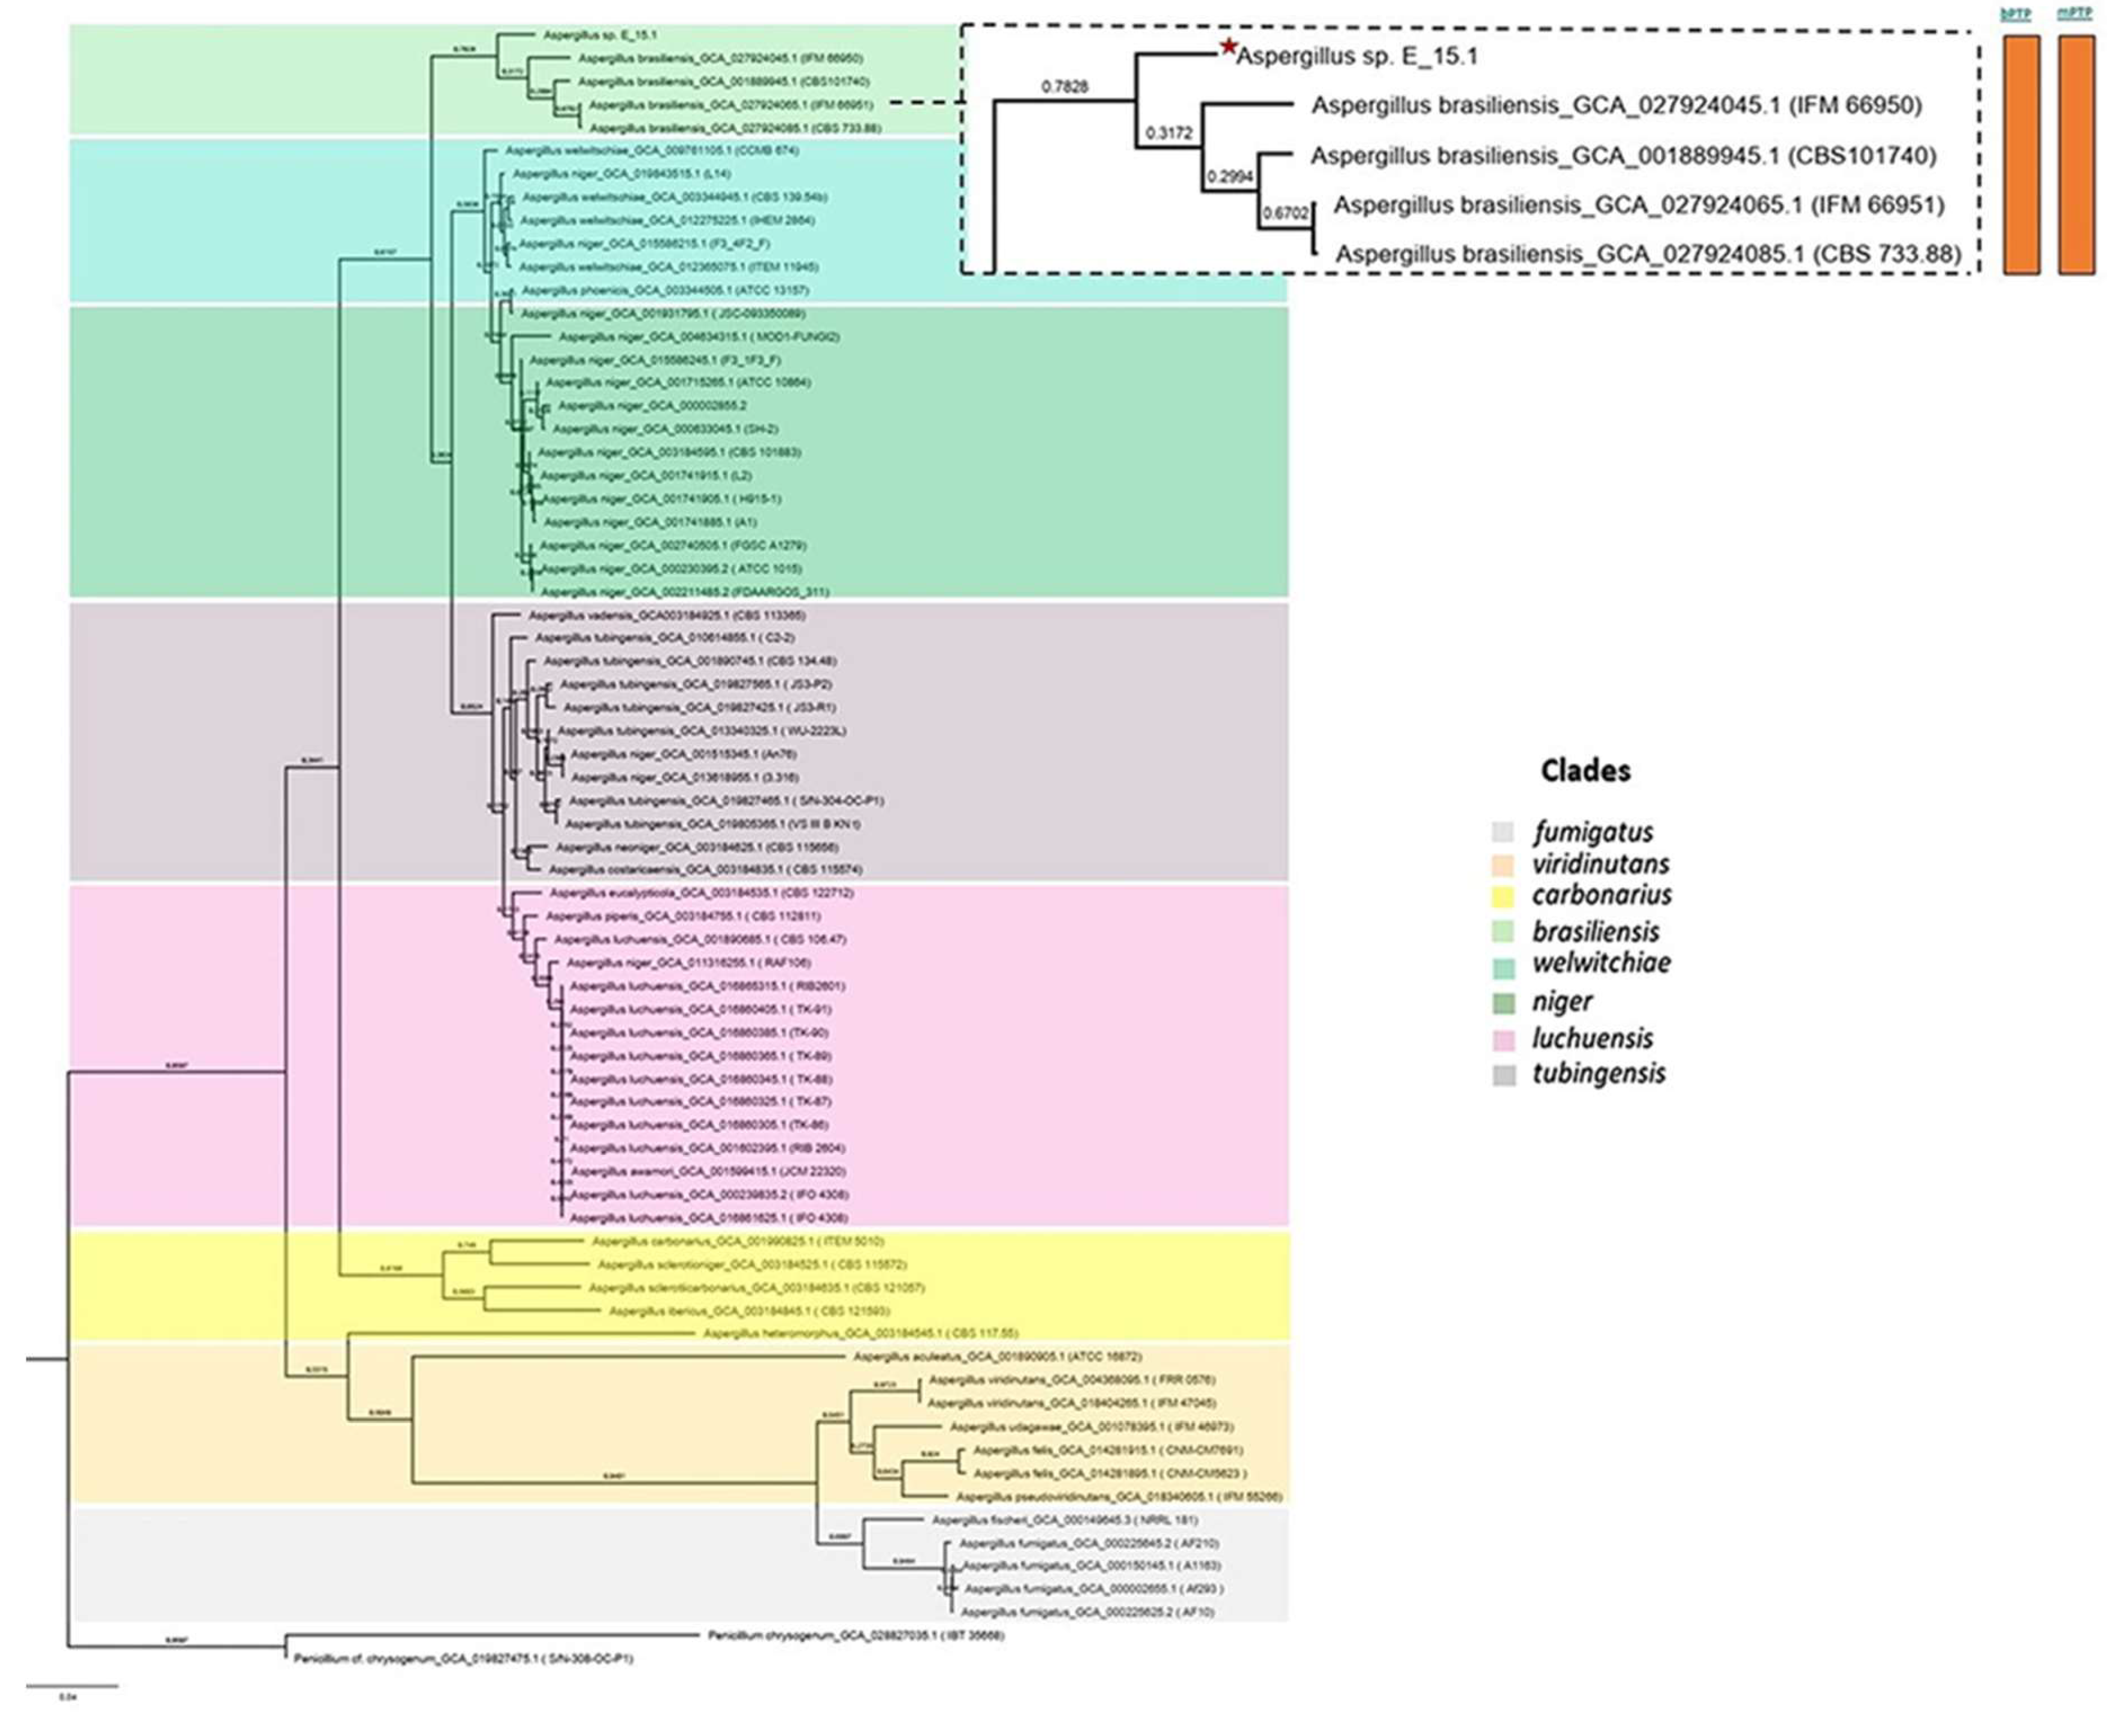
A. brasiliensis. The genetic orthology analysis (
Figure 6) and the UFCG (Universal Fungal Core Genes) analysis (
Figure 7) similarly showed that the E_15.1 strain is closely related to the
A. brasiliensis strain. OrthoFinder results showed that there are a total of 15,169 orthologous protein groups present among the predicted proteomes and a total of 1,119 orthologous proteins existing as a single copy.
All phylogenetic trees yielded strong evidence for a monophyletic clade consisting of A. brasiliensis, allowing us to classify E_15.1 as A. brasiliensis.
Furthermore, species delimitation tests in both algorithms (bPTP and mPTP) for all phylogenetic trees aim to determine the transition point from one speciation process to another coalescence process. In our case, the E_15.1 strain is constrained to a single coalescence rate across all trees with A. brasiliensis by accommodating specific intraspecies coalescence rates.
Finally, the genomic coherence values ANI (Average Nucleotide Identity) and Mash genomic distance, showed values of 96.7% and 0.02 respectively, between strain E_15.1 and the genome of strain GCA001889945.1 (CBS 101740T), which demonstrates a high genetic relationship between both species.
3.4. Identification of Metabolic Pathways and Specialized Metabolites
Genomic exploration of genes related to secondary metabolites synthesis in strain E_15.1 revealed 14 regions, each hosting groups of unique candidates (
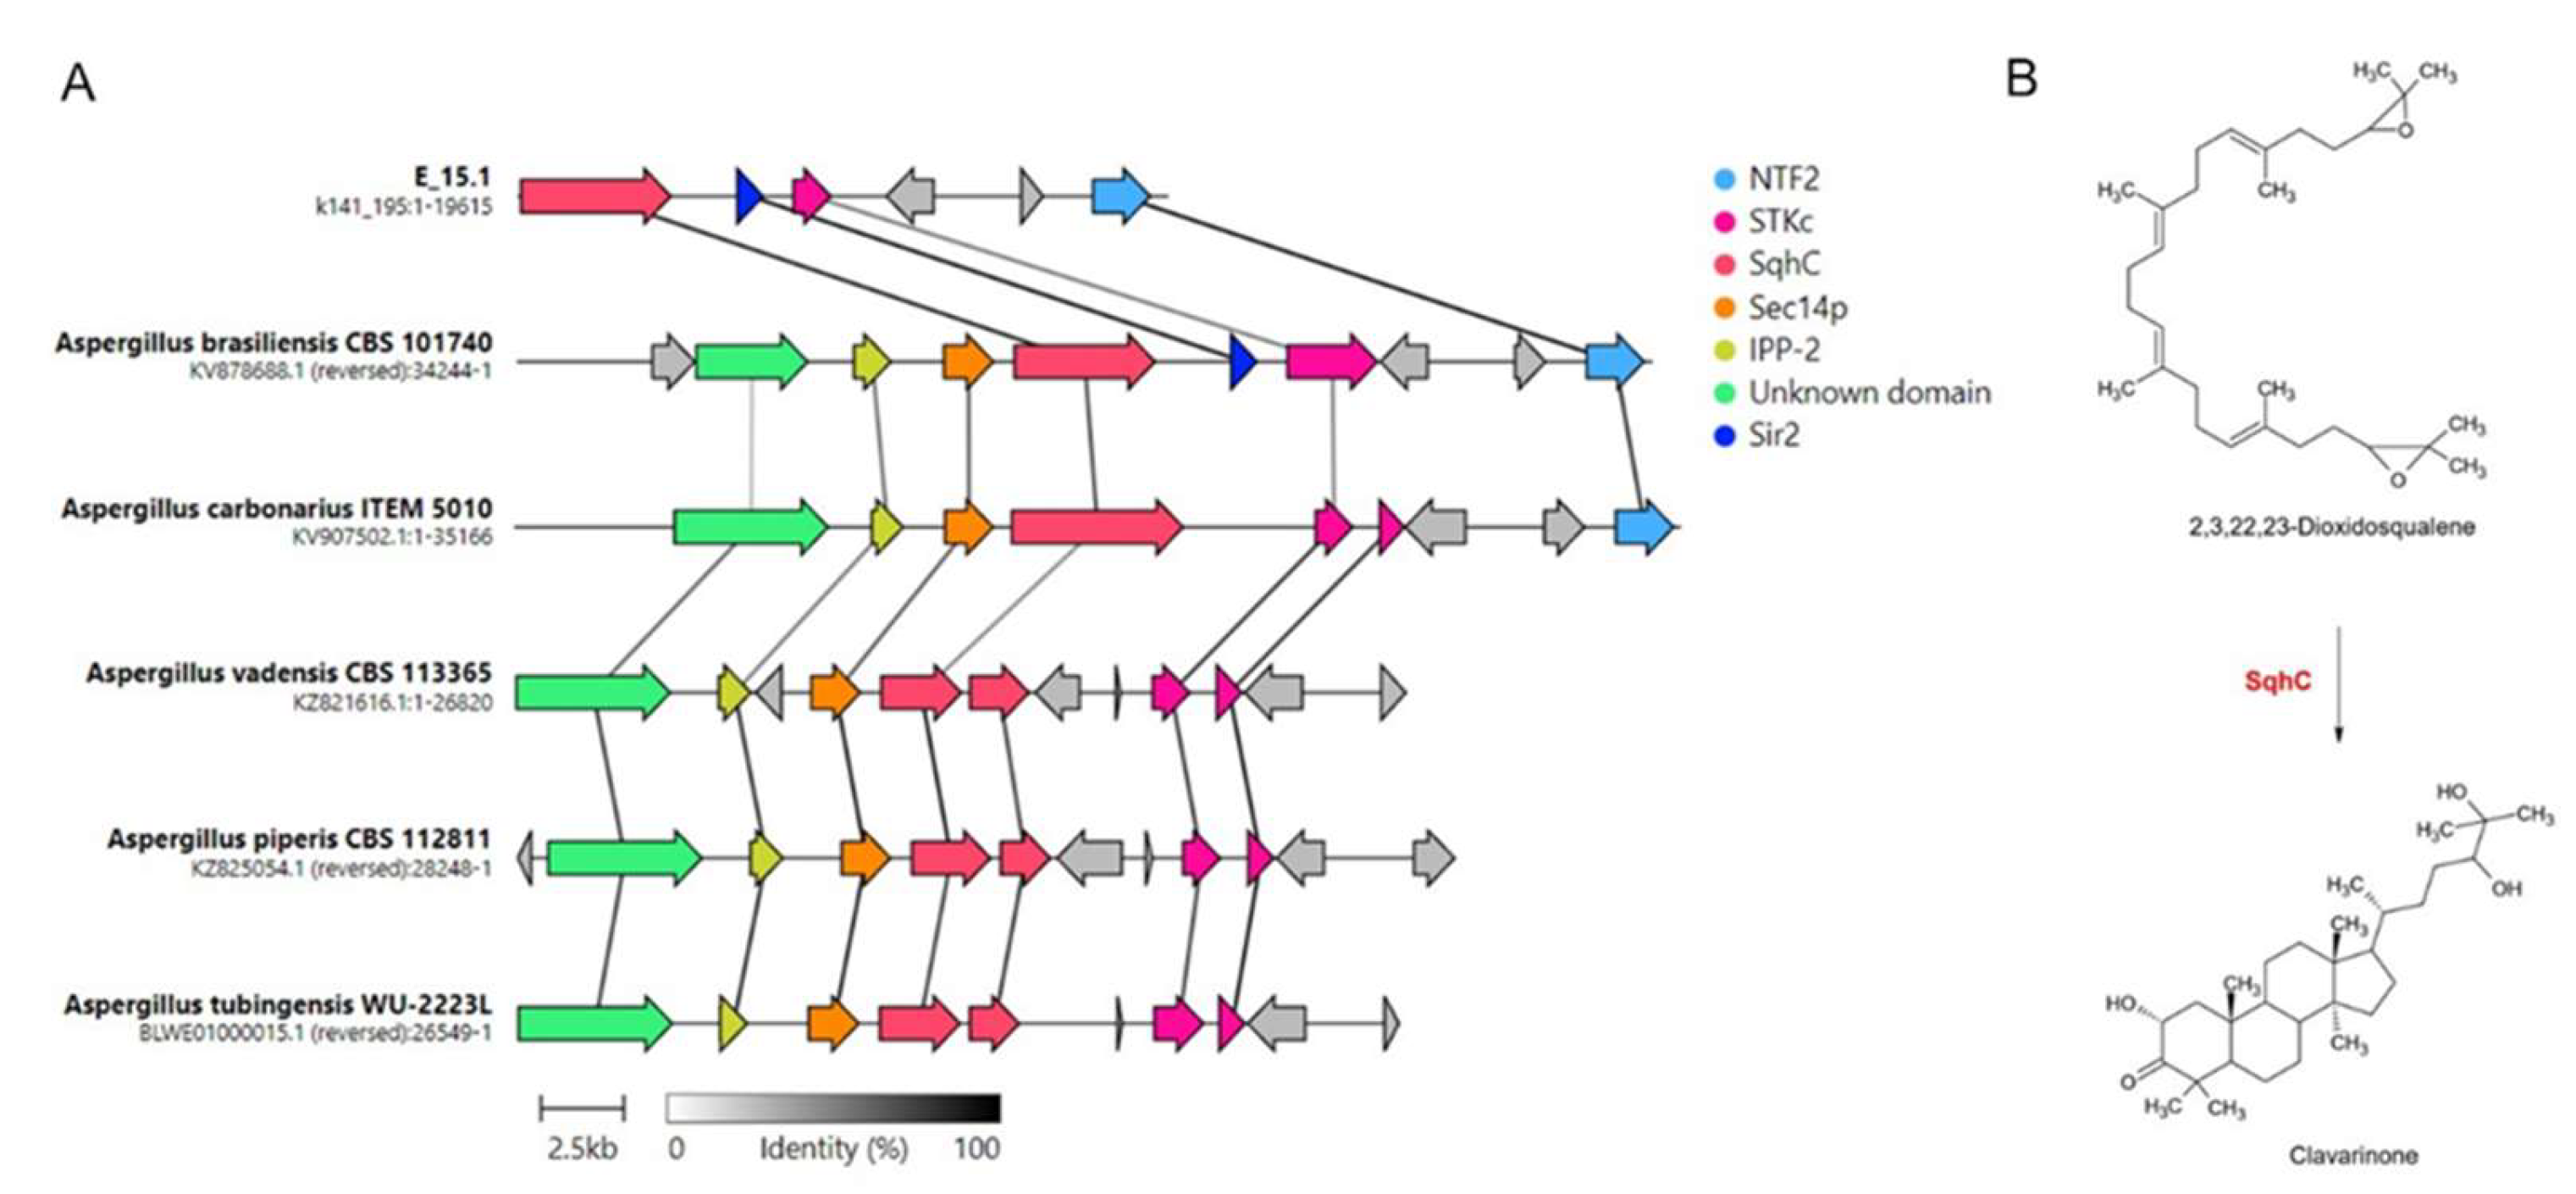
Table 2). Four of these had no matches for the 'most similar known cluster' output, corresponding to the terpene type (region 489.1), indole (region 405.1), NI-siderophore (region 345.3), and NRPS (non-ribosomal peptide synthetase) group (region 418.1). Nine regions showed partial matches with similarity scores ranging from 7% to 70% for the top results: Hybrid NRPS-PKS (non-ribosomal peptide synthetase-polyketide synthase) (region 39.1) with microperfuranone (region 278.1) with terrestric acid (region 345.1) with aspergillicin A (region 389.1), in that order. Interestingly, a cluster was detected with a 100% similarity to the BGC associated with clavaric acid synthesis. After manual inspection, the presence of homologs for various components of the gene cluster responsible for the biosynthesis, transport, and regulation of this metabolite was confirmed. Synteny analysis of clavaric acid biosynthetic gene clusters identified in different
Aspergillus species compared in this study was conducted (
Figure 8).
Of all the genes involved in clavaric acid biosynthesis in strain E_15.1, the one who presented the one exhibiting the highest identity with the A. brasiliensis strain CBS 101740 corresponded to NTF2 (100%), involved in transportation, followed by Sir2 (99%), involved in regulation and SqhC (94%), which plays a key role in the biosynthesis of this metabolite. The STKc gene was the one with the lowest percentage of identity (63%) between both strains. The proteins corresponding to IPP-2 and Sec14p were not detected by AntiSMASH within the E_15.1 genome, however, on the set of coding sequences annotated by DIAMOND, both proteins were detected with high homology (100% and 97.3% respectively) to the present in A. brasiliensis CBS 101740 (sequence IDs: g7955.t1 and g7956.t1; Supplementary Dataset S1).
In order to identify protein families with functions of interest in the genome of strain E_15.1 and the ten compared
Aspergillus strains, a search for specific metabolic pathways related to potential Plant Growth-Promoting (PGP) attributes was conducted using the KEGG and KofamKOALA orthology databases (
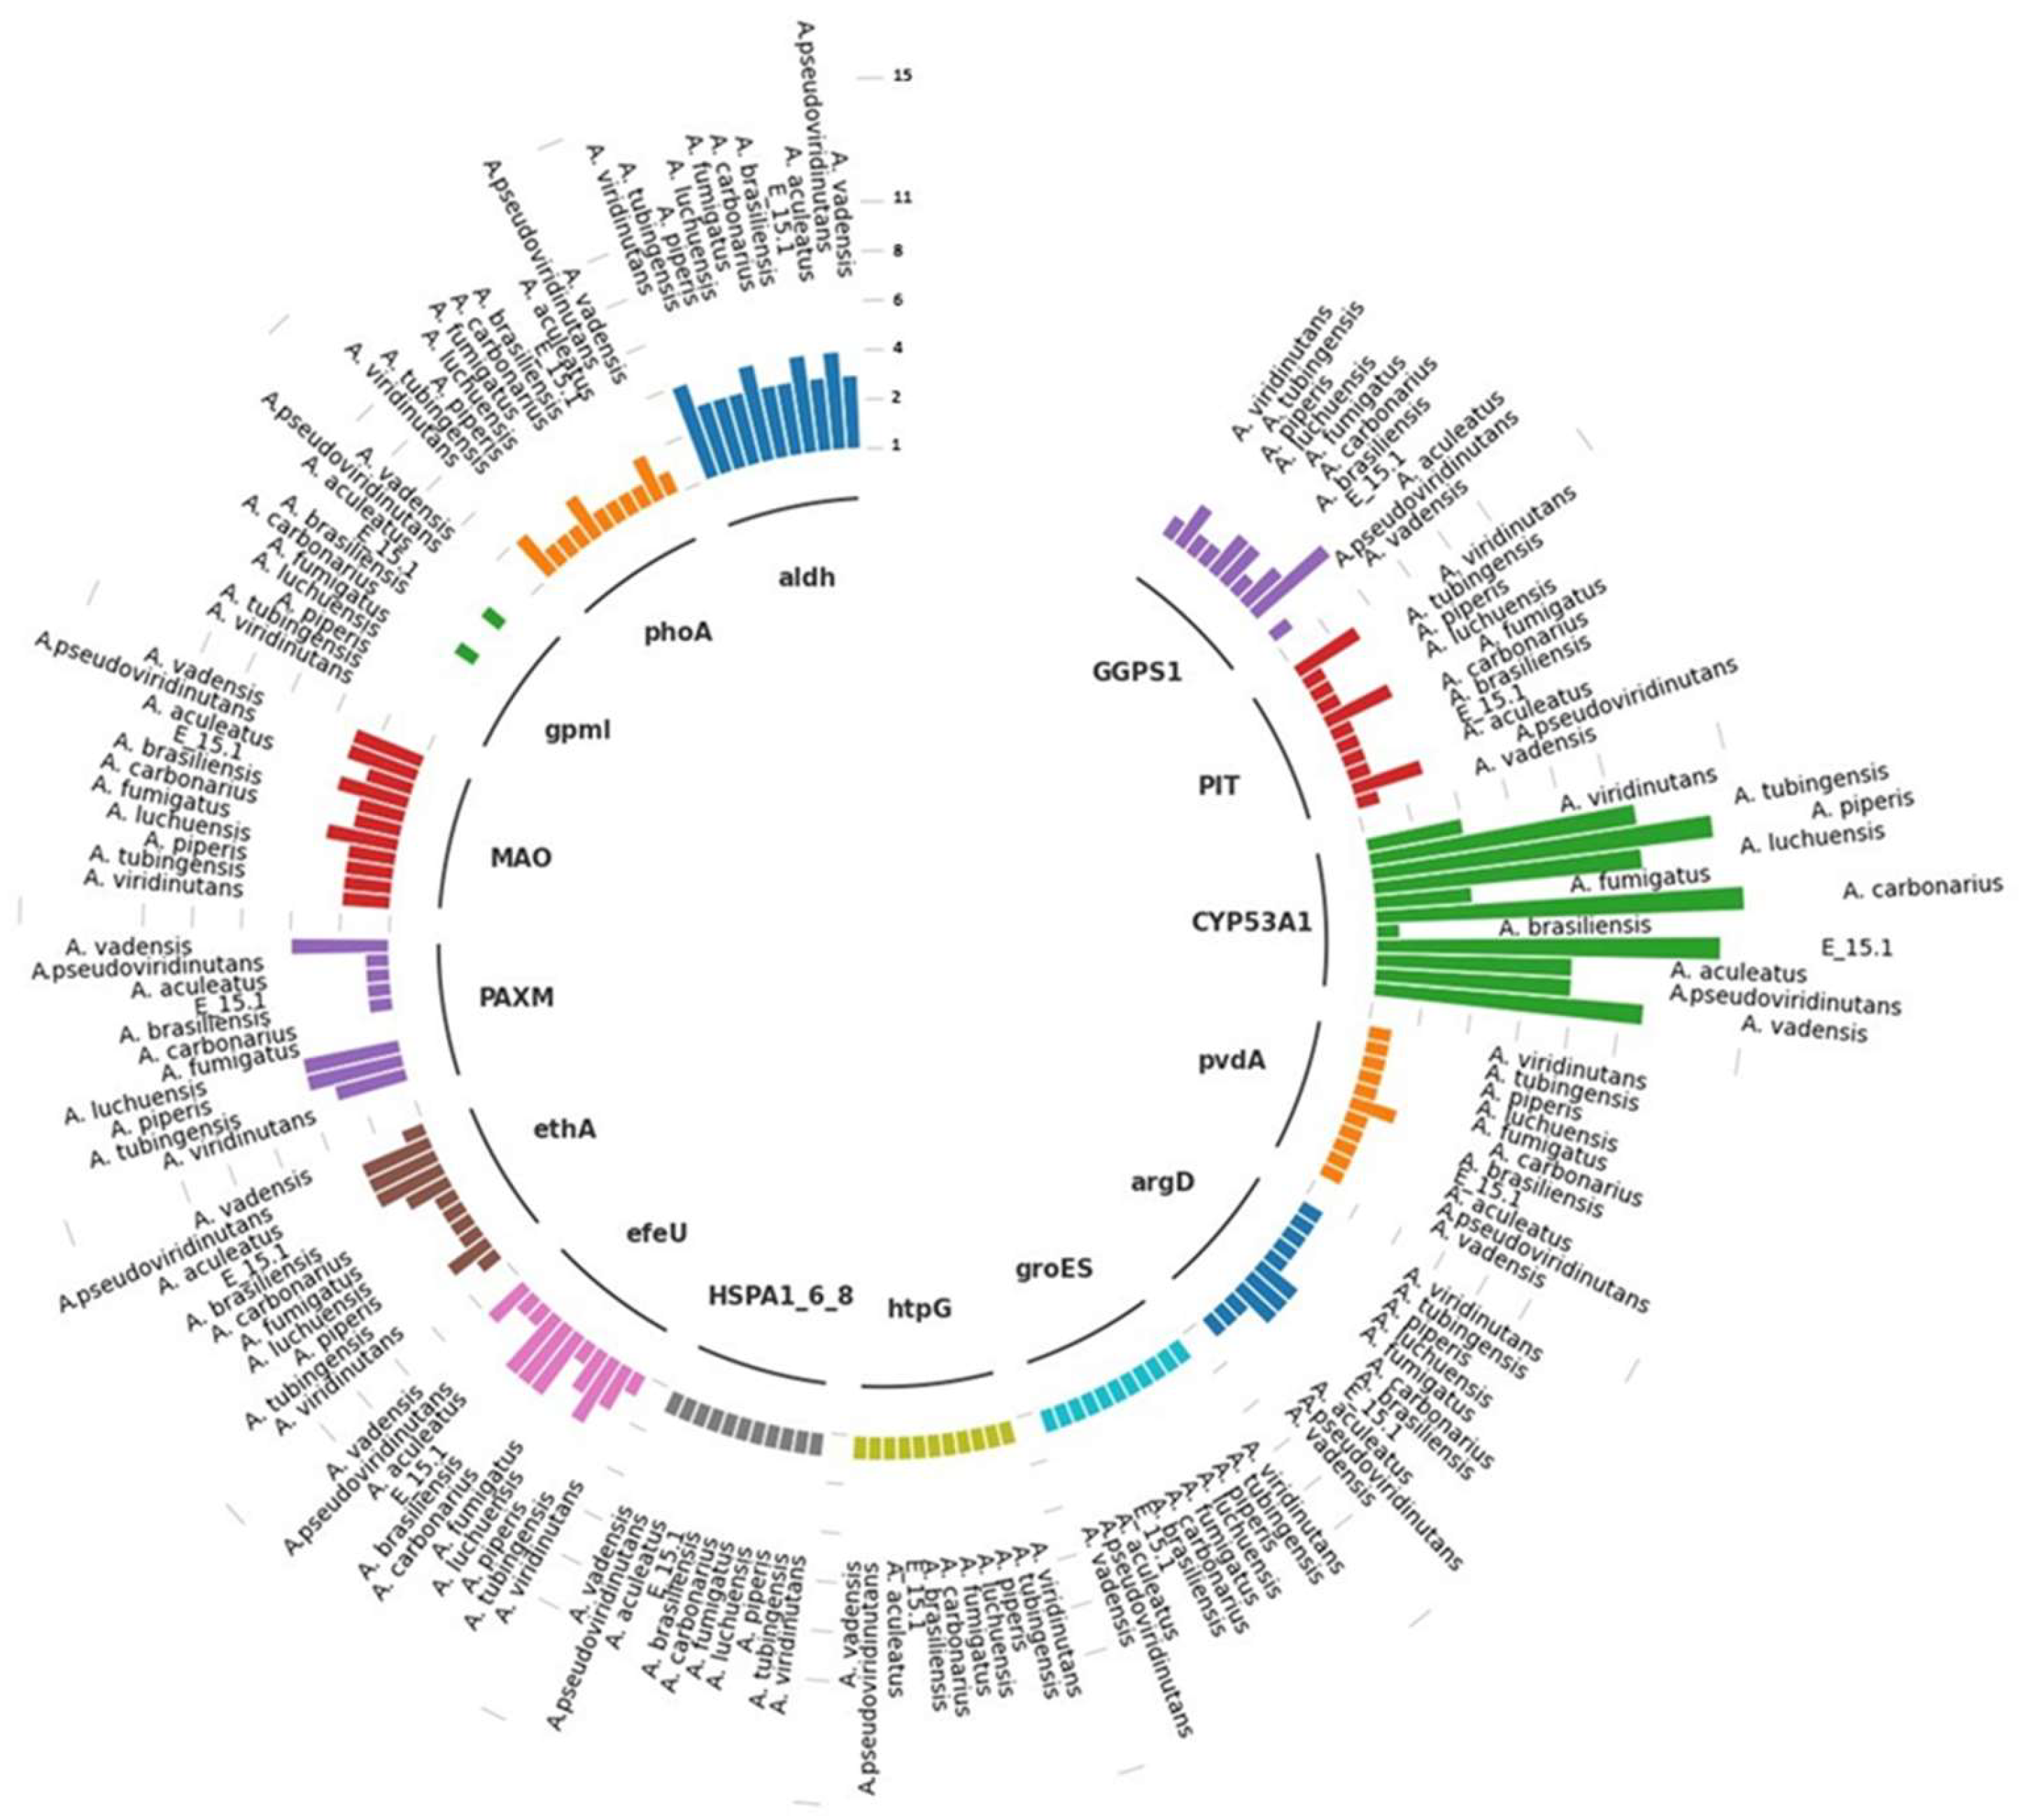
Table 3). This analysis revealed the presence of gene copies involved in the biosynthesis of plant growth regulators (AIA, gibberellins), phosphate solubilization, siderophore production, Cytochrome P450, and heat shock proteins (HSP) (
Figure 9).
Specifically, in the case of phosphate uptake, gpmI was the only gene not found in the genomic context of strain E_15.1, while the rest of the genes were present in a single copy (phoa and PIT). In the case of A. pseudoviridinutans, A. fumigatus, and A. viridinutans, three copies of PIT and two copies (phoa) were found. The gpmI gene was only found in a single copy in A. aculeatus and A. carbonarius. Genes associated with iron uptake were also examined, and three copies of efeU were detected in E_15.1, A. brasiliensis, A. carbonarius, and A. piperis, while in the rest of the compared genomes, this gene was found in a single copy.
Two genes involved in an alternative pathway for IAA (indole-3-acetic acid) metabolism (tryptamine; TAM) (MAO and aldH) were found, with four copies of aldH in E_15.1, A. pseudoviridinutans, A. fumigatus, A. viridinutans, and four copies of MAO in A. vadensis, A. brasiliensis, A. luchuensis, and A. piperis. Regarding biodegradation and xenobiotic metabolism, three copies of the ethA gene were found in E_15.1, A. aculeatus, and A. pseudoviridinutans. It is worth noting that the highest number of gene copies was found for the CYP53A1 gene (cytochrome P450), which is attributed to the versatility of these proteins in a wide range of enzymatic reactions.
In relation to the response to abiotic stress, three genes in a single copy were found for all compared genomes (HSPA1_6_8, groES, htpG). Two genes associated with siderophore production (pvdA and argD) were found in single copies, respectively. Finally, in relation to gibberellin biosynthesis (AG3), a gene (GGPS1) was found in two copies in all compared genomes, except for four copies in A. aculeatus.
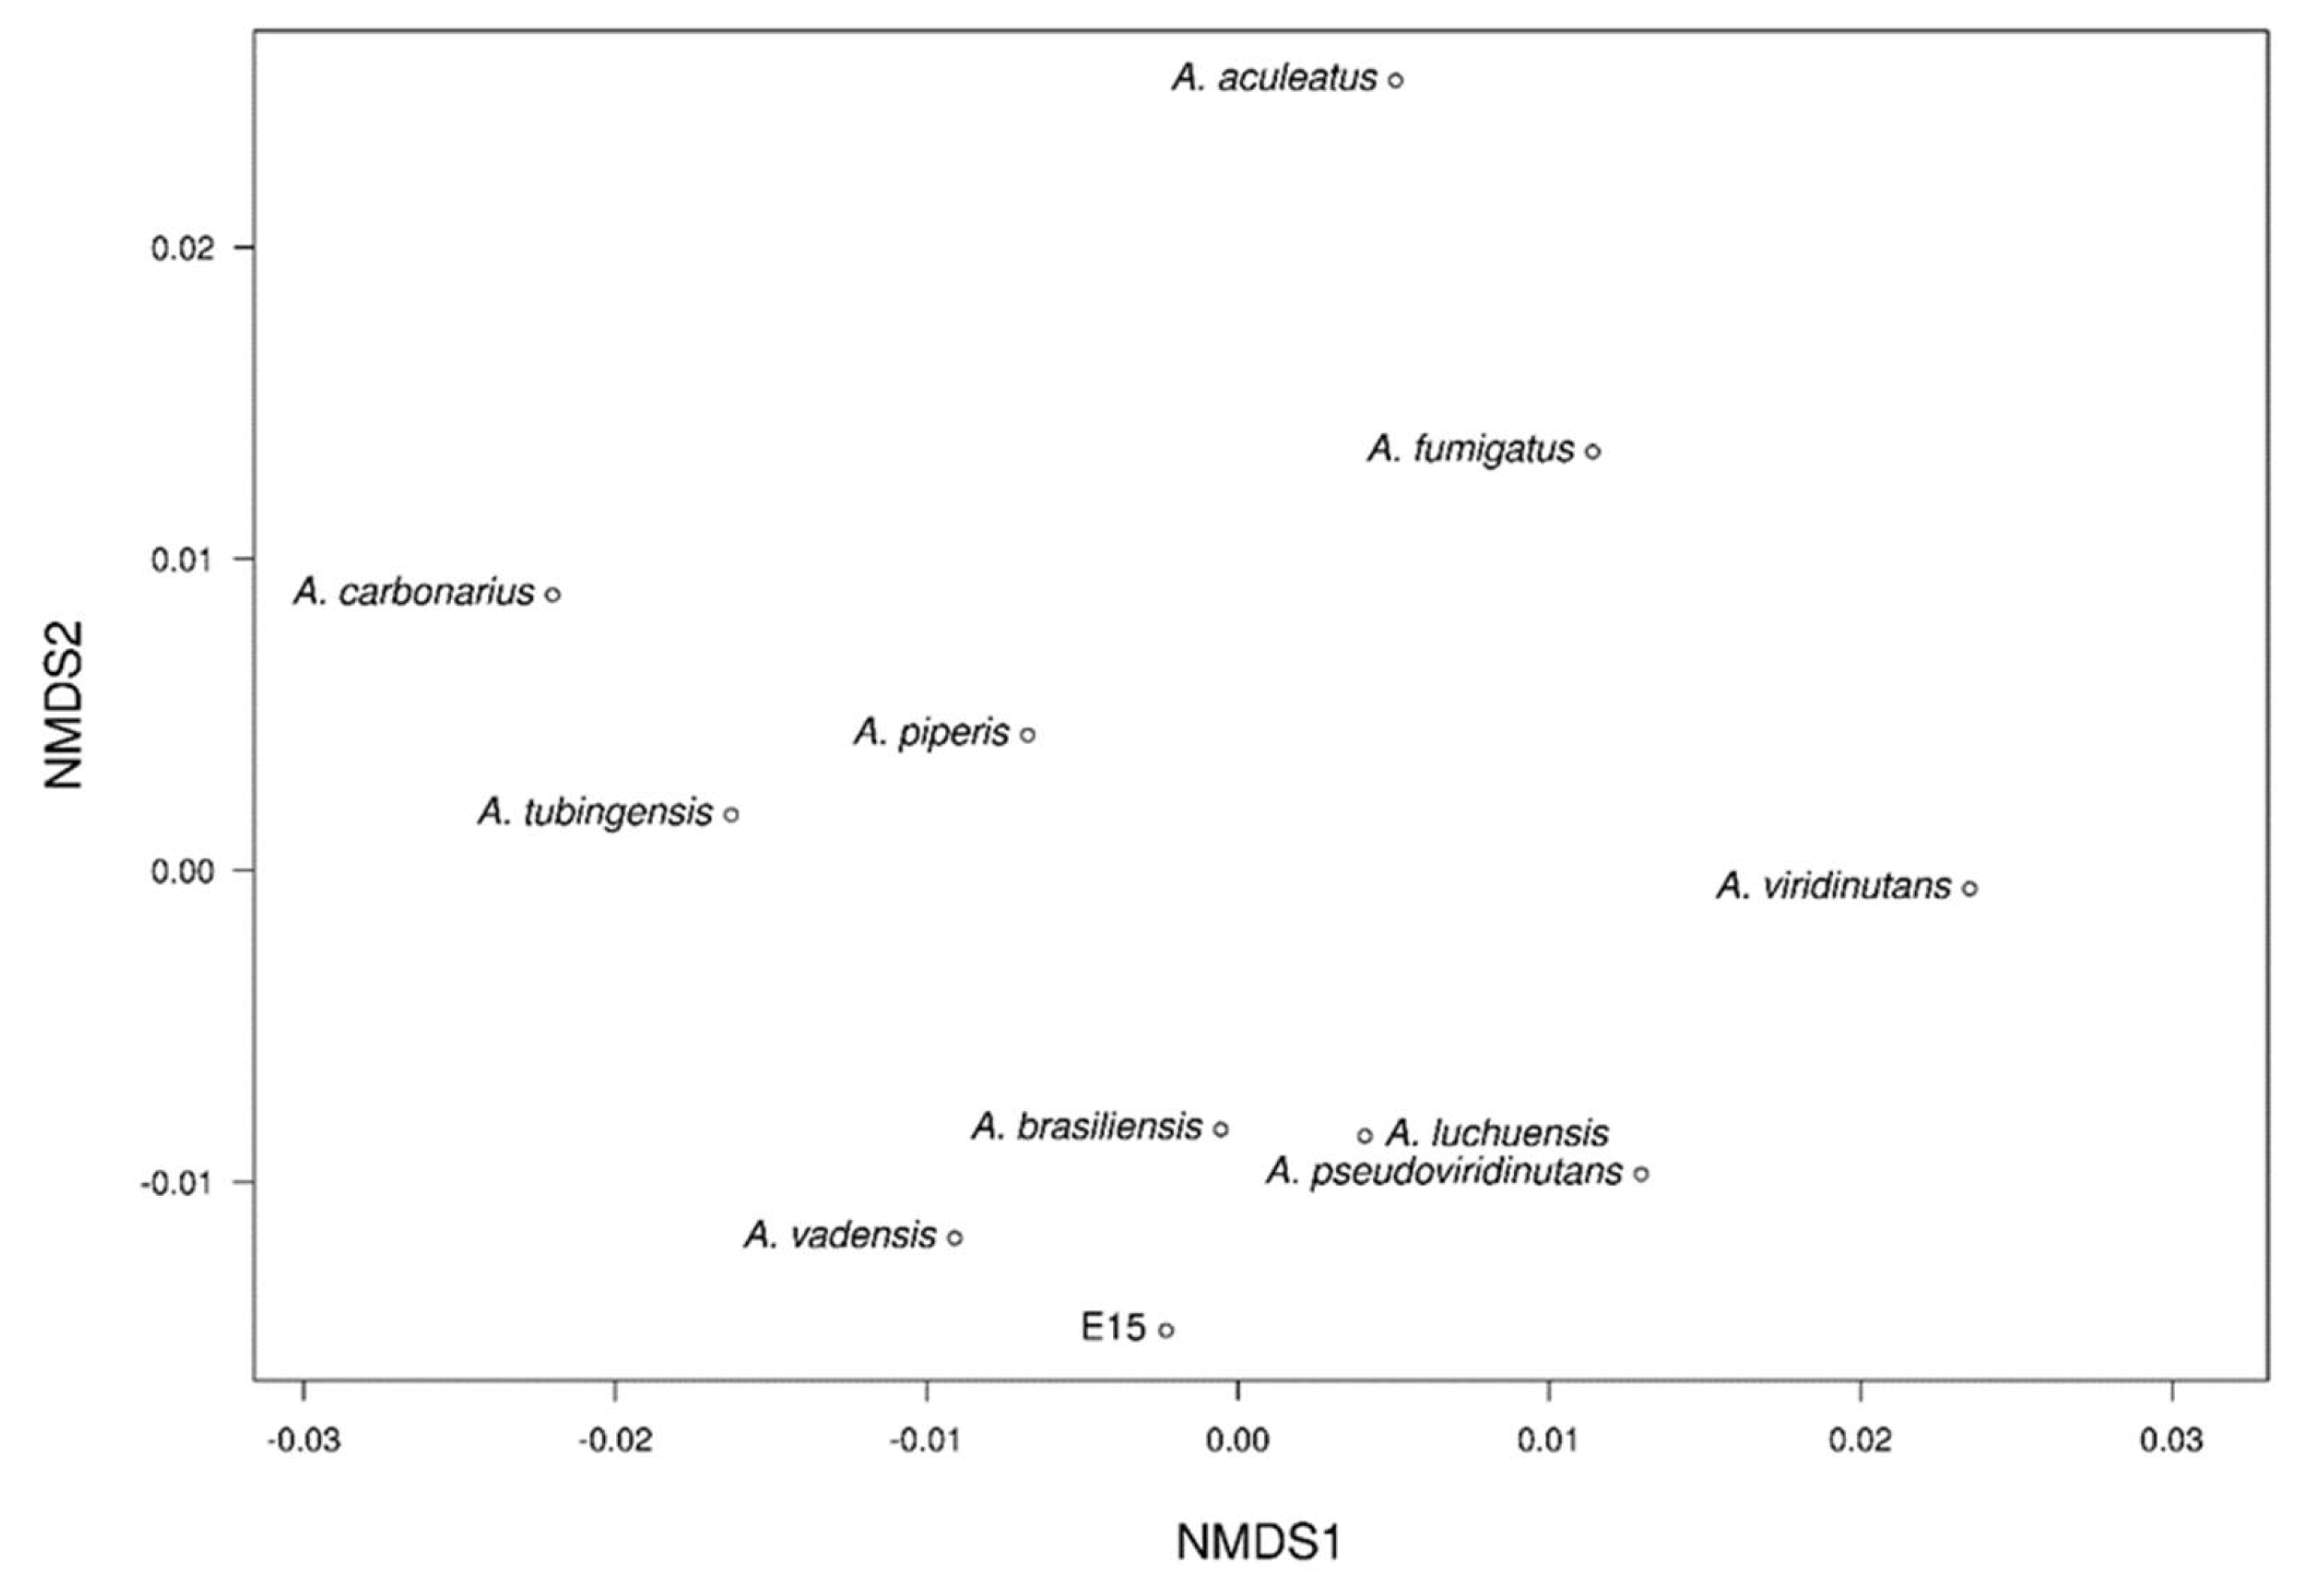
The NMDS analysis revealed two distinct clusters among the different genomes clearly separated in a three-dimensional space (
Figure 10). In the first group, E_15.1 strain was observed close to the strains of
A. brasiliensis,
A. vadensis,
A. luchuensis, and
A. pseudoviridinutans. In a second group,
A. piperis,
A. tubingensis, and
A. carbonarius were grouped together. Independently and more distant, the strains
A. fumigatus,
A. viridinutans, and
A. aculeatus were observed. These results support the representation of the NMDS, which highlights the genome of
A. aculeatus as the most distinct species in terms of genomic functional annotations.
3.5. In Vitro Assays for PGP Traits and Hydrolytic Activities
Due to the results obtained from the genomic analysis, experiments were performed to confirm the phenotypic characteristics suggested by several interesting traits found in the genome. Through
in vitro assays (
Figure 11), four positive PGP activities were confirmed in strain E_15.1. A very good P solubilization activity (PVK culture medium) (
Figure 11A) was detected for E_1.5 as judged by the broad clear zones around the colonies. Siderophore production using CAS agar medium (
Figure 11B), was clearly detected but the halos around the colonies were smaller. The same was true for the gibberellin production using Candau test (
Figure 11C), where the production of florescence was observed. The amount of IAA produced by E_15.1 gradually increased with tryptophan concentration (
Figure 11G), reaching an IAA production of 14.8 µg/ml with the highest concentration, compared to the medium without tryptophane, where practically no IAA production was observed (0.78 ug/ml). Complementary to this, hydrolytic activity was also detected, specifically for chitinases (
Figure 11D), cellulases (
Figure 11E), and xylanases (
Figure 11F) through the medium culture supplemented with 1% carboxymethylcellulose (CMC), beechwood xylan, or colloidal chitin as the sole carbon source for each assay respectively. In relation to these results, smaller clear halos could be observed around the colonies when evaluating the activity of chitinases (
Figure 11D) and cellulases (
Figure 11E) in comparison with more defined and larger halos that were observed in the activity of xylanases (
Figure 11F).
3.6. Plant Responses to E_15 Interaction in Greenhouse Conditions
We conducted an experiment to evaluate whether E_15.1 can promote plant growth, which is the overall effect of the beneficial properties of a PGPR on the host plant. We evaluated the potential of E_15.1 in enhancing tomato plants growth in vivo by applying a suspension the 1 x 10
6 spores/ml of E_15.1 at the substrate level of tomato plants and assessing their growth after 90 days in greenhouse conditions. The most relevant and statistically significant results were observed in the increase stem longitude, total fresh weight and total dry mass in the plants inoculated with the E_15.1 strain compared to the positive control, and non-inoculated control (
Figure 11H).
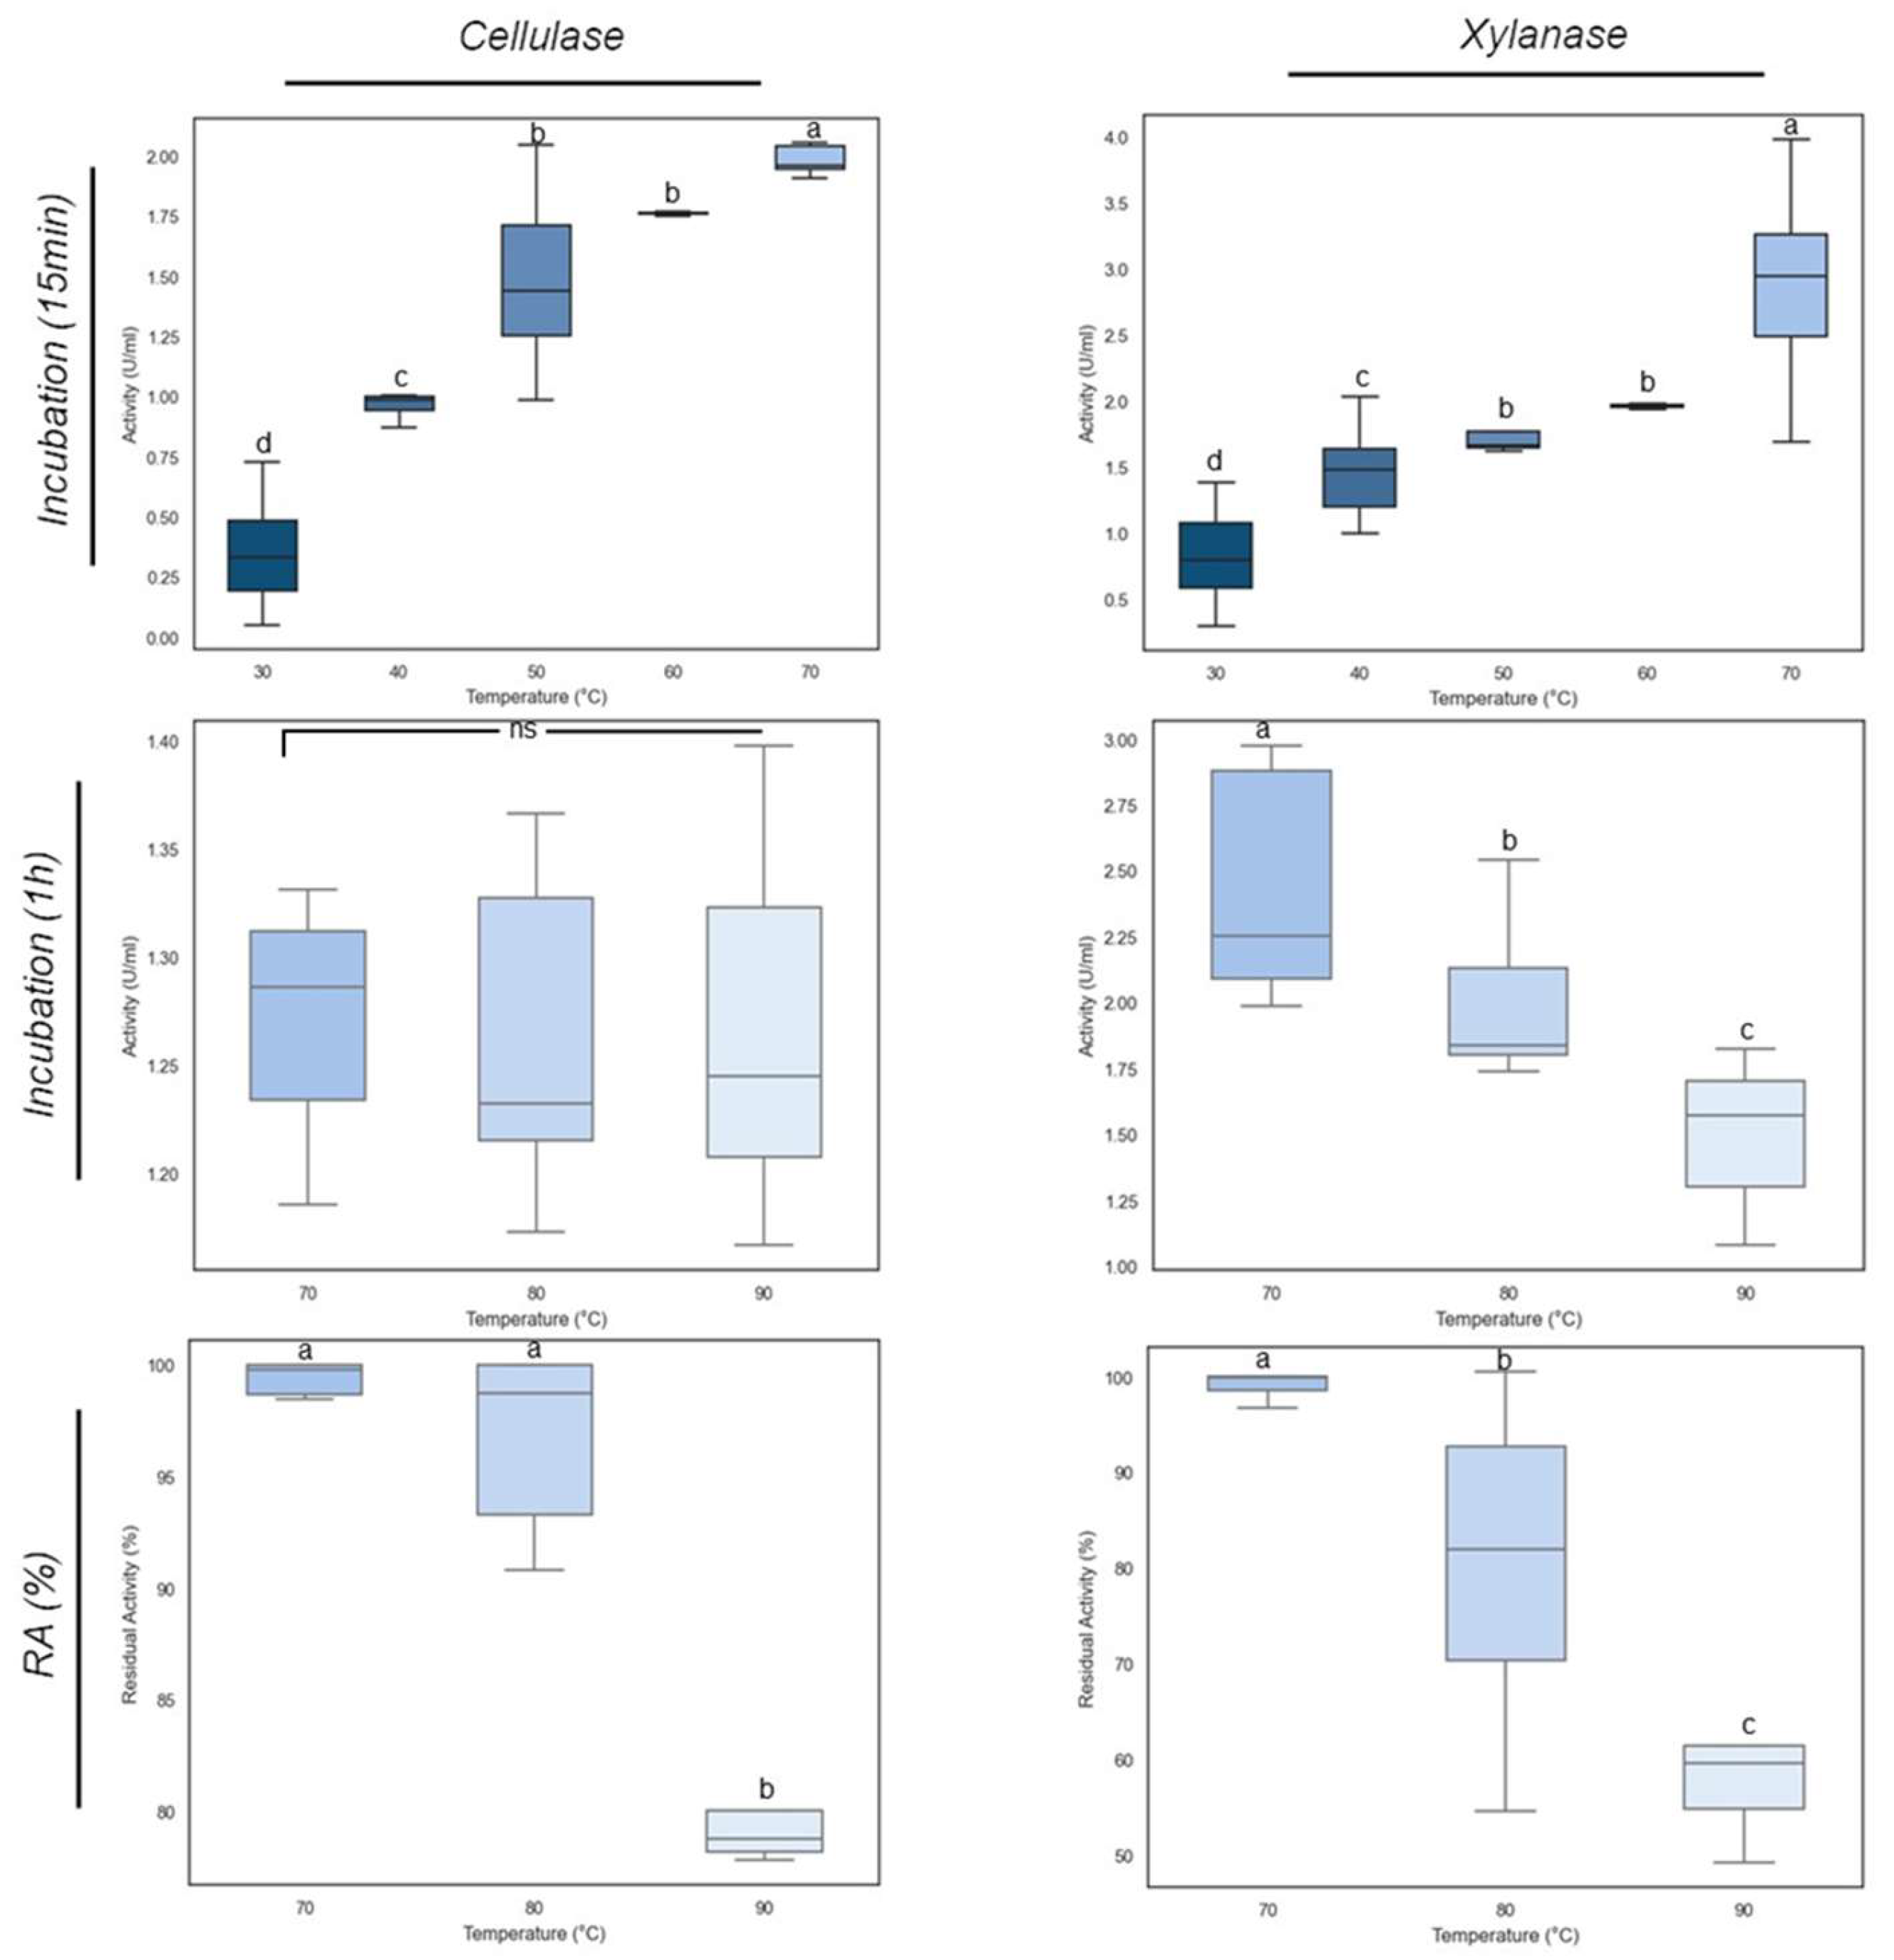
3.7. Effect of Temperature on Xylanase and Cellulase Activities
E_15.1 supernatants were incubated at different temperatures to assess the optimal temperature for xylanase and cellulase activities. The results depicted in
Figure 12 show that at 70 ºC the optimal temperature for both activities were achieved, with cellulase reaching 2.04 U/mL and xylanase reaching 2.86 U/mL (
Figure 12). The cellulase and xylanase activities of the E_15.1 strain at 70 °C were significantly (p<0.05) greater than those at other temperatures. A significant increase in activity was noticeable when the incubation temperature was shifted from 60 ºC to 70 °C clearly demonstrating that these enzymes from E_15.1 strain exhibit its optimal activity at 70 °C. When assessing the thermostability of these enzymes, it was observed that cellulase activity was lower than that of xylanase (Fig 12) at all temperatures tested but it was more stable, since little difference was observed in the activity even after incubation for one hour at 90 ºC (Fig 12), showing a slight decrease after one hour at 90 ºC (
Figure 12). Instead, xylanase activity decreased as the temperature increased, and it was significantly lower after incubation for one hour at 90°C compared to the other temperatures evaluated (
Figure 12). When assessing the residual activity of these enzymes, it was observed that after 1h of incubation at 90 °C, more than 50% of the xylanase activity was maintained (Fig 12), whereas the cellulase activity was maintained between 70 and 80% of (
Figure 12). These results confirm that the enzymes tested are robust proteins that could have biotechnological applications.
4. Discussion
The Chichonal volcano provides a unique habitat for isolating endophytic fungi from plants, characterized by extreme and fluctuating conditions such as high temperatures, heavy metal concentrations, and low pH values [
54]. These polyextremophilic conditions enable the adaptation of organisms with distinctive traits, making the volcano's crater an ideal site for bioprospecting. Such adapted fungi are valuable for discovering new bioactive compounds with potential applications in agriculture, medicine, and the food industry [
55]. Endophytic
Aspergillus species have been reported for their ability to enhance root and seed development, nutrient absorption, photosynthesis, plant growth, and chlorophyll content [
56].
Rapid biochemical tests, such as detecting clear zones around colonies on solid media, are commonly used to assess fungal capabilities [
48,
57]. This method effectively demonstrated the phosphate solubilization ability of strain E_15.1, underscoring its ecological role in its volcanic habitat. These findings are consistent with studies identifying
Aspergillus as a dominant phosphate-solubilizing genus in the rhizosphere, particularly
Aspergillus niger, known for its high solubilization capacity [
58]. The phosphorus-solubilizing capability of
Aspergillus is linked to its production of organic acids, which lower the pH and facilitate solubilization. Acidification occurs through several mechanisms: proton excretion via plasma membrane ATPases, proton exchange during nutrient uptake, organic acid production from metabolic processes, and carbon dioxide production during respiration. These organic acids act as chelating agents, making phosphorus available in the form of orthophosphate [
17,
59].
Metabolites produced by endophytic fungi plays a vital role in soil fertility. Gibberellins (GAs) and indole acetic acid (IAA) are two important growth regulating metabolites, produced commercially from fungi and used in the agriculture and horticulture industry [
51]. Earlier,
A. fumigatus was reported to promote plant growth and in vitro culture showed that it also secreted bioactive gibberellins [
60]. However,
A. fumigatus produces several toxins which prevent its use in commercial applications. The intensity of the fluorescence observed with E_15.1 strain corroborates its positive activity in gibberellin production, a trait directly related to various growth processes, including embryonic development and seed germination induction [
61]. The results obtained in the biochemical tests related to plant growth-promoting traits correlate with the results obtained in terms of tomato plant growth promotion in greenhouse conditions. This was reflected in the increased stem and root length, as well as the fresh and dry weight of both shoots and roots in plants inoculated with E_15.1 strain compared to the not inoculated control plants. This has been demonstrated by a wide range of growth-promoting microorganisms, primarily belonging to the
Aspergillus genera, in numerous plant species. For instance,
Pinus koraiensis plants inoculated with
A. niger, showed an increase in siderophore production compared to the untreated control [
62]. Similarly, peanut plants (
Arachis hypogaea) inoculated with
A. niger significantly increased soil phosphorus availability, resulting in an increase in dry matter (Malviya et al., 2011). However, it is important to stress that both
A. fumigatus and
A. niger can be plant pathogens and produce mycotoxins which are a danger to animal and human consumption, whereas
A. brasiliensis has never been reported as a dangerous organism.
Overall, the results obtained using molecular tools (
Figure 9,
Table 2 and
Table 3) and culture-based techniques (
Figure 11) were consistent. Using the PVK culture medium, the phosphate-solubilizing activity of E_15.1 strain was determined. Genomic analyses showed the presence of three genes involved in phosphate metabolism. These genes are implicated in the solubilization of inorganic phosphate by modulating its uptake and transport into the cell. It has been reported that passive diffusion of the compound can occur through hydrolysis by the
phoA gene, which was present in the genome of E_15.1 strain. Alkaline phosphatases (
phoA) are among the most common enzymes induced when there are low levels of inorganic phosphate [
63].
Through the CAS agar culture medium assay, siderophore production by E_15.1 strain was observed, supported by the result of the antiSMASH analysis, which identified a novel siderophore-producing gene cluster in region 345.3 with no matches to the closest-known cluster. Simultaneously, genomic information using the KofamKOALA database for annotation analysis determined that E_15.1 strain contained a gene associated with iron uptake (efeU), which is a high-affinity iron transporter.
Furthermore, the search for genes related to IAA production revealed the presence of
MAO and
aldH genes in E_15.1, both involved in the synthesis of this phytohormone. Multiple pathways for IAA synthesis in fungi have been described, most of which use tryptophan as a precursor. An alternative pathway that employs tryptamine as a precursor has been described by Duca and Glick (2020)[
64]. This pathway involving tryptamine recruits an amino oxidase enzyme (
MAO) to convert the primary substrate into indole acetaldehyde, subsequently obtaining IAA through the action of an aldehyde dehydrogenase (
aldH). Indole-3-acetic acid (IAA) has been reported to be produced by various endophytic fungi such as
A. fumigatus (EU823312),
Phoma glomerata (JX111911),
Paecilomyces sp. (EU823315),
Paecilomyces formosus (JQ013813), and
Penicillium sp. (JX111910) [
65]. So, E-15.1 seems to have both routes for IAA synthesis.
When the in vitro gibberellin production was assessed, E_15.1 strain exhibited fluorescence intensity, indicative of a positive result. In addition to manual gene search using the KofamKOALA tool, a gene involved in the biosynthesis of gibberellins of the AG3 type (GGPS1) was found. This gene belongs to the prenyltransferase family and encodes a protein with geranyl diphosphate (GGPP) synthase activity. The enzyme catalyzes the synthesis of GGPP from farnesyl diphosphate and isopentenyl diphosphate.
CAZymes are key enzymes for the breakdown and utilization of biopolymers such as cellulose, hemicellulose, pectin, and lignin by fungi allowing them to play a central role in carbon recycling in the biosphere. The fungal CAZome is also closely related to the host preference and adaptation to the fungal lifestyle such as being endophytic [
66]. Compared to other
Aspergillus species, E_15.1 strain displayed a wide diversity of CAZymes encoding genes, especially GH, CE, and CBM encoding genes, suggesting that E_15.1 strain may have greater environmental adaptability than other
Aspergillus species. The analysis of the diversity and abundance of CAZymes encoding genes in these fungi provides insight into how fungi adapt to extreme conditions, such as volcanic environments where nutrients are scarce and difficult to access. In relation to this, the largest number of orthologs related to the metabolism of sugars and sugar nucleotides was represented by K01183 (chitinase), followed by K00698 (chitin synthase) (
Figure 3), results that could be related to the degradation mainly of chitooligosaccharide type substrates of strain E_15.1, which corresponds to the fact that approximately one third of the predicted CAZy proteins were related to the degradation or chemical modification of chitooligosaccharides. These genes could also play an essential role in fungal cell wall metabolism.
The antiSMASH analyses detected gene clusters related to the biosynthesis of clavaric acid in E_15.1 strain, with 100% identity (
Table 2). Synteny analysis among the eleven strains belonging to the
Aspergillus genus compared in the present study revealed that only five strains presented biosynthetic clusters corresponding to this gene with more than 50 % identity (
Figure 8).
Although clavaric acid has primarily been associated with Basidiomycetes, its presence as a secondary triterpenoid metabolite has recently been described in
Aspergillus terreus B12 [
67], isolated from a South China sea sponge. The
occ gene (encoding the squalene oxide cyclase enzyme) has been reported as the first gene in fungi specifically involved in the cyclization of secondary metabolites with a triterpenoid structure, such as the antitumor compound produced by this fungus. One of the peculiarities of this finding is that it opens the door to finding similar occ-like genes in other fungi capable of producing compounds similar to those of the basidiomycete
Hypholoma sublateritium, where it was initially described by Li et al. (2018) [
68]. Clavaric acid has been of interest to researchers due to its antitumor properties, as it is a potent inhibitor of the RAS farnesyltransferase protein, which allows Ras proteins to attach to the cell membrane and send signals. Ras proteins are associated with uncontrolled cell proliferation in a quarter of human tumors, which may have practical relevance in the pharmaceutical industry due to its biological properties in the treatment of different types of cancer [
68]. Future studies on clavaric acid biosynthesis in E_15.1 strain through genetic manipulation may be useful for the development of antitumor medicine.
Aspergillus is probably the most known genus for its capacity to produce a broad range of enzymes related to the degradation of plant polysaccharides, such as cellulose, xylan, xyloglucan, and pectin [
66]. These enzymes are essential to convert the natural carbon sources of these fungi (mainly plant polymers) into small molecules that can be taken up into the cell and can be widely used in the industry [
66].
There have been many reports on thermophilic and mesophilic microorganisms that produce thermostable xylanases. Between genus
Aspergillus, it has been reported that
Aspergillus sydowii MG 49 produces two xylanases with optimal activity at 60°C and a stability in the range of 40–70°C declining sharply around 70°C [
69].
The NMDS analysis in E-15.1 revealed two distinct clusters among the different genomes clearly separated in a three-dimensional space (
Figure 10). In the first group, E_15.1 strain was observed close to the strains of
A. brasiliensis,
A. vadensis,
A. luchuensis, and
A. pseudoviridinutans. In a second group,
A. piperis,
A. tubingensis, and
A. carbonarius were grouped together. Independently and more distant, the strains
A. fumigatus,
A. viridinutans, and
A. aculeatus were observed. These results support the representation of the NMDS, which highlights the genome of
A. aculeatus as the most distinct species in terms of genomic functional annotations.
Author Contributions
“Conceptualization, RABG and JFM; methodology, JFM, AMR, JGSG, COA, YPLL and MLIA; software, AMR, JGSG, and MLIA.; validation, AMR, JFM, RABG, JGSG, AMFO, and MLIA.; formal analysis, AMR, JGSG, MLIA, AMFO, YPLL, JFM, and RABG.; investigation, AMR, and JFM.; resources, RABG, AMFO and MRSC.; data curation, AMR, JGSG, and MLIA.; writing—original draft preparation, AMR, JFM and RABG.; writing—review and editing, AMR, JFM, JGSG, MLIA, and RABG.; visualization, AMR, JGSG, MLIA, JFM and RABG.; supervision, JFM, JGSG and RABG.; project administration, AMFO MRSC and RABG.; funding acquisition, AMFO, RABG, and MRSC. All authors have read and agreed to the published version of the manuscript.”.
Figure 1.
Morphological characteristics and growth of the endophytic fungal E_15.1 strain isolated of a plant root tissue of Andropogon sp. of Chichonal Volcano, at different temperature conditions. A) Roots with mycelial growth at 3 days of cultivation (black arrows), B) Control (disinfection test root imprint showing no mycelial growth), C) Strain E_15.1, Panels D-F: left side top view, right sight back view.) D) Morphology on MEA medium, E) Morphology on CYA medium, F) Morphology on PDA medium, G-I-K) conidiophore 10, 40 and 100X respectively, H-J-L) septate hyphae 10, 40 and 100X respectively, M) Growth of strain E_15.1 on MEA solid medium at different incubation temperatures (28 and 40°C); N) Graph showing the mycelial growth (cm) in the time of strain E_15.1 incubated at different temperatures; O) Growth rate of strain E_15.1 in liquid medium incubated at different temperatures. This assay was performed in triplicate and statistical significance was assessed using a Tukey test (*p≤0.05, ** p˂0.01, statistical significance indicated by asterisks).
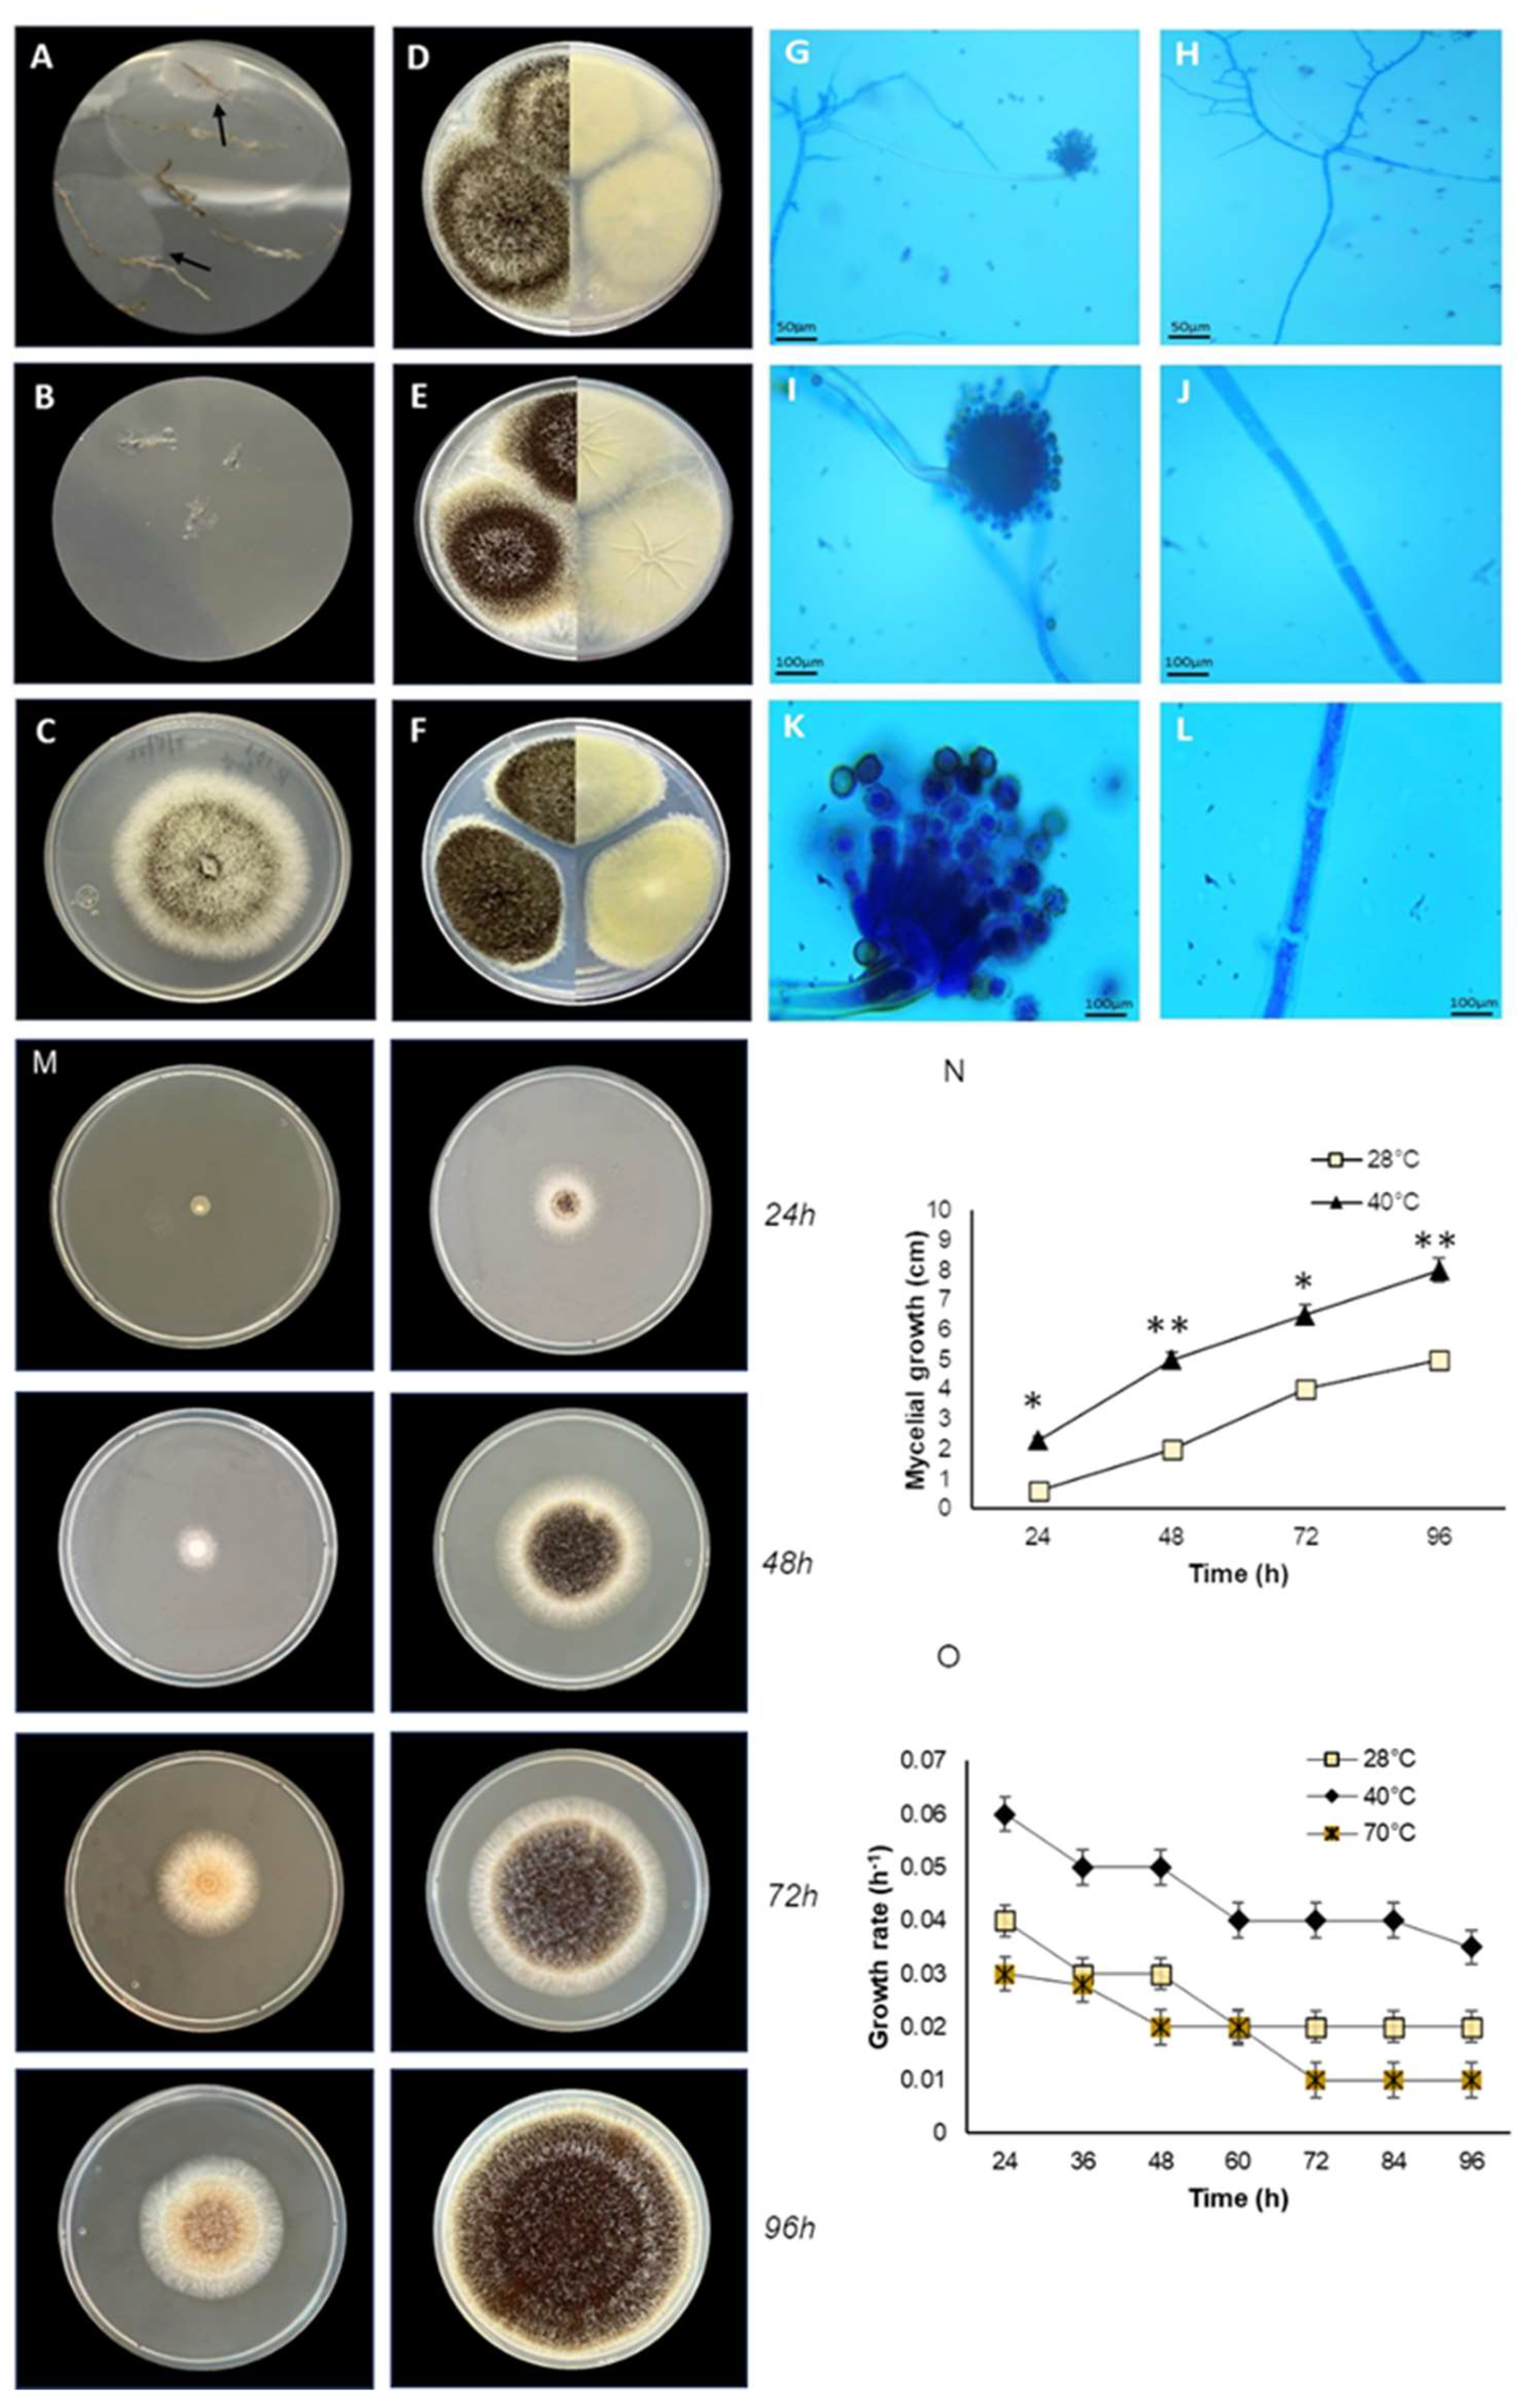
Figure 2.
Annotation and functional classification of E_15.1 strain. A) Gene Ontology (GO) classification, B) Histogram of Cluster of Orthologs Groups (COG).
Figure 2.
Annotation and functional classification of E_15.1 strain. A) Gene Ontology (GO) classification, B) Histogram of Cluster of Orthologs Groups (COG).
Figure 3.
Functional annotation by KEGG of the proteins predicted by AUGUSTUS from the fungal genome E_15.1 and 10 strains belonging to the Aspergillus genus. A) Main pathways of secondary metabolism, xenobiotic degradation, lipid and carbohydrate metabolism. B) Orthologs related to amino sugars metabolism.
Figure 4.
Functional annotation of carbohydrate-active enzymes (CAZymes) encoded by the E_15.1 genome in comparison to CAZymes identified in the genomes of selected fungi. A) Number of genes per CAZy family related to plant biomass degradation. B) Abundance of coding sequences for CAZymes targeting different substrates (PS) in related fungal genomes. Enzyme families are represented by their classes (GH: glycoside hydrolases, GT: glycosyltransferases, PL: polysaccharide lyases, CE: carbohydrate esterase, and CBM: chitin-binding modules), and the family numbers are based on HMM predictions from the carbohydrate-active enzyme database. The bars of different colors, represent the different substrates (PS) on which the different classes of CAZymes act. The abundance levels of different enzymes within a family are depicted using a color scale, from the lowest (yellow) to the highest occurrences (dark blue) per species.
Figure 5.
Phylogenomic analysis of the Aspergillus genus based on mutational distances using the JolyTree Program (v.1.1b.191021ac) with RefSeq category genomes. The orange color bars show that species delimitation tests in both algorithms (bPTP and mPTP) restrict strain E_15.1 to a coalescence rate with all A. brasiliensis species.
Figure 6.
Phylogenetic orthology with the OrthoFinder Program (v2.5.4). The orange color bars show that species delimitation tests in both algorithms (bPTP and mPTP) restrict strain E_15.1 to a coalescence rate with all A. brasiliensis species.
Figure 6.
Phylogenetic orthology with the OrthoFinder Program (v2.5.4). The orange color bars show that species delimitation tests in both algorithms (bPTP and mPTP) restrict strain E_15.1 to a coalescence rate with all A. brasiliensis species.
Figure 7.
Phylogenetic analysis using UFCG (Universal Fungi Core Genes) Program (v1.0.3). The orange color bars show that species delimitation tests in both algorithms (bPTP and mPTP) restrict strain E_15.1 to a coalescence rate with all A. brasiliensis species.
Figure 7.
Phylogenetic analysis using UFCG (Universal Fungi Core Genes) Program (v1.0.3). The orange color bars show that species delimitation tests in both algorithms (bPTP and mPTP) restrict strain E_15.1 to a coalescence rate with all A. brasiliensis species.
Figure 8.
Synteny analysis of clavaric acid biosynthetic gene clusters identified in different Aspergillus species. A) Representation of the best link (highest protein sequence similarity) for each gene; B) Cyclization reaction of the terpene 2, 3, 22, 23 dioxidosqualene by the action of the enzyme SqhC (squalene cyclase) to obtain clavarinone, a direct precursor of clavaric acid. STKc: Serine/threonine protein kinase; NTF2: Nuclear transport factor 2; Sec14p: phosphatidylinositol transfer protein; IPP-2: protein phosphatase 2 (phosphoprotein) inhibitor; Sir2: NAD-dependent protein deacetylase.
Figure 9.
Different copies of genes involved in specific metabolic pathways associated with plant growth-promoting, xenobiotics biodegradation and metabolism, and abiotic stress response traits found in the genome of E_15.1 strain and ten strains of the genus Aspergillus compared through KEEG orthology and KofamKOALa databases. The numerical scale indicates the number of copies in the genome.
Figure 10.
Non-metric multi-dimensional scaling (NMDS) clustering based on Euclidean distance of eleven Aspergillus genomes based on similarity of functional groups according to Pfam, COG, KEGG, CAZy, and antiSMASH annotations.
Figure 10.
Non-metric multi-dimensional scaling (NMDS) clustering based on Euclidean distance of eleven Aspergillus genomes based on similarity of functional groups according to Pfam, COG, KEGG, CAZy, and antiSMASH annotations.
Figure 11.
In vitro assays showing PGP and hydrolytic activity traits of Aspergillus brasiliensis strain E_15.1. (A) Phosphate solubilization test in PVK medium; (B) Production of siderophores; (C) Gibberellin production, C (-) indicates the negative control using non-inoculated medium; C (+) indicates the positive control using 2 µg/ml AG3; (D) Chitinase activity; (E) Cellulase activity; (F) Xylanase activity, (G) IAA production, right visual test color with different trp concentrations, left amount of IAA according to the calculations using the standard curve; (H) Effect of inoculation of A. brasiliensis E_15.1 on Saladette variety tomato plants. Plants inoculated with 1 mL of sterile water were used as negative controls (black bars); for comparison, 1 x 10⁶ spores/ml of Trichoderma atroviridae were inoculated to the plants (dark gray bars); finally, 1 x 10⁶ spores/ml of E_15.1 inoculated plants (light gray bars), were assessed for growth promotion traits. The following metrics were recorded after 90 days: total fresh weight (FW), total dry mass (DW), root length (RL) and shoot height (SH). This assay was performed in triplicate and statistical significance was assessed using a Tukey test (*p≤0.05, ** p˂0.01, statistical significance indicated by asterisks). Ns: non-significant. Scale bars=1cm.
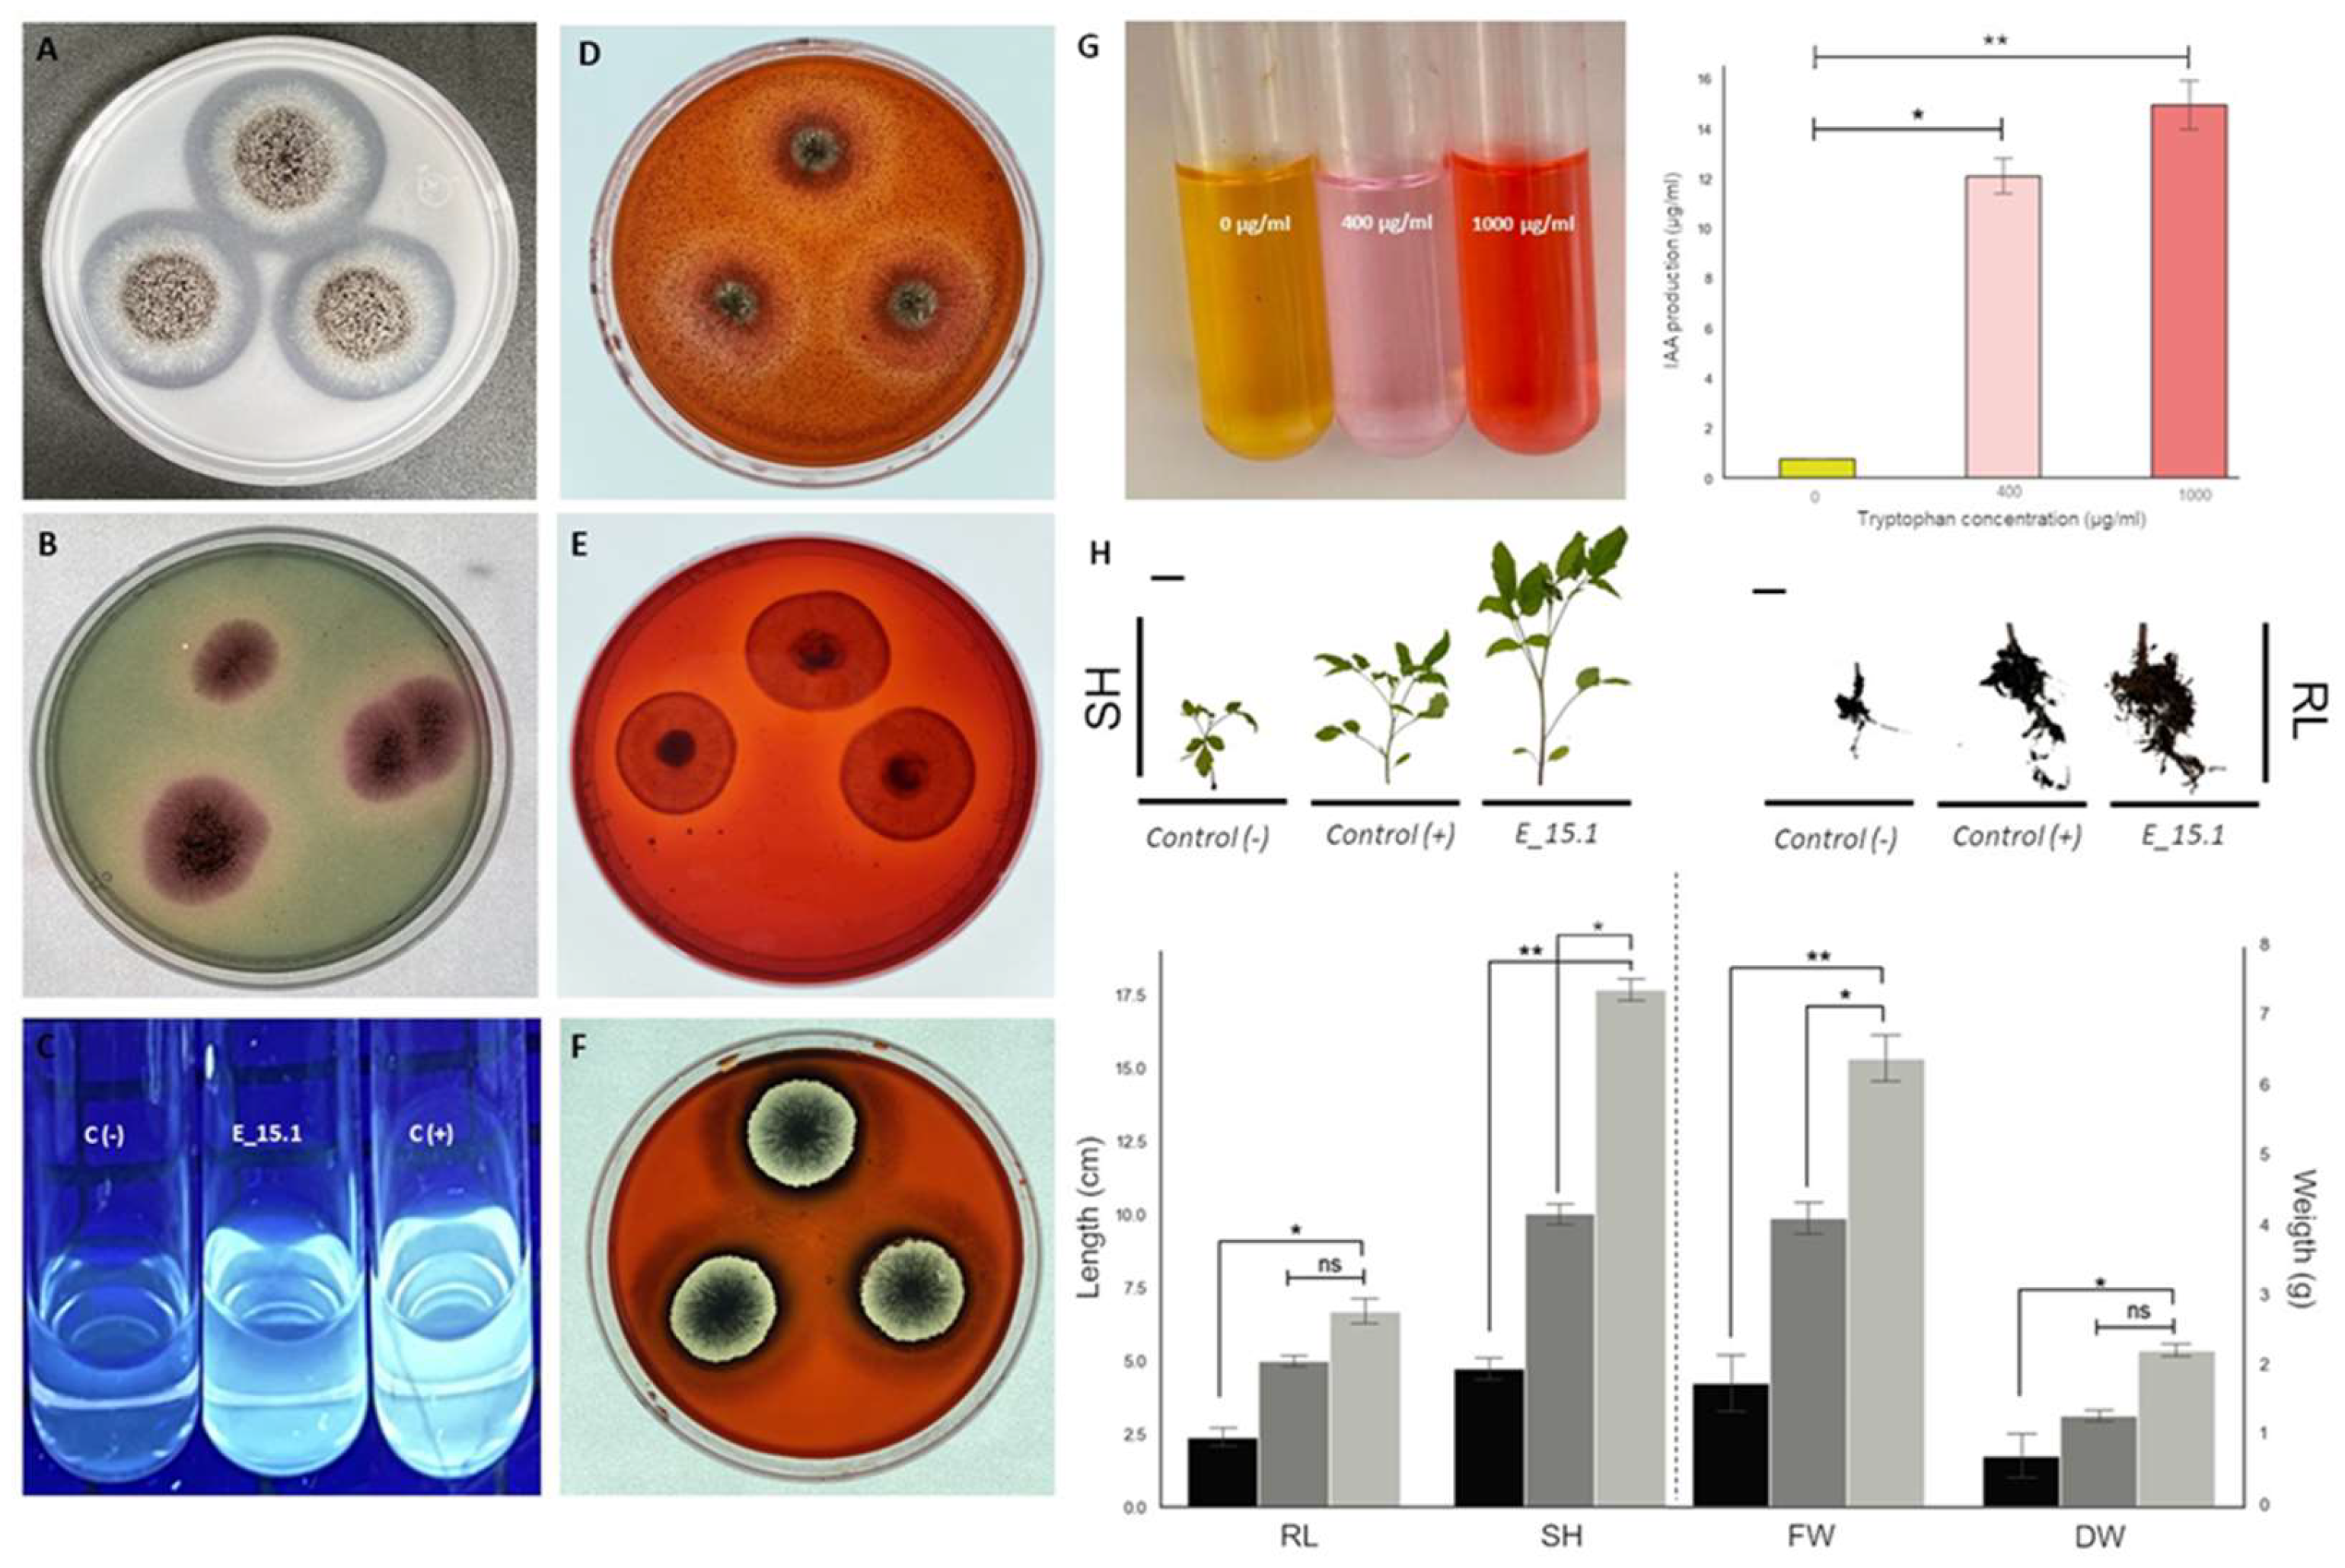
Figure 12.
Effect of temperature on xylanase and cellulase activities of E_15.1 strain. The bars represent the mean and standard deviation. Different letters indicate significant differences determined by one-way ANOVA and Tukey's multiple mean comparison when p ≤ 0.05. Ns: non-significant.
Figure 12.
Effect of temperature on xylanase and cellulase activities of E_15.1 strain. The bars represent the mean and standard deviation. Different letters indicate significant differences determined by one-way ANOVA and Tukey's multiple mean comparison when p ≤ 0.05. Ns: non-significant.
Table 1.
Summary of several main features for E_15.1 strain compared to ten sequenced Aspergillus genomes.
Table 1.
Summary of several main features for E_15.1 strain compared to ten sequenced Aspergillus genomes.
| Species |
Strain |
Accession
Number |
Genome size
(Mb) |
Content
G + C
(%) |
Predicted proteins |
|
| A. brasiliensis |
CBS 101740 |
GCA_001889945.1 |
35.8 |
50.25 |
10,120 |
| A. brasiliensis |
E_15.1 |
JBBEEP010000000 |
36.9 |
49.4 |
10,992 |
| A. piperis |
CBS 112811 |
GCA_003184755.1 |
35.2 |
48.99 |
9702 |
| A. viridinutans |
IFM 47045 |
GCA_018404265.1 |
34.9 |
45.41 |
9314 |
| A. luchuensis |
IFO 4308 |
GCA_016861625.1 |
37.2 |
48.82 |
9954 |
| A. carbonarius |
ITEM 5010 |
GCA_001990825.1 |
36.1 |
48.82 |
10,071 |
| A. aculeatus |
ATCC 16872 |
GCA_001890905.1 |
35.4 |
50.52 |
10,196 |
| A. pseudoviridinutans |
IFM 55266 |
GCA_018340605.1 |
33.3 |
49.33 |
10,005 |
| A. tubingensis |
WU 2223-L |
GCA_013340325.1 |
35.0 |
49.32 |
9667 |
| A. vadensis |
CBS 113365 |
GCA_003184925.1 |
35.6 |
49.18 |
9642 |
| A. fumigatus |
AF 293 |
GCA_000002655.1 |
29.3 |
48.82 |
8681 |
Table 2.
Secondary metabolites gene sequences identified in E_15.1 strain.
Table 2.
Secondary metabolites gene sequences identified in E_15.1 strain.
| Region |
Type |
From |
To |
Most Similar Know Cluster |
Similarity |
| 26.1 |
T1PKS |
1 |
52,794 |
3'-methoxy-1,2-dehydropenicillide |
26% |
| 489.1 |
terpene |
55,448 |
86,734 |
|
- |
| 332.1 |
terpene |
65,589 |
97,901 |
oryzine A |
12% |
| 216.1 |
terpene |
1 |
19,615 |
clavaric acid |
100% |
| 405.1 |
indole |
1,540 |
32,820 |
|
- |
| 345.3 |
NI-siderophore |
627,350 |
645,079 |
|
- |
| 418.1 |
NRPS |
1 |
61,789 |
|
- |
| 278.1 |
Hybrid NRPS-PKS |
13,579 |
156,906 |
microperfuranone |
66% |
| 345.1 |
Hybrid NRPS-PKS |
128,207 |
200,446 |
terrestric acid |
62% |
| 377.1 |
T1PKS |
17,129 |
82,533 |
yanuthone D |
70% |
| 389.1 |
Hybrid NRPS-PKS |
7,514 |
142,103 |
aspergillicin A |
66% |
| 487.2 |
Fungal-RiPP-like |
138,687 |
229,455 |
terreazepine |
7% |
| 52.1 |
NRPS-like |
72,815 |
136,204 |
notoamide A |
11% |
| 158.2 |
NRPS |
262,537 |
331,184 |
azanigerone A |
13% |
Table 3.
Strain E_15.1 genes associated with plant growth-promoting, xenobiotics biodegradation and metabolism, and abiotic stress response traits discussed in this study.
Table 3.
Strain E_15.1 genes associated with plant growth-promoting, xenobiotics biodegradation and metabolism, and abiotic stress response traits discussed in this study.
| Associated function |
Annotation Entry (KO) |
Annotation Pfam |
Gene |
Product Name |
Phosphate uptake |
K01077 |
PF00245 |
phoA |
alkaline phosphatase |
| K15633 |
PF00245 |
gpmI |
2,3-bisphosphoglycerate-independent phosphoglycerate mutase |
| K14640 |
PF01384 |
PIT |
solute carrier family 20 (sodium-dependent phosphate transporter) |
IAA |
K00128 |
PF00171 |
aldH |
Aldehyde dehydrogenase family |
| K00274 |
PF00743 |
MAO |
monoamine oxidase |
| K01667 |
PF00155 |
tnaA |
tryptophanase |
|
| K18386 |
PF01593 |
PAXM |
FAD dependent monooxygenase |
|
| Xenobiotics biodegradation and metabolism |
K10215 |
PF00743
|
ethA |
monooxygenase |
| Cytochrome P450 |
K07824 |
PF00067 |
CYP53A1 |
benzoate 4-monooxygenase |
Abiotic stress response |
K03283 |
PF00012 |
HSPA1_6_8 |
heat shock 70kDa protein 1/6/8 |
| K04078 |
PF00166 |
groES |
chaperonin GroES |
| K04079 |
PF00183 |
htpG |
molecular chaperone HtpG |
| Iron uptake |
K07243 |
PF03239 |
efeU |
high-affinity iron transporter |
Siderophore |
K10531 |
PF13434 |
pvdA |
L-ornithine N5-monooxygenase |
| K00818 |
PF00155 |
argD |
acetylornithine aminotransferase |
| Biosynthesis of gibberellins (GAs) |
K00804 |
PF03936 |
GGPS1 |
geranylgeranyl diphosphate synthase, type III |

