Submitted:
12 June 2024
Posted:
13 June 2024
You are already at the latest version
Abstract

Keywords:
1. Introduction
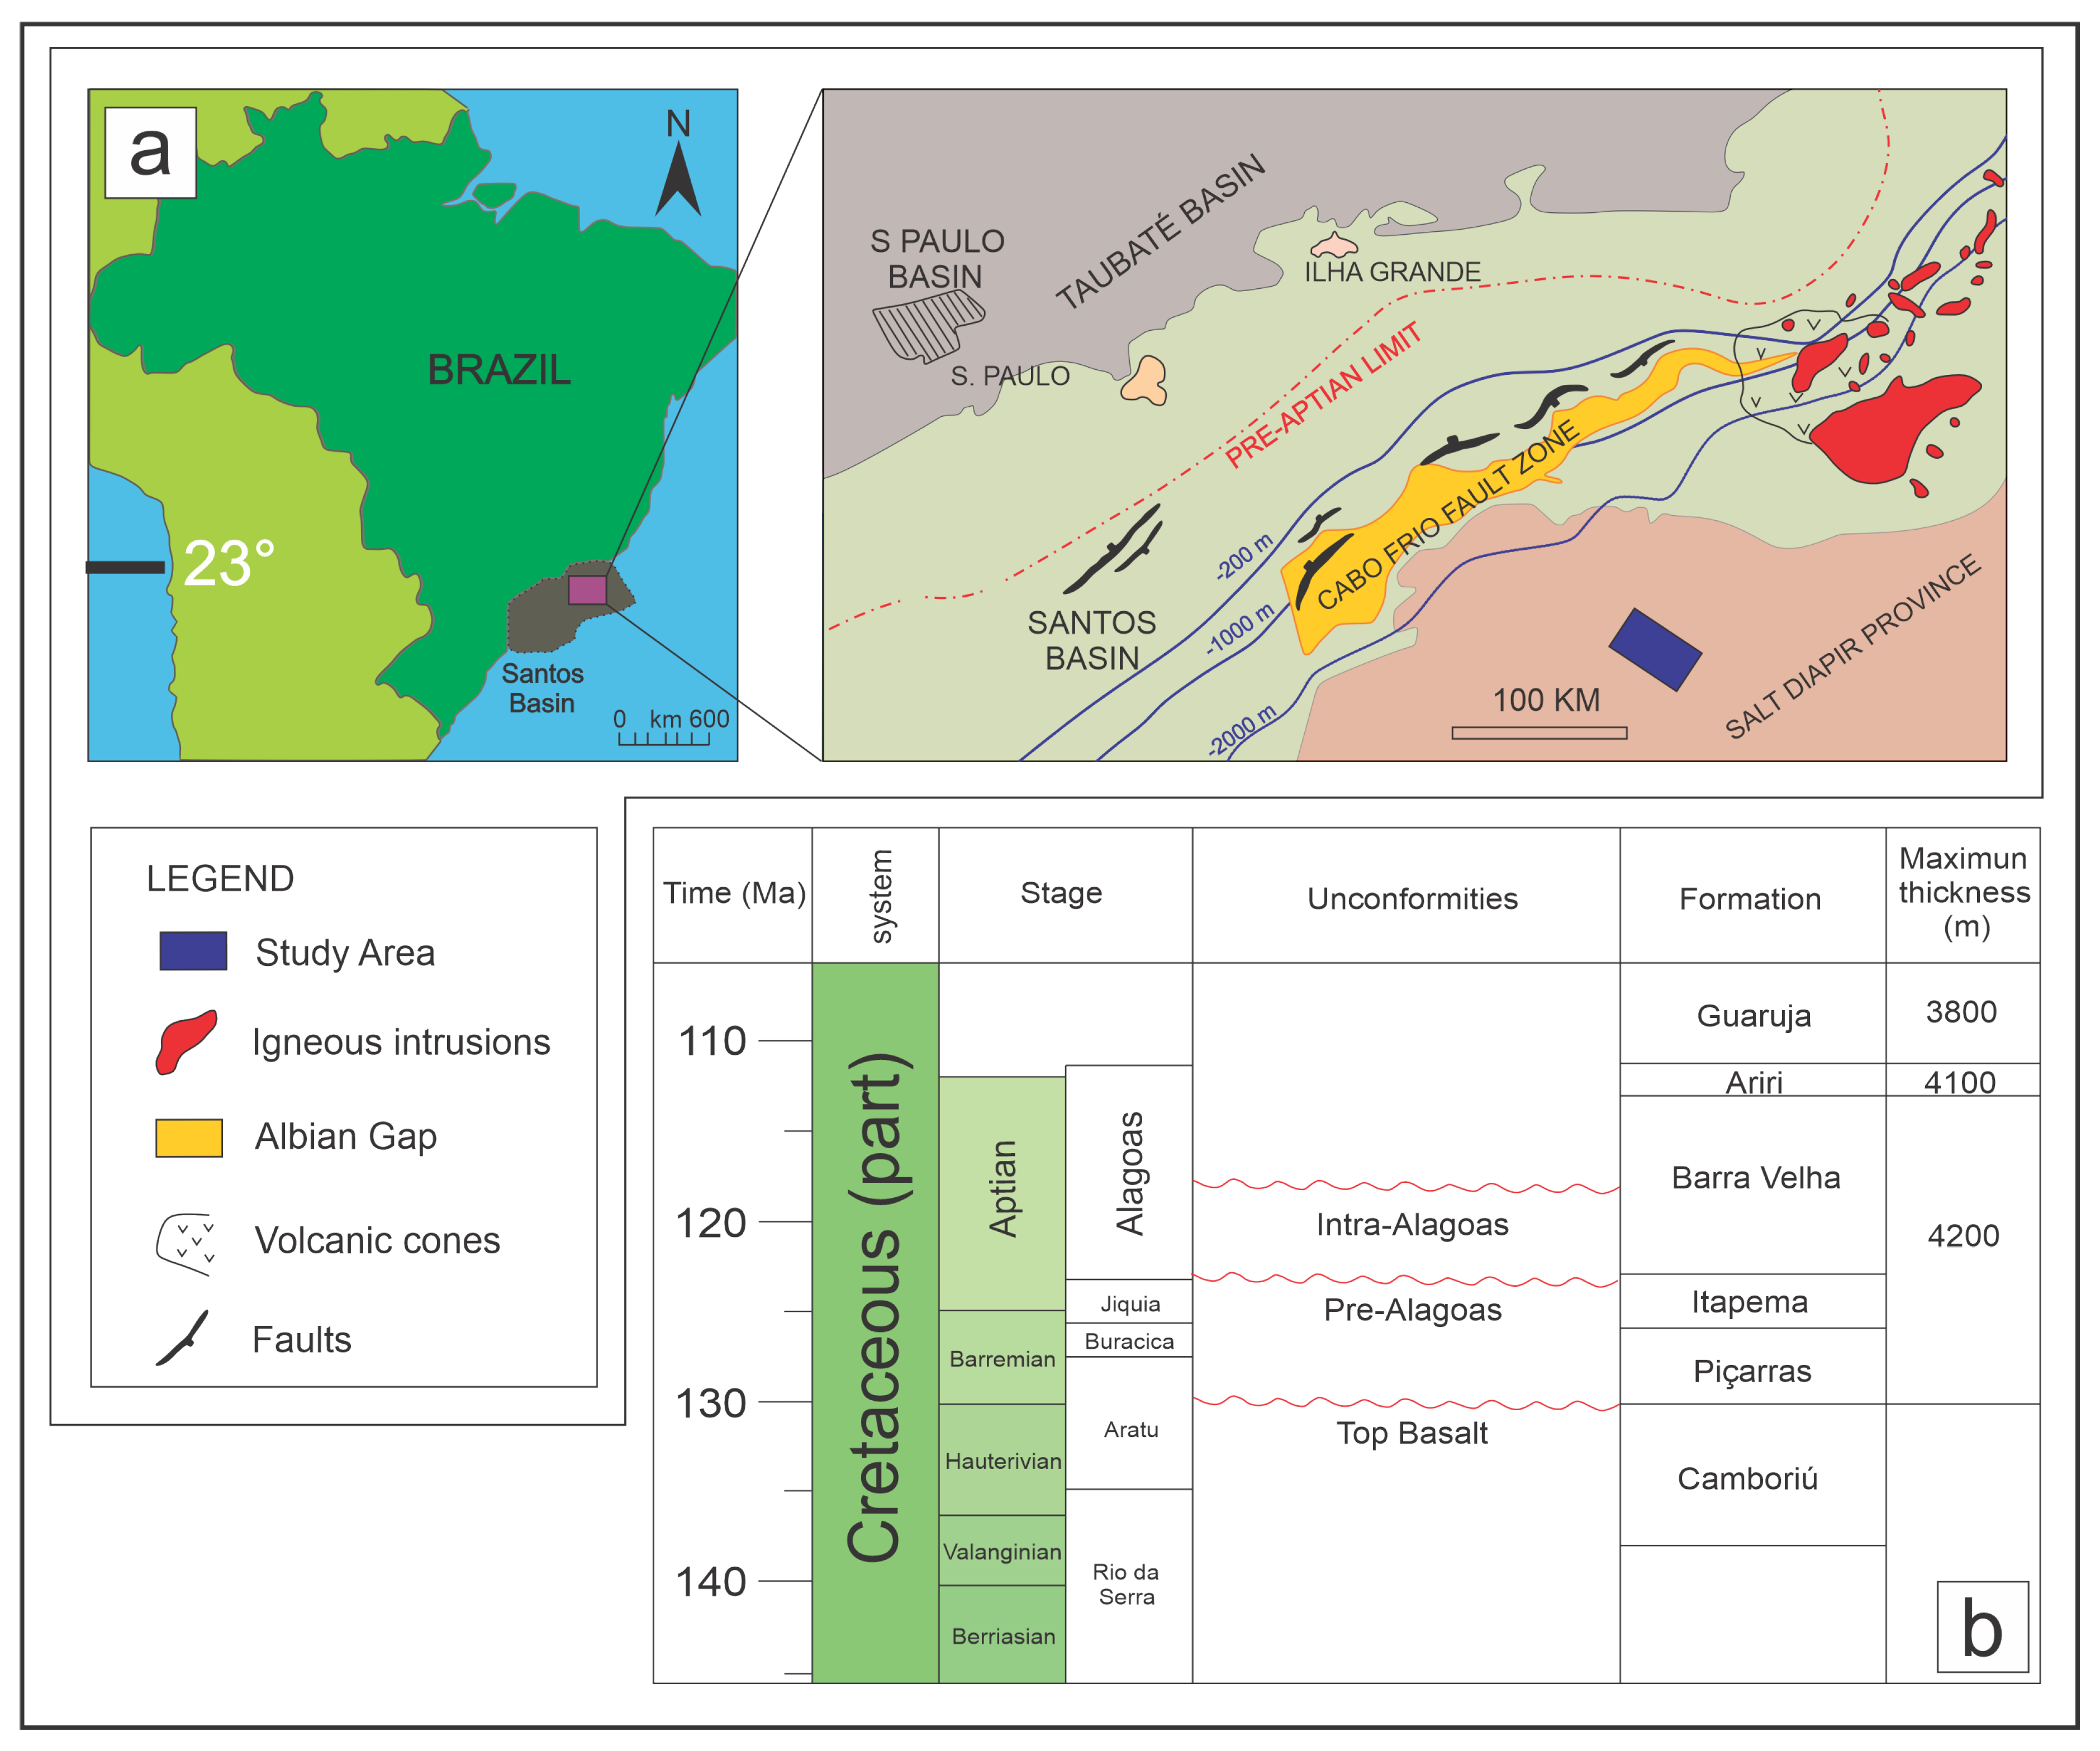
2. Geological Settings
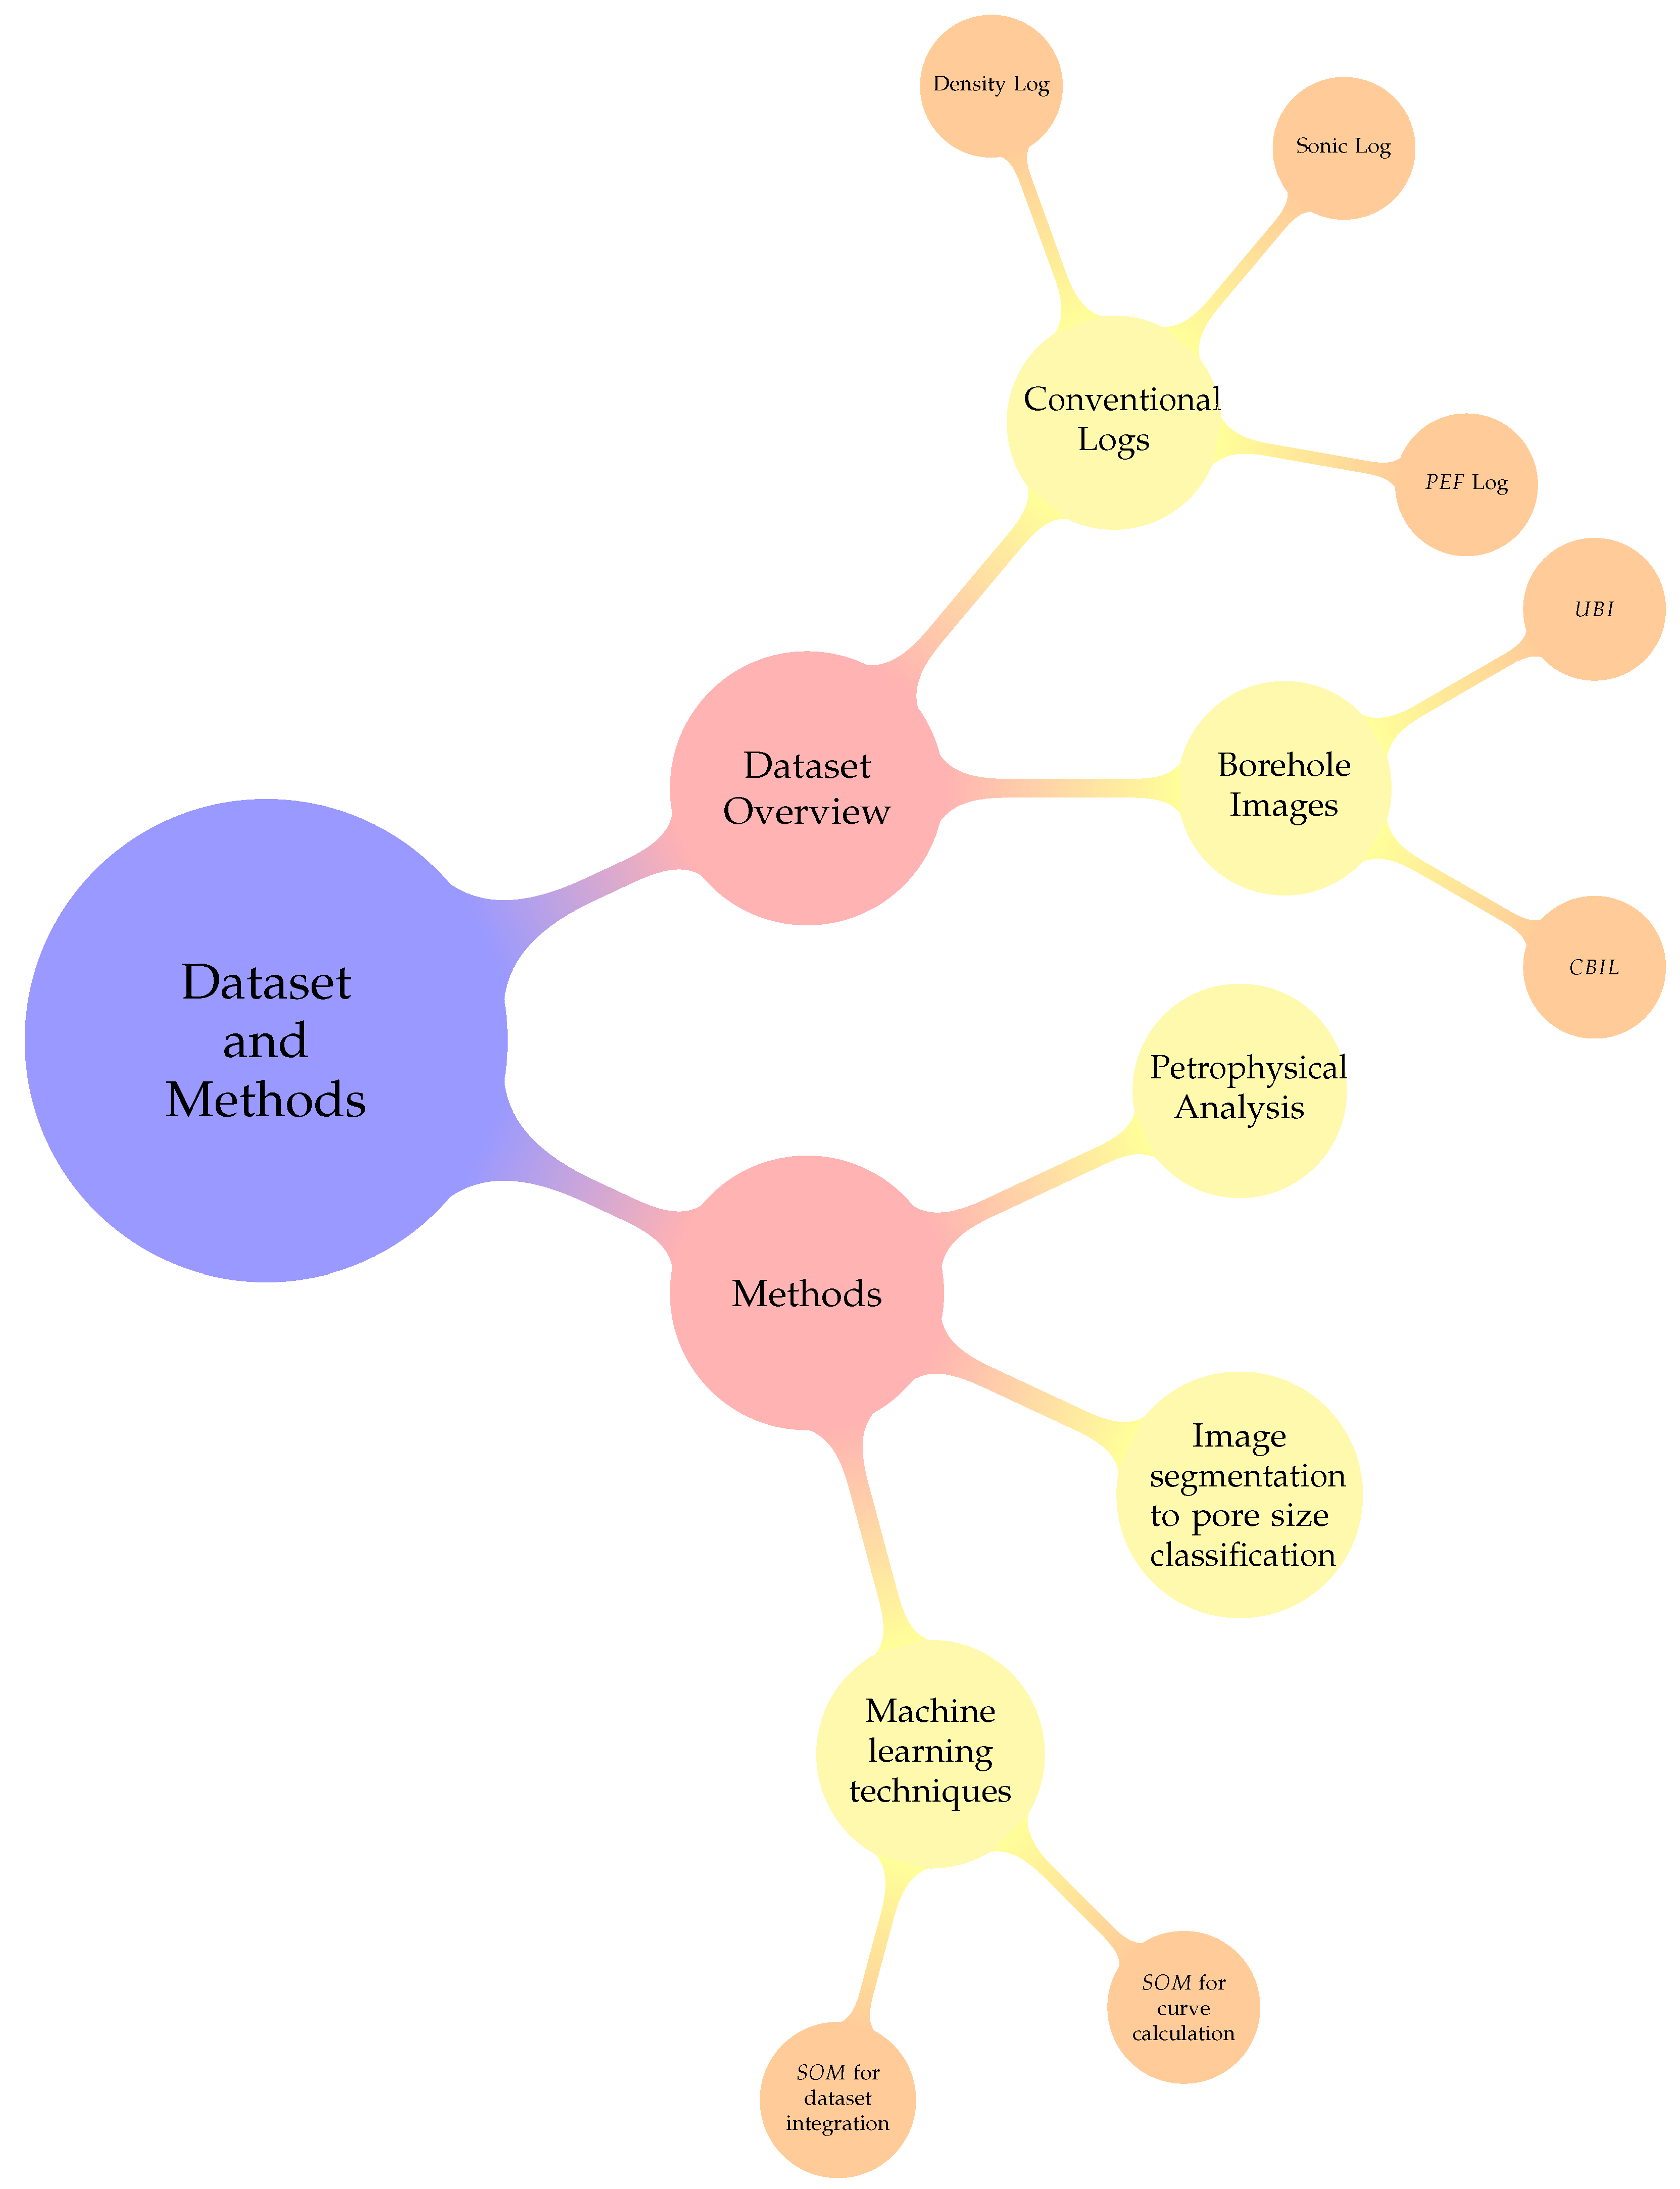
3. Materials and Methods
3.1. Dataset Overview
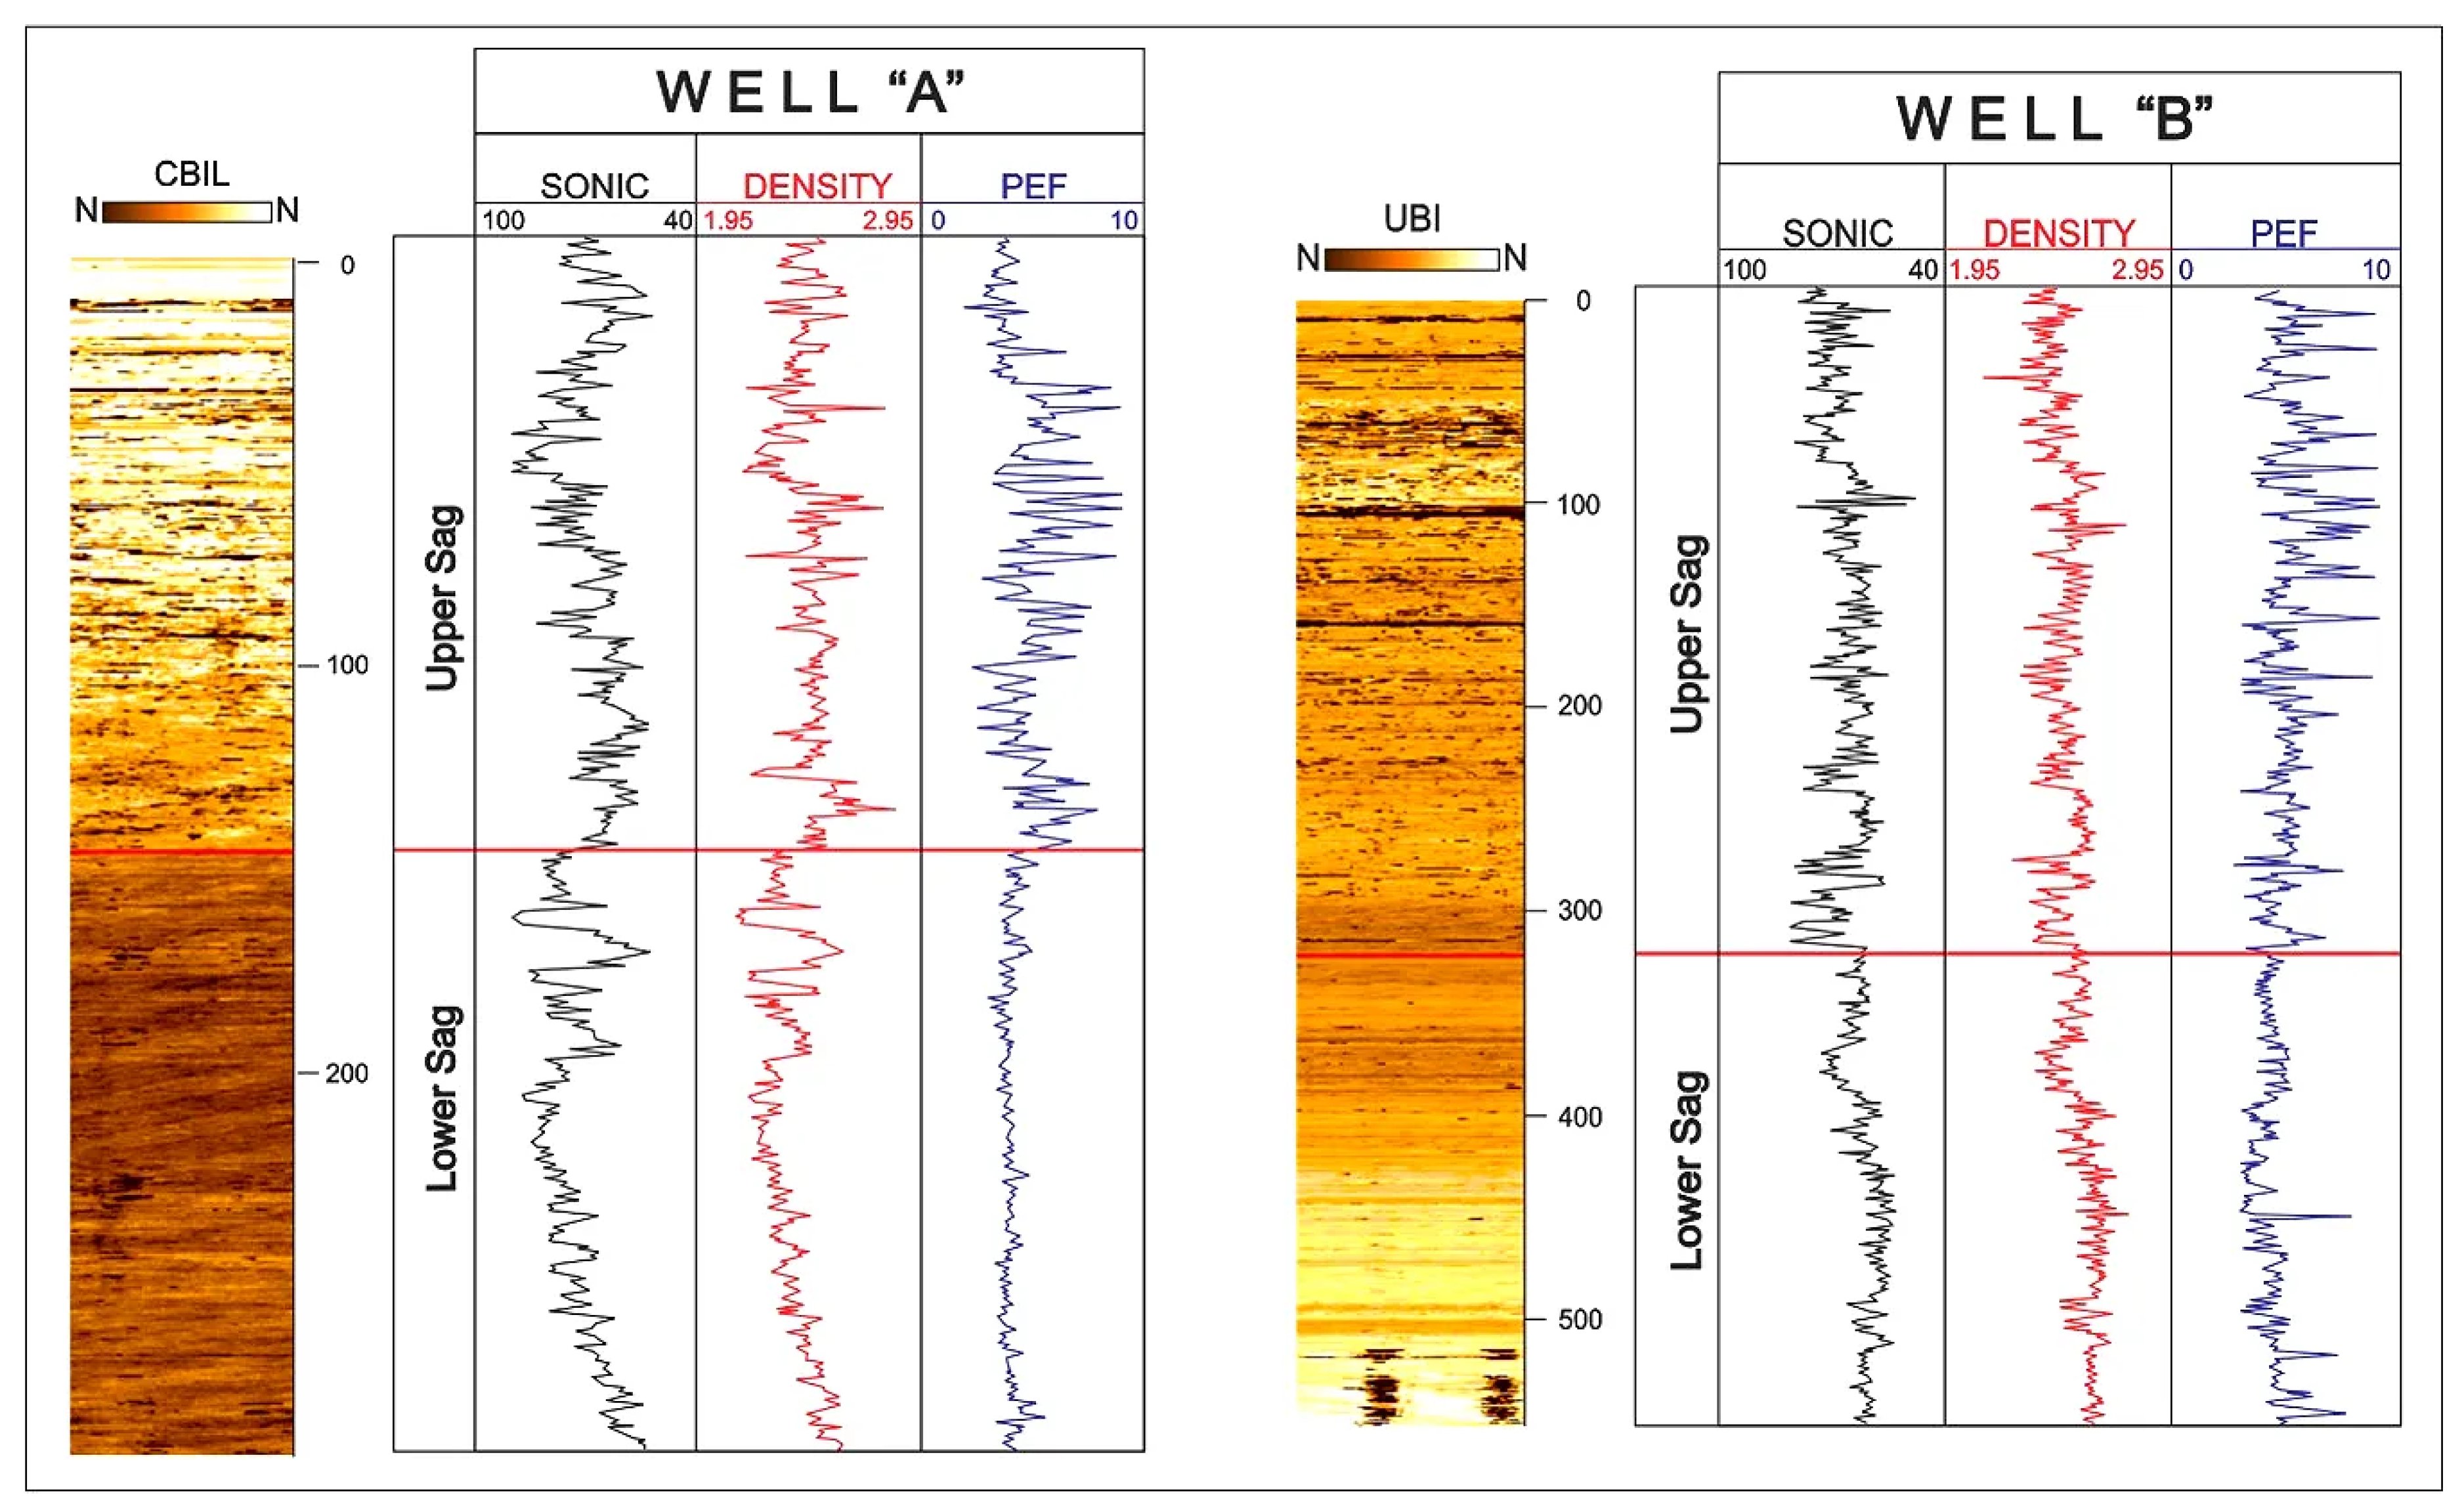
3.1.1. Conventional Logs
Density Log
Sonic Log
Photoelectric Factor Log
3.1.2. Borehole Images ()
Ultrasonic Borehole Imager ()
Circumferential Borehole Imaging Log ()
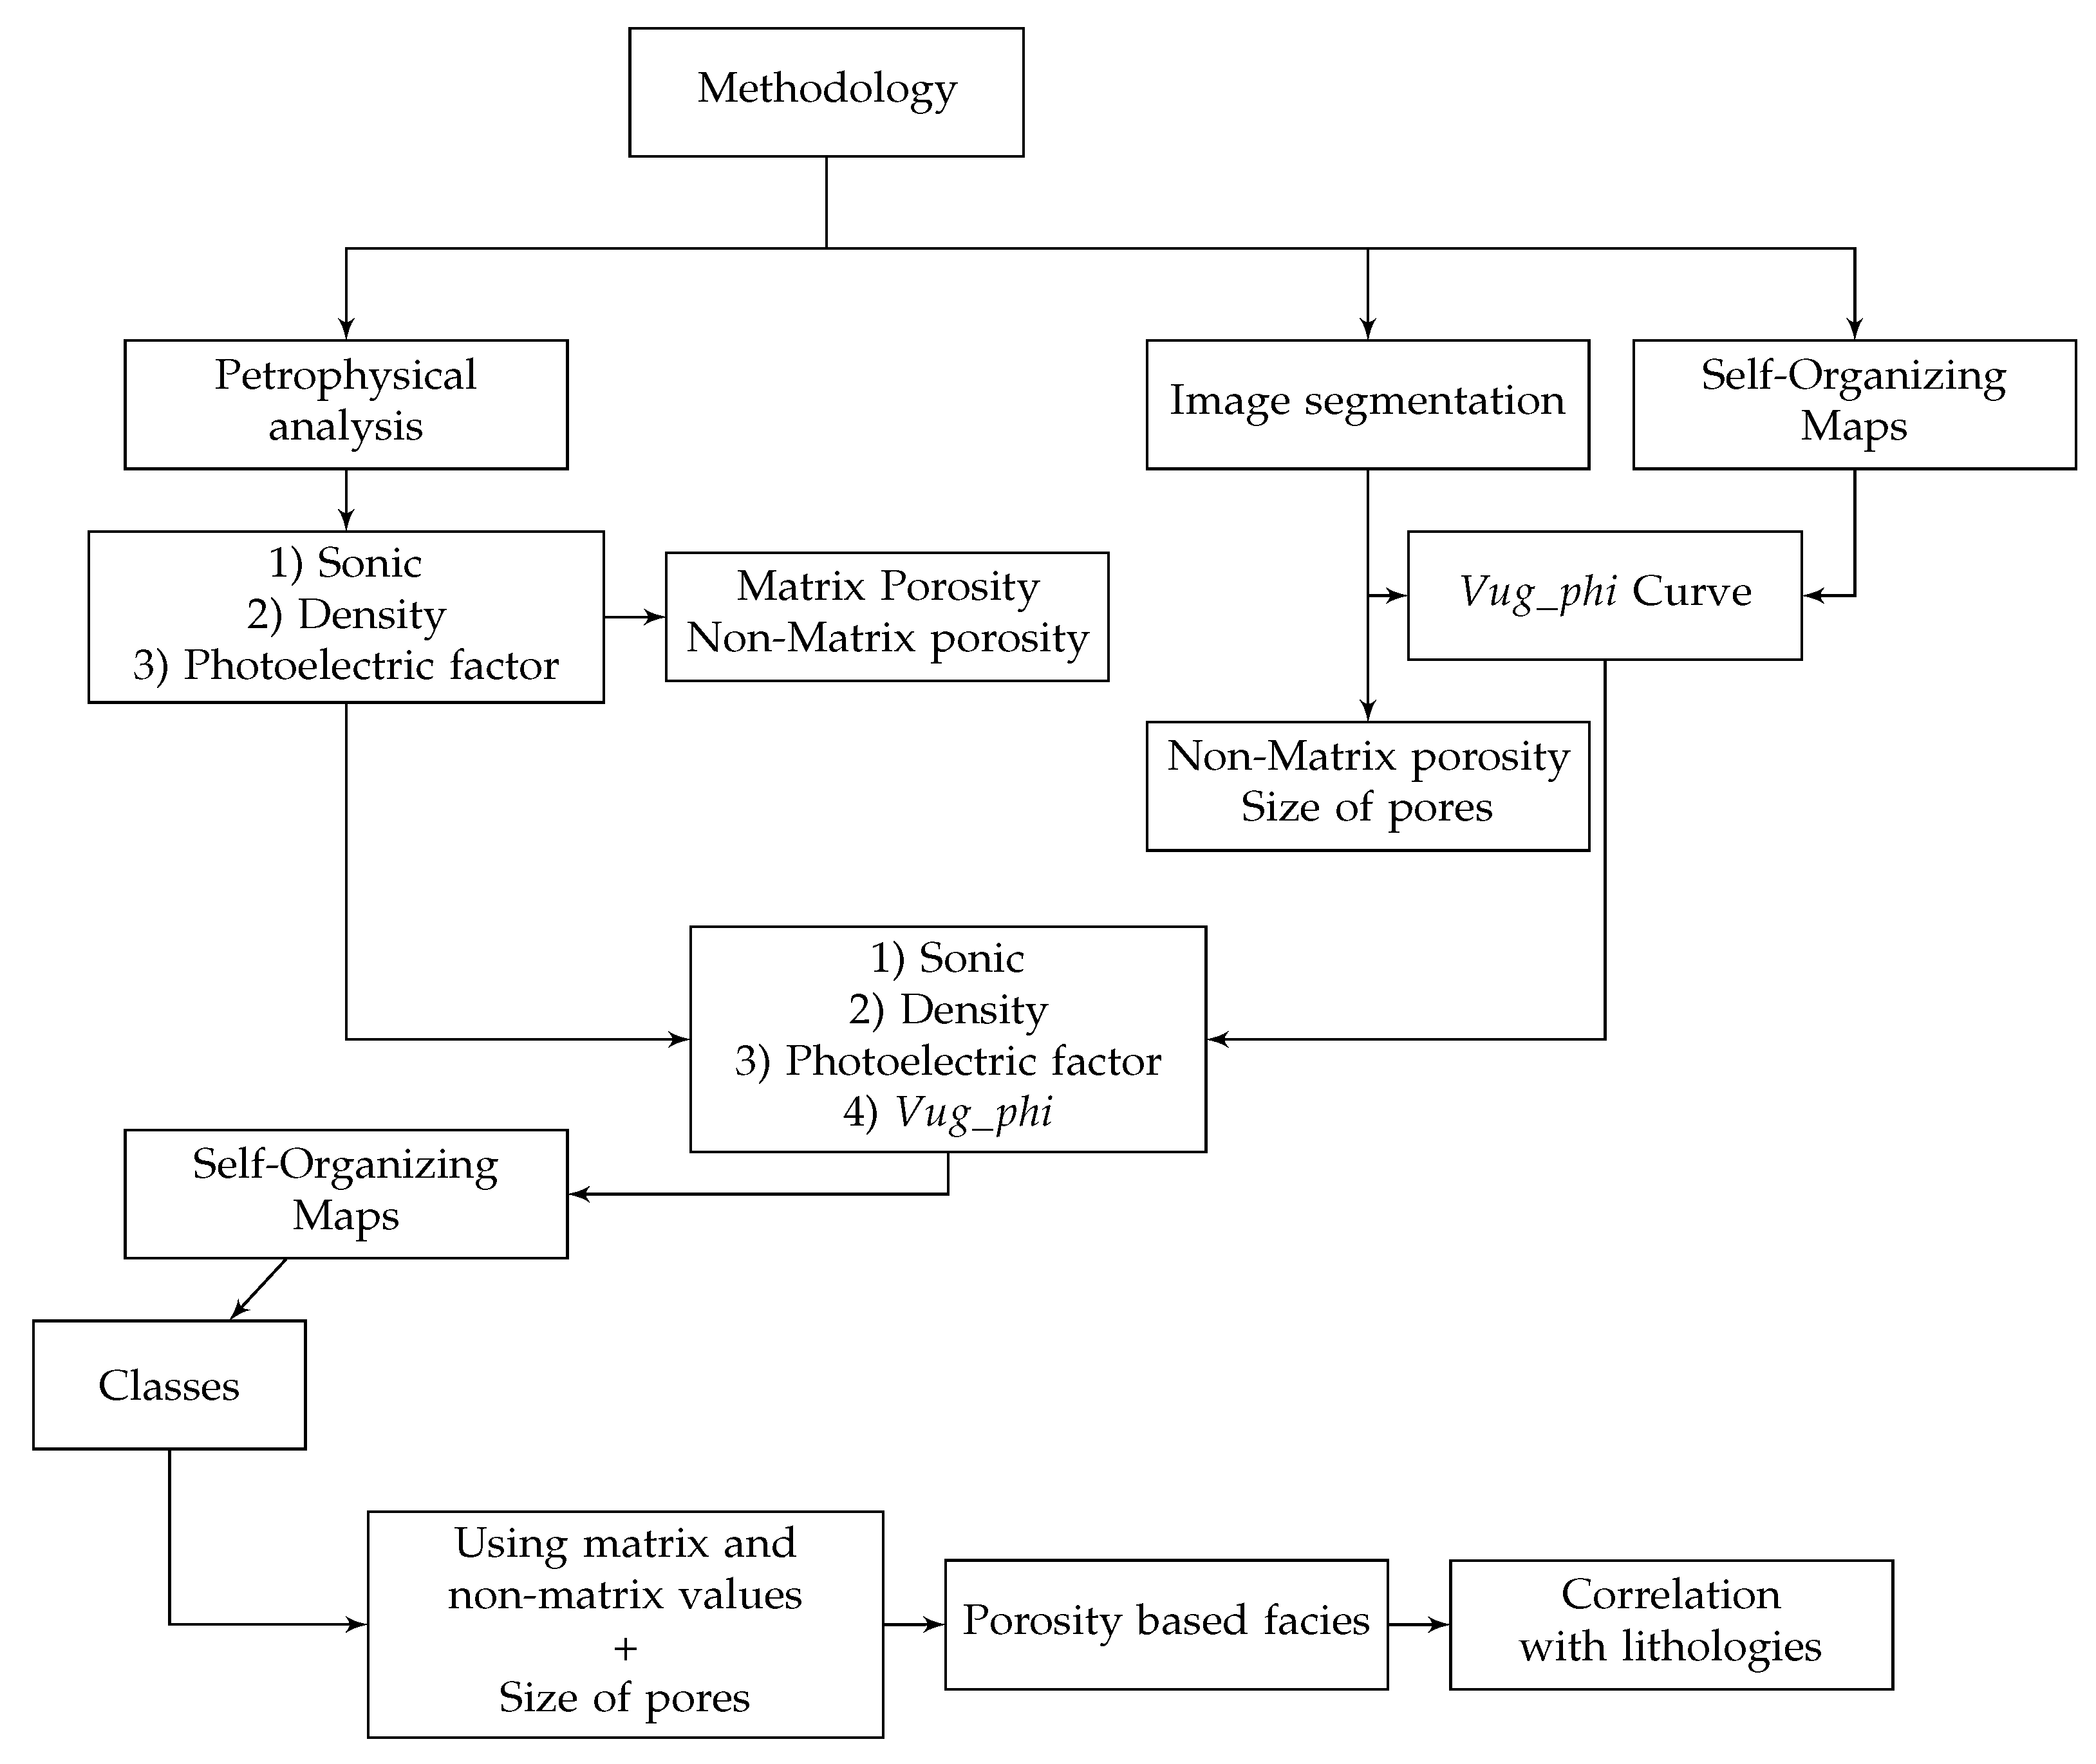
3.2. Methodology
3.2.1. Petrophysical Analysis
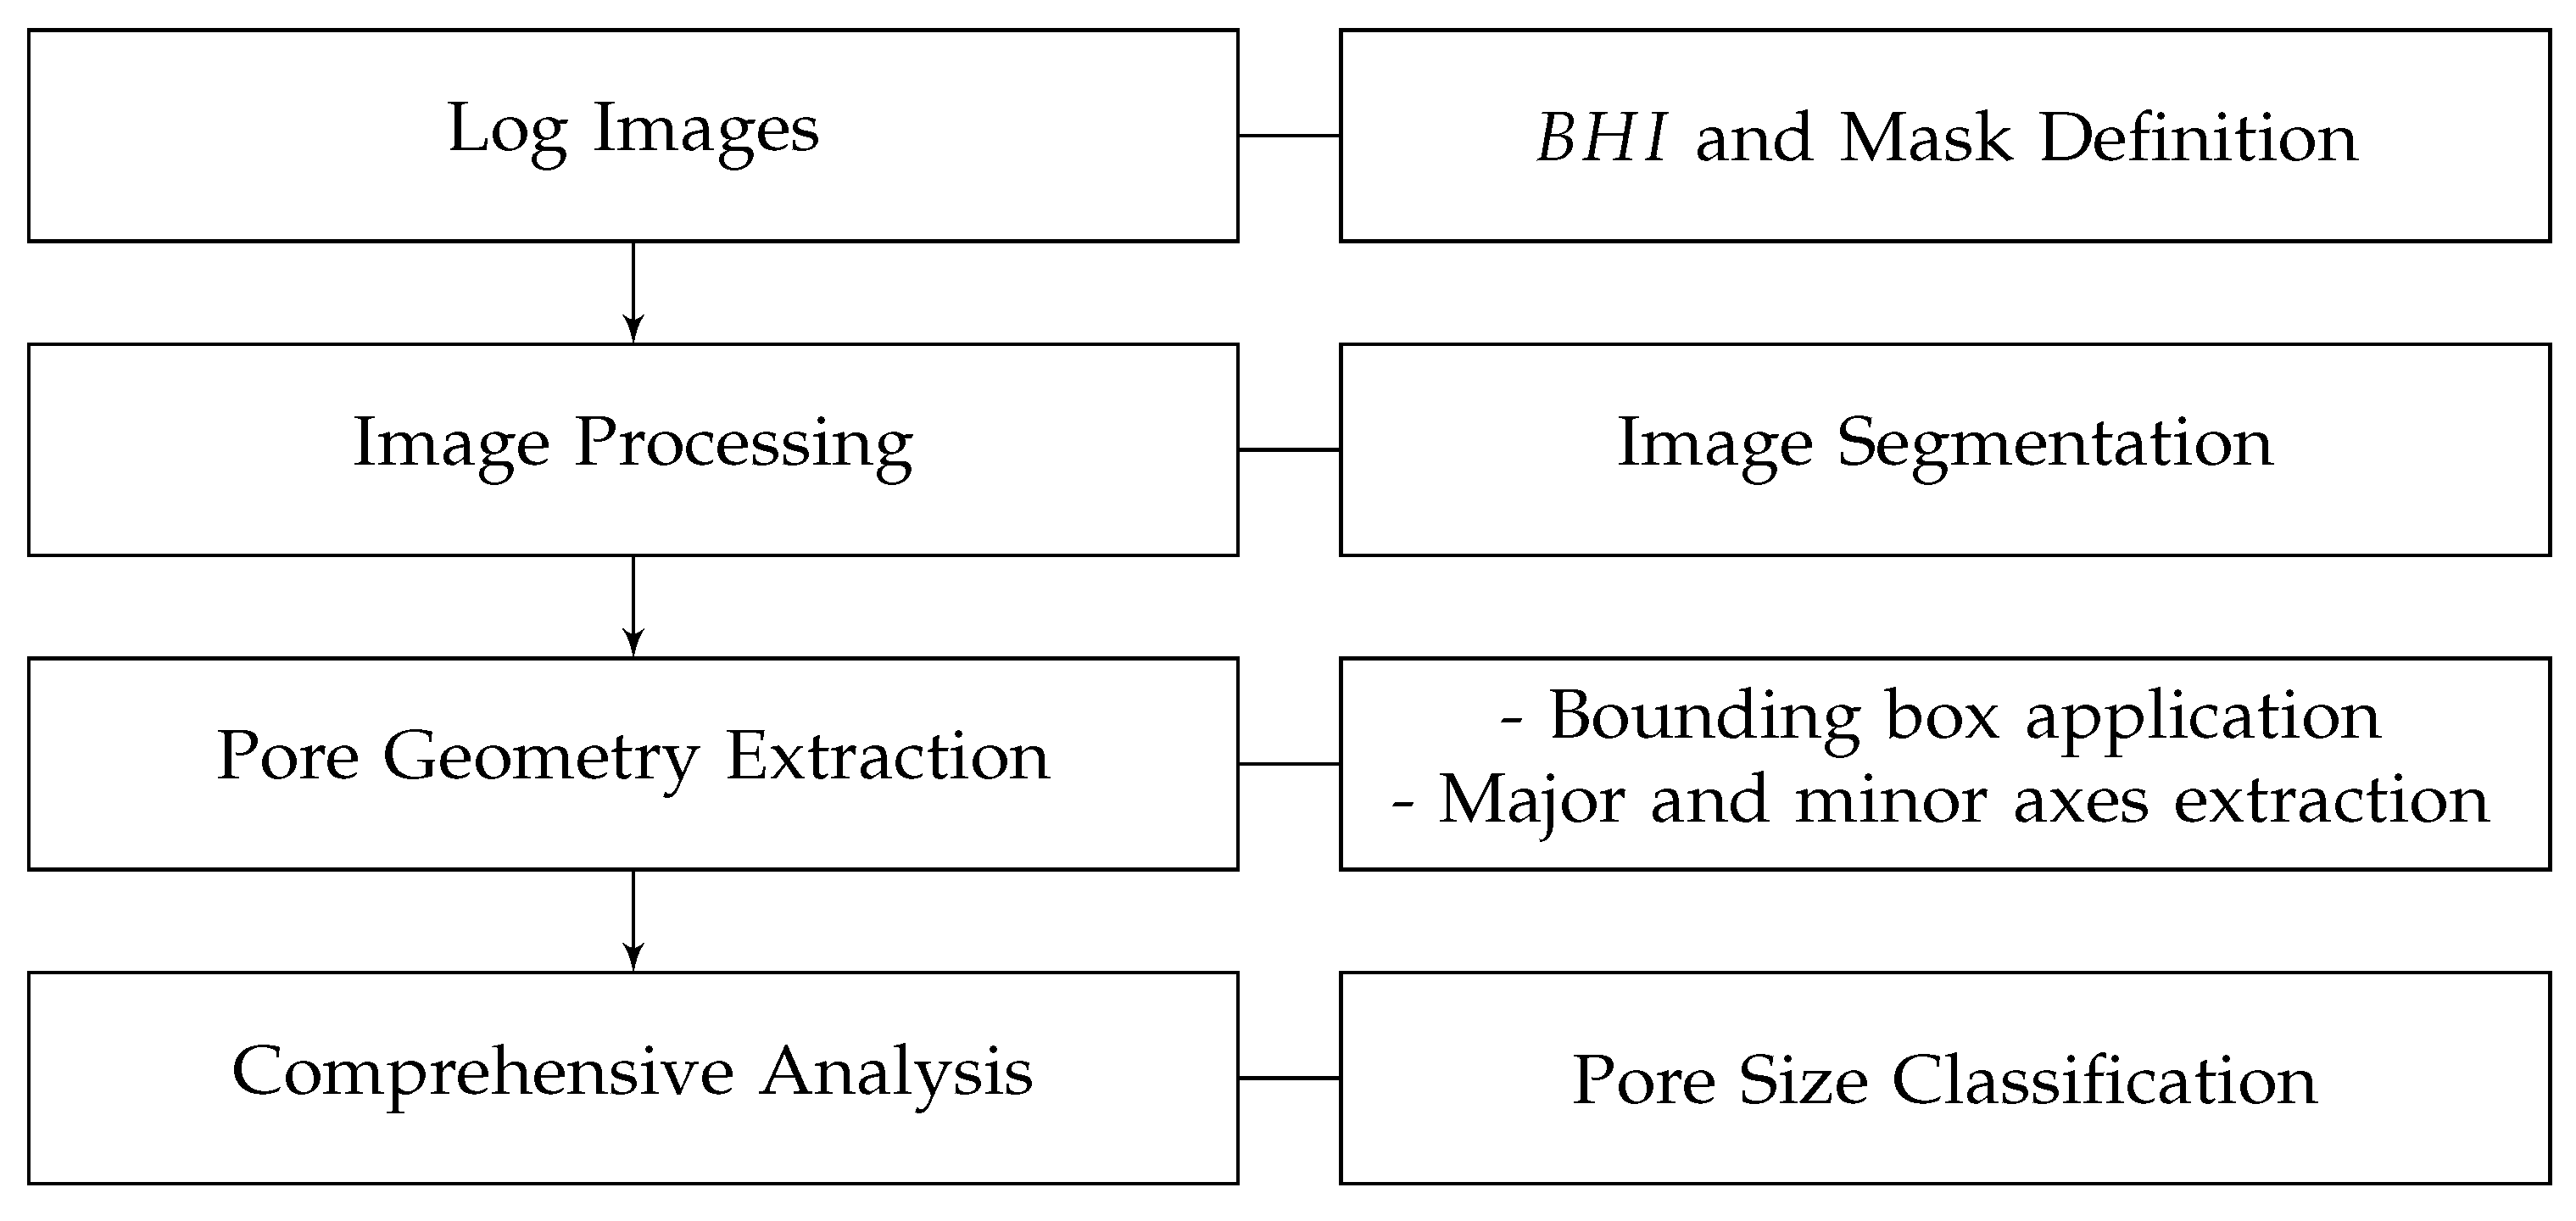
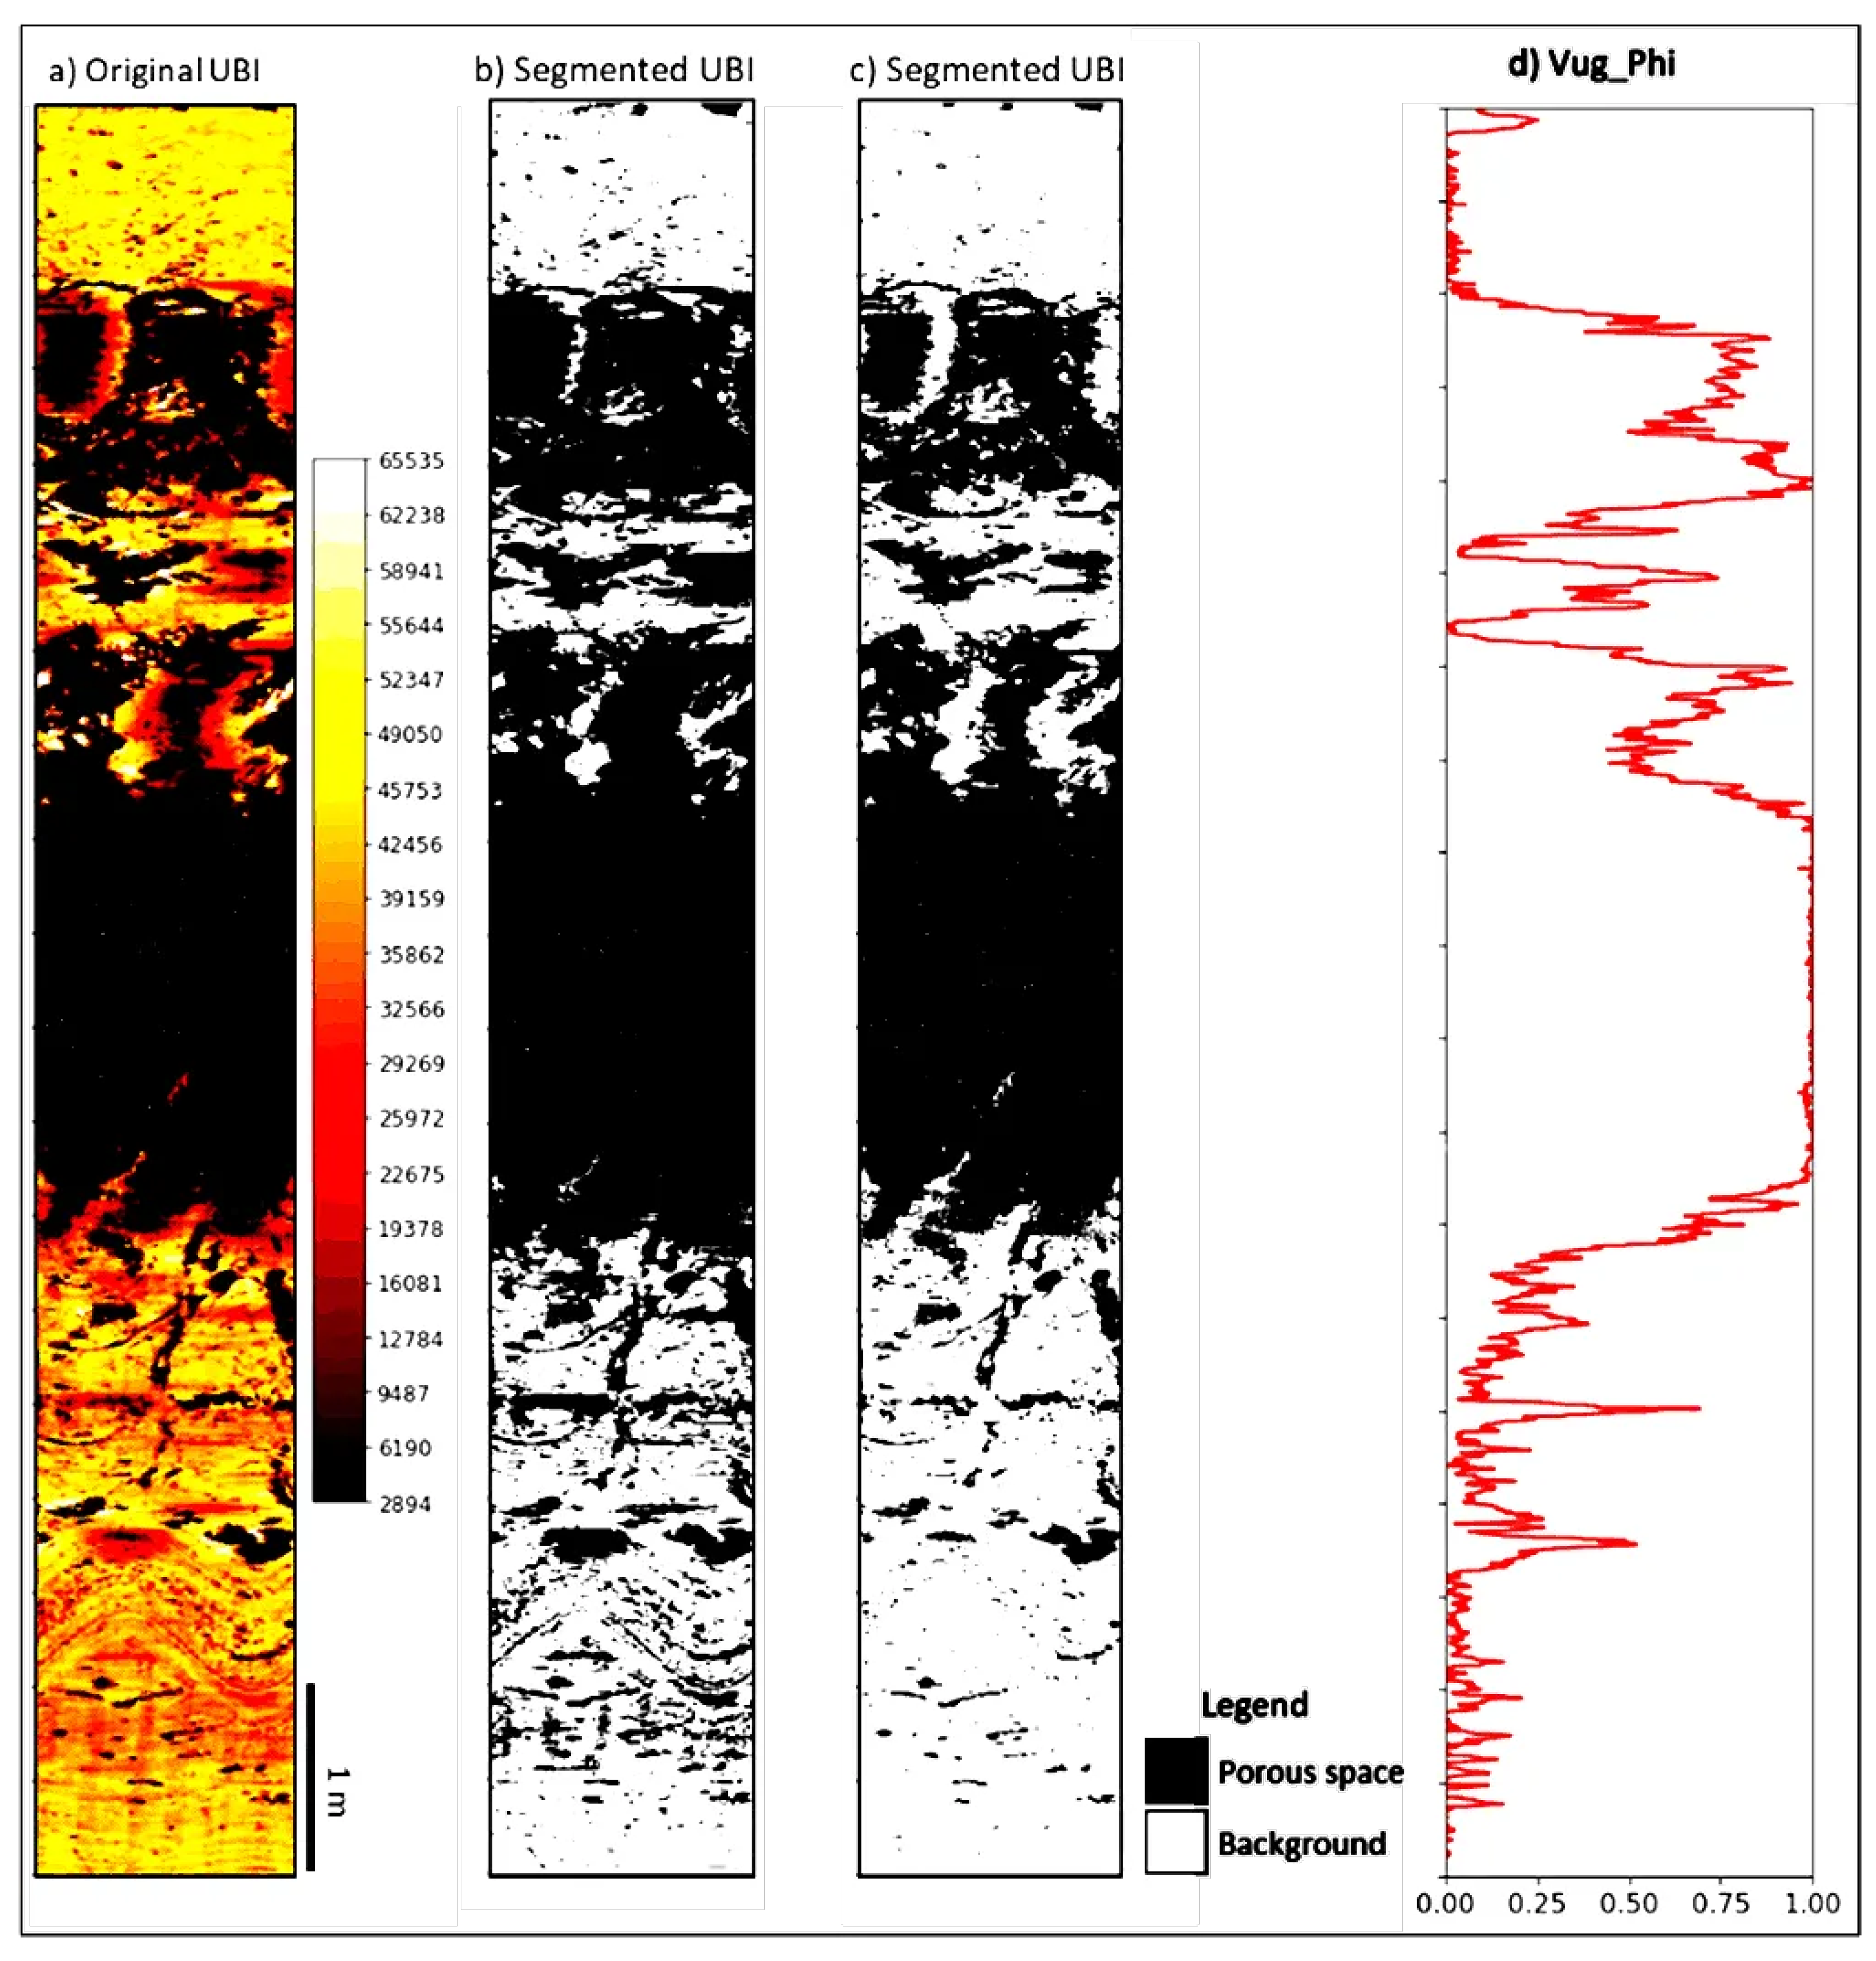
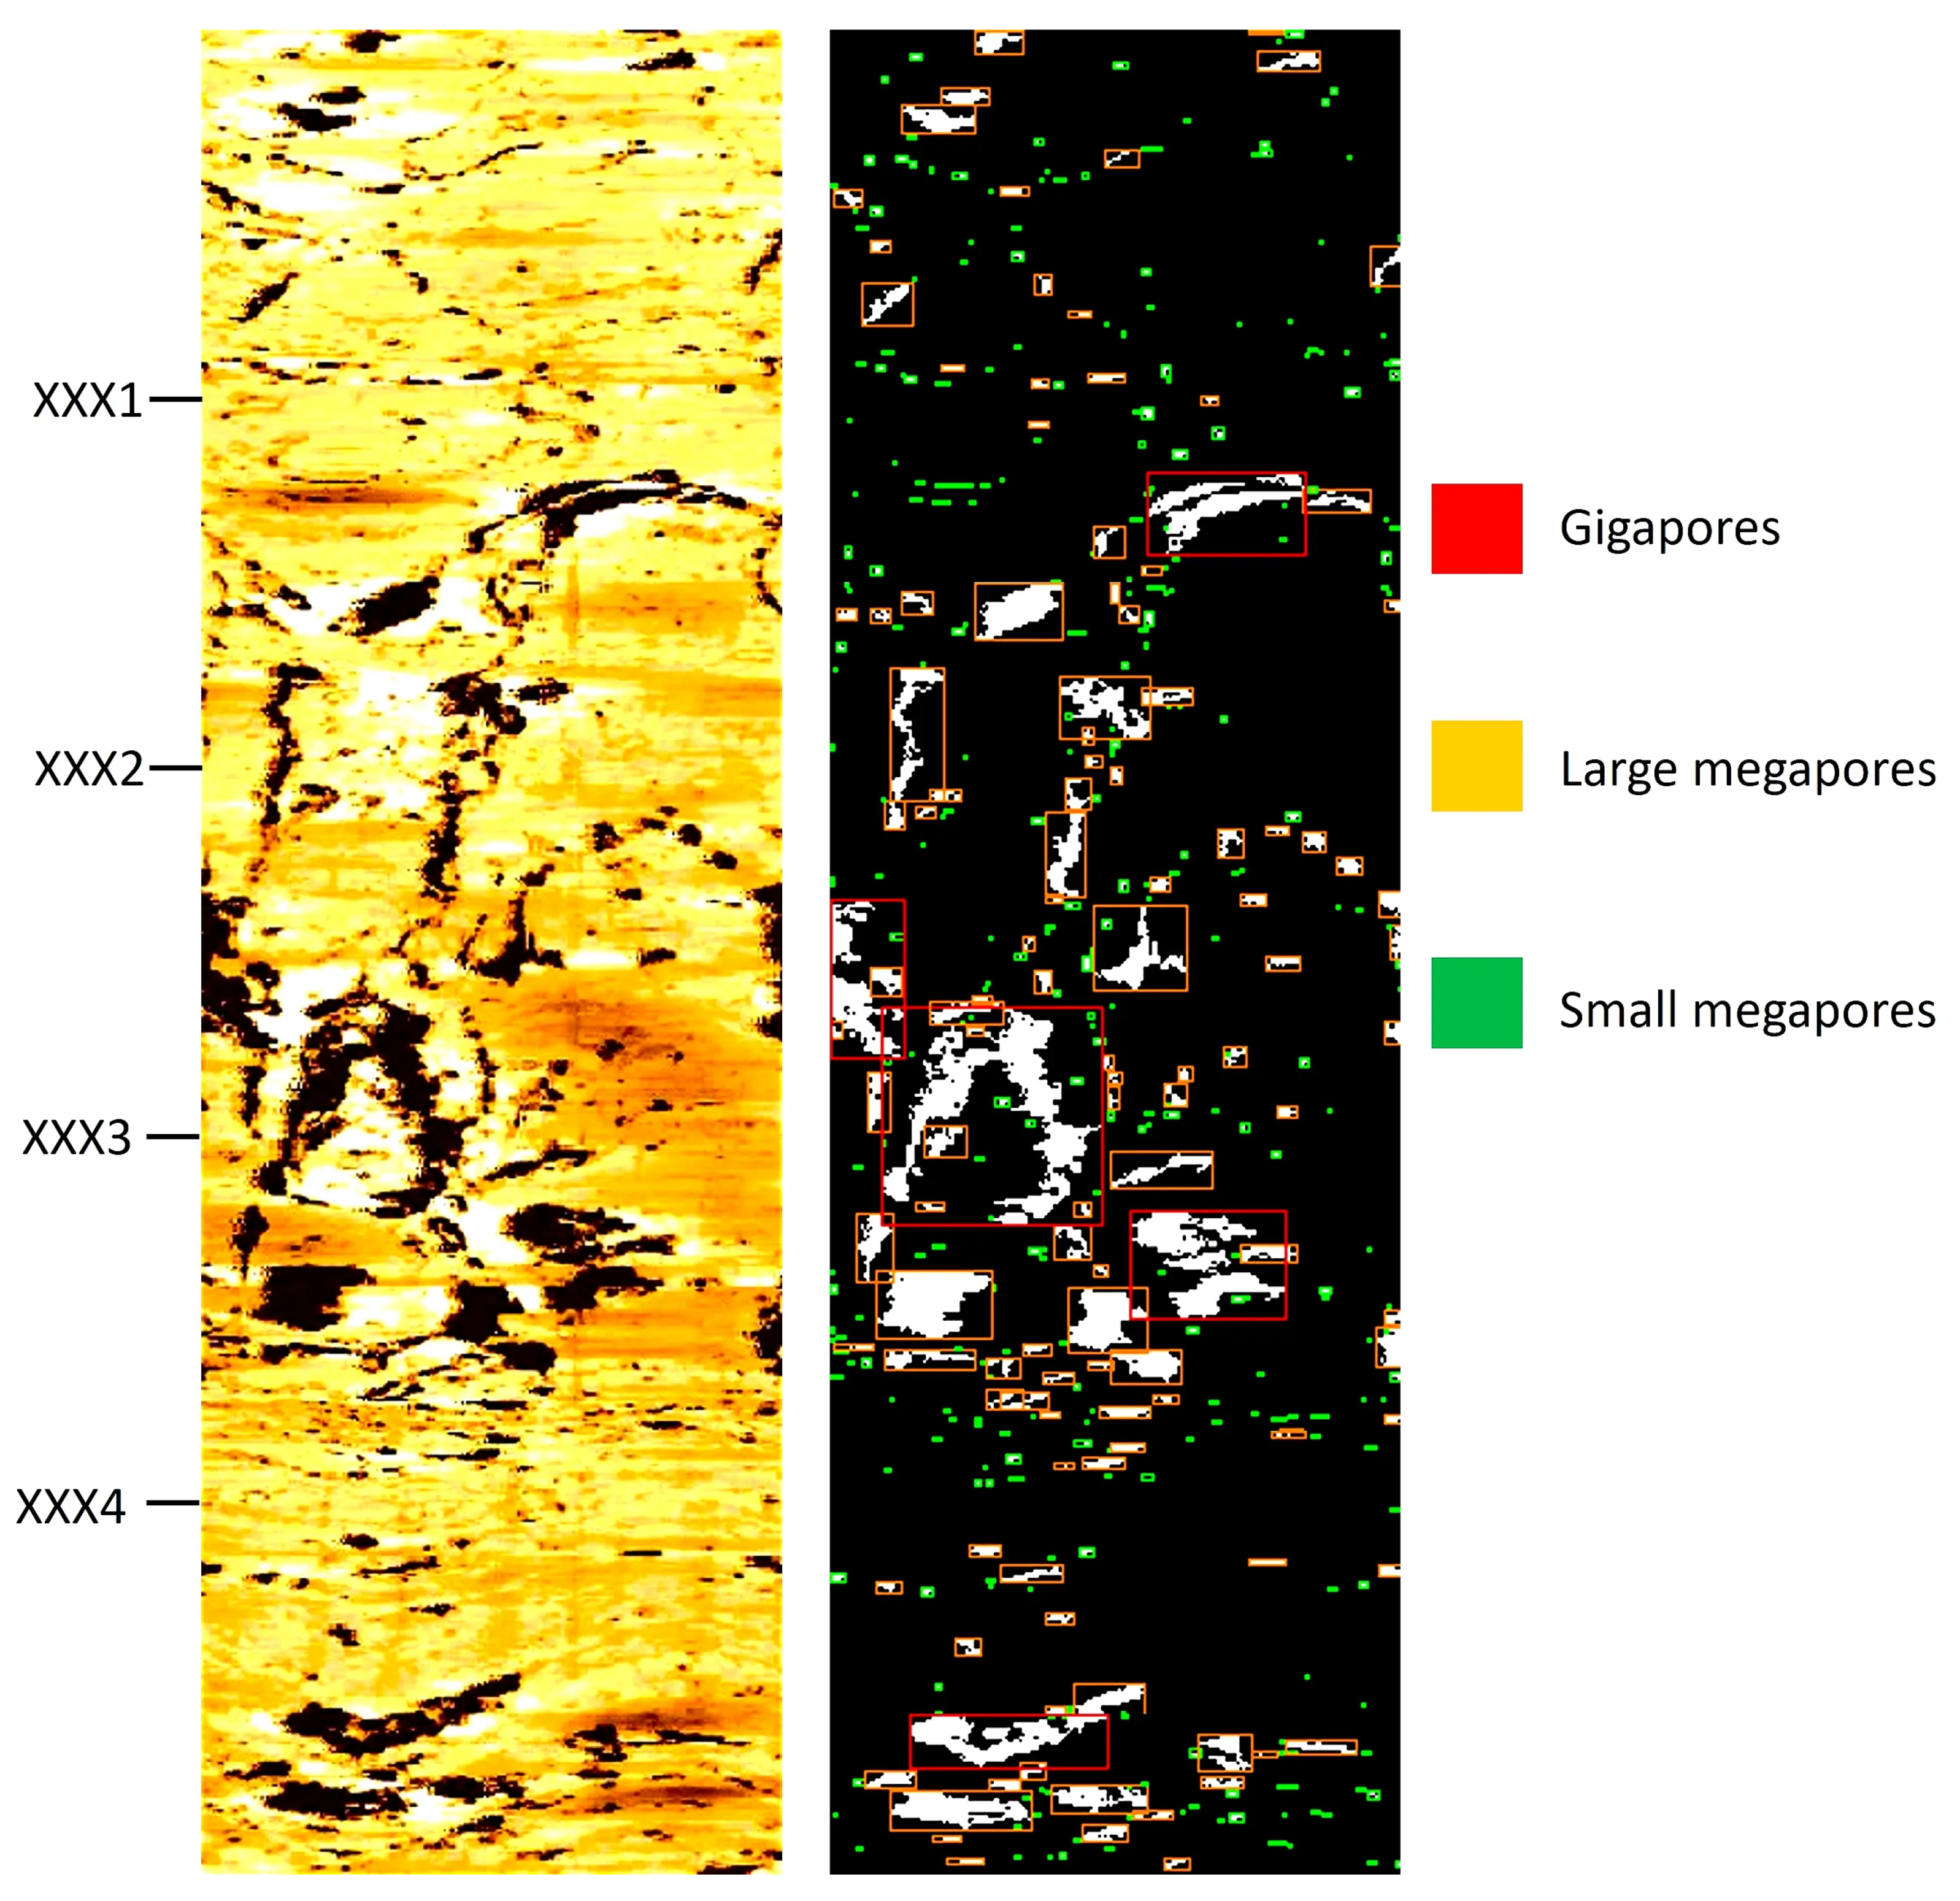
3.2.2. Image Segmentation for Pore Size Classification
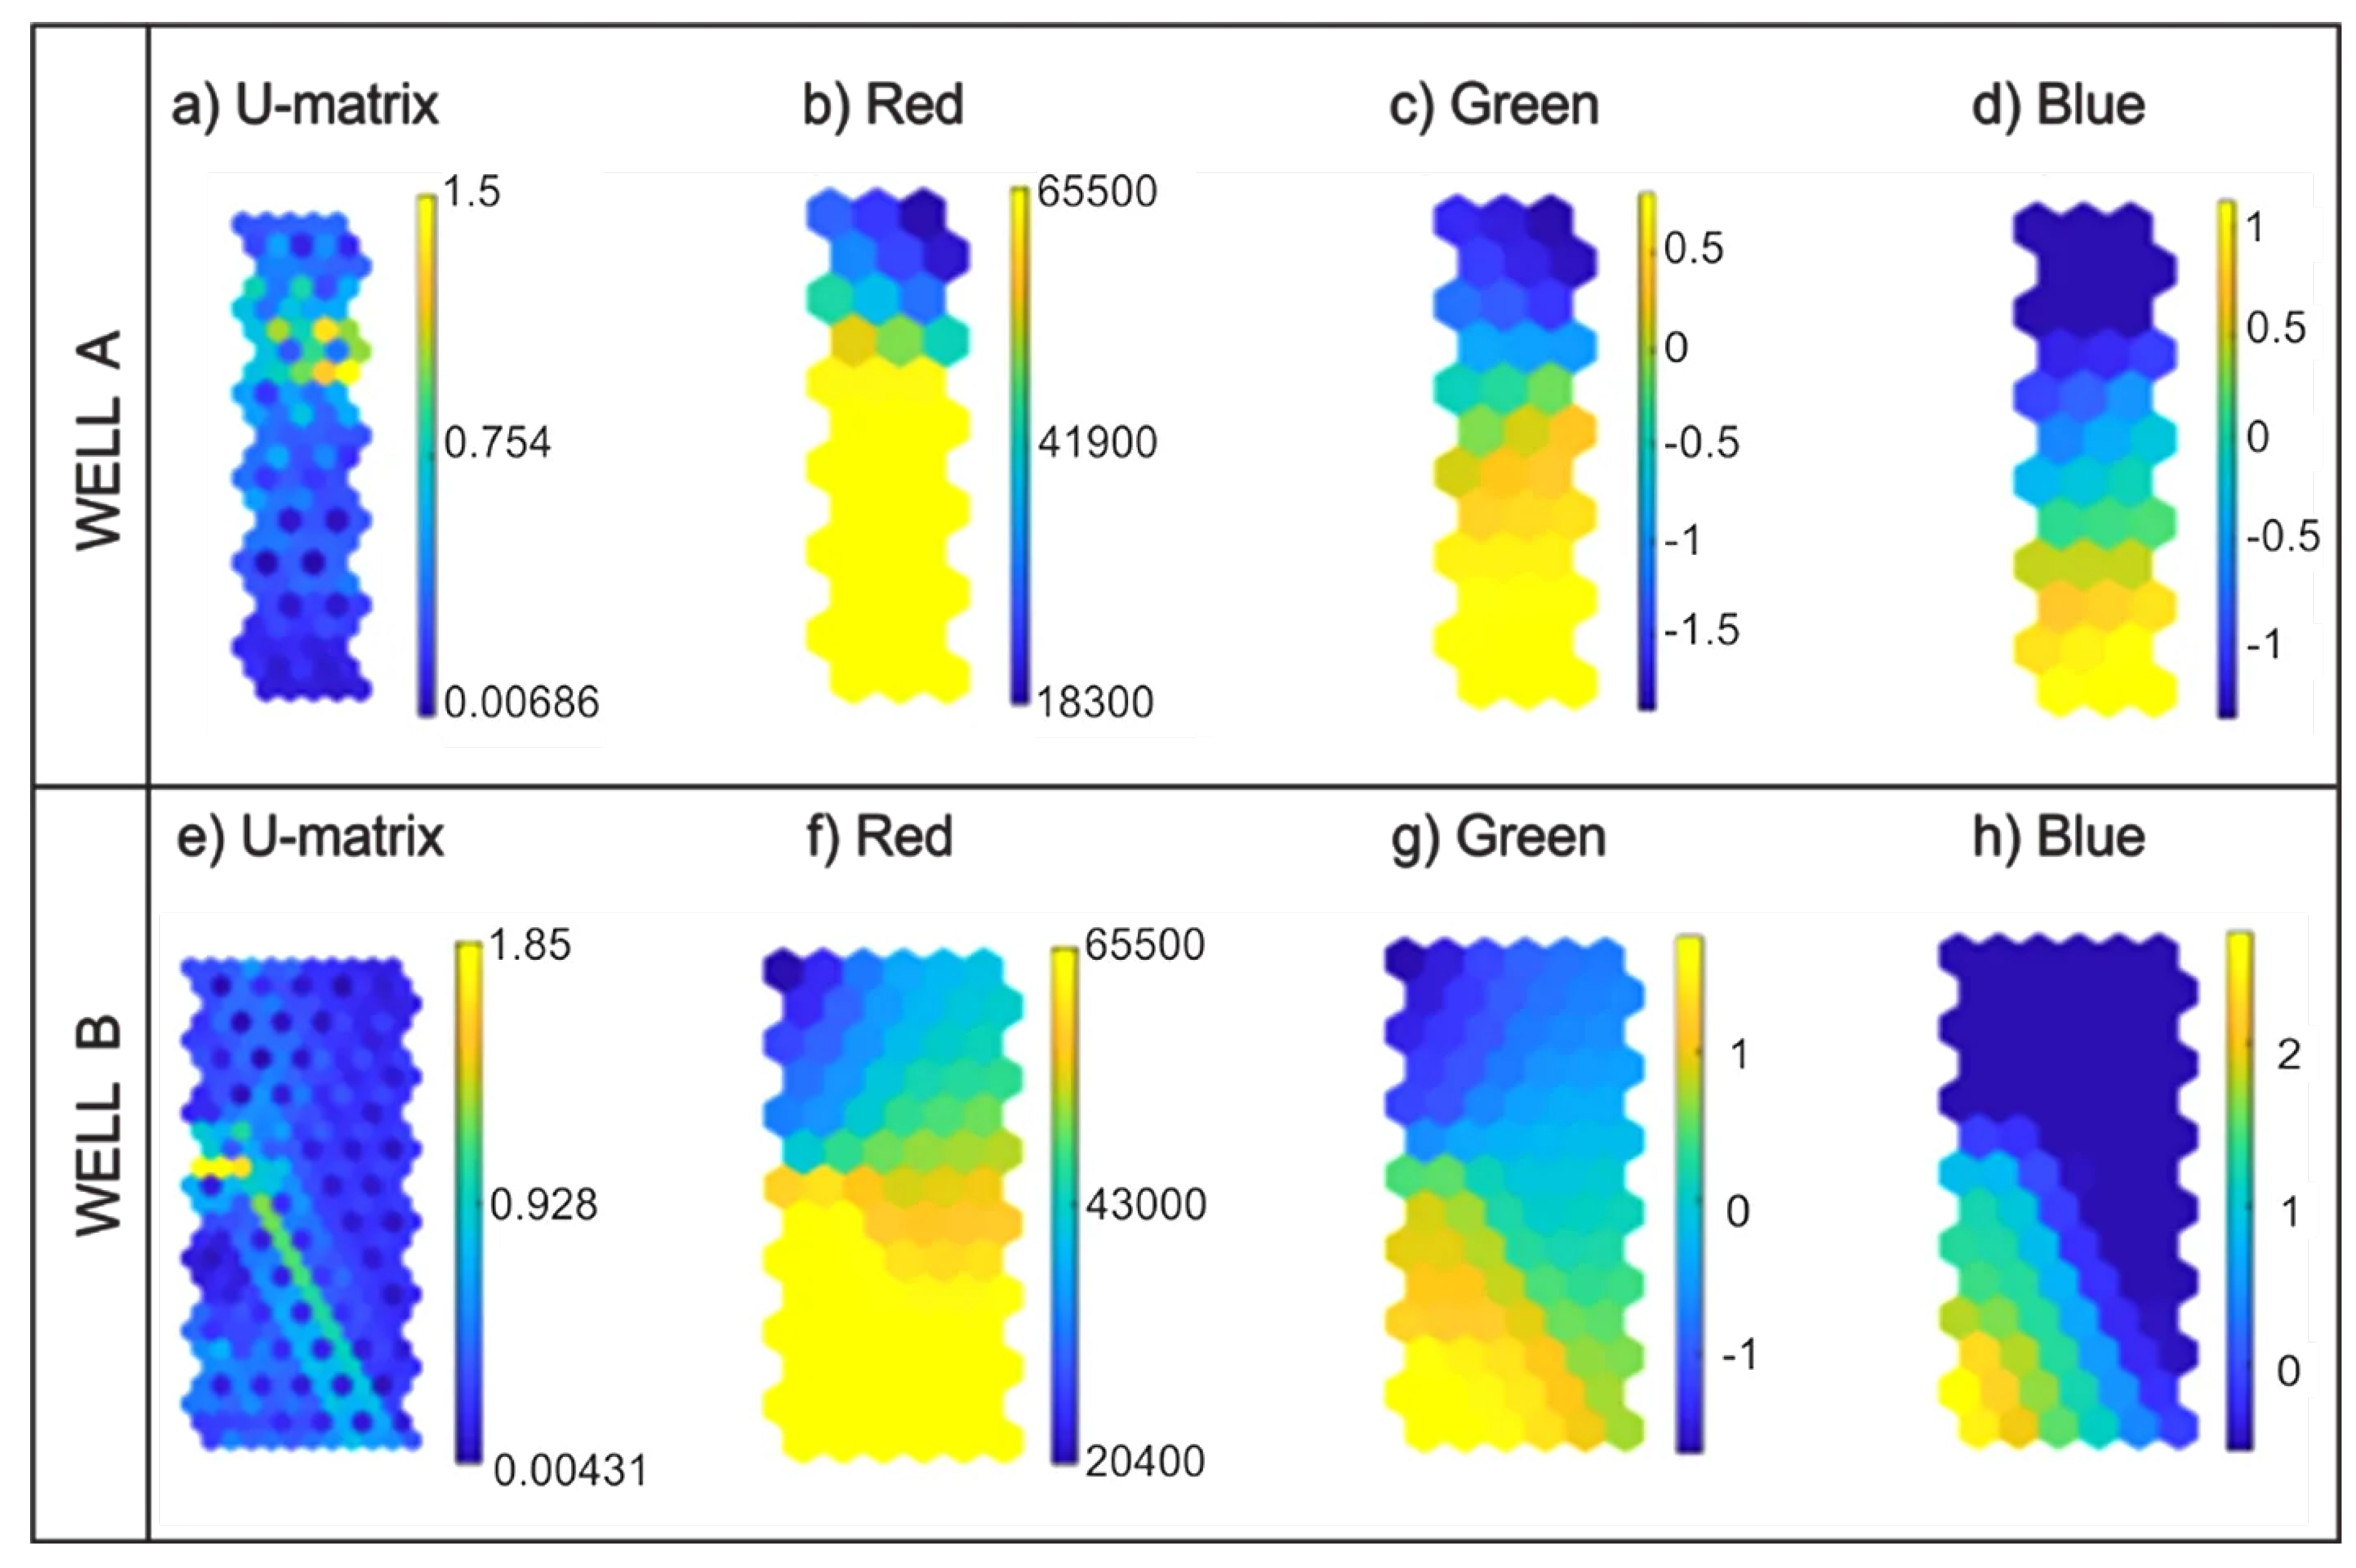
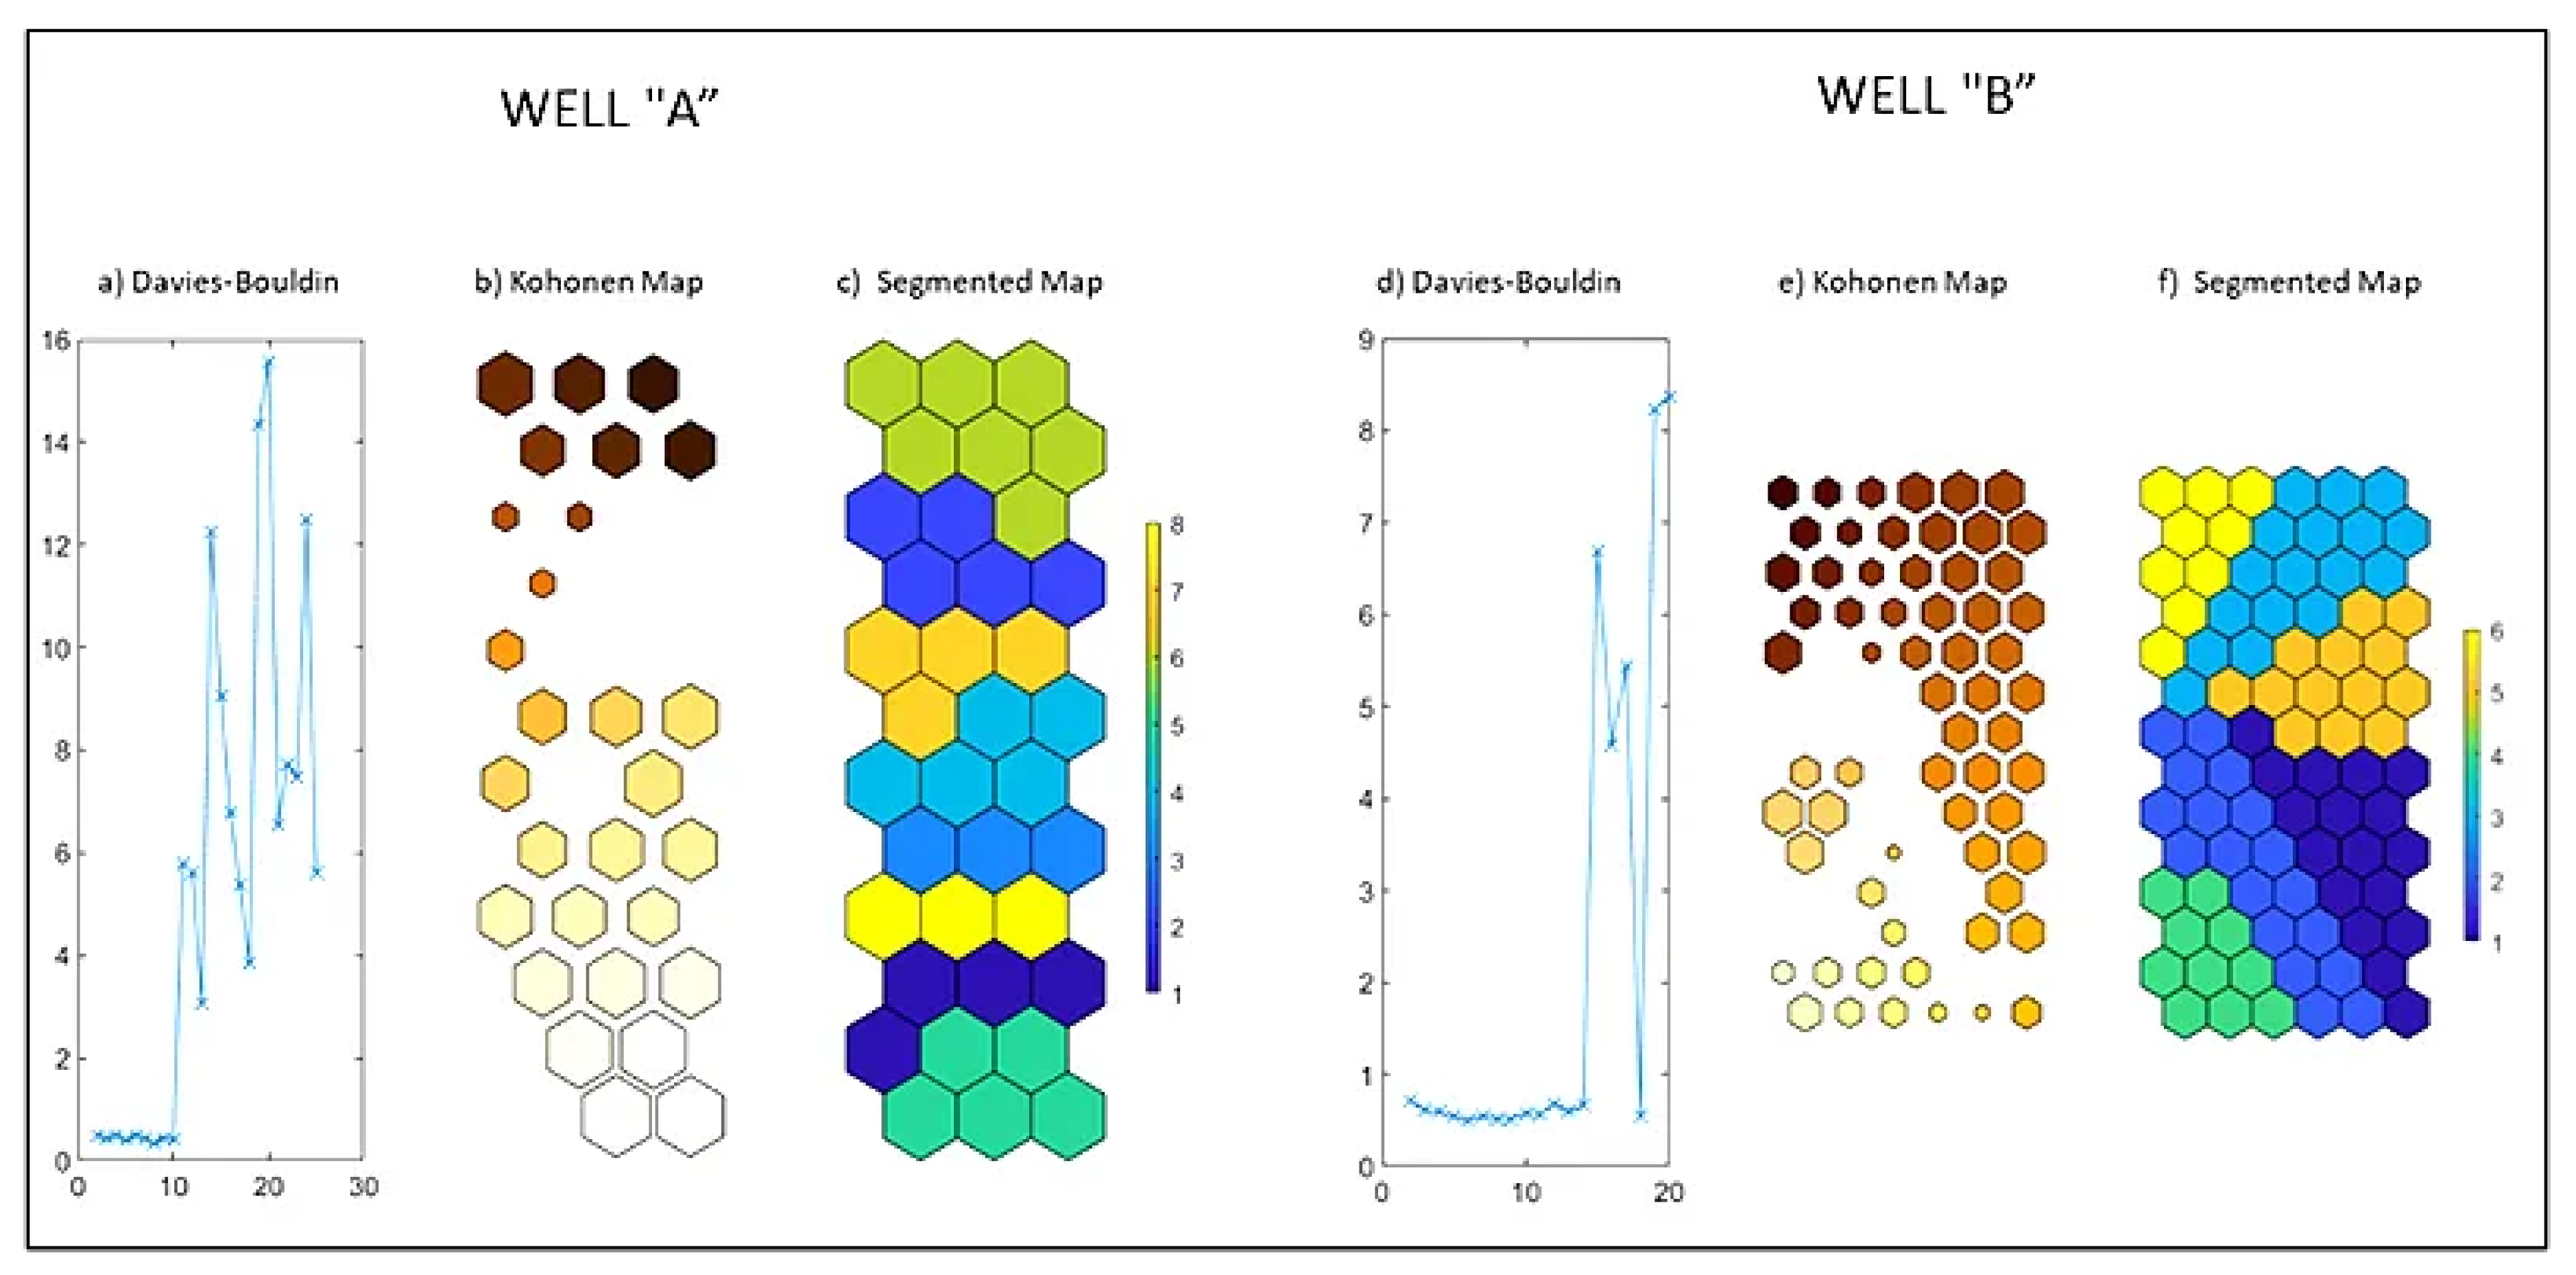
3.2.3. Advancements in Machine Learning Techniques for Geological Analysis
- Initialization: The weight vectors corresponding to each neuron are initially configured either randomly or through alternative initialization methods. These weight vectors effectively represent points within the input space.
- Competition and Cooperation: Throughout the training process, an input vector is introduced to the . Each neuron computes its resemblance to the input vector by employing a similarity metric, most commonly the Euclidean distance. The neuron with the weight vector that most closely resembles the input is deemed the winning neuron.
- Weight Adjustment: The winning neuron and its immediate neighbors within the lattice have their weight vectors adjusted to become more akin to the input vector. The extent of this adjustment is contingent upon the neighborhood function, which gradually contracts over time, allowing the to converge.
- Topology Preservation: A striking attribute of s is their ability to conserve the topological relationships inherent in the input data. Comparable input vectors are mapped to proximate neurons within the grid, thereby facilitating data visualization and clustering.
- Training Iteration: The steps delineated in points 2 through 4 are iteratively repeated for a predefined number of training cycles, progressively enhancing the mapping of input data within the .
- Final Representation: After training, the furnishes a condensed, structured representation of the input data, effectively functioning as an organized, lower-dimensional rendition of the original dataset.
- ∘
-
Similarity Metric (Euclidean Distance): The similarity (or dissimilarity) between an input vector, denoted as I, and a neuron equipped with a weight vector, denoted as W, is calculated as follows:Where and represent the components of the input vector and the weight vector, respectively.
- ∘
-
Weight Adjustment: The modification of the weight vector for the winning neuron and its neighboring neurons is executed in the following manner:Where, signifies the change in weight, corresponds to the learning rate, designates the neighborhood function, and signifies the disparity between the input vector and the weight vector.
- ∘
-
Neighborhood Function: The neighborhood function, denoted as , dictates the influence exerted by the winning neuron on its neighboring neurons, with its magnitude diminishing as a function of both time and distance from the winner:Where, c denotes the distance from the winning neuron, while represents the neighborhood radius.
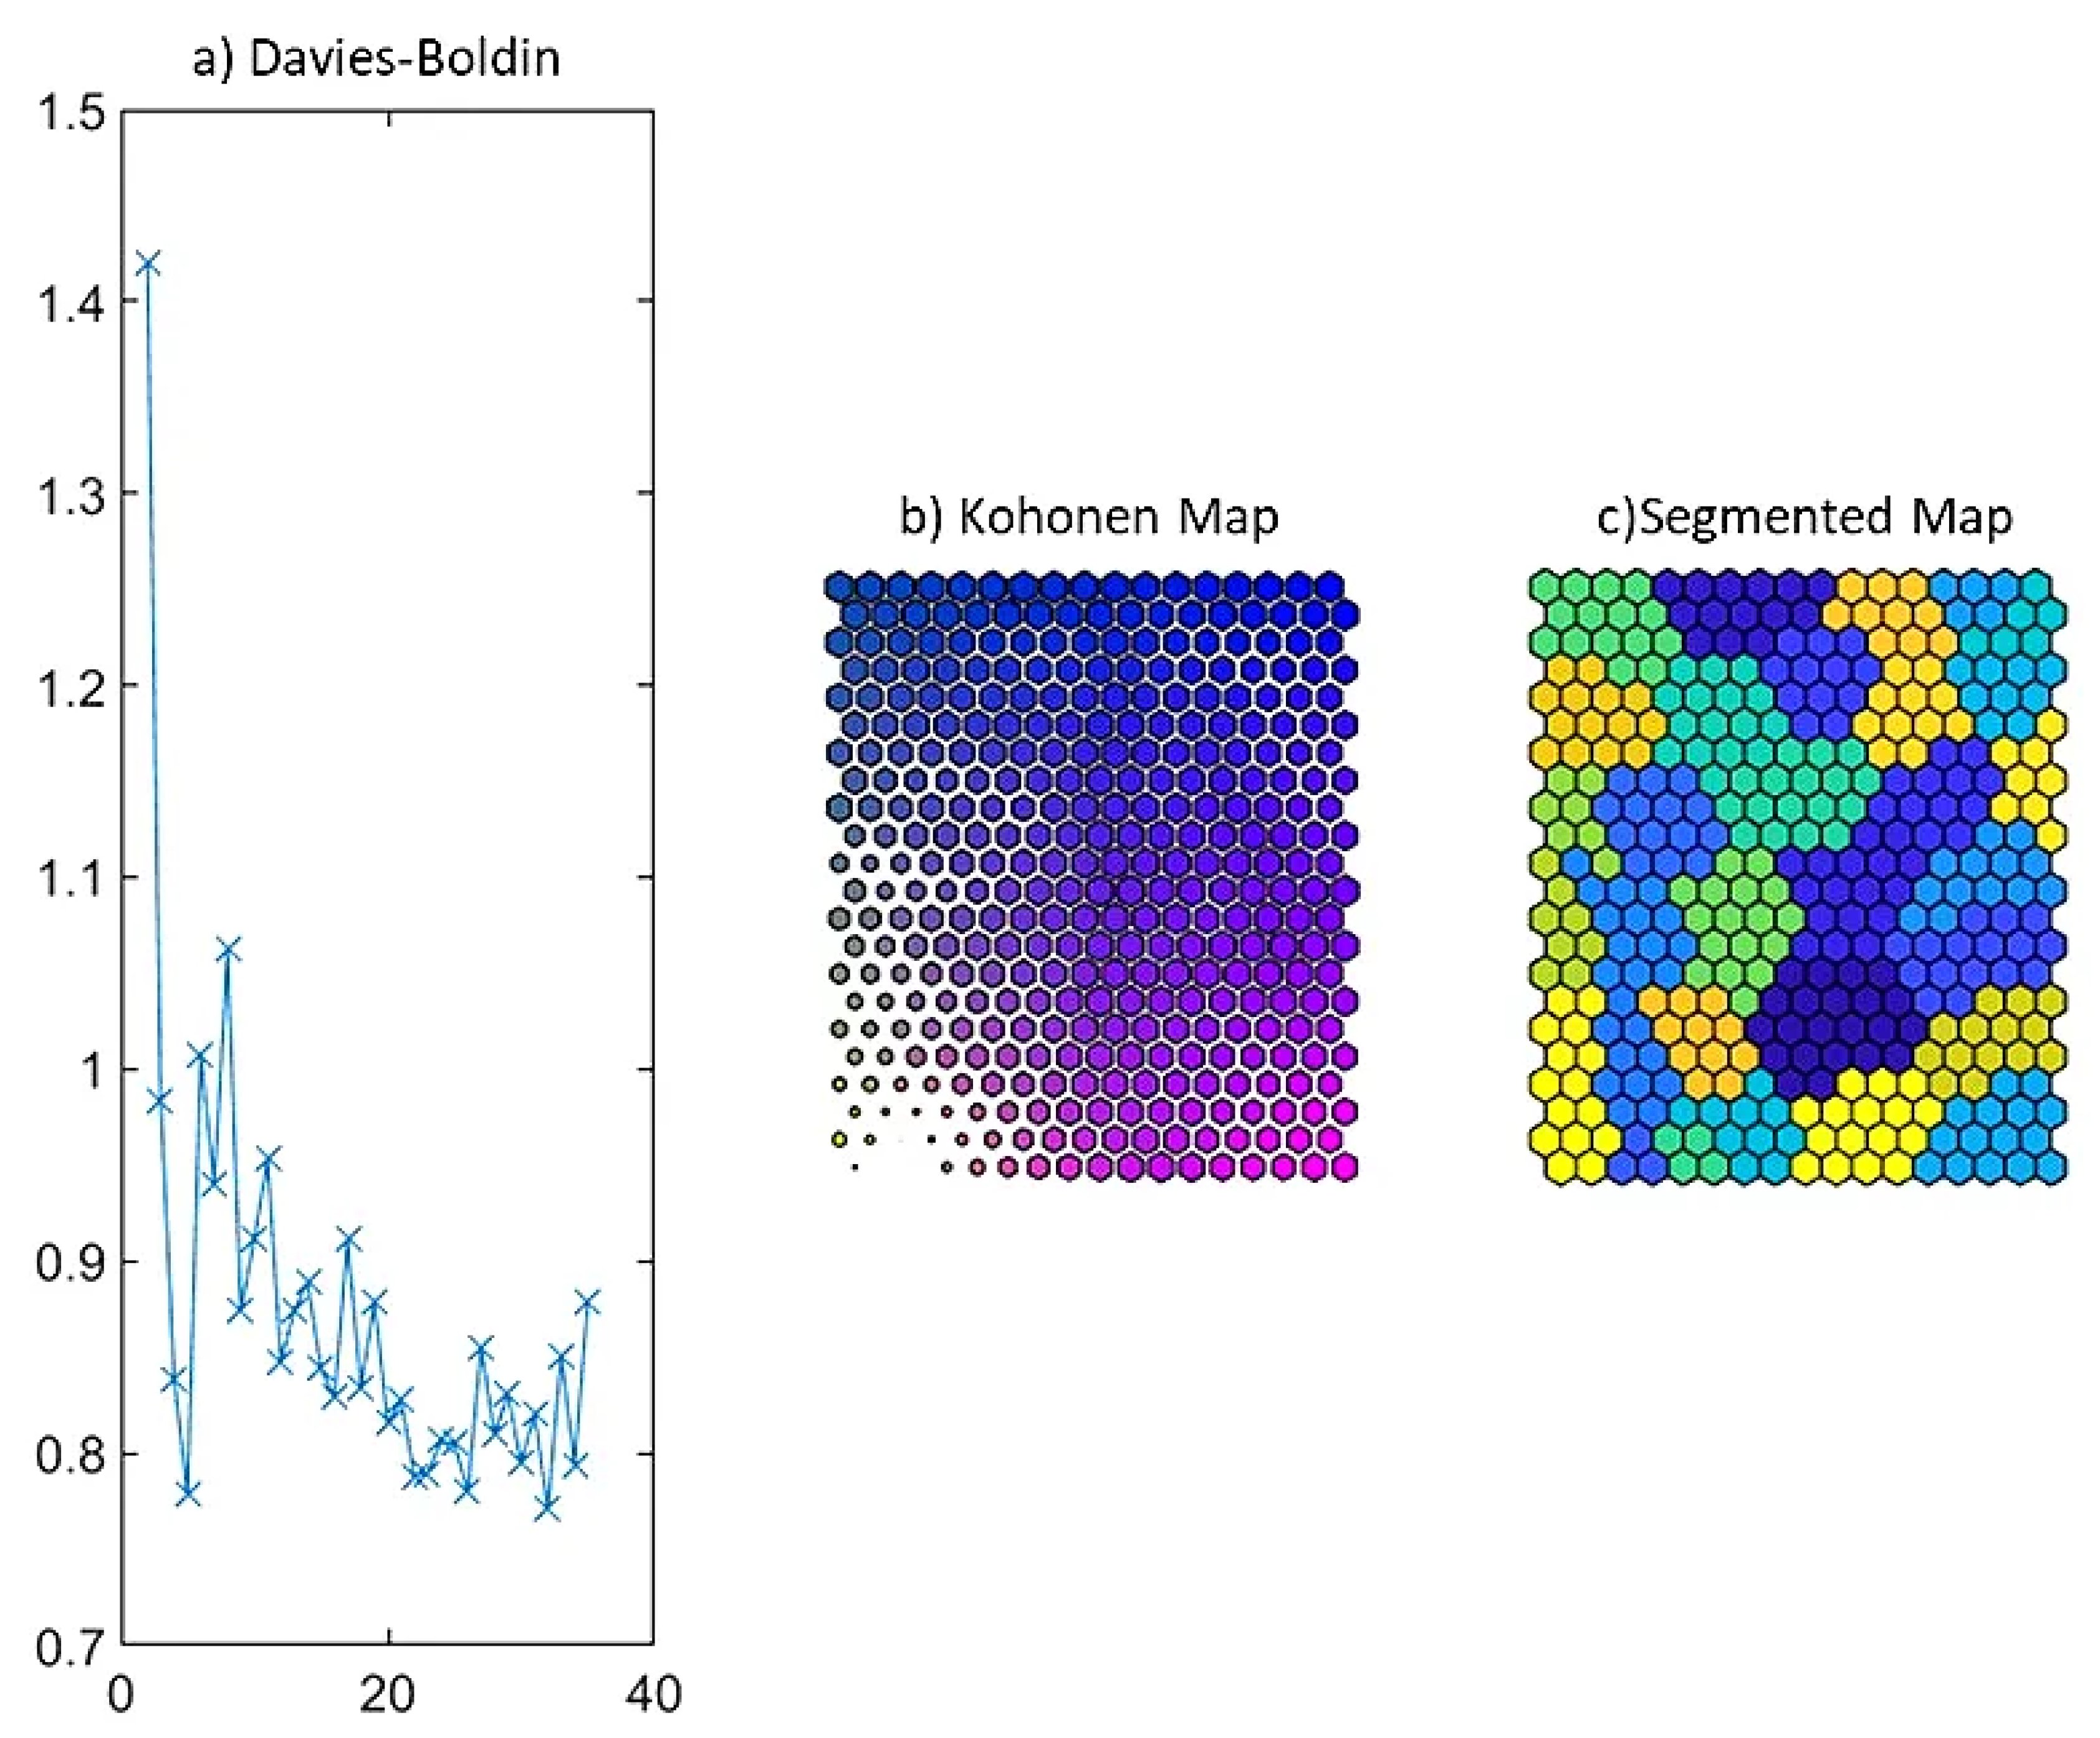
Utilizing for Curve Computation
Integration of Datasets Using (Conventional and Logs)
4. Results and Discussion
4.1. “ Curve” Calculation
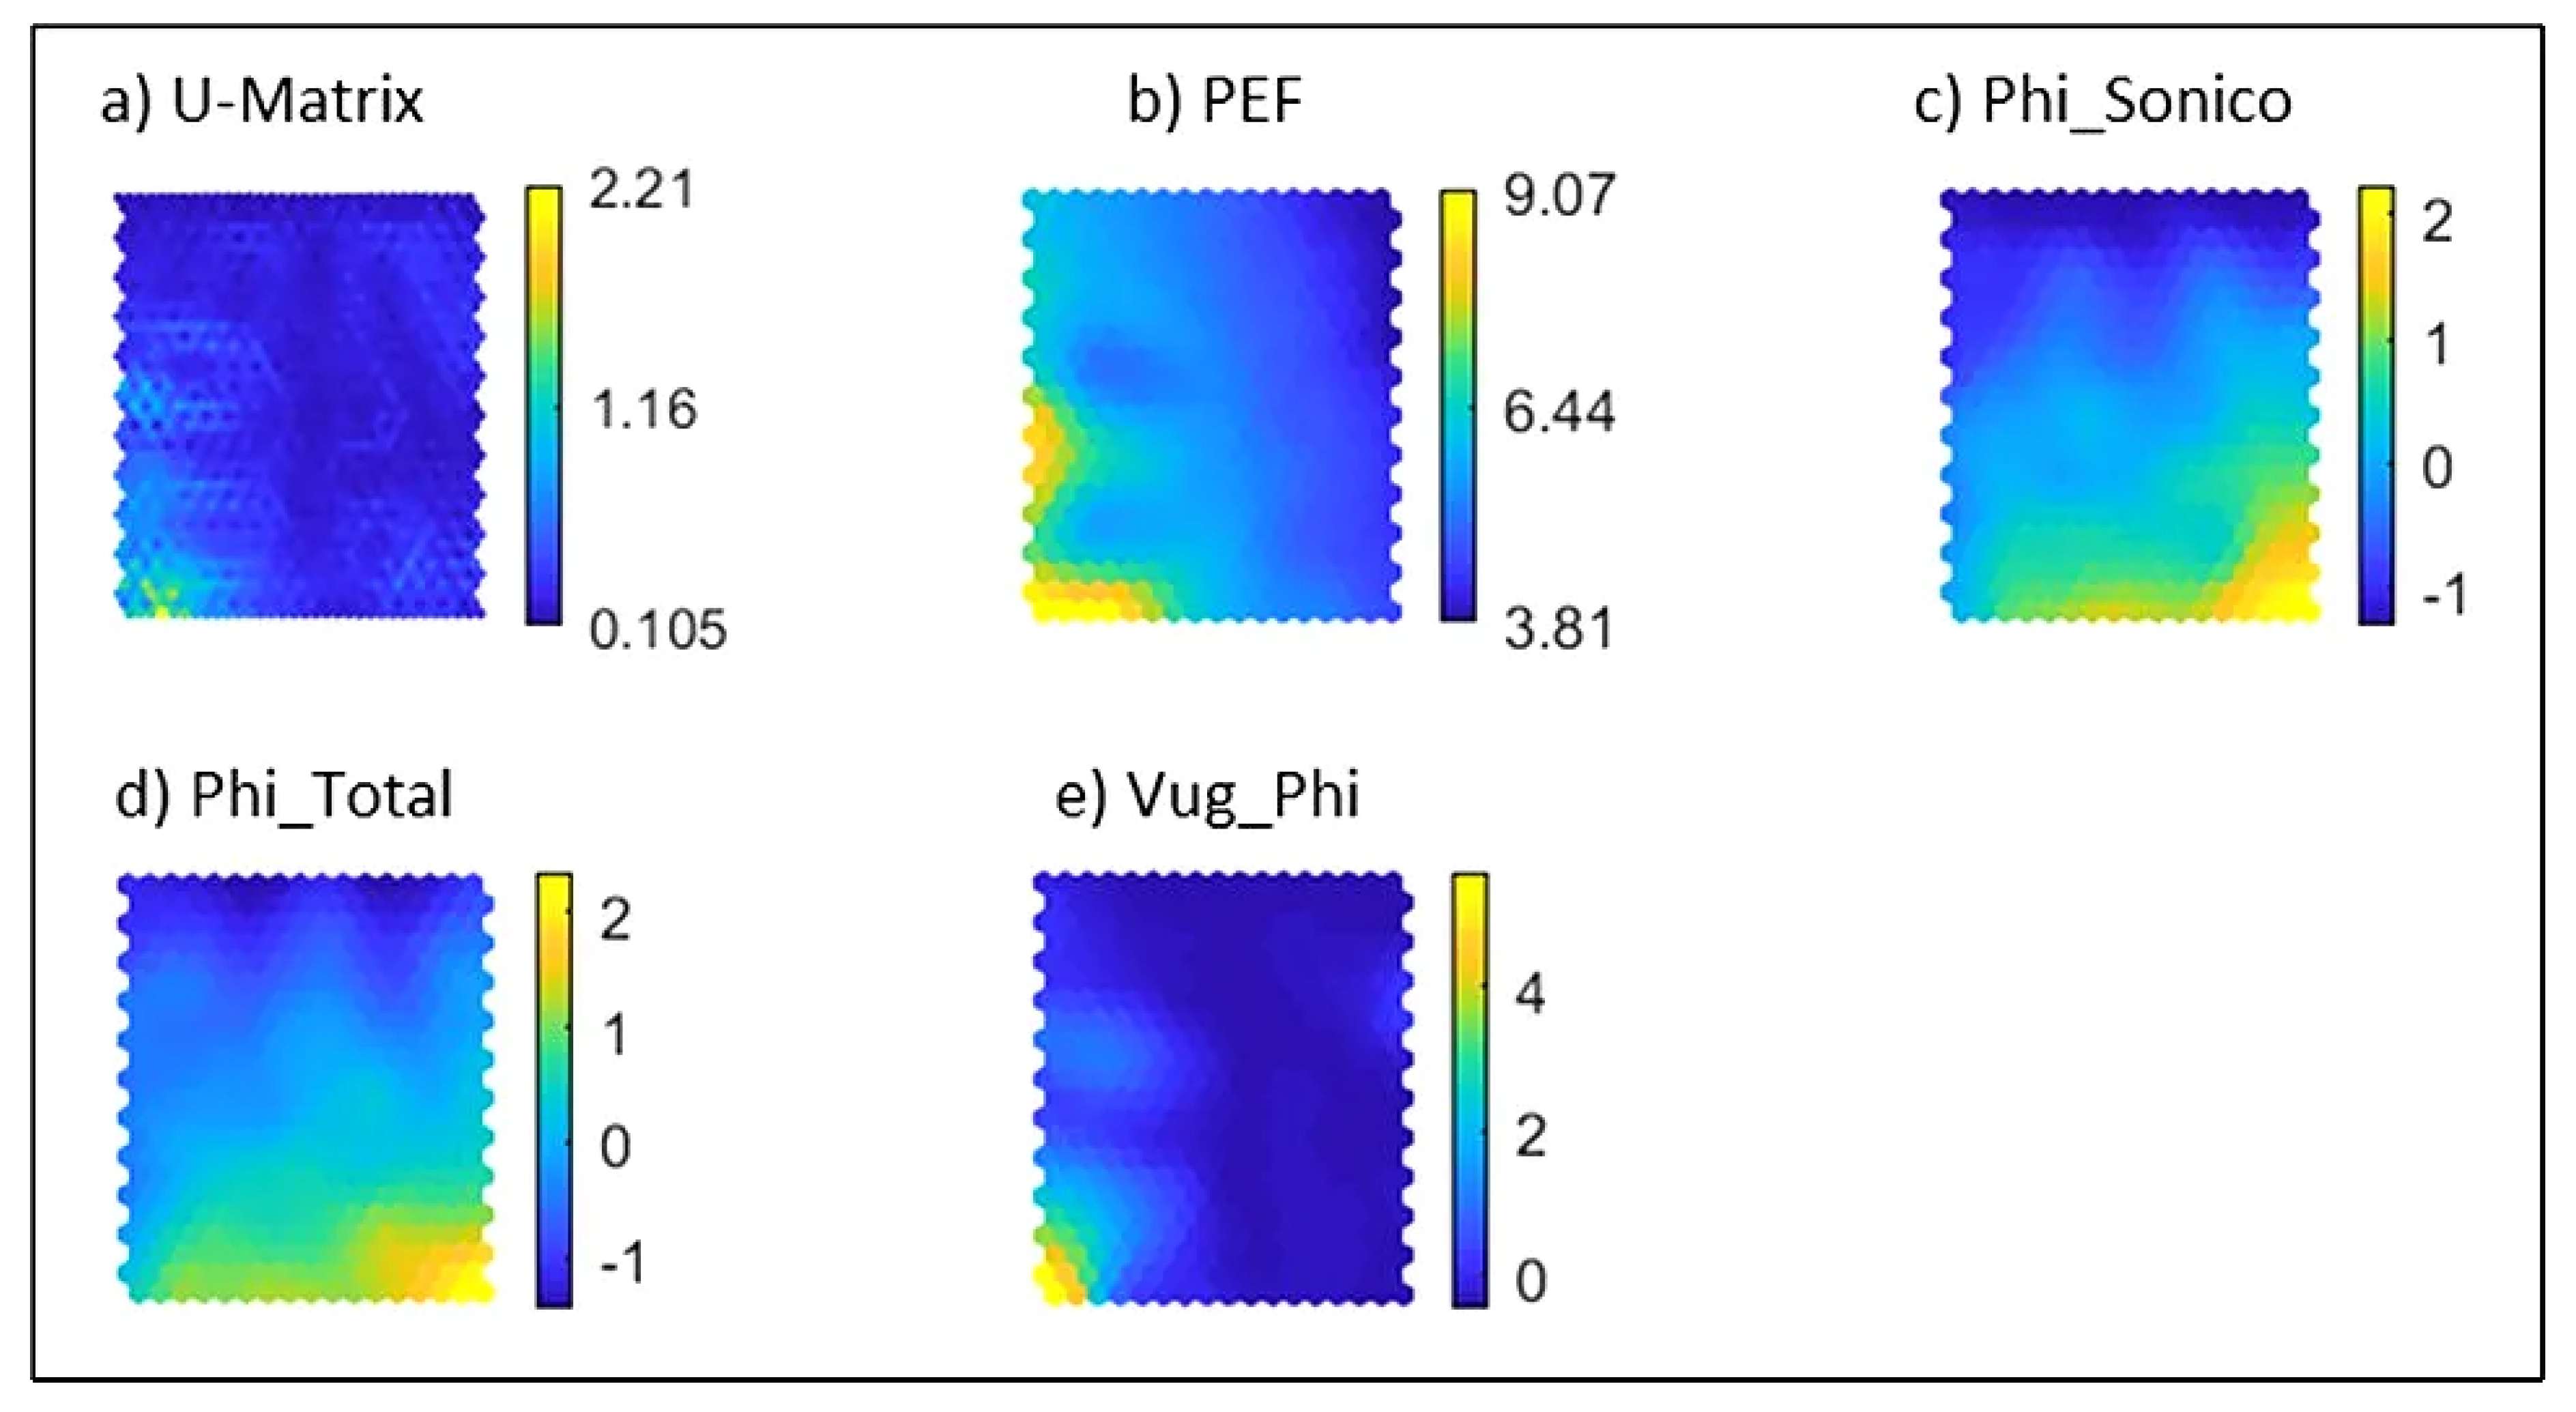
4.1.1. Responses of the Data Inputs Against Porous Environment
4.1.2. Integration of Conventional and logs
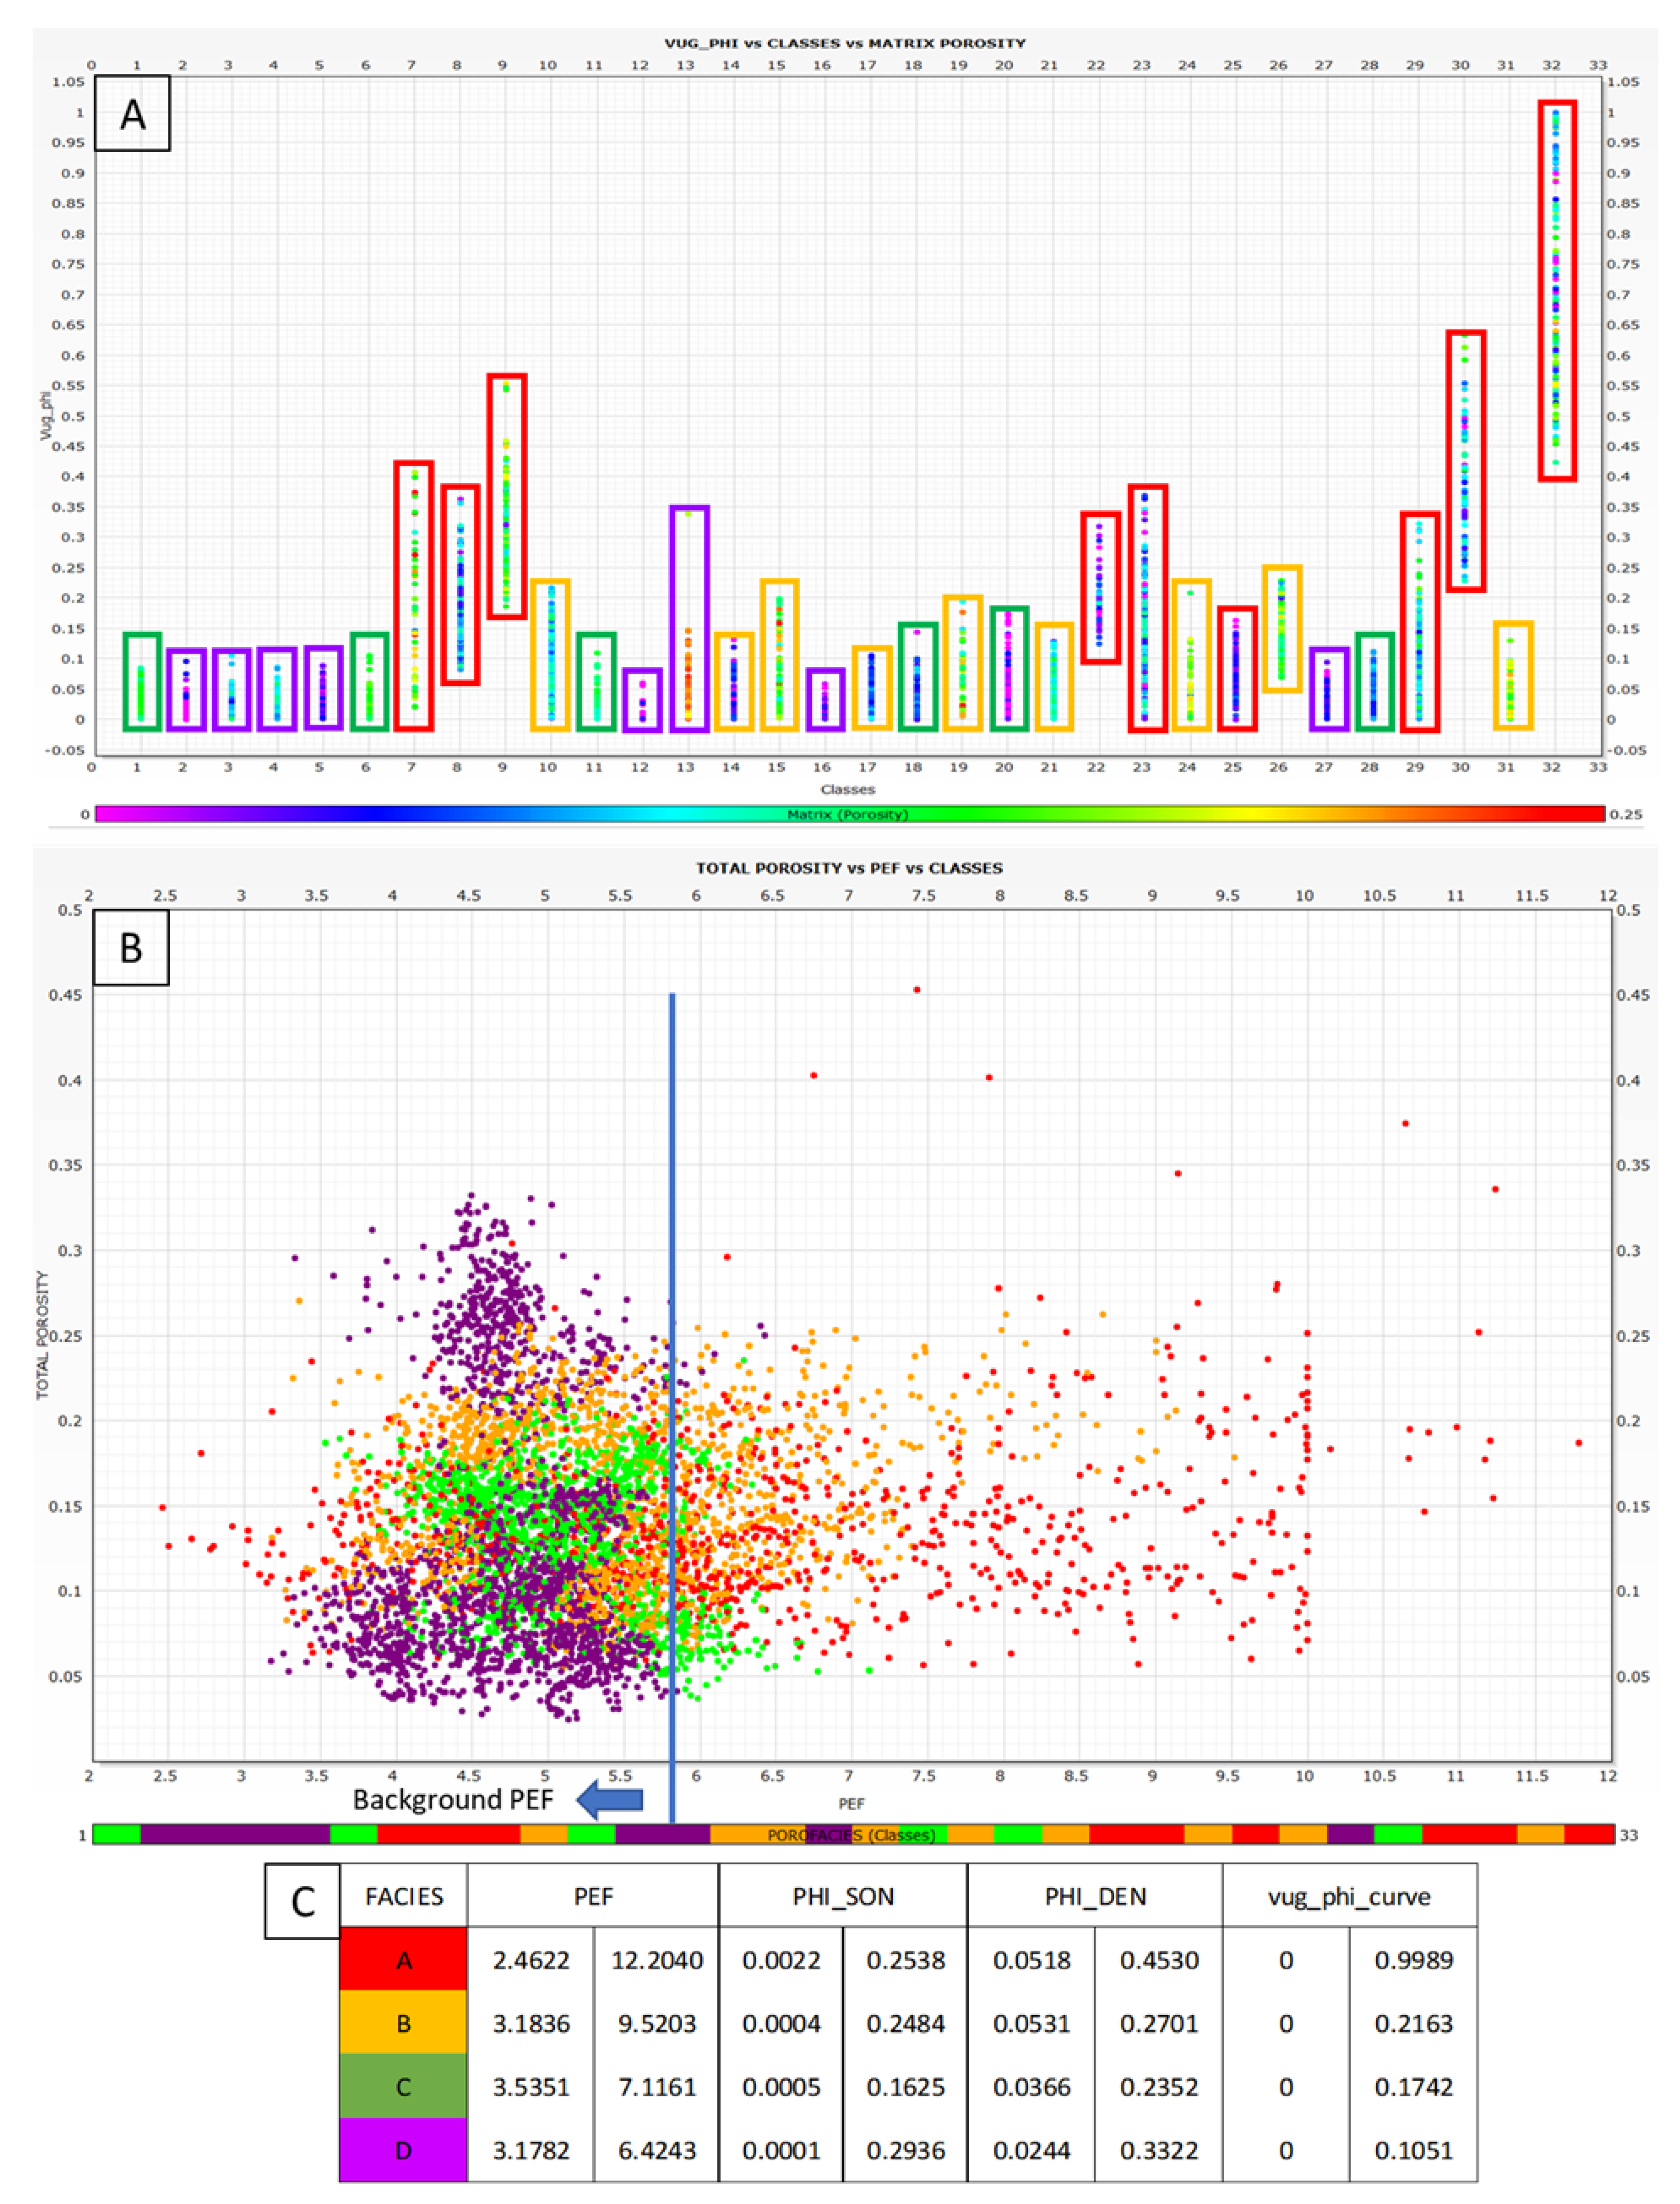
4.2. Porosity-Based Facies
4.2.1. Facies A
4.2.2. Facies B
4.2.3. Facies C
4.2.4. Facies D
4.3. Porosity-Based Facies as Lithology Proxies
5. Conclusions
- Utility of Logs: logs prove to be the superior tool for identifying sub-seismic features in unconventional reservoirs.
- Challenges with Logs: Despite their efficacy, logs may be scarce and susceptible to interference patterns, requiring additional data sources.
- Role of Conventional Well Logs: Conventional well logs, primarily used for defining physical rock characteristics, can be utilized (with limitations) for interpreting sub-seismic features.
- Complementary Nature of Conventional Well Logs: Individual conventional well logs lack sufficient information for pore space identification but combining them aids in preliminary detecting intervals with high pore space percentages.
- Integration Methodology: Proposing a semi-automatic methodology that integrates and conventional well logs using a small database and neural network.
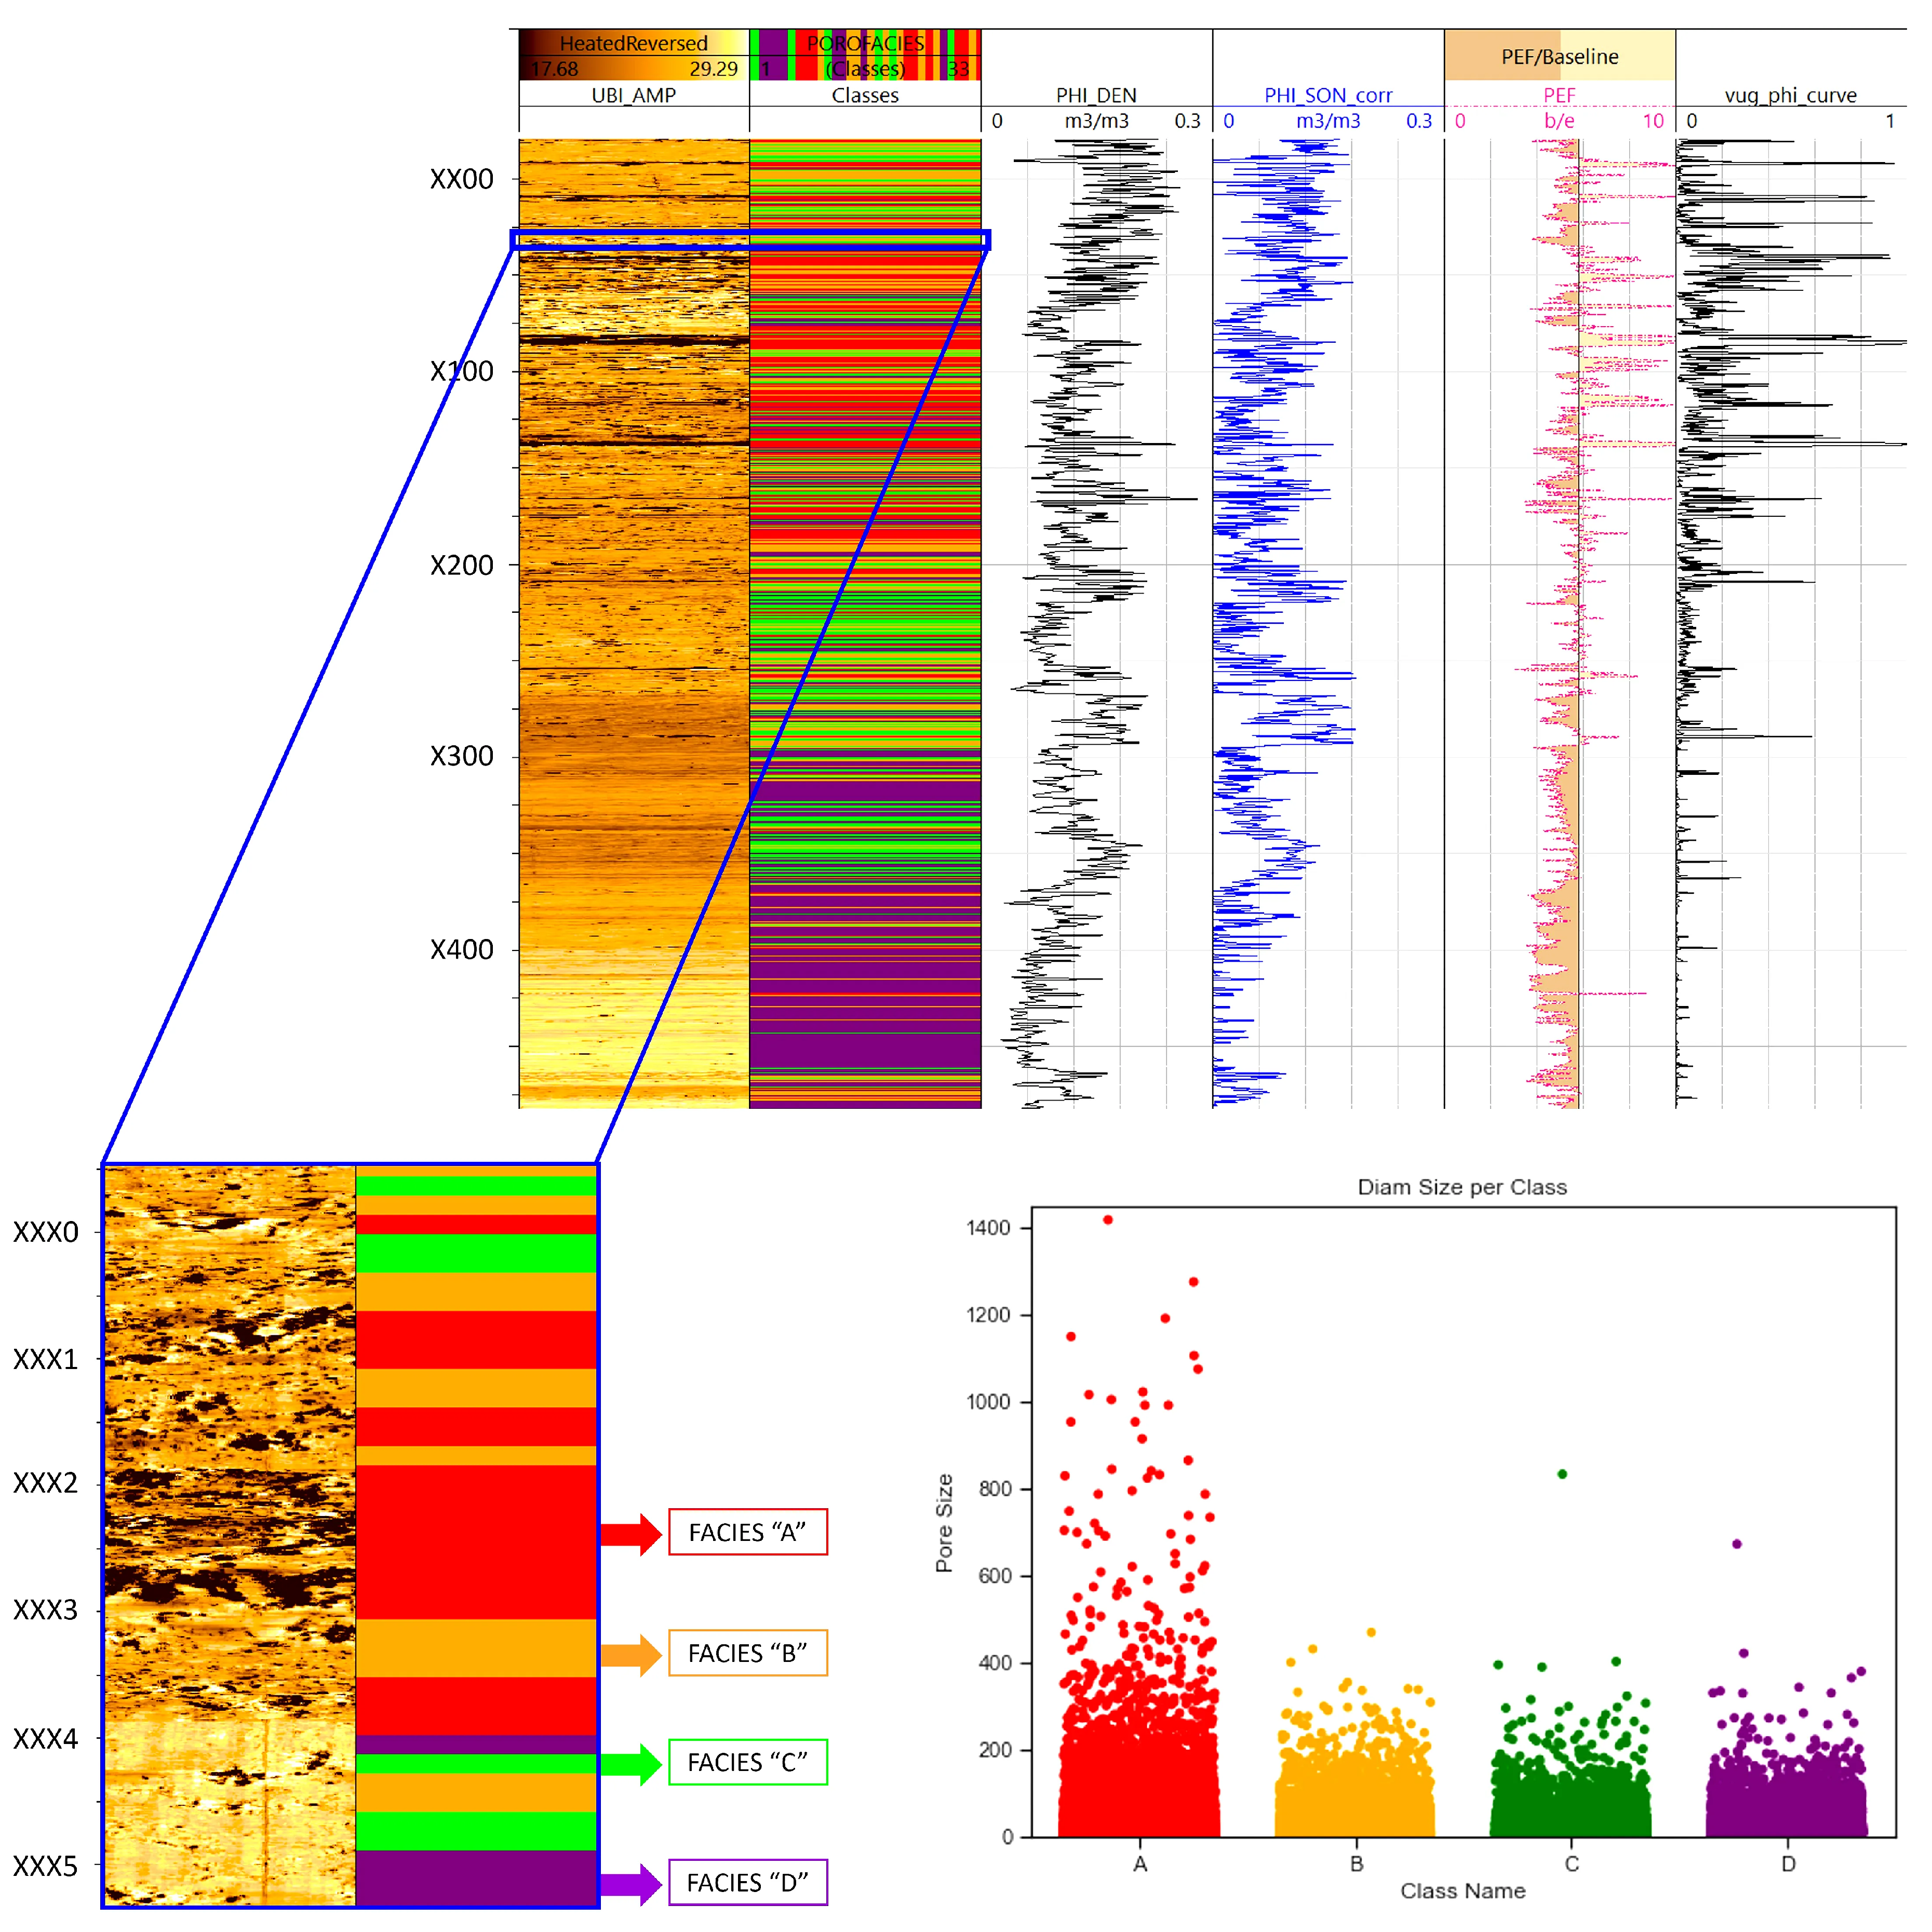
- Neural Network Training: Using four variables (Density, Sonic, , and ) to train a Neural Network, resulting in 32 classes regrouped into four facies based on porosities and non-matrix pore size.
- Facies Characterization: Facies A exhibits high non-matrix porosity, B displays medium non-matrix and matrix porosity, C shows medium to low non-matrix and matrix porosity, and D is characterized by low non-matrix and low matrix porosity.
- Correlation with Lithologies: Facies A correlates with shrubstone-like lithologies, B with rudstones-like lithologies, C with grainstones-like lithologies, and D with mudstone-like lithologies.
- Reservoir Quality Assessment: Facies A and B are identified as excellent-quality reservoirs with significant fluid storage and transport capacity, while C is considered good-quality, and D is categorized as poor-quality reservoir facies.
- Flow Behavior Implications: The study suggests that A and B facies exhibit superior fluid storage and transport capabilities compared to C and D facies.
- Reliability of the Proposed Methodology: The semi-automatic methodology proves to be a reliable means of preliminary facies classification based on porosity, considering the limitations of the available small database and individual data types.
Author Contributions
Acknowledgments
Conflicts of Interest
Abbreviations and Nomenclatures
| Nuclear Magnetic Resonance | |
| Ultrasonic Borehole Image | |
| String of Beads Response | |
| Borehole Image Logs | |
| Barra Velha Formation | |
| Self Organizing Map | |
| Potential of Hydrogen | |
| Magnesium | |
| Photoelectric Factor | |
| Circumferential Borehole Imaging | |
| Fractional Porosity of the rock | |
| v | Velocity of the formation |
| Velocity of interstitial fluids | |
| Velocity of the rock matrix | |
| Matrix porosity | |
| Acoustic transit time | |
| Acoustic transit time of interstitial fluids | |
| Acoustic transit time of the rock matrix | |
| t | Travel time |
| Travel time of interstitial fluids | |
| Travel time of the rock matrix | |
| Total porosity | |
| Matrix density | |
| Formation bulk density | |
| Fluid density | |
| D | Euclidean distance |
| I | Input vector |
| W | Weight vector |
| Modification of weight vector | |
| Neighborhood function | |
| c | Distance from the winning neuron |
| Neighborhood radius | |
| Machine learning | |
| Red, Green, Blue |
References
- Gardiner, N.J.; Roberts, J.J.; Johnson, G.; Smith, D.J.; Bond, C.E.; Knipe, R.; Haszeldine, S.; Gordon, S.; O’Donnell, M. Geosciences and the energy transition. Earth Science, Systems and Society 2023, 3, 10072. [Google Scholar] [CrossRef]
- Netto, P.R.; Pozo, M.; da Silva, M.D.; Gomes, M.E.B.; Mexias, A.; Ramnani, C.W.; Parizek-Silva, Y.; Borghi, L.; Rios-Netto, A.d.M. Paleoenvironmental implications of authigenic magnesian clay formation sequences in the Barra Velha Formation (Santos Basin, Brazil). Minerals 2022, 12, 200. [Google Scholar] [CrossRef]
- de Mello, V.L.; Lupinacci, W.M. Mineralogy based classification of carbonate rocks using elastic parameters: A case study from Buzios Field. Journal of Petroleum Science and Engineering 2022, 209, 109962. [Google Scholar] [CrossRef]
- Correa, R.; Pereira, C.; Cruz, F.; Lisboa, S.; Junior, M.; Souza, V.; Rocha, C.; Araujo, F.; de Carvalho, B.M. Integrated seismic-log-core-test fracture characterization and modelling, Barra Velha Formation, Pre-Salt of Santos Basin. 2019 AAPG Annual Convention and Exhibition:, 2019.
- Correia, M.G.; Maschio, C.; Schiozer, D.J. Integration of multiscale carbonate reservoir heterogeneities in reservoir simulation. Journal of petroleum science and engineering 2015, 131, 34–50. [Google Scholar] [CrossRef]
- Guan, C.; Zeng, L.; Yao, Y.; Zhang, H.; Zhang, J.; Liang, D. Natural Fractures and Their Contribution to Natural Gas Migration and Accumulation in Marine Carbonate Reservoirs: Lower Triassic Feixianguan Formation, Northeast Sichuan Basin, China. Sustainability 2023, 15, 16155. [Google Scholar] [CrossRef]
- Xu, C.; Di, B.; Wei, J. A physical modeling study of seismic features of karst cave reservoirs in the Tarim Basin, China. Geophysics 2016, 81, B31–B41. [Google Scholar] [CrossRef]
- Yu, J.; Li, Z.; Yang, L. Fault system impact on paleokarst distribution in the Ordovician Yingshan Formation in the central Tarim basin, northwest China. Marine and Petroleum Geology 2016, 71, 105–118. [Google Scholar] [CrossRef]
- Zhang, D. Production allocation method in numerical simulation for fractured vuggy reservoirs. Geoenergy Science and Engineering 2023, 226, 211735. [Google Scholar] [CrossRef]
- Liu, B.; Yasin, Q.; Sohail, G.M.; Chen, G.; Ismail, A.; Ma, Y.; Fu, X. Seismic characterization of fault and fractures in deep buried carbonate reservoirs using CNN-LSTM based deep neural networks. Geoenergy Science and Engineering 2023, 229, 212126. [Google Scholar] [CrossRef]
- Li, W.; Yue, D.; Colombera, L.; Duan, D.; Long, T.; Wu, S.; Liu, Y. A novel method for seismic-attribute optimization driven by forward modeling and machine learning in prediction of fluvial reservoirs. Geoenergy Science and Engineering 2023, 227, 211952. [Google Scholar] [CrossRef]
- Duarte, S.B.; De Jesus, C.M.; Da Silva, V.F.; Arouca Sobreira, M.C.; Cristofaro, R.A.L.; de Lima, L.; De Mello E Silva, F.G.; Marques De Sa, C.H.; De Oliveira Berto, F.M.; Backheuser, Y. ; others. Artificial Intelligence Use To Predict Severe Fluid Losses in Pre-Salt Carbonates. SPWLA Annual Logging Symposium. SPWLA, 2018, p. D043S008R002.
- Ek-Chacón, E.; Molino-Minero-Re, E.; Méndez-Monroy, P.E.; Neme, A.; Ángeles-Hernández, H. Semi-Supervised Training for (Pre-Stack) Seismic Data Analysis. Applied Sciences 2024, 14, 4175. [Google Scholar] [CrossRef]
- Li, J.; Xu, T.; Zhang, W.; Liu, H.; Kang, Y.; Lv, W. A borehole porosity prediction method with focusing on local shape. Geoenergy Science and Engineering 2023, 228, 211933. [Google Scholar] [CrossRef]
- Basso, M.; Souza, J.P.P.; Honório, B.C.Z.; Melani, L.H.; Chinelatto, G.F.; Belila, A.M.P.; Vidal, A.C. Acoustic image log facies and well log petrophysical evaluation of the Barra Velha Formation carbonate reservoir from the Santos Basin, offshore Brazil. Carbonates and Evaporites 2022, 37, 50. [Google Scholar] [CrossRef]
- Soares, M.V.T.; da, S. Bomfim, L.; Vidal, A.C.; Avansi, M.C.K.; Cunha, O.R.; García, R.G.V.; de Paiva Medeiros, R.S. Pre-salt carbonate cyclicity and depositional environment: NMR petrophysics and Markov cyclicity of lacustrine acoustic facies (Santos Basin, Brazil). Marine and Petroleum Geology 2023, 157, 106494. [Google Scholar] [CrossRef]
- Chen, W.; Yang, J.; Li, L.; Wang, H.; Huang, L.; Jia, Y.; Hu, Q.; Jiang, X.; Tang, J. Investigation of Mechanical Properties Evolution and Crack Initiation Mechanisms of Deep Carbonate Rocks Affected by Acid Erosion. Sustainability 2023, 15, 11807. [Google Scholar] [CrossRef]
- Zhou, X.; Wei, J.; Hadavimoghaddam, F.; Gayubov, A.; Ostadhassan, M.; Chen, Y.; Wang, Y.; Yang, B.; Pu, B.; Zhang, X.; others. “Double sweet spot” identification method via cluster analysis of petrophysical properties from well logg data: A case study of a tight sandstone reservoir. Geoenergy Science and Engineering 2023, 227, 211821. [Google Scholar] [CrossRef]
- Huang, F.; Huang, L.; Zhu, Z.; Zhang, M.; Zhang, W.; Jiang, X. A Logging Data Based Method for Evaluating the Fracability of a Gas Storage in Eastern China. Sustainability 2024, 16, 3165. [Google Scholar] [CrossRef]
- Aghli, G.; Moussavi-Harami, R.; Mortazavi, S.; Mohammadian, R. Evaluation of new method for estimation of fracture parameters using conventional petrophysical logs and ANFIS in the carbonate heterogeneous reservoirs. Journal of Petroleum Science and Engineering 2019, 172, 1092–1102. [Google Scholar] [CrossRef]
- Yasin, Q.; Ding, Y.; Baklouti, S.; Boateng, C.D.; Du, Q.; Golsanami, N. An integrated fracture parameter prediction and characterization method in deeply-buried carbonate reservoirs based on deep neural network. Journal of Petroleum Science and Engineering 2022, 208, 109346. [Google Scholar] [CrossRef]
- Zhao, W.; Liu, T.; Yang, J.; Zhang, Z.; Feng, C.; Tang, J. Approaches of Combining Machine Learning with NMR-Based Pore Structure Characterization for Reservoir Evaluation. Sustainability 2024, 16, 2774. [Google Scholar] [CrossRef]
- Xu, Z.; Lin, M.; Jiang, W.; Cao, G.; Yi, Z. Identifying the comprehensive pore structure characteristics of a rock from 3D images. Journal of Petroleum Science and Engineering 2020, 187, 106764. [Google Scholar] [CrossRef]
- Zhu, L.; Ma, Y.; Cai, J.; Zhang, C.; Wu, S.; Zhou, X. Key factors of marine shale conductivity in southern China—Part II: The influence of pore system and the development direction of shale gas saturation models. Journal of Petroleum Science and Engineering 2022, 209, 109516. [Google Scholar] [CrossRef]
- Zhu, B.; Meng, J.; Pan, R.; Song, C.; Zhu, Z.; Jin, J.; Zhang, C.; Liu, L.; Xu, L.; Zhou, X. Multi-scale characterization of organic matter pore space in deep marine shale combined with mathematical morphology. Geoenergy Science and Engineering 2023, 223, 211539. [Google Scholar] [CrossRef]
- Mahjour, S.K.; Santos, A.A.S.; Correia, M.G.; Schiozer, D.J. Scenario reduction methodologies under uncertainties for reservoir development purposes: distance-based clustering and metaheuristic algorithm. Journal of Petroleum Exploration and Production Technology 2021, 11, 3079–3102. [Google Scholar] [CrossRef]
- Gavidia, J.C.R.; Chinelatto, G.F.; Basso, M.; da Ponte Souza, J.P.; Soltanmohammadi, R.; Vidal, A.C.; Goldstein, R.H.; Mohammadizadeh, S. Utilizing integrated artificial intelligence for characterizing mineralogy and facies in a pre-salt carbonate reservoir, Santos Basin, Brazil, using cores, wireline logs, and multi-mineral petrophysical evaluation. Geoenergy Science and Engineering 2023, 231, 212303. [Google Scholar] [CrossRef]
- Zhao, L.; Zou, C.; Chen, Y.; Shen, W.; Wang, Y.; Chen, H.; Geng, J. Fluid and lithofacies prediction based on integration of well-log data and seismic inversion: A machine-learning approach. Geophysics 2021, 86, M151–M165. [Google Scholar] [CrossRef]
- Xing, Y.; Yang, H.; Yu, W. An approach for the classification of rock types using machine learning of core and log data. Sustainability 2023, 15, 8868. [Google Scholar] [CrossRef]
- Feng, J.; Wang, Q.; Li, M.; Li, X.; Zhou, K.; Tian, X.; Niu, J.; Yang, Z.; Zhang, Q.; Sun, M. Pore Pressure Prediction for High-Pressure Tight Sandstone in the Huizhou Sag, Pearl River Mouth Basin, China: A Machine Learning-Based Approach. Journal of Marine Science and Engineering 2024, 12, 703. [Google Scholar] [CrossRef]
- Gu, Y.; Li, Y.; Yang, Y.; Xiao, B.; Zhang, D.; Bao, Z. Classification pattern of lacustrine carbonate diagenetic facies and logging-based data-driven prediction via a generalized and robust ensemble learning: A demonstration of pre-salt profile, santos basin. Geoenergy Science and Engineering 2023, 223, 211543. [Google Scholar] [CrossRef]
- Junior, A.N.; Queiroz, G.N.; Godoy, M.G.; da Silva Cardoso, V.; Cedrola, S.M.L.; Mansoldo, F.R.P.; Firpo, R.M.; Paiva, L.M.G.; Sohrabi, M.; Vermelho, A.B. Assessing EOR strategies for application in Brazilian pre-salt reservoirs. Geoenergy Science and Engineering 2023, 211508. [Google Scholar] [CrossRef]
- Moreira, J.L.P.; Madeira, C.V.; Gil, J.A.; Machado, M.A.P.; others. bacia de Santos. Boletim de Geociencias da PETROBRAS 2007, 15, 531–549. [Google Scholar]
- Mohriak, W.; Nemčok, M.; Enciso, G. South Atlantic divergent margin evolution: rift-border uplift and salt tectonics in the basins of SE Brazil. Geological Society, London, Special Publications 2008, 294, 365–398. [Google Scholar] [CrossRef]
- Gomes, J.; Bunevich, R.; Tedeschi, L.; Tucker, M.; Whitaker, F. Facies classification and patterns of lacustrine carbonate deposition of the Barra Velha Formation, Santos Basin, Brazilian Pre-salt. Marine and Petroleum Geology 2020, 113, 104176. [Google Scholar] [CrossRef]
- Wright, V.P.; Barnett, A. Critically evaluating the current depositional models for the pre-salt Barra Velha Formation, Offshore Brazil. AAPG Search and Discovery, Article 2017, 51439. [Google Scholar]
- Tosca, N.J.; Wright, V.P. Diagenetic pathways linked to labile Mg-clays in lacustrine carbonate reservoirs: a model for the origin of secondary porosity in the Cretaceous pre-salt Barra Velha Formation, offshore Brazil. Geological Society, London, Special Publications 2018, 435, 33–46. [Google Scholar] [CrossRef]
- Poros, Z.; Jagniecki, E.; Luczaj, J.; Kenter, J.; Gal, B.; Correa, T.S.; Ferreira, E.; McFadden, K.A.; Elifritz, A.; Heumann, M. ; others. Origin of Silica in Pre-Salt Carbonates, Kwanza Basin, Angola. https://www.searchanddiscovery.com/pdfz/documents/2017/51413poros/ndx_poros.pdf.html, 2017. Accessed: December 11, 2023. 11 December.
- Wright, V.P.; Barnett, A.J. An abiotic model for the development of textures in some South Atlantic early Cretaceous lacustrine carbonates. Geological Society, London, Special Publications 2015, 418, 209–219. [Google Scholar] [CrossRef]
- Minzoni, M.; Cantelli, A.; Thornton, J.; Wignall, B. Seismic-scale geometries and sequence-stratigraphic architecture of Early Cretaceous syn-post rift carbonate systems, Presalt Section, Brazil. In Seismic Characterization of Carbonate Platforms and Reservoirs; Geological Society, London, Special Publications, 2021; pp. 105–126. [CrossRef]
- Pickell, J.J.; Heacock, J.G. Density logging. Geophysics 1960, 25, 891–904. [Google Scholar] [CrossRef]
- Bjorlykke, K. Petroleum geoscience: From sedimentary environments to rock physics; Springer Science & Business Media, 2010.
- Asquith, G.B.; Krygowski, D.; Gibson, C.R. Basic well log analysis; Vol. 16, American Association of Petroleum Geologists Tulsa, 2004. [CrossRef]
- Serra, O.; Serra, L. Well Logging. Data Acquisitions and Applications, 2004.
- Schlumberger. UBI: advanced borehole imaging independent of mud type. https://www.slb.com/products-and-services/innovating-in-oil-and-gas/reservoir-characterization/surface-and-downhole-logging/wireline-openhole-logging/ultrasonic-borehole-imager. Accessed: December 7, 2023.
- Shahinpour, A. Borehole image log analysis for sedimentary environment and clay volume interpretation. Master’s thesis, Institutt for petroleumsteknologi og anvendt geofysikk, 2013.
- Nian, T.; Wang, G.; Xiao, C.; Zhou, L.; Deng, L.; Li, R. The in situ stress determination from borehole image logs in the Kuqa Depression. Journal of Natural Gas Science and Engineering 2016, 34, 1077–1084. [Google Scholar] [CrossRef]
- Zhou, Z.; Wang, W.; Liu, Y. Mathematical model of artificial fracture reinitiation in vugs of carbonate reservoirs. Geoenergy Science and Engineering 2023, 221, 211366. [Google Scholar] [CrossRef]
- Wyllie, M.R.J.; Gregory, A.R.; Gardner, L.W. Elastic wave velocities in heterogeneous and porous media. Geophysics 1956, 21, 41–70. [Google Scholar] [CrossRef]
- Choquette, P.W.; Pray, L.C. Geologic nomenclature and classification of porosity in sedimentary carbonates. AAPG bulletin 1970, 54, 207–250. [Google Scholar] [CrossRef]
- de Jesus, C.M.; Compan, A.L.M.; Coêlho, J.R.P.; de Sá Silveira, A.E.; Blauth, M. Evaluation of Karst Porosity Morphological Properties through Borehole Image Logs–Correlation with Dynamic Reservoir Properties from a presalt Oil Field. Offshore Technology Conference Brasil. OTC, 2019, p. D021S026R002. [CrossRef]
- Bomfim, L.D.S.; Pedrini, H.; Vidal, A.C. A Combined Noisy Borehole Image Log Segmentation Method. 2023 30th International Conference on Systems, Signals and Image Processing (IWSSIP). IEEE, 2023, pp. 1–5.
- Jia, M.; Huang, W.; Li, Y. Quantitative Characterization of Pore Structure Parameters in Coal Based on Image Processing and SEM Technology. Energies 2023, 16, 1663. [Google Scholar] [CrossRef]
- de Jesus, C.M.; Martins Compan, A.L.; Surmas, R. Permeability estimation using ultrasonic borehole image logs in dual-porosity carbonate reservoirs. Petrophysics 2016, 57, 620–637. [Google Scholar]
- Mohammadizadeh, S.; Moghaddam, M.A.; Talebbeydokhti, N. Analysis of flow in porous media using combined pressurized-free surface network. Journal of Porous Media 2021, 24. [Google Scholar] [CrossRef]
- Malki, M.L.; Saberi, M.R.; Kolawole, O.; Rasouli, V.; Sennaoui, B.; Ozotta, O. Underlying mechanisms and controlling factors of carbonate reservoir characterization from rock physics perspective: A comprehensive review. Geoenergy Science and Engineering 2023, 226, 211793. [Google Scholar] [CrossRef]
- Zhao, X.; Chen, X.; Lan, Z.; Wang, X.; Yao, G. Pore pressure prediction assisted by machine learning models combined with interpretations: A case study of an HTHP gas field, Yinggehai Basin. Geoenergy Science and Engineering 2023, 229, 212114. [Google Scholar] [CrossRef]
- Mahjour, S.K.; Soltanmohammadi, R.; Heidaryan, E.; Faroughi, S.A. Geosystems risk and uncertainty: The application of ChatGPT with targeted prompting. Geoenergy Science and Engineering, 2024; 212889. [Google Scholar] [CrossRef]
- Guo, J.; Luo, Y.; Zeng, F.; Wang, R.; Yuan, C.; He, L.; Lu, C. Reconstruction of missing shear wave slowness in shale gas reservoir based on deep learning algorithm. Geoenergy Science and Engineering 2023, 227, 211865. [Google Scholar] [CrossRef]
- Kohonen, T. Self-Organizing Maps; Springer Berlin, Heidelberg, 2001. [CrossRef]
- Lofts, J.; Bourke, L. The recognition of artefacts from acoustic and resistivity borehole imaging devices. Geological Society, London, Special Publications 1999, 159, 59–76. [Google Scholar] [CrossRef]
- Zhang, Z.; Han, W.; Steinsiek, R.; Patterson, D. Ultrasonic signal noise reduction processing in borehole imaging application. 2016 IEEE International Frequency Control Symposium (IFCS). IEEE, 2016, pp. 1–6. [CrossRef]
- Aguilera, R. Analysis of naturally fractured reservoirs from conventional well logs (includes associated papers 6420 and 6421). Journal of petroleum technology 1976, 28, 764–772. [Google Scholar] [CrossRef]
- Wu, X.; Su, Y.; Zhang, C.; Xin, Y.; Chen, X.; Li, N.; Huang, R.; Tang, B.; Zhao, X. A novel evaluation method of dolomite reservoir using electrical image logs: The Cambrian dolomites in Tarim Basin, China. Geoenergy Science and Engineering 2024, 233, 212509. [Google Scholar] [CrossRef]
- Lai, J.; Bai, T.; Zhao, Y.; Xiao, L.; He, Z.; Wang, C.; Wang, G.; Qin, Z. Unusually petrophysical behavior and geological significance of mudrocks. Geoenergy Science and Engineering 2023, 230, 212171. [Google Scholar] [CrossRef]
- Fernández-Ibáñez, F.; Jones, G.D.; Mimoun, J.G.; Bowen, M.G.; Simo, J.; Marcon, V.; Esch, W.L. Excess permeability in the Brazil pre-Salt: Nonmatrix types, concepts, diagnostic indicators, and reservoir implications. AAPG Bulletin 2022, 106, 701–738. [Google Scholar] [CrossRef]
- Li, Z.; Fan, C.; Sun, B.; Han, X.; Hui, X.; Deng, X.; Wang, A.; Wang, G. Characteristics, logging identification and major controlling factors of bedding-parallel fractures in tight sandstones. Geoenergy Science and Engineering 2023, 228, 211956. [Google Scholar] [CrossRef]
- Hasan, M.L.; M. Tóth, T. Localization of potential migration pathways inside a fractured metamorphic hydrocarbon reservoir using well log evaluation (Mezősas field, Pannonian Basin). Geoenergy Science and Engineering 2023, 225, 211710. [Google Scholar] [CrossRef]
- Tamoto, H.; dos Santos Gioria, R.; de Carvalho Carneiro, C. Prediction of nuclear magnetic resonance porosity well-logs in a carbonate reservoir using supervised machine learning models. Journal of Petroleum Science and Engineering 2023, 220, 111169. [Google Scholar] [CrossRef]
- Muniz, M.; Bosence, D. Lacustrine carbonate platforms: facies, cycles, and tectonosedimentary models for the presalt Lagoa Feia Group (Lower Cretaceous), Campos Basin, Brazil. AAPG Bulletin 2018, 102, 2569–2597. [Google Scholar] [CrossRef]

| Parameter | Condition | value |
|---|---|---|
| Topology shape | 2D rectangular sheet map | |
| Map lattice | Hexagonal | |
| Normalization | Normalized variance to unity, and its mean to zero | |
| Algorithm | Initialized | Batch |
| Alpha | Always | Decreasing |
| Neighborhood | Always | Gaussian |
| Initial Alpha | Rough training phase | 0.5 |
| Final Alpha | Fine tuning phase | 0.05 |
| Initial Radius | Initialized randomly | Max (side length map)/4 |
| Initial Radius | Rough training phase | Max (1, (initial value)/4) |
| Final Radius | Fine tuning phase | 1 |
| Number of iterations | Rough training phase | 4 m/n 1 |
| Number of iterations | Fine tuning phase | 16 m/n |
| Well log | Type of porosity |
|---|---|
| Density | Total porosity |
| Sonic | Matrix porosity |
| Photoelectric factor | Non-matrix porosity |
| Difference between density and sonic | Non-matrix porosity |
| Quantity of pores | ||||
|---|---|---|---|---|
| Facies A | Facies B | Facies C | Facies D | |
| Gigapores | 271 (1.34%) | 33 (0.29%) | 20 (0.20%) | 19 (0.16%) |
| Large megapores | 5419 (26.76%) | 2642 (23.29%) | 2132 (21.53%) | 2346 (20.02%) |
| Small megapores | 14560 (71.90%) | 8669 (76.42%) | 7749 (78.27%) | 9355 (79.82%) |
| Large mesopores | non-detected | non-detected | non-detected | non-detected |
| Small mesopores | non-detected | non-detected | non-detected | non-detected |
| Micropores | non-detected | non-detected | non-detected | non-detected |
| TOTAL | 20250 | 11344 | 9901 | 11720 |
| [15] | [16] | ||
| Lithology | Visual Porosity | Lithology | Visual Porosity |
| Shrubstones | High | Shrubstone-like | High |
| Grainstones and rudstones | Medium | Rudstones-like | High/Low |
| Partially silicified shrubby | Medium | Grainstones-like | Medium |
| Spherulite packstones/dolomudstones | Low | Mudstone-like | Low |
| Current Study | |||
| Posible Lithology | Non-Matrix Porosity | Porosity-facies | |
| Shrubstone | High | A | |
| Rudstones | Medium | B | |
| Grainstones | Low | C | |
| Mudstone | Low | D | |
Disclaimer/Publisher’s Note: The statements, opinions and data contained in all publications are solely those of the individual author(s) and contributor(s) and not of MDPI and/or the editor(s). MDPI and/or the editor(s) disclaim responsibility for any injury to people or property resulting from any ideas, methods, instructions or products referred to in the content. |
© 2024 by the authors. Licensee MDPI, Basel, Switzerland. This article is an open access article distributed under the terms and conditions of the Creative Commons Attribution (CC BY) license (http://creativecommons.org/licenses/by/4.0/).


