Submitted:
12 June 2024
Posted:
13 June 2024
You are already at the latest version
Abstract
Despite the recommendation to treat depression using the transcranial direct current stimulation (tDCS), novel findings raised doubts over the tDCS efficacy in managing depressive episodes. Neurophysiologic approaches to understand the specificities of brain responses to tDCS in de-pressed patients remains a feature. Objective: to compare the immediate hemodynamic responses to tDCS on left dorsolateral pre-frontal cortex (DLPFC; F3-Fp2 montage) in patients with depres-sive disorder and healthy controls (no additional stimuli). Methods: Sixteen participants were al-located in depression group and 16 in the control group. Both groups received 2mA tDCS for 20 minutes, using the F3-Fp2 montage. The hemodynamic effect over the DLPFC was assessed using near-infrared intracranial spectroscopy (NIRS) positioned on the left supraorbital region (Fp1). Mean, minimal and maximal values of baseline and post-stimulation rates of oxygen saturation (SatO2) were recorded. The oxygenated hemoglobin rates (HbO) were extracted. Results: Be-tween-group differences were detected for mean and minimal baseline rates of SatO2 and HbO levels. The depression group showed lower results compared to the control group. After the pro-tocol, only the depression group showed increased mean and minimal rates of SatO2 and HbO. The post-tDCS rates were equal for both groups. Conclusion: The findings showed immediate anodal tDCS effects over DLPFC hemodynamics. The effects were exclusive for the lowest base-line rates group, not affecting the normal oxygen rates group. The minimal increase of SatO2 and HbO rates after the protocol in the depression group suggests that those with reduced cerebral perfusion may be more affected by tDCS.
Keywords:
Near-infrared spectroscopy
; oxyhemoglobin
; oxygen saturation
1. Introduction
The latest evidence-based guideline for the use of tDCS in neurological and psychiatric disorders recommend the anodal left dorsolateral pre-frontal cortex stimulation with tDCS as definitely effective to treat depression [1]. Another network meta-analysis showed anodal tDCS over frontal lobe (F3-F4 montage) significantly improving depressive symptoms compared to sham controls with higher response rates than other types of non-invasive brain stimulation [2]. However, novel findings of 2 large-sample randomized controlled studies raised doubts over the tDCS efficacy [3,4]. They used unsupervised home-use tDCS alone or combined with a digital psychological intervention or digital placebo. Both studies found that tDCS was not superior to sham to manage major depressive episodes. Those findings are in line with other reviews, arguing that the effectiveness of tDCS on treatment-resistant depression is limited [5,6]. Some possible explanations for those conflicting results may be the inadequacy of dose-response, the sample anatomy’s variability in terms of individual vascular complexity, or even the high heterogeneity among interventions and assessment protocols used on distinct studies. As consensus was not yet achieved, the mechanistic and neurophysiologic approach to understand specificities of brain responses to tDCS stimuli in depressed patients compared to healthy controls continue to stand as a key feature for continuous basic and clinical research.
The effects of tDCS over the cortical neurovascular tissue are beyond the implements on neuronal activity [7]. Instead, there are evidence that tDCS neurovascular modulation targets the entire tissue: neurons, glia, endothelial cells, and the extracellular processes involved in brain transport, such as changes in viscosity accompanied by changes on the osmotic flow [8,9]. The complex interaction among those factors would provoke specific responses in each person, mainly driven by the subject’s baseline characteristics or even by the type of disorder affecting the neural system [10].
Neurovascular modulation is a wide-discussed topic concerning cortical response to tDCS in depressed patients [8]. Marked abnormalities were found in depressed patients compared to healthy controls, mainly in blood oxygen rates of the bilateral ventrolateral prefrontal cortex and bilateral dorsolateral prefrontal cortex (DLPFC) [11]. As those patients exhibit dysregulated cerebral blood flow 12 – which is a major and distinctive pattern compared to healthy people, the hemodynamic balance would be essential to provide tissue homeostasis followed by disease-associated behavioral improvements.
Functional near-infrared spectroscopy (fNIRS) is a noninvasive optical imaging technique that relies on the difference in the absorption of NIR light between oxyhemoglobin (HbO) and deoxyhemoglobin (HbR) [13]. The technique quantifies the hemoglobin concentration changes using variations in the absorbed light intensity measured by emitting continuous wave light through the skull into the brain [11,14]. The fNIRS has been proposed as a less expensive alternative over the fMRI to assess brain blood flow [13]. However, the fNIRS has been usually used in combination to cognitive or motor tasks in order to activate specific cortical regions of interest, not isolating the tDCS effect itself. Other approaches to clarify the tDCS effects on brain hemodynamics in disorder and healthy people would allow clearer clinical perspectives at tDCS usefulness in depressed patients.
Thus, the primary aim of the present study was to compare the immediate differences in response to applying tDCS over the left DLPFC (F3-Fp2 montage) in patients with depressive disorder and healthy controls with no additional stimuli. Secondarily, the current study aimed to compare the between-group baseline differences on both depressed and healthy people.
2. Materials and Methods
2.1. Participants
Thirty-two participants of both sexes were enrolled in this study. A two-tailed a priori sample calculation was performed with an α level of 0.05, an expected power (1-β) of 0.80, and an effect size of 0.6618, obtained from a previous study [15]. Considering a potential sample loss of 30%, the final sample was divided into 2 groups: the depression group (n=16) and the control group (n=16) – both receiving the tDCS. Figure 1 show the flow-chart. The participants provided their informed consent to participate in the study, conducted in accordance with the Declaration of Helsinki and approved by the Ethics Committee of the Federal University of Juiz de Fora (number 67611823.0.0000.5147). The trial was registered in the Brazilian clinical trials registry (number RBR-42xvqrz). Inclusion criteria were as follows: for the depression group, participants had to be aged between 18 and 45 years, a diagnosis of mild to moderate depressive disorder reported by a psychiatrist and/or psychologist. For the control group, the participants had to be between 18 and 45 years old, with no symptoms or diagnosis of any neuropsychiatric or neurological disorders. Exclusion criteria were set as follows: participants with epilepsy, those using anticonvulsant medication and/or experiencing sleep deprivation, patients with metallic implants inside or near the head (e.g., cochlear implant, implanted/stimulator electrodes, aneurysm clips or coils, projectile fragments, jewelry, and hair clips), patients with cardiac pacemakers, stents, or other active devices in which the interaction with the electric field may interfere with their functioning, and patients with eczema on the head.
Participants were randomized in 2 groups, as previously described. The randomization sequence was generated using the website http://www.randomizer.org, considering an input of 2 groups, 32 individuals, and setting the uniqueness of each position in the randomization ranking. The allocation concealment was maintained by informing the therapist of the participant’s group assignment only after their enrollment in the study. All participants were assessed to determine their adherence to inclusion and exclusion criteria. Personal information and contacts were also collected during the anamnesis process.
2.2. Transcranial Direct Current Stimulation (tDCS)
The tDCS was performed using a continuous current of 2 mA, delivered for 20 minutes through two rubber electrodes wrapped in a saline solution-soaked sponge (5 cm × 7 cm = 35 cm2 each) to improve contact between the electrodes and the scalp. The positioning of the electrodes followed the 10–20 EEG coordinates system. The anode was positioned over the left DLPFC (F3) and the cathode was positioned over the right supraorbital region (Fp2). A 30-s ramp-up started the current until the 2 mA target was achieved. The current remained constant for 20 minutes, and then gradually faded to 0 mA with 30 s ramp-down.
2.3. NIRS Recording
The effect of tDCS upon brain cortical activity was assessed using a near-infrared intracranial spectroscopy (NIRS) system (Humon Hex, Dynometrics Inc., Boston, MA, EUA). This is a 60.5 x 57 x 13.8 mm device weighting ~32 g that wirelessly connects through Bluetooth to a smartphone (Humon Hex, Dynometrics Inc., Boston, MA, EUA, retrieved from http://humon.io) and it shows the automatically calculated and real-time O2 saturation level in percentage (SatO2). The equipment has infrared light emitters and sensors that capture the differences in the spectrum between oxyhemoglobin (HbO) and deoxyhemoglobin (HbR), as they have different levels of light absorption. Previous studies have demonstrated that HbO concentration changes are more sensitive than other Hb concentration changes in reflecting alterations in regional cerebral blood flow [16,17.] Thus, HbO concentration was chosen as the main outcome for hemodynamic changes. The raw data obtained by the Humon sensor were extracted and the averages of the baseline and post-stimulation periods were calculated.
2.4. Experimental Testing
The NIRS sensor was positioned on the left supraorbital region (Fp1), and the electrodes were placed in the F3 (anode) and Fp2 (cathode) regions, fastened with a headband for the tDCS intervention. The NIRS sensor was then activated, and the SatO2 baseline was recorded. After 2 minutes, tDCS was applied for 20 minutes. Following the intervention, the tDCS was switched off while the SatO2 levels were continuously monitored for additional 2 minutes (post-stimulation period).
2.5. Statistical Analysis
Data were presented as mean and standard deviation. The average, minimal and maximal rates of the oxygen saturation (SatO2) and oxyhemoglobin (HbO) from pre- and post-tDCS intervals were analyzed. The Shapiro-Wilk and the Levene’s tests were used to respectively assess the normality and the homogeneity. As data was normally distributed, within-group differences between pre- and post-tDCS were assessed using the Student’s paired t-test. Also, the independent samples t-test was used to evaluate between-group differences. The standardized differences for the comparisons of all variables were obtained using the Cohen’s d effect sizes (ES). The magnitude of ES was qualitatively interpreted using the following thresholds: <0.2, trivial; 0.2–0.6, small; 0.6–1.2, moderate; 1.2–2.0, large; 2.0–4.0, very large; >4.0, nearly perfect 18. The JAMOVI software (JAMOVI project [2020]. Version 2.4.11) was used for all testing analysis. The significance level was set at p < 0.05.
3. Results
3.1. Oxygen Saturation (SatO2)
Table 2 summarizes the SatO2 results. The control group showed higher SatO2 mean and minimum rates compared to depression group prior to tDCS protocol, with moderate ES of 0.95 and 0.94, respectively. However, no between-group differences were noted after the tDCS. The maximal rate of SatO2 did not differ before nor after the tDCS. Considering the time effect, the mean and minimum rates of SatO2 were higher for the depression group right after the tDCS protocol when compared to baseline, with respectively small (0.54) and trivial (0.17) ES. No significant time changes were observed for the control group in any variable. No time effect was observed for the maximal rate of SatO2 in any group.
3.1. Oxyhemoglobin (HbO)
The HbO results are presented on Table 3. Conversely to SatO2, the control group had higher levels of mean and minimal HbO compared to the depression group at baseline, both variables showing respectively moderate ES of 0.95 and 0.97. However, both groups showed the same levels of HbO after tDCS, as no differences were detected in any variable.
Time effect was also a feature. The depression group showed higher levels of mean and minimal HbO after tDCS, with respectively small (0.56) and moderate (0.85) ES. The control group showed no within-group differences, as the HbO levels did not change after tDCS for any variable. The maximal levels of HbO were also the same for both groups in any time point.
4. Discussion
The present findings confirm the previously postulated hypothesis, as the depression group was the single group affected by the tDCS protocol, suggesting that the participants’ baseline characteristics would drive the cortical hemodynamic response to tDCS. The baseline mean and minimum rates of SatO2, along with the mean and minimum HbO values were significantly lower in the depression group compared to the control group. Additionally, after the protocol, only the depression group showed increased levels of mean and minimal SatO2 and HbO, while the control group SatO2 and HbO responses remained unchanged during the intervention.
The present study reinforces the idea that anodal stimulation may increase the cortex hemodynamic response. A fMRI-based study showed that a range of anodal intensities applied over the primary motor cortex increased the cerebral blood flow under the electrode, with 2-mA increasing the greatest (15.3%) compared to sham [19]. In fact, pre-clinical studies have already shown both vasodilation and increased blood flow could be the primary responses of the vessels to tDCS [14,20]. The increase of the neuronal resting membrane potentials would be then a secondary response, along with the increased likelihood of neurons depolarization. In turn, the increased neuronal activity would also require some neurovascular coupling adaptations mediated by brain perfusion [21].
Contradictory to present findings, a NIRS-based study of local cerebral oxygenation during tDCS in patients with mild traumatic brain injury found that tDCS lead to a decrease in the local brain oxygenation values on the anodal side between 8 and 12 min in 3-5 days post-injury [22]. Conversely, another study showed that anodal tDCS did not elicit any consistent instantaneous dose-dependent cerebral blood flow increases in the specific targeted hand primary motor cortex at conventional intensity ranges [23]. In the other hand, a study showed tDCS positive effects over depressed people with cerebral vascular impairments compared to sham controls [24]. This particular type of depression is often less responsive to drug treatment. The results showed that 58% of inpatients achieved remission when receiving 2 daily sessions of tDCS. The same group had a response rate of 68% whereas the sham group had no response at all. Conversely, a systematic review with meta-analysis showed improved cognitive performance and increased HbO in response to tDCS intervention [25], although some potential confounders had to be pointed, as the moderate heterogeneity for HbO responses and the large variation of the tasks to assess cognitive performance. Another study applied the tDCS 1-mA bilaterally on the prefrontal cortex (anode left on Fp1 and cathode right on Fp2) [26]. The results showed a peak of HbO in the bilateral prefrontal region 4 min after the end of stimulation, and before returning to baseline levels. The effect was more pronounced under the left anode when 15 min of stimulation was preferred over 10 min.
The present baseline hemodynamic response of depressed group showed lower levels of SatO2 and HbO compared to healthy controls, suggesting that depressed people have marked abnormalities of the prefrontal cortex oxygenation. A recent case-control meta-analysis and meta-regression showed decreased cerebral blood flow in the inferior frontal gyrus, insula, middle occipital gyrus and bilateral superior temporal gyrus in all patients with major depressive disorder [27]. Another study compared healthy controls with no prior history of psychiatric disorder to a database of SPECT scans of suicidal patients, all diagnosed with major depressive disorder [28]. The results showed hypoperfusion bilaterally in the superior/medial prefrontal cortex in the cohort of completed suicides compared to controls. Depression was considered a strong comorbid factor, with potential deficits in tasks associated with this region including attention, memory, and executive function. Finally, in accordance to the present findings, another previous study has shown the abnormal resting state of corticolimbic blood flow in depressed unmedicated patients [28]. In this particular cited study, the resting blood flow in depressed patients was correlated with the severity of depression based on the Hamilton’s scale scores.
Some limitations must be addressed. The present study was designed to produce immediate results in a specific cohort of patients and healthy controls. Distinct baseline characteristics, such as level of impairment, age, and sex distribution may alter the observed outcomes. The findings are restricted to the assessed prefrontal area. Thus, other interactions among cortical areas were not considered to discuss the results. The electrode positioning was the same for all patients. The 10-20 system was the only adopted setting to account for skull variability. Procedures as neuro navigation or computational modelling were not available in the laboratory’s facilities. Finally, the conventional tDCS was chosen for this study due to its wider availability in clinical settings. Other devices and montages, as HD-tDCS or individualized HD-tDCS may produce different results.
5. Conclusions
The current findings highlight the anodal tDCS immediate effect when applied on the DLPFC. The implements of the minimal HbO rate right after the protocol only for the depressed group suggest that people with decreased perfusion may be selectively more affected than those without impaired brain hemodynamics.
Author Contributions
writing—original draft preparation, L.O.C., M.C.M., V.K.V.M., K.R.R.F., M.E.C.S., A.F.E., A.L.G.A., G.L.G, A.C.B..; writing—review and editing, L.O.C.; visualization, L.O.C.; supervision, A.C.B.; methodology, L.O.C., M.C.G.S.M., V.K.V.M., K.R.R.F., M.E.C.S., A.L.G.A., G.L.G; data curation, V.K.V.M., A.F.E. All authors have read and agreed to the published version of the manuscript.
Funding
This study was supported in part by the Coordenação de Aperfeiçoamento de Pessoal deNível Superior—Brasil (CAPES)—Finance Code 001 and by the Fundação de Amparo à Pesquisade Minas Gerais (FAPEMIG). This research was funded by the Federal University of Juiz de Fora.
Institutional Review Board Statement
The study was conducted in accordance with the Declaration of Helsinki, and approved by Ethics Committee of the Federal University of Juiz de For a on 12 April 2023 (protocol code 67611823.0.0000.5147). The trial was registered in the Brazilian clinical trials registry (number RBR-42xvqrz).
Informed Consent Statement
Informed consent was obtained from all subjects involved in the study.
Data Availability Statement
The data presented in this study are openly available in: Barbosa, Alexandre (2024), “Does tDCS selectively modulate the pre-frontal cortex hemo-dynamics? An immediate effect-controlled trial on depressed and healthy people”, Mendeley Data, V1, doi: 10.17632/vgpm3sx7pz.1
Conflicts of Interest
The authors declare no conflicts of interest.
References
- Fregni F, El-Hagrassy MM, Pacheco-Barrios K, et al. Evidence-Based Guidelines and Secondary Meta-Analysis for the Use of Transcranial Direct Current Stimulation in Neurological and Psychiatric Disorders. International Journal of Neuropsychopharmacology. 2021;24(4):256-313. [CrossRef]
- Hsu CW, Chou PH, Brunoni AR, et al. Comparing different non-invasive brain stimulation interventions for bipolar depression treatment: A network meta-analysis of randomized controlled trials. Neurosci Biobehav Rev. 2024;156(September 2023):105483. [CrossRef]
- Borrione L, Cavendish BA, Aparicio LVM, et al. Home-Use Transcranial Direct Current Stimulation for the Treatment of a Major Depressive Episode. JAMA Psychiatry. Published online January 3, 2024. [CrossRef]
- Kim J, Park S, Kim H, Roh D, Kim DH. Home-based, Remotely Supervised, 6-Week tDCS in Patients With Both MCI and Depression: A Randomized Double-Blind Placebo-Controlled Trial. Clin EEG Neurosci. Published online December 17, 2023. [CrossRef]
- Meron D, Hedger N, Garner M, Baldwin DS. Transcranial direct current stimulation (tDCS) in the treatment of depression: Systematic review and meta-analysis of efficacy and tolerability. Neurosci Biobehav Rev. 2015;57:46-62. [CrossRef]
- Palm U, Hasan A, Strube W, Padberg F. tDCS for the treatment of depression: a comprehensive review. Eur Arch Psychiatry Clin Neurosci. 2016;266(8):681-694. [CrossRef]
- Khadka N, Bikson M. Neurocapillary-Modulation. Neuromodulation: Technology at the Neural Interface. 2022;25(8):1299-1311. [CrossRef]
- Bikson M. Transcranial direct current stimulation and neurovascular modulation. Eur J Neurol. 2023;30(4):802-803. [CrossRef]
- Gellner A, Frase S, Reis J, Fritsch B. Direct current stimulation increases blood flow and permeability of cortical microvasculature in vivo. Eur J Neurol. 2023;30(2):362-371. [CrossRef]
- Yang D, Shin YI, Hong KS. Systemic Review on Transcranial Electrical Stimulation Parameters and EEG/fNIRS Features for Brain Diseases. Front Neurosci. 2021;15. [CrossRef]
- Chao J, Zheng S, Wu H, et al. fNIRS Evidence for Distinguishing Patients With Major Depression and Healthy Controls. IEEE Transactions on Neural Systems and Rehabilitation Engineering. 2021;29:2211-2221. [CrossRef]
- Kang L, Wang W, Nie Z, et al. Dysregulated cerebral blood flow, rather than gray matter Volume, exhibits stronger correlations with blood inflammatory and lipid markers in depression. Neuroimage Clin. 2024;41(January):103581. [CrossRef]
- Lu H, Zhang Y, Qiu H, et al. A new perspective for evaluating the efficacy of tACS and tDCS in improving executive functions: A combined tES and fNIRS study. Hum Brain Mapp. 2024;45(1):1-14. [CrossRef]
- Wachter D, Wrede A, Schulz-Schaeffer W, et al. Transcranial direct current stimulation induces polarity-specific changes of cortical blood perfusion in the rat. Exp Neurol. 2011;227(2):322-327. [CrossRef]
- Fregni F, El-Hagrassy MM, Pacheco-Barrios K, et al. Evidence-Based Guidelines and Secondary Meta-Analysis for the Use of Transcranial Direct Current Stimulation in Neurological and Psychiatric Disorders. Int J Neuropsychopharmacol. 2021;24(4):256-313. [CrossRef]
- Pizzagalli DA, Roberts AC. Prefrontal cortex and depression. Neuropsychopharmacology. 2022;47(1):225-246. [CrossRef]
- Cheng YC, Kuo PH, Su MI, Huang WL. The efficacy of non-invasive, non-convulsive electrical neuromodulation on depression, anxiety and sleep disturbance: a systematic review and meta-analysis. Psychol Med. 2022;52(5):801-812. [CrossRef]
- Hopkins WG, Marshall SW, Batterham AM, Hanin J. Progressive statistics for studies in sports medicine and exercise science. Med Sci Sports Exerc. 2009;41(1):3-13. [CrossRef]
- Jamil A, Batsikadze G, Kuo H, et al. Current intensity- and polarity-specific online and aftereffects of transcranial direct current stimulation: An fMRI study. Hum Brain Mapp. 2020;41(6):1644-1666. [CrossRef]
- Hu S, Zheng T, Dong Y, Du J, Liu L. Effect of Anodal Direct-Current Stimulation on Cortical Hemodynamic Responses With Laser-Speckle Contrast Imaging. Front Neurosci. 2018;12(July):1-6. [CrossRef]
- Figeys M, Zeeman M, Kim ES. Effects of Transcranial Direct Current Stimulation (tDCS) on Cognitive Performance and Cerebral Oxygen Hemodynamics: A Systematic Review. Front Hum Neurosci. 2021;15(April). [CrossRef]
- Trofimov AO, Agarkova DI, Sergeev D, et al. NIRS-Based Study of Local Cerebral Oxygenation During Transcranial Direct Current Stimulation in Patients with Mild Traumatic Brain Injury. In: Advances in Experimental Medicine and Biology. Vol 1395. ; 2022:59-63. [CrossRef]
- Liu ML, Karabanov AN, Piek M, Petersen ET, Thielscher A, Siebner HR. Short periods of bipolar anodal TDCS induce no instantaneous dose-dependent increase in cerebral blood flow in the targeted human motor cortex. Sci Rep. 2022;12(1):9580. [CrossRef]
- Zanardi R, Poletti S, Prestifilippo D, Attanasio F, Barbini B, Colombo C. Transcranial direct current stimulation: A novel approach in the treatment of vascular depression. Brain Stimul. 2020;13(6):1559-1565. [CrossRef]
- Figeys M, Zeeman M, Kim ES. Effects of Transcranial Direct Current Stimulation (tDCS) on Cognitive Performance and Cerebral Oxygen Hemodynamics: A Systematic Review. Front Hum Neurosci. 2021;15. [CrossRef]
- Merzagora AC, Foffani G, Panyavin I, et al. Prefrontal hemodynamic changes produced by anodal direct current stimulation. Neuroimage. 2010;49(3):2304-2310. [CrossRef]
- Wang Y ming, Yang Z ya. Aberrant pattern of cerebral blood flow in patients with major depressive disorder: A meta-analysis of arterial spin labelling studies. Psychiatry Res Neuroimaging. 2022;321(January):111458. [CrossRef]
- Willeumier K, Taylor D V., Amen DG. Decreased cerebral blood flow in the limbic and prefrontal cortex using SPECT imaging in a cohort of completed suicides. Transl Psychiatry. 2011;1(8):e28-e28. [CrossRef]
Figure 1.
Flow diagram.
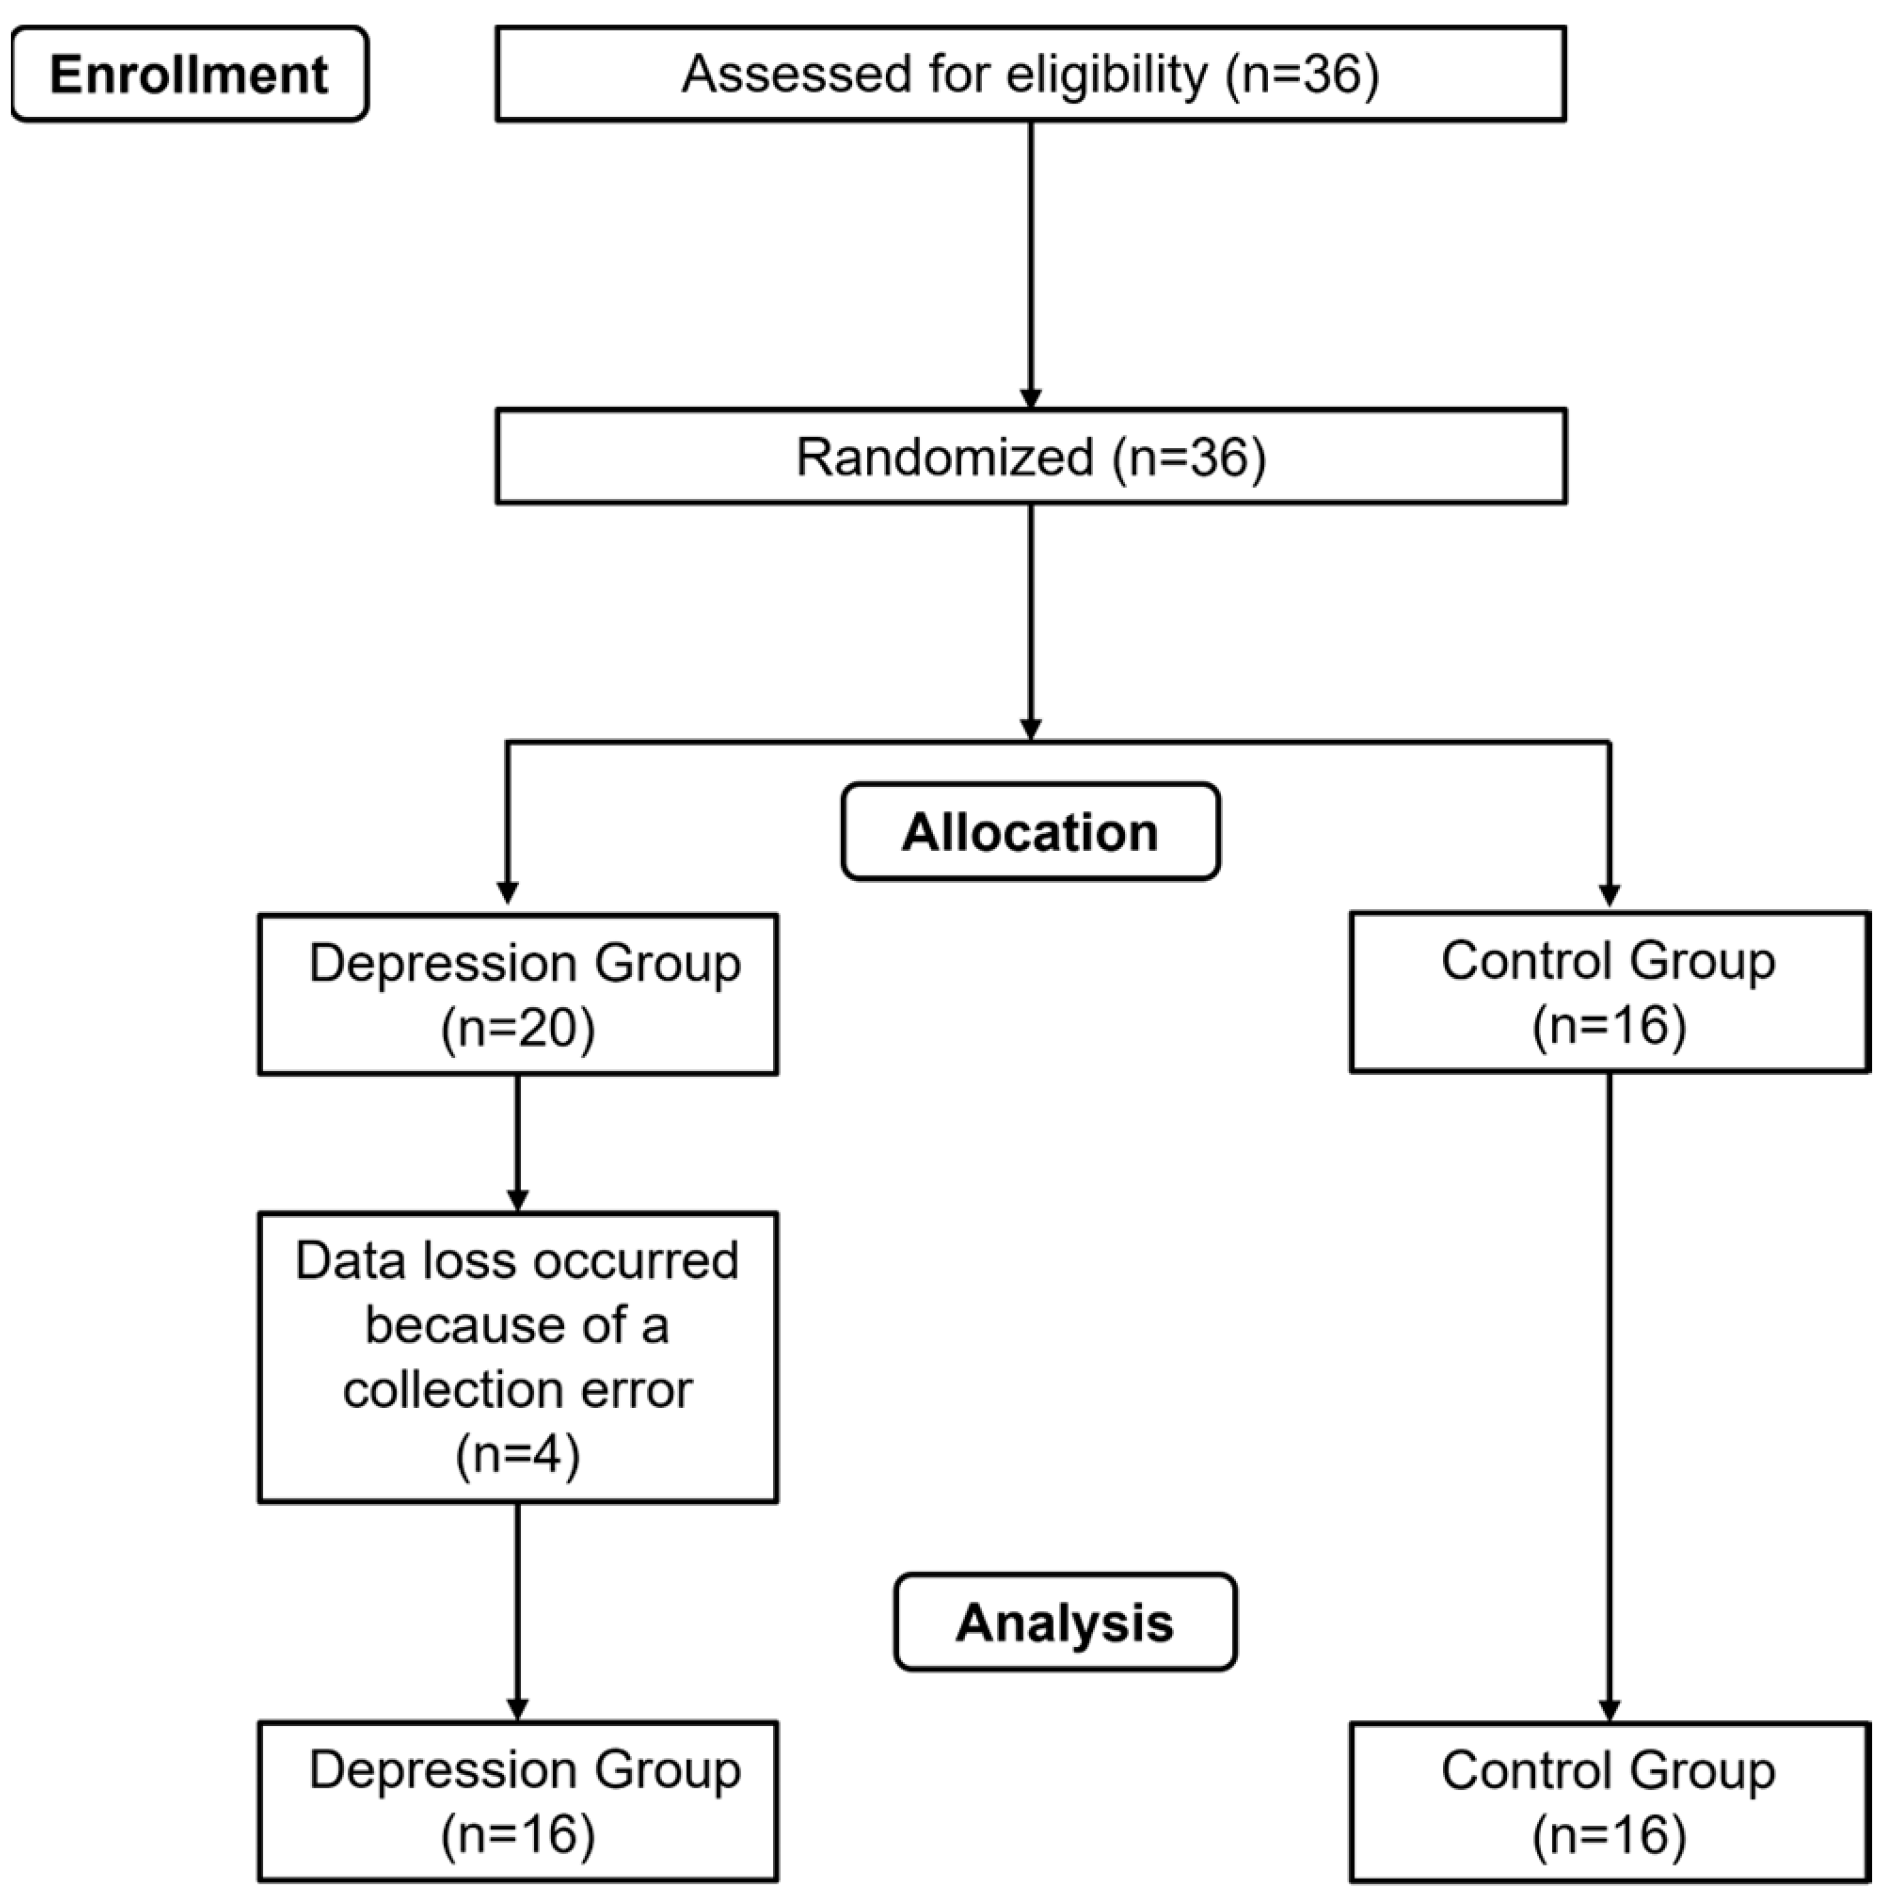

Table 1.
Participants’ characteristics.
| Characteristics | Depression Group | Control Group | p value | ||
| Mean ± SD | n (%) | Mean ± SD | n (%) | ||
| Sex | |||||
| Male | 4 (25) | 3 (18.75) | |||
| Female | 12 (75) | 13 (81.25) | |||
| Age (years) | 36.4 ± 18.9 | 24.1 ± 2.29 | <.001* | ||
| Weight (kg) | 69.4 ± 16.8 | 71.1 ± 14.1 | 0.22 | ||
| Height (m) | 1.65 ± 0.07 | 1.67 ± 0.04 | 0.15 | ||
| (BMI) | 25.5 ± 5.5 | 25.3 ± 4.10 | 0.12 | ||
Legend: BMI = body mass index; * Significant difference assigned.
Table 2.
Within- and between-group differences for oxygen saturation (SatO2).
| Outcome (%) | Depression Group (n=16) Mean ± SD |
Within-group differences |
Control Group (n=16) Mean ± SD |
Within-group differences | Between-group differences | |||
| Baseline | Post-stimulation | Baseline | Post-stimulation | Baseline | Post-stimulation | |||
| Mean | 51.1 ± 7.35 | 53.7 ± 10.0 | 0.045* | 57.3 ± 5.46 | 57.8 ± 5.52 | 0.288 | 0.011* | 0.156 |
| Minimum | 45.5 ± 14.3 | 51.7 ± 10.8 | 0.006* | 55.7 ± 5.29 | 56.4 ± 6.31 | 0.515 | 0.012* | 0.148 |
| Maximum | 54.5 ± 7.18 | 55.6 ± 9.87 | 0.503 | 58.6 ± 5.63 | 58.5 ± 5.56 | 0.789 | 0.084 | 0.314 |
| Median | 50.8 ± 7.50 | 53.6 ± 9.94 | 0.048* | 57.3 ± 5.57 | 57.9 ± 5.53 | 0.301 | 0.009* | 0.141 |
* Significant differences assigned.
Table 3.
Comparison of HbO levels between and within groups.
| Outcome (g/dL) | Depression group (n=16) Mean ± SD |
Within-group differences | Control group (n=16) Mean ± SD |
Within-group differences |
Between-group differences | |||
| Baseline | Post-stimulation | Baseline | Post-stimulation | Baseline | Post-stimulation | |||
| Mean | 5.94 ± 0.97 | 6.29 ± 1.35 | 0.04* | 6.76 ± 0.75 | 6.84 ± 0.76 | 0.28 | 0.01* | 0.16 |
| Minimum | 5.25 ± 1.74 | 6.04 ± 1.43 | 0.004* | 6.54 ± 0.72 | 6.64 ± 0.86 | 0.49 | 0.01* | 0.15 |
| Maximum | 6.39 ± 0.96 | 6.55 ± 1.35 | 0.47 | 6.94 ± 0.78 | 6.93 ± 0.77 | 0.79 | 0.08 | 0.33 |
* Significant difference assigned.
Disclaimer/Publisher’s Note: The statements, opinions and data contained in all publications are solely those of the individual author(s) and contributor(s) and not of MDPI and/or the editor(s). MDPI and/or the editor(s) disclaim responsibility for any injury to people or property resulting from any ideas, methods, instructions or products referred to in the content. |
© 2024 by the authors. Licensee MDPI, Basel, Switzerland. This article is an open access article distributed under the terms and conditions of the Creative Commons Attribution (CC BY) license (http://creativecommons.org/licenses/by/4.0/).
Copyright: This open access article is published under a Creative Commons CC BY 4.0 license, which permit the free download, distribution, and reuse, provided that the author and preprint are cited in any reuse.


