Submitted:
12 June 2024
Posted:
13 June 2024
You are already at the latest version
Abstract
Keywords:
Background
2. Results
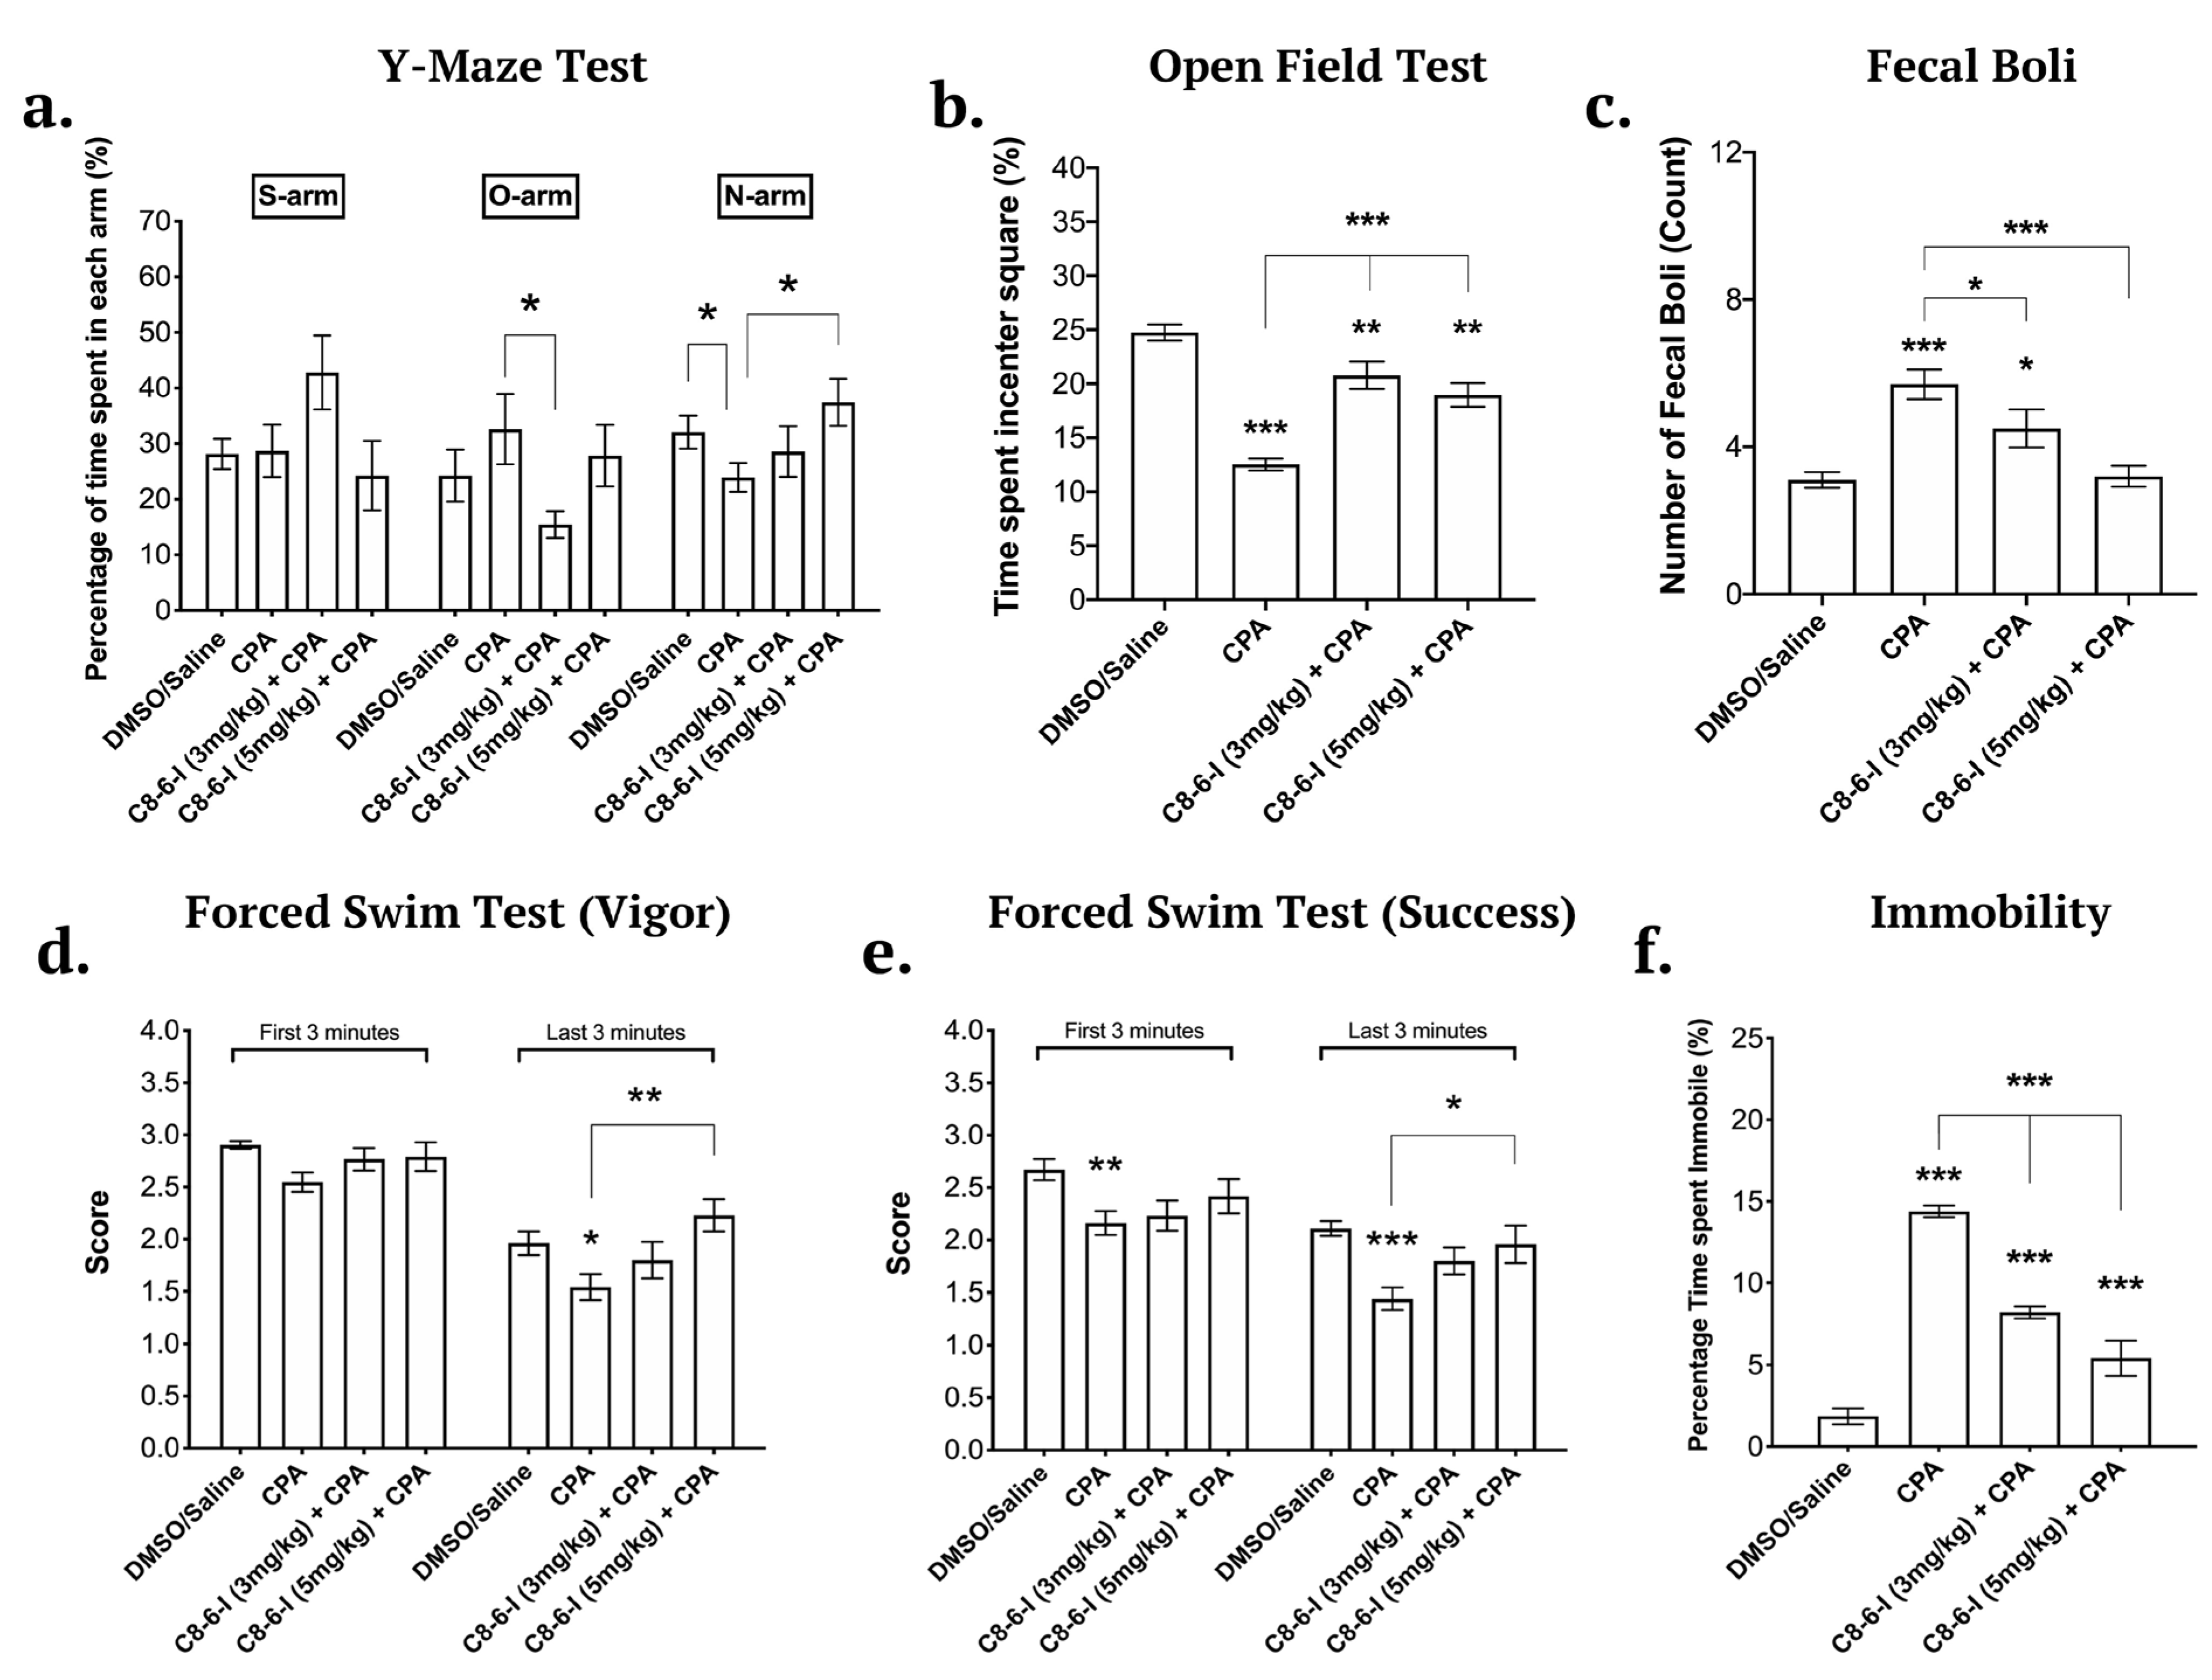
2.1. Caffeine-Indan Dimer Decreased the Behavioural Deficits after Chronic A1R Stimulation
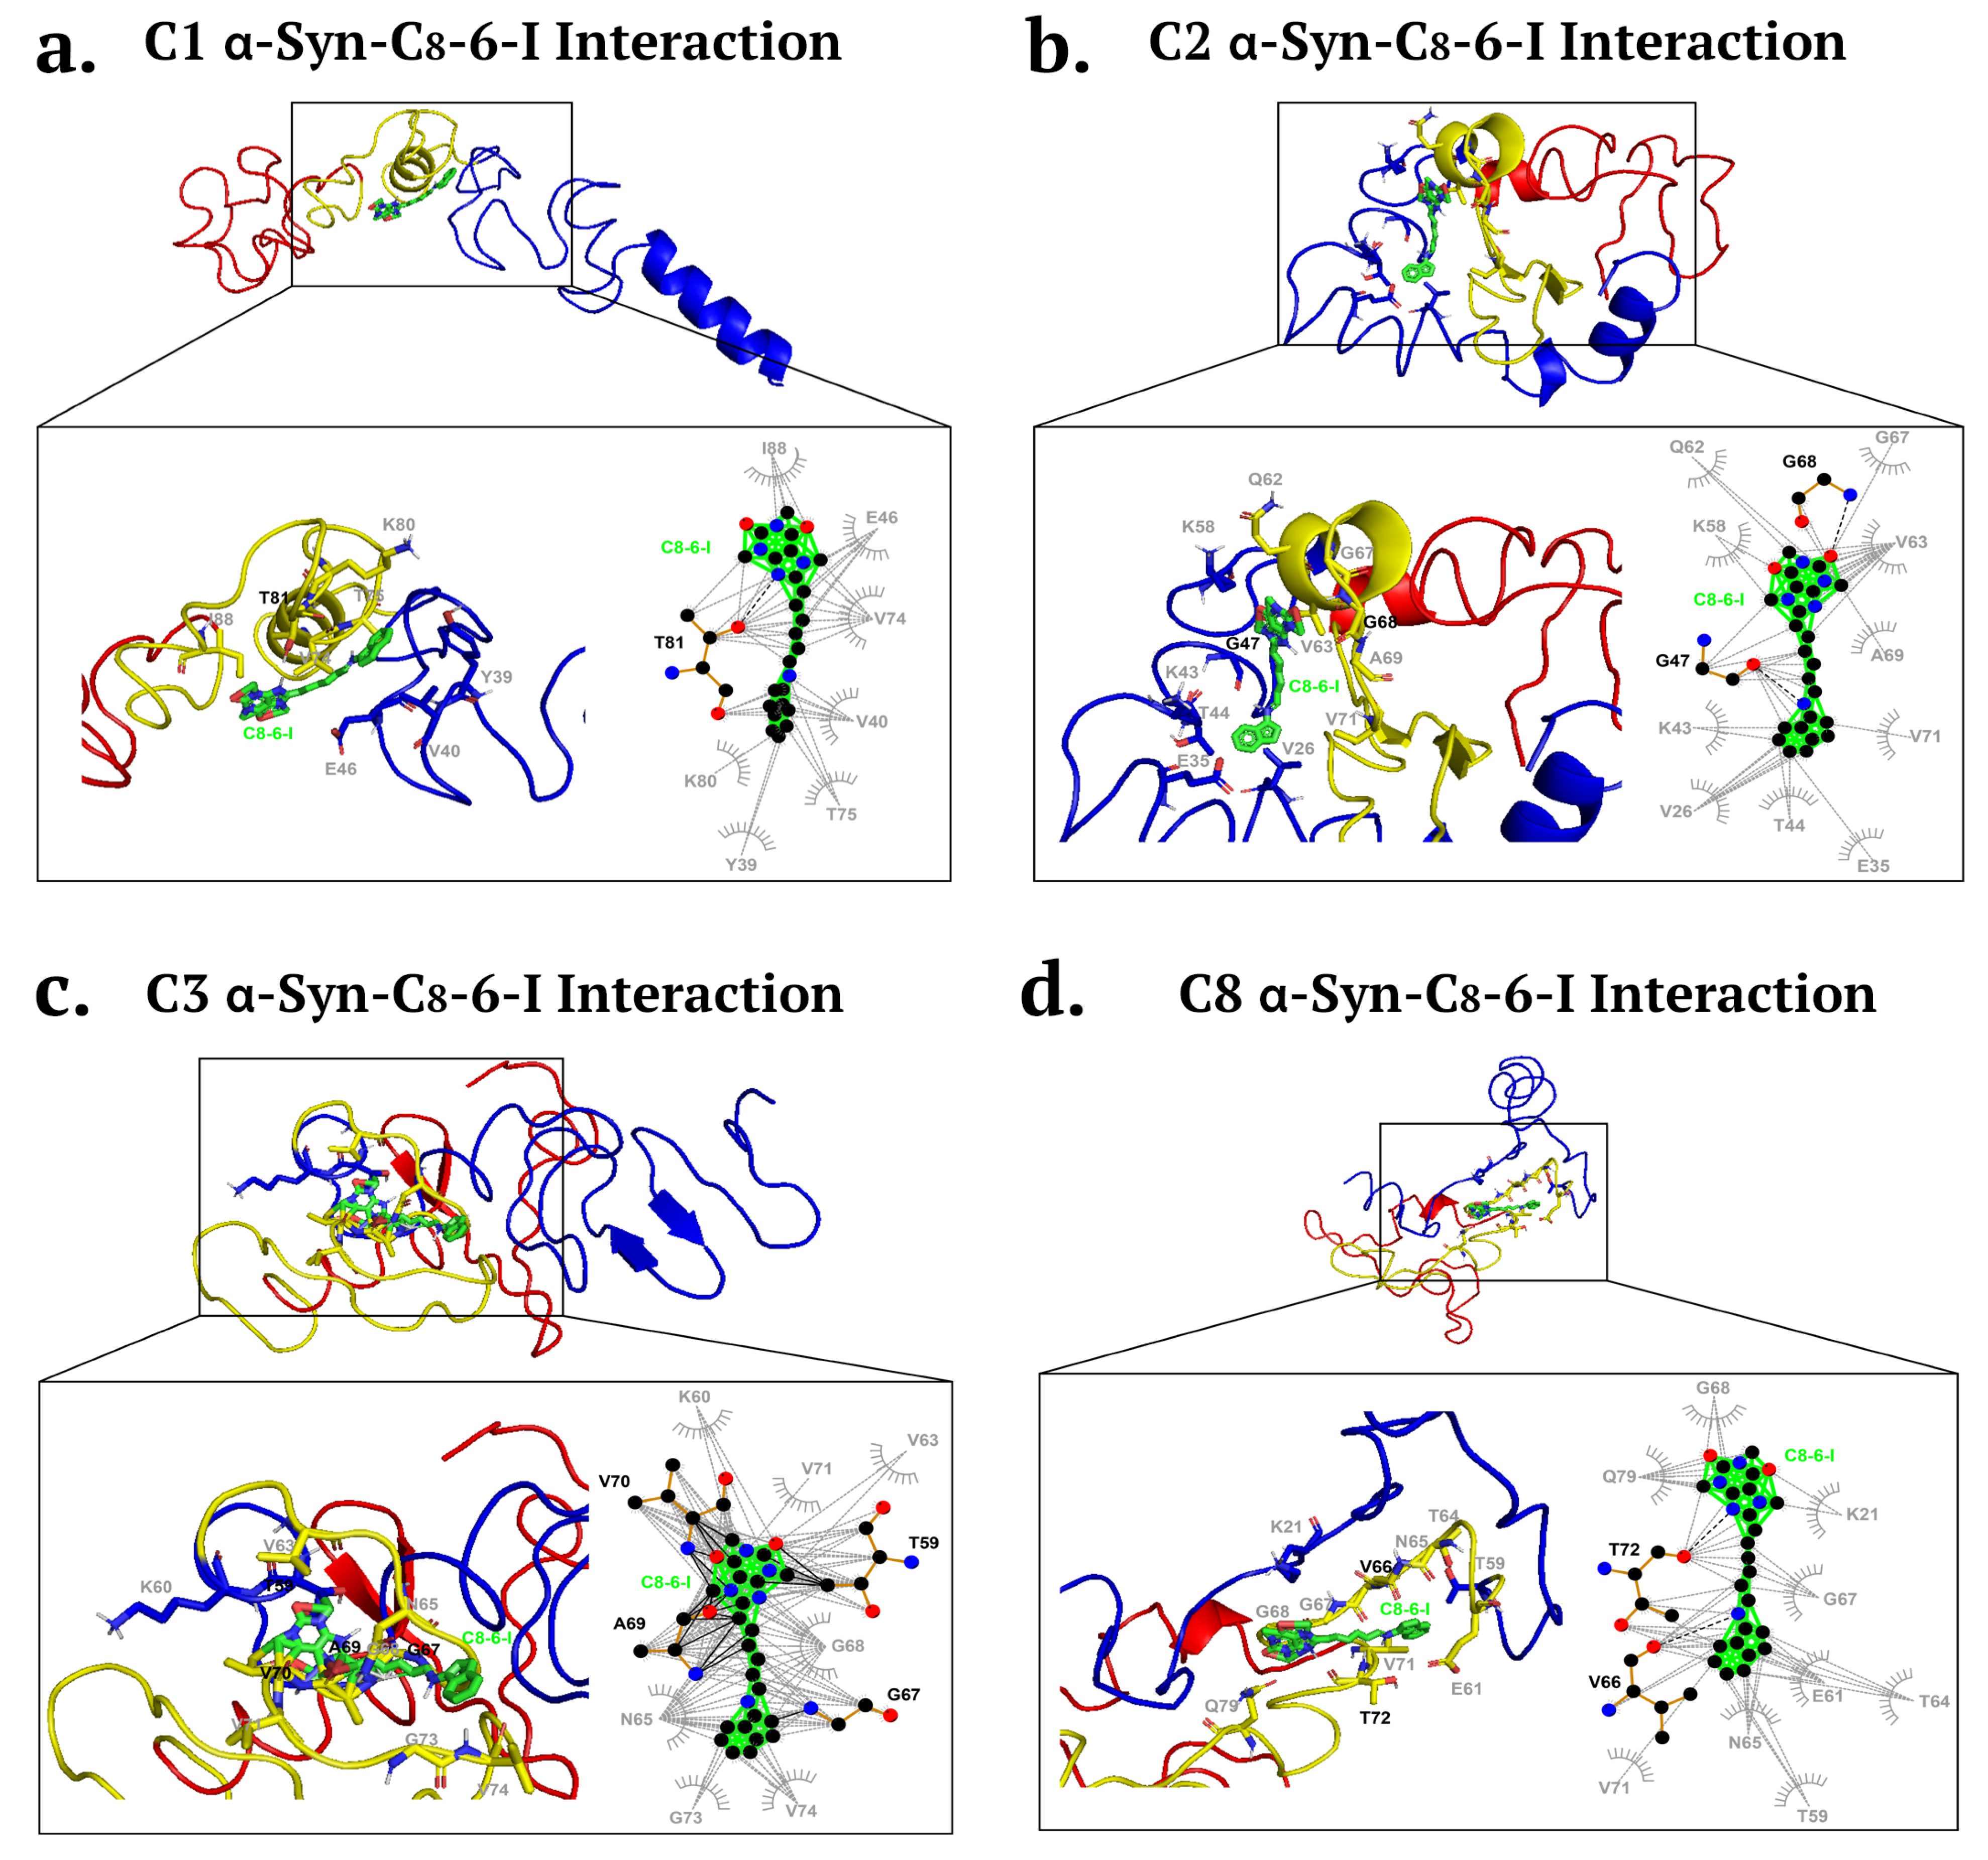
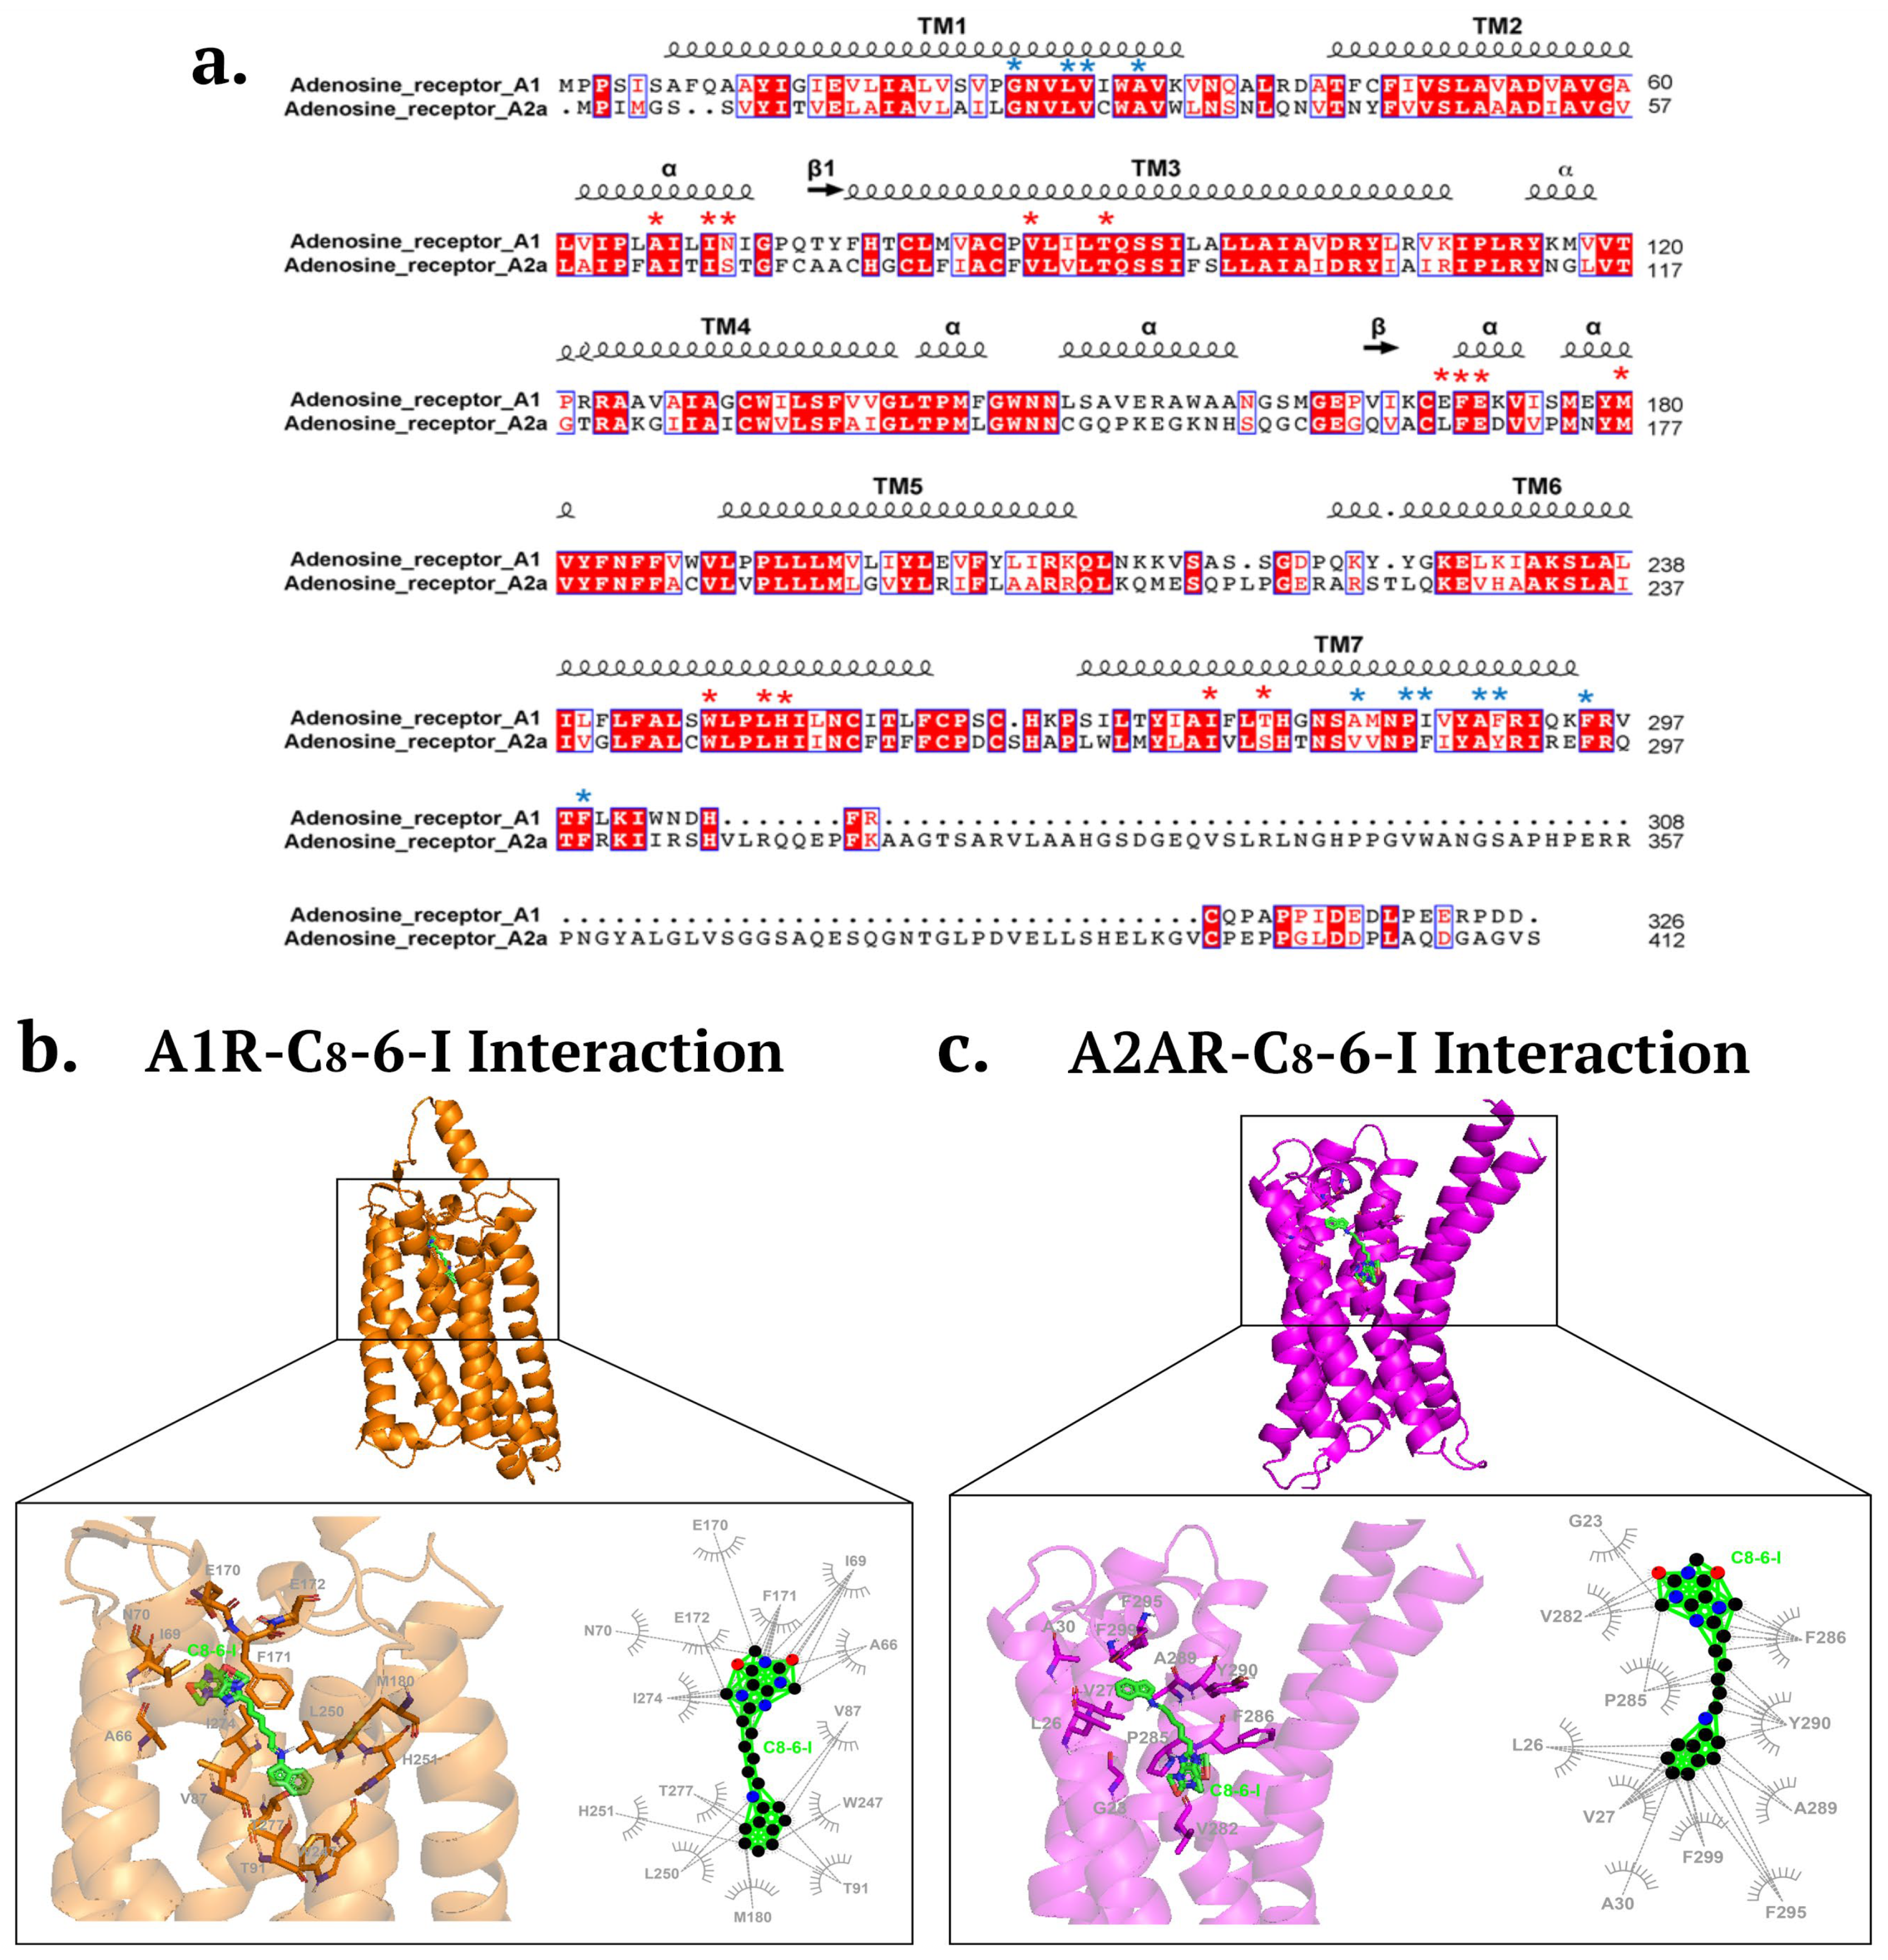
2.2. Molecular Docking Revealed Potential Binding of C8-6-I to α-Syn and Adenosine Receptors
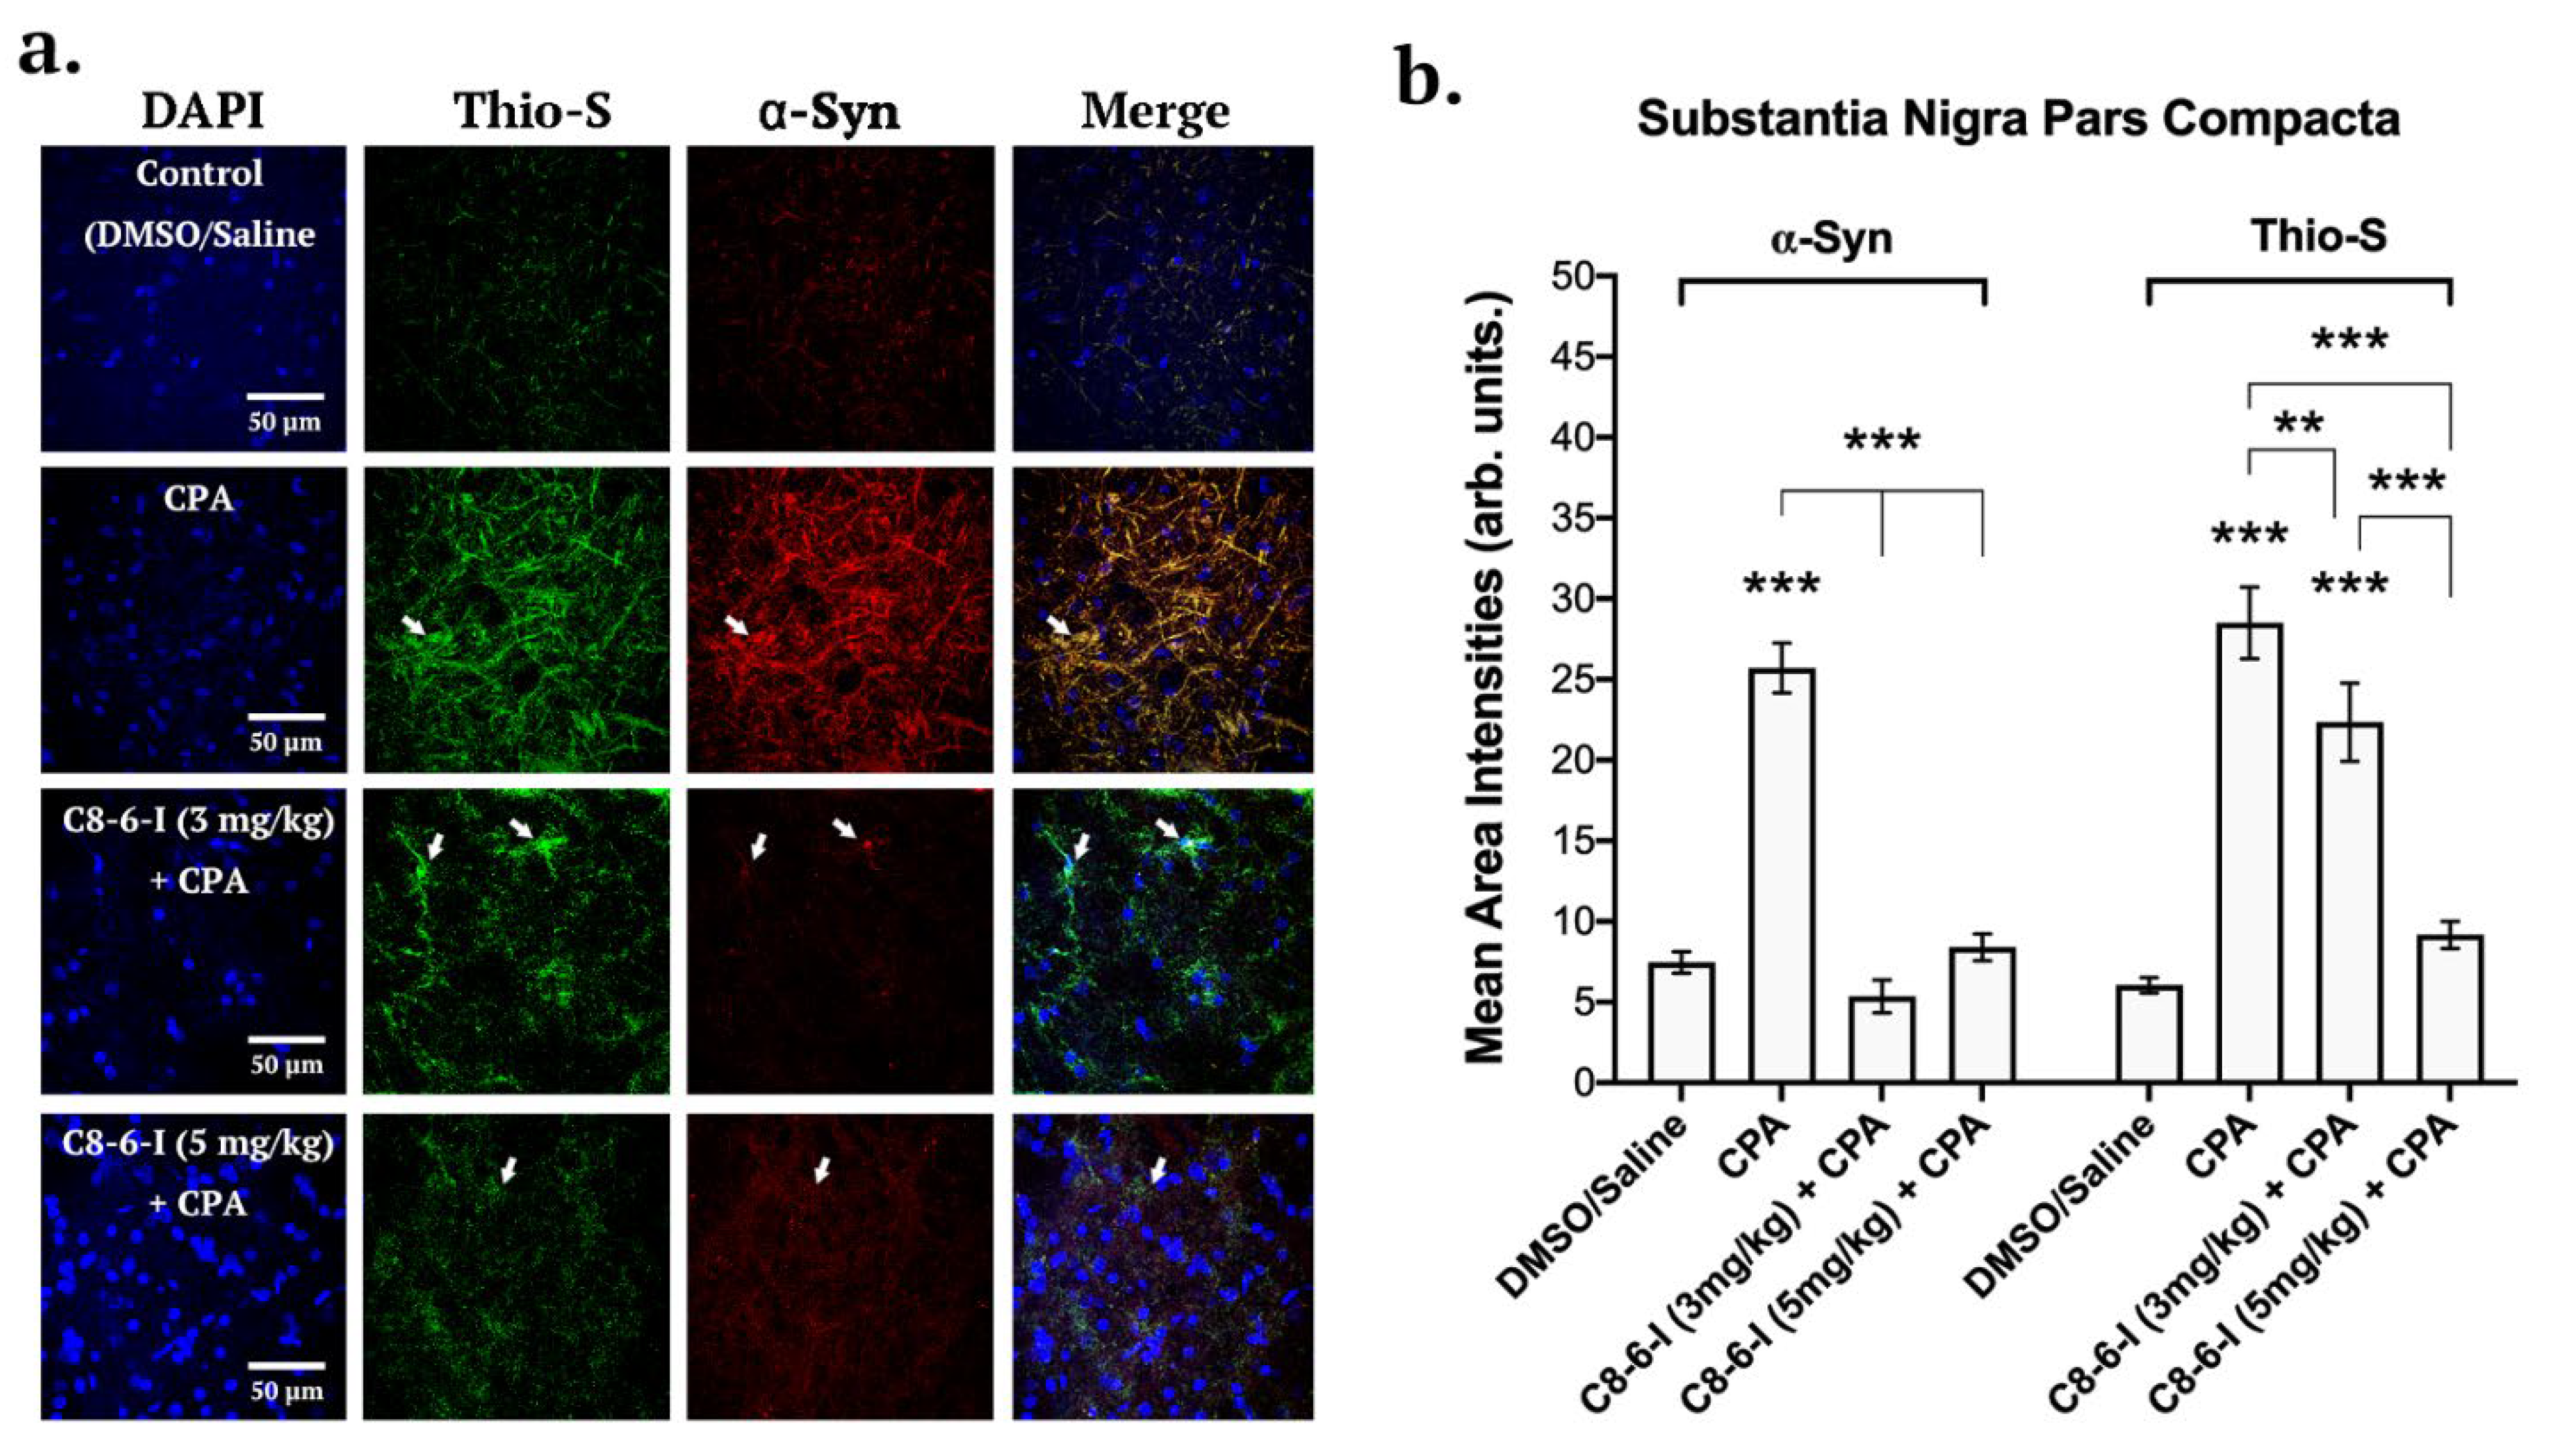
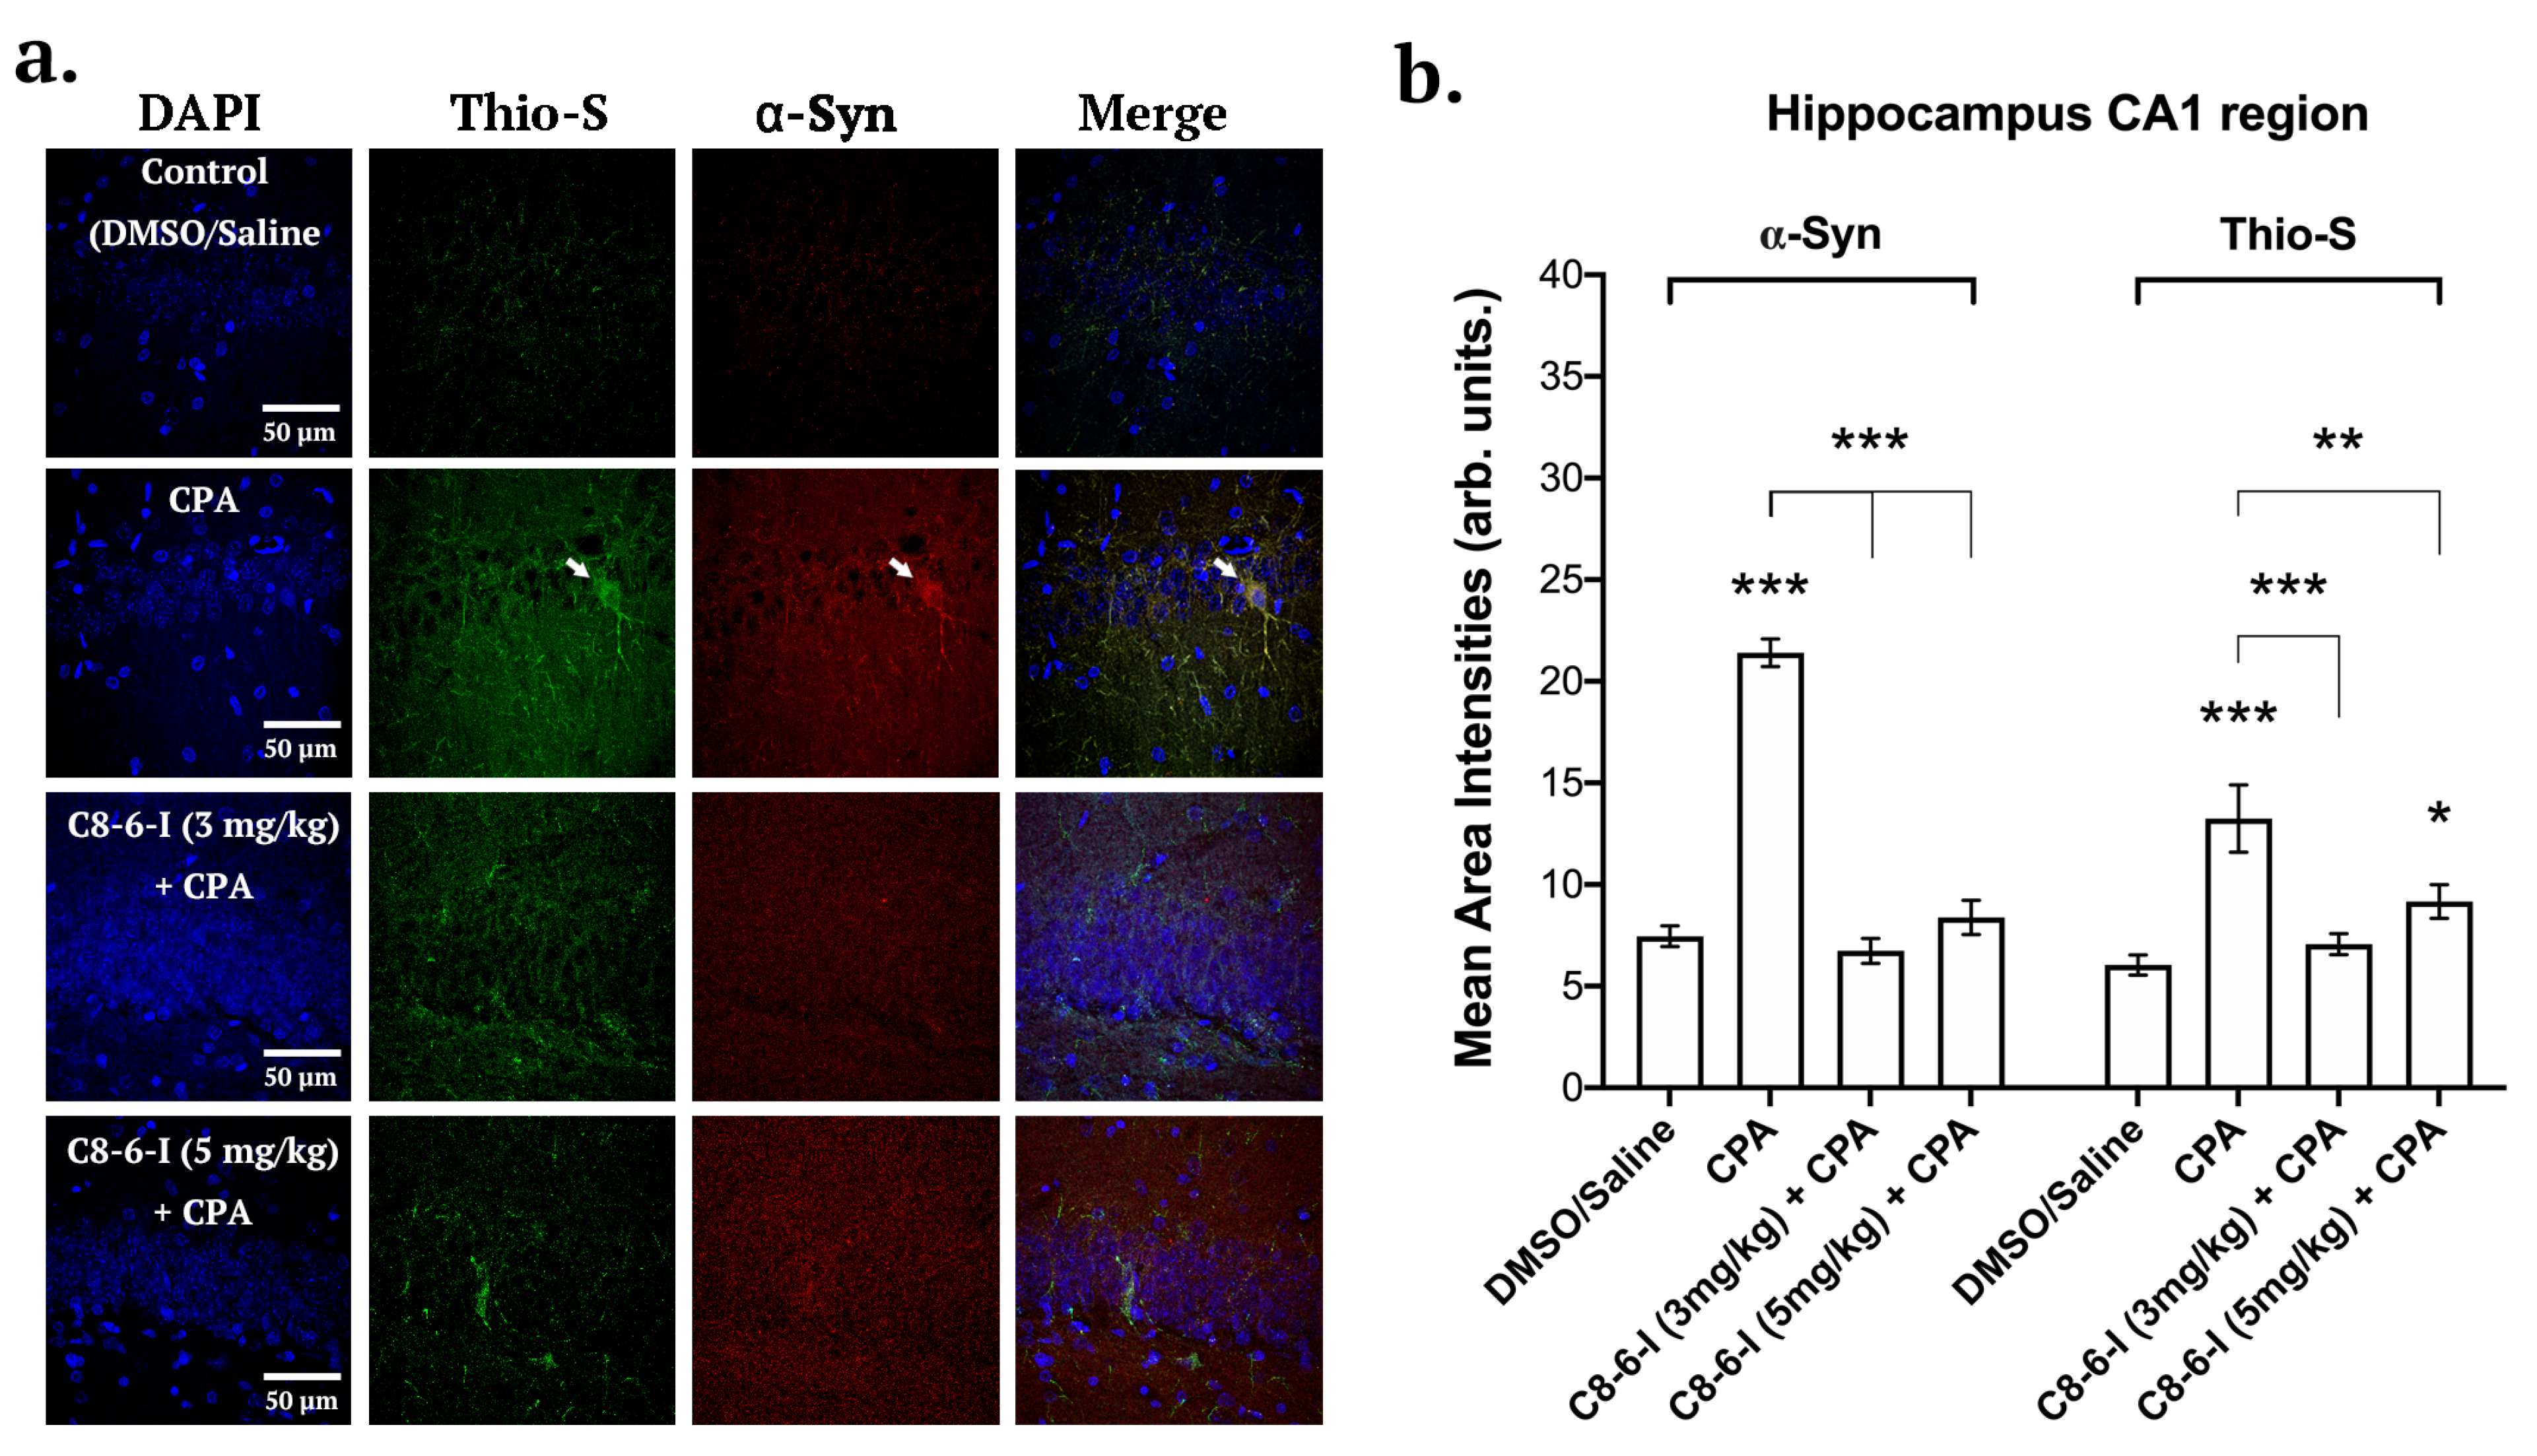
2.3. C8-6-I Decreased CPA-Induced α-Synuclein Expression and Aggregation in Substantia Nigra and Hippocampus
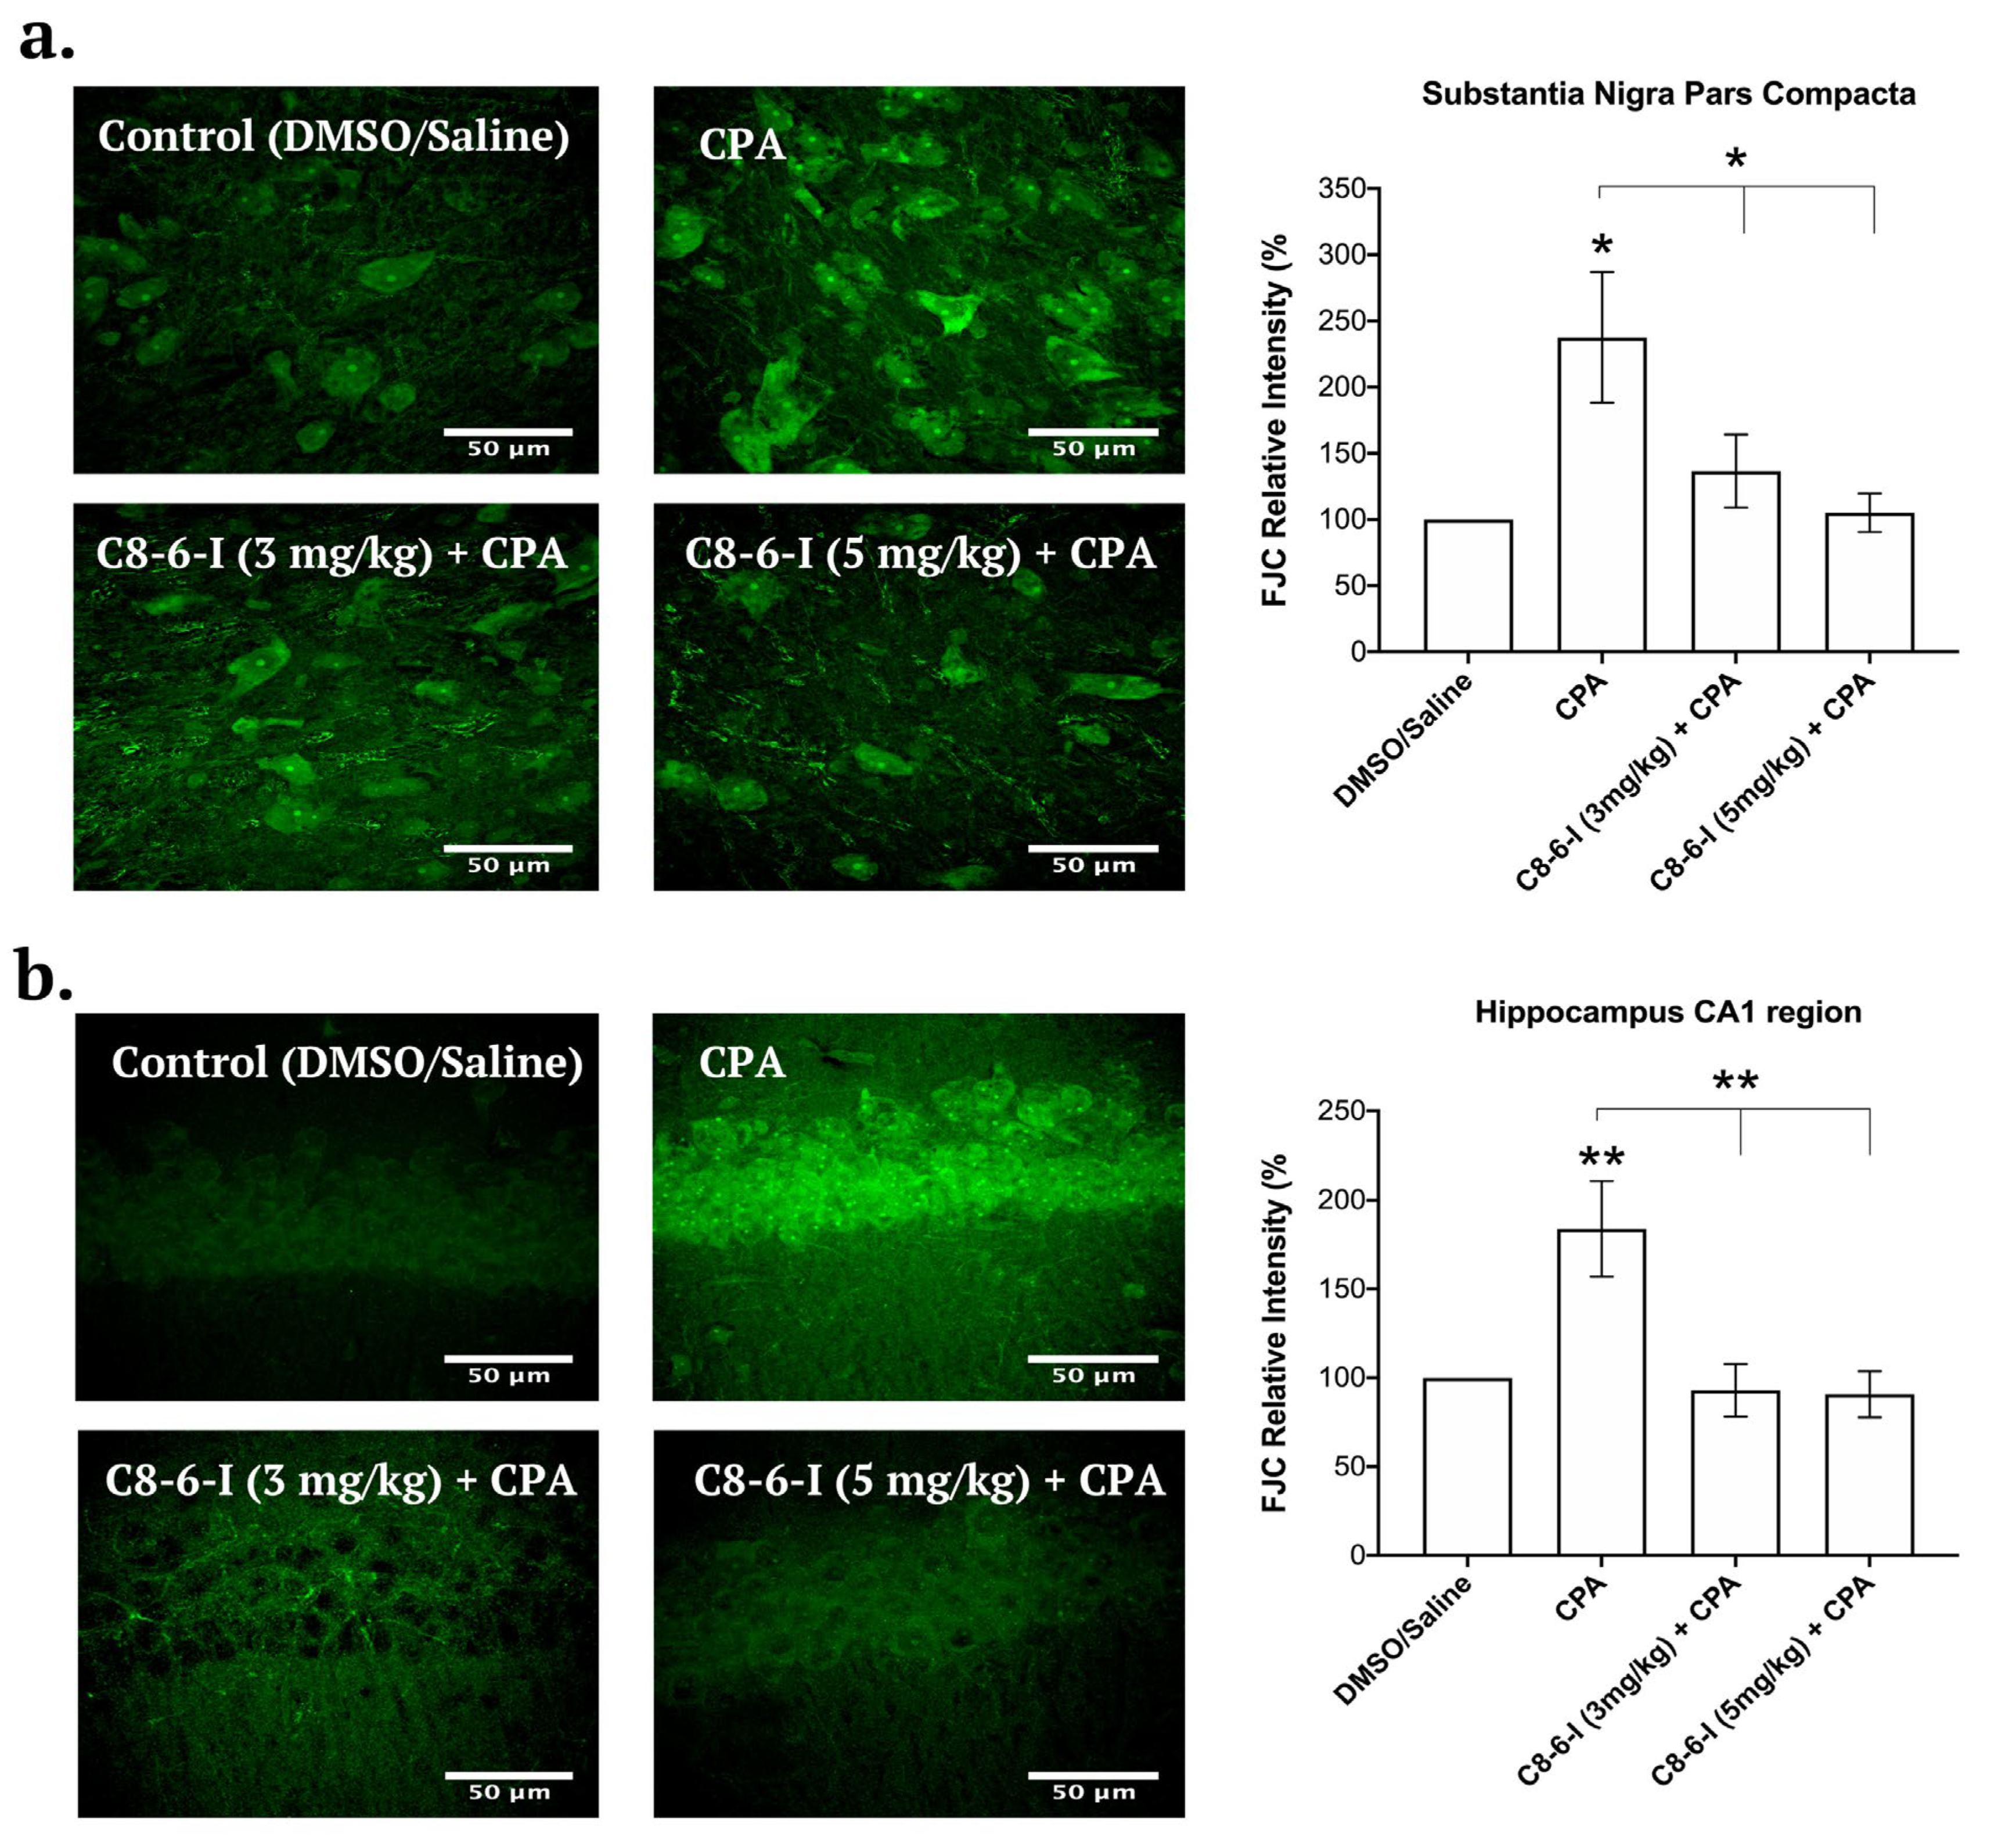
2.4. C8-6-I Decreased CPA-induced Neurodegeneration in Substantia Nigra and Hippocampus
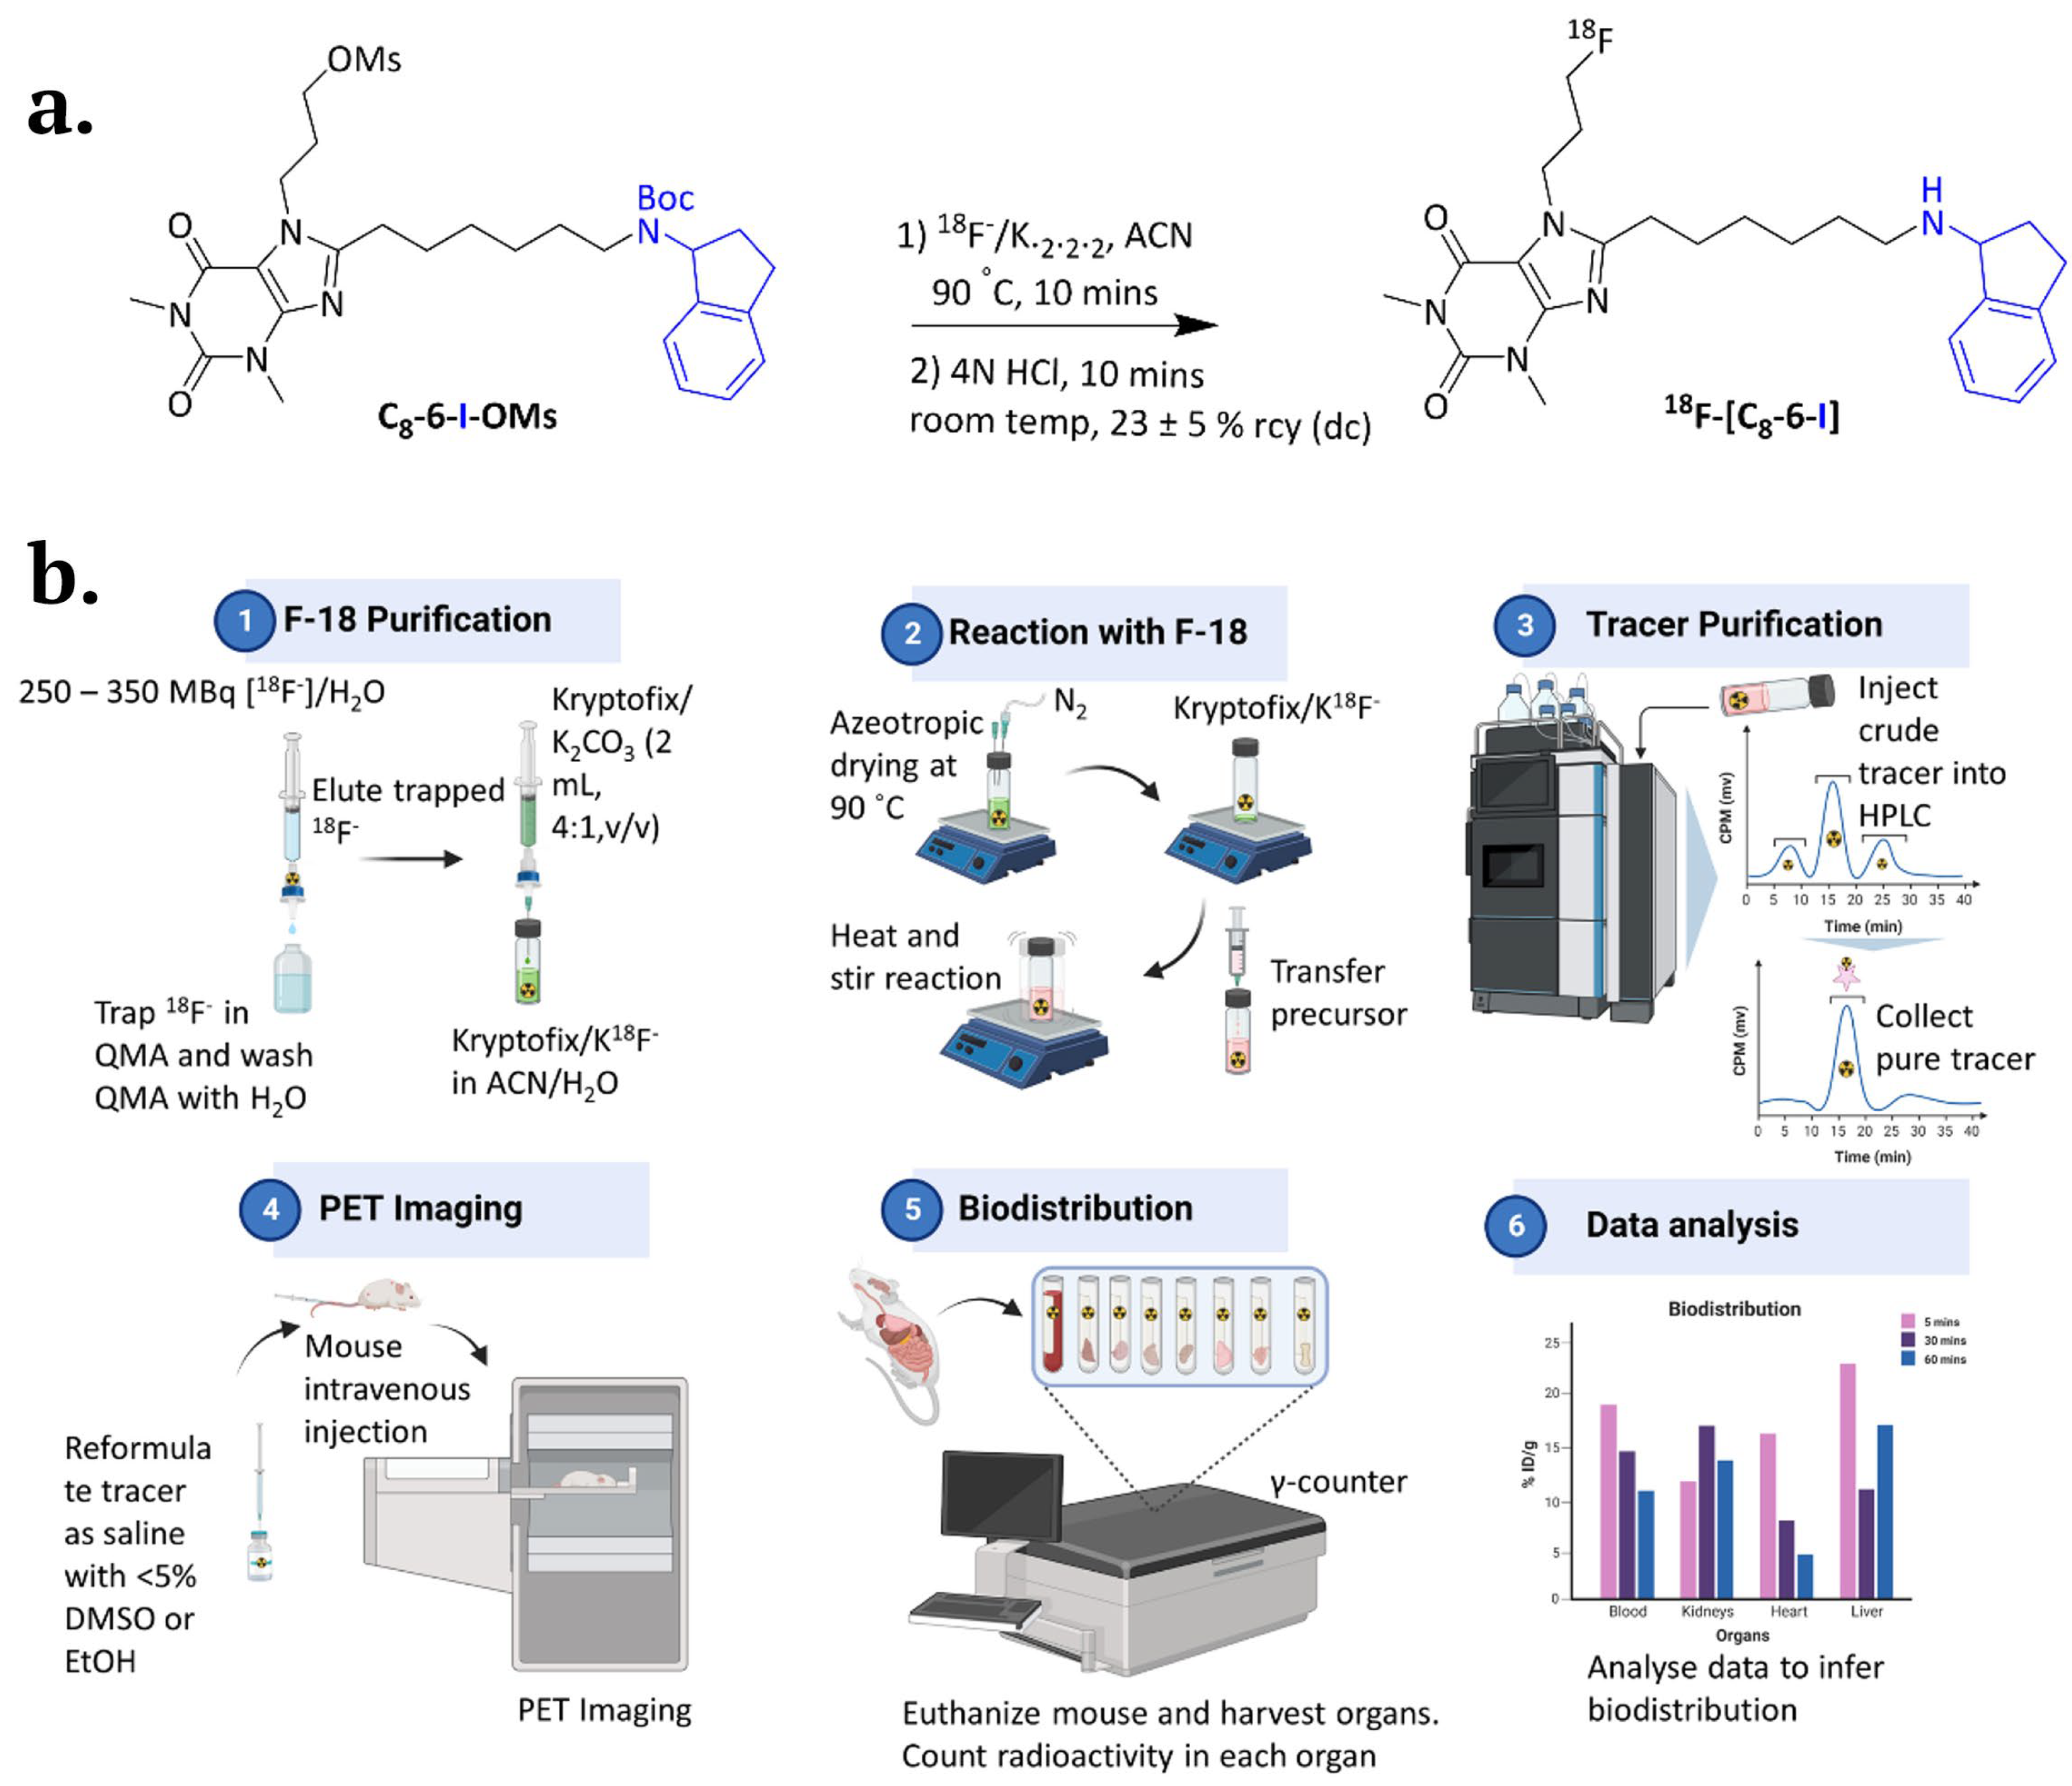
2.5. 18F-Labelled C8-6-I and its Potential Therapeutic Use for In Vivo Studies
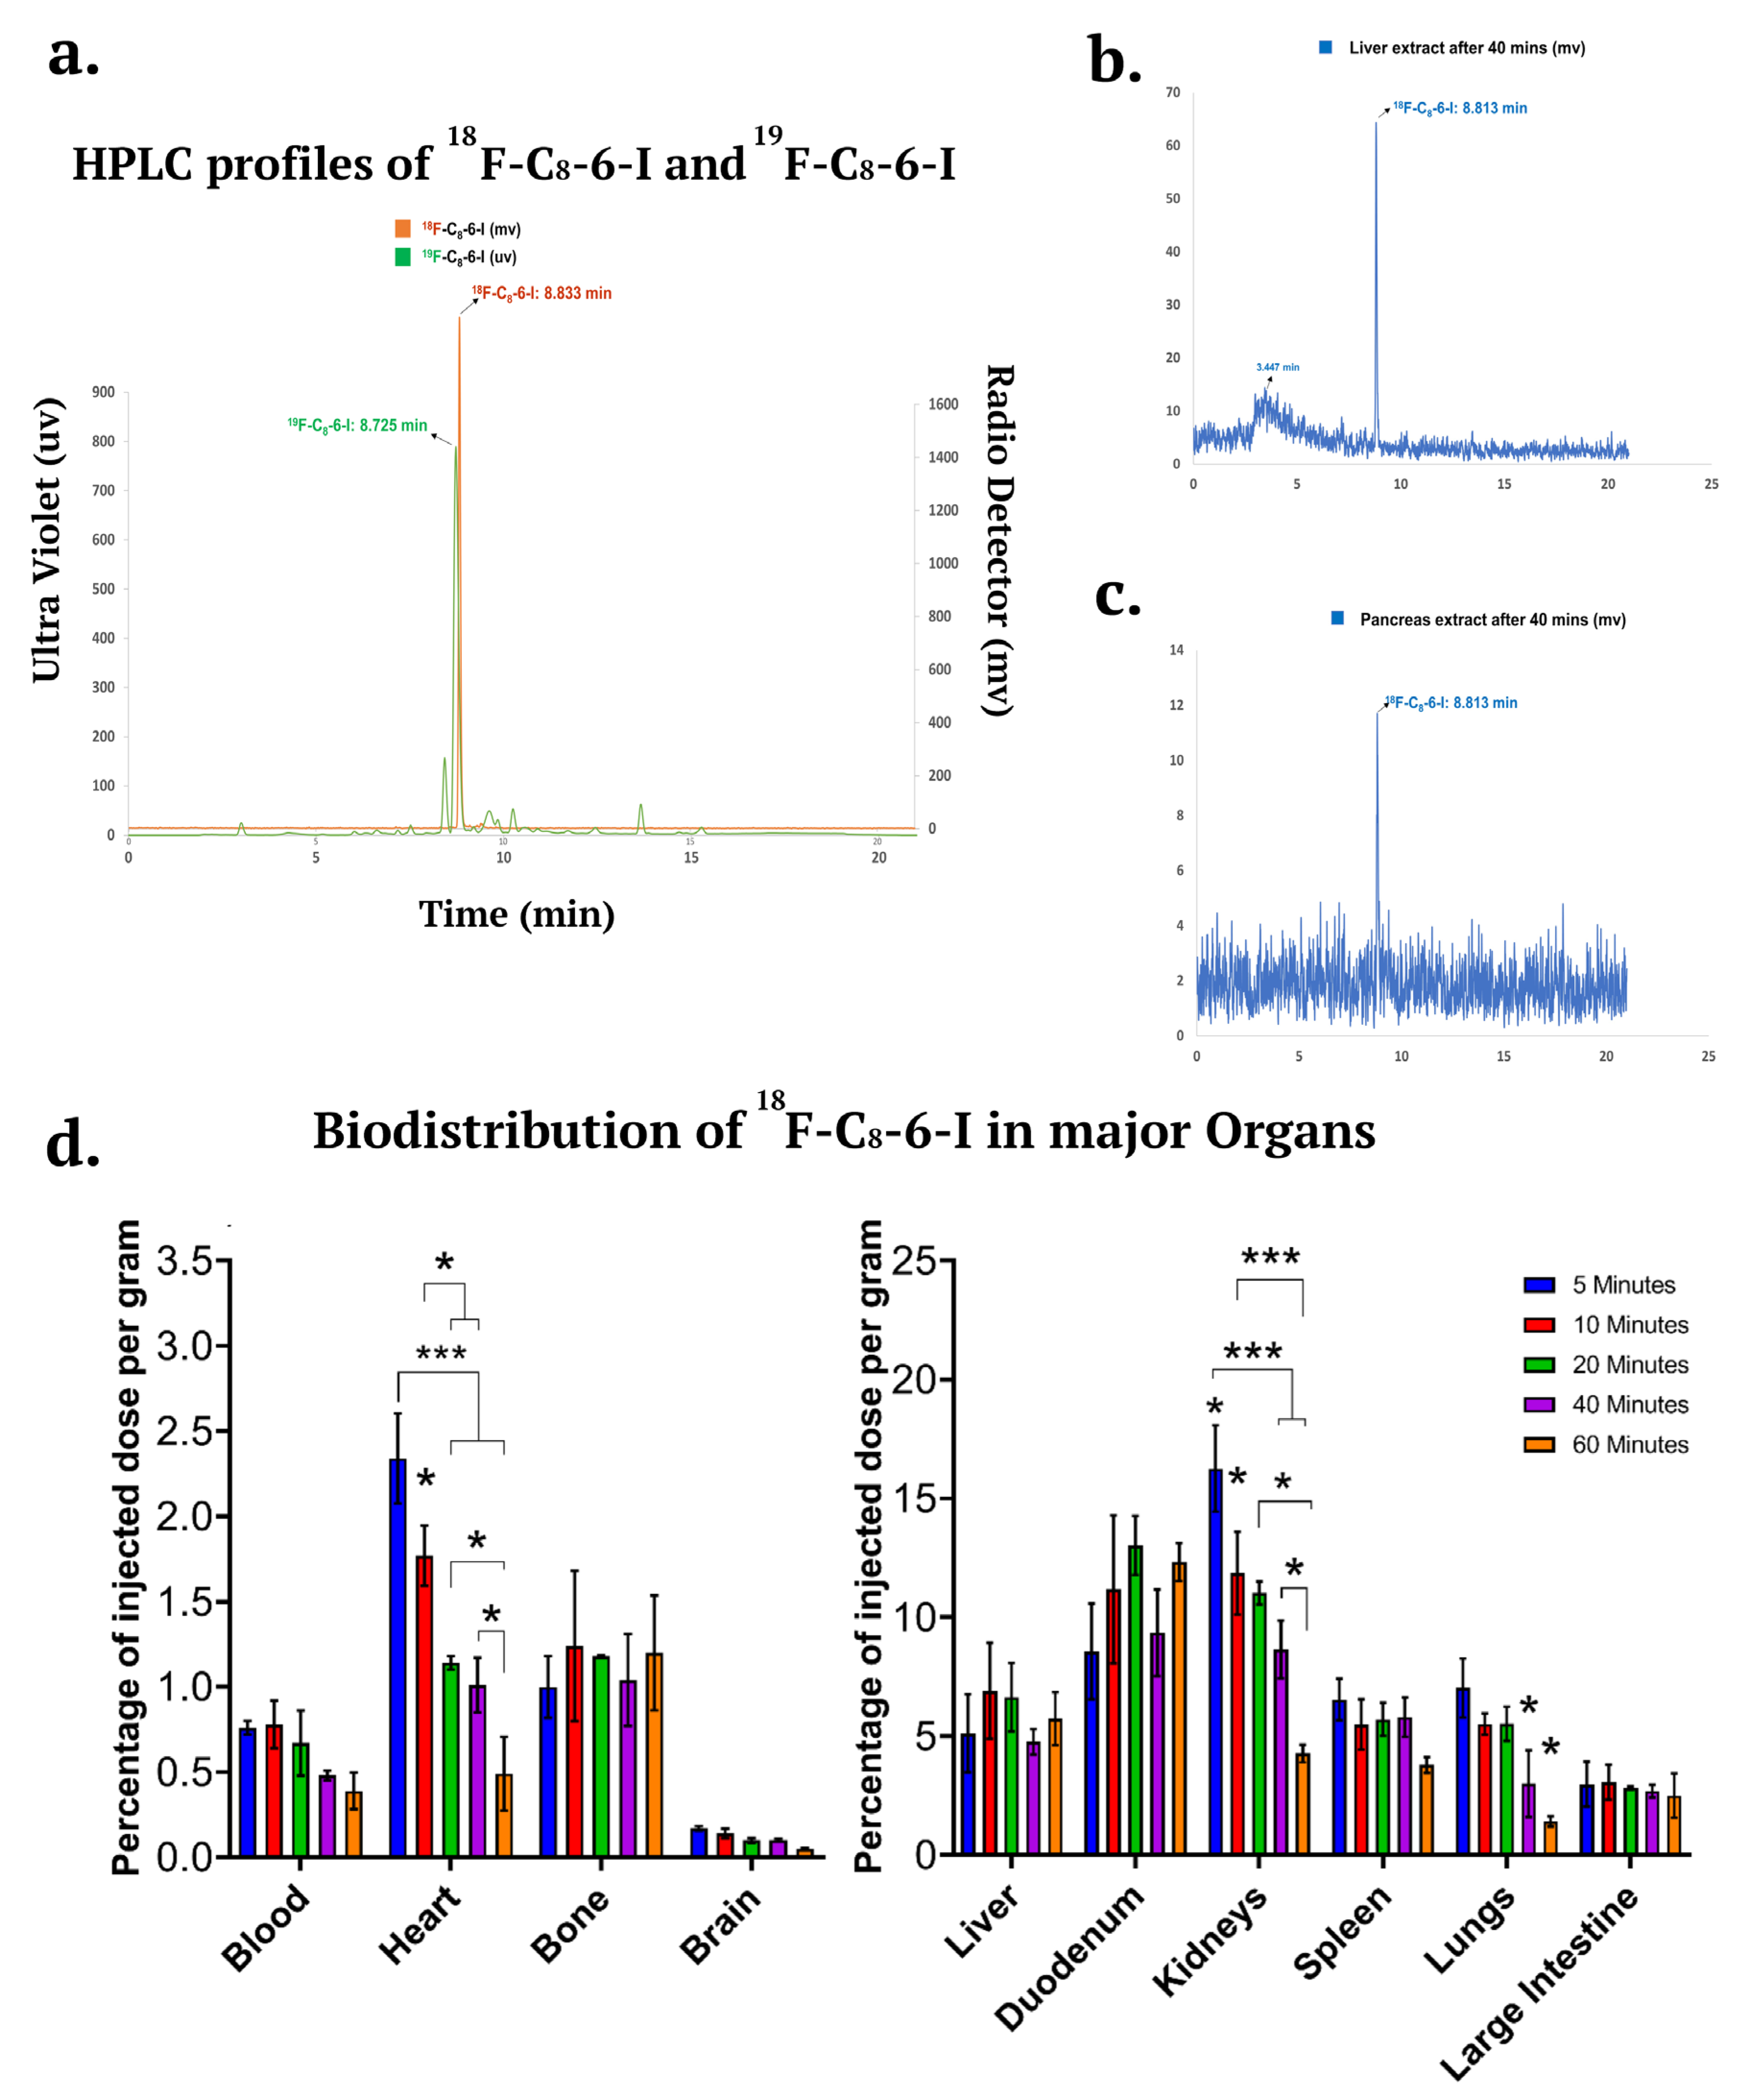
2.6. 18F-Labelled C8-6-I In Vivo Metabolism and Distributed in the Major Organs Including the Brain
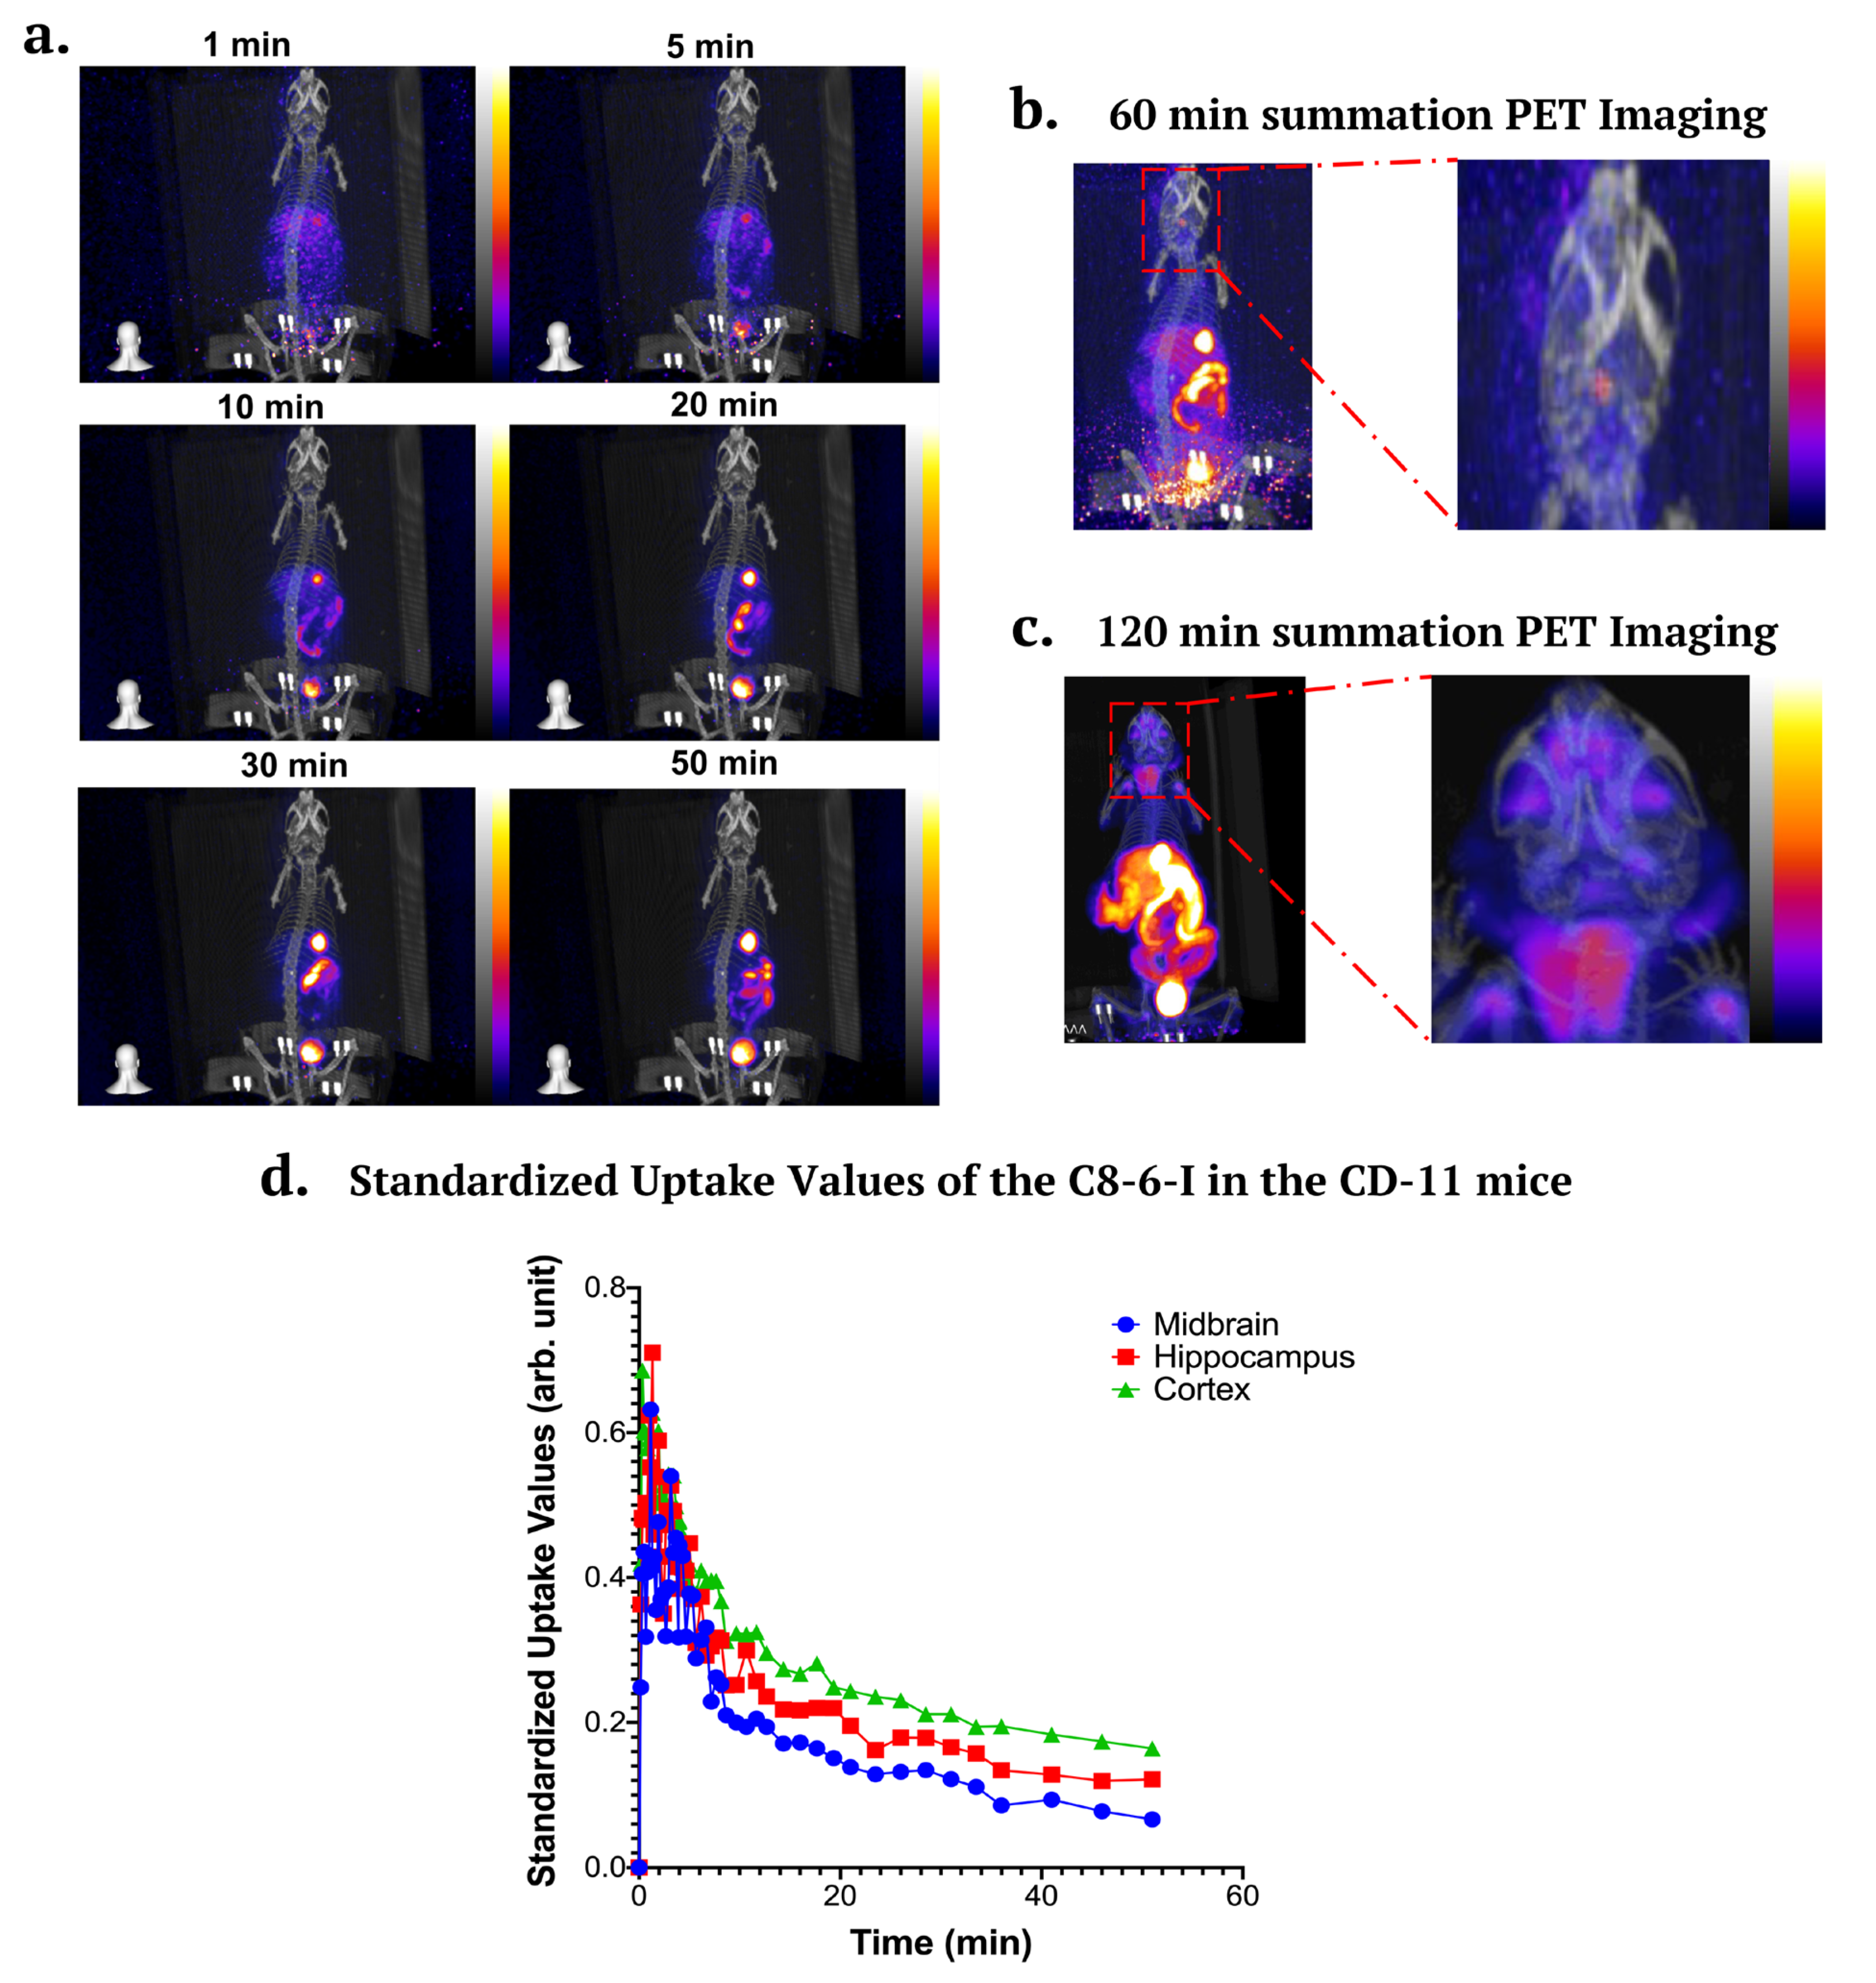
2.7. In Vivo PET/CT Imaging in CD-1 Mice
Discussion
Methods
In Vivo Animal Protocol
Reagents
Behaviour Tests
Y-Maze
Open Field Test
Forced Swim Test
Structural Modeling and Molecular Docking
Immunohistochemistry
Thioflavin-S
Fluoro-Jade C
Radiochemistry
Micro-PET/CT Imaging
In Vivo Metabolic Stability and Biodistribution
Statistical Analyses
Availability of Data and Materials
Ethical Approval and Consent to Participate
Compliance with Ethical Standards
Consent for Publication
Authors’ Information
Conflicts of Interests/Competing Interests
Supplementary Materials
Author Contributions
Funding
Acknowledgments
Abbreviations
References
- Stockwell, J.; Jakova, E.; Cayabyab, F.S. Adenosine A1 and A2A receptors in the brain: current research and their role in neurodegeneration. Molecules 2017, 22, 676. [Google Scholar] [CrossRef]
- Chang, C.-P.; Wu, K.-C.; Lin, C.-Y.; Chern, Y. Emerging roles of dysregulated adenosine homeostasis in brain disorders with a specific focus on neurodegenerative diseases. J. Biomed. Sci. 2021, 28, 1–25. [Google Scholar] [CrossRef] [PubMed]
- Jakova, E.; Moutaoufik, M.T.; Lee, J.S.; Babu, M.; Cayabyab, F.S. Adenosine A1 receptor ligands bind to α-synuclein: implications for α-synuclein misfolding and α-synucleinopathy in Parkinson’s disease. Transl. Neurodegener. 2022, 11, 1–26. [Google Scholar] [CrossRef] [PubMed]
- Lv, Y.-C.; Gao, A.-B.; Yang, J.; Zhong, L.-Y.; Jia, B.; Ouyang, S.-H.; Gui, L.; Peng, T.-H.; Sun, S.; Cayabyab, F.S. Long-term adenosine A1 receptor activation-induced sortilin expression promotes α-synuclein upregulation in dopaminergic neurons. Neural Regen. Res. 2020, 15, 712. [Google Scholar] [PubMed]
- Kakish, J.; Lee, D.; Lee, J.S. Drugs that bind to α-synuclein: neuroprotective or neurotoxic? ACS Chem. Neurosci. 2015, 6, 1930–1940. [Google Scholar] [CrossRef] [PubMed]
- Jakova, E.; Lee, J.S. Behavior of α-synuclein–drug complexes during nanopore analysis with a superimposed AC field. Electrophoresis 2017, 38, 350–360. [Google Scholar] [CrossRef]
- Tripathi, R.; Saber, H.; Chauhan, V.; Tripathi, K.; Factor, S. Parkinson Disease from long term drug abuse: Meta-analysis of amphetamine/methamphetamine and Parkinson Disease (P6. 079). 2018. [Google Scholar] [CrossRef]
- Pregeljc, D.; Teodorescu-Perijoc, D.; Vianello, R.; Umek, N.; Mavri, J. How important is the use of cocaine and amphetamines in the development of Parkinson disease? A computational study. Neurotox. Res. 2020, 37, 724–731. [Google Scholar] [CrossRef]
- Biswas, S.; Bagchi, A. Study of the Effects of Nicotine and Caffeine for the Treatment of Parkinson’s Disease. Appl. Biochem. Biotechnol. 2023, 195, 639–654. [Google Scholar] [CrossRef]
- Kakish, J.; Allen, K.J.H.; Harkness, T.A.; Krol, E.S.; Lee, J.S. Novel Dimer Compounds That Bind α-Synuclein Can Rescue Cell Growth in a Yeast Model Overexpressing α-Synuclein. A Possible Prevention Strategy for Parkinson’s Disease. ACS Chem. Neurosci. 2016, 7, 1671–1680. [Google Scholar] [CrossRef]
- Nwabufo, C.K.; Aigbogun, O.P.; Allen, K.J.; Owens, M.N.; Lee, J.S.; Phenix, C.P.; Krol, E.S. Employing in vitro metabolism to guide design of F-labelled PET probes of novel α-synuclein binding bifunctional compounds. Xenobiotica 2021, 51, 885–900. [Google Scholar] [CrossRef] [PubMed]
- Moutaoufik, M.T.; Malty, R.; Amin, S.; Zhang, Q.; Phanse, S.; Gagarinova, A.; Zilocchi, M.; Hoell, L.; Minic, Z.; Gagarinova, M. Rewiring of the human mitochondrial interactome during neuronal reprogramming reveals regulators of the respirasome and neurogenesis. Iscience 2019, 19, 1114–1132. [Google Scholar] [CrossRef] [PubMed]
- Chen, J.; Zaer, S.; Drori, P.; Zamel, J.; Joron, K.; Kalisman, N.; Lerner, E.; Dokholyan, N.V. The structural heterogeneity of α-synuclein is governed by several distinct subpopulations with interconversion times slower than milliseconds. Structure 2021, 29, 1048–1064. [Google Scholar] [CrossRef] [PubMed]
- Chen, J.; Zaer, S.; Drori, P.; Zamel, J.; Joron, K.; Kalisman, N.; Lerner, E.; Dokholyan, N.V. Additional simulation data of α-synuclein monomer. Dataset 2021. [Google Scholar]
- Thanos, P.K.; Wang, G.-J.; Volkow, N.D. Positron emission tomography as a tool for studying alcohol abuse. Alcohol Res. Health 2008, 31, 233. [Google Scholar]
- Halder, R.; Ritter, T. 18F-Fluorination: Challenge and Opportunity for Organic Chemists. J. Org. Chem. 2021, 86, 13873–13884. [Google Scholar] [CrossRef] [PubMed]
- Matthews, P.M.; Rabiner, E.A.; Passchier, J.; Gunn, R.N. Positron emission tomography molecular imaging for drug development. Br. J. Clin. Pharmacol. 2012, 73, 175–186. [Google Scholar] [CrossRef] [PubMed]
- Cherry, S.R. Fundamentals of positron emission tomography and applications in preclinical drug development. J. Clin. Pharmacol. 2001, 41, 482–491. [Google Scholar] [CrossRef] [PubMed]
- Ghosh, K.K.; Padmanabhan, P.; Yang, C.-T.; Ng, D.C.E.; Palanivel, M.; Mishra, S.; Halldin, C.; Gulyás, B. Positron emission tomographic imaging in drug discovery. Drug Discov. Today 2022, 27, 280–291. [Google Scholar] [CrossRef]
- Suridjan, I.; Comley, R.A.; Rabiner, E.A. The application of positron emission tomography (PET) imaging in CNS drug development. Brain Imaging Behav. 2019, 13, 354–365. [Google Scholar] [CrossRef] [PubMed]
- Bergström, M.; Grahnen, A.; Långström, B. Positron emission tomography microdosing: a new concept with application in tracer and early clinical drug development. Eur. J. Clin. Pharmacol. 2003, 59, 357–366. [Google Scholar] [CrossRef]
- Lee, C.-M.; Farde, L. Using positron emission tomography to facilitate CNS drug development. Trends Pharmacol. Sci. 2006, 27, 310–316. [Google Scholar] [CrossRef]
- Gulyás, B.; Halldin, C.; Sóvágó, J.; Sandell, J.; Cselényi, Z.; Vas, Á.; Kiss, B.; Kárpáti, E.; Farde, L. Drug distribution in man: a positron emission tomography study after oral administration of the labelled neuroprotective drug vinpocetine. Eur. J. Nucl. Med. Mol. Imaging 2002, 29, 1031–1038. [Google Scholar] [CrossRef] [PubMed]
- Miyoshi, S.; Mitsuoka, K.; Nishimura, S.; Veltkamp, S.A. Radioisotopes in drug research and development: focus on positron emission tomography. Radioisot. Bio-Med. Sci. Rij. InTech—Open Access Publ. 2011, 93–114. [Google Scholar]
- Sekar, S.; Zhang, Y.; Miranzadeh Mahabadi, H.; Buettner, B.; Taghibiglou, C. Low-Field Magnetic Stimulation Alleviates MPTP-Induced Alterations in Motor Function and Dopaminergic Neurons in Male Mice. Int. J. Mol. Sci. 2023, 24, 10328. [Google Scholar] [CrossRef] [PubMed]
- Sekar, S.; Viswas, R.S.; Miranzadeh Mahabadi, H.; Alizadeh, E.; Fonge, H.; Taghibiglou, C. Concussion/mild traumatic brain injury (TBI) induces brain insulin resistance: a positron emission tomography (PET) scanning study. Int. J. Mol. Sci. 2021, 22, 9005. [Google Scholar] [CrossRef] [PubMed]
- Kakish, J.; Tavassoly, O.; Lee, J.S. Rasagiline, a suicide inhibitor of monoamine oxidases, binds reversibly to α-synuclein. ACS Chem. Neurosci. 2014, 6, 347–355. [Google Scholar] [CrossRef] [PubMed]
- Draper-Joyce, C.J.; Khoshouei, M.; Thal, D.M.; Liang, Y.-L.; Nguyen, A.T.; Furness, S.G.; Venugopal, H.; Baltos, J.-A.; Plitzko, J.M.; Danev, R. Structure of the adenosine-bound human adenosine A1 receptor–Gi complex. Nature 2018, 558, 559–563. [Google Scholar] [CrossRef]
- Ijzerman, A.P.; van Galen, P.J.; Jacobson, K.A. Molecular modeling of adenosine receptors. I. The ligand binding site on the A1 receptor. Drug Des. Discov. 1992, 9, 49. [Google Scholar] [PubMed]
- Carpenter, B.; Lebon, G. Human adenosine A2A receptor: molecular mechanism of ligand binding and activation. Front. Pharmacol. 2017, 8, 898. [Google Scholar] [CrossRef]
- Aigbogun, O.P.; Nwabufo, C.K.; Owens, M.N.; Allen, K.J.H.; Lee, J.S.; Phenix, C.P.; Krol, E.S. An HPLC-UV validated bioanalytical method for measurement of in vitro Phase 1 kinetics of α-synuclein binding bifunctional compounds. Xenobiotica 2022, 1–45. [Google Scholar] [CrossRef] [PubMed]
- Postuma, R.B.; Lang, A.E.; Munhoz, R.P.; Charland, K.; Pelletier, A.; Moscovich, M.; Filla, L.; Zanatta, D.; Rios Romenets, S.; Altman, R.; et al. Caffeine for treatment of Parkinson disease. Neurology 2012, 79, 651. [Google Scholar] [CrossRef]
- Postuma, R.B.; Anang, J.; Pelletier, A.; Joseph, L.; Moscovich, M.; Grimes, D.; Furtado, S.; Munhoz, R.P.; Appel-Cresswell, S.; Moro, A. Caffeine as symptomatic treatment for Parkinson disease (Café-PD): A randomized trial. Neurology 2017, 89, 1795–1803. [Google Scholar] [CrossRef] [PubMed]
- Prediger, R.D. Effects of caffeine in Parkinson’s disease: from neuroprotection to the management of motor and non-motor symptoms. J. Alzheimers Dis. 2010, 20, S205–S220. [Google Scholar] [CrossRef] [PubMed]
- Hernán, M.A.; Zhang, S.M.; Rueda-DeCastro, A.M.; Colditz, G.A.; Speizer, F.E.; Ascherio, A. Cigarette smoking and the incidence of Parkinson’s disease in two prospective studies. Ann. Neurol. 2001, 50, 780–786. [Google Scholar] [CrossRef] [PubMed]
- Checkoway, H.; Powers, K.; Smith-Weller, T.; Franklin, G.M.; Longstreth Jr, W.; Swanson, P.D. Parkinson’s disease risks associated with cigarette smoking, alcohol consumption, and caffeine intake. Am. J. Epidemiol. 2002, 155, 732–738. [Google Scholar] [CrossRef] [PubMed]
- Quik, M.; Perez, X.A.; Bordia, T. Nicotine as a potential neuroprotective agent for Parkinson’s disease. Mov. Disord. 2012, 27, 947–957. [Google Scholar] [CrossRef] [PubMed]
- Biswas, S.; Roy, R.; Biswas, R.; Bagchi, A. Structural analysis of the effects of mutations in Ubl domain of Parkin leading to Parkinson’s disease. Gene 2020, 726, 144186. [Google Scholar] [CrossRef] [PubMed]
- Levin, L.; Srour, S.; Gartner, J.; Kapitansky, O.; Qutob, N.; Dror, S.; Golan, T.; Dayan, R.; Brener, R.; Ziv, T. Parkin somatic mutations link melanoma and Parkinson’s disease. J. Genet. Genomics 2016, 43, 369–379. [Google Scholar] [CrossRef]
- Wahlqvist, M.L.; Lee, M.-S.; Hsu, C.-C.; Chuang, S.-Y.; Lee, J.-T.; Tsai, H.-N. Metformin-inclusive sulfonylurea therapy reduces the risk of Parkinson’s disease occurring with Type 2 diabetes in a Taiwanese population cohort. Parkinsonism Relat. Disord. 2012, 18, 753–758. [Google Scholar] [CrossRef]
- Paudel, Y.N.; Angelopoulou, E.; Piperi, C.; Shaikh, M.F.; Othman, I. Emerging neuroprotective effect of metformin in Parkinson’s disease: A molecular crosstalk. Pharmacol. Res. 2020, 152, 104593. [Google Scholar] [CrossRef] [PubMed]
- Agostini, F.; Masato, A.; Bubacco, L.; Bisaglia, M. Metformin repurposing for Parkinson disease therapy: opportunities and challenges. Int. J. Mol. Sci. 2022, 23, 398. [Google Scholar] [CrossRef] [PubMed]
- Mor, D.E.; Sohrabi, S.; Kaletsky, R.; Keyes, W.; Tartici, A.; Kalia, V.; Miller, G.W.; Murphy, C.T. Metformin rescues Parkinson’s disease phenotypes caused by hyperactive mitochondria. Proc. Natl. Acad. Sci. 2020, 117, 26438–26447. [Google Scholar] [CrossRef] [PubMed]
- Winklhofer, K.F.; Haass, C. Mitochondrial dysfunction in Parkinson’s disease. Biochim. Biophys. Acta BBA-Mol. Basis Dis. 2010, 1802, 29–44. [Google Scholar] [CrossRef]
- Abou-Sleiman, P.M.; Muqit, M.M.; Wood, N.W. Expanding insights of mitochondrial dysfunction in Parkinson’s disease. Nat. Rev. Neurosci. 2006, 7, 207–219. [Google Scholar] [CrossRef]
- Malpartida, A.B.; Williamson, M.; Narendra, D.P.; Wade-Martins, R.; Ryan, B.J. Mitochondrial dysfunction and mitophagy in Parkinson’s disease: from mechanism to therapy. Trends Biochem. Sci. 2021, 46, 329–343. [Google Scholar] [CrossRef] [PubMed]
- Dimpfel, W.; Hoffmann, J. Effects of rasagiline, its metabolite aminoindan and selegiline on glutamate receptor mediated signalling in the rat hippocampus slice in vitro. BMC Pharmacol. 2011, 11, 1–10. [Google Scholar] [CrossRef] [PubMed]
- Chau, K.; Cooper, J.; Schapira, A. Rasagiline protects against alpha-synuclein induced sensitivity to oxidative stress in dopaminergic cells. Neurochem. Int. 2010, 57, 525–529. [Google Scholar] [CrossRef] [PubMed]
- Bar-Am, O.; Weinreb, O.; Amit, T.; Youdim, M.B. The neuroprotective mechanism of 1-(R)-aminoindan, the major metabolite of the anti-parkinsonian drug rasagiline. J. Neurochem. 2010, 112, 1131–1137. [Google Scholar] [CrossRef] [PubMed]
- Neyroud, D.; Cheng, A.J.; Donnelly, C.; Bourdillon, N.; Gassner, A.-L.; Geiser, L.; Rudaz, S.; Kayser, B.; Westerblad, H.; Place, N. Toxic doses of caffeine are needed to increase skeletal muscle contractility. Am. J. Physiol.-Cell Physiol. 2019, 316, C246–C251. [Google Scholar] [CrossRef] [PubMed]
- Grgic, J. Effects of Caffeine on Resistance Exercise: A Review of Recent Research. Sports Med. 2021, 51, 2281–2298. [Google Scholar] [CrossRef] [PubMed]
- Kang, J.H.; Lee, S.K. Progressive nicotine poisoning by multiple transdermal nicotine patches. J. Med. Life Sci. 2021, 18, 31–34. [Google Scholar] [CrossRef]
- Dworzański, W.; Opielak, G.; Burdan, F. Side effects of caffeine. Pol. Merkur. Lek. Organ Pol. Tow. Lek. 2009, 27, 357–361. [Google Scholar]
- Carstens, E.; Carstens, M.I. Sensory effects of nicotine and tobacco. Nicotine Tob. Res. 2022, 24, 306–315. [Google Scholar] [CrossRef] [PubMed]
- Fiore, M.C.; Jorenby, D.E.; Baker, T.B.; Kenford, S.L. Tobacco dependence and the nicotine patch: clinical guidelines for effective use. Jama 1992, 268, 2687–2694. [Google Scholar] [CrossRef] [PubMed]
- Nwabufo, C.K.; Aigbogun, O.P. Diagnostic and therapeutic agents that target alpha-synuclein in Parkinson’s disease. J. Neurol. 2022, 269, 5762–5786. [Google Scholar] [CrossRef]
- Taylor, E.M. The impact of efflux transporters in the brain on the development of drugs for CNS disorders. Clin. Pharmacokinet. 2002, 41, 81–92. [Google Scholar] [CrossRef] [PubMed]
- Wager, T.T.; Hou, X.; Verhoest, P.R.; Villalobos, A. Central Nervous System Multiparameter Optimization Desirability: Application in Drug Discovery. ACS Chem. Neurosci. 2016, 7, 767–775. [Google Scholar] [CrossRef]
- Zhang, L.; Villalobos, A.; Beck, E.M.; Bocan, T.; Chappie, T.A.; Chen, L.; Grimwood, S.; Heck, S.D.; Helal, C.J.; Hou, X.; et al. Design and selection parameters to accelerate the discovery of novel central nervous system positron emission tomography (PET) ligands and their application in the development of a novel phosphodiesterase 2A PET ligand. J. Med. Chem. 2013, 56, 4568–4579. [Google Scholar] [CrossRef] [PubMed]
- Zhang, L.; Chen, L.; Beck, E.M.; Chappie, T.A.; Coelho, R. V.; Doran, S.D.; Fan, K.H.; Helal, C.J.; Humphrey, J.M.; Hughes, Z.; et al. The Discovery of a Novel Phosphodiesterase (PDE) 4B-Preferring Radioligand for Positron Emission Tomography (PET) Imaging. J. Med. Chem. 2017, 60, 8538–8551. [Google Scholar] [CrossRef]
- Kaide, S.; Watanabe, H.; Iikuni, S.; Hasegawa, M.; Ono, M. Synthesis and Evaluation of 18F-Labeled Chalcone Analogue for Detection of α-Synuclein Aggregates in the Brain Using the Mouse Model. ACS Chem. Neurosci. 2022, 13, 2982–2990. [Google Scholar] [CrossRef]
- Lindberg, A.; Knight, A.C.; Sohn, D.; Rakos, L.; Tong, J.; Radelet, A.; Mason, N.S.; Stehouwer, J.S.; Lopresti, B.J.; Klunk, W.E.; et al. Radiosynthesis, in Vitro and in Vivo Evaluation of [18F]CBD-2115 as a First-in-Class Radiotracer for Imaging 4R-Tauopathies. ACS Chem. Neurosci. 2021, 12, 596–602. [Google Scholar] [CrossRef] [PubMed]
- Murrell, E.; Tong, J.; Smil, D.; Kiyota, T.; Aman, A.M.; Isaac, M.B.; Watson, I.D.G.; Vasdev, N. Leveraging Open Science Drug Development for PET: Preliminary Neuroimaging of 11C-Labeled ALK2 Inhibitors. ACS Med. Chem. Lett. 2021, 12, 846–850. [Google Scholar] [CrossRef] [PubMed]
- Urbina, F.; Zorn, K.M.; Brunner, D.; Ekins, S. Comparing the Pfizer Central Nervous System Multiparameter Optimization Calculator and a BBB Machine Learning Model. ACS Chem. Neurosci. 2021, 12, 2247–2253. [Google Scholar] [CrossRef] [PubMed]
- Klann, E.M.; Dissanayake, U.; Gurrala, A.; Farrer, M.; Shukla, A.W.; Ramirez-Zamora, A.; Mai, V.; Vedam-Mai, V. The Gut–Brain Axis and Its Relation to Parkinson’s Disease: A Review. Front. Aging Neurosci. 2022, 13. [Google Scholar] [CrossRef] [PubMed]
- Tan, A.H.; Lim, S.Y.; Lang, A.E. The microbiome–gut–brain axis in Parkinson disease — from basic research to the clinic. Nat. Rev. Neurol. 2022, 18, 476–495. [Google Scholar] [CrossRef] [PubMed]
- Chan, D.G.; Ventura, K.; Villeneuve, A.; Du Bois, P.; Holahan, M.R. Exploring the Connection Between the Gut Microbiome and Parkinson’s Disease Symptom Progression and Pathology: Implications for Supplementary Treatment Options. J. Park. Dis. 2022, 12, 2339–2352. [Google Scholar] [CrossRef]
- Nguyen, A.T.N.; Tran, Q.L.; Baltos, J.-A.; McNeill, S.M.; Nguyen, D.T.N.; May, L.T. Small molecule allosteric modulation of the adenosine A1 receptor. Front. Endocrinol. 2023, 14. [Google Scholar] [CrossRef]
- Nguyen, N.T.; Nguyen, T.H.; Pham, T.N.H.; Huy, N.T.; Bay, M.V.; Pham, M.Q.; Nam, P.C.; Vu, V.V.; Ngo, S.T. Autodock vina adopts more accurate binding poses but autodock4 forms better binding affinity. J. Chem. Inf. Model. 2019, 60, 204–211. [Google Scholar] [CrossRef]
- Bruns, R.F.; Fergus, J.H. Allosteric enhancement of adenosine A1 receptor binding and function by 2-amino-3-benzoylthiophenes. Mol. Pharmacol. 1990, 38, 939–949. [Google Scholar]
- Ferguson, G.N.; Valant, C.; Horne, J.; Figler, H.; Flynn, B.L.; Linden, J.; Chalmers, D.K.; Sexton, P.M.; Christopoulos, A.; Scammells, P.J. 2-aminothienopyridazines as novel adenosine A1 receptor allosteric modulators and antagonists. J. Med. Chem. 2008, 51, 6165–6172. [Google Scholar] [CrossRef] [PubMed]
- Cleary, C.; Linde, J.; Hiscock, K.; Hadas, I.; Belmaker, R.; Agam, G.; Flaisher-Grinberg, S.; Einat, H. Antidepressive-like effects of rapamycin in animal models: Implications for mTOR inhibition as a new target for treatment of affective disorders. Brain Res. Bull. 2008, 76, 469–473. [Google Scholar] [CrossRef]
- Flaisher-Grinberg, S.; Einat, H. A possible utilization of the mice forced swim test for modeling manic-like increase in vigor and goal-directed behavior. J. Pharmacol. Toxicol. Methods 2009, 59, 141–145. [Google Scholar] [CrossRef] [PubMed]
- Chen, Z.; Xiong, C.; Pancyr, C.; Stockwell, J.; Walz, W.; Cayabyab, F.S. Prolonged Adenosine A1 Receptor Activation in Hypoxia and Pial Vessel Disruption Focal Cortical Ischemia Facilitates Clathrin-Mediated AMPA Receptor Endocytosis and Long-Lasting Synaptic Inhibition in Rat Hippocampal CA3-CA1 Synapses: Differential Regulat. J. Neurosci. 2014, 34, 9621. [Google Scholar] [CrossRef] [PubMed]
- Zhang, Y.; Wang, T.; Zhang, X.; Deuther-Conrad, W.; Fu, H.; Cui, M.; Zhang, J.; Brust, P.; Huang, Y.; Jia, H. Discovery and development of brain-penetrant 18F-labeled radioligands for neuroimaging of the sigma-2 receptors. Acta Pharm. Sin. B 2022, 12, 1406–1415. [Google Scholar] [CrossRef] [PubMed]
| Organ | 5 min | 10 min | 20 min | 40 min | 60 min |
|---|---|---|---|---|---|
| Blood | 0.76 ± 0.040 | 0.78 ± 0.14 | 0.67 ± 0.19 | 0.48 ± 0.029 | 0.39 ± 0.11 |
| Liver | 5.12 ± 1.65 | 6.91 ± 2.02 | 6.64 ± 1.44 | 4.76 ± 0.54 | 5.74 ± 1.12 |
| Small intestine | 8.56 ± 2.02 | 11.18 ± 3.11 | 13.02 ± 1.24 | 9.35 ± 1.82 | 12.33 ± 0.81 |
| Kidney | 16.26 ± 1.82 | 11.86 ± 1.74 | 11.02 ± 0.48 | 8.65± 1.21 | 4.27 ± 0.37 |
| Spleen | 6.54 ± 0.88 | 5.49 ± 1.05 | 5.71 ± 0.69 | 5.80 ± 0.83 | 3.79 ± 0.33 |
| Lung | 7.03 ± 1.24 | 5.51 ± 0.44 | 5.52 ± 0.72 | 3.00 ± 1.40 | 1.42 ±0.22 |
| Heart | 2.34 ± 0.26 | 1.77 ± 0.17 | 1.14 ± 0.040 | 1.01 ± 0.16 | 0.49 ± 0.018 |
| Large intestine | 2.98 ± 0.94 | 3.06 ± 0.73 | 2.83 ± 0.068 | 2.69 ± 0.26 | 2.50 ± 0.93 |
| Bone | 1.00 ± 0.18 | 1.24 ± 0.44 | 1.18 ± 0.005 | 1.04 ± 0.27 | 1.20 ± 0.34 |
| Brain | 0.17 ± 0.014 | 0.14 ± 0.027 | 0.10 ± 0.013 | 0.10 ± 0.011 | 0.05 ± 0.005 |
| Time (min) | Flow Rate (ml/min) | Mobile Phase A (%) | Mobile Phase B (%) |
|---|---|---|---|
| 0.00 | 5 | 90 | 10 |
| 3.00 | 5 | 90 | 10 |
| 7.00 | 5 | 60 | 40 |
| 10.00 | 5 | 40 | 60 |
| 15.00 | 5 | 10 | 90 |
| 17.00 | 5 | 10 | 90 |
| 18.00 | 5 | 90 | 10 |
| 21.00 | 5 | 90 | 10 |
Disclaimer/Publisher’s Note: The statements, opinions and data contained in all publications are solely those of the individual author(s) and contributor(s) and not of MDPI and/or the editor(s). MDPI and/or the editor(s) disclaim responsibility for any injury to people or property resulting from any ideas, methods, instructions or products referred to in the content. |
© 2024 by the authors. Licensee MDPI, Basel, Switzerland. This article is an open access article distributed under the terms and conditions of the Creative Commons Attribution (CC BY) license (http://creativecommons.org/licenses/by/4.0/).


