Submitted:
12 June 2024
Posted:
13 June 2024
You are already at the latest version
Abstract

Keywords:
1. Introduction
2. Materials and Methods
2.1. Materials
2.2. Methods
2.2.1. Preparation of Liposome Dispersion
2.2.2. Preparation of the Creams and Emulgels
2.2.3. Physico-Chemical Characterization of the Liposome Dispersion
2.2.3.1. Evaluation of Encapsulation Efficiency
2.2.4. Physico-Chemical Characterization of Creams and Emulgels
2.2.5. Texture Profile Analysis (TPA) of Creams and Emulgels
2.2.6. Examination of Sensory Properties
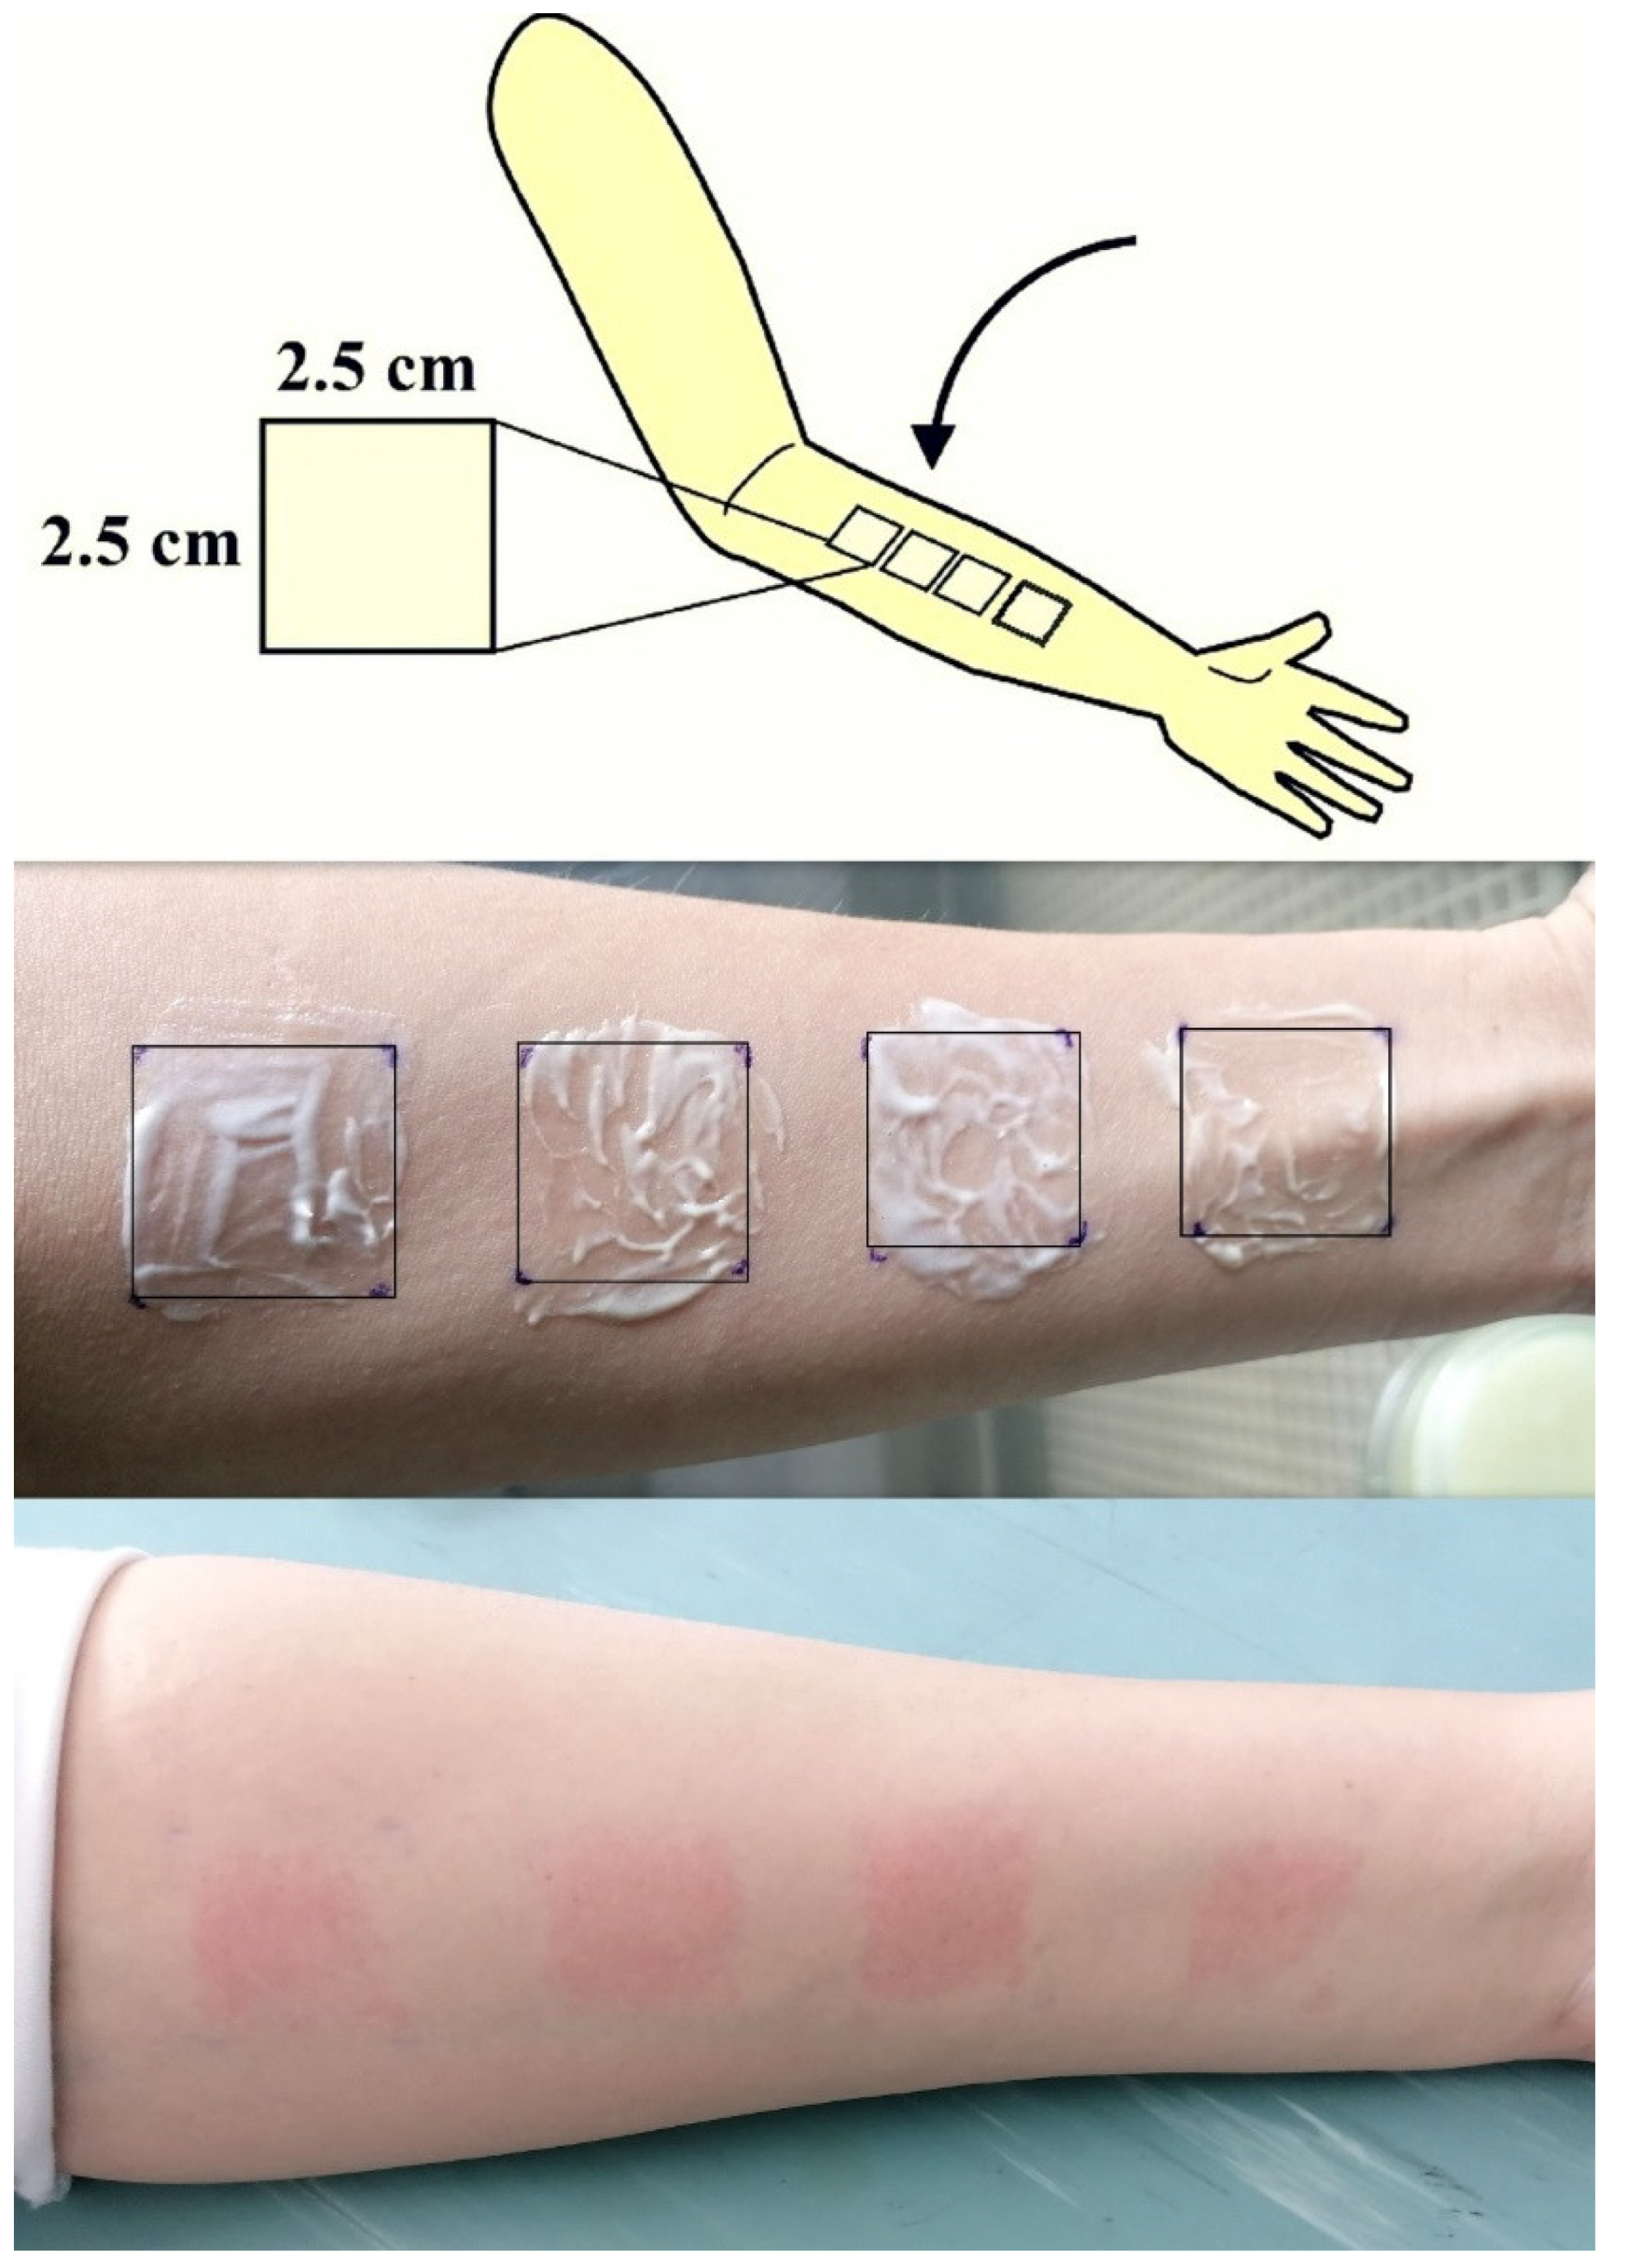
2.2.7. Tape Stripping
2.2.8. HPLC Analysis
2.2.8.1. The chromatographic Conditions
2.2.8.2. Sample Extraction
2.2.9. Ethical Standards
2.2.10. Statistical Analysis
3. Results and Discussion
4. Conclusions
Author Contributions
Funding
Institutional Review Board Statement
Informed Consent Statement
Data Availability Statement
Acknowledgments
Conflicts of Interest
References
- Caritá, A.C.; Santos, B.F.; Shultz, J.D.; Kohn, B.M.; Chorilli, M.; Leonardi, G.R. Vitamin C: One compound, several uses. Advances for delivery, efficiency and stability. Nanomedicine. 2020, 24, 102117. [Google Scholar] [CrossRef]
- Pouillot, A.; Polla, L.A.; Tacchini, P. Natural antioxidants and their effects on the skin. Formulating, packaging, and marketing of natural cosmetic products. 2011, 13, 239–257. [Google Scholar]
- Humbert, P.G.; Haftek, M.; Creidi, P. Topical ascorbic acid on photoaged skin. Clinical, topographical and ultrastructural evaluation: double-blind study vs. placebo. Exp. Dermatol. 2003, 12, 237–244. [Google Scholar] [CrossRef] [PubMed]
- Fitzpatrick, R.E.; Rostan, D. Double blind, half-face study comparing topical vitamin C vehicle for rejuvenation of photodamage. Dermatol. Surg. 2002, 28, 231–238. [Google Scholar] [PubMed]
- Hinek, A.; Kim, H.J.; Wang, Y.; Wang, A.; Mitts, T.F. Sodium L-ascorbate enhances elastic fibers deposition by fibroblasts from normal and pathologic human skin. J. Dermatol. Sci. 2014, 75, 173–182. [Google Scholar] [CrossRef] [PubMed]
- Kishimoto, Y.; Saito, N.; Kurita, K.; Shimokado, K.; Maruyama, N.; Ishigami, A. Ascorbic acid enhances the expression of type 1 and type 4 collagen and SVCT2 in cultured human skin fibroblasts. Biochem. Biophys. Res. Commun. 2013, 430, 579–584. [Google Scholar] [CrossRef] [PubMed]
- Hwang, S.W.; Oh, D.J.; Lee, D.; Kim, J.W.; Park, S.W. Clinical efficacy of 25% L-ascorbic acid (C’ensil) in the treatment of melisma. J. Cutan. Med. Surg. 2009, 13, 74–81. [Google Scholar] [CrossRef] [PubMed]
- Stamford, N.P. Stability, transdermal penetration, and cutaneous effects of ascorbic acid and its derivatives. J Cosmet Dermatol. 2012, 11, 310–7. [Google Scholar] [CrossRef] [PubMed]
- Farris, K. Topical vitamin C for photoaging and other conditions. Dermatol. Surg. 2005, 31, 814–818. [Google Scholar] [CrossRef]
- Sorice, A.; Guerriero, E.; Capone, F.; Colonna, G.; Castello, G.; Costantini, S. Ascorbic acid: its role in immune system and chronic inflammation diseases. Mini Rev Med Chem. 2014, 14, 444–452. [Google Scholar] [CrossRef]
- Stolić Jovanović, A.; Martinović, M.; Žugić, A.; Nešić, I.; Tosti, T.; Blagojević, S.; Tadić, V.M. Derivatives of L-Ascorbic Acid in Emulgel: Development and Comprehensive Evaluation of the Topical Delivery System. Pharmaceutics. 2023, 15, 813. [Google Scholar] [CrossRef]
- Dini, I. Contribution of Nanoscience Research in Antioxidants Delivery Used in Nutricosmetic Sector. Antioxidants. 2022, 11, 563. [Google Scholar] [CrossRef] [PubMed]
- Baek, J.; Ramasamy, M.; Willis, N.C.; Kim, D.S.; Anderson, W.A.; Tam, K.C. Encapsulation and controlled release of vitamin C in modified cellulose nanocrystal/chitosan nanocapsules. Curr. Res. Food Sci. 2021, 4, 215–223. [Google Scholar] [CrossRef]
- Fraj, J.; Petrović, L.; Ðekić, L.; Budinčić, J.M.; Bučko, S.; Katona, J. Encapsulation and release of vitamin C in double W/O/W emulsions followed by complex coacervation in gelatin-sodium caseinate system. J. Food Eng. 2021, 292, 110353. [Google Scholar] [CrossRef]
- Kaur, I.P.; Kapila, M.; Agrawal, R. Role of novel delivery systems in developing topical antioxidants as therapeutics to combat photoageing, Ageing Res. Rev. 2007, 6, 271–288. [Google Scholar] [CrossRef]
- Nielloud, F.; Marti-Mestres, G. Pharmaceutical Emulsions and Suspensions, 2nd ed.; Marcel Dekker, Inc: New York, NY, USA, 2000. [Google Scholar]
- Savary, G.; Gilbert, L.; Grisel, M.; Picard, C. Instrumental and sensory methodologies to characterize the residual film of topical products applied to skin. Skin Res Tech 2019, 25, 415–23. [Google Scholar] [CrossRef]
- Haneefa, K.M.; Mohanta, G.P.; Nayar, C. Emulgel: An Advanced Review. J. Pharm. Sci. Res. 2013, 5, 254–258. [Google Scholar]
- Asija, R.; Sharma, R.; Gupta, A. Emulgel: A novel approach to topical drug delivery. J. Biomed. Pharm. Res. 2013, 2, 91–94. [Google Scholar]
- Sushma, G.; Pravalika, T.; Sri, B.R.; Priyanaka, P.; Priya, P.V.; Sharma, J.V.C. Emulgels-A Novel Approach for Topical Drug Delivery. Int. J. Pharm. Sci. Rev. Res. 2021, 67, 142–147. [Google Scholar] [CrossRef]
- Panchal, B.; Rathi, S. Topical emulgel: A review on state of art. PSM. 2018, 9, 253–264. [Google Scholar]
- Austria, R.; Semenzato, A.; Bettero, A. Stability of vitamin C derivatives in solution and topical formulations. J. Pharm. Biomed. Anal. 1997, 15, 795–801. [Google Scholar] [CrossRef] [PubMed]
- Špiclin, P.; Gašperlin, M.; Kmetec, V. Stability of ascorbylpalmitate in topical microemulsions. Int. J. Pharm. 2001, 222, 271–279. [Google Scholar] [CrossRef] [PubMed]
- Carstensen, JT. Oxidation in solution. In: Carstensen JT, Rhodes CT, editors. Drug Stability, Principles and Practices. Dekker, New York; 2000. p. 113–131.
- vanHoogevest, P.; Fahr, A.; in Nanocosmetics(Eds:, J. Cornier, C.M. Keck, M. Van de Voorde), Springer, Cham, Switzerland 2019, p. 95.
- Verma, D.D.; Verma, S.; Blume, G.; Fahr, A. Liposomes increase skin penetration of entrapped and non-entrapped hydrophilic substances into human skin: a skin penetration and confocal laser scanning microscopy study. Eur J Pharm Biopharm. 2003, 55, 271–277. [Google Scholar] [CrossRef] [PubMed]
- Raj, S.; Jose, S.; Sumod, U.S.; Sabitha, M. Nanotechnology in cosmetics: opportunities and challenges. J Pharm Bioanal Sci. 2012, 4, 186–193. [Google Scholar] [CrossRef] [PubMed]
- Rapalli, V.K.; Singhvi, G. Dermato-pharmacokinetic: assessment tools for topically applied dosage forms. Expert Opinion on Drug Delivery 2021, 18, 423–426. [Google Scholar] [CrossRef] [PubMed]
- Pensado, A.; Chiu, W.S.; Cordery, S.F.; Rantou, E.; Bunge, A.L.; Delgado-Charro, M.B. ; Stratum corneum sampling to assess bioequivalence between topical acyclovir products. Pharm Res. 2019, 36, 180. [Google Scholar] [CrossRef]
- N’Dri-Stempfer, B.; Navidi, W.C.; Guy, R.H.; Bunge, A.L. Improved bioequivalence assessment of topical dermatological drug products using dermatopharmacokinetics. Pharm Res. 2009, 26, 316–28. [Google Scholar] [CrossRef] [PubMed]
- Petrović, S.; Tačić, A.; Savić, S.; Nikolić, V.; Nikolić, L.; Savić, S. Sulfanilamide in solution and liposome vesicles; in vitro release and UV-stability studies. SPJ. 2017, 25, 1194–1200. [Google Scholar] [CrossRef]
- Ohsawa, T.; Miura, H.; Harada, K. Improvement of encapsulation efficiency of water-soluble drugs in liposomes formed by the freeze-thawing method. Chemical and pharmaceutical bulletin 1985, 33, 3945–3952. [Google Scholar] [CrossRef]
- Rupp, C.; Steckel, H.; Müller, B.W. Mixed micelle formation with phosphatidylcholines: The influence of surfactants with different molecule structures. Int. J. Pharm. 2010, 387, 120–128. [Google Scholar] [CrossRef] [PubMed]
- Sun, W.; Zhang, N.; Li, A.; Zou, W.; Xu, W. Preparation and evaluation of N3-O-toluyl-fluorouracil-loaded liposomes. Int. J. Pharm. 2008, 353, 243–250. [Google Scholar] [CrossRef]
- Tadić, V.M.; Žugić, A.; Martinović, M.; Stanković, M.; Maksimović, S.; Frank, A.; Nešić, I.; Enhanced Skin Performance of Emulgel, vs. Cream as Systems for Topical Delivery of Herbal Actives (Immortelle Extract and Hemp Oil). Pharmaceutics 2021, 13, 1919. [Google Scholar] [CrossRef] [PubMed]
- Tadić, V.M.; Nešić, I.; Martinović, M.; Rój, E.; Brašanac-Vukanović, S.; Maksimović, S.; Žugić, A. Old plant, new possibilities: Wild bilberry (Vacciniummyrtillus L., Ericaceae) in topical skin preparation. Antioxidants. 2021, 10, 465. [Google Scholar] [CrossRef] [PubMed]
- Pugliese, P.T. The skin’s antioxidant systems.<italic> DermatolNurs. </italic>1998, 10: 401–116:quiz 17–18. http://www.dermatologynursing.net/cgi-bin/WebObjects/DNJournal.woa/wa/viewSection?s_id=1073744810&ss_id=1&tName=issueTOC.
- Al-Niaimi, F.; Chiang, N.Y.Z. Topical vitamin C and the skin: mechanisms of action and clinical applicabhtions. J ClinAesthetDermatol. 2017, 10, 14. [Google Scholar]
- Meščić Macan, A.; Gazivoda Kraljević, T.; Raić-Malić, S. Therapeutic perspective of vitamin C and its derivatives. Antioxidants. 2019, 8, 247. [Google Scholar] [CrossRef] [PubMed]
- Tripathi, R.; Singh, B.; Bisht, S.S.; Pandey, J. L-ascorbic acid in organic synthesis: An overview. Curr. Org. Chem. 2009, 13, 99–122. [Google Scholar] [CrossRef]
- Weber, V.; Coudert, P.; Rubat, C.; Duroux, E.; Leal, F. , Couquelet, J. Antioxidant properties of novel lipophilic ascorbic acid analogues. J. Pharm. Pharmacol. 2000, 52, 523–530. [Google Scholar] [CrossRef] [PubMed]
- Patravale, V.B.; Mandawgade, S.D. Novel cosmetic delivery systems: an application update. Int J Cosmet Sci. 2008, 30, 19–33. [Google Scholar] [CrossRef] [PubMed]
- Reva, T.; Vaseem, A.A.; Satyaprakash, S. Md.khalid, J.A. Liposomes: The novel approach in cosmaceuticals. World J Pharm Pharm Sci. 2015, 4, 1616–1640. [Google Scholar]
- Wu, Y.; Zheng, X.; Xu, X.G.; Li, Y.H.; Wang, B.; Gao, X.H.; Chen, H.D.; Yatskayer, M.; Oresajo, C. Protective effects of a topical antioxidant complex containing vitamins C and E and ferulic acid against ultraviolet irradiation-induced photodamage in Chinese women. J. Drugs Dermatol. 2013, 12, 464–468. [Google Scholar]
- Xu, T.H.; Chen, J.Z.; Li, Y.H.; Wu, Y.; Luo, Y.J.; Gao, X.H.; Chen, H.D. Split-face study of topical 23.8% L-ascorbic acid serum in treating photo-aged skin. J. Drugs Dermatol. 2012, 11, 51–56. [Google Scholar] [PubMed]
- Serrano, G.; Almudever, P.; Serrano, J.M.; Milara, J.; Torrens, A.; Exposito, I.; Cortijo, J. Phosphatidylcholine liposomes as carriers to improve topical ascorbic acid treatment of skin disorders. Clin. Cosmet. Investig. Dermatol. 2015, 8, 591–599. [Google Scholar] [PubMed]
- Gosenca, M.; Bešter-Rogač, M.; Gašperlin, M. Lecithin based lamellar liquid crystals as a physiologically acceptable dermal delivery system for ascorbylpalmitate. Eur. J. Pharm. Sci. 2013, 50, 114–122. [Google Scholar] [CrossRef] [PubMed]
- Jiao, Z.; Wang, X.; Yin, Y.; Xia, J.; Mei, Y. Preparation and evaluation of a chitosan-coated antioxidant liposome containing vitamin C and folic acid. Journal of Microencapsulation 2018, 35, 272–280. [Google Scholar] [CrossRef] [PubMed]
- Zhou, W.; Liu, W.; Zou, L.; Liu, W.; Liu, C.; Liang, R.; Chen, J. Storage stability and skin permeation of vitamin C liposomes improved by pectin coating. Colloids Surf. B Biointerfaces 2014, 117, 330–337. [Google Scholar] [CrossRef] [PubMed]
- Yoo, J.; Shanmugam, S.; Song, C.K. Skin penetration and retention of L-ascorbic acid 2-phosphate using multilamellar vesicles. Arch Pharm Res. 2008, 31, 1652–1658. [Google Scholar] [CrossRef] [PubMed]
- Khatibi, S.A.; Misaghi, A.; Moosavy, M.H.; Amoabediny, G.; Basti, A.A. Effect of preparation methods on the properties of Zatariamultifloraboiss. essential oil loaded nanoliposomes: Characterization of size, encapsulation efficiency and stability. Pharm. Sci. 2015, 20, 141–148. [Google Scholar]
- Poudel, A.; Gachumi, G.; Wasan, K.M.; DallalBashi, Z.; El-Aneed, A.; Badea, I. Development and Characterization of Liposomal Formulations Containing Phytosterols Extracted from Canola Oil Deodorizer Distillate along with Tocopherols as Food Additives. Pharmaceutics. 2019, 11, 185. [Google Scholar] [CrossRef]
- Betz, G.; Imboden, R.; Imanidis, G. Interaction of liposome formulations with human skin in vitro. Int J Pharm. 2001, 229, 117–129. [Google Scholar] [CrossRef]
- Contreras, M.F.; Soriano, M.J.; Diéguez, A.R. In vitro percutaneous absorption of all-trans retinoic acid applied in free form or encapsulated in stratum corneum lipid liposomes. Int J Pharm. 2005, 297, 134–145. [Google Scholar] [CrossRef]
- Doi, N.; Yamada, Y.; Toyoshima, M.; Kondo, Y.; Nakaoji, K.; Hamada, K.; Tatsuka, M. Facial Treatment with 3-O-Cetyl Ascorbic Acid for Improvement of Skin Texture: Uptake, Effectiveness, and In Vitro Carcinogenicity Assessment. Cosmetics. 2021, 8, 38. [Google Scholar] [CrossRef]
- Shirata, M.M.F.; Maia Campos, P.M.B.G. Importance of texture and sensorial profile in cosmetic formulations development. Surg. Cosmet. Dermatol 2016, 187, 223. [Google Scholar] [CrossRef]
| Ingredients (INCI name) | %, (w/w) |
|---|---|
| Phosal 40IP | 10.00 |
| Ascorbyl palmitate | 5.00 |
| Propylene glycol | 10.00 |
| Phenoxyethanol (and) Ethylhexylglycerin | 1.00 |
| Aqua (Water) | ad 100.00 |
| Ingredients(INCI name) | LipoEmulgel (LE) | Emulgel (E) | LipoCream (LC) | Cream (C) | Function in the formulation | ||||||
|---|---|---|---|---|---|---|---|---|---|---|---|
| Oil phase | |||||||||||
| Caprylic/capric triglycerides | 11.00 | 11,00 | 11.00 | 11.00 | Emollient | ||||||
| Isopropyl myristate | 7.50 | 7.50 | 7.50 | 7.50 | Emollient | ||||||
| Olive oil | 3.00 | 3.00 | 3.00 | 3.00 | Emollient | ||||||
| Cetearyl alcohol (and)Coco-glucoside | 7.00 | 7.00 | 7.00 | 7.00 | O/W emulsifier | ||||||
| Myristyl alcohol (and)Myristyl glucoside | 1.50 | 1.50 | 1.50 | 1.50 | O/W emulsifier | ||||||
| Ascorbylpalmitate | - | 2.00 | - | 2.00 | Active substance | ||||||
| Ascorbylpalmitatedispersion | 40.00 | - | 40.00 | - | Active substance | ||||||
| Water phase | |||||||||||
| Hydroxyethyl cellulose (HEC) | 1.00 | 1.00 | - | - | Thickener/Gelling agent | ||||||
| Propylene glycol | 10.00 | 10.00 | 10.00 | 10.00 | Humectant | ||||||
| Phenoxyethanol (and) Ethylhexylglycerin | 1.00 | 1.00 | 1.00 | 1.00 | Preservative | ||||||
| Aqua (Water) | ad 100.00 | ad 100.00 | ad 100.00 | ad 100.00 | Solvent | ||||||
| Test Speed | 2 mm/s |
| Target Value | 2 mm |
| Trigger load | 10g |
| Probe | Cone probe, TA-STF |
| Measured parameters | Hardness cycle 1 Hardness cycle 2 Cohesiveness Adhesiveness |
| pH | ||||
|---|---|---|---|---|
| Before centrifuge assay | After centrifuge assay | After accelerated stability test | After 30 days ((21 ± 2°C) |
|
| LE | 4.50 | 4.55 | 4.51 | 4.53 |
| E | 4.66 | 4.65 | 4.59 | 4.56 |
| LC | 4.39 | 4.31 | 4.35 | 4.35 |
| C | 4.90 | 4.93 | 4.91 | 4.87 |
| Electrical conductivity (μS/cm) | ||||
| Before centrifuge assay |
After centrifuge assay |
After accelerated stability test |
After 30 days ((21 ± 2°C) |
|
| LE | 50.20 | 51.10 | 51.44 | 51.41 |
| E | 52.90 | 50.40 | 52.95 | 52.47 |
| LC | 39.60 | 37.80 | 40.11 | 39.87 |
| C | 59.10 | 57.10 | 56.15 | 58.65 |
| Organoleptic properties (color, smell,appearance) | ||||
| LE | yellowish-white, no odor, glossy | yellowish-white, no odor, glossy | yellowish-white, no odor, glossy | yellowish-white, no odor, glossy |
| E | white, no odor, glossy | white, no odor, glossy | white, no odor, glossy | white, no odor,glossy |
| LC | yellowish-white, no odor, glossy | yellowish-white, no odor, glossy | yellowish-white, no odor, glossy | yellowish-white, no odor, glossy |
| C | yellowish-white, no odor, glossy | yellowish-white, no odor, glossy | yellowish-white, no odor, glossy | yellowish-white, no odor, glossy |
| Adhesiveness (mJ) |
Cohesiveness | Hardness Cycle 1 (g) |
Hardness Cycle 2 (g) |
|
|---|---|---|---|---|
| LE | 0.43±0.06 | 1.54±0.18 | 27.67±3.79 | 25.67±4.04 |
| E | 0.43±0.06 | 1.78±0.15 | 25.33±1.53 | 24.33±1.53 |
| LC | 0.50±0.20 | 1.48±0.28 | 25.67±4.51 | 24.33±5.03 |
| C | 0.33±0.06 | 1.74±0.24 | 23.33±2.52 | 22.00±2.65 |
| Before Application | ||||
|---|---|---|---|---|
| LE | E | LC | C | |
| Consistency | 10.00 | 9.71 | 9.71 | 9.71 |
| Gloss level | 6.95 | 6.12 | 6.59 | 6.12 |
| LE | E | LC | C | ||
|---|---|---|---|---|---|
| Physico-chemical characteristics) | Organoleptic properties | Acceptable | Acceptable | Acceptable | Acceptable |
| pH | Within the range suggested for topical preparations | Within the range suggested for topical preparations | Within the range suggested for topical preparations | Within the range suggested for topical preparations | |
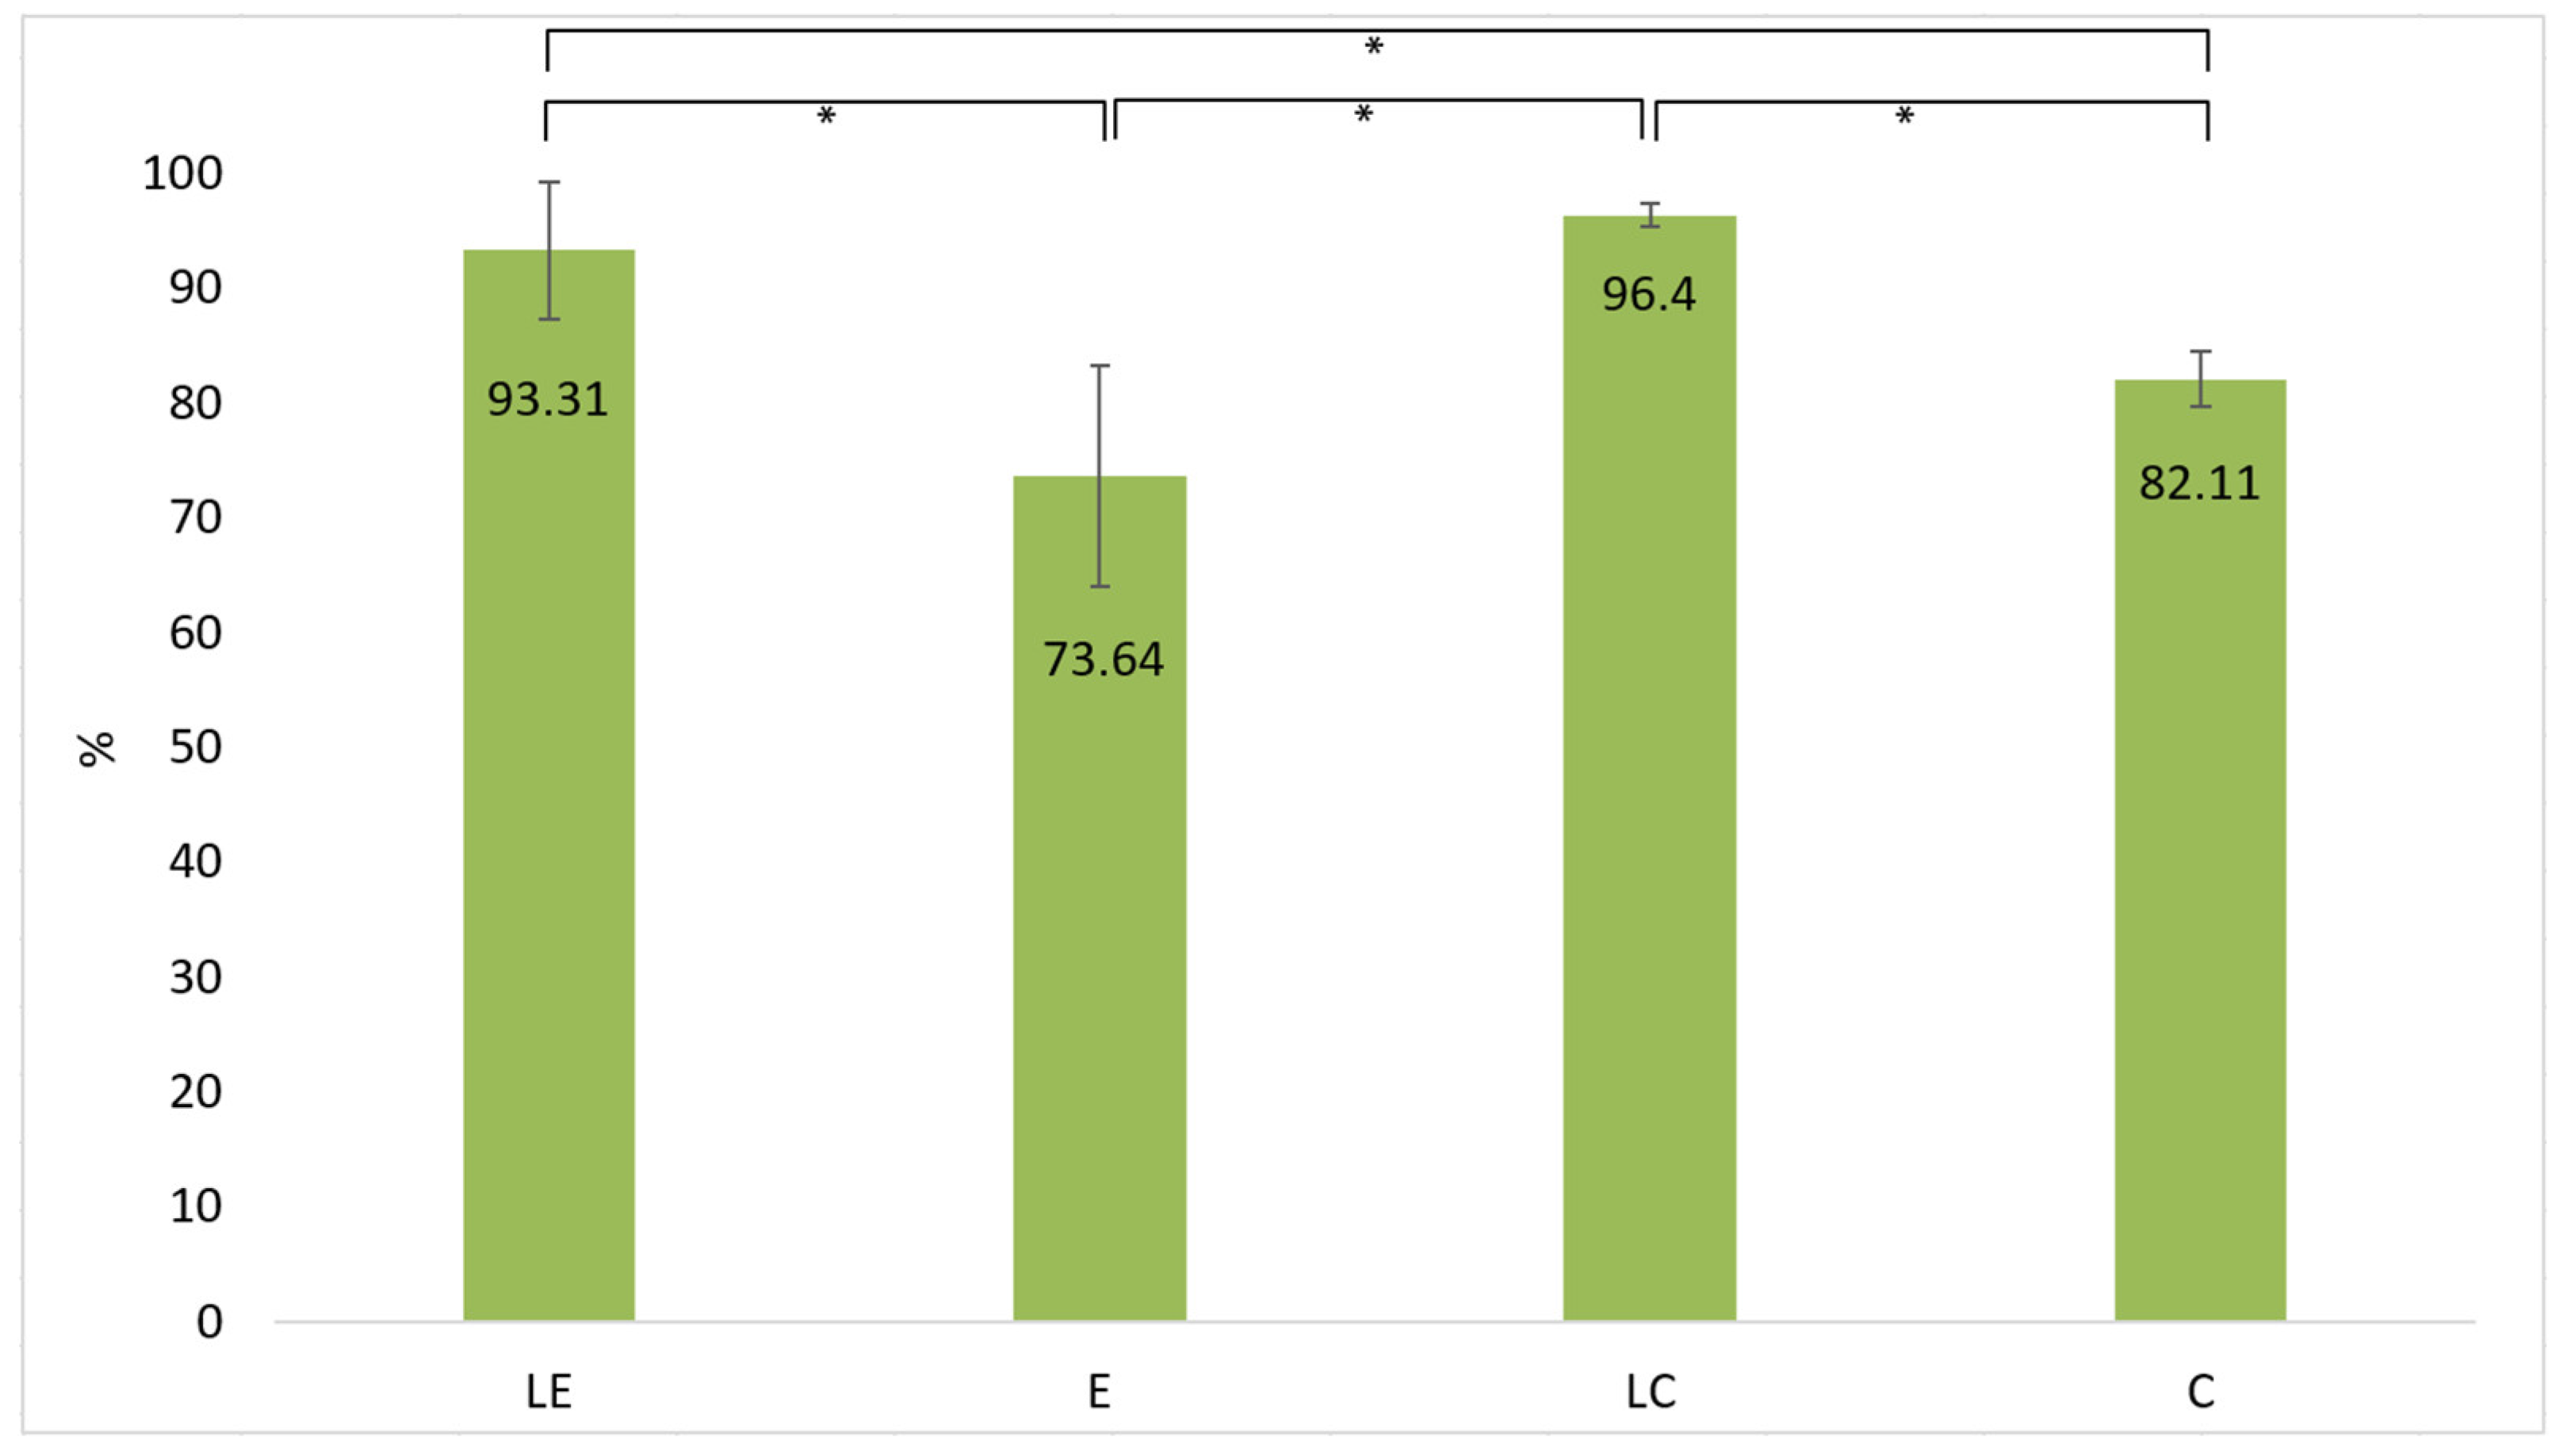
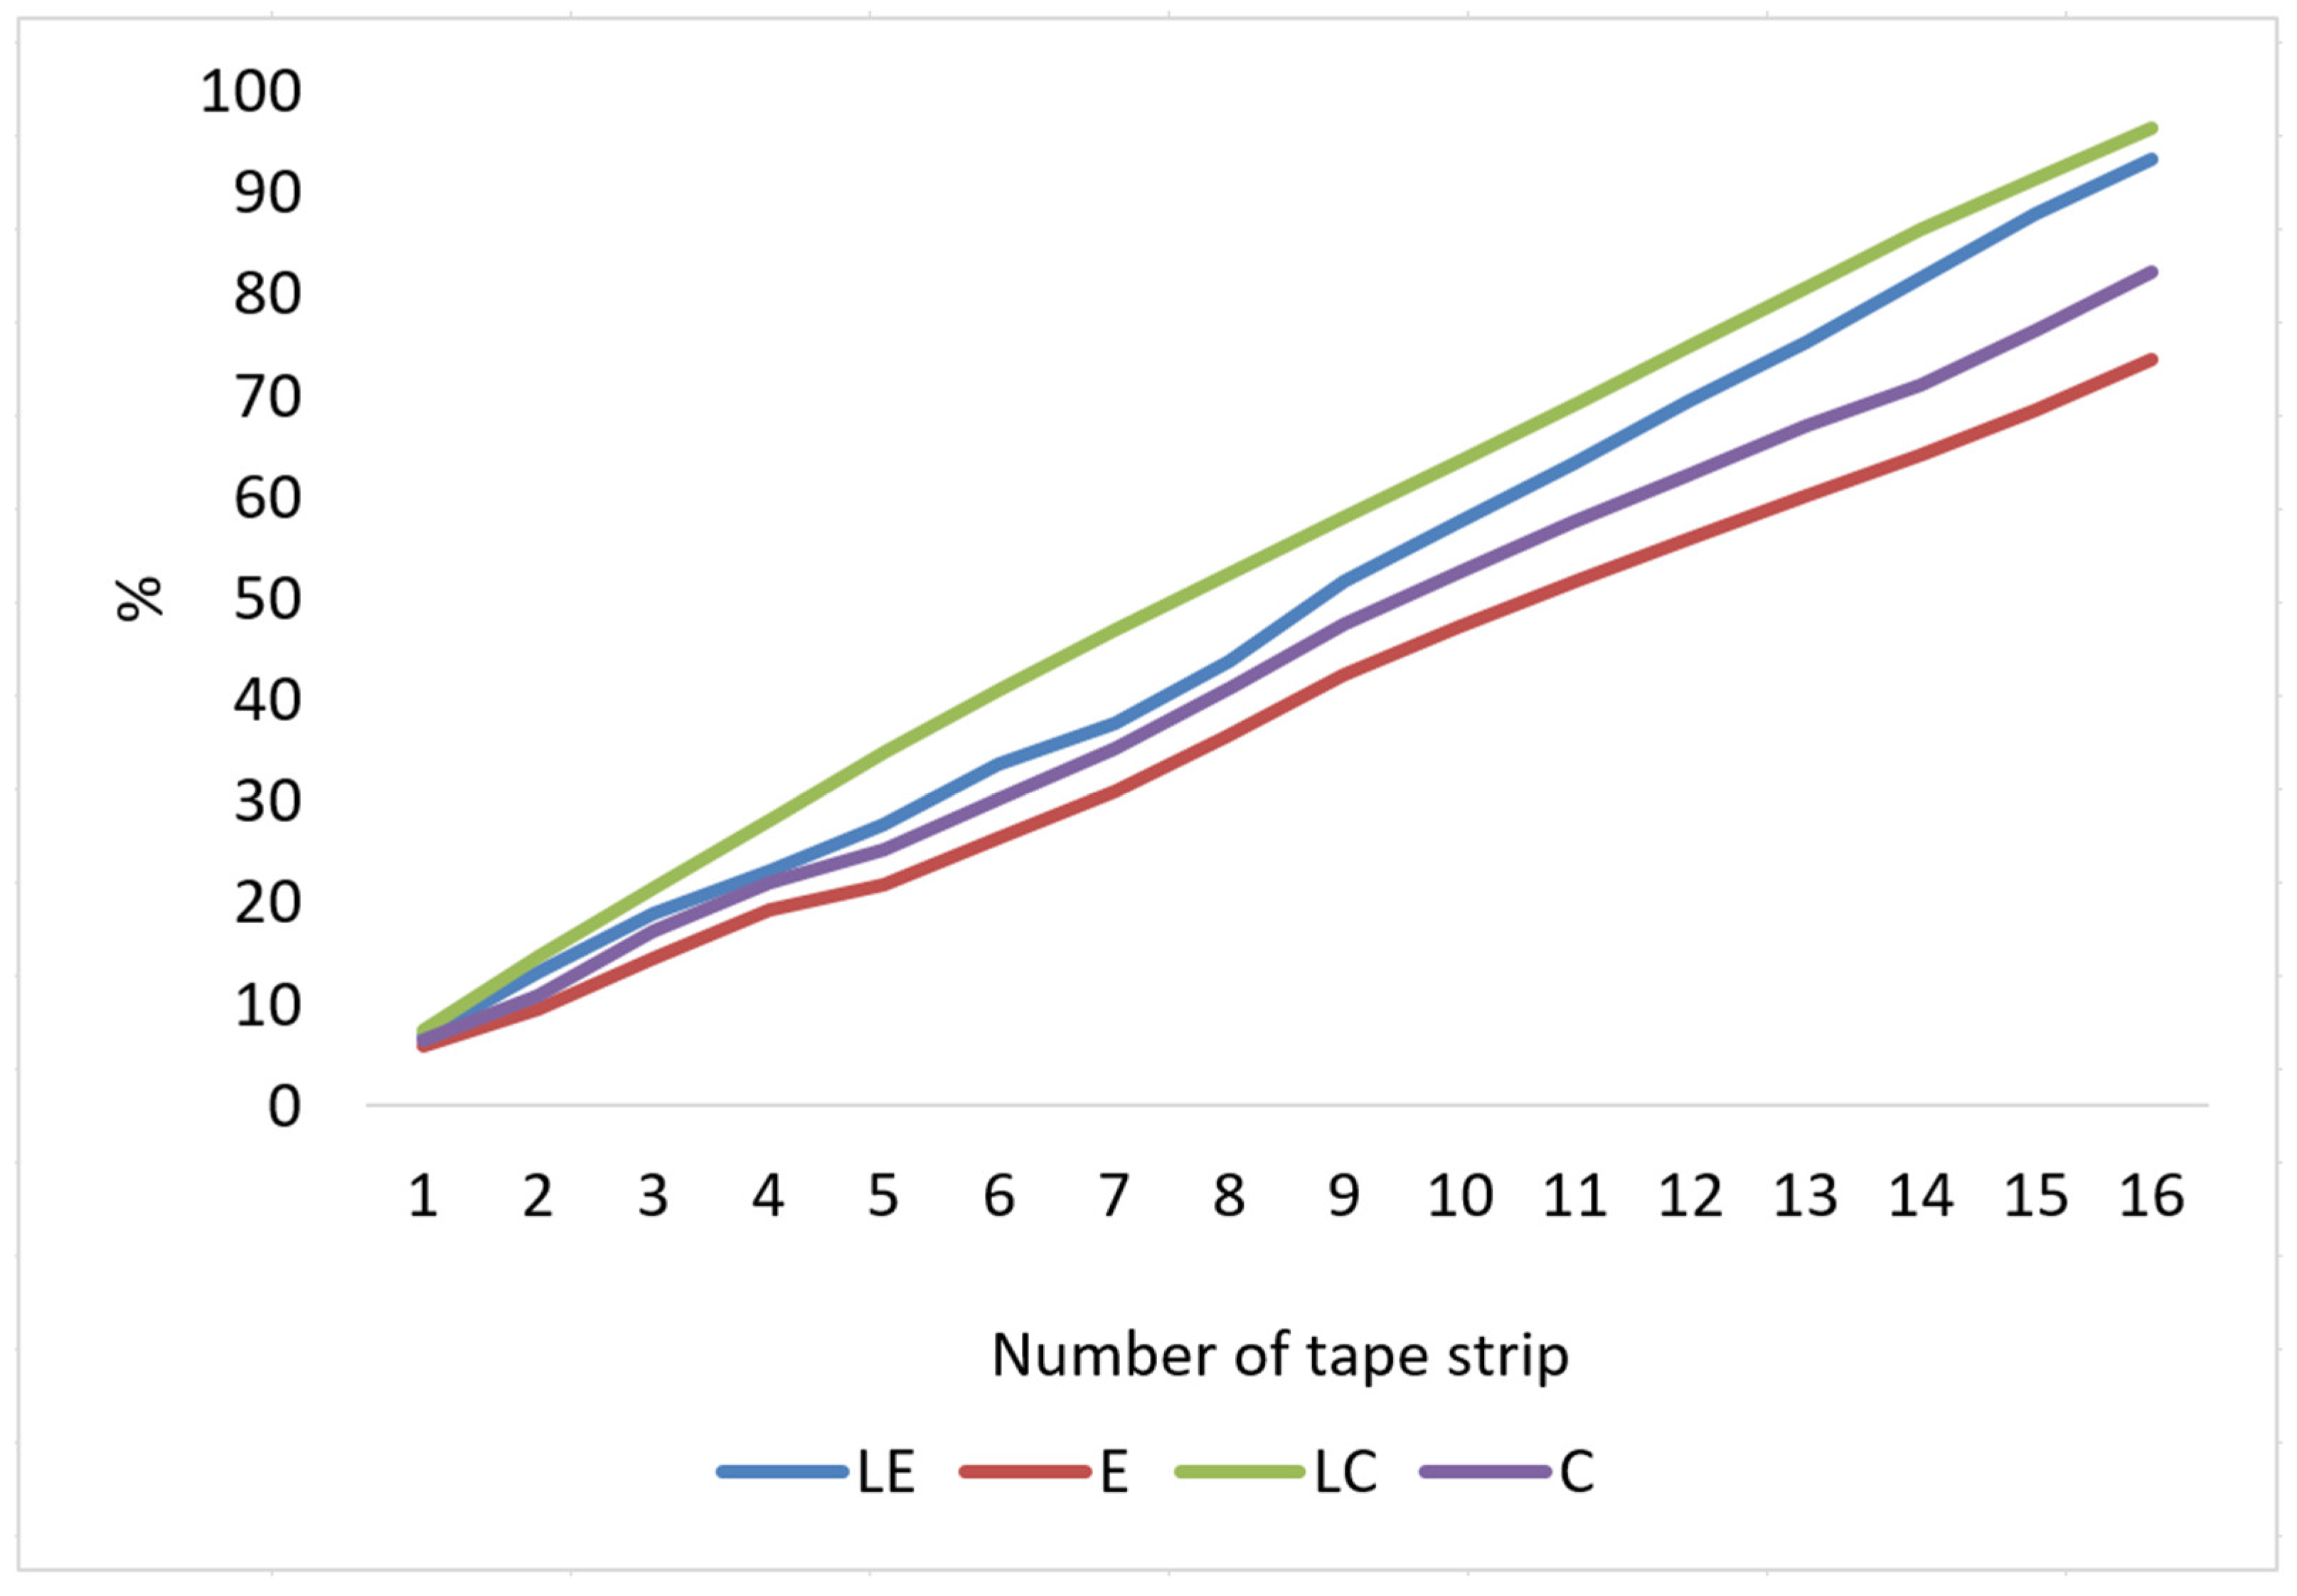
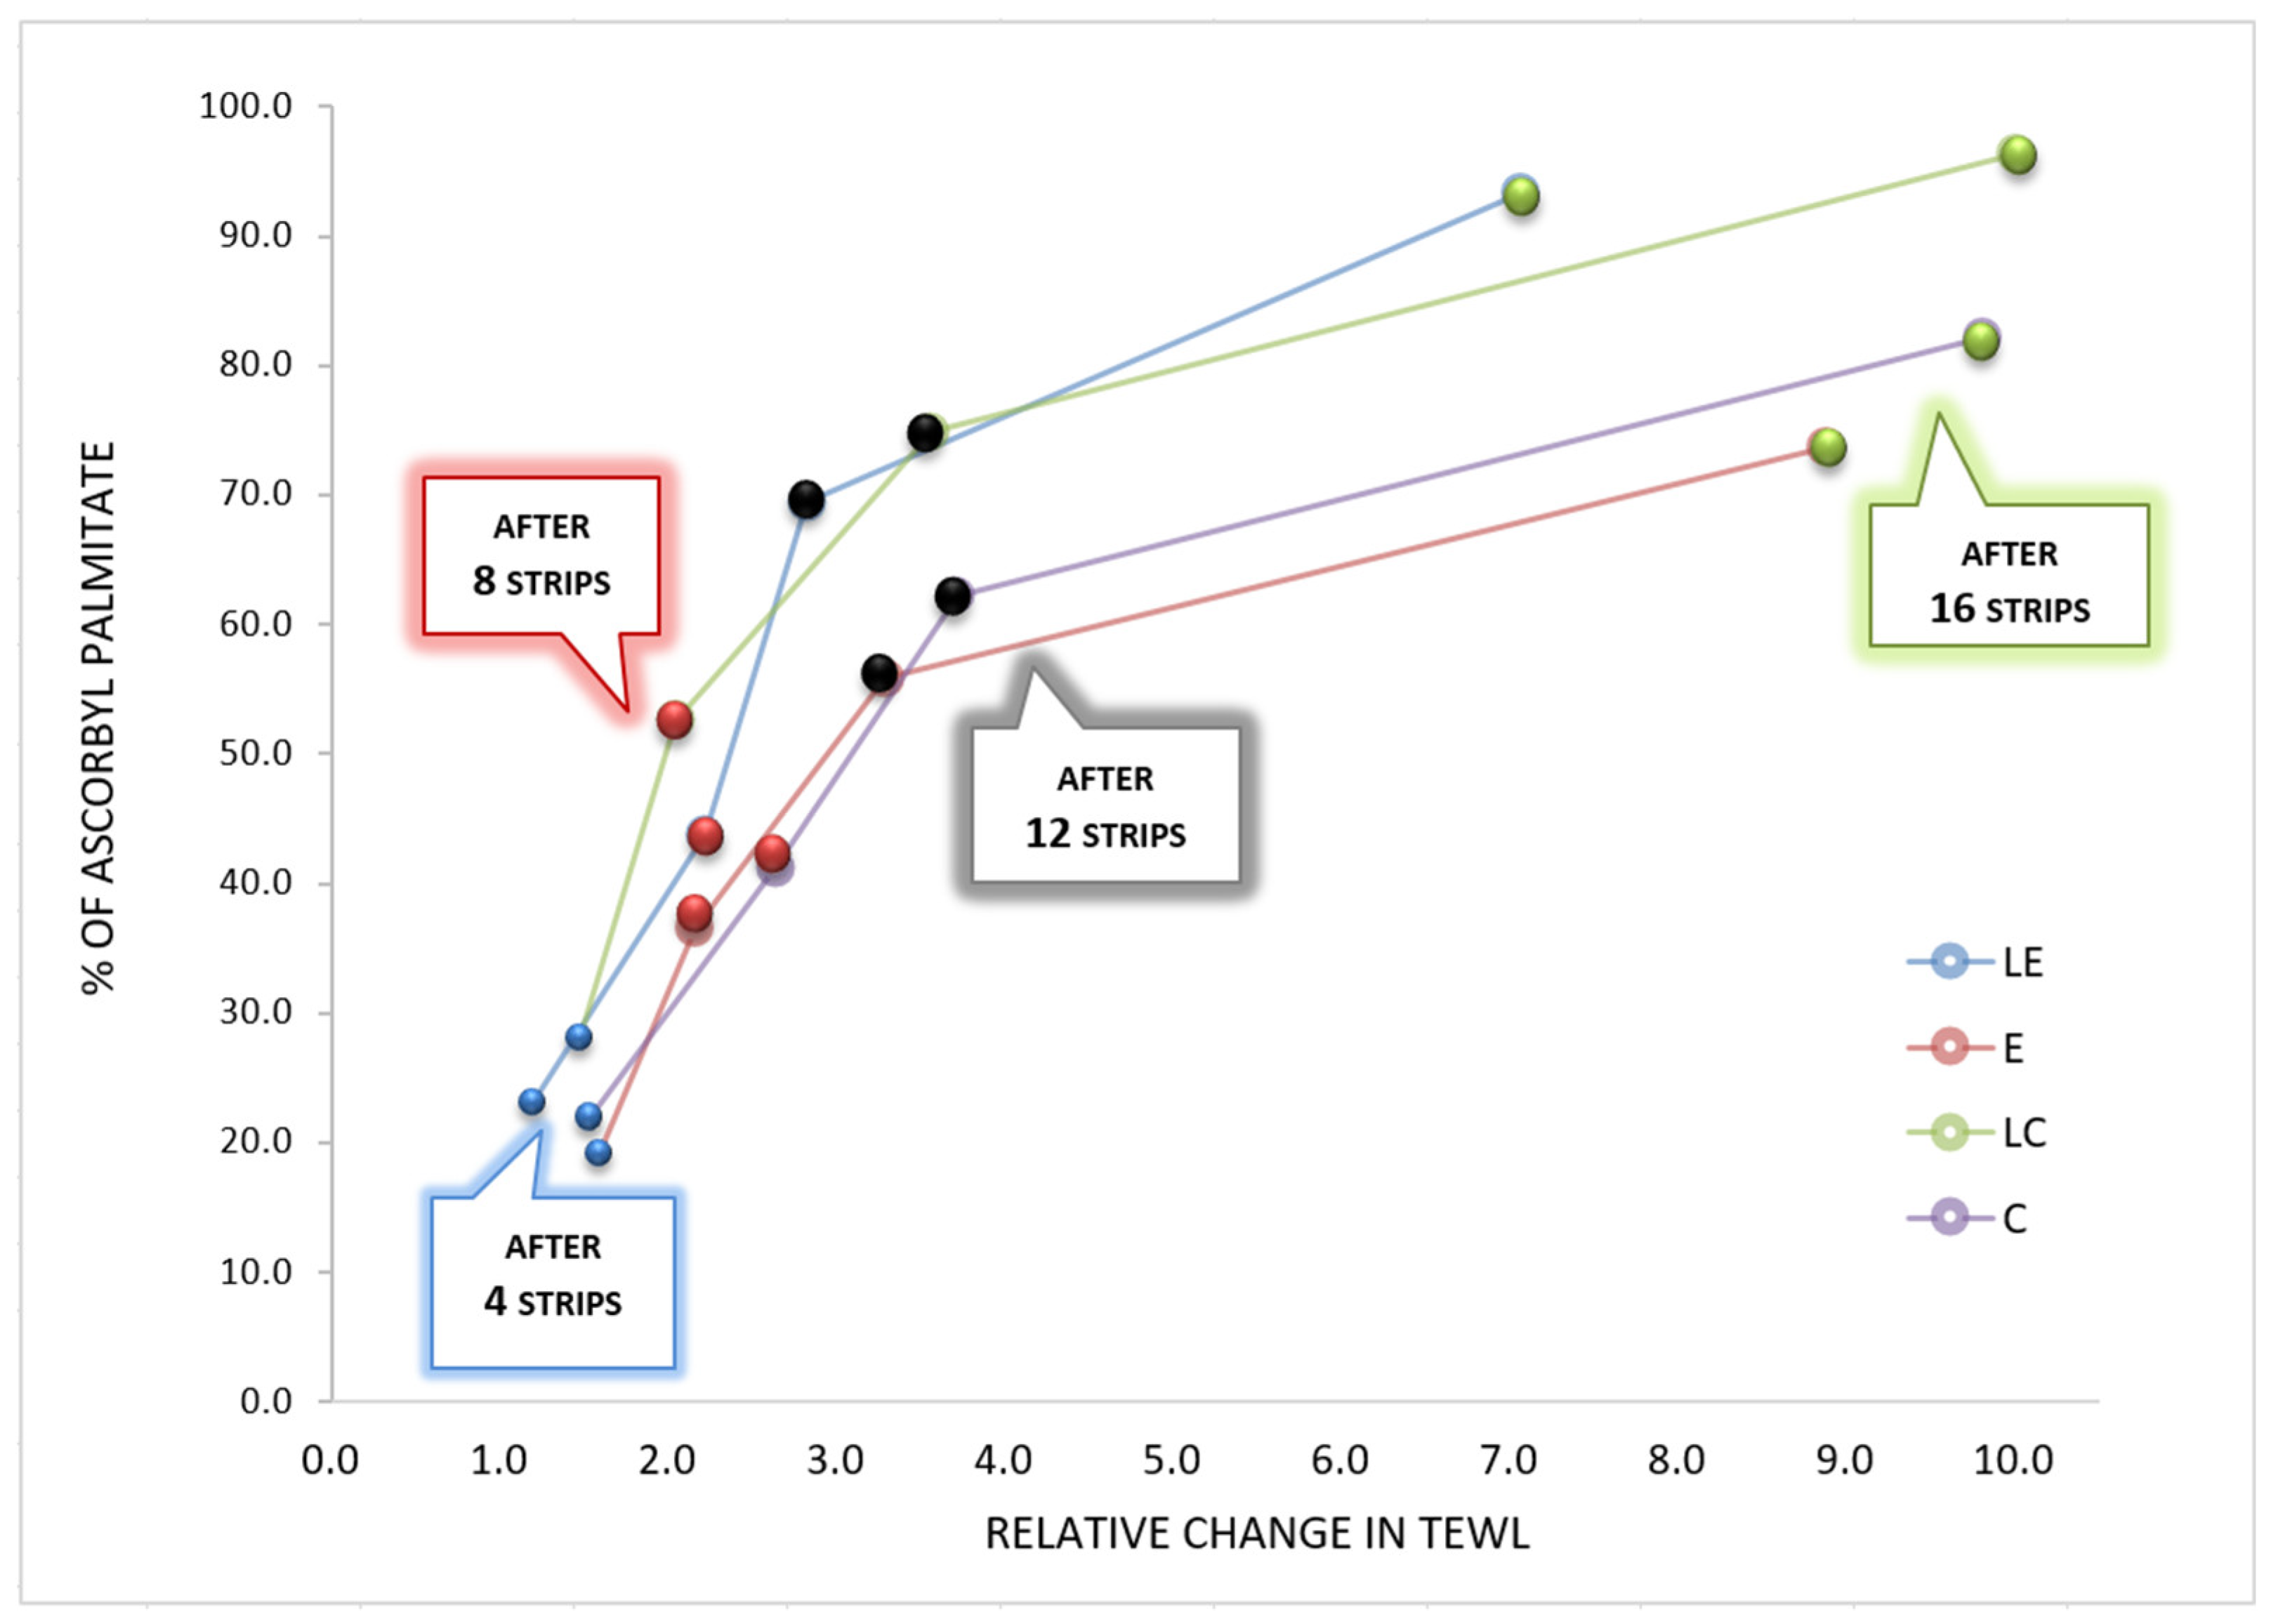
| Tape stripping | Total percentage of penetrated ascorbylpalmitate | >90% | <90% | >90% | <90% |
| + | |||||
| Sensory analysis | Consistency | + | |||
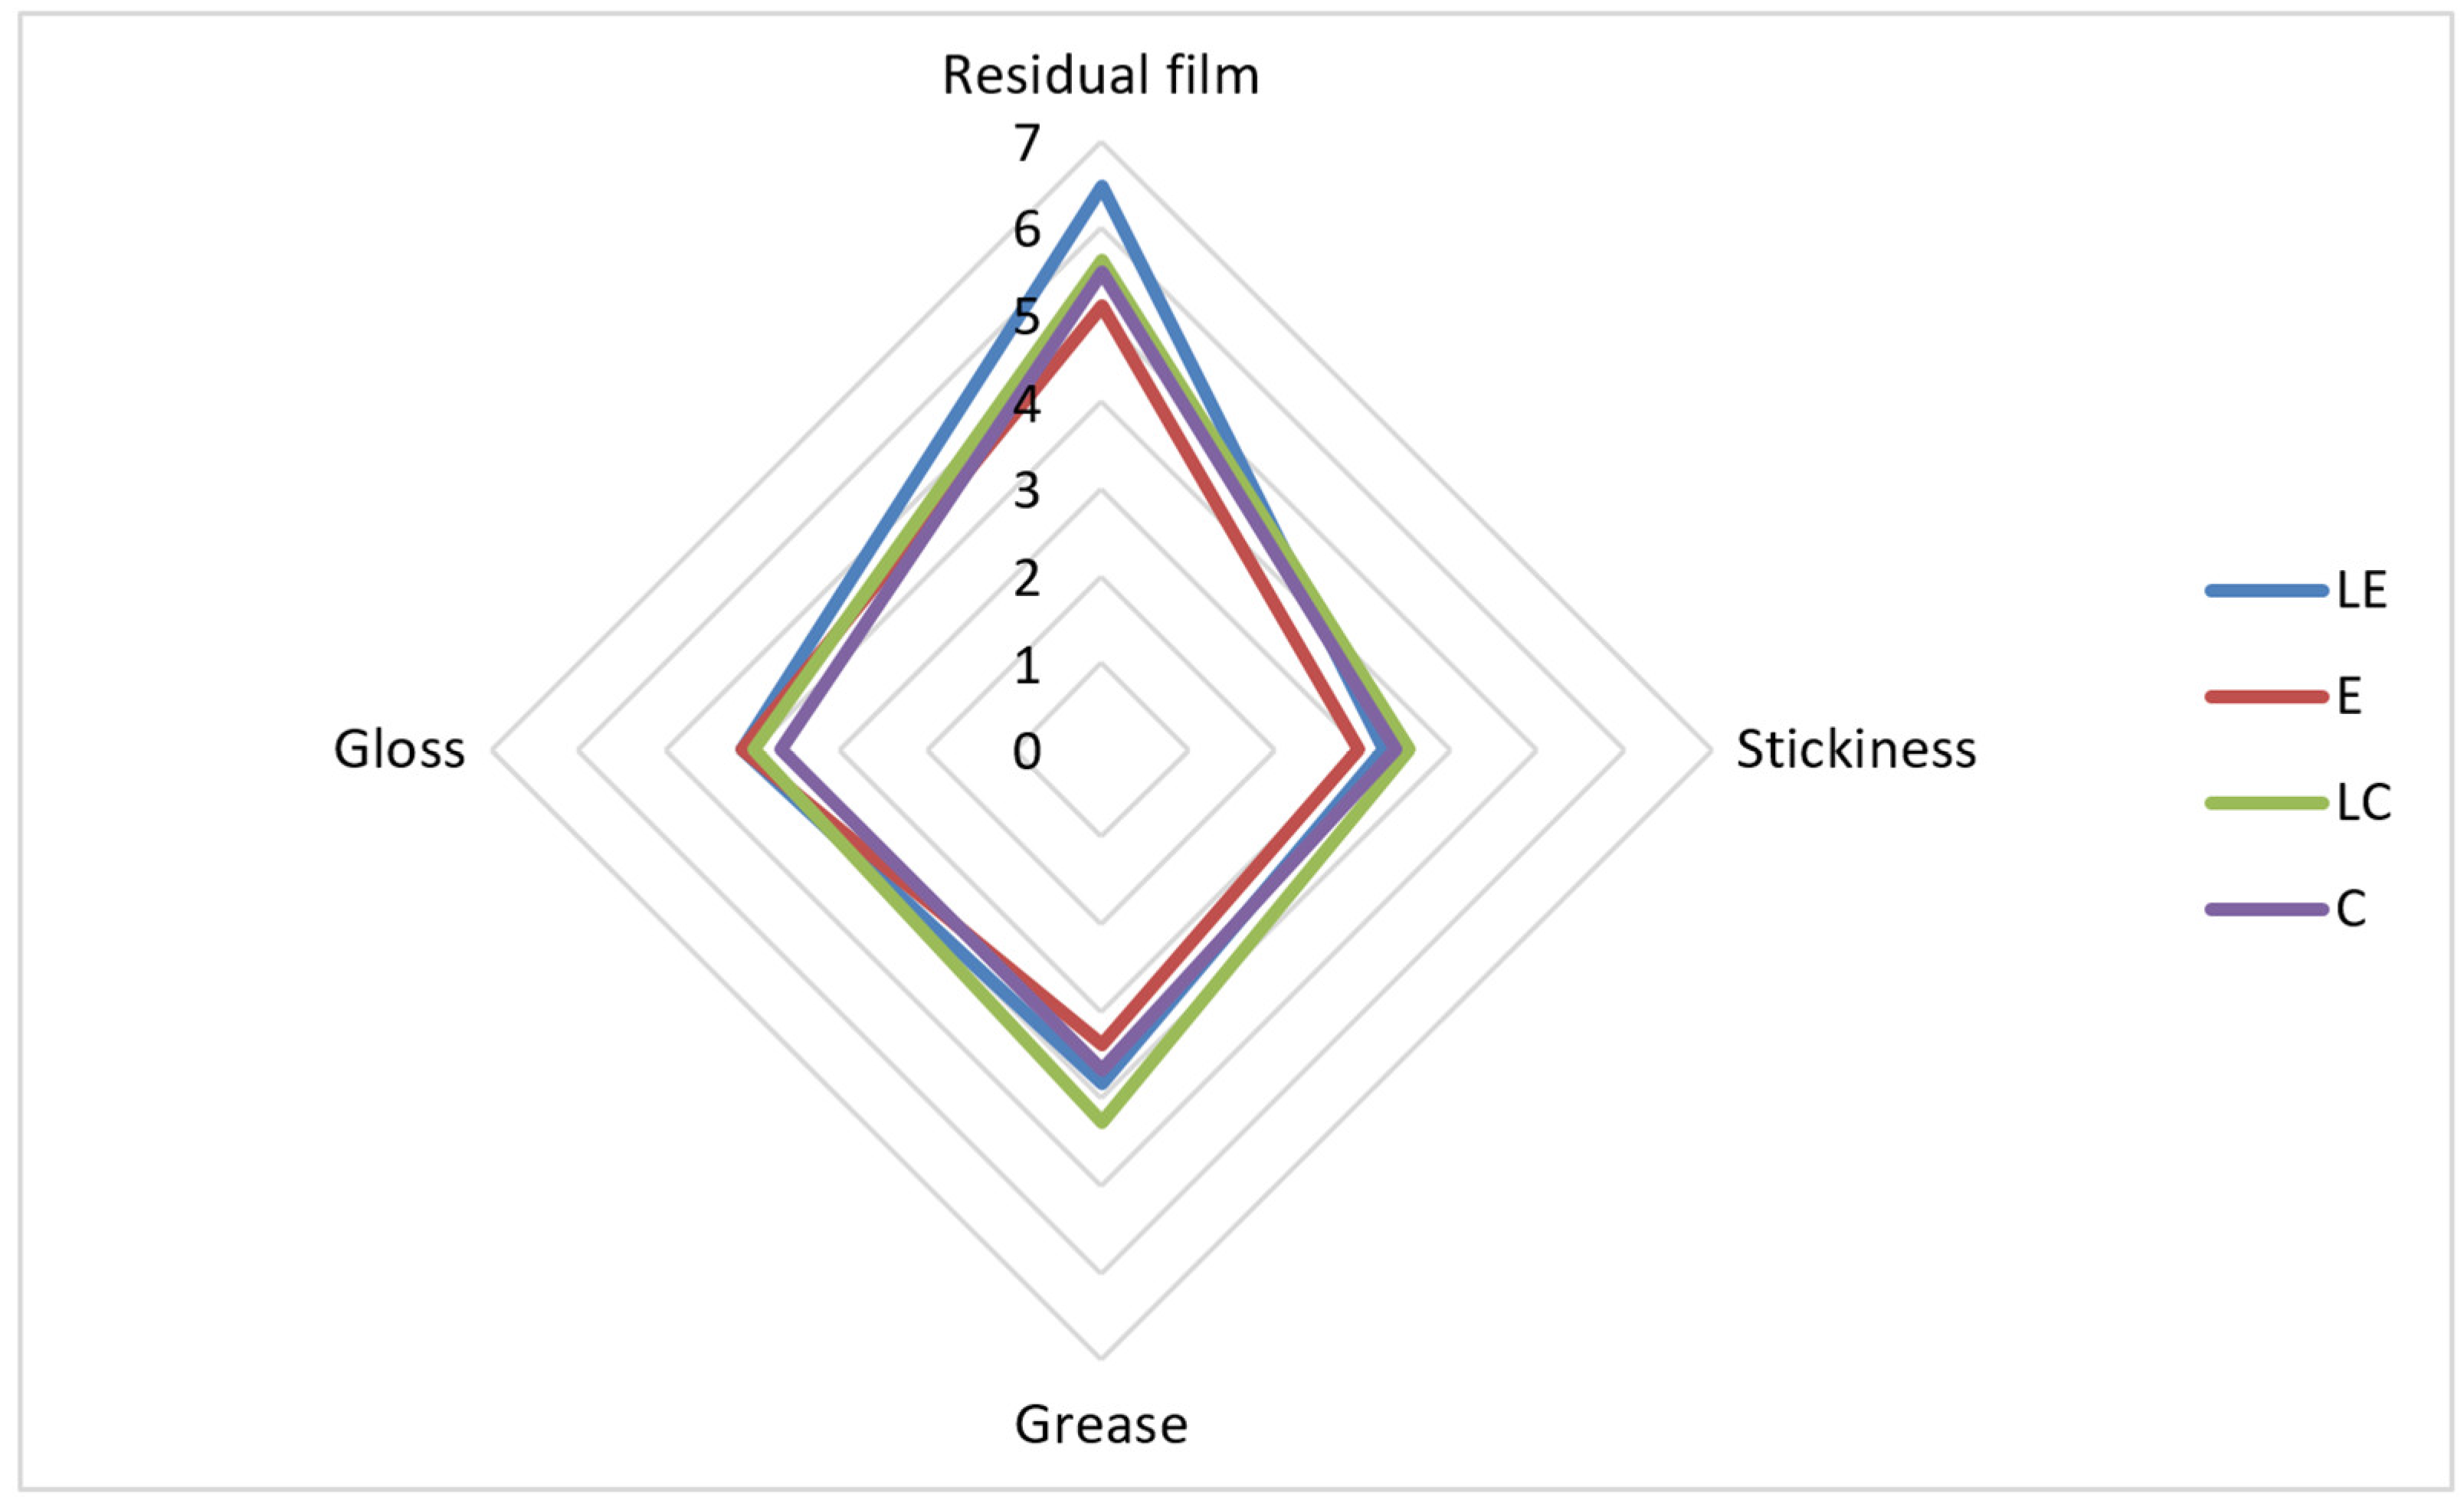
| Gloss | + | ||||
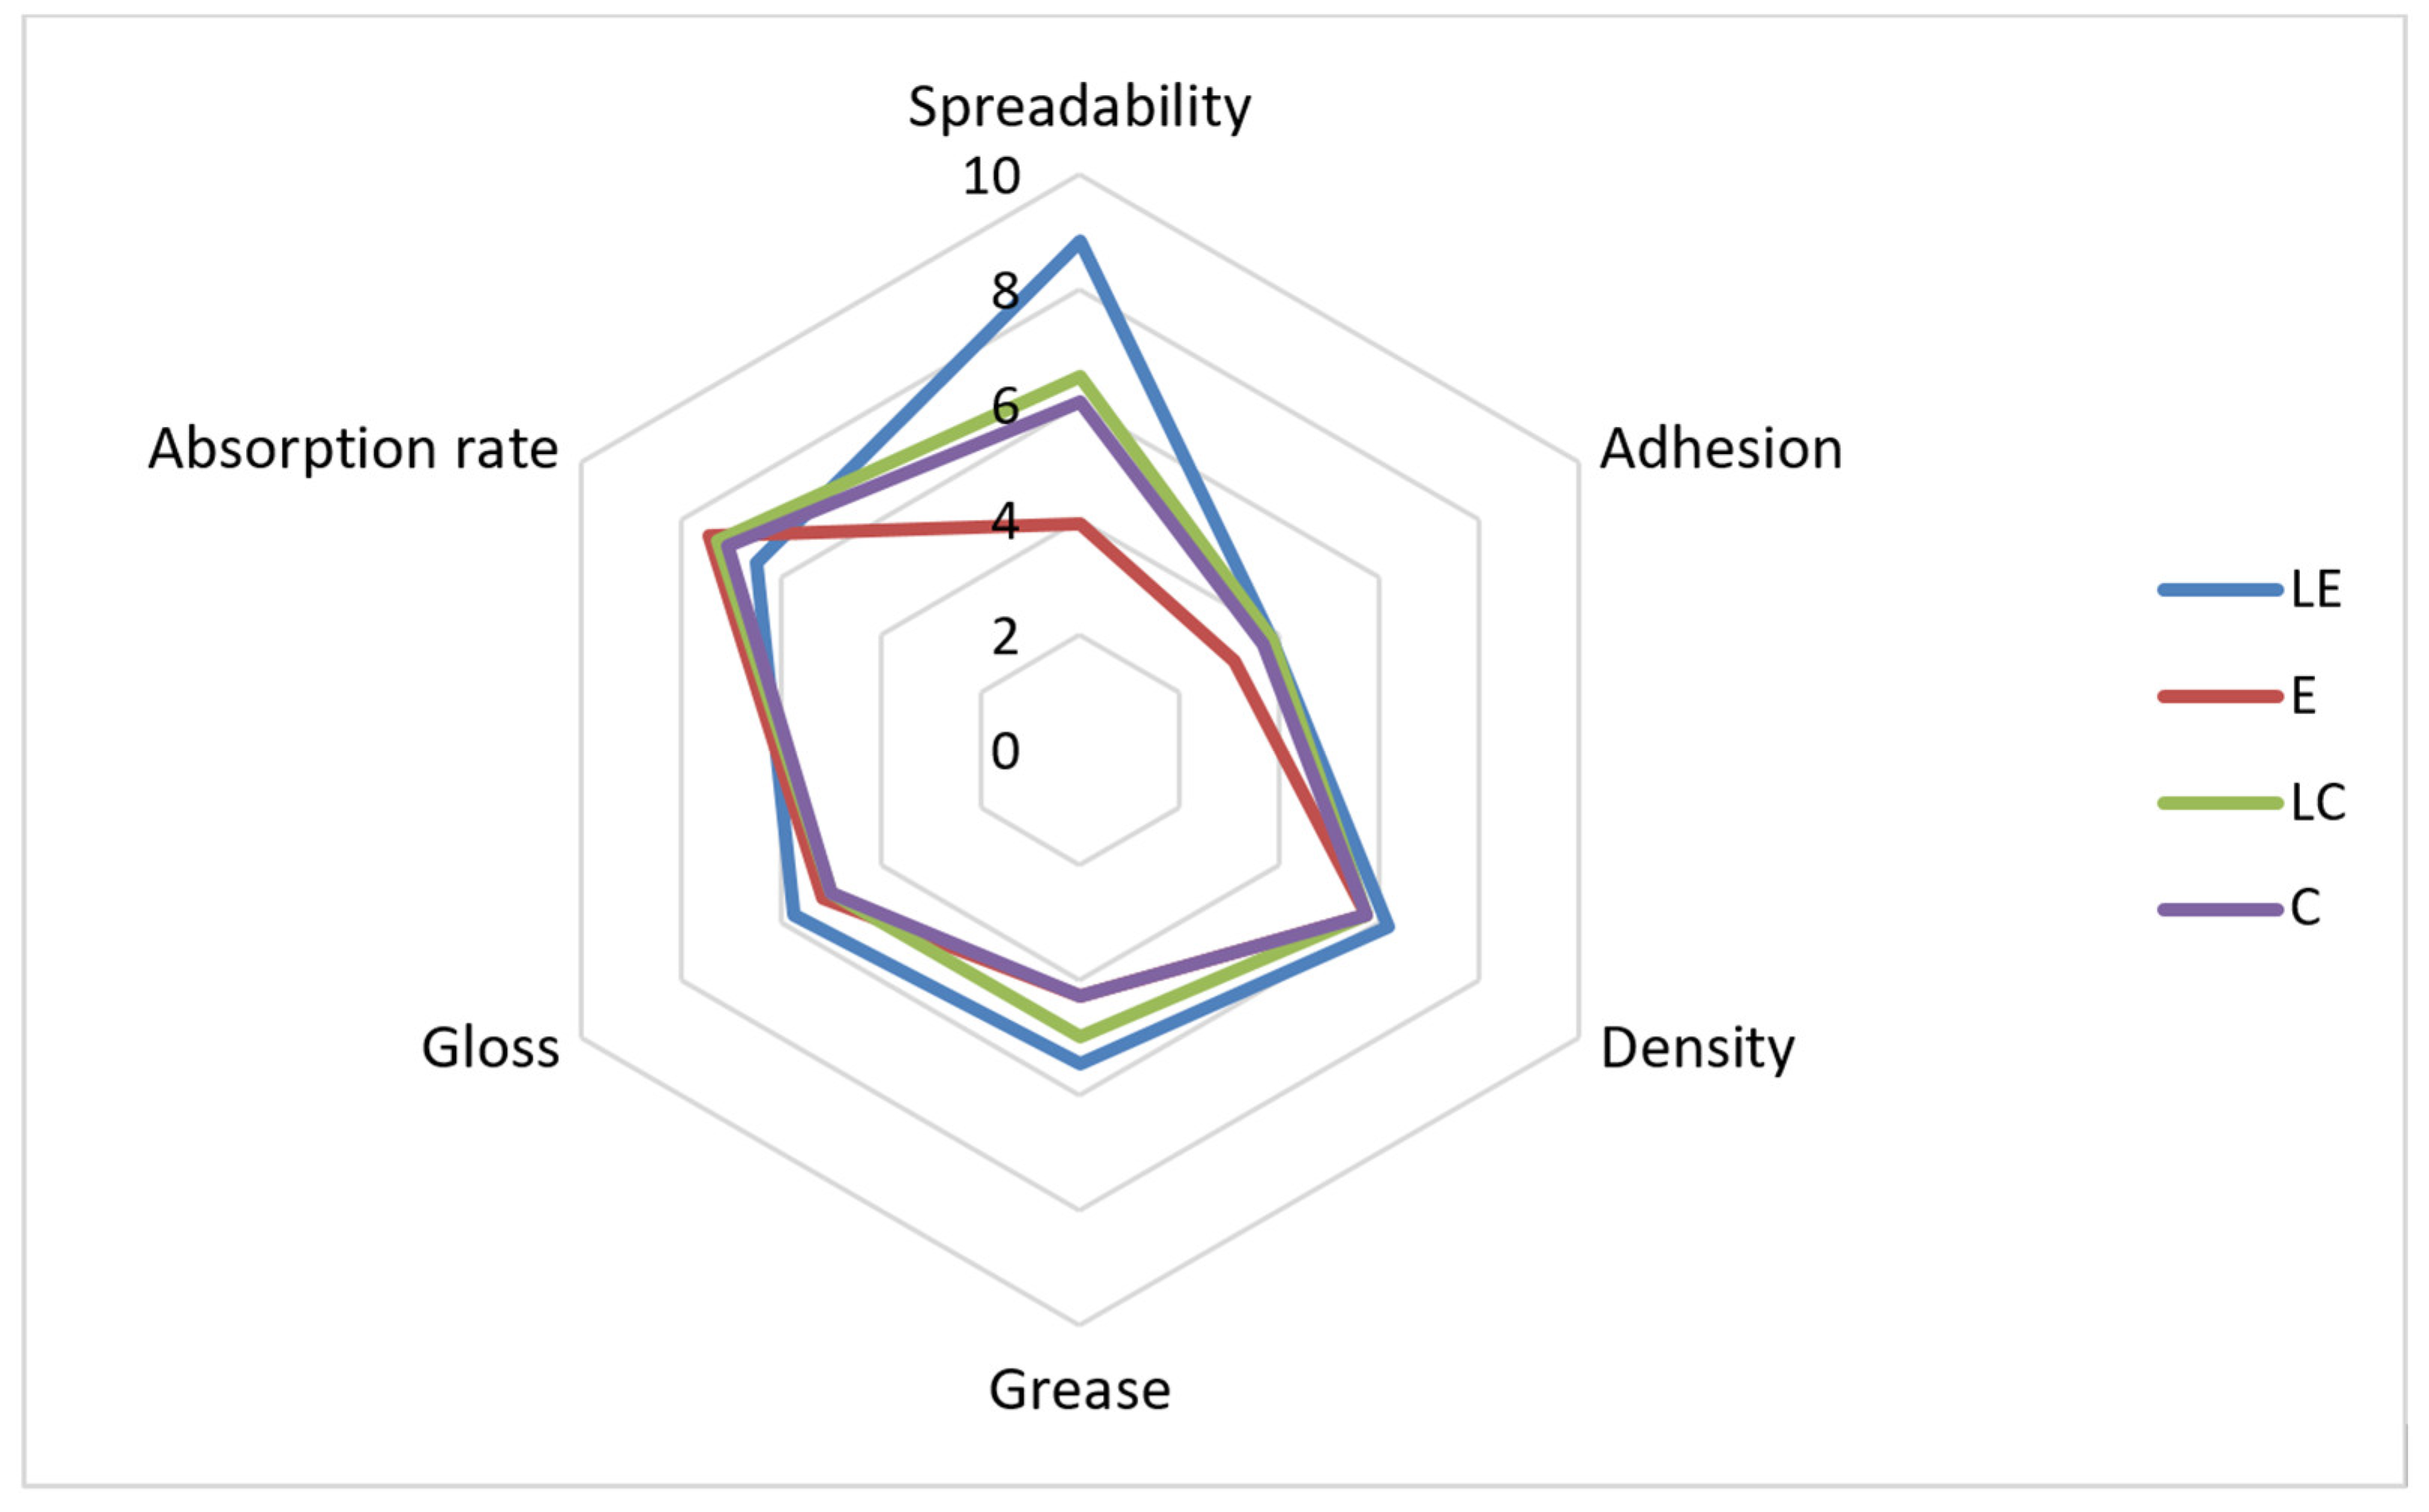
| Spreadability | + | ||||
| Residual film | + | ||||
| Fast absorption | + | + | + | ||
| Slow absorption | + | ||||
| The least sticky | + | ||||
| The least greasy feeling on the skin | + | + | |||
| Texture analysis | Hardness | + | |||
| Consistency | + | ||||
| Cohesiveness | + | + | |||
| Adhesiveness | + | ||||
| Spreadability | + | ||||
| Deformity after pressure | Stable structure | Stable structure | Stable structure | Stable structure |
Disclaimer/Publisher’s Note: The statements, opinions and data contained in all publications are solely those of the individual author(s) and contributor(s) and not of MDPI and/or the editor(s). MDPI and/or the editor(s) disclaim responsibility for any injury to people or property resulting from any ideas, methods, instructions or products referred to in the content. |
© 2024 by the authors. Licensee MDPI, Basel, Switzerland. This article is an open access article distributed under the terms and conditions of the Creative Commons Attribution (CC BY) license (http://creativecommons.org/licenses/by/4.0/).


