3.5. Association Analysis of Seven SNPs with Growth Traits
According to the results of the correlation analysis of growth traits of Nanjiang yellow goat at each month of age (
Table 3,
Table 4, and
Table 5), it is shown that individuals with AG genotypes at rs656779265 (G>A) locus, BW-2, BL-18 and CC-18 were highly significantly higher than those with AA genotypes (P<0.01), and individuals with BL-2, BH-2, BL-6 and BW-18 were significantly higher than those with AA genotypes (P<0.05). In addition, CC-18 was highly significantly higher in individuals with the AG genotype than with the GG genotype (P<0.01), and BW-2, BW-18 and BL-18 were significantly higher than with the GG genotype (P<0.05). However, CC-4 was significantly higher (P<0.05) in individuals with the GG genotype than in those with the AG genotype only at the rs656779265 (G>A) locus.
Individuals with TT and AT genotypes at rs638185407 (T>A) locus had highly significantly higher BW-0, CC-2 than AA genotypes (P<0.01), and individuals with AT genotypes had significantly higher BH-2 than AA genotypes (P<0.05). In addition, individuals with the TT genotype at the rs638185407 (T>A) locus had BH-4, CW-4 highly significantly higher than the AT genotype (P<0.01), and BW-4, BL-4 and CH-4 significantly higher than the AT genotype (P<0.05). As the sample size of AA genotypes was less than three, post hoc tests were not performed. Unlike before, individuals with the AT genotype at the rs638185407 (T>A) locus had a highly significantly higher CC-18 (P<0.01) and a significantly higher BL-18 (P<0.05) than the AA genotype.
Individuals with the CA genotype at the rs665251622 (A>C) locus had significantly higher BW-18 and CC-18 than the CC genotype (P<0.05). As the sample size of the CA genotype at the rs640683953 (A>C) locus was less than three individuals, post hoc tests were not performed.
The BW-0 of the GC genotype at the rs654358008 (G>C) locus was significantly higher than that of the CC genotype (P<0.05). More interestingly, individuals with the GC genotype at rs654358008 (G>C) showed a significant advantage in terms of birth weight. Compared with the CC genotype, the GC genotype had significantly higher BH-2, BW-6, BL-6, BH-6, CC-6, BW-12, BL-12, BH-12, CC-12, BW-18, BL-18 and CC-18 than the CC genotype (P<0.01), and the BW-2, BL-2, CC-2 and BH-18 were significantly higher than the CC genotype (P<0.05). 0.05). More importantly, the goats with the GC genotype of rs654358008 had significantly larger growth traits or heavier body mass compared to the goats with other genotypes at all periods. And more importantly, goats with the GC genotype of rs654358008 had significantly larger growth traits or heavier body mass compared to goats with other genotypes at all periods.
Individuals with CT genotype at the rs671132057 (T>C) locus had BL-18 and CC-18 highly significantly higher than TT genotype (P<0.01), and individuals with CT genotype had BW-2, BL-2, BH-2, CC-2 significantly higher (P<0.05) than TT genotype. In addition, BL-2 and BH-2 were significantly higher (P<0.05) than TT genotype in individuals with CC genotype and CC-4 was significantly higher (P<0.05) than CT genotype in individuals with CC genotype. In addition, CC-18 was significantly higher (P<0.05) than CC genotype in individuals with CT genotype.
Individuals with AA genotype at the rs652062749 (G>A) locus had BL-4 highly significantly higher (P<0.01) than GG genotype and significantly higher (P<0.05) than AG genotype, but showed a disadvantage in the subsequent period. rs652062749 (G>A) individuals with GG genotype at the rs652062749 (G>A) locus had BL-6, CC-6, BL-12 and BH-12 highly significantly higher than AA genotypes (P<0. 01), BW-6, BH-6, BW-12 and CC-12 were significantly higher than AA genotypes (P<0.05), and BL-6, CC-6 and BL-12 were significantly higher than AG genotypes (P<0.05). The rs652062749 (G>A) locus of the GG genotypes individuals of BL-12 and BH-12 were extremely significantly higher than AA genotypes (P<0.01), BW-12 and CC-12 were significantly higher than AA genotypes (P<0.05) and their BL-12 was significantly higher than AG genotypes (P<0.05).
Table 3.
Association analysis of three SNPs with various growth traits for different amounts of months in the Nanjiang Yellow goat population
Table 3.
Association analysis of three SNPs with various growth traits for different amounts of months in the Nanjiang Yellow goat population
| Locus |
rs656779265(G>A)
|
rs638185407(T>A)
|
rs665251622(A>C)
|
| Genotype |
AA |
GA |
GG |
AA |
AT |
TT |
AA |
CA |
CC |
| Number |
51 |
97 |
50 |
3 |
48 |
145 |
56 |
101 |
39 |
| BW-0(kg) |
2.26±0.271
|
2.26±0.30 |
2.21±0.32 |
1.98±0.68A
|
2.30±0.33B
|
2.24±0.28B
|
2.26±0.30 |
2.24±0.30 |
2.26±0.30 |
| BW-2(kg) |
11.11±0.96B
|
11.51±0.94Aa
|
11.15±0.84b
|
11.00±0.00 |
11.49±1.03 |
11.27±0.91 |
11.21±1.00 |
11.40±0.90 |
11.28±0.94 |
| BL-2(cm) |
46.94±1.43b
|
47.52±1.68a
|
47.14±1.68 |
47.00±1.73 |
47.50±1.65 |
47.21±1.64 |
47.14±1.73 |
47.37±1.60 |
47.26±1.60 |
| BH-2(cm) |
45.08±1.13b
|
45.58±1.42a
|
45.32±1.35 |
44.67±1.53b
|
45.65±1.34a
|
45.31±1.34 |
45.36±1.52 |
45.43±1.25 |
45.36±1.35 |
| CC-2(cm) |
50.94±1.38 |
51.34±1.53 |
51.32±1.59 |
49.33±1.15B
|
51.61±1.71A
|
51.15±1.41A
|
51.16±1.45 |
51.18±1.49 |
51.50±1.64 |
| BW-6(kg) |
25.75±4.12 |
26.30±4.21 |
25.50±4.68 |
26.67±4.93 |
26.76±4.58 |
25.71±4.20 |
26.01±4.40b
|
26.25±4.16a
|
25.35±4.57 |
| BL-6(cm) |
59.02±5.45b
|
59.44±5.20a
|
58.66±5.68 |
58.67±8.14 |
60.15±5.88 |
58.58±5.16 |
59.13±5.40b
|
59.48±5.34a
|
58.46±5.53 |
| BH-6(cm) |
56.02±4.78 |
56.32±4.64 |
55.94±4.75 |
56.00±6.24 |
56.85±5.16 |
55.96±4.52 |
56.21±4.84 |
56.38±4.71 |
55.59±4.53 |
| CC-6(cm) |
65.08±4.45 |
68.38±4.40 |
65.12±4.68 |
66.33±6.51 |
66.36±4.77 |
64.88±4.30 |
65.25±4.53 |
65.46±4.49 |
64.87±4.39 |
| BW-12(kg) |
34.07±4.86 |
34.54±4.85 |
33.72±5.26 |
34.33±5.69 |
35.08±5.35 |
33.96±4.81 |
34.36±5.20 |
34.48±4.73 |
33.62±5.15 |
| BL-12(cm) |
65.90±5.20 |
66.27±5.07 |
66.08±5.38 |
66.67±5.03 |
66.96±5.76 |
56.89±4.97 |
66.32±5.30 |
66.16±5.13 |
66.00±5.18 |
| BH-12(cm) |
62.78±4.38 |
63.27±4.33 |
63.22±4.79 |
63.33±4.04 |
63.71±4.96 |
62.97±4.29 |
63.25±4.54 |
63.28±4.41 |
62.82±4.47 |
| CC-12(cm) |
74.76±5.17 |
75.60±5.07 |
75.05±53.8 |
75.33±7.57 |
76.14±5.72 |
75.01±4.91 |
75.23±5.17 |
75.64±5.16 |
74.63±5.06 |
| BW-18(kg) |
47.21±7.07b
|
48.59±7.09a
|
47.48±7.63b
|
47.17±9.00 |
48.96±7.55 |
47.70±7.12 |
47.92±7.80 |
48.47±6.98a
|
46.99±7.06b
|
| BL-18(cm) |
73.08±5.63B
|
73.79±5.28Aa
|
72.53±4.92b
|
72.67±5.03b
|
74.50±5.79a
|
72.97±5.10 |
72.98±5.22 |
73.70±5.37 |
72.79±5.29 |
| BH-18(cm) |
68.75±3.69 |
69.60±4.26 |
69.14±4.59 |
69.00±6.08 |
70.10±4.63 |
69.03±4.02 |
69.18±4.05 |
69.45±4.18 |
69.13±4.56 |
| CC-18(cm) |
85.03±4.88B |
86.30±4.63A
|
85.11±5.40B
|
83.33±7.57B
|
87.01±5.10A
|
85.32±4.74 |
85.43±5.06b
|
86.17±4.69a
|
84.97±5.22 |
Table 4.
Association analysis of four SNPs with various growth traits for different amounts of months in the Nanjiang Yellow goat population
Table 4.
Association analysis of four SNPs with various growth traits for different amounts of months in the Nanjiang Yellow goat population
| Locus |
rs640683953(A>C)
|
rs654358008(G>C)
|
rs671132057(T>C)
|
rs652062749(G>A)
|
| Genotype |
CA |
CC |
GC |
CC |
CT |
CC |
TT |
AG |
GG |
AA |
| Number |
2 |
193 |
3 |
195 |
94 |
56 |
45 |
77 |
99 |
15 |
| BW-0(kg) |
2.57±0.061
|
2.24±0.30 |
2.44±0.15a
|
2.25±0.30b
|
2.27±0.30 |
2.22±0.31 |
2.24±0.29 |
2.23±0.28 |
2.27±0.32 |
2.26±0.23 |
| BW-2(kg) |
11.50±0.71 |
11.29±0.92 |
12.33±1.15a
|
11.30±0.92b
|
11.46±0.96a
|
11.26±0.88 |
11.03±0.90b
|
11.34±0.86 |
11.31±1.01 |
11.20±0.98 |
| BL-2(cm) |
47.50±0.71 |
47.26±1.64 |
48.67±2.52a
|
47.25±1.61b
|
47.50±1.75a
|
47.30±1.64a
|
46.78±1.29b
|
47.30±1.48 |
47.28±1.73 |
47.00±1.89 |
| BH-2(cm) |
45.00±1.41 |
45.38±1.35 |
47.00±1.00A
|
45.36±1.33B
|
45.50±1.45a
|
45.43±1.26a
|
45.02±1.16b
|
45.34±1.21 |
45.40±1.46 |
45.40±1.35 |
| CC-2(cm) |
53.00±1.41 |
51.19±1.51 |
53.00±1.00a
|
51.20±1.50b
|
51.21±1.55a
|
51.46±1.55 |
50.91±1.36b
|
51.26±1.40 |
51.18±1.57 |
51.53±1.51 |
| BW-6(kg) |
27.75±6.72 |
25.91±4.27 |
31.17±3.62A
|
25.88±4.27B
|
26.30±4.33 |
25.70±4.45 |
25.50±4.02 |
25.62±3.92 |
26.38±4.51a
|
24.90±4.50b
|
| BL-6(cm) |
62.00±9.90 |
59.05±5.28 |
64.67±6.81A
|
59.05±5.32B
|
59.51±5.34 |
58.71±5.48 |
58.80±5.37 |
58.74±5.04b
|
59.62±5.68Aa
|
57.80±5.35B
|
| BH-6(cm) |
59.00±8.49 |
56.08±4.60 |
61.67±4.93A
|
56.06±4.64B
|
56.46±4.74 |
55.95±4.64 |
55.71±4.66 |
55.77±4.20b
|
56.59±5.07a
|
55.27±4.59b
|
| CC-6(cm) |
66.50±4.95 |
65.18±4.45 |
70.67±5.13A
|
65.15±4.42B
|
65.49±4.59 |
65.13±4.45 |
64.82±4.28 |
64.86±4.30b
|
65.65±4.66Aa
|
63.93±3.77B
|
| BW-12(kg) |
38.00±8.49 |
34.11±4.85 |
38.67±4.93A
|
34.14±4.93B
|
34.56±5.05 |
33.95±4.97 |
33.77±4.71 |
33.92±4.34 |
34.57±5.27a
|
32.90±5.11b
|
| BL-12(cm) |
71.00±9.90 |
66.03±5.07 |
72.00±8.00A
|
66.04±5.08B
|
66.30±5.33 |
66.09±5.01 |
65.76±4.95 |
65.71±4.67b
|
66.62±5.47Aa
|
64.87±5.28B
|
| BH-12(cm) |
66.50±7.78 |
63.06±4.40 |
67.00±5.00A
|
63.07±4.42B
|
63.31±4.54 |
63.13±4.40 |
62.71±4.23 |
62.83±3.91 |
63.51±4.78A
|
62.00±4.71B
|
| CC-12(cm) |
81.00±8.49 |
75.13±5.09 |
80.33±6.43A
|
75.17±5.12B
|
75.58±5.23 |
75.35±5.22 |
74.58±5.01 |
75.00±4.62 |
75.58±5.50a
|
73.77±5.28b
|
| BW-18(kg) |
51.50±9.19 |
47.89±7.22 |
54.00±9.64A
|
47.86±7.16B
|
48.55±7.30a
|
47.48±7.01 |
46.86±6.84b
|
47.56±6.64 |
48.54±7.76A
|
46.10±6.54B
|
| BL-18(cm) |
76.50±6.36 |
73.22±5.29 |
79.00±7.81A
|
73.20±5.22B
|
73.82±5.46A
|
73.20±5.38 |
72.27±4.64B
|
72.99±4.96 |
73.69±5.47A
|
71.80±4.99B
|
| BH-18(cm) |
72.00±4.24 |
69.21±4.19 |
71.33±7.32a
|
69.23±4.16b
|
69.63±4.36 |
69.16±4.43 |
68.53±3.40 |
69.01±3.79 |
69.51±4.35 |
68.67±4.88 |
| CC-18(cm) |
88.50±6.36 |
85.63±4.92 |
89.00±5.57A
|
85.62±4.90B
|
86.30±4.82Aa
|
85.24±4.88b
|
84.74±4.79B
|
85.51±4.59 |
85.94±5.13a
|
84.20±4.55b
|
Table 5.
Association analysis of seven SNPs with various growth traits in the Nanjiang Yellow goat population at four months of age
Table 5.
Association analysis of seven SNPs with various growth traits in the Nanjiang Yellow goat population at four months of age
| Locus |
Genotype |
Number |
BW-4(kg) |
BL-4(cm) |
BH-4(cm) |
CC-4(cm) |
| rs656779265(G>A) |
AA |
73 |
14.33±2.111
|
51.63±2.53 |
50.36±2.85 |
54.51±3.02 |
| AG |
24 |
13.98±2.06 |
51.48±2.83 |
50.04±2.88 |
54.20±2.99b
|
| GG |
32 |
14.88±2.38 |
52.59±2.74 |
50.96±2.53 |
55.73±2.86a
|
| rs638185407(T>A) |
AA |
1 |
18.80±0.00 |
54.50±0.00 |
53.50±0.00 |
60.00±0.00 |
| AT |
21 |
13.43±2.01a
|
50.57±2.77a
|
48.92±2.86A
|
53.80±3.09 |
| TT |
105 |
14.41±2.15b
|
51.98±2.74b
|
50.59±2.73B
|
54.71±2.96 |
| rs665251622(A>C) |
AA |
76 |
14.42±2.42 |
51.62±2.7b
|
50.81±2.97 |
54.75±3.49 |
| CA |
14 |
13.99±1.93b
|
51.57±2.82b
|
49.86±2.73b
|
54.31±2.67b
|
| CC |
38 |
15.44±2.39a
|
53.21±2.47a
|
51.64±2.20a
|
55.84±3.19a
|
| rs640683953(A>C) |
CA |
1 |
16.20±0.00 |
54.50±0.00 |
55.00±0.00 |
59.80±0.00 |
| CC |
125 |
14.29±2.17 |
51.82±2.78 |
50.34±2.77 |
54.65±2.99 |
| rs654358008(G>C) |
CC |
4 |
14.25±2.17 |
51.78±2.81 |
50.32±2.82 |
54.58±2.97 |
| GC |
125 |
14.85±2.12 |
51.80±1.29 |
50.45±1.97 |
56.35±4.24 |
| rs671132057(T>C) |
CC |
68 |
14.63±2.38 |
52.52±2.92 |
50.68±2.50 |
55.59±2.82a
|
| CT |
37 |
14.09±2.10 |
51.5±2.79 |
50.05±2.90 |
54.19±3.04b
|
| TT |
21 |
14.30±2.15 |
51.46±2.49 |
50.65±3.08 |
54.40±3.15 |
| rs652062749(G>A) |
AA |
49 |
15.10±2.26 |
54.26±1.78Aa
|
51.00±1.93 |
54.46±2.89 |
| AG |
67 |
14.41±1.94 |
52.02±2.68b
|
50.53±2.76 |
54.88±2.78 |
| GG |
7 |
13.96±2.26 |
51.18±2.78Bb
|
49.99±2.92 |
54.38±3.16 |
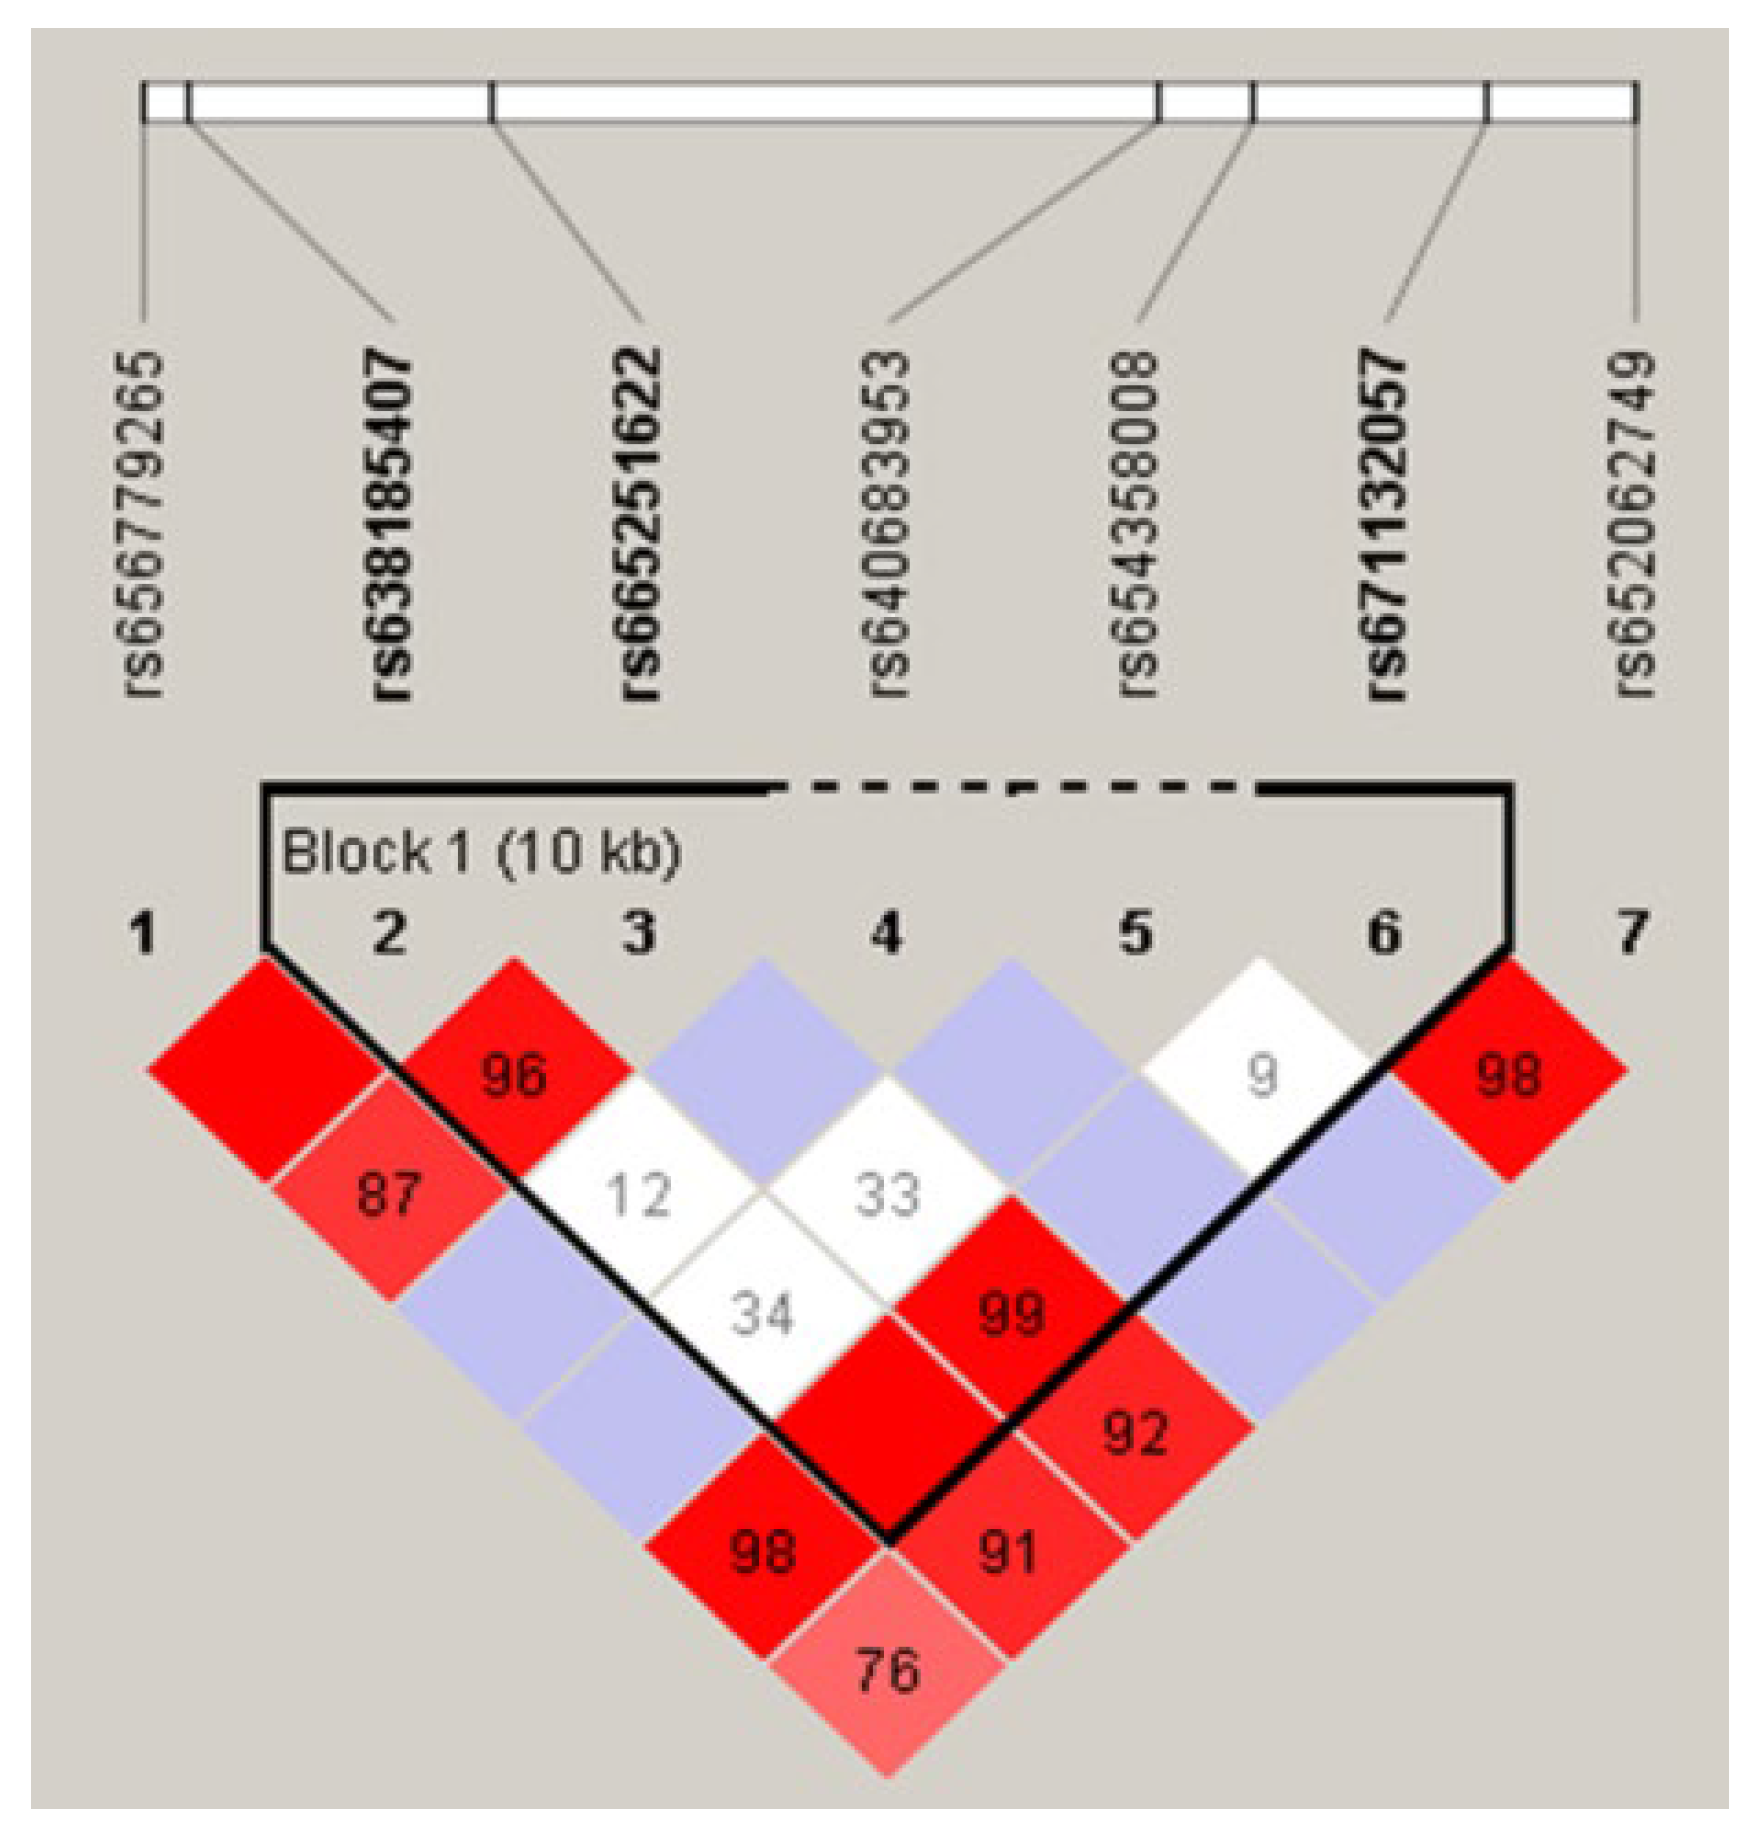
Combination genotypes are formed by combining genotypes of SNPs in linkage disequilibrium. To ensure accurate association analysis, only combination genotypes with a sample size of more than three individuals were selected for association analysis with the growth traits of Nanjiang yellow goats.
The association analysis of combination genotypes and birth weight of Nanjiang Yellow goat revealed that the average birth weight of the ATCACT combination genotype was the largest. The birth weights of individuals with the ATCACT combination genotype were significantly better (P<0.01) than those with the AACCCC and ATCACC combination genotypes, as well as the TTAATT and TTCCCC combination genotypes. In contrast, the AACCCC combination genotype was significantly inferior (P<0.01) compared to other genotypes.
Table 6.
Association analysis of combination genotypes and birth weight of Nanjiang Yellow goat
Table 6.
Association analysis of combination genotypes and birth weight of Nanjiang Yellow goat
| Combination Genotypes |
Birth Weight(kg) |
|
| AACCCC(4) |
1.98±0.68ADa
|
|
| ATCACC(10) |
2.08±0.58ACD
|
|
| ATCACT(44) |
2.35±0.28BCD
|
|
| TTAACC(4) |
2.20±0.14b
|
|
| TTAACT(21) |
2.32±0.35b
|
|
| TTAATT(66) |
2.24±0.29ABCb
|
|
| TTCACC(27) |
2.23±0.20b
|
|
| TTCACT(93) |
2.22±0.29b
|
|
| TTCCCC(33) |
2.24±0.26ABCb
|
|
The analysis of the association between combination genotypes and growth traits at two months of age revealed that the Nanjiang yellow goat group with the TTAACT combination genotype exhibited the greatest mean values for all parameters. However, the difference in body weight and chest circumference with the other combination genotypes was not statistically significant. Moreover, the body length and height of individuals with the TTAACT combination genotype were significantly better than those of the TTAATT genotype group (P < 0.05).
Table 7.
Association analysis of combination genotypes and growth traits of Nanjiang Yellow goat at two months of age
Table 7.
Association analysis of combination genotypes and growth traits of Nanjiang Yellow goat at two months of age
| Combination Genotypes |
Two Months of Age |
|
| Body Weight(kg) |
Body Length(cm) |
Body Height(cm) |
Chest Circumference(cm) |
|
| ATCACC(5) |
11.20±1.10 |
47.20±2.39 |
45.40±1.34 |
51.40±1.67 |
|
| ATCACT(31) |
11.52±1.08 |
47.48±1.61 |
45.65±1.40 |
51.40±1.72 |
|
| TTAACT(8) |
11.88±1.25 |
48.88±2.70a
|
46.88±2.42a
|
52.25±1.28 |
|
| TTAATT(45) |
11.03±0.90 |
46.78±1.29b
|
45.02±1.16b
|
50.91±1.36 |
|
| TTCACC(10) |
11.10±0.52 |
47.50±1.51 |
45.60±1.07 |
51.25±1.03 |
|
| TTCACT(53) |
11.40±0.84 |
47.28±1.61 |
45.23±1.19 |
51.02±1.39 |
|
| TTCCCC(23) |
11.13±0.96 |
47.00±1.62 |
45.17±1.34 |
51.35±1.47 |
|
The association analysis of genotypes with weight and growth traits at four months of age showed that TTCCCC genotypes were extremely significantly better than ATCACT genotypes (P<0.01) and significantly better than TTCACC genotypes (P<0.05). In addition, TTCCCC genotypes were extremely significantly better than ATCACT genotypes concerning body length (P <0.01) and significantly better than TTCACC, TTAATT, and TTAACT combination genotypes (P<0.05). The height of the TTCCCC combination genotypes was extremely significantly better than the ATCACT combination genotypes (P<0.01) and significantly better than the TTCACC and ATCACC combination genotypes (P<0.05). In addition, the chest circumference of the TTCCCC combination genotypes was significantly better than that of the ATCACT combination genotypes (P<0.05).
Table 8.
Association analysis of combination genotypes and growth traits of Nanjiang Yellow goat at four months of age
Table 8.
Association analysis of combination genotypes and growth traits of Nanjiang Yellow goat at four months of age
| Combination Genotypes |
Four Months of Age |
|
| Body Weight(kg) |
Body Length(cm) |
Body Height(cm) |
Chest Circumference(cm) |
|
| ATCACC(5) |
14.24±1.71 |
52.76±1.97abc
|
49.52±1.94bd
|
55.96±2.63a
|
|
| ATCACT(13) |
13.05±2.24B
|
49.83±2.86Babd
|
48.37±3.21Babd
|
52.82±3.13b
|
|
| TTAACT(13) |
14.24±2.68 |
51.27±2.55bcd
|
50.32±2.61 |
54.63±4.04 |
|
| TTAATT(21) |
14.30±2.15 |
51.46±2.49bcd
|
50.65±3.08abc
|
54.40±3.15 |
|
| TTCACC(17) |
13.81±1.91b
|
51.28±2.83bcd
|
49.90±2.06bd
|
54.74±2.12 |
|
| TTCACT(40) |
14.37±1.83 |
52.13±2.74 |
50.43±2.80 |
54.43±2.63 |
|
| TTCCCC(10) |
15.70±2.34Aa
|
54.03±1.92Aacd
|
52.15±2.09Aacd
|
55.96±3.34a
|
|
The association of combined genotypes with growth traits at the age of six months revealed that the TTAACT combined genotypes individuals were significantly superior (P<0.05) to the TTCCCC combined genotypes in terms of body weight and body length. Furthermore, the body height of TTAACT combination genotypes individuals was extremely significantly better than that of TTCCCC and TTCACT combination genotypes (P<0.01) and significantly better than those of TTAATT combination genotypes (P<0.05). TTAACT combination genotypes' chest circumference was significantly better than TTCACT and TTCCCC combination genotypes (P<0.01).
Table 9.
Association analysis of combination genotypes and growth traits of Nanjiang Yellow goat at six months of age
Table 9.
Association analysis of combination genotypes and growth traits of Nanjiang Yellow goat at six months of age
| Combination Genotypes |
Six Months of Age |
|
|
| Body Weight(kg) |
Body Length(cm) |
Body Height(cm) |
Chest Circumference(cm) |
|
| ATCACC(5) |
26.40±5.81abc
|
59.20±7.36 |
57.20±7.05ACD
|
65.40±5.13 |
|
| ATCACT(31) |
27.29±4.31Aacd
|
60.71±5.75Aacd
|
57.19±5.03ACDabc
|
66.82±4.75ACDacd
|
|
| TTAACT(8) |
28.19±5.74abc
|
60.75±5.65abc
|
58.5±5.63ACacd
|
67.00±5.01ABCabc
|
|
| TTAATT(45) |
25.50±4.02 |
58.80±5.37 |
55.71±4.66bcd
|
64.82±4.28bcd
|
|
| TTCACC(10) |
26.70±3.43 |
59.90±4.98 |
56.90±4.41 |
66.00±4.22bcd
|
|
| TTCACT(53) |
25.47±4.06bcd
|
58.68±5.08bcd
|
55.75±4.45ABDabd
|
64.56±4.32BDbd
|
|
| TTCCCC(23) |
24.78±4.39Babd
|
57.78±5.08Babd
|
55.09±4.06BCDabd
|
64.04±3.78BDbd
|
|
Correlating the combination genotypes with growth traits at one year of age exhibited that the samples with TTAACT combination genotypes exhibited the highest data for all growth traits. Among them, the TTAACT combination genotypes were significantly better than the TTCCCC combination genotypes regarding body weight (P<0.01) and significantly better than the TTCACT combination genotypes.
The body length of TTAACT combination genotypes was found to be extremely significantly better than TTCACT and TTCCCC combination genotypes (P<0.01) and significantly better than TTAATT and TTCACC combination genotypes (P<0.05).
Individuals of the TTAACT combination genotype exhibited extremely significantly better body height than those of the TTCACT and TTCCCC combination genotypes (P<0.01) and significantly better than the TTAATT combination genotypes (P<0.05). Furthermore, Individuals of the TTAACT combination genotype were significantly better (P<0.05) than those of the TTCACT and TTCCCC combination genotypes regarding chest circumference.
Table 10.
Association analysis of combination genotypes and growth traits of Nanjiang Yellow goat at one year of age
Table 10.
Association analysis of combination genotypes and growth traits of Nanjiang Yellow goat at one year of age
| Combination Genotypes |
One Year of Age |
|
| Body Weight(kg) |
Body Length(cm) |
Body Height(cm) |
Chest Circumference(cm) |
|
| ATCACC(5) |
35.30±4.02 |
66.80±5.76abc
|
64.00±5.43acd
|
76.40±6.58acd
|
|
| ATCACT(31) |
35.53±5.29Aacd
|
67.06±5.82Aabc
|
63.87±4.99acd
|
74.83±4.79acd
|
|
| TTAACT(8) |
37.31±6.85Aabc
|
69.13±6.51Aacd
|
65.63±5.4Aacd
|
78.13±5.33acd
|
|
| TTAATT(45) |
33.77±4.71 |
65.76±4.95bcd
|
62.71±4.23bcd
|
74.58±5.01 |
|
| TTCACC(10) |
34.40±5.81abc
|
66.70±5.01bcd
|
64.20±4.26abc
|
76.90±4.98abc
|
|
| TTCACT(53) |
33.67±4.48bd
|
65.51±4.8Bbd
|
62.68±4.11Bbcd
|
76.44±5.77bcd
|
|
| TTCCCC(23) |
32.89±4.85Bbd
|
65.09±4.44Bbd
|
62.17±3.95Bbd
|
74.24±4.72bd
|
|
The association of combined genotypes with growth traits at 1.5 years of age revealed (
Table 11) that individuals of TTAACT combination genotype were significantly superior to TTAATT and TTCACT combined genotypes in body weight (P<0.05). In addition, the body length of individuals with TTAACT combination genotypes exhibited extremely significantly better than TTCCCC combination genotypes (P<0.01) and significantly better than TTAATT and TTCACT combination genotypes (P<0.05). Moreover, the body height of individuals with TTAACT combination genotypes was extremely significantly better than TTCCCC combination genotypes (P<0.01). Moreover, the chest circumference of TTAACT combination genotype individuals was found to be extremely significantly better than TTAATT, TTCACT, and TTCCCC combination genotypes (P<0.01) and significantly better than TTCACC combination genotypes (P<0.05).
Table 11.
Association analysis of combination genotypes and growth traits of Nanjiang Yellow goat at 1.5 years of age
Table 11.
Association analysis of combination genotypes and growth traits of Nanjiang Yellow goat at 1.5 years of age
| Combination Genotypes |
1.5 Years of Age |
|
| Body Weight(kg) |
Body Length(cm) |
Body Height(cm) |
Chest Circumference(cm) |
|
| ATCACC(5) |
49.80±9.42ACDacd
|
75.00±7.31ACDEFacd
|
70.00±6.16abcde
|
86.20±6.61abc
|
|
| ATCACT(31) |
49.31±7.63ABCacd
|
74.58±5.67ABCEFacd
|
70.23±4.63abcef
|
87.58±4.80Aacd
|
|
| TTAACT(8) |
53.00±10.76ABCacd
|
76.50±7.11ABCDEacd
|
72.50±5.61Aacdef
|
88.50±5.71Aacd
|
|
| TTAATT(45) |
46.86±6.84BCDbcd
|
72.27±4.64BDEFbcd
|
68.53±3.40bcdef
|
84.74±4.79Bbcd
|
|
| TTCACC(10) |
49.15±7.2ABCabc
|
74.40±5.62ABCDEabc
|
69.40±3.84bcdef
|
86.20±3.74bcd
|
|
| TTCACT(53) |
47.58±6.41BCDbcd
|
73.08±5.06BCDEFbcd
|
68.98±3.87bcdef
|
85.25±4.57Bbcd
|
|
| TTCCCC(23) |
45.80±6.08BDbd
|
71.74±4.71BDFbd
|
68.43±4.40Bbdf
|
84.24±4.47Bbd
|
|
3.7. The Detection and Functional Verification of Non-Coding SNPs in IGF2BP1
SNPs in non-coding regions can indirectly regulate the gene expression process, thereby affecting animal phenotype or reproductive performance[
23,
24]. The dual luciferase reporter vector assay is an accurate and reliable method to validate non-coding SNPs in research[
25,
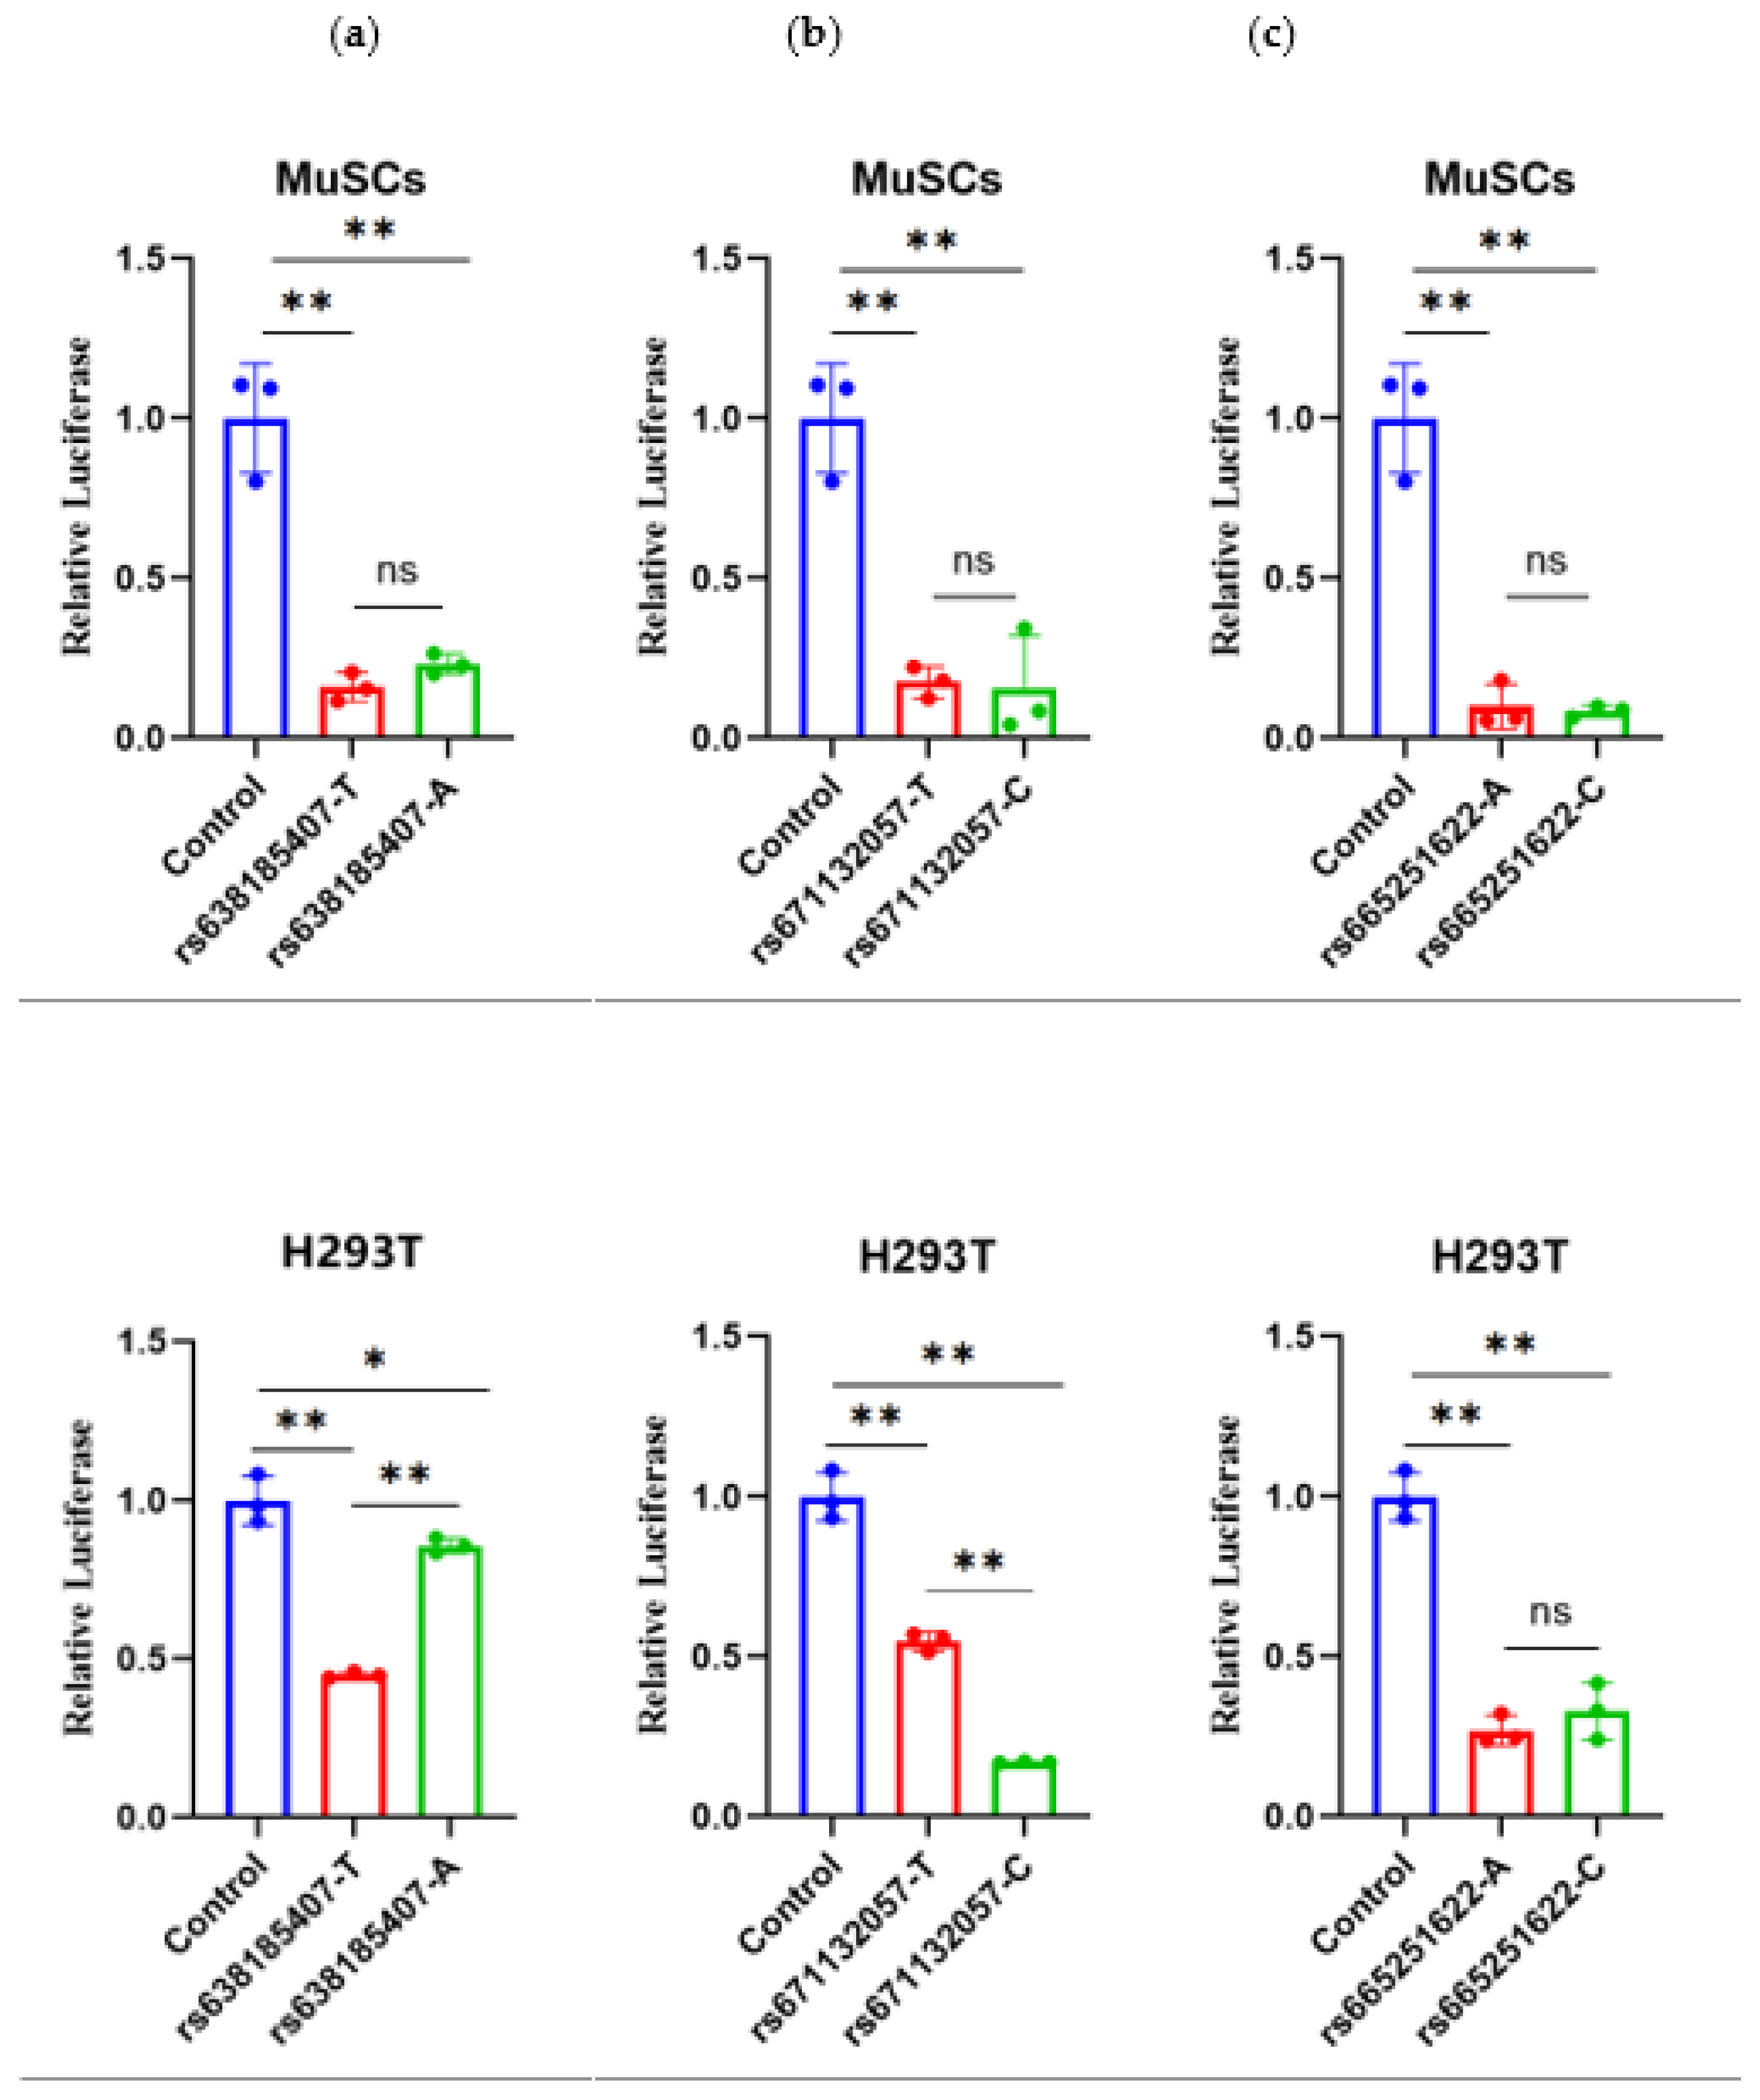
26]. In this study, we performed dual luciferase assays for three strong linkage SNPs in two cells, H293T and MuSCs(
Figure 4). For RS638185407(T>A), the dual luciferase activity of both genotypes in MuSCs cells was extremely significantly lower than that of the control (P<0.01), which demonstrated an inhibitory effect. However, the comparison of the two types was not statistically significant. There was a tendency for the mutant type (A) to be elevated, with the dual-luciferase activity of the wild type being extremely significantly lower than that of the control (P<0.01) and the mutant type being significantly lower than the H293T cells (P<0.05). Both the wild and mutant types demonstrated an inhibitory effect, with the wild type's activity also found to be extremely significantly lower than that of the mutant type (P<0.01).
In terms of RS671132057(T>C), in MuSCs cells, the dual-luciferase activities of both types were extremely significantly lower than that of the control (P<0.01), indicating an inhibitory effect. However, the comparison between the two types was not significant, while the mutant type(C) tended to decrease. In H293T cells, both types' dual-luciferase activities were also extremely significantly lower than the control (P<0.01), indicating an inhibitory effect. Furthermore, the mutant activity was extremely significantly lower than the wild type (P<0.01).
For RS665251622(A>C), both genotypes exhibited extremely significantly lower (P<0.01) dual-luciferase activity in MuSCs cells than in controls (P<0.01), which was inhibitory. However, the comparison between the two types was not significant, while the wild type's dual-luciferase activity was extremely significantly lower (P<0.01) in H293T cells than in controls (P<0.01), both of which were inhibitory. The comparison between the two types was not significant, with a tendency for the mutant type (C) to be elevated.
Figure 4.
The results of the dual-luciferase assays for three SNPs in two cells
Figure 4.
The results of the dual-luciferase assays for three SNPs in two cells


