1. Introduction
Primary high energy cosmic rays reaching the Earth interact with gas in our atmosphere to produce cascades of secondary particles. The important interactions involve the primary particles and their interaction daughters with atmospheric nuclei, initially producing pions, which subsequently provide a cascade of particles consisting of the remnants of the original interacting primary (the shower core), muons from the charged pions, plus electrons/positrons and gamma-rays (the electromagnetic cascade) initially from the neutral pions. The total of these components is an extensive air shower. These various components spread laterally from the shower axis (the continuation of the path of the primary particle) with lateral scales which are significantly different. The core lateral extension is of the order of metres, the characteristic scale of the electromagnetic cascade results from scattering on atmospheric nuclei and is ~60 m at sea-level (the Molière radius), and the muons are found to spread to much larger distances set by their initial angular distribution, with rather little atmospheric scattering.
When extensive air showers are studied, the relationships between signals in particle detectors at various spacings are of central interest since such detectors are used in air shower arrays to determine the parameters of the showers as they are observed [
1]. From those data, the arrays derive information on the initiating primary cosmic ray particle (e.g. [
2]). In the most basic form of measurement, a common study is that of the ‘decoherence’ between two detectors. That is, the way in which the coincidence rate between two detectors varies as their separation is changed [
3]. This type of experiment is of interest historically but, also, it is now accessible in teaching laboratories using relatively affordable hardware (e.g. [
4]). The resulting relationship between coincidence rate and separation is the ‘decoherence curve’ and this is often the topic of comic ray studies in undergraduate teaching laboratories. However, those data do contain subtleties which are relevant to understanding aspects of particle detection in large, complex, air shower arrays. As a result, a further point of interest in interpreting decoherence experiments is to better understand the statistical properties of detector signals, particularly close to the shower core.
The interpretation of decoherence data may appear trivial, but it is, in fact, dependent on understanding the combined detailed structure of the electromagnetic component (the ’soft’ component) and the nuclear-active core of the showers near the shower core [
5]. In studies of large air shower, arrays, multiple detectors are used and data recording is triggered by coincidences between subsets of those detectors [
2]. In this case, ‘two detector’ decoherence curves can also be derived for those detectors which are a part of the complex triggering arrangements. In this case, the trigger is not just a coincidence between the detectors themselves (except that it is required that both do themselves trigger) but also the trigger requirements of the array as a whole. The decoherence curve for nearby detectors, which also requires the air shower trigger, then reflects the relationship between signals in rather closely-spaced detectors within the triggering shower. Due to the nature of the trigger within a cascade having a steep particle lateral distribution, these detectors are generally found close to the shower core and here, particle densities may be rapidly changing with location.
This paper examines a traditionally derived decoherence curve and its interpretation with the aid of a very simple toy air shower model. It then examines such curves which are found when the trigger is the detection of an external air shower plus two triggered detectors, in order to understand the triggering process in terms of detector core distances and the resulting statistical relationship between the particle densities in the spaced detectors.
2. Materials and Methods
2.1. Detectors for Decoherence Studies.
The studies described here were carried out at the University of Adelaide, close (below 100 m) to sea-level. They were based on a pair of 0.25 m2 (0.5 x 0.5 m) detectors consisting of plastic scintillators with 50 mm thickness, in light-tight cubic boxes, each viewed from above at a distance of 800 mm by a 120 mm photomultiplier tube. The laboratory was located below a roof and ceiling with a total absorber depth of ~5 g.cm2.. The detectors could either be self triggered (usually at the single particle level) with a two detector coincidence (one microsecond resolving time) or their data could be recorded after triggering also by the ‘Roof Array’ (see below) above the laboratory. In either case, particle densities were recorded using a CAMAC data acquisition system.
The scintillation detectors could be placed together (centre separation of 0.5 m) or could be separated with centres up to 7.5 m apart, a distance determined by the available space.
2.2. The Extensive Air Shower “Roof Array”.
In the roof space immediately above the decoherence scintillation detectors is a small seven-detector air shower array – the “Roof Array”. This consists of seven one square metre scintillation detectors in a rectangular array of dimensions 19 m x 10 m. The array triggers on a coincidence of three detectors, resulting in a mean array ‘shower size’ of about 2000 (vertical equivalent) particles, corresponding to a primary energy ~ 0.02 PeV. The roof array data are recorded using a CAMAC system with fast timing and particle density measurements for all seven detectors. The data are stored for all triggered detectors (including the test decoherence detectors). The intrinsic array trigger rate is of the order of one per three minutes.
Shower arrival directions, with an uncertainty of a few degrees, are routinely derived from fast timing analysis of the shower font using the times of the triggered detectors. The array is mainly sensitive to the electromagnetic cascade of the shower. This component has a rather short attenuation length and its atmospheric attenuation is high compared to other shower components such as the muons or the nuclear active core. A result is that half of the triggered showers arrive within about 20o of the zenith. Shower directions are not used explicitly in the analysis described here, apart from being an input to estimating the number of particles in the shower at detector level.
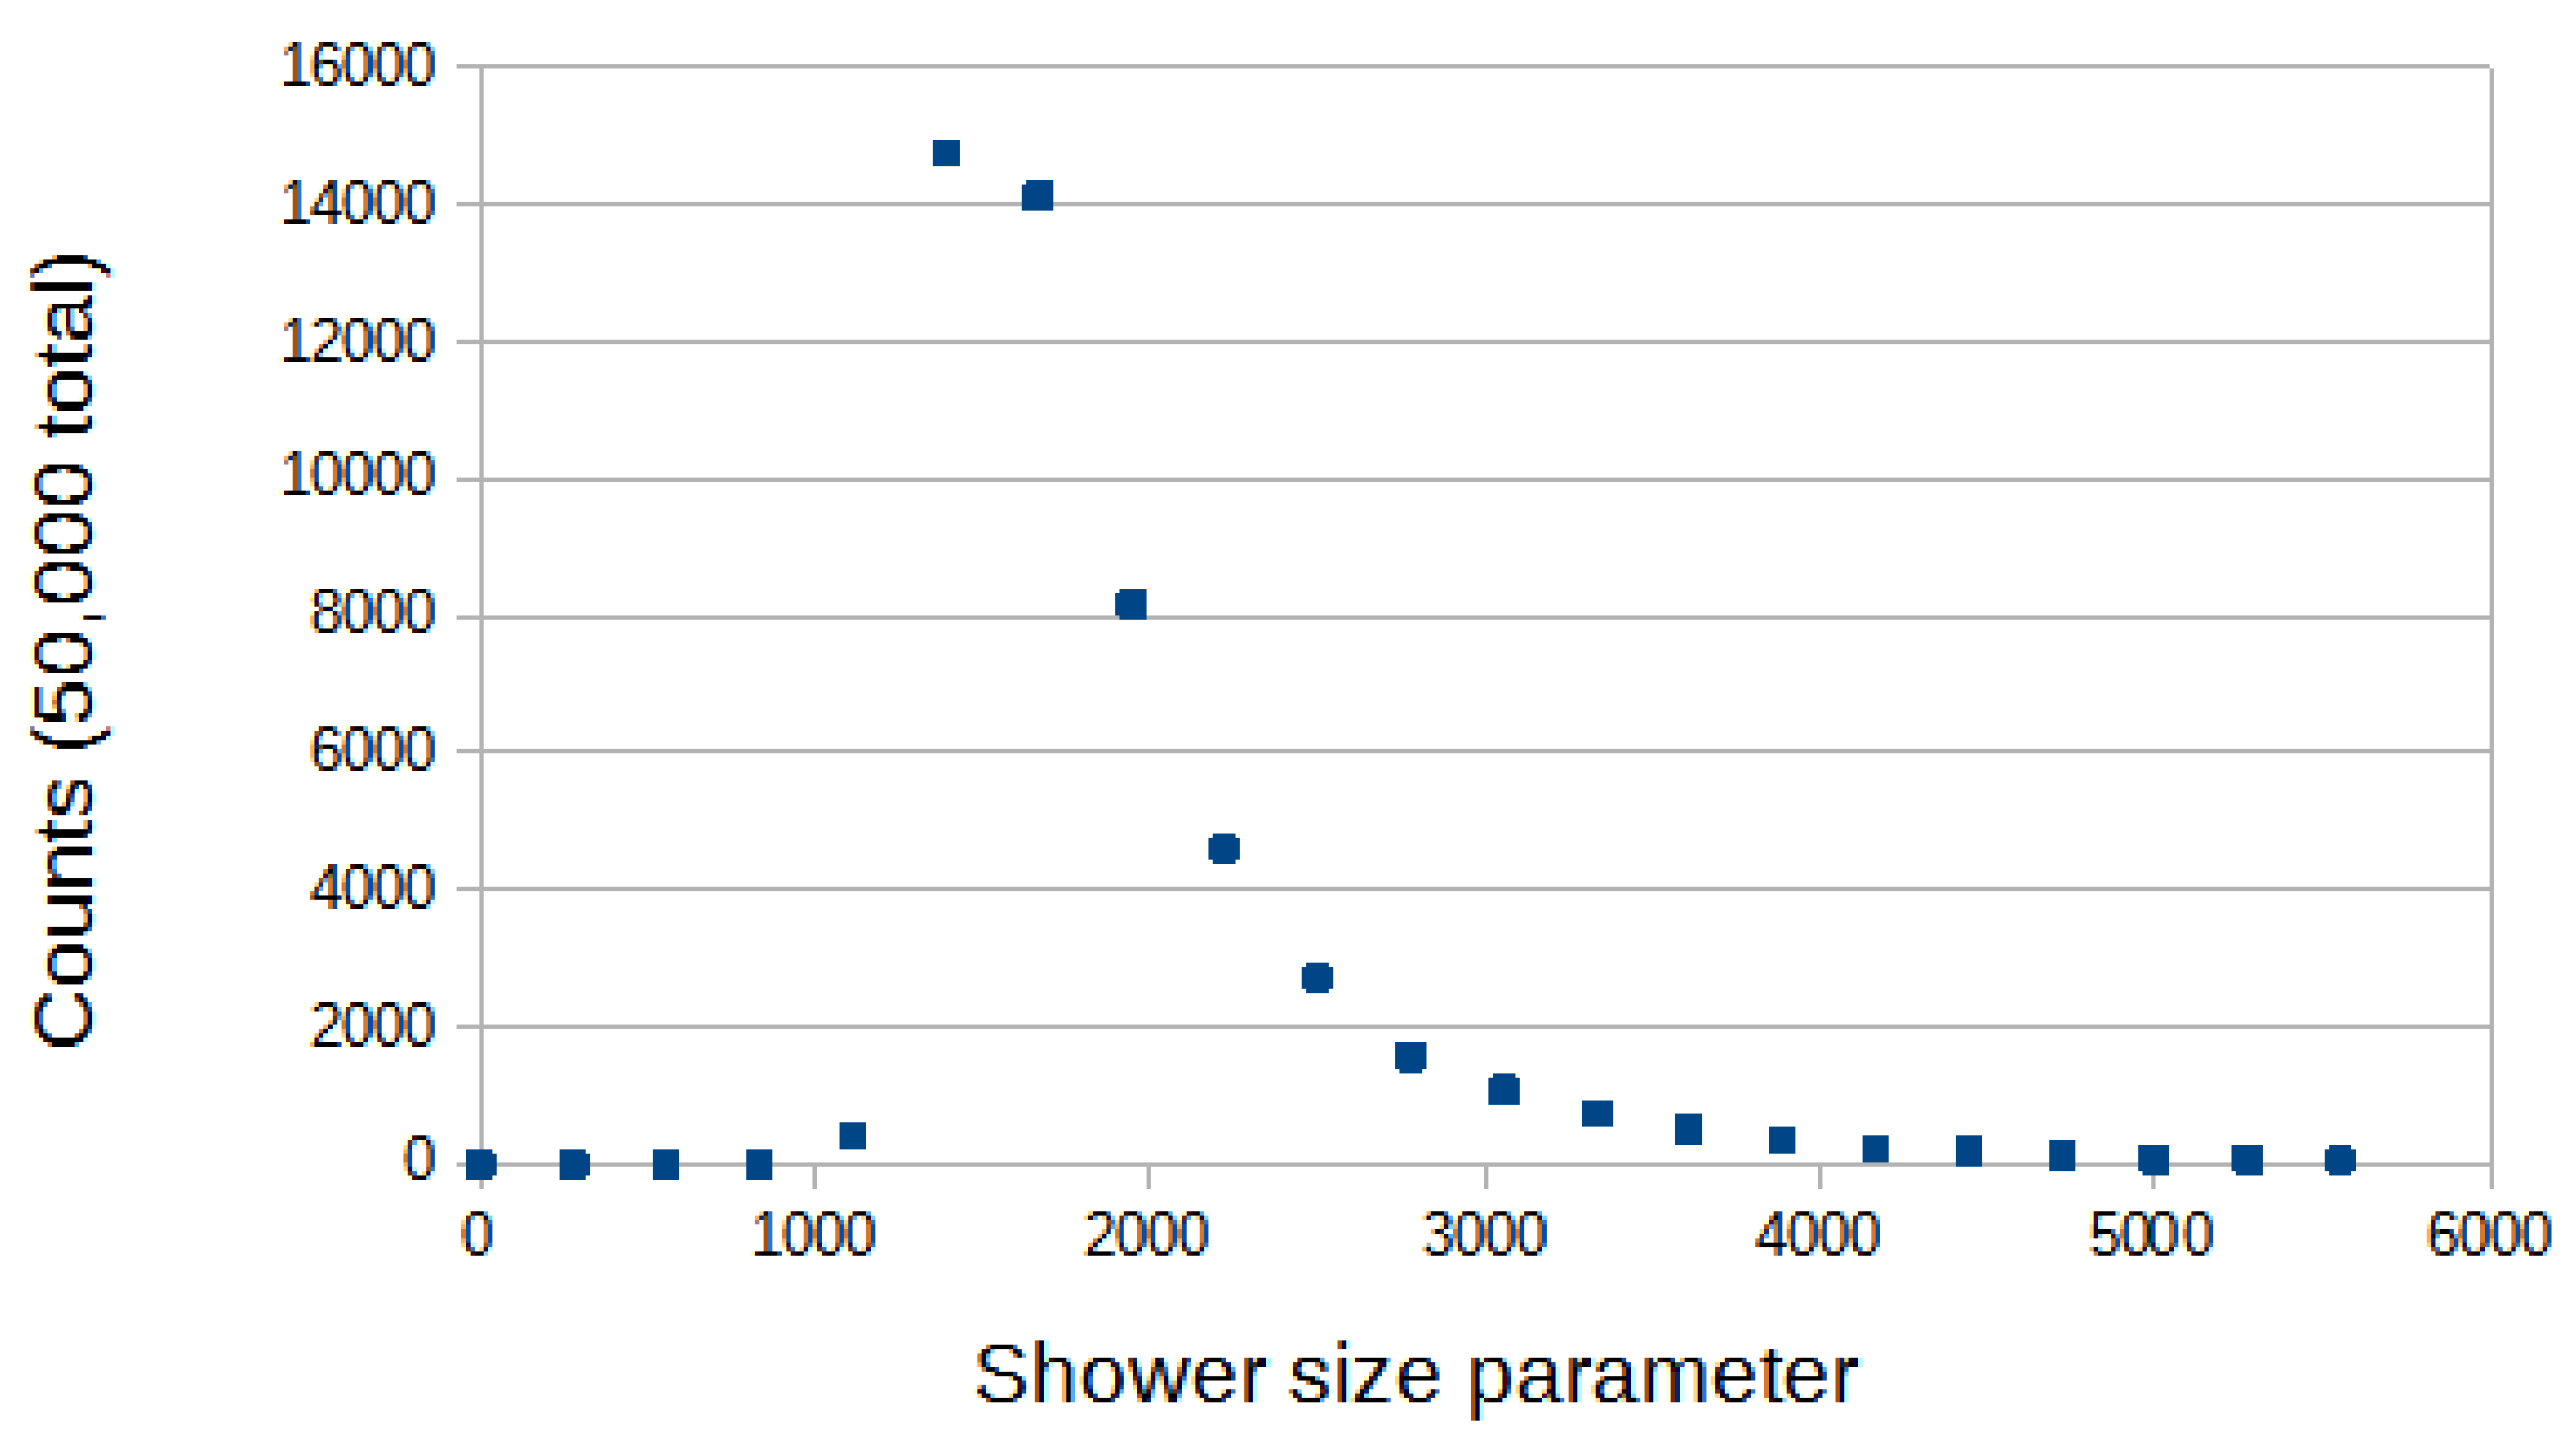
Since the array is rather small, many of the triggering showers fall outside the boundaries of the array. This means that a shower particle ‘size’ analysis is inherently uncertain. Nevertheless, a nominal size parameter (related to the total number of shower particles) is determined for each shower based on fitting a simple lateral distribution function (~exp(-r/Ro).1/r) to the array detector particle densities and this size is used below as a parameter to broadly classify showers. The distribution of this parameter is shown in Fig.1.
Figure 1.
The distribution of shower size parameters detected by the Roof Array when analysed by determining an arrival direction, and estimating a core location. This parameter is close to the total number of shower particles at the observation (sea) level.
Figure 1.
The distribution of shower size parameters detected by the Roof Array when analysed by determining an arrival direction, and estimating a core location. This parameter is close to the total number of shower particles at the observation (sea) level.
3. Results
3.1. Two Detector self-triggered Decoherence.
Air shower decoherence experiments, often found in undergraduate teaching laboratories, usually record the coincidence rate between two air shower detectors as a function of their horizontal spacing, typically out to distances of order 10 m. The detectors are usually set to trigger on single particles and the detectors themselves can be quite small, often with areas ~ 0.01 m
2. As a result, the largest practical spacing is often determined by the low coincidence trigger rate at large spacings, or the physical space available. A good example of a recent experiment is that of Riggi
et al. [
4]. They used 0.04 m
2 scintillators with spacings up to 26 m in a large lecture hall.
Riggi
et al. displayed their data in linear graphs of coincidence rate vs. spacing. Their data can be read and translated to a ln-ln power-law format and it can be seen to be adequately fitted by a falling power law with an index ~-0.8.
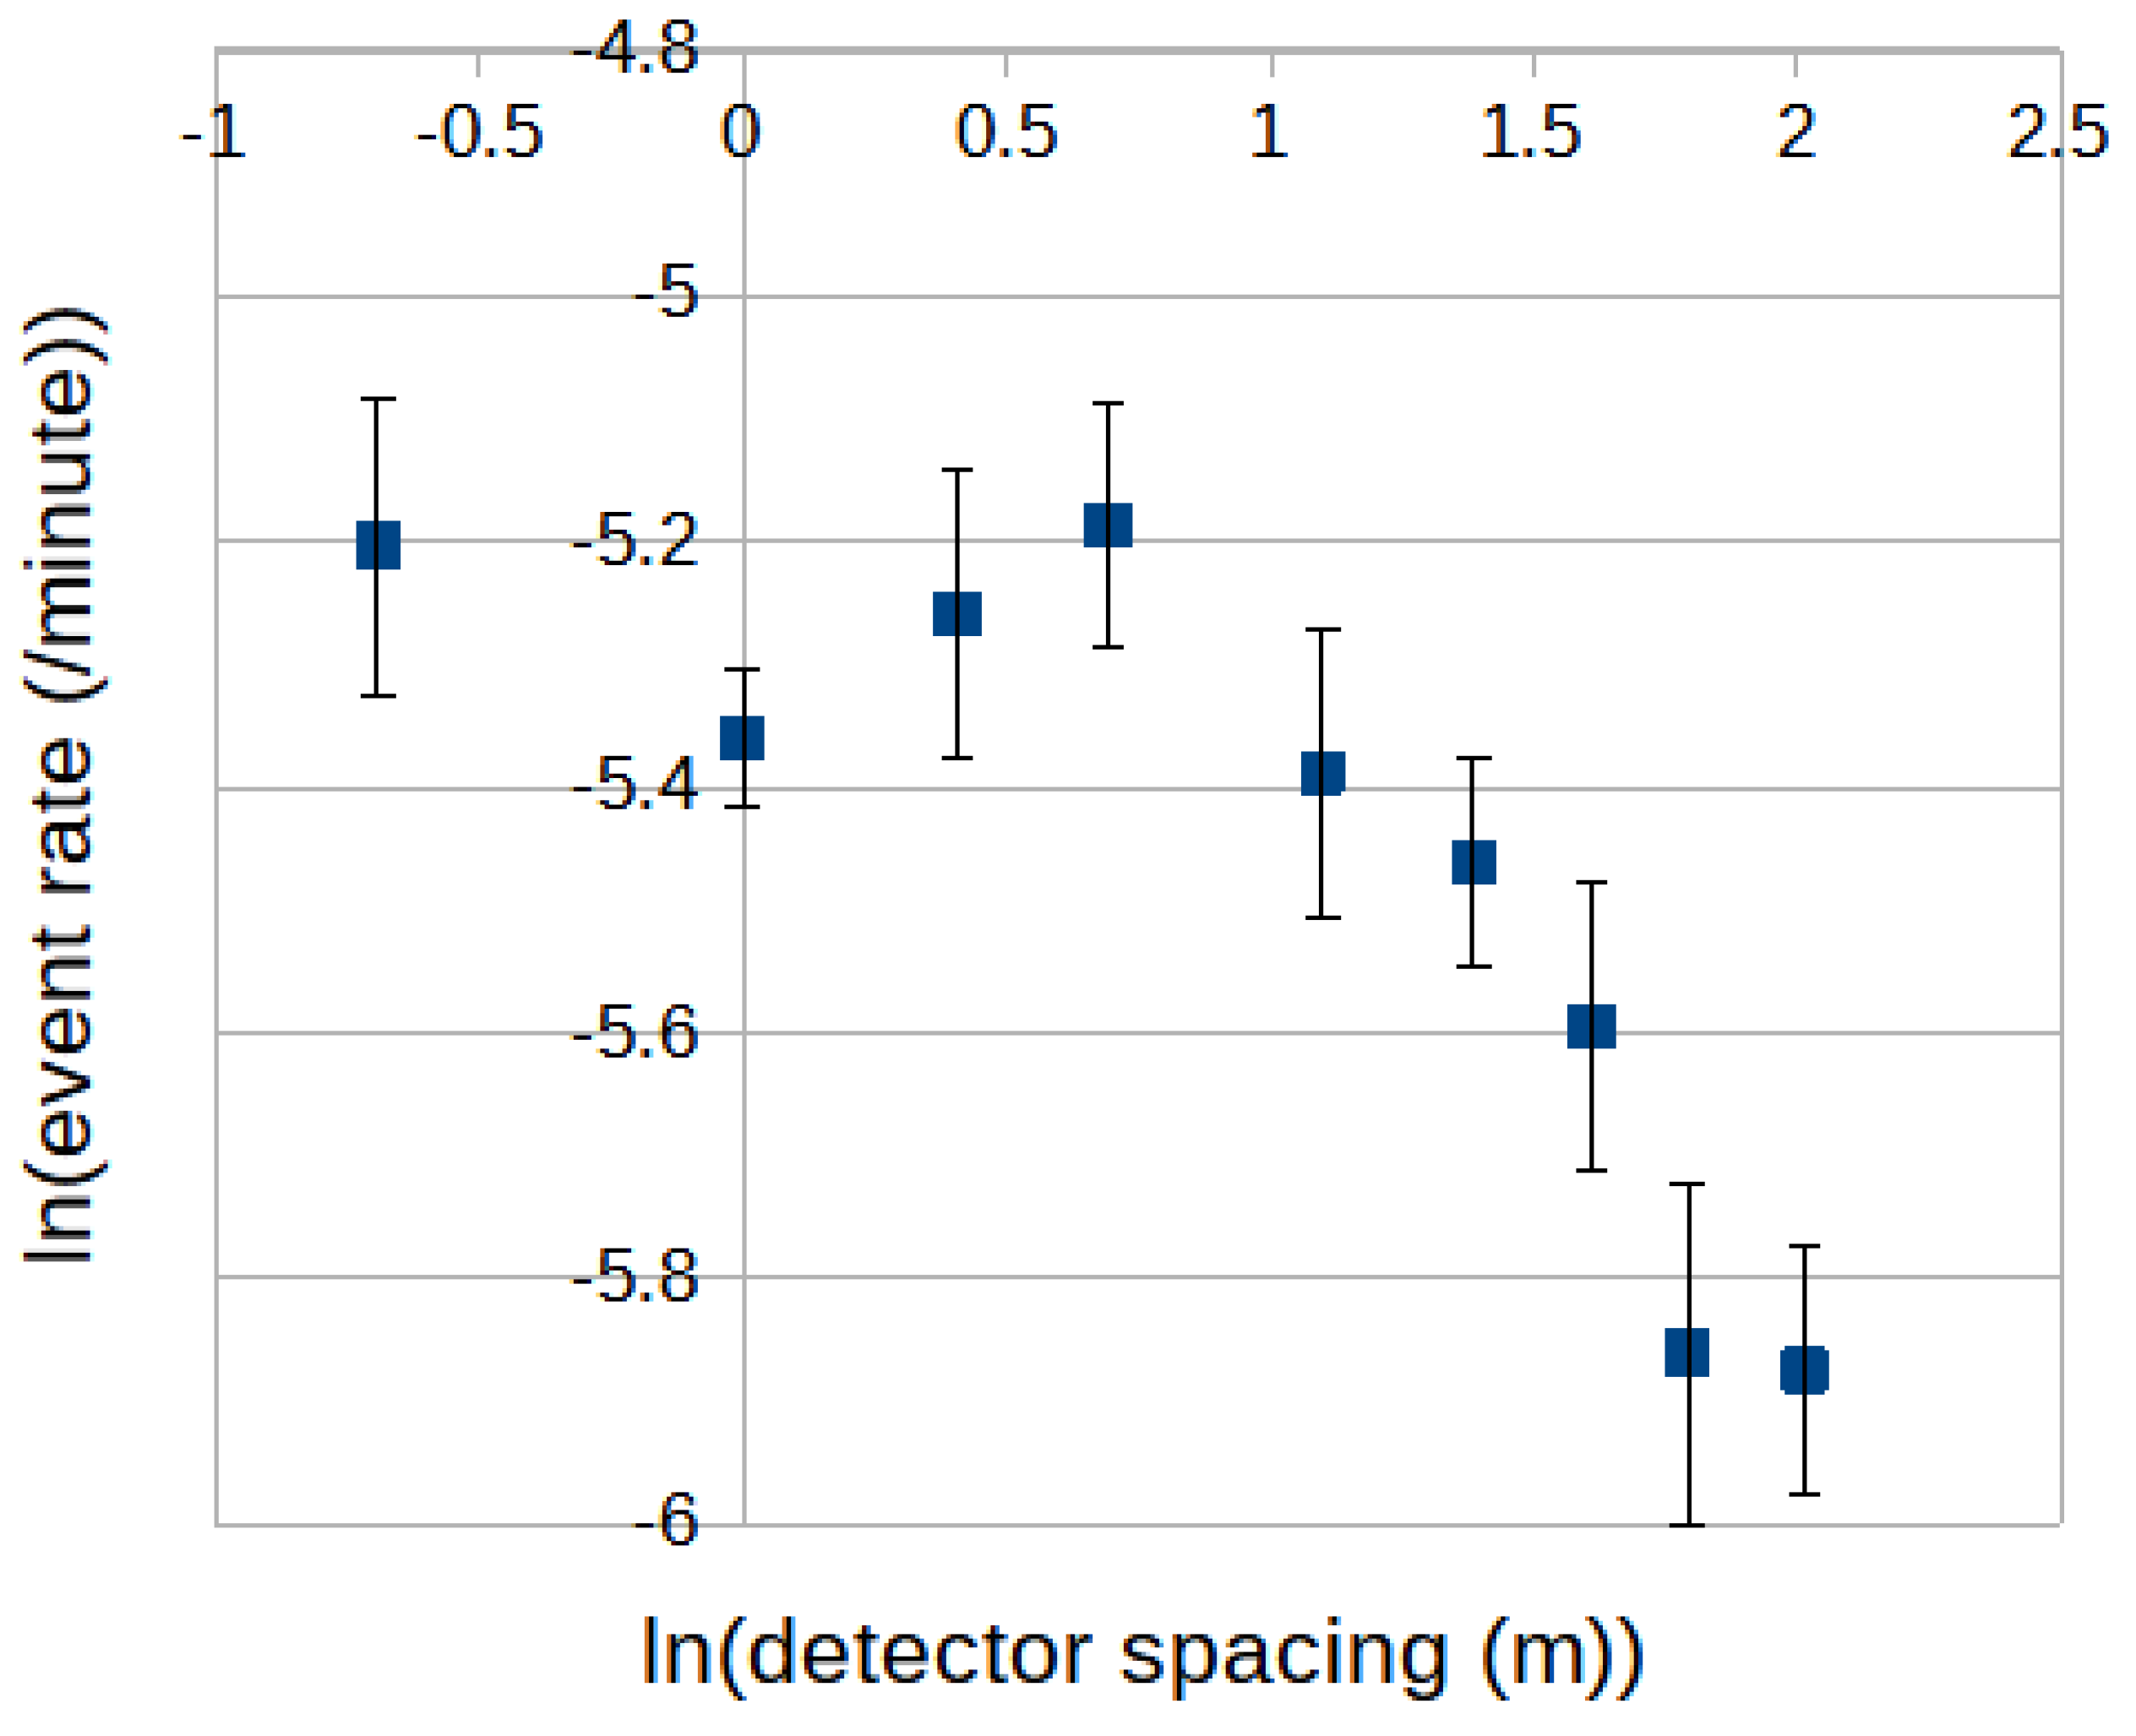
Figure 1 shows a similarly plotted ln-ln relationship determined using the Adelaide 0.25 m
2 scintillators (each triggered slightly below the one particle level). Again, a power law is an adequate fit to the data, in this case with a power law index of about -1.15. These results are also consistent in the values of their indices with modelling using a toy model, described below, such that the use of larger detectors (sensitive to smaller particle densities (per square metre)) results in a steeper power law relating coincidence rate and detector separation.
Figure 2.
Decoherence curve for two 0.25 m2 scintillation detectors (coincidence rate versus separation) expressed as a power law.
Figure 2.
Decoherence curve for two 0.25 m2 scintillation detectors (coincidence rate versus separation) expressed as a power law.
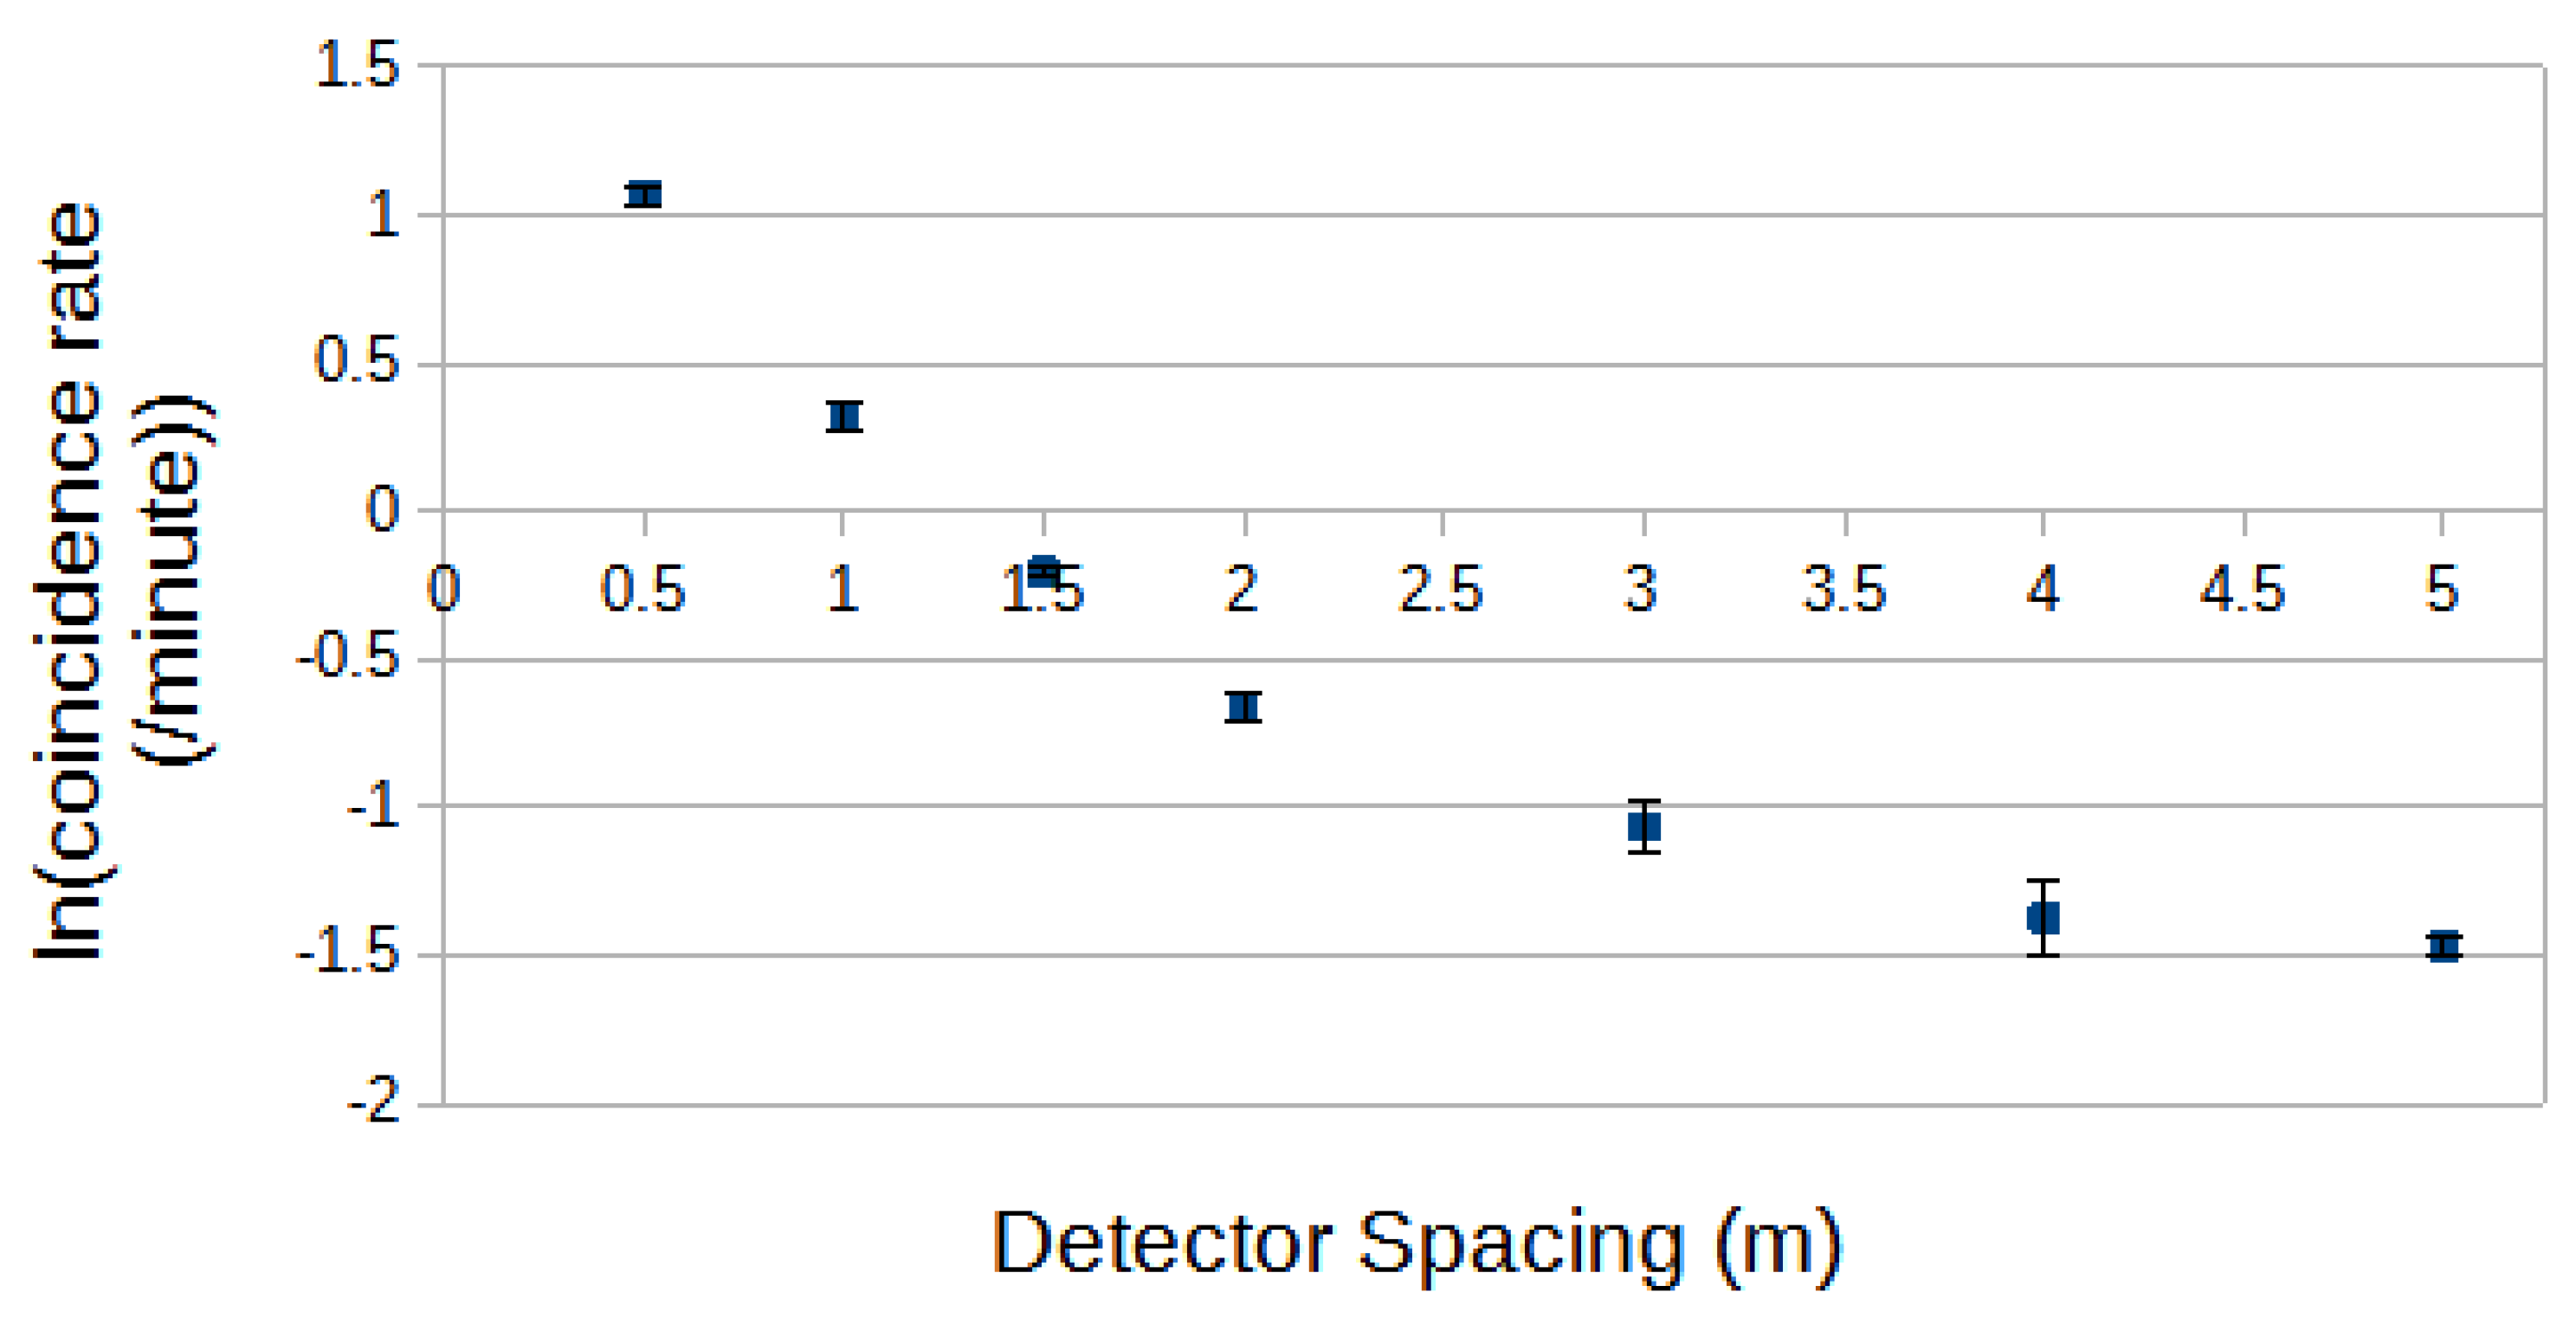
These data can, alternatively, be displayed in a ln-linear, exponential, format and this is shown in Fig. 3 for reference below. In the spacing range below one metre, an exponential may be a useful form.
Figure 3.
As Fig. 2 but in a ln-linear form. Note that the smallest spacings are set by the finite dimensions of the detectors (minimum centre spacing 0.5 m) and there will also be a resulting smoothing effect in the data at small spacings.
Figure 3.
As Fig. 2 but in a ln-linear form. Note that the smallest spacings are set by the finite dimensions of the detectors (minimum centre spacing 0.5 m) and there will also be a resulting smoothing effect in the data at small spacings.
3.2. Array triggered Decoherence
Rather than simple two detector decoherence systems, complex air shower arrays, consisting of many detectors, are more common systems for studying cosmic ray showers. An array might have a complex trigger, at least requiring several detectors in coincidence. There are then interesting questions concerning the statistical properties of detector density measurements within a triggered array either between array detectors or for a single detector, particularly near a shower core.
These issues can be examined if, rather than triggering the recording of data using just the two decoherence detectors themselves, the two test detectors can have their signal amplitudes recorded in coincidence with the Roof Array. Not all array triggers then result in measurable signals in the two detectors (for small showers, at least one detector may not contain a single measurable particle). Array triggered decoherence distributions can then be derived through the rate of array-plus-detector (pair) coincidences as a function of the spacing of the two test detectors. These distributions will be different to those in which triggering is determined solely by the test detectors themselves.
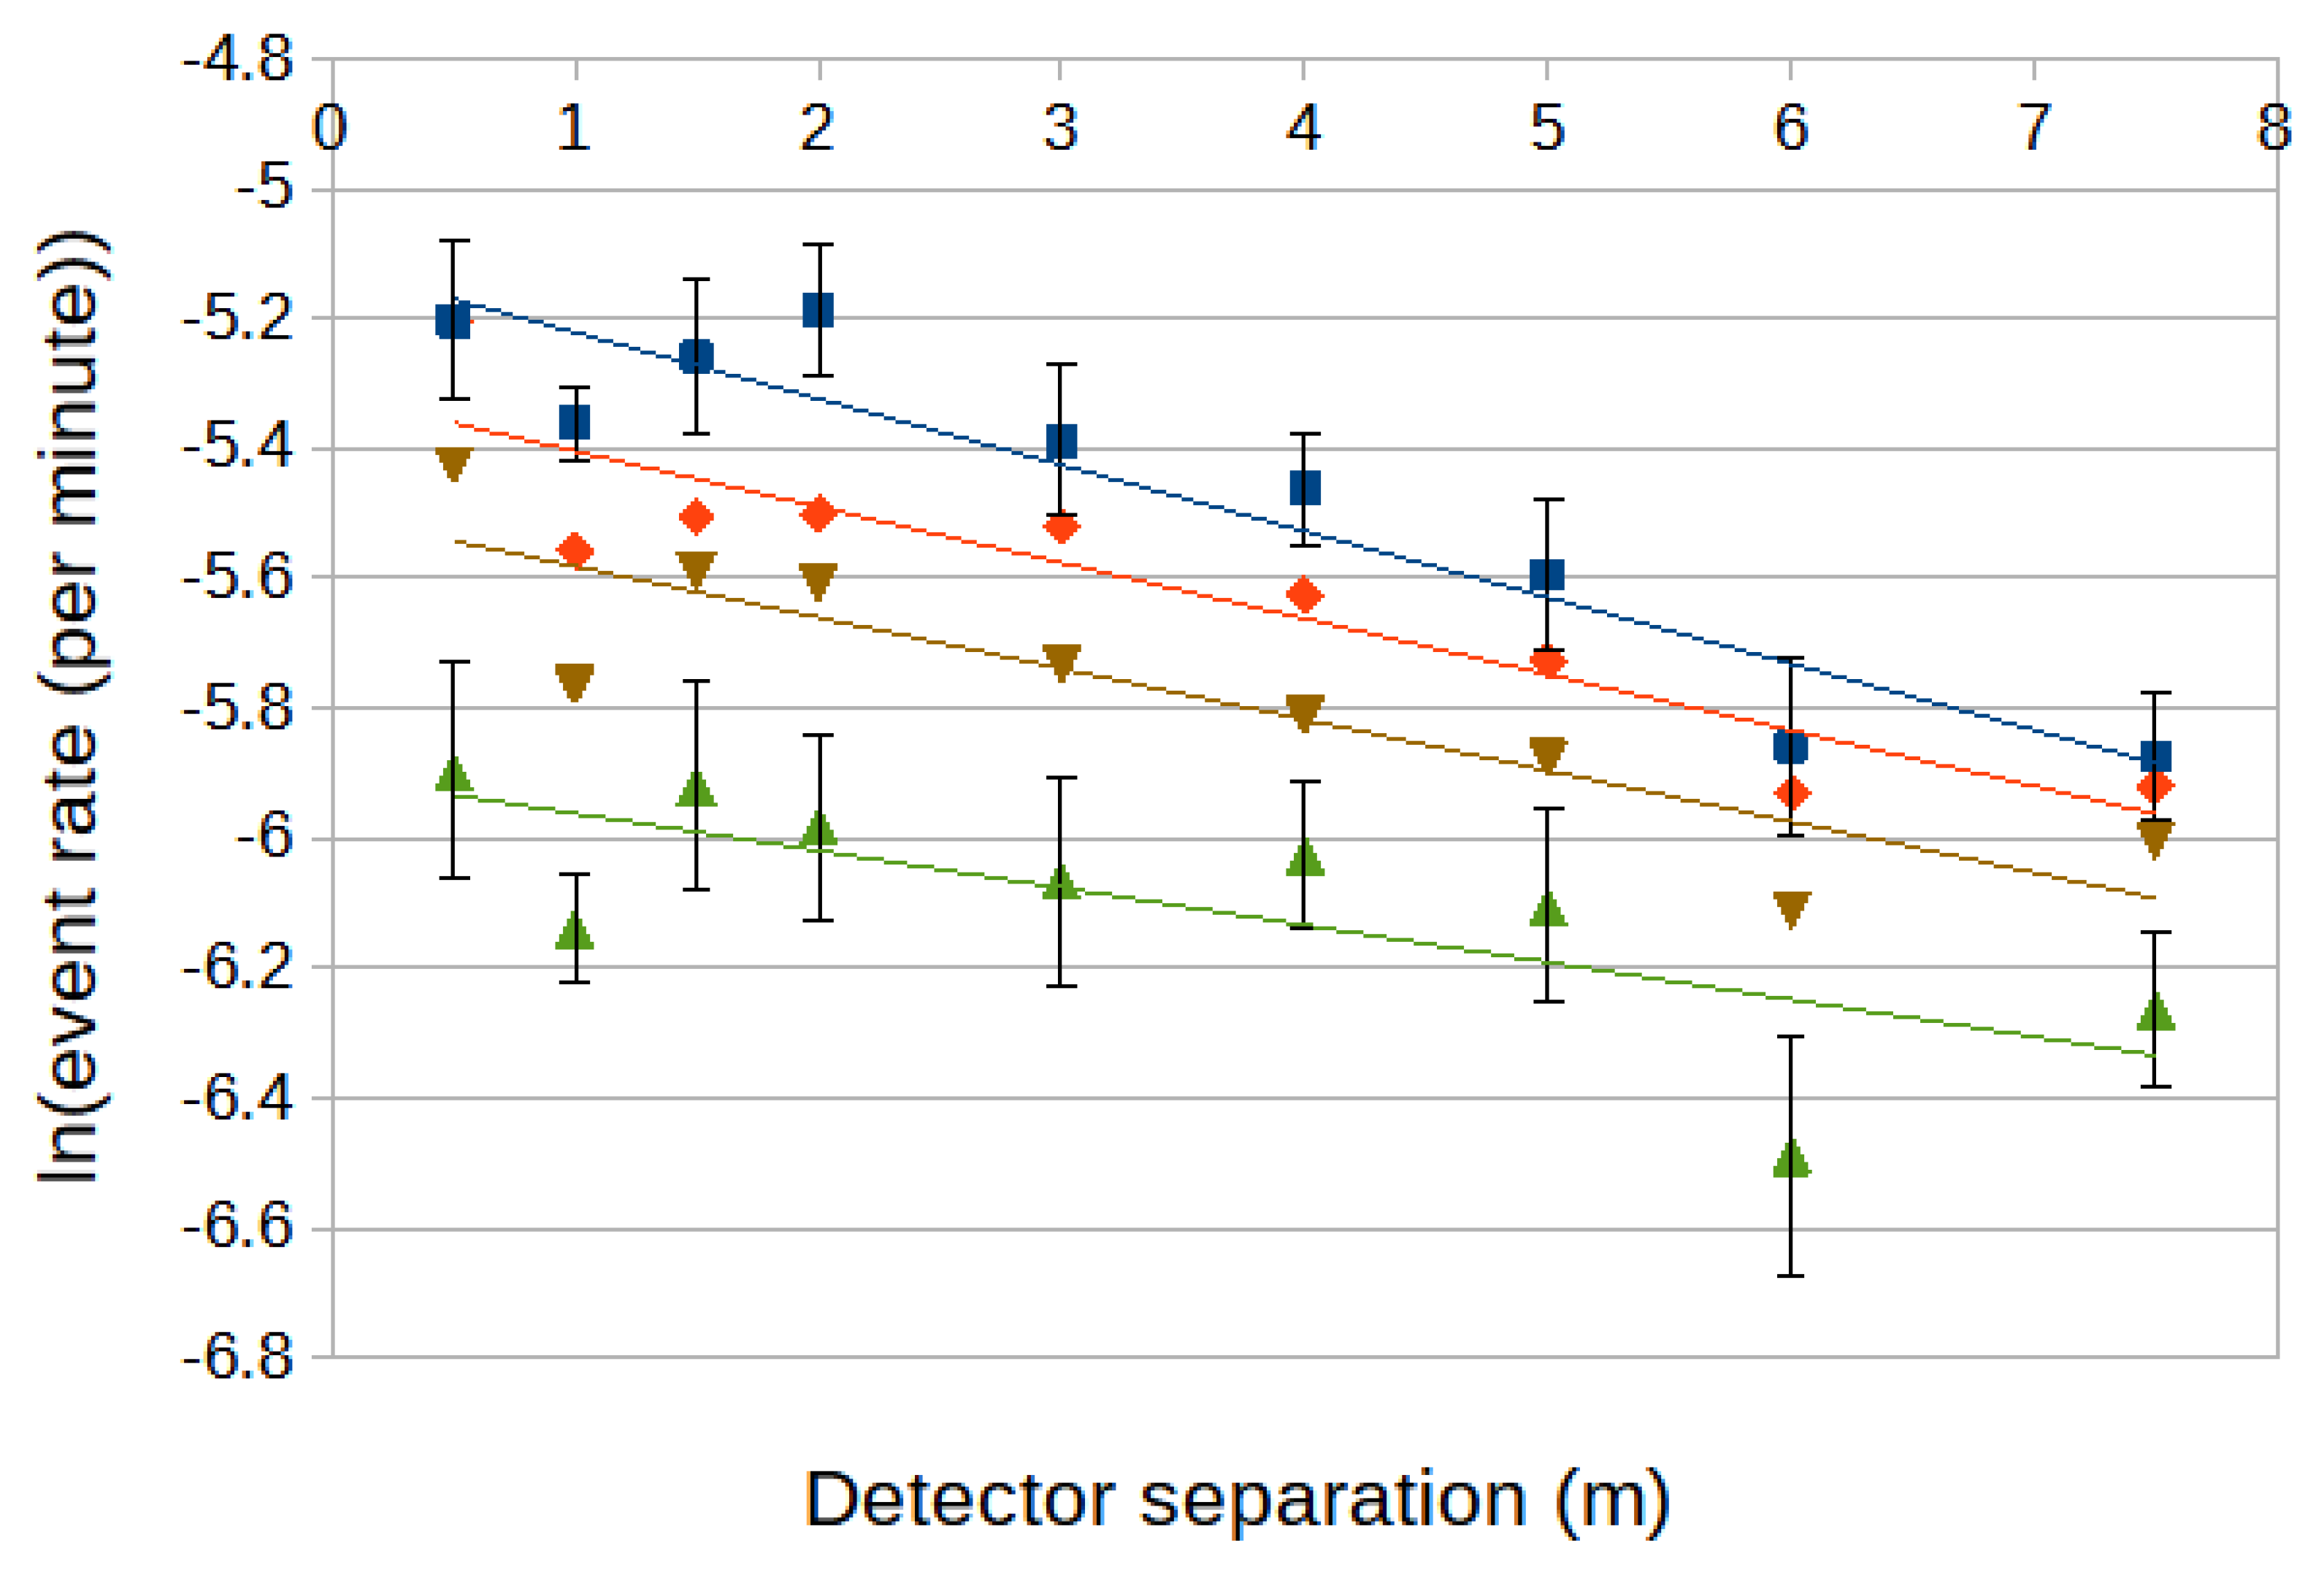
Figure 4 shows an example of such a (power-law) distribution for an array threshold shower size parameter of 2000. As before, the two decoherence detectors are triggered slightly below the one particle level. These data now clearly deviate from a power law form at small spacings, below 2 m.
As before, this deviation from a simple power law suggests that a ln-linear exponential form could be considered for the array triggered decoherence.
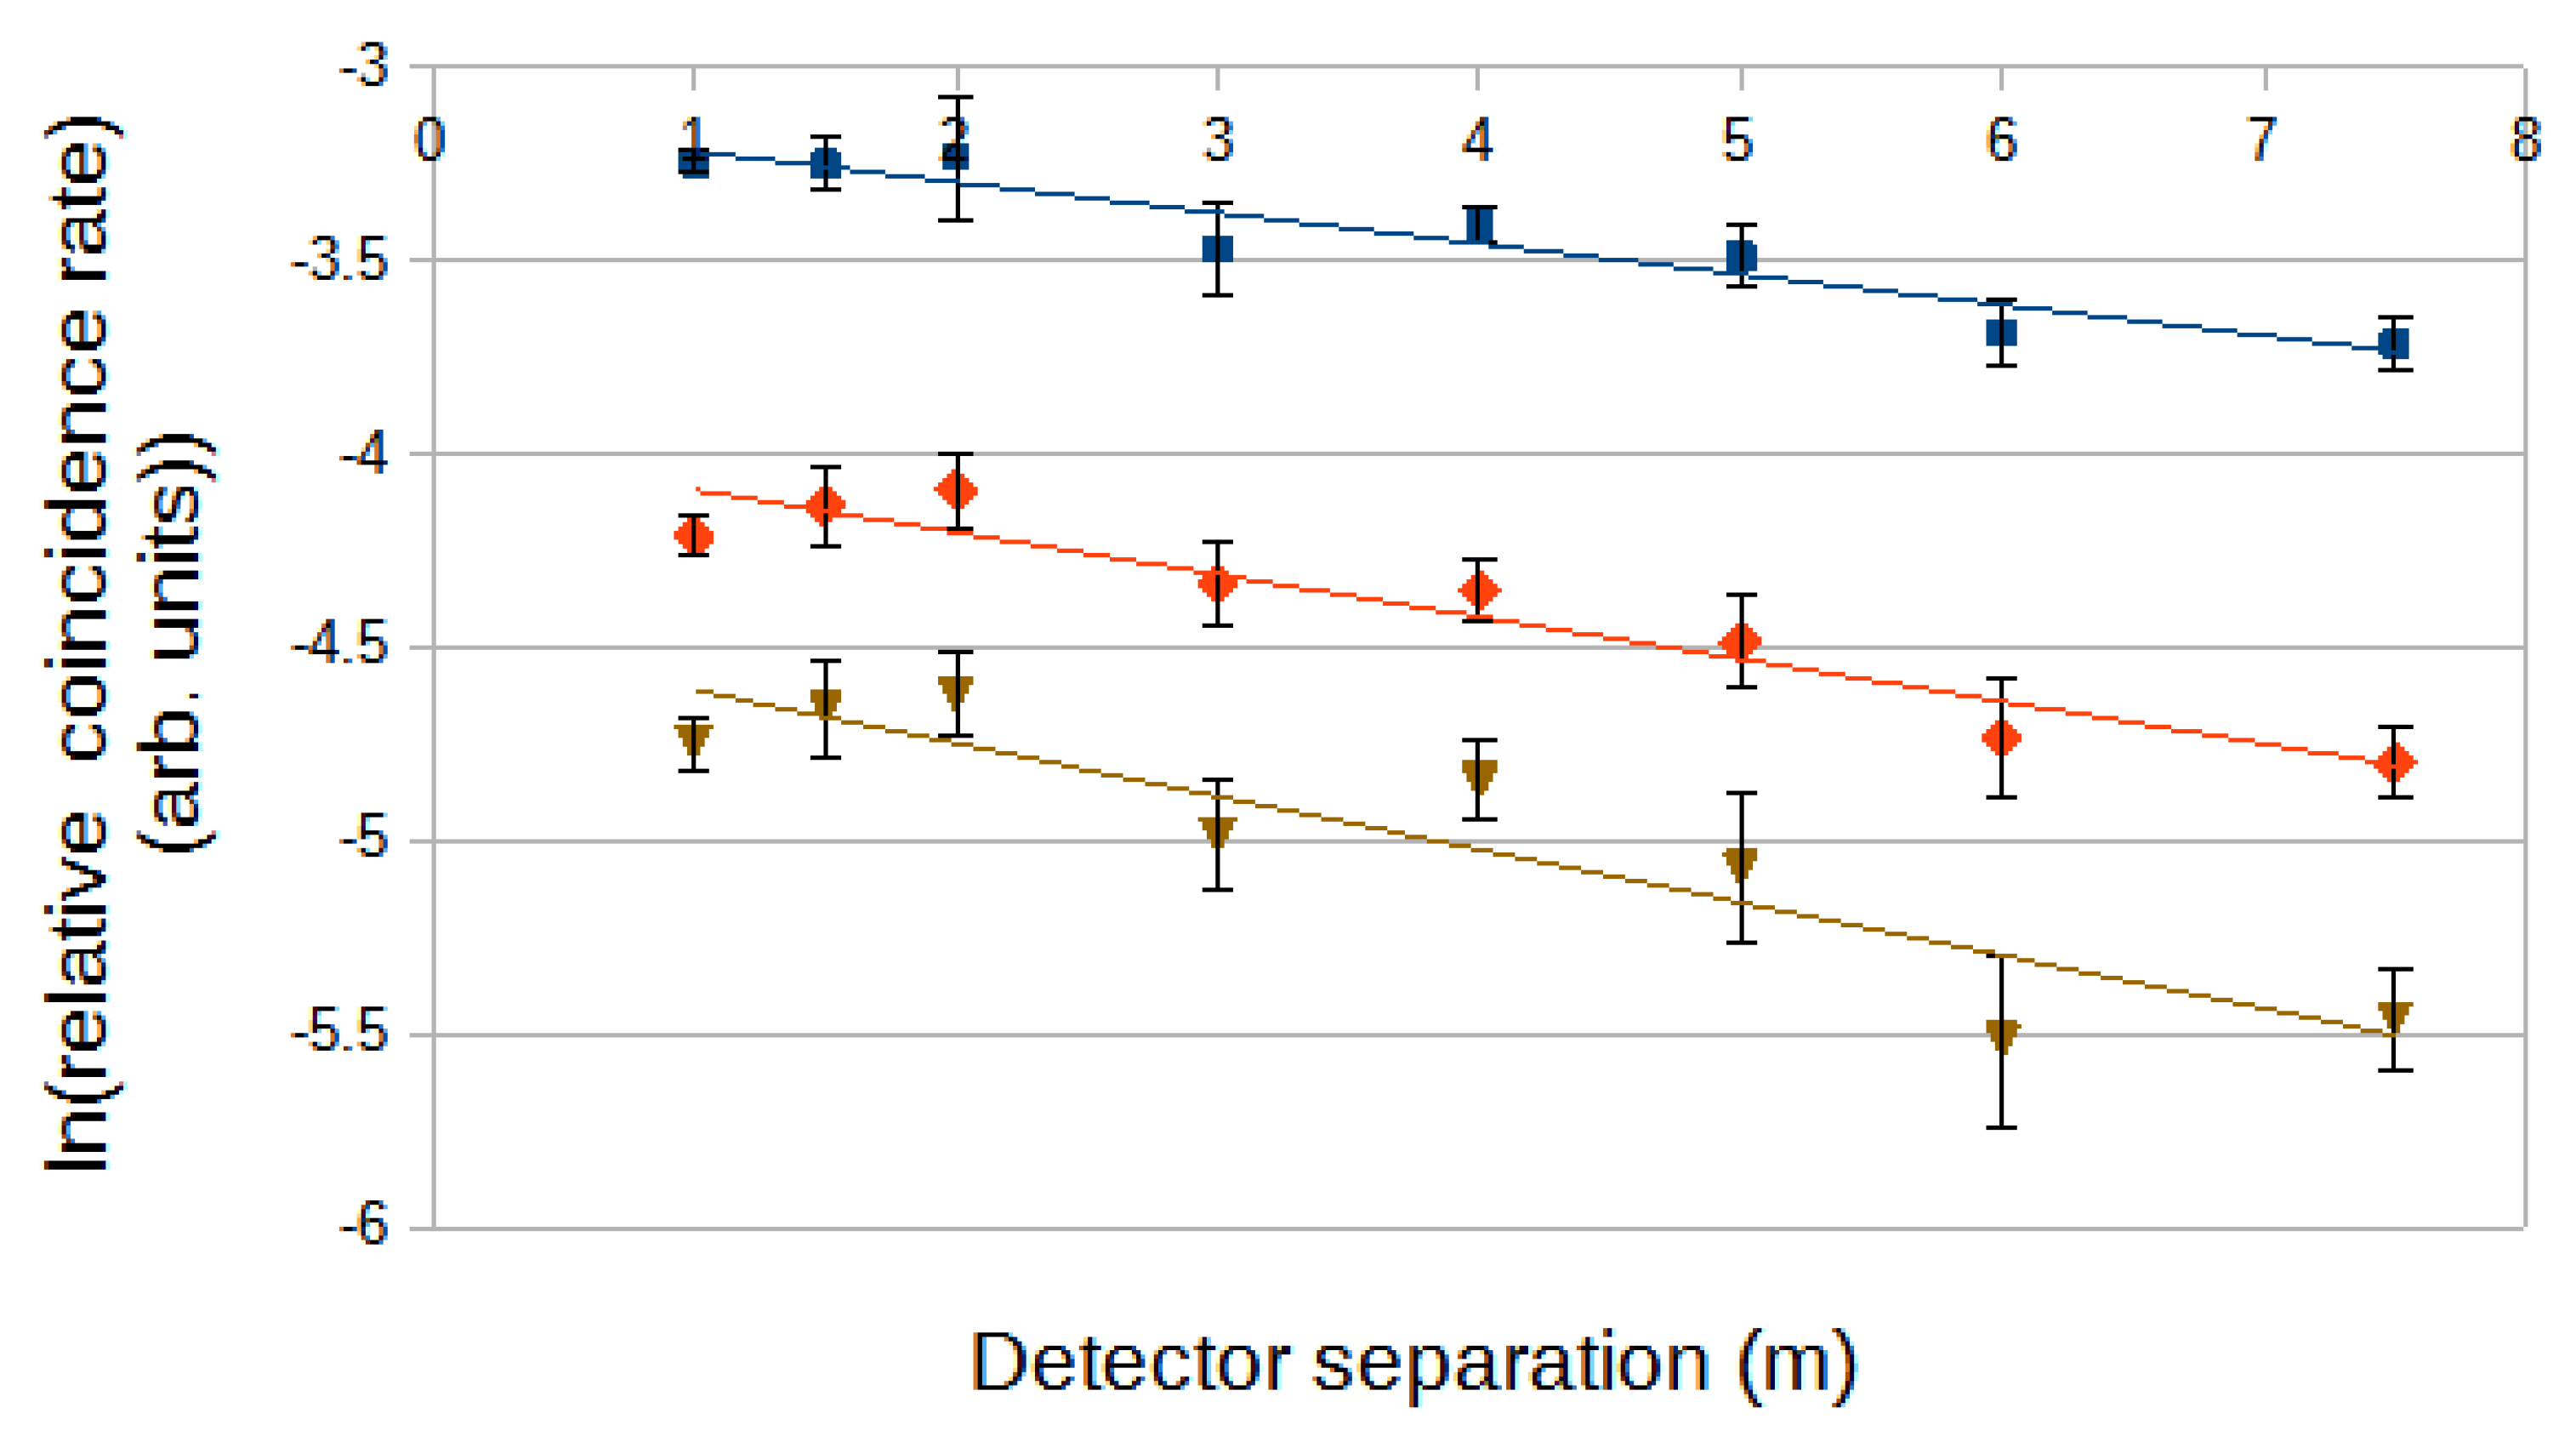
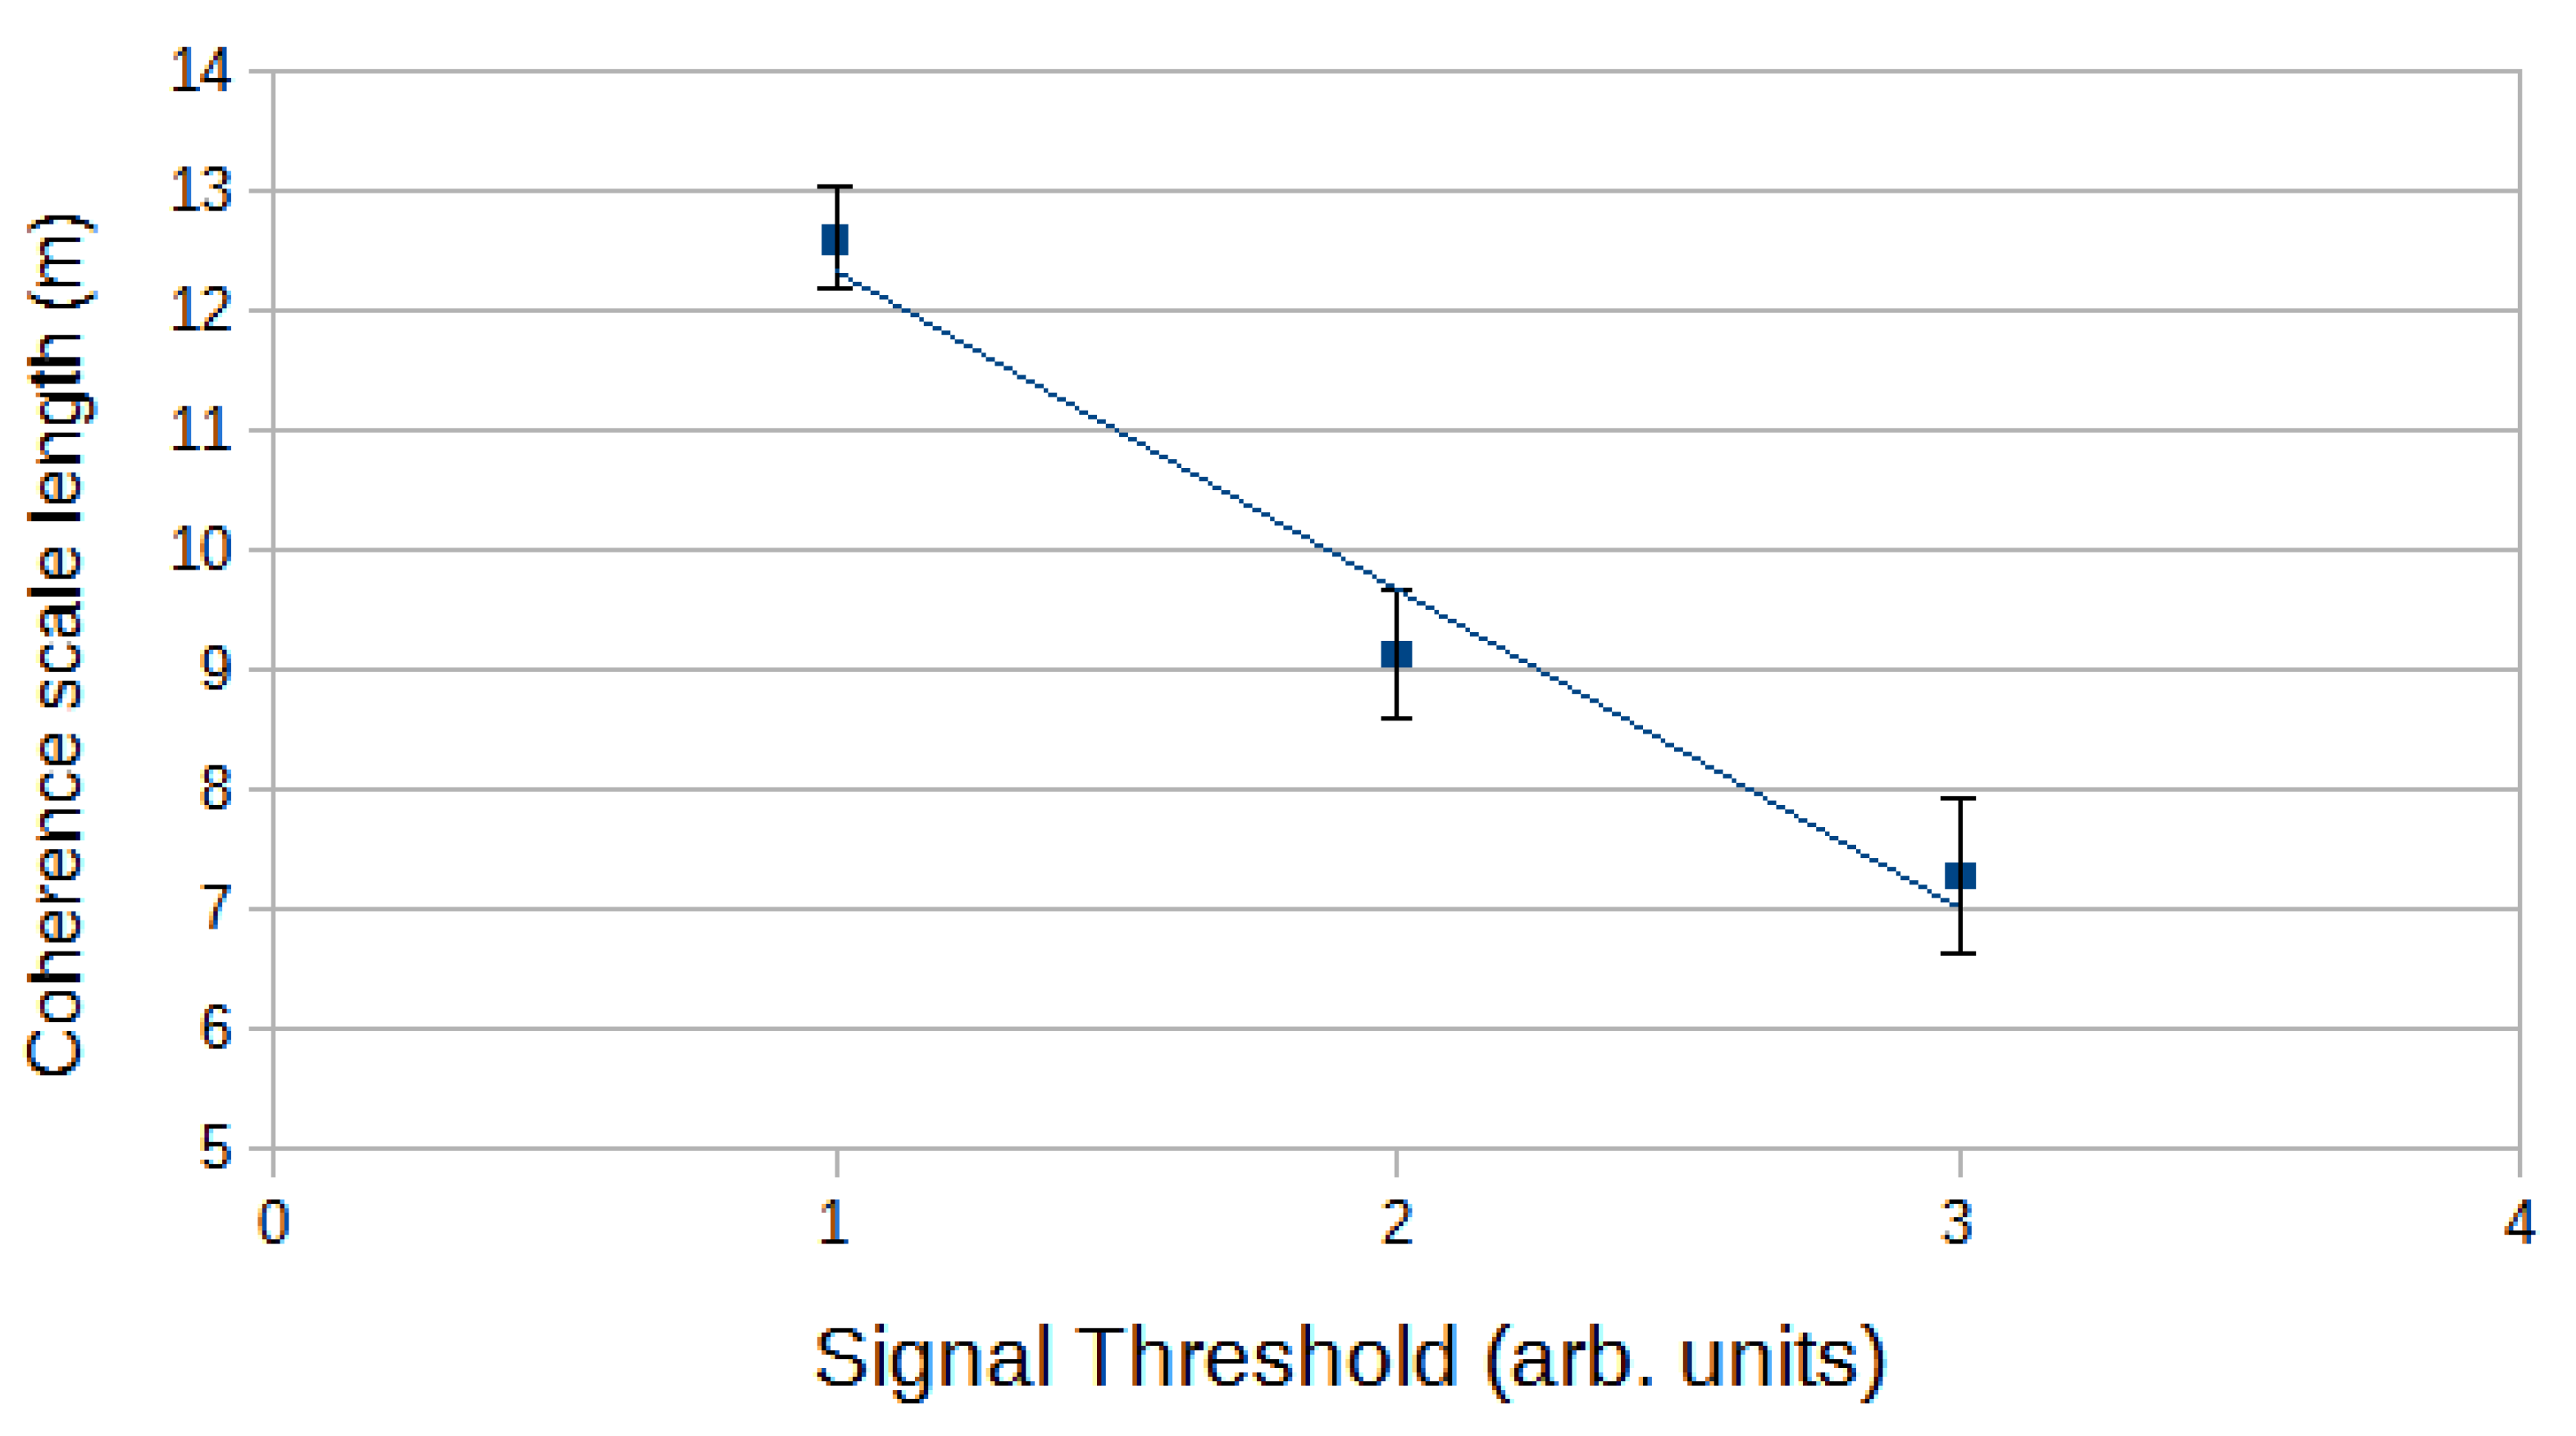
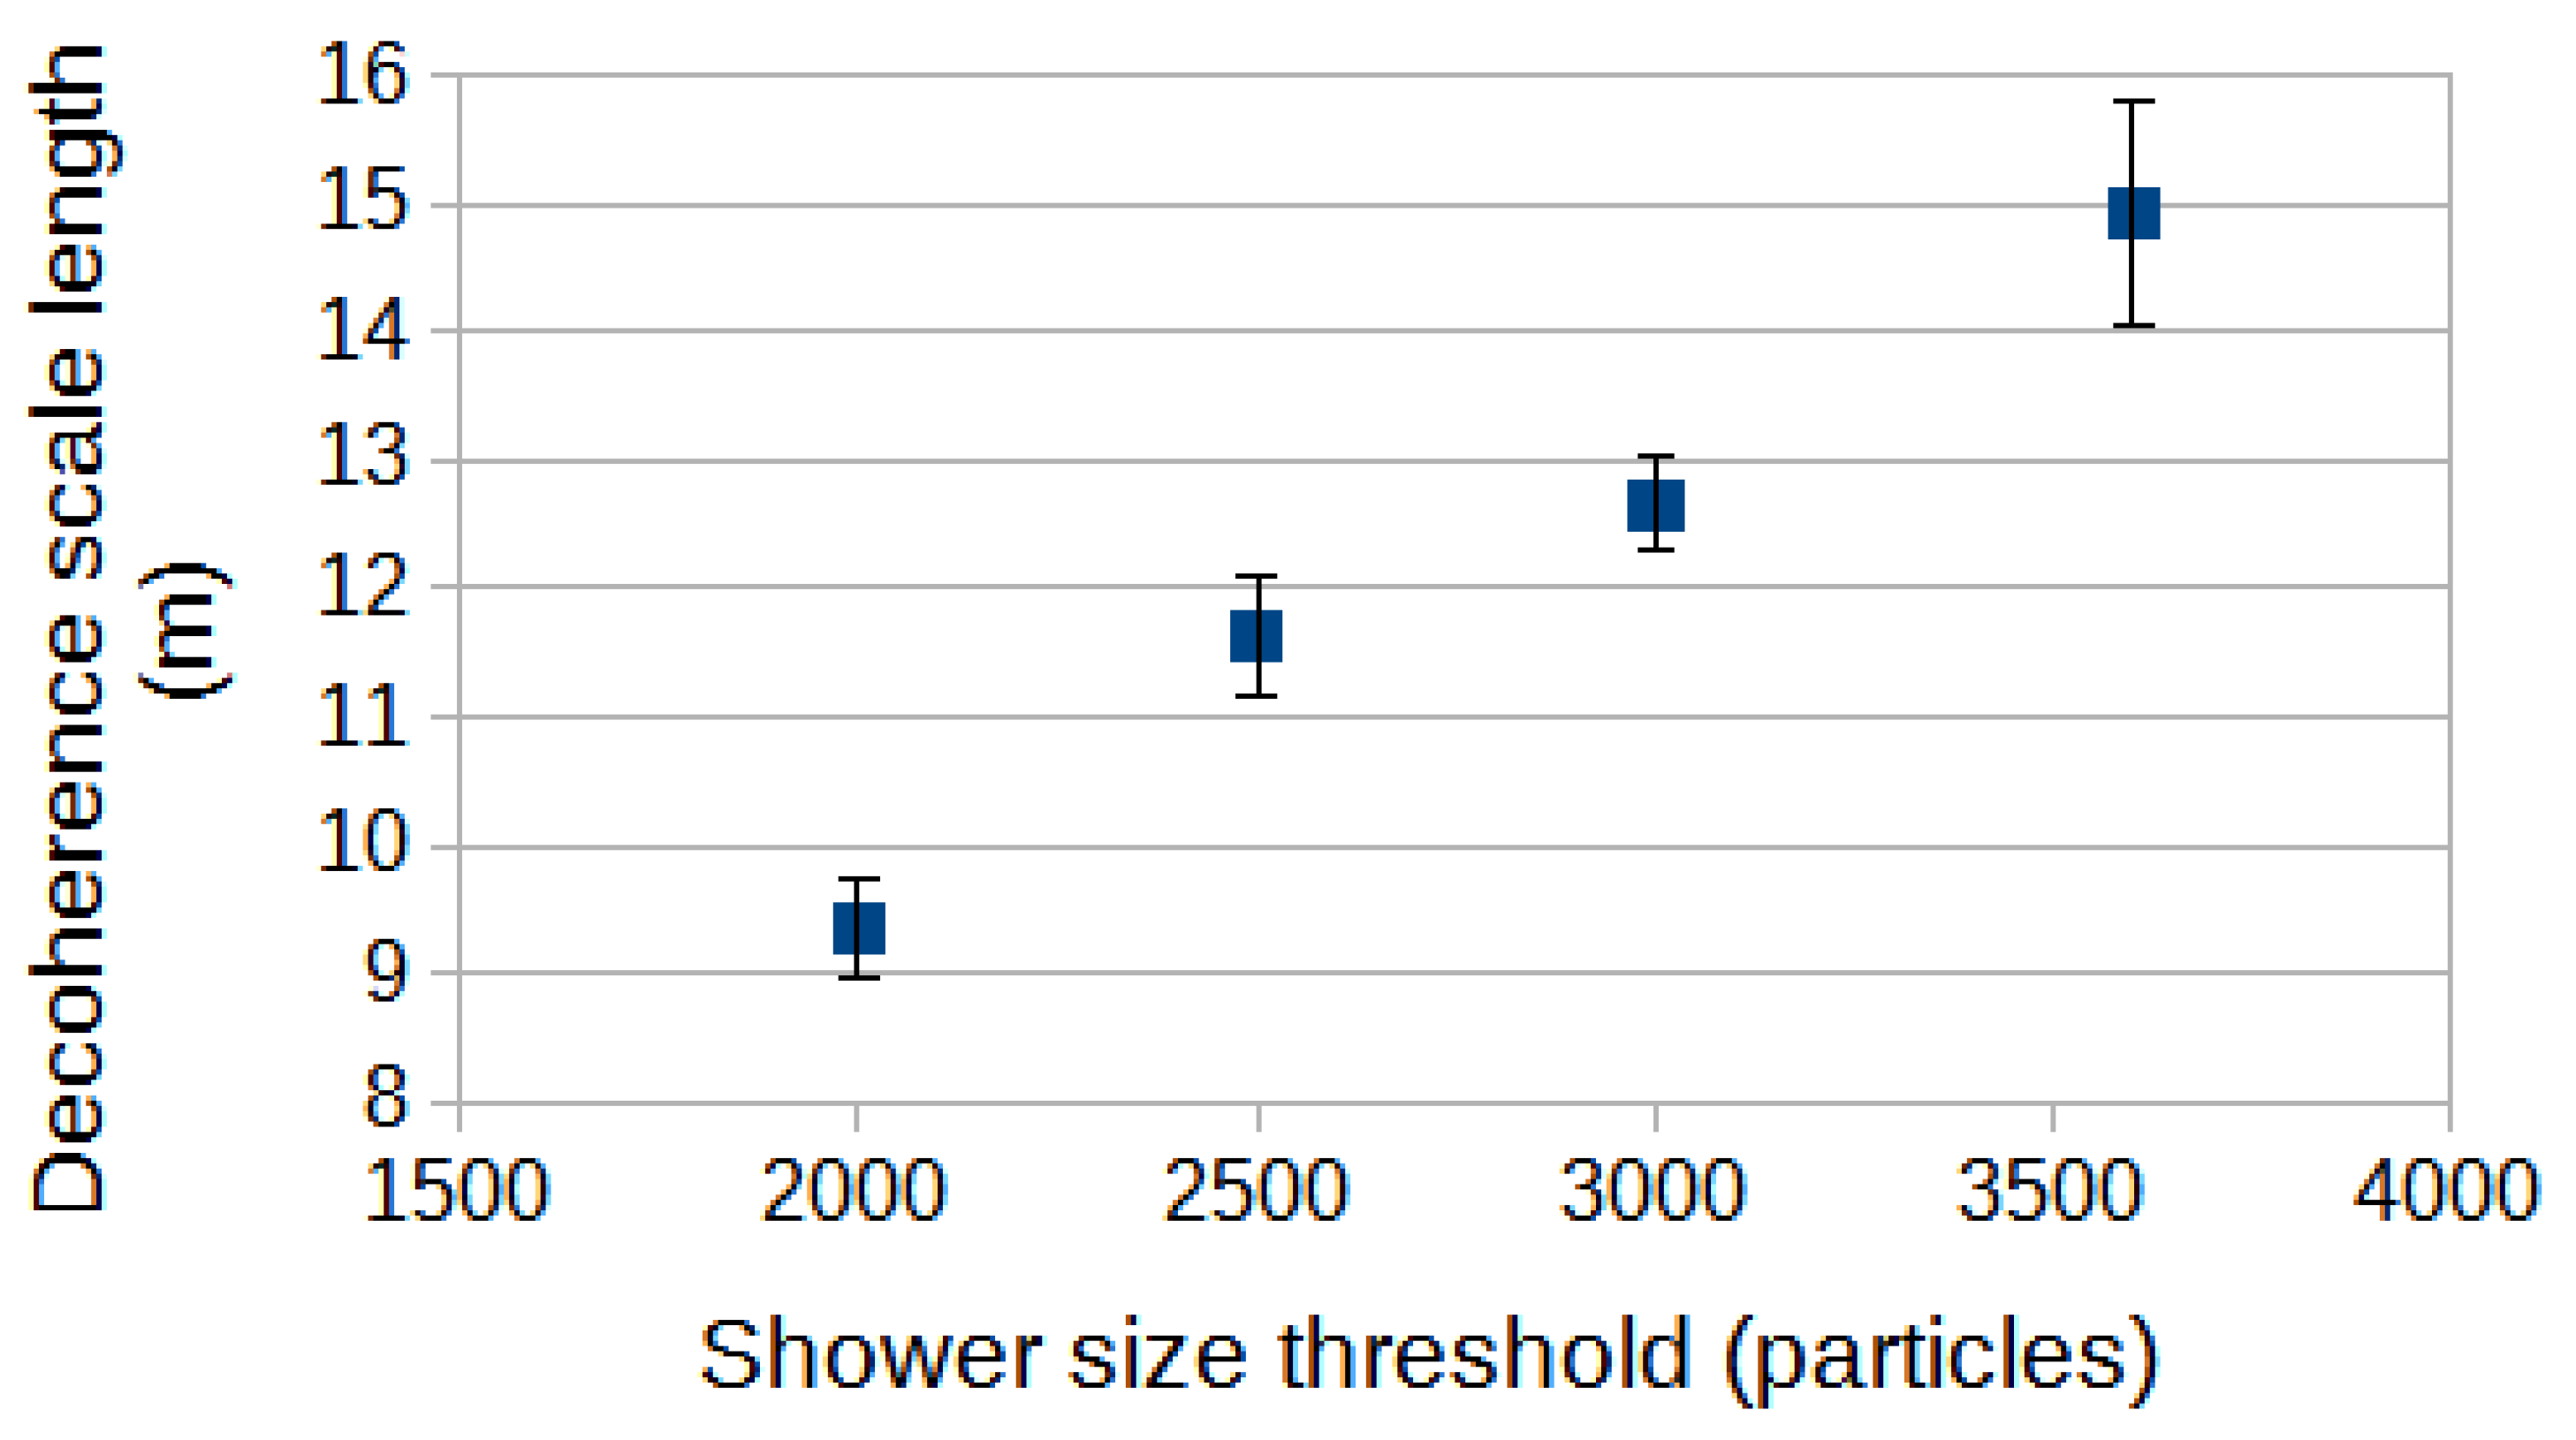
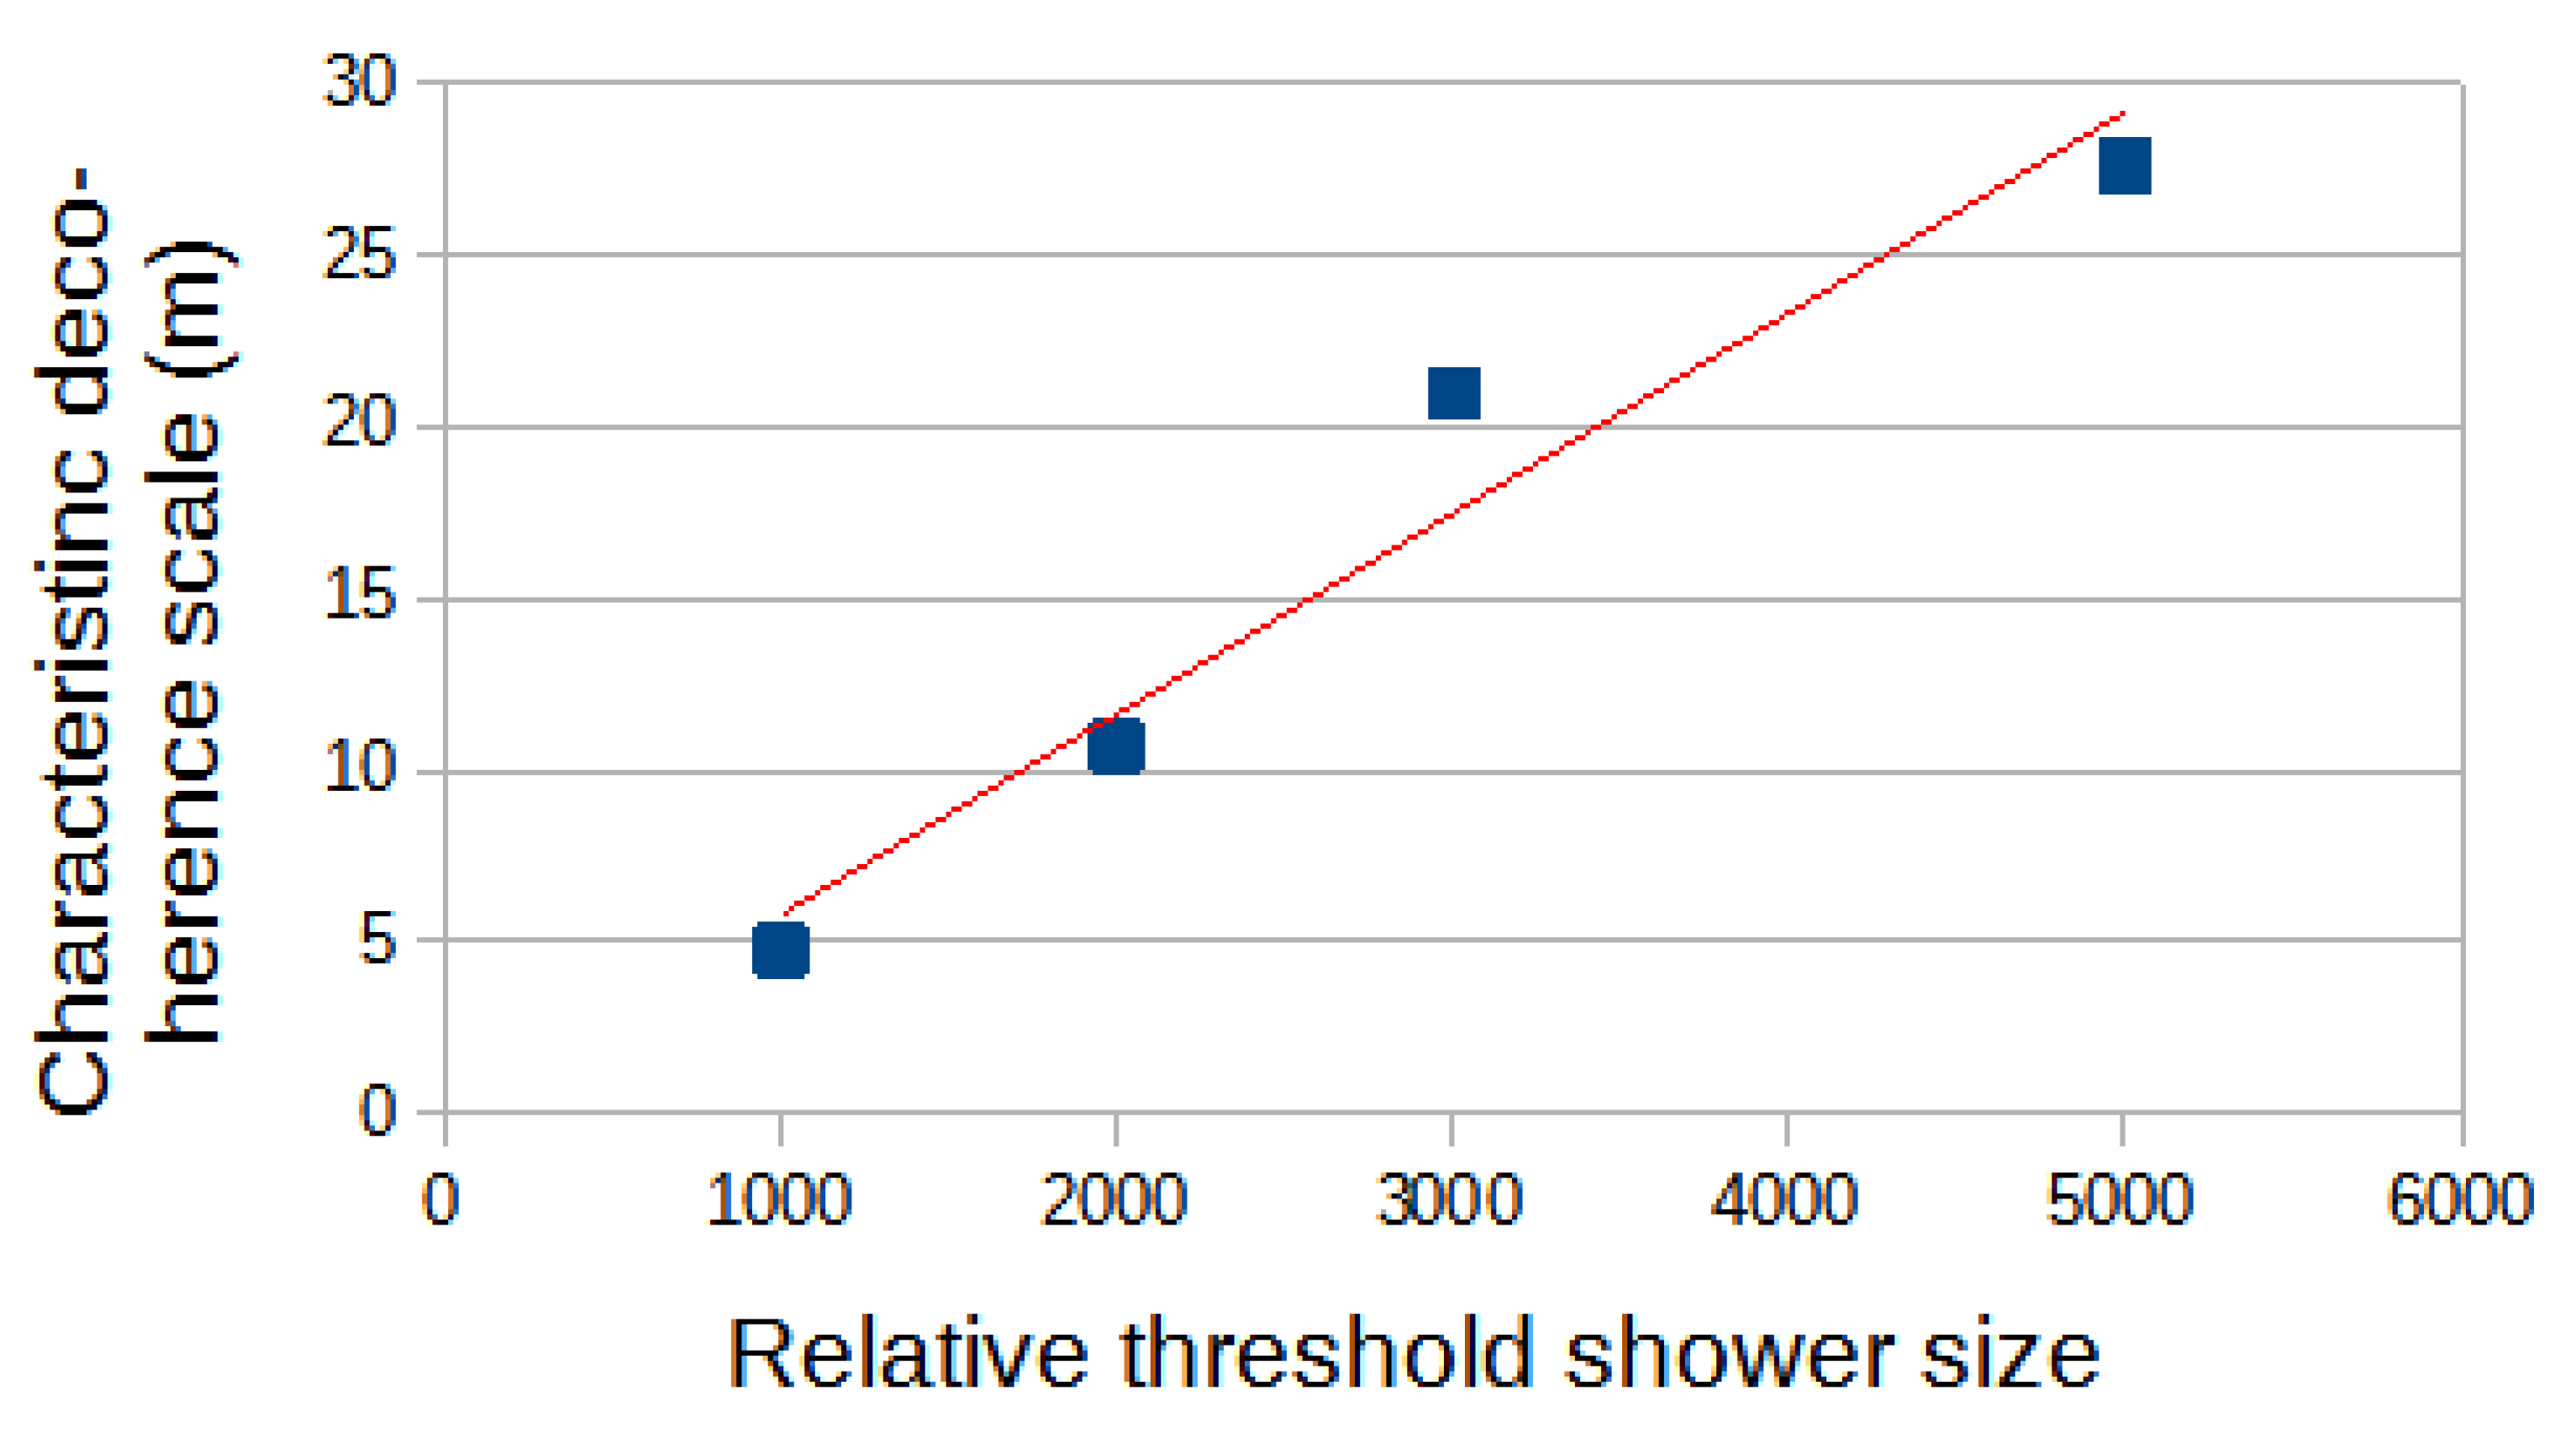
Figure 5 shows four decoherence distributions plotted in this ln-linear way, based on using array size parameter thresholds from 2000 to 3600. The distributions are adequately described by straight lines. Naturally, the event rate reduces with an increasing shower size threshold but, also, the slopes of the distributions change progressively. The characteristic scale of the exponential (a separation in metres) increases with increasing shower size parameter threshold. This scale is shown in
Figure 6 as a function of the shower size threshold. It appears that, as the shower size increases, so does the characteristic scale of the two detector decoherence. When larger array shower sizes are demanded, since the two detectors have fixed particle thresholds, this will be associated with the possibility of coincidences being found at progressively greater core distances. A fixed particle density is, naturally, found at larger core distances for larger showers.
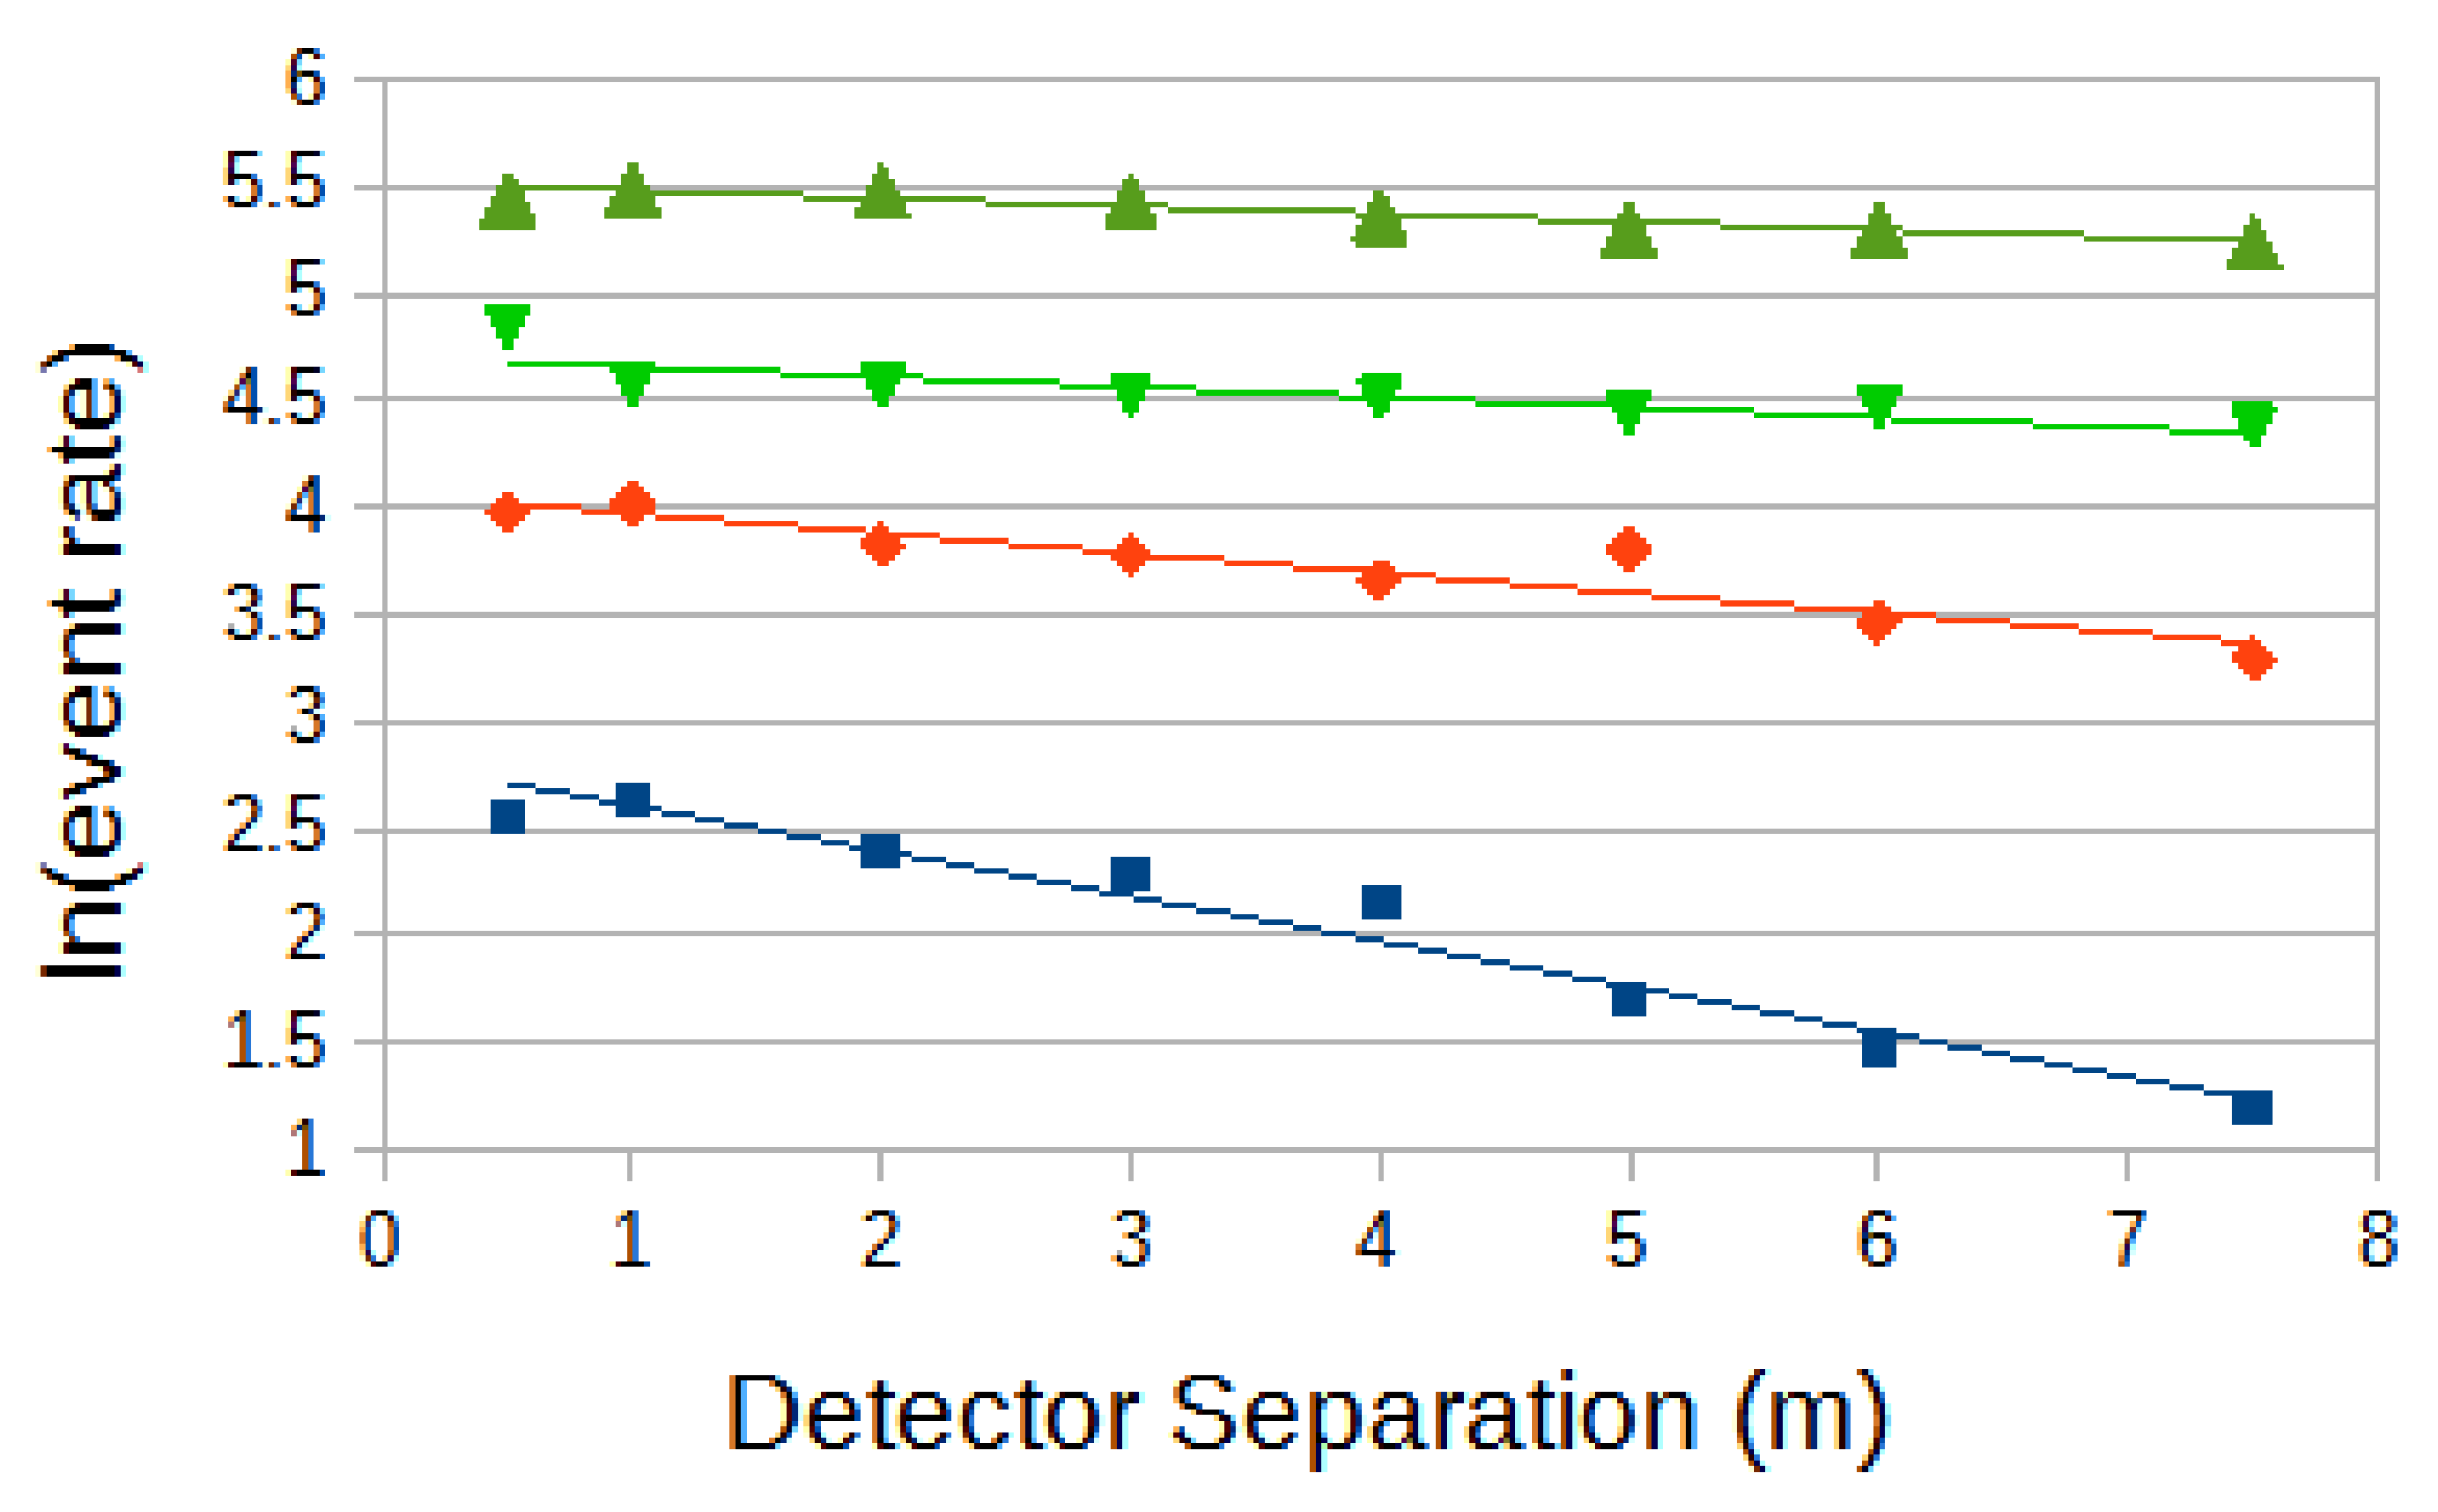
If one takes Roof Array triggers and sets (identical) thresholds for the two decoherence detectors, one can examine how the decoherence scale length varies with a changing detector threshold. In this case, when the detector thresholds are raised for a given set of Roof Array events, triggering is now successful on progressively smaller core distances (where the particle densities are higher). The result is that the decoherence scale lengths decrease now as the mean core distances decrease.
Figure 7.
Decoherence curves with detector signal thresholds approximately at levels of 1 (blue), 2 (red), 3 (brown) particles. All roof array triggers are used here, for the size distribution shown in Fig. 1.
Figure 7.
Decoherence curves with detector signal thresholds approximately at levels of 1 (blue), 2 (red), 3 (brown) particles. All roof array triggers are used here, for the size distribution shown in Fig. 1.
Figure 8.
The (exponential) scale lengths for the decoherence curves in Fig. 7 as a function of detector signal thresholds thresholds. (arbitrary units are approximately particles).
Figure 8.
The (exponential) scale lengths for the decoherence curves in Fig. 7 as a function of detector signal thresholds thresholds. (arbitrary units are approximately particles).
3.3. A simple ‘Toy’ decoherence model
A crude, simple, toy shower model is used here to assist with understanding the array decoherence data. Random shower sizes are selected from a power law distribution with a differential spectral index of -2.5, approximately that of the shower energy spectrum, and their core locations are selected randomly out to 50 m around the Roof Array geometry. It is assumed that all showers arrive vertically. The particle densities in the seven roof array detectors are determined and fluctuated based on their Poisson uncertainty. ‘Showers’ which trigger are analysed and a shower size determined which is checked to follow the input size within plausible fluctuations. These showers are then checked to determine if they would have provided coincidence pairs with two decoherence detectors located near the array centre, as in the experiment described above. This toy model is simple and crude. It assumes vertical showers and assumes a simple 1/r exp(-r/R
o) lateral distribution function (R
o is assumed to be 60 m, a Molière radius). Clearly this latter radius is not critical for an array of dimensions only up to 19 m). The resulting modelled exponential decoherence functions are shown in
Figure 9 and
Figure 10 shows the corresponding scale length as a function of shower threshold. Given the limitations of the model, these data can be usefully compared to real data shown in
Figure 5 and
Figure 6.
3.4. An examination of the statistical correlation of signals recorded with an array trigger when two detectors are placed together.
The decoherence detectors discussed above are smaller than many detectors commonly used in air shower arrays (which are typically at least 1 m2 in area). As an aid to understanding the statistical properties of measurements with such larger detectors when operated within air shower arrays, one can ask about the nature of the correlation in particle densities when smaller detector are placed together, thus with a combination making up a larger ‘detector’ (in our case, array triggered decoherence detectors at a spacing between centres of 0.5 m). We accomplish this by measuring particle numbers in the two co-located detectors and comparing their measured numbers of particles when the detector signals (densities) are recorded in coincidence with showers of increasing size ((total particles) or energy).
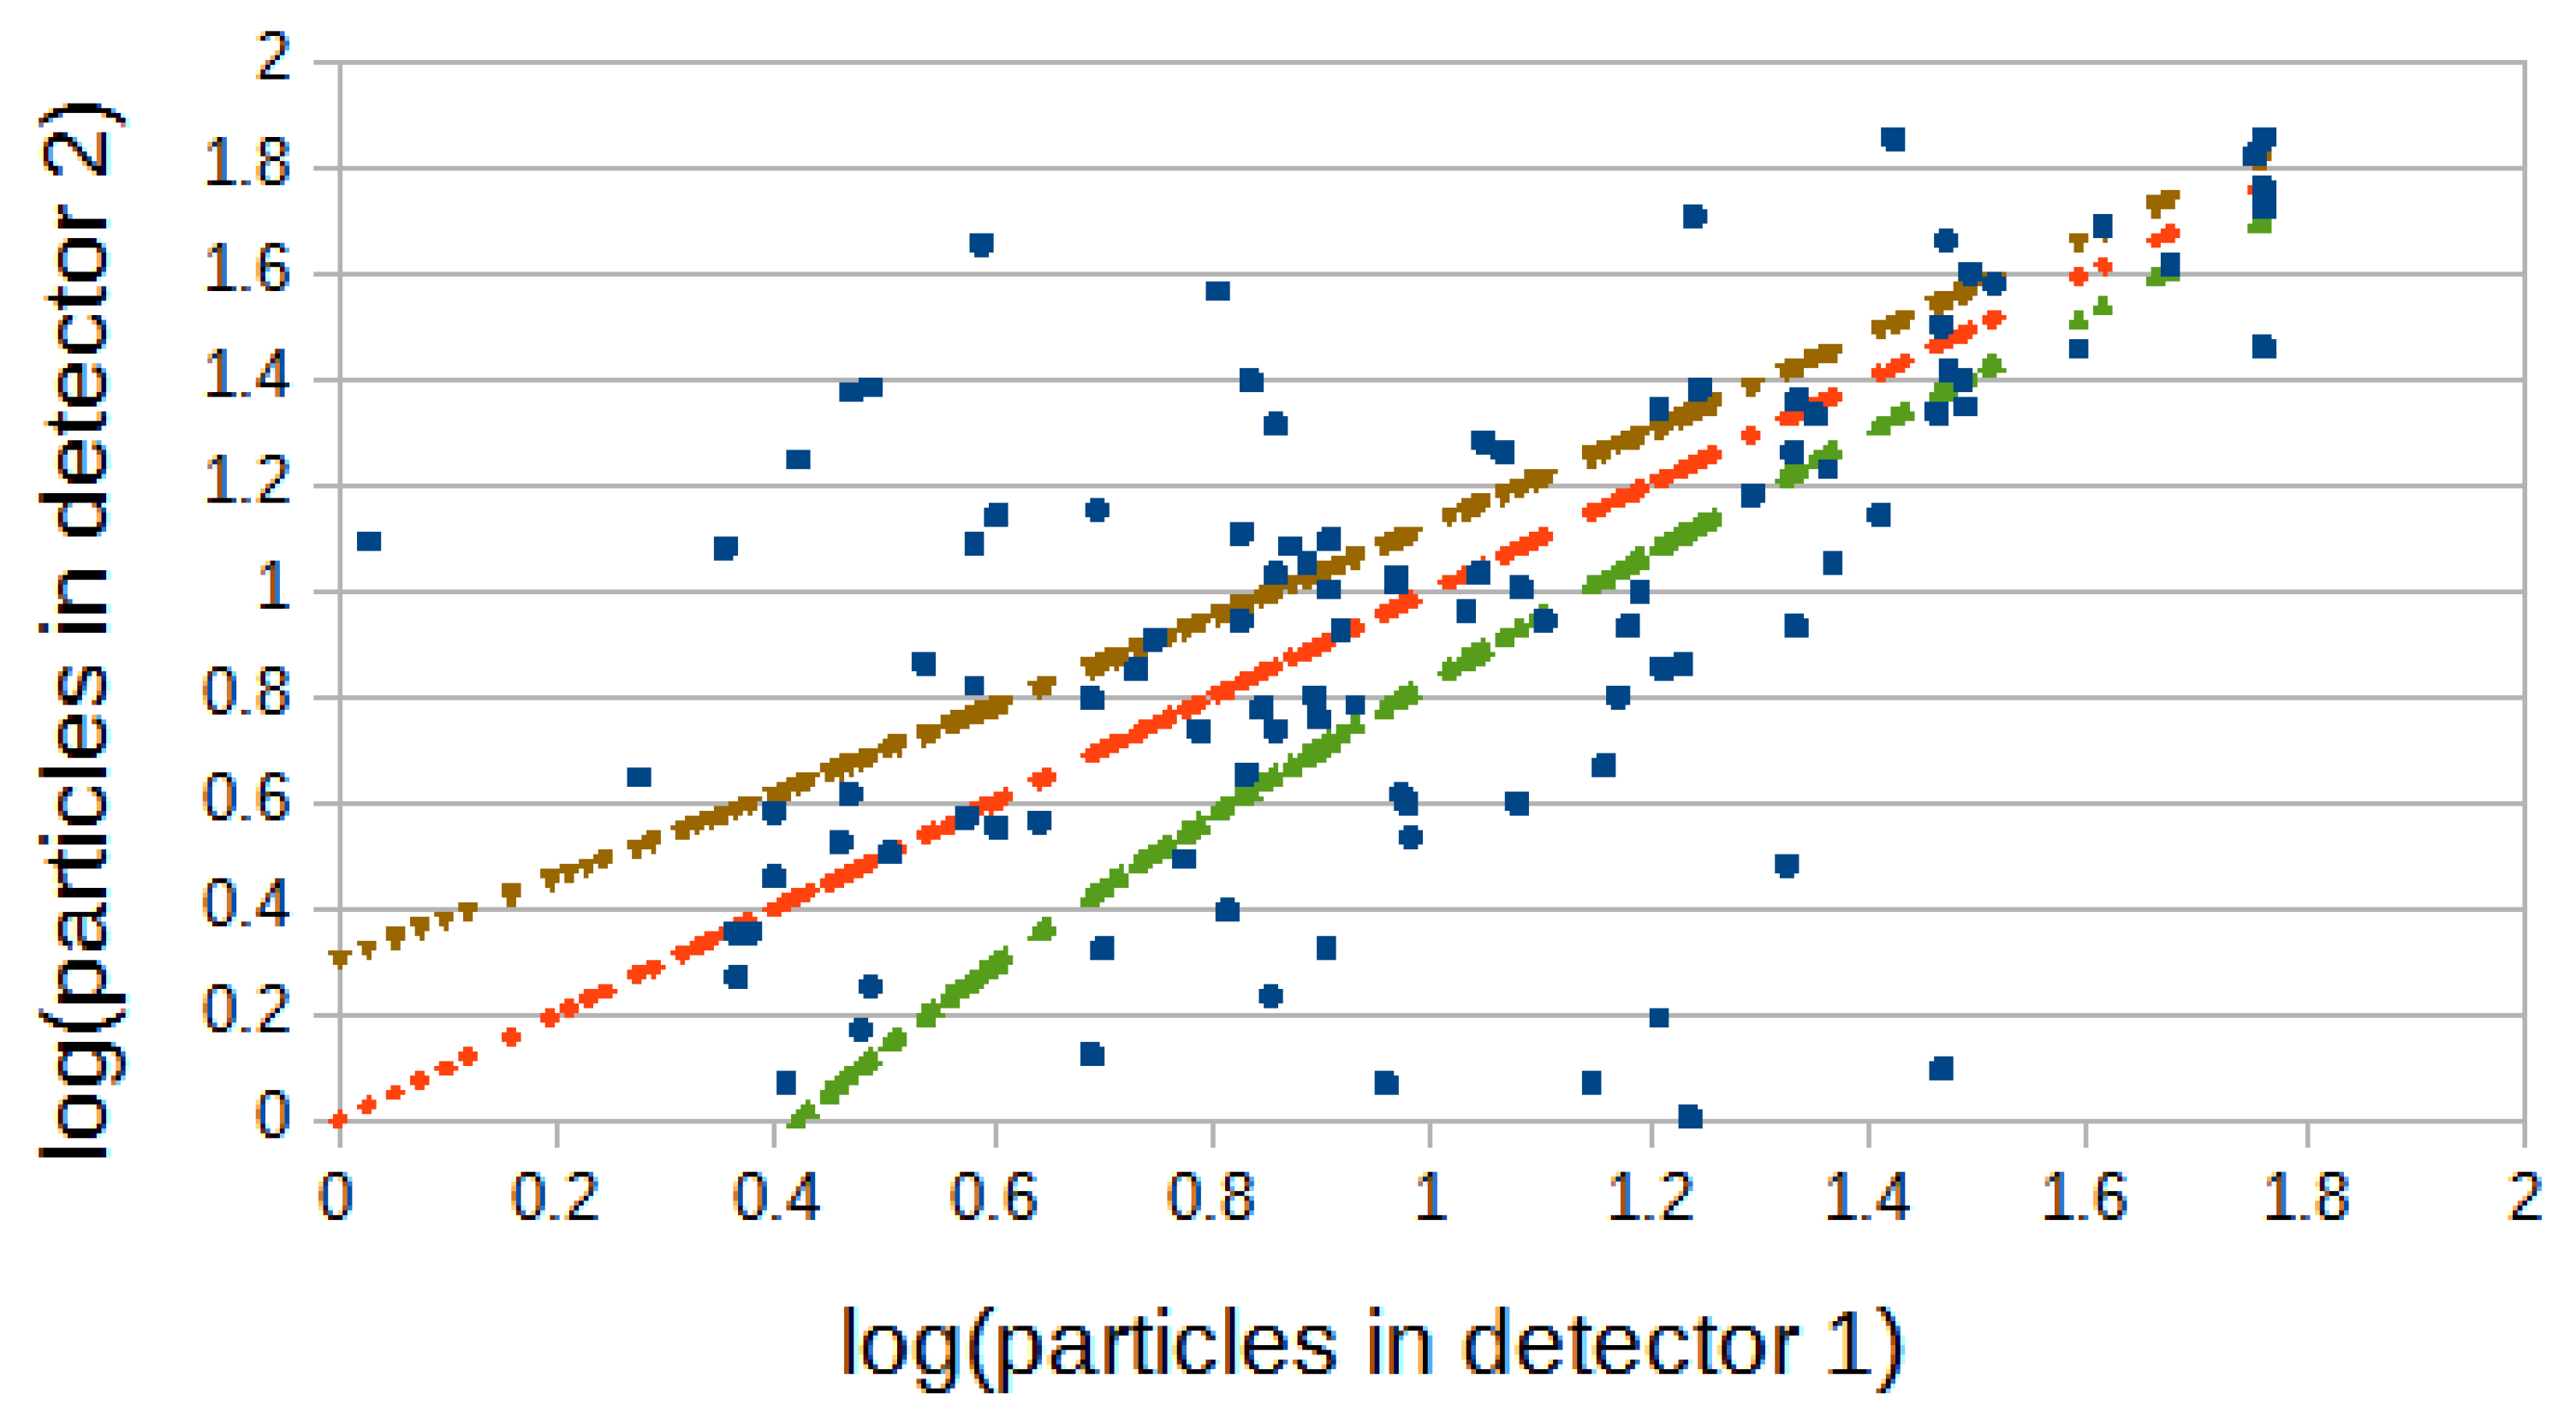
Figure 11 shows the relationship between the signals in two detectors located together when all array triggers are accepted and both detectors have non-zero particle densities. The array threshold size is ~1500 particles.
The array threshold can be changed by choosing to select showers out of the total shown in
Figure 11 with shower size parameters which are progressively greater.
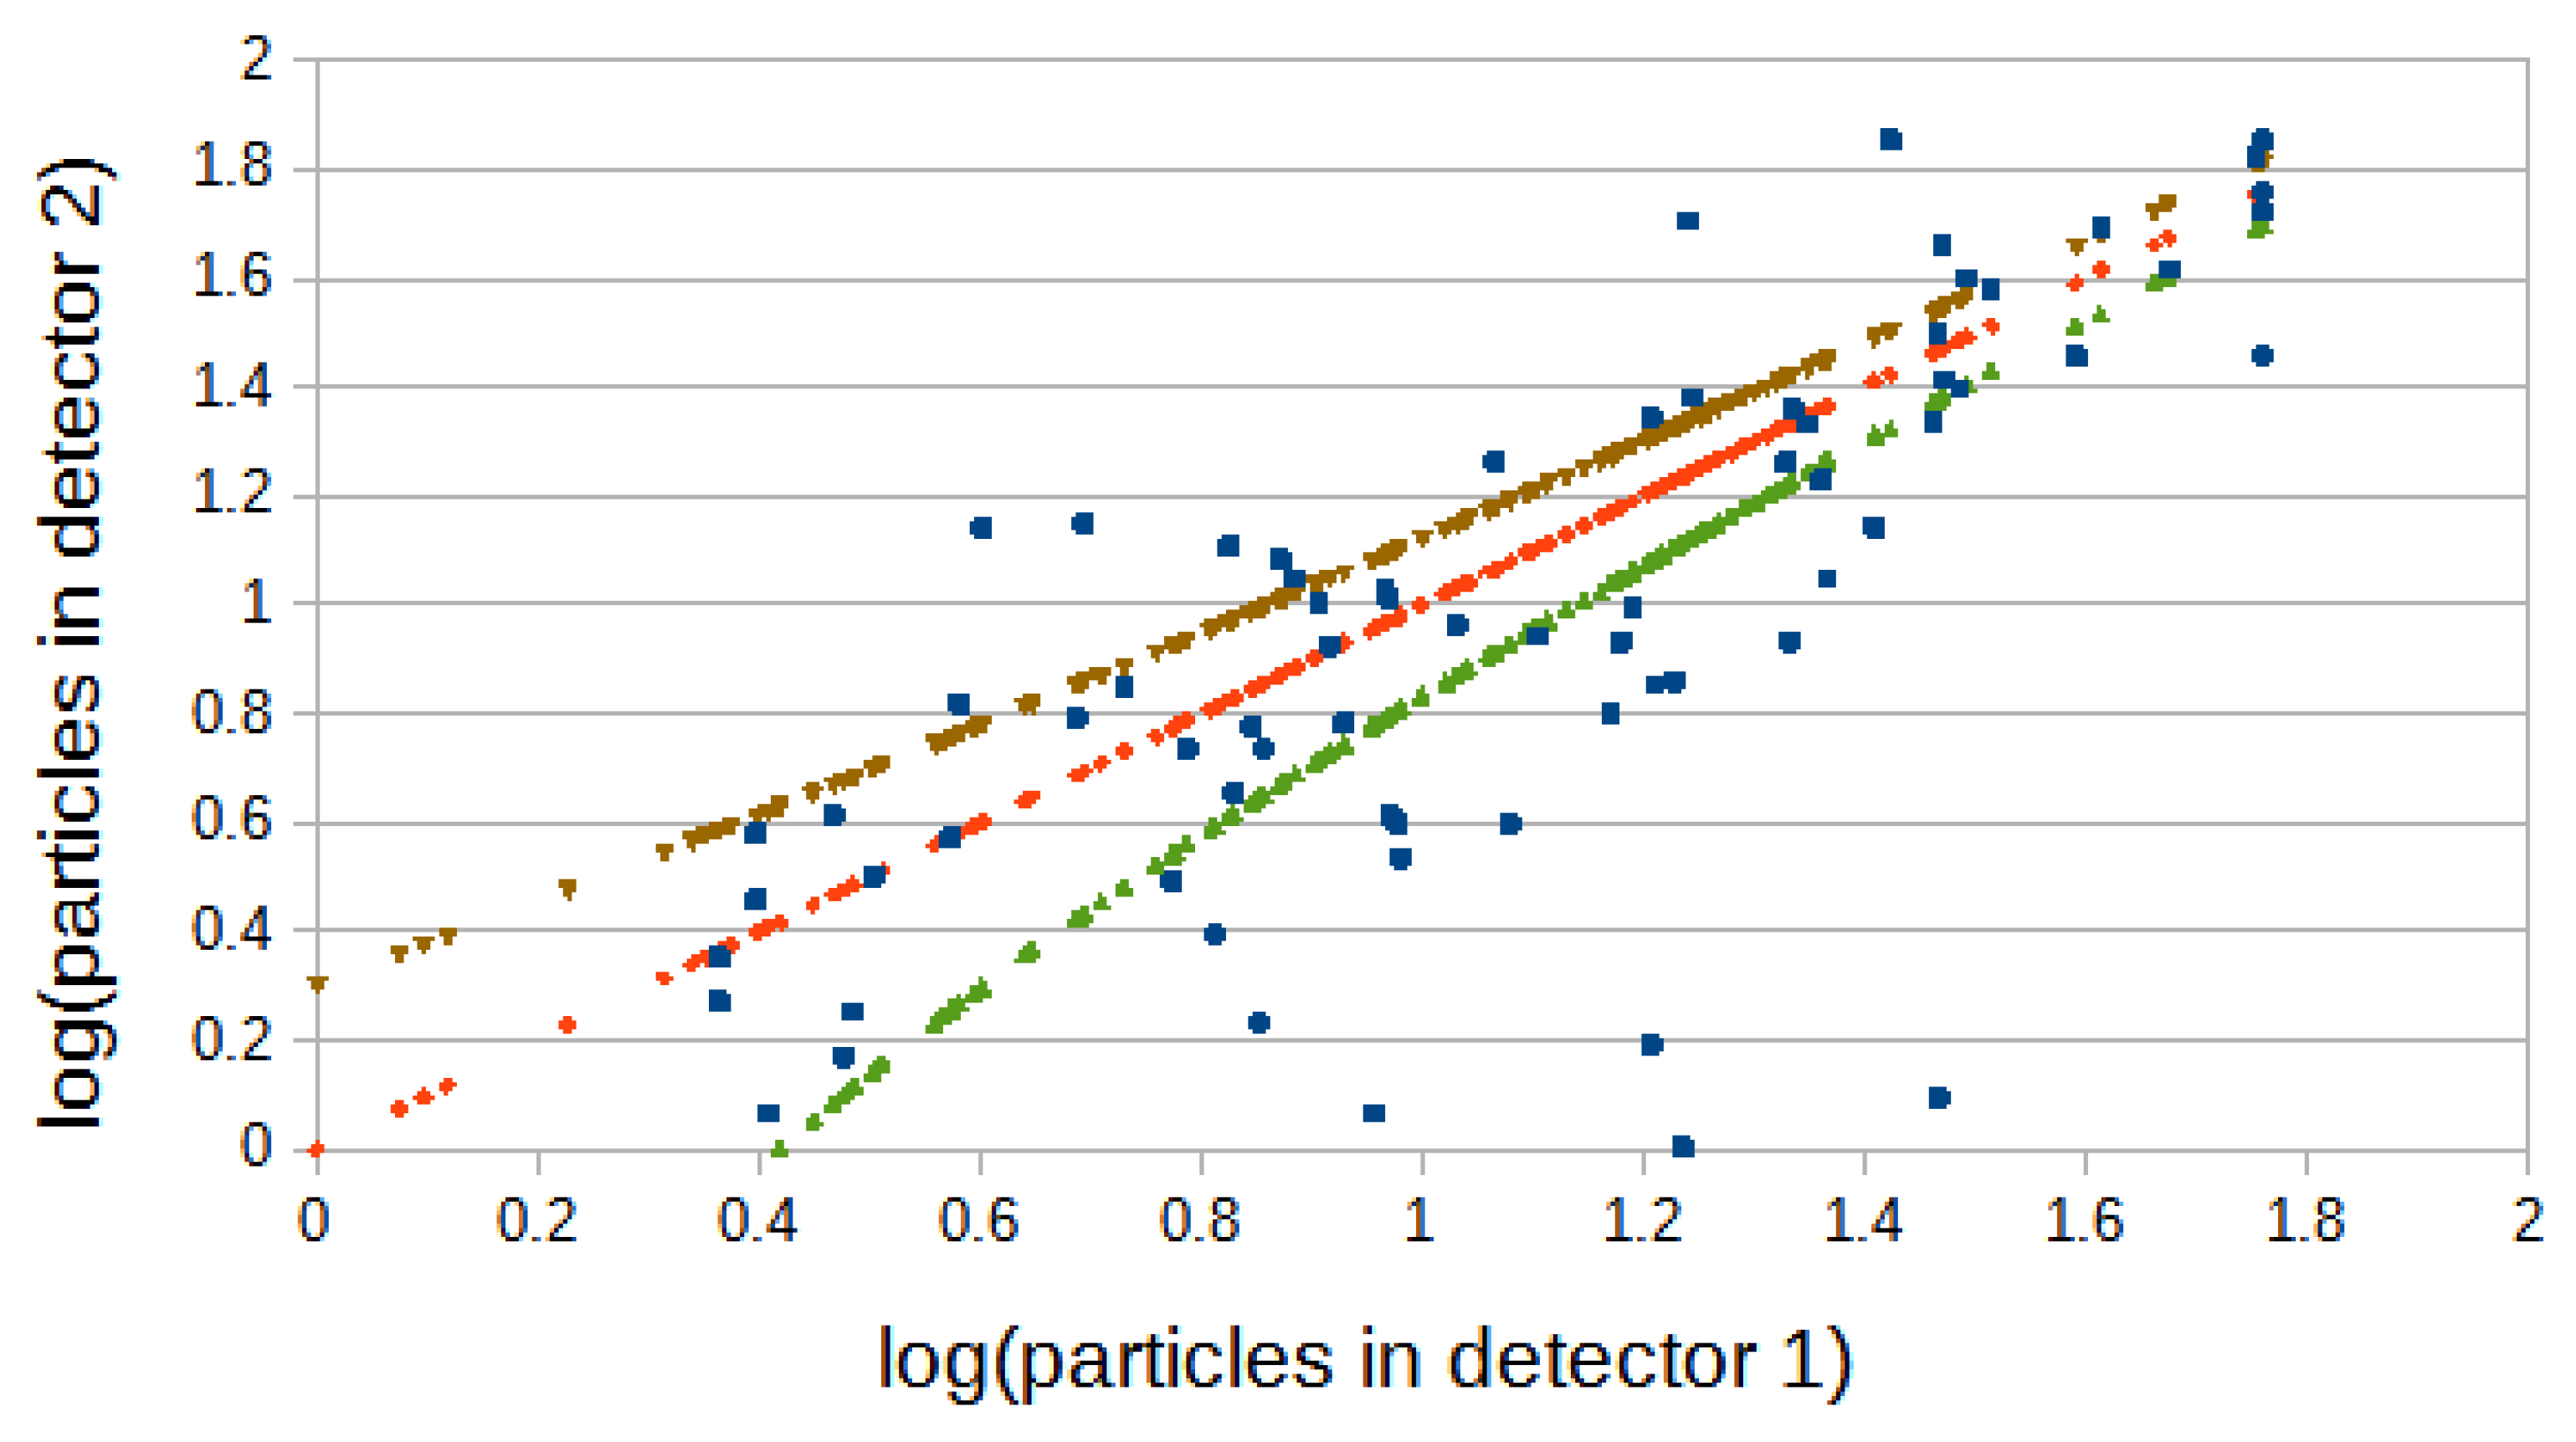
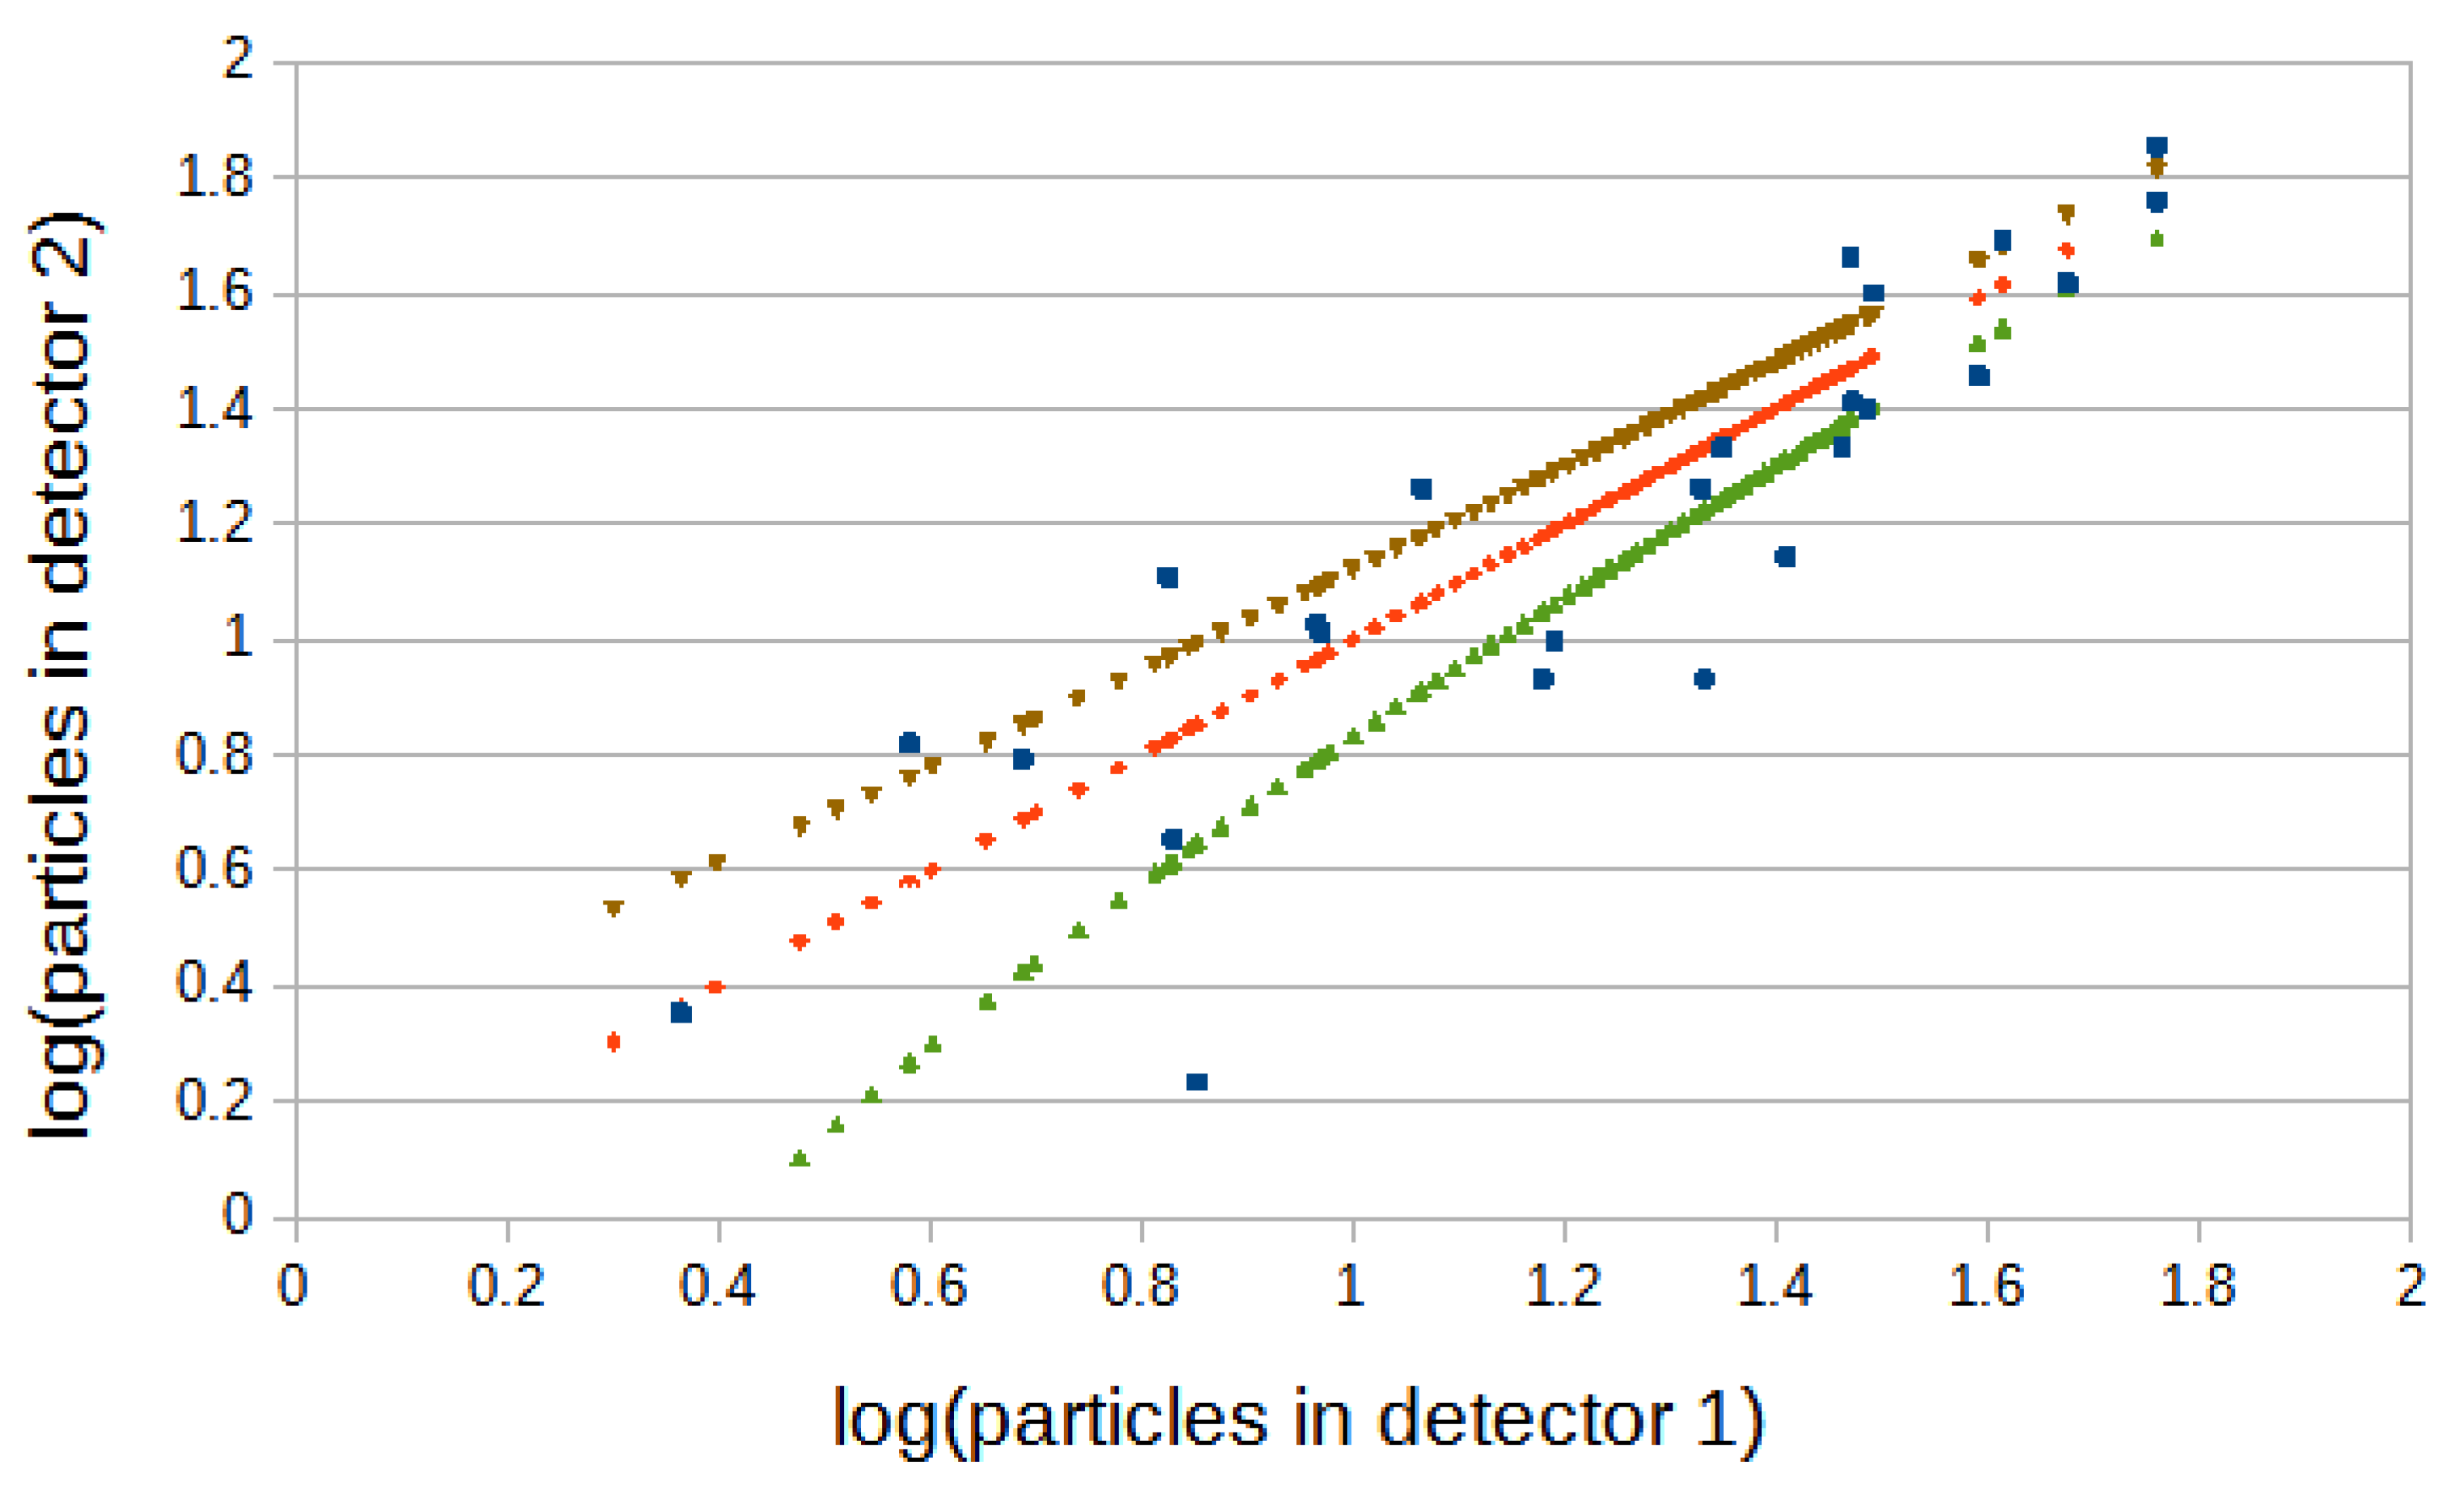
Figure 12 and
Figure 13 show how the relationships between the detector particle numbers change as shower sizes increase (4000 and 7000 particles). It is evident that the detector densities cover about the same range but, for larger shower sizes, the spread in the distribution progressively approaches that expected for Poisson statistics (plus and minus one standard deviation between the brown and green points) for the particle numbers.
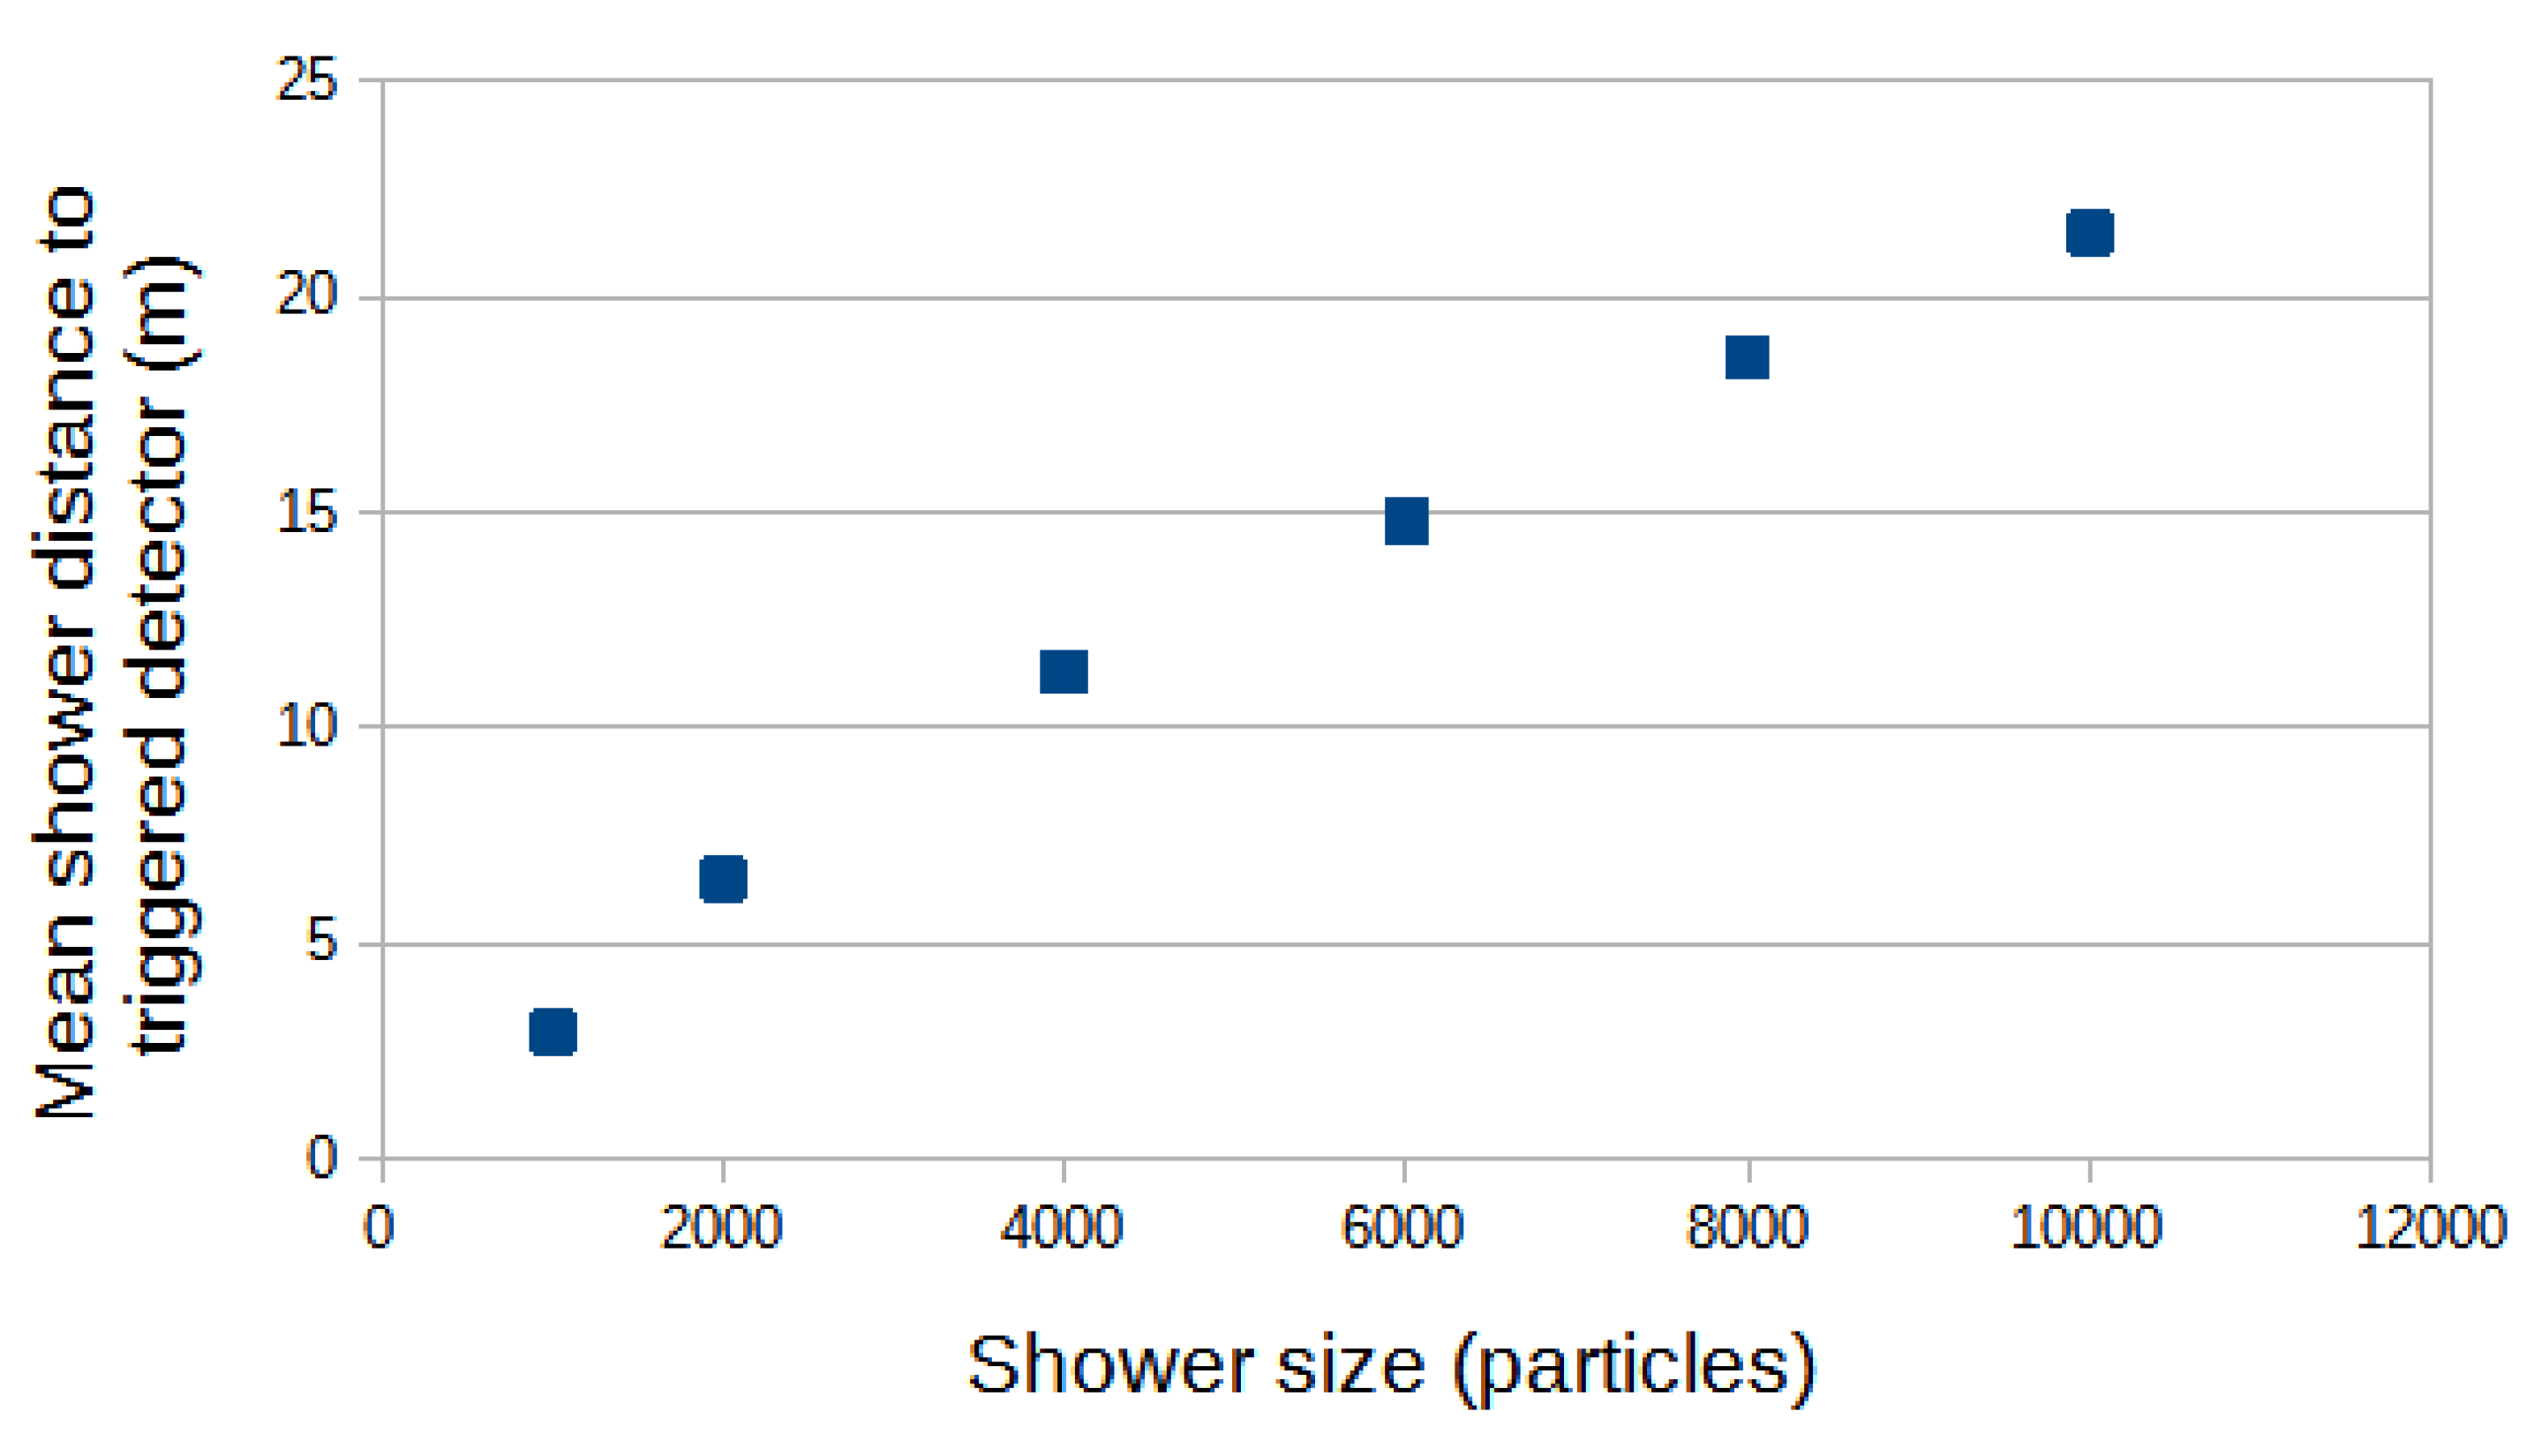
As the shower size is increased, the mean distance of the triggered detectors from the shower core increases. It appears then that for the events which require a higher shower size trigger, the density fluctuations between the detectors are associated with regions of the shower which are progressively further from the steep shower core and where the fractional variation of the lateral distribution function over the detector dimensions progressively reduces. The fluctuations are then closer to random counting fluctuations rather than including a large component due to the distribution of particle density changing with core distance.
Figure 14 illustrates the increased distance to the core as the shower size increases using the toy model described above.
3.5. Spread in the signal amplitudes as a function of detector spacing.
The spread in signal amplitudes between the two (non-zero signal) detectors varies when their separation is now changed from the previous arrangement when they were co-located.
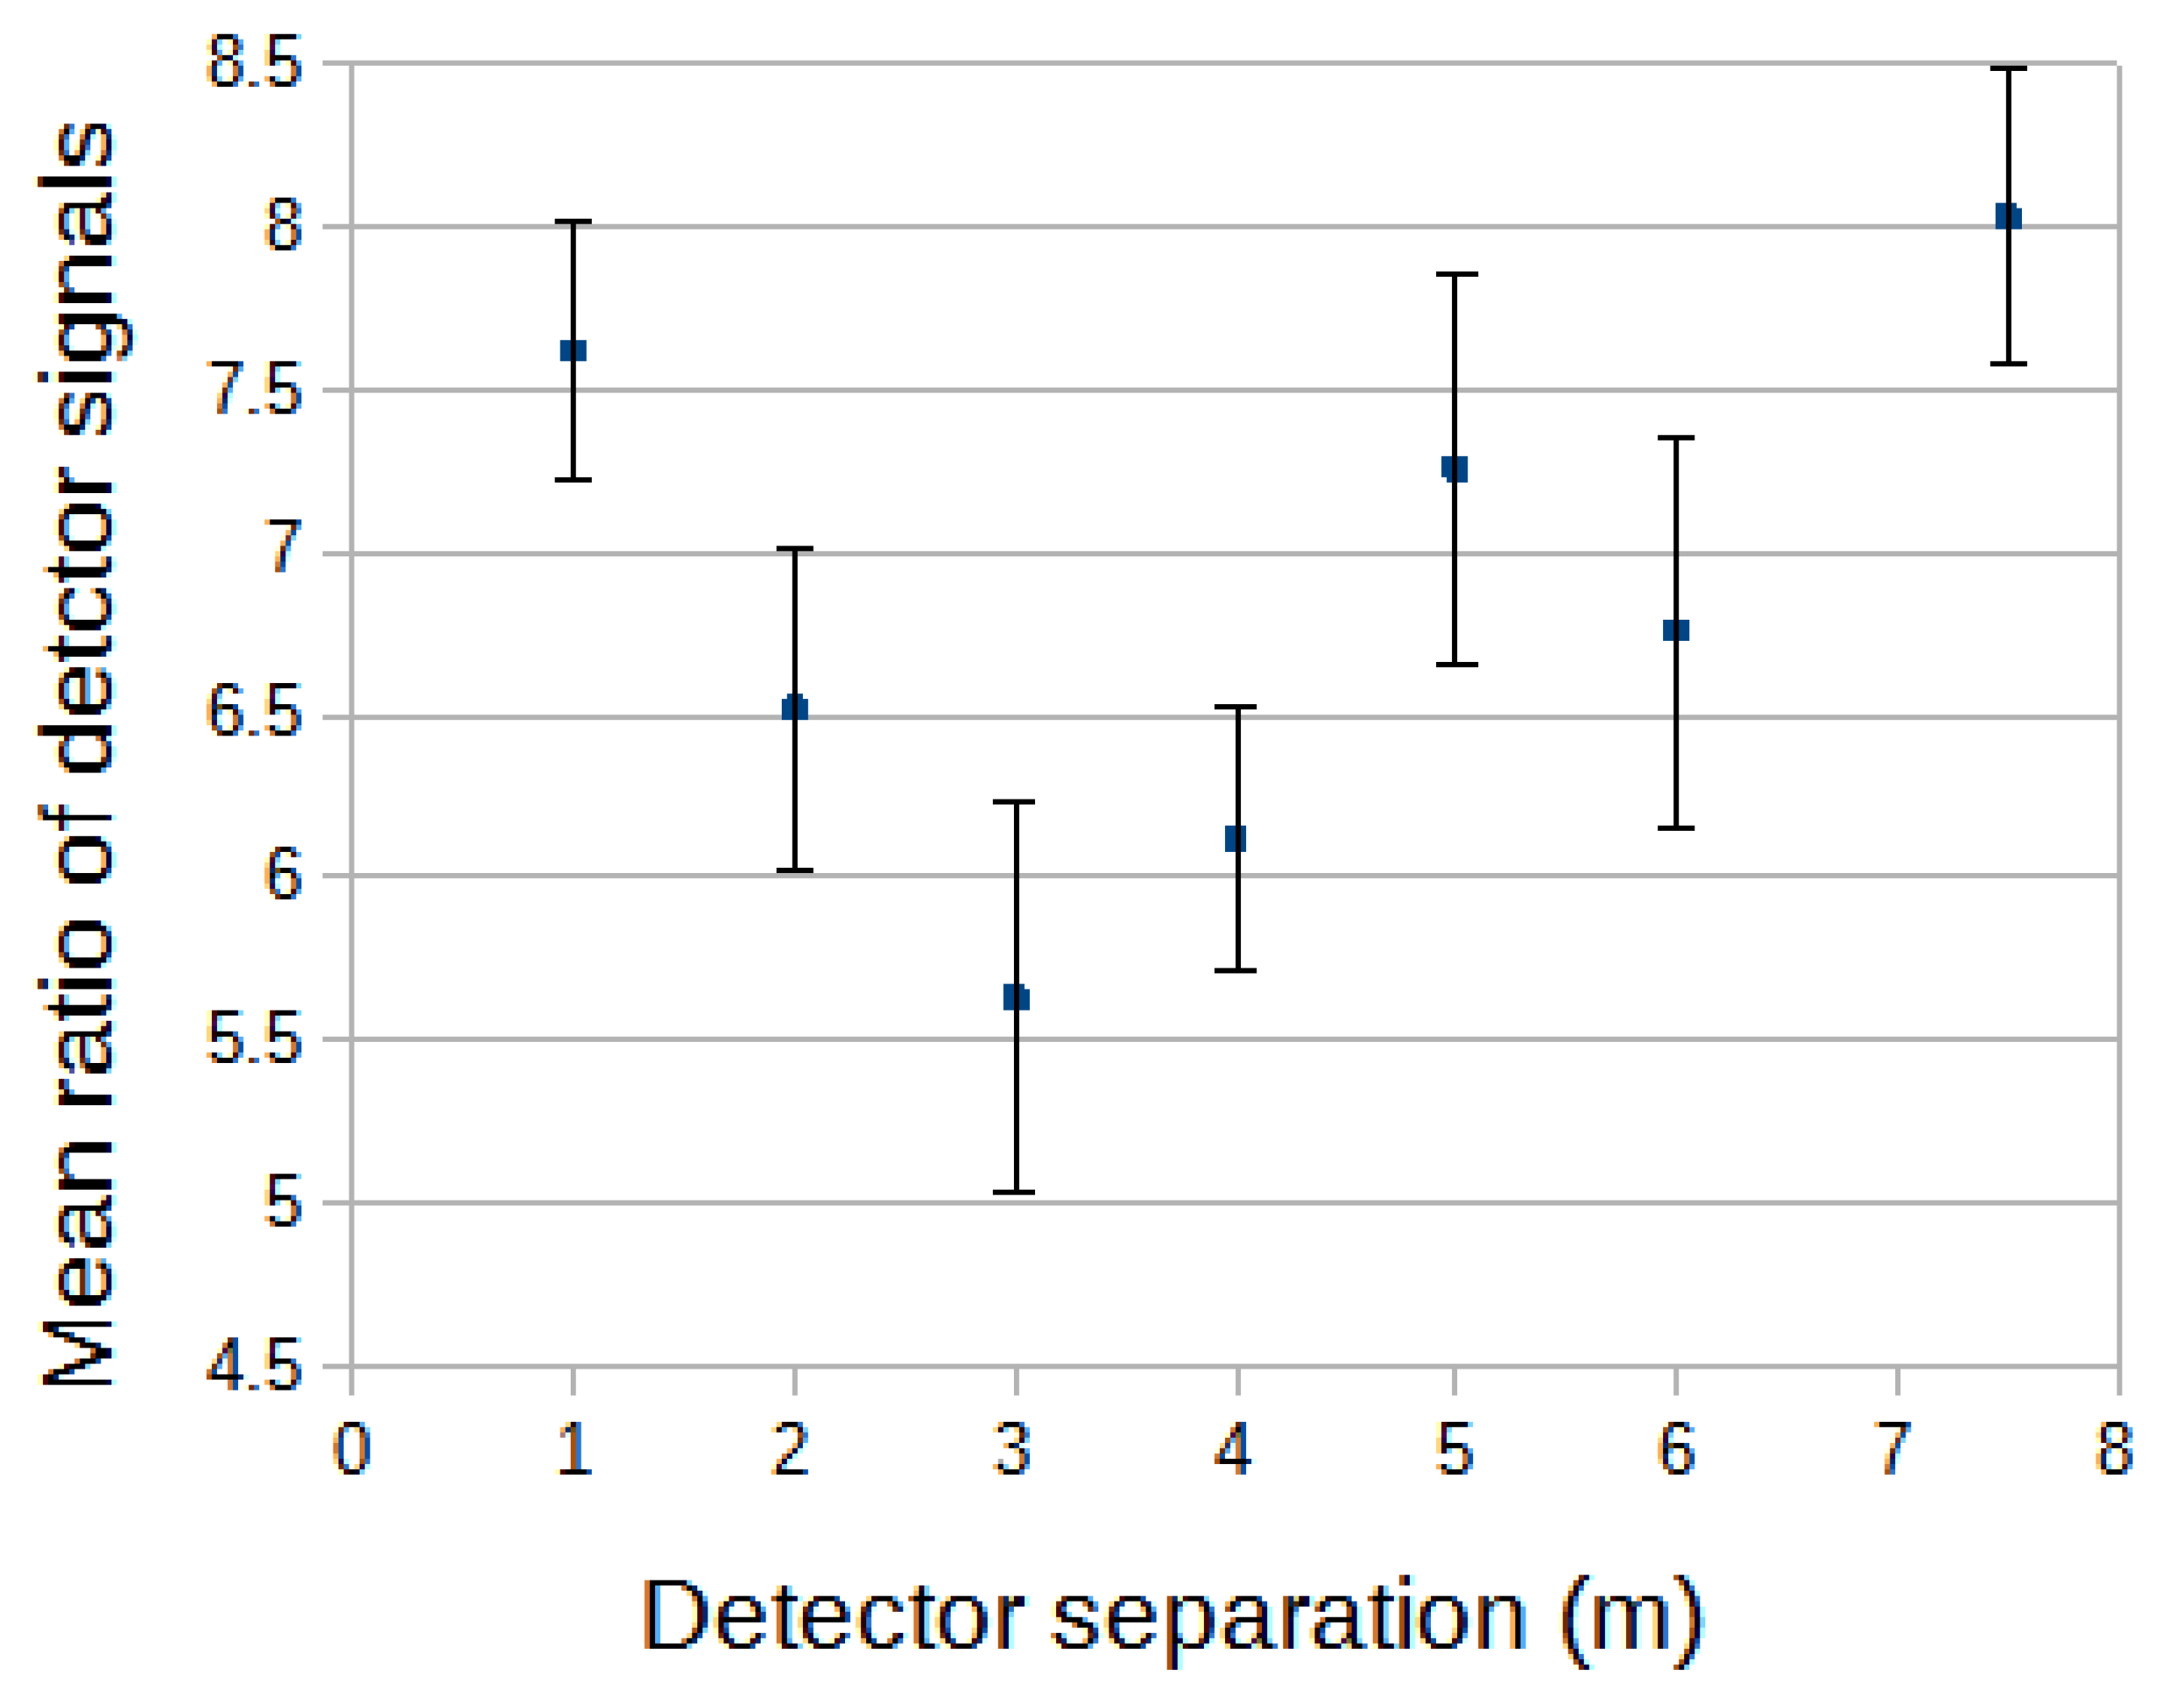
Figure 15 shows this variation for the triggering situation used for Fig.11. Here, with no shower size cuts, there is a low shower size threshold (1500 particles).
Figure 11, for close detectors, shows significant outliers and, for display in
Figure 15, the mean ratio of the detector signals is determined ((larger signal)/smaller) including the outliers. This is repeated in
Figure 15 for increasing detector spacings
It seems likely that when the detectors are close together, for very small showers, the scatter is a result of both detectors triggering very close to the narrow core of the shower, resulting is a significant spread in densities over metre distances. At larger detector separations, for the class of showers triggering the array plus giving non-zero signals in the detectors, at least one detector will be at a larger core distance than is typical of two closely located detectors. The shower particle densities and the (fractional) steepness of the lateral distribution function reduce with increasing core distance (although not rapidly since both detectors must still record at least one particle) and the detector signal ratios then more reflect just the Poisson fluctuations in the decreasing shower particle density. With increasing core distance, and decreasing shower particle density, the fractional Poisson fluctuation increases (~√n/n for each detector). This approach to Poisson is strengthened as the shower size threshold is increased. For instance, at a spacing of 7.5 m, and when an increased threshold shower size of ~5000 particles is imposed, the variance of the detector signal ratios becomes close to (within 20%) that expected on the basis of Poisson statistics.
4. Discussion
The usual air shower decoherence experiment involves triggering two detectors and determining the coincidence rate of those triggers as a function of detector spacing (e.g. [
4]). This is historically important as it can demonstrate the large lateral spread of particles in a shower. It can be interpreted in terms of simple model lateral distributions of the air shower particles and usually generates a power law dependence of coincidence rate with increasing detector separation. The index of the power law depends to an extent on the detector threshold (usually single particles) and the detector areas (so, on the particle density per square metre). These parameters determine the closeness of the detectors to the shower core, and the size threshold of the relevant showers since, when triggering is on single particles, larger detectors are sensitive to smaller particle densities and can trigger off very small showers.
An alternative procedure is to require that the recording of the two detector signals also requires an explicit local air shower trigger. In this way, an extra constraint is added and the experiment is closer to studying broader underlying shower characteristics. In the earlier arrangement, all showers are accepted which trigger both detectors. Now, there is a selection of component showers from that group of two-detector triggers. The shower size trigger may be at a low level (small air showers) but its inclusion reduces the event rate as the very small showers are preferentially excluded and a shower size baseline is set.. There is then an opportunity to investigate the relationships between particle densities for detectors at small spacings within air shower detection systems. For such an arrangement, at least at small core distances, the relationship between the ‘two-detector coincidence plus array’ trigger rate and detector separation can be expressed as an exponential and a characteristic scale length can be defined. This scale length is shortest for measurements close to the shower core where the lateral distribution is most steep, as exhibited by it increasing with the shower size threshold for a fixed detector particle density (larger shower sizes enable the two-detector coincidence to occur further from the shower core) and decreasing with increasing particle density for a fixed shower size threshold, when the triggered detectors must be closer to the core. Thus, one finds that there is a measurable scale length which is small close to the shower core and this is closely related to physical scales in the core region of the shower.
These ideas can be extended to consider some statistical properties of particle density variations within the showers and are relevant to understanding particle density measurements with small detector systems or for understanding measurements by large segmented detectors (e.g. [
6]). Where the characteristic scales are short (near the core), particle density variations can strongly reflect lateral distribution function variations over small distances associated with real variations within the shower, plus variations due to counting statistics. At larger core distances, conventional counting statistics dominate and detector densities there can be adequately understood is the usual way.
4. Conclusions
Studies have been made of the relationships between densities in pairs of spaced particle detectors triggered by cosmic ray air showers. These have been self-triggered as in conventional decoherence (variation of coincidence rate with spacing) experiments and investigations have also included the requirement that there is a coincident local air shower array trigger. The latter is able to add detail, and understanding, to the usual decoherence data since characteristic scales within the showers become apparent in the data. Those scales can usefully aid understanding of the statistical properties to be found in air shower detector measurements.
Funding
This research received no external funding.
Data Availability Statement
The data presented in this study are available on request from the corresponding author.
Acknowledgments
Tadeusz Wibig is gratefully thanked for his interest and critical insight into this work. Neville Wild and Adrian Giffen are thanked for their work in supporting the Roof Array.
Conflicts of Interest
The author declares no conflicts of interest.
References
- Cocconi, G., Cocconi Tongiorgi, V., Greisen, K. The Lateral Structure of Cosmic-Ray Air Showers. Phys. Rev. 1949, 76, 1020–1034. [Google Scholar] [CrossRef]
- Aab, A. (the Pierre Auger Collaboration) The Pierre Auger Cosmic Ray Observatory Nucl. Inst. Meth. A 2015, 798, 172–213. [Google Scholar]
- Wei, J. and Montgomery C.G. Narrow Air Showers of Cosmic Rays. Phys. Rev. 1949, 76, 1488–1493. [Google Scholar] [CrossRef]
- Riggi, F., La Rocca, P., Pinto, C., Riggi, S. A modular telescope facility to investigate the cosmic ray decoherence curve. Journal of Instrumentation 2021, 16, T08006. [Google Scholar] [CrossRef]
- Wibig,, T. Particle correlation in the cosmic ray showers around the spectral knee. Journal of High Energy Astrophysics 2024, 41, 54–60. [Google Scholar] [CrossRef]
- Gesualdi, F., and Supanitsky, A.D. Estimation of the number of counts on a particle counter detector with full time resolution. European Physical Journal C 2022, 82, 925. [Google Scholar] [CrossRef]
|
Disclaimer/Publisher’s Note: The statements, opinions and data contained in all publications are solely those of the individual author(s) and contributor(s) and not of MDPI and/or the editor(s). MDPI and/or the editor(s) disclaim responsibility for any injury to people or property resulting from any ideas, methods, instructions or products referred to in the content. |
© 2024 by the authors. Licensee MDPI, Basel, Switzerland. This article is an open access article distributed under the terms and conditions of the Creative Commons Attribution (CC BY) license (http://creativecommons.org/licenses/by/4.0/).
