II. Literature Review
A highly effective CNN architecture was presented by the author [
3] for the detection of potato illnesses. This is crucial because fungal infections have a big effect on potato harvests, which are a major source of food. They used Adam and cross- entropy to optimise the model and produced an image-based training dataset in order to accomplish this. The model used much less resources (99.39 percent parameter reduction) to achieve high accuracy (99.53 percent) in disease identification. Using image processing and machine learning, the authors [
4] suggest an automated system to recognise and categorise potato leaf illnesses (Early Blight and Late Blight). With a 97 percent accuracy rate, the Random Forest classifier emerged as the most promising technique for automatically classifying the disease.
The use of deep learning for very accurate automated identification of potato and tomato leaf diseases was suggested by the authors [
5]. For this aim, two CNN architectures were created especially. The model was optimised using Adam and Categorical Crossentropy on an image dataset. With the least amount of resources used, the model was able to detect diseases with excellent accuracy (98.14 percent for potatoes and 91.34 percent for tomatoes).
A multi-level deep learning model was presented by the authors [
6] for the analysis of the disease. Due to regional training data, existing approaches frequently lack generalizability. The suggested model isolates potato leaves initially by using YOLOv5 for picture segmentation. Next, in the separated leaves, an innovative CNN finds both early andlate blight. This model beat previous approaches on the PlantVillage dataset in terms of accuracy and computational efficiency, achieving 99.75 percent accuracy on a Pakistani dataset.
A CNN architecture was proposed by the authors [
7] to detect fungal-caused late and early blight infections in potatoes. An important source of food, potato harvests are severely impacted by this illness. The model has a Softmax final judgement function and analyses data using categorical cross- entropy and the Adam optimizer. With a parameter count of 10,089,219, the model minimises resource use while achieving excellent accuracy (99 percent) in disease identification.
A convolutional neural network architecture was presented by the authors [
8] to categorise potato leaf blight (healthy, early blight, late blight). Their testing accuracy with a 14- layer model was 98 percent on average. They employed data augmentation to grow their dataset from 1,722 to 9,822 photos in order to increase accuracy.
A deep learning model was presented by the authors [
9] to identify potato, tomato, and pepper leaf diseases, such as early and late blight. To obtain different characteristics from pictures, they combined transfer learning with a pre-trained VGG19 model. In the test dataset, logistic regression achieved a classification accuracy of 97.8 percent, outperforming other classifiers.
Using PySpark dataframe, the authors [
10] proposed MCIP, a framework for analysing crop image data. By employing K- means for clustering and PCA for feature selection, MCIP overcomes the drawbacks of existing techniques. It can be used on other crops and identified potato, tomato, and pepper leaf diseases with near-perfect accuracy (almost 100 percent).
The authors [
11] suggest an automated machine learning- based approach for detecting potato diseases in order to enhance potato yield and agricultural digitization in Bangladesh. Their approach uses machine learning and image processing to identify disease from the potato photos. The model, which was trained on more than 2000 healthy and diseased potato leaves, demonstrated a testing accuracy of 99.23 percent, indicating that machine learning presents a viable option for the diagnosis of potato diseases.
Four potato leaf diseases can be classified, according to the authors’ [
12]. Leaf photos of potato were analysed using the VGG16 and VGG19 convolutional neural network architectures for the purpose of disease classification. With an average accuracy of 91 percent, this method proved that deep learning is a viable method for detecting potato diseases.
For the classification of plant diseases, the authors [
13] suggest a two-step deep learning method. To determine which CNN architecture performs the best, they first compare a number of them, including modified and mixed models. Based on training epochs, F1-score, validation accuracy, and loss, they assess these models. Second, they use various deep learning optimizers to optimise this best model. A dataset comprising 26 illnesses from 14 different plant species is used to train all of the models. Outperforming earlier techniques, the Xception architecture with the Adam optimizer produced the best accuracy (99.81 percent) and F1-score (0.9978). A CNN-based method was suggested by the authors [
14] for the detection of tomato leaf diseases. Their algorithm detects a number of illnesses, including septoria blight and early blight, using image processing.
In an effort to increase potato production, the authors [
15] suggest an advanced machine learning system for identifying and categorising potato leaf diseases. High agricultural yields depend on early disease diagnosis, yet manual inspection is labor-intensive and skill-intensive.
A. Comparative Analysis of Studies
Table 1 summarizes recent advancements in machine learning (ML) for potato, tomato, and pepper leaf disease detection. All studies achieved impressive accuracy, ranging from 97.8percent to near-perfect (almost 100 percent). [
8] utilized a 14-layer CNN, achieving 98 percent accuracy. However, their approach necessitates a large training dataset. [
9] explored transfer learning with VGG19, attaining 97.8 percent accuracy, suggesting efficient feature extraction capabilities. [
10] introduced MCIP, a framework leveraging K-means clustering and PCA for feature selection. This framework achieved near- perfect accuracy and demonstrates potential generalizability to other crops. [
11] prioritized high accuracy (99.23 percent) to support agricultural digitization initiatives. Finally, [
7] proposed a CNN specifically designed for late/early blight detection, achieving 99 percent accuracy with an efficient model architecture (Softmax, categorical cross-entropy, Adam optimizer). These findings collectively underscore the efficacy of ML for potato leaf disease detection. While all approaches exhibited strong performance, further research should investigate methods for enhancing efficiency and generalizability across diverse datasets and disease types.
III. Methodology
This paper presents a novel CNN architecture for categoriz ing various leaf diseases. The model leverages the TensorFlow and Keras libraries to construct an efficient image recognition pipeline. The following sections delve into the technical aspects of the model, including data preparation, augmentation, network architecture, training configuration, and evaluation metrics.
- 1)
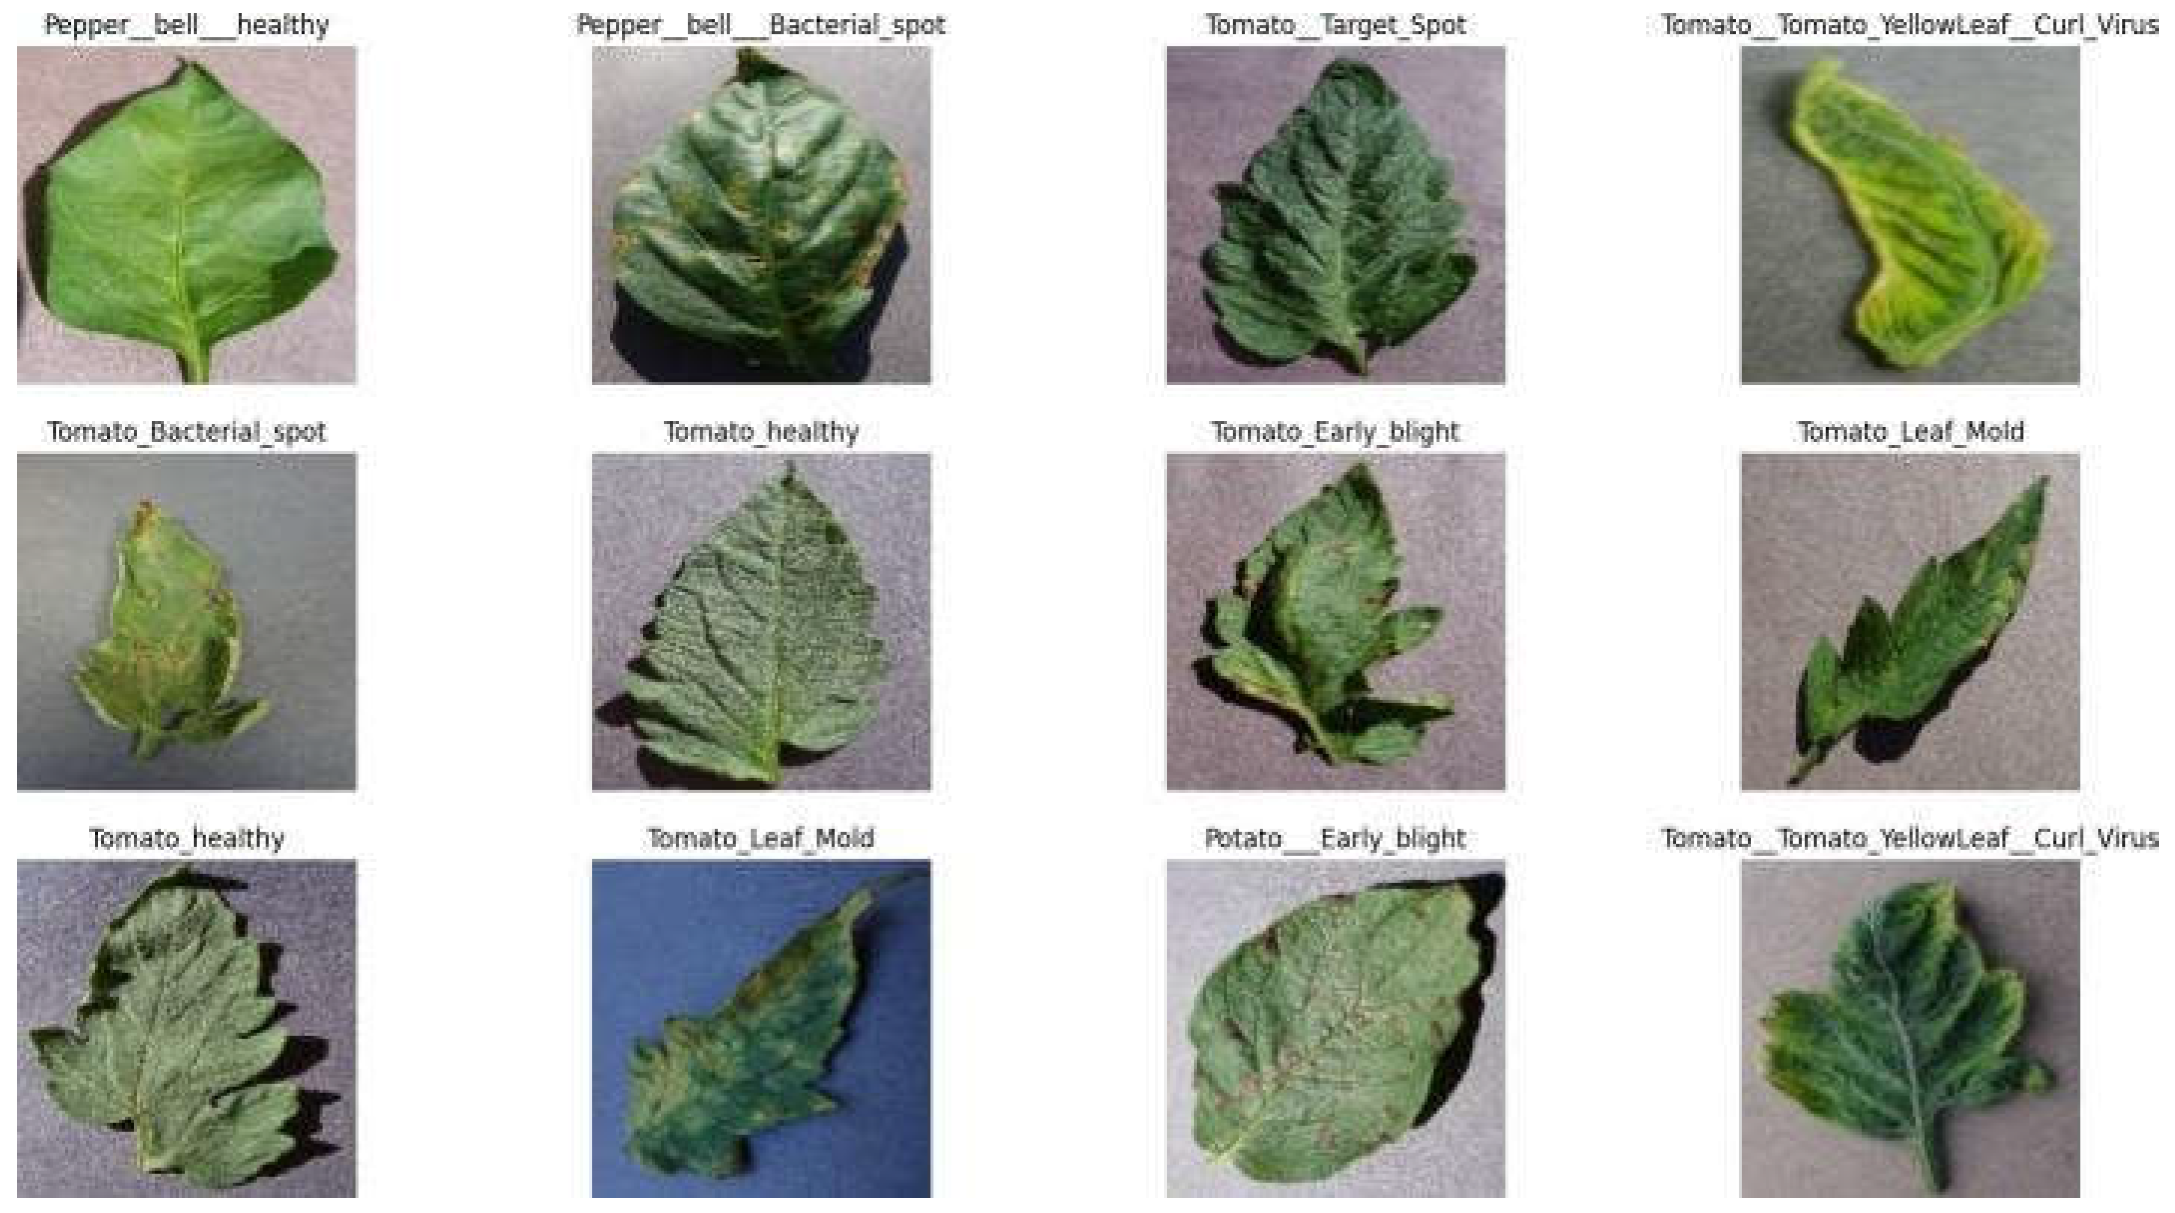
>1) Data Acquisition and Preprocessing: The cornerstone of training a robust image classification model lies in a well- curated dataset. The implemented approach utilizes the tf.keras.preprocessing image dataset from directory function for data access and preprocessing.
Following data loading, essential preprocessing steps are introduced. The get dataset partitions tf function partitionsthe dataset into training, validation, and testing sets. This segregation ensures the model is trained on the representative subset, its performance is evaluated on a separate unseen hold- out set (validation set), and its generalizability is assessed on another unseen set (testing set). The hyperparameter configuration (train split, val split, and test split) controls the data allocation proportions, ensuring balanced representation for training and evaluation.
To further enrich the training data and mitigate overfitting, data augmentation techniques are employed. Overfitting occurs when a model excessively memorizes training data specifics, resulting in poor performance on unseen examples. The data augmentation function introduces random horizontal and vertical flips along with rotations within the training images.
- 2)
>2) Model Architecture Design: The proposed system’s core is a meticulously crafted CNN architecture specifically designed for various disease classifications of leaves. The model employs a sequential stack of convolutional and dense layers to extract informative features from input images and map them to the corresponding disease categories.
The architecture commences with preprocessing layers. The resize and rescale block performs two crucial steps. First, it resizes all input images to a uniform dimension of 128x128 pixels using a resizing layer. This ensures consistency in the input data format for subsequent convolutional layers. Second, it rescales the pixel intensities to a range of 0 to 1 using a rescaling layer. This normalization step facilitates the training process and promotes faster convergence.
The first convolutional layer utilizes 32 filters with a size of (3, 3) and uses the activation function, the rectified linear unit (ReLU). Subsequent convolutional layers progressively increase the number of filters (64, 128, and 256) to capture increasingly complex features. After each convolutional layer, we join a max pooling layer with a size of (2, 2) to reduce the matrix dimensionality by half.
Following feature extraction, the model employs fully- connected (dense) layers for disease classification. A dense layer with 64 neurons and a ReLU activation function serves as a hidden layer, further processing the features. The lastlayer has the same number of outputs as the disease classes(15 in this case) and employs a softmax activation function. The softmax function outputs a probability distribution across all disease categories, with the highest value indicating the predicted class for the input image.
- 3)
>3) Training Configuration and Evaluation: For the model compilation, the optimizer Adam has been used, which is a beneficial choice for models because of its efficiency and fast learning rate adjustments, which lead to faster convergence. The loss function employed is the sparse categorical cross- entropy, well-suited for multi-class classification problems.It measures the difference between the predicted probability distribution and the true one-hot encoded label for each image. The model is trained for several epochs, where epoch defines one complete pass of the entire training dataset. During each epoch, the model changes its parameters to reduce the loss, progressively improving its classification accuracy.
- 3)
A. Proposed Model
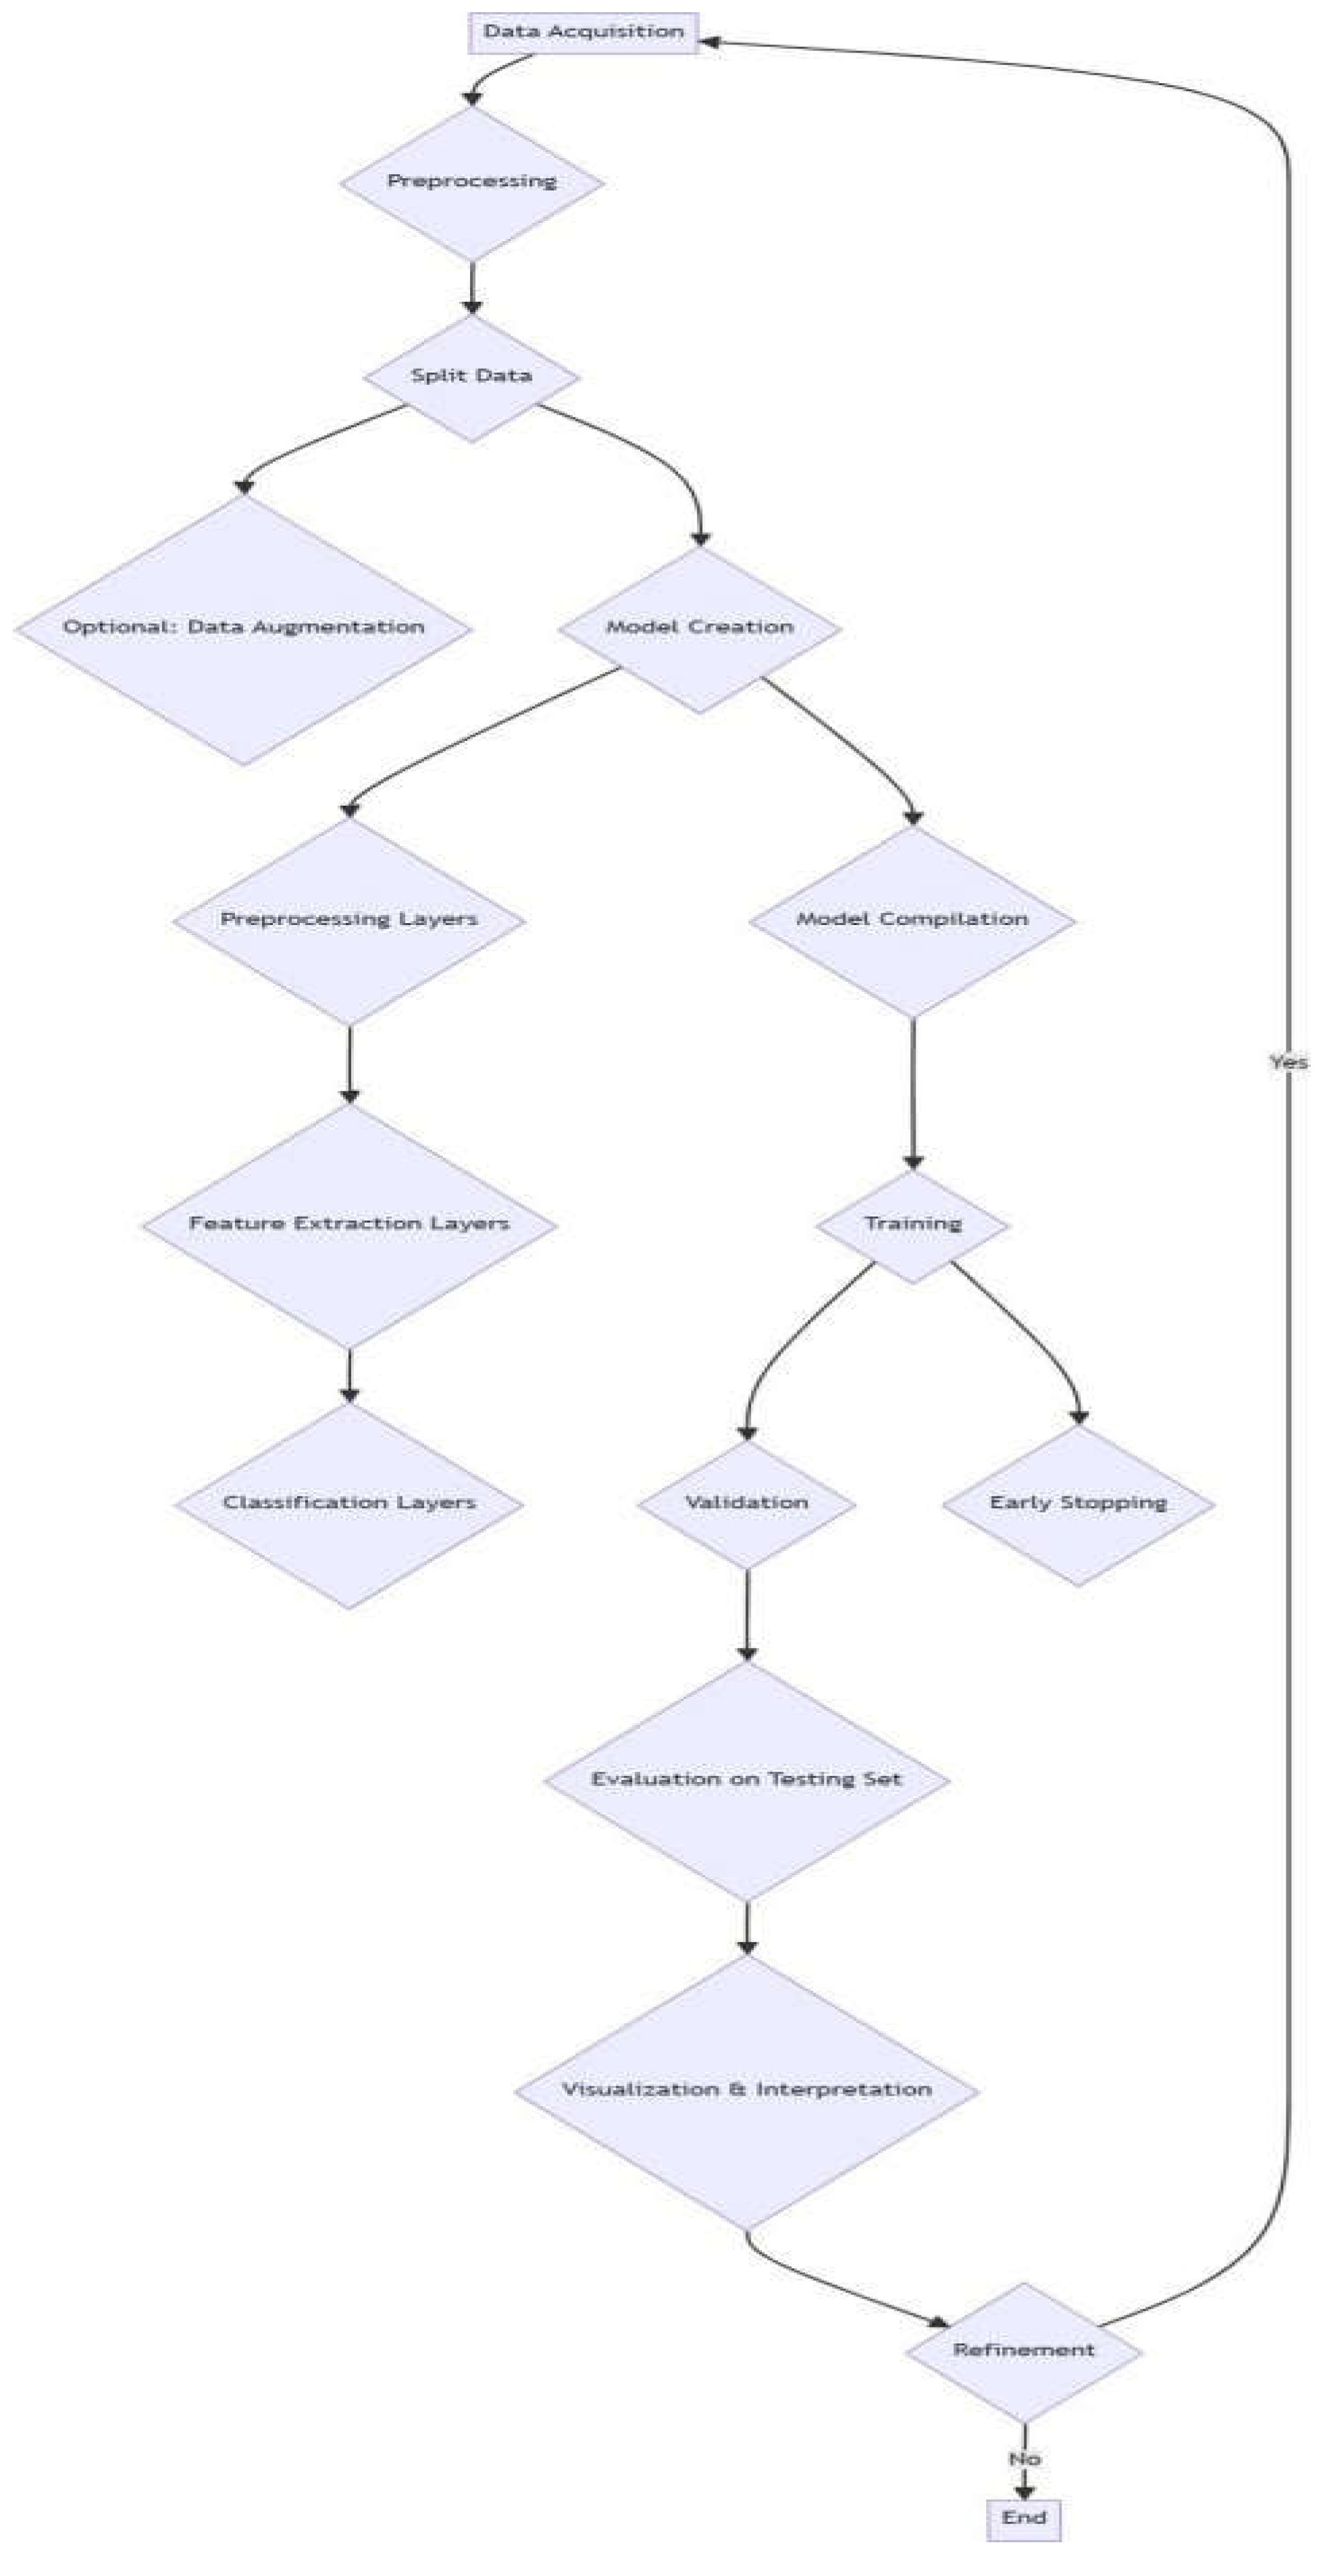
A custom independently trained neural network CNN architecture is used to classify tomato, potato, and pepper leaf diseases using deep learning. Below is a detailed explanation of each step:
Step I Data Gathering: Get a potato, tomato, and pepper leaf disease-specific picture collection. Although publicly available datasets are useful, they need be tailored to target diseases like early and late blight. Choose a dataset that uses JPEG or PNG and labels each image with a disease status.
Step II: Preprocessing data prepares images for model training after data gathering. This phase accelerates CNN learning and ensures data format uniformity. An outline of preprocessing workflow:
Data Loading: Use tf.keras.preprocessing.image dataset from directory to load image data from a directory. Image- label pairings are automatically extracted using the directory’s subfolder organisation.
A Resizing layer in the model design scales all input images to a consistent size. The appropriate size (128x128 pixels) can be calculated from the dataset’s attributes and computer power. Image Normalisation: Apply a rescaling layer to normalise photo pixel intensities to 0–1. Normalisation ensures equal contribution of all images during training, preventing bias towards brighter or darker shots.
Step III: Carefully partition the loaded dataset. The instruction set, which contains 80 percent of the data, trains the model. Adjusting hyperparameters and avoiding overfitting requires the validation set, which makes up about 10 percent. The remaining 10 percent—the testing set—is a fully held-out set used for final performance evaluation on unseen data after training. Additional shuffles, such shuffle or shuffle(buffer size), ensure the model is trained on a random order of images, preventing biases towards specific sequences.
Step IV: Optional Data Enhancement Dataset size affects deep learning model performance. Lack of data might induce overfitting. This risk is reduced by data augmentation. By controlling training picture alterations and transformations, these approaches create new synthetic instances and artificially enlarge the training dataset. Define an Augmentation Strategy using the data augmentation function or a related mechanism. This technique could use random rotations within a specific range (e.g., +/- 20 degrees), horizontal and vertical flips, and cropping to manage training image disparities.
Step V Model Creation: The system is based on a refined CNN architecture designed for potato, tomato, and pepper leaf disease categorization. CNNs are great at extracting spatial properties from image data because they learn from local patterns.
Convolutional layers apply learnable filters that scan the input image and activate when patterns or features are found. These filters capture edges and other low-level features.
Pooling layers reduce convolutional layer feature maps. This reduces data spatial dimensionality, boosting computational performance and preventing overfitting. Max pooling, which selects the most activations within a window, is popular.
Classification Layer Configuration: Convolutional layer characteristics must be converted into sickness categories. How the final step goes:
Flattening layers convert convolutional layer multi- dimensional feature maps into one-dimensional vectors that may be input into dense layers.
As a hidden layer, the retrieved characteristics are processed by a dense layer consisting of the activation function ReLU. The ReLU activation function gives the model non-linearity, allowing it to learn more complex feature correlations.
Last dense layer employs softmax activation function and has as many neurons as disease classes (15 for late blight, early blight, and healthy leaves). The output probability distribution maximum value from the softmax functionreflects the projected class for the input image across all sickness categories.
Step VI Training Models: After designing the model architecture, train it with ready-made data:
The compilation of the CNN model is done using the optimizer Adam, which is popular for its efficiency and learning rate flexibility. Use the sparse categorical cross-entropy loss function for multi-class classification.
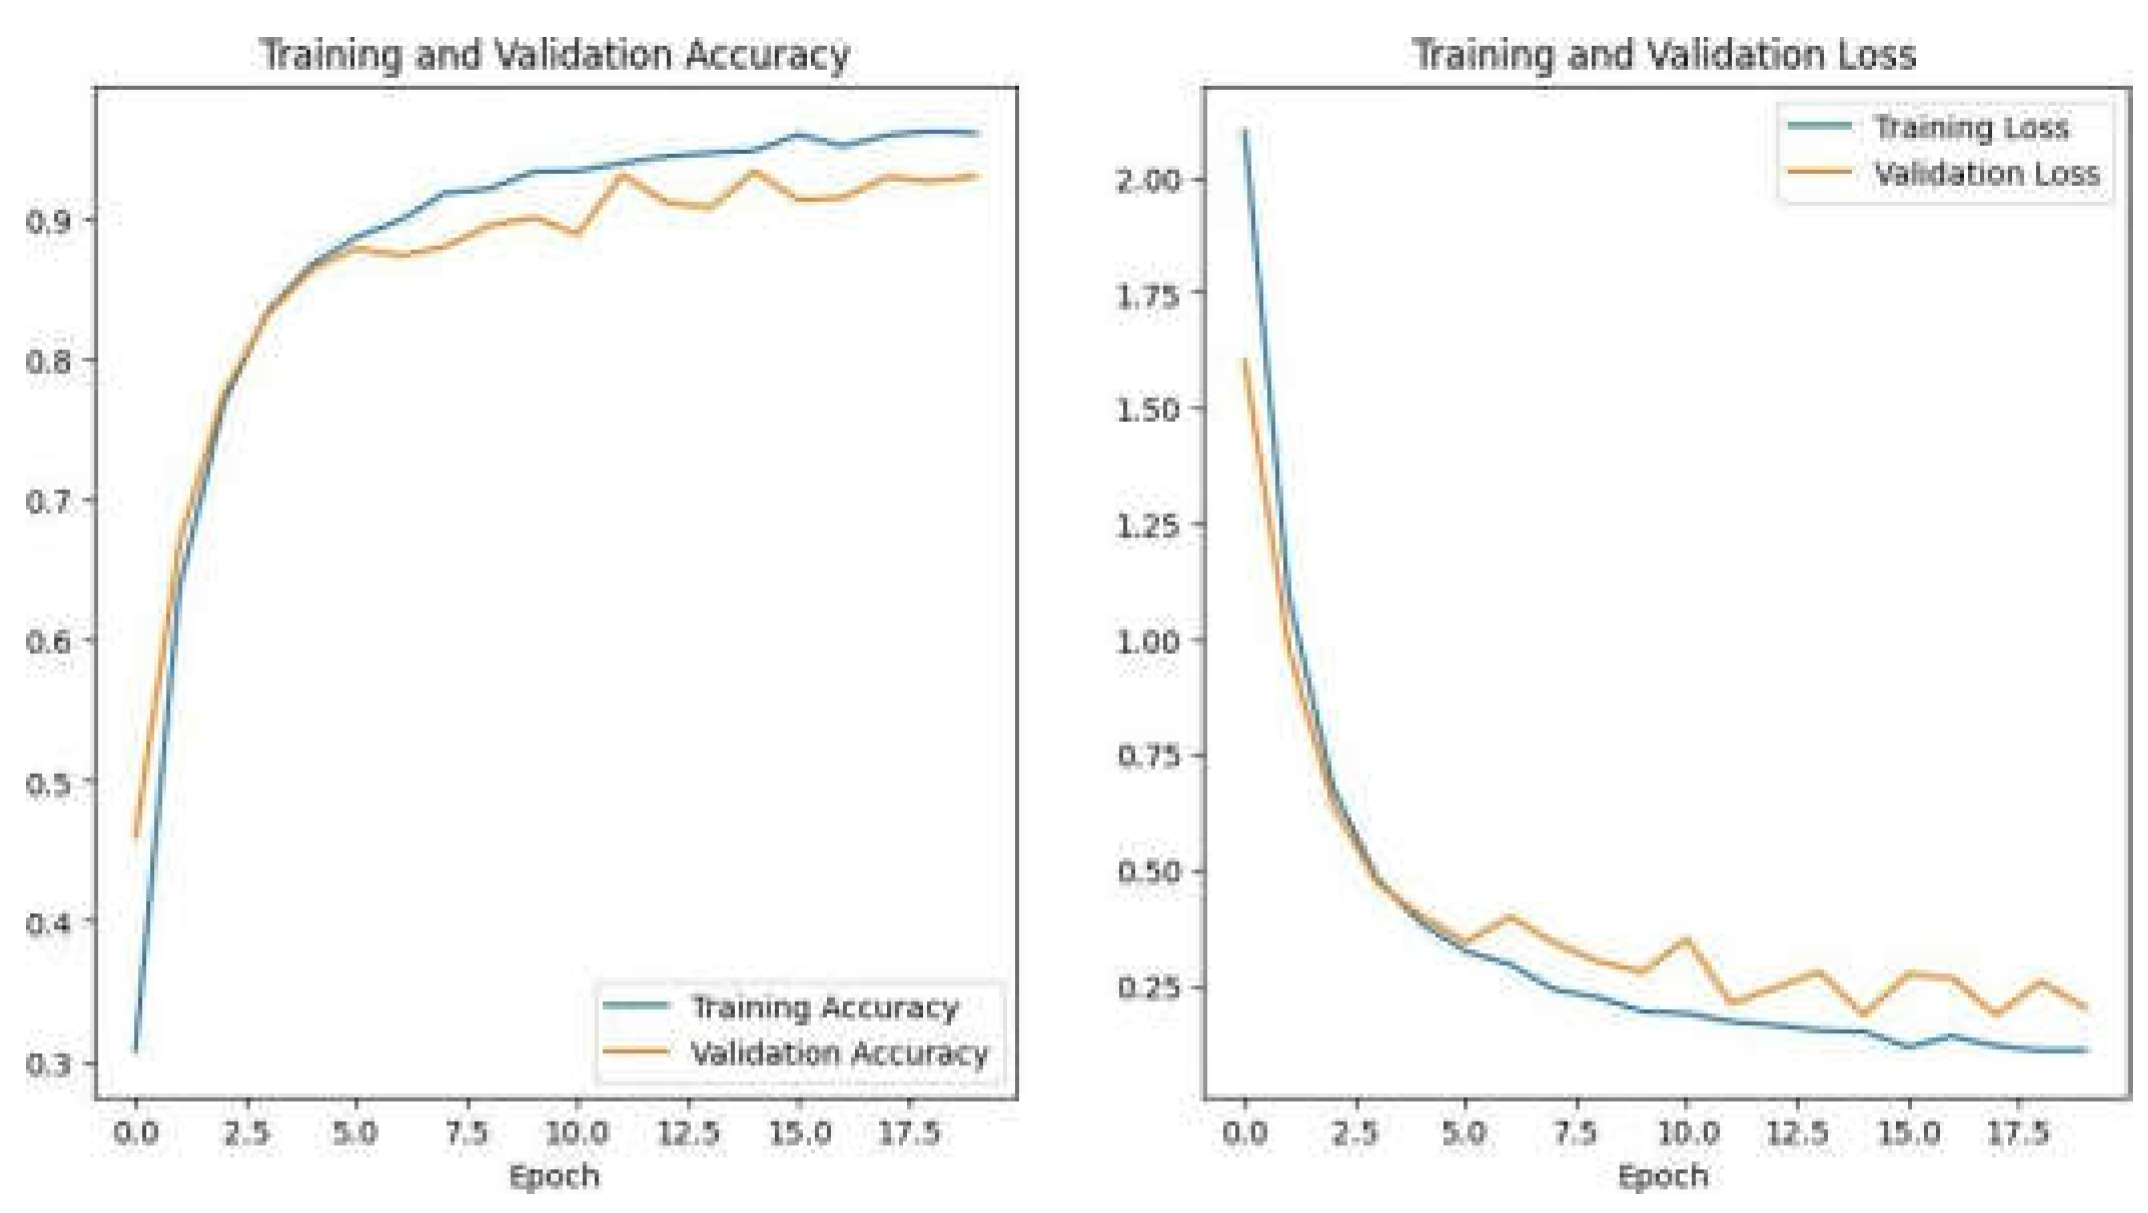
Configure how many epochs the model will undergo training. Twenty epochs is a usual starting point, however it can be altered depending on dataset size, validation effectiveness, and computer capability.
Start training by fitting the model to the training set using the learning rate, optimizer, loss function, and epochs. Each iteration, the model updates its filter weights and biases to minimise the training and validation set loss function.
Validation Monitoring: Monitor the model’s validation set performance throughout training. Check validation loss and accuracy. Early stopping may be used to cease training if validation loss does not improve after a given number of epochs. To avoid overfitting, pause the training process when the model becomes too familiar with the training data and loses its ability to generalise to new data.
Step VII Model Assessment: Analysing the model’s performance on unknown data after training determines its generalizability:
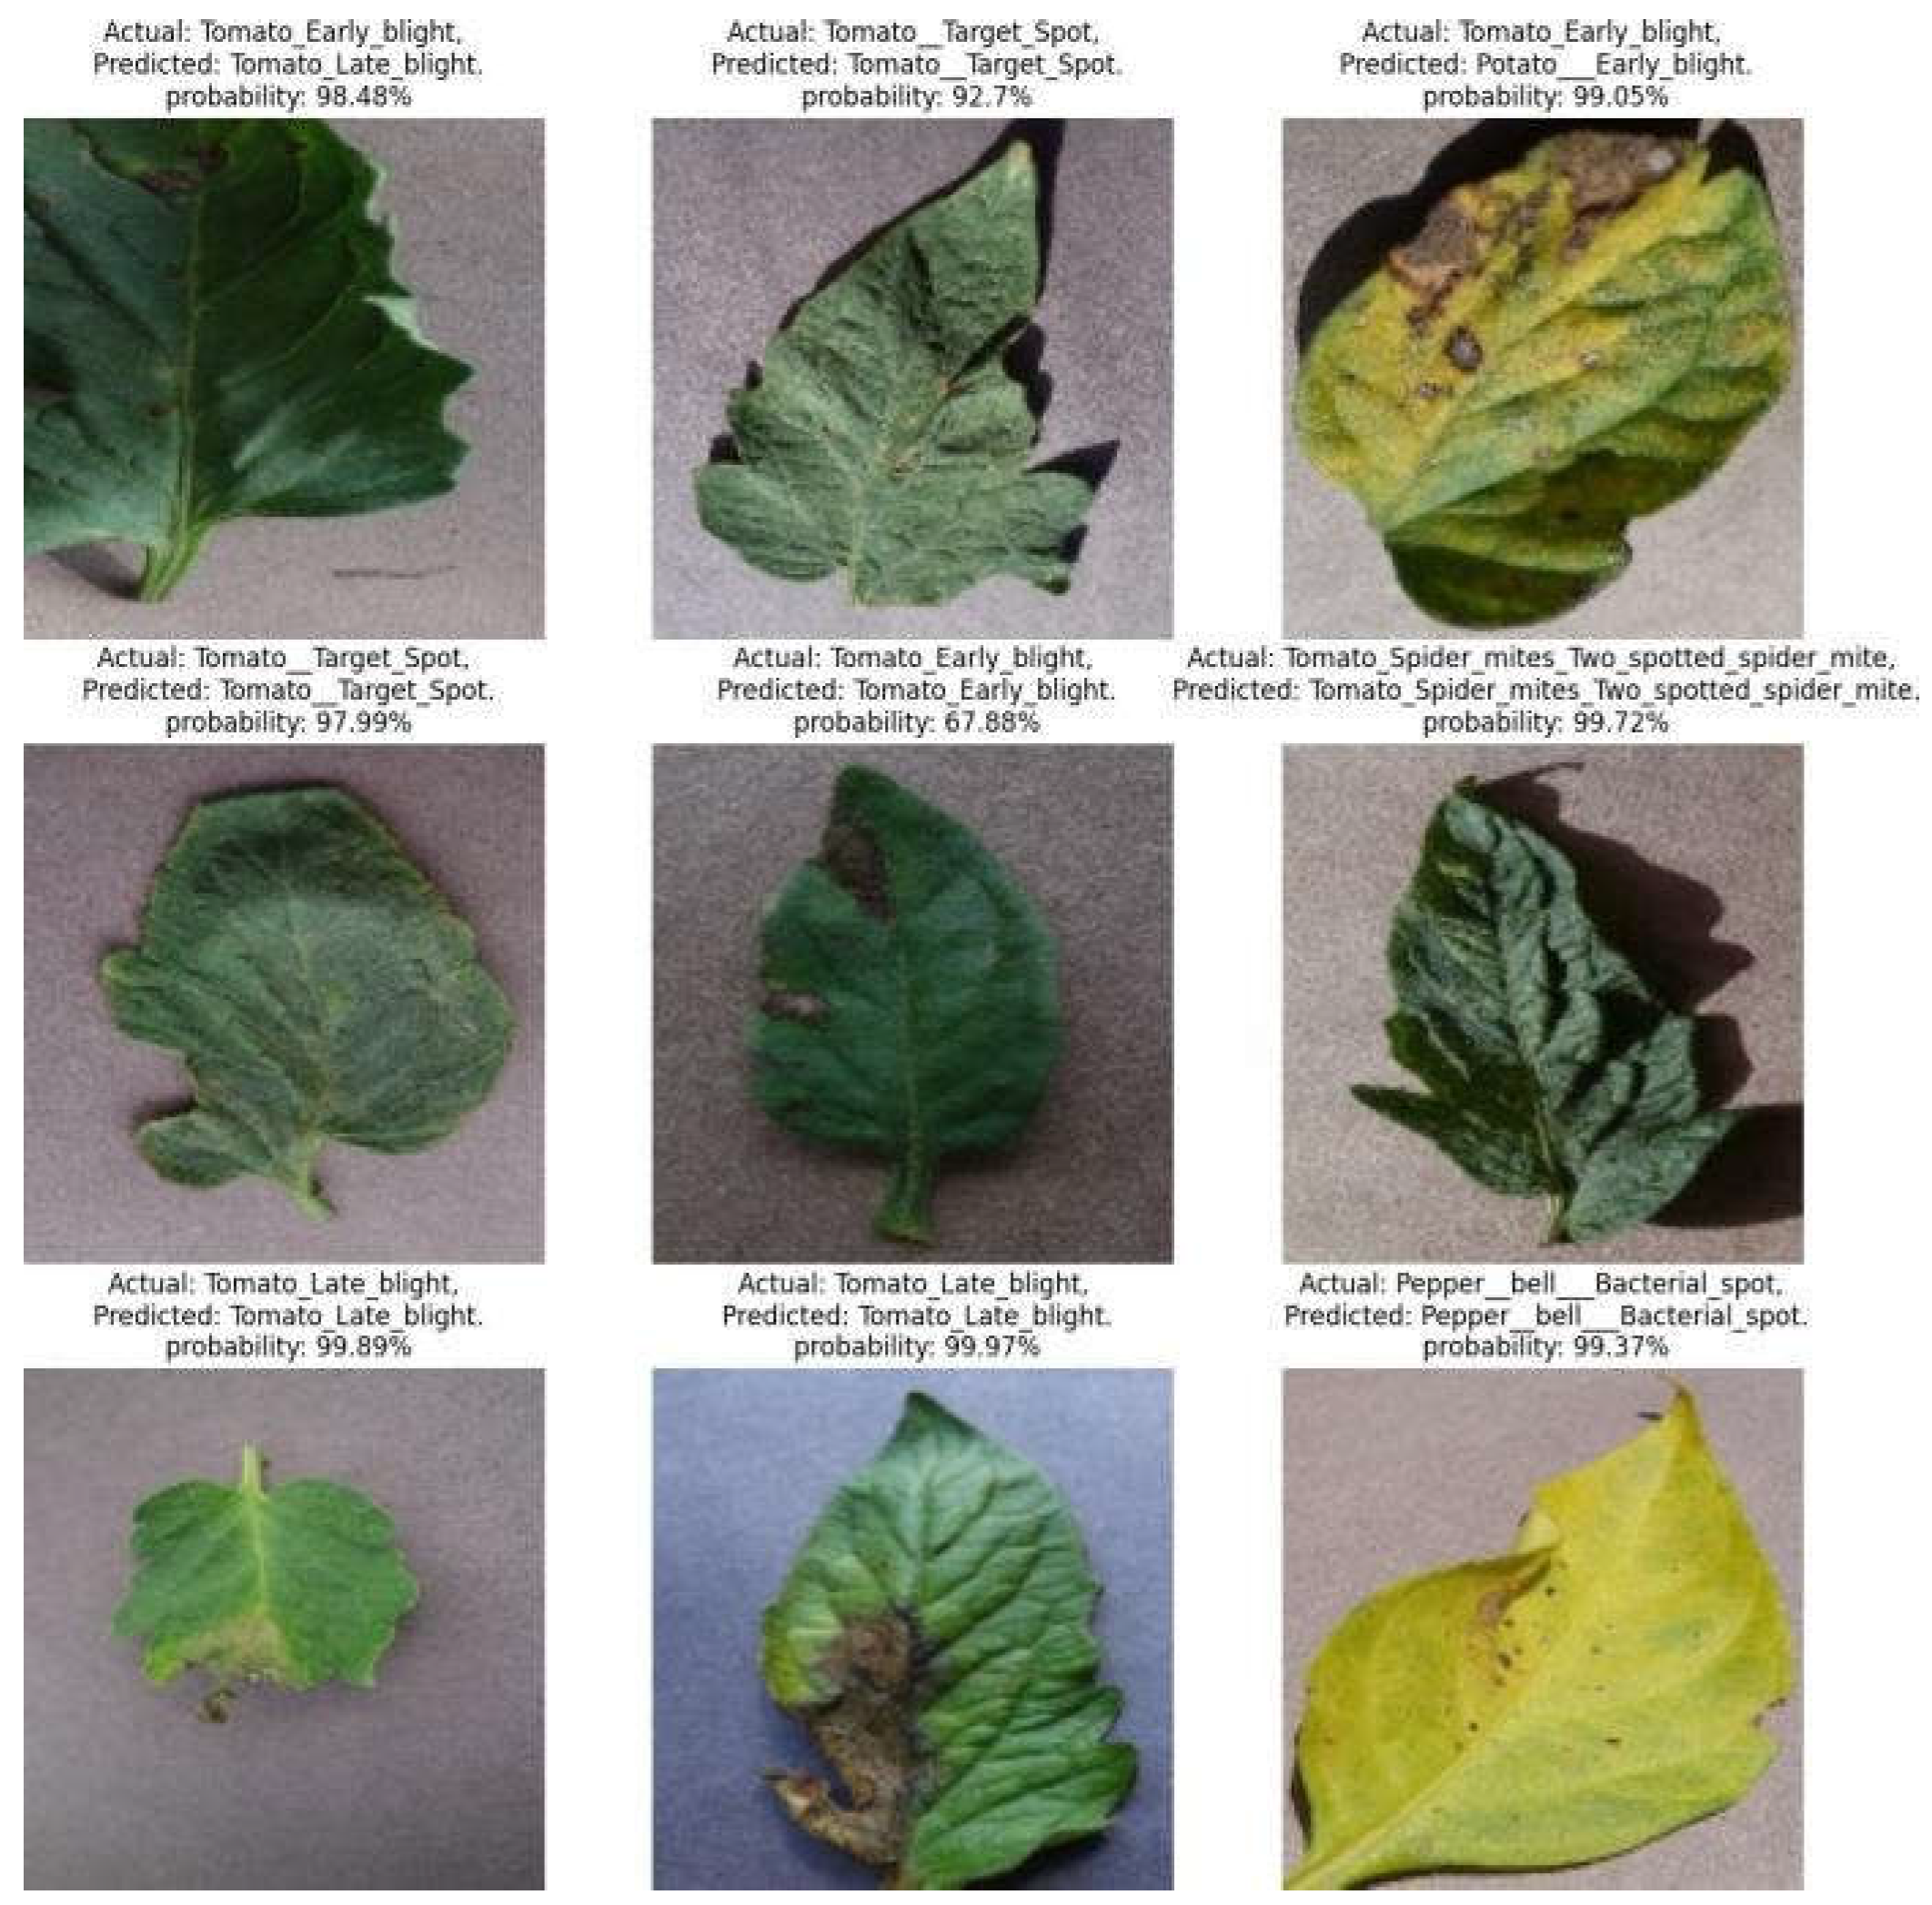
Testing Set: Evaluate the model’s output on a private testing set. Various parameters such as recall, precision, F1-score, and accuracy can be calculated to assess the model’s potato, tomato, and pepper leaf disease classification accuracy.
Visualisation and Interpretation: Visualise the model’s predictions using test photographs to understand its pros and cons. Confusion matrices can identify misclassifications and improvement opportunities.
Step VIII: Optional Model Refinement: If the original model performance is unacceptable, consider these refining methods: Adjustable hyperparameters include optimizer selection, learning rate, dense layer neurons, convolutional layers, and filter sizes. Hyperparameter setups can improve model performance.
If data augmentation is utilised to improve model robustness and generalizability, experiment with different procedures or amounts.
In conclusion, A structured approach that includes data gath ering, preprocessing, augmentation (optional), model construction, training, and evaluation is the focus of the methodology. Image datasets that are publicly accessible or domain-specific datasets specifically designed to target illnesses (late blight and early blight) can be utilised. By scaling and normalising the data, data preparation guarantees consistency in image format and makes model training easier. When data augmentation techniques are used, the training dataset is artificially expanded in order to reduce overfitting.
The carefully constructed CNN architecture, which is intended to extract useful information from the images, is the central component of the system. A sequential stack of convolutional and dense layers is used in the architecture. Features are retrieved by convolutional layers with pooling layers, and then processed for illness classification by dense layers with activation functions.
Figure 1.
Flowchart of the model.
Figure 1.
Flowchart of the model.
1:procedure CLASSIFYPOTATOLEAF(image)
2: preprocessed_image ← Preprocess(image)
3: predictions ← ForwardPass(CNN_model, preprocessed_image)
4: disease_class ← ExtractDiseaseClass(predictions)
5: return disease_class
6: function PREPROCESS(image)
7: resized_image ← Resize(image, target_size)
8: normalized_image ← Normalize(resized_image)
9: return normalized_image
10: function FORWARDPASS(model, picture)
11: result ← model(picture)
12: return result
13: function EXTRACTDISEASECLASS(predictions)
14: disease_class ← argmax(predictions)
15: return disease_class


