
Submitted:
13 June 2024
Posted:
14 June 2024
You are already at the latest version
Abstract
A Q-switched Nd:YAG laser was focused on Pb-Ti alloy samples in several Laser Induced Breakdown experiments in order to measure the Stark parameters of several spectral lines (58) of single ionized Titanium including the 3504.89 Å, and the 3510.83 Ålines (where we aported new experimental and theoretical values).Diagnostics of the laser induced plasmas (electron density and electron temperature) was performed using Balmer’s H alpha line (6562.7 Å).Temperatures were obtained by the Boltzmann Plot technique with spectral lines of Pb I (after correction for its evident self-absorption).Subsequently, calculations by the Griem approach of the Stark broadening parameters for several spectral lines were performed using the Gaunt factors proposed by Van Regemorter and those proposed by Douglas H. Sampson. In the latter cases the values obtained were very close to the experimental values. It allows us to assume that the calculations made for the spectral lines of Ti II, without experimental information, are more accurate using the Gaunt factors proposed by Sampson.
Keywords:
atomic data
; atomic processes
1. Introduction
Knowing the properties of the chemical elements belonging to the iron period, (Z=21-30)is necessary to understand core synthesis in the different types of supernovae: titanium (along with vanadium and scandium) are produced by the explosive combustion of silicon and oxygen in the SN phase of core collapse [1].
Information on the different titanium species (especially Ti I and Ti II) is needed to improve the accuracy of their stellar abundance determination. In the work of Wood et al. [2] on Ti II abundance in the photospheres of the Sun and metal-poor star HD 84937, the interest aroused by these species can be observed. In this work authors published improved Ti II atomic parameters for 364 spectral lines (present in the Photospheres of the Sun and metal-poor star HD 84937) and abundance determinations for 43 spectral lines (3263 Å-5418 Å) present in the Photospheres of the Sun. This is an important contribution but one potential problem is that in this last wavelength range there are 377 Ti II lines (1683 if we include Ti I,[3]). There are some of these 377 lines too close to those studied and even more intense. The presence of V II in the solar spectrum contributes to complicate the analysis and identification of the spectral lines. It is necessary to know how these lines can overlap with each other affecting the published results and for this it is necessary to analyze what are their line broadening parameters by collision with electrons.
In addition, titanium alloys are considered the most attractive metallic materials for industrial and biomedical applications. Ti6Al4V alloy, developed before 1955, is the best known and most widely used titanium alloy. About half of the world’s titanium production is for Ti6Al4V alloy applications. Ti6Al4V alloy, due to its low density, high specific strength, and excellent performance, is one of the main materials used to manufacture aviation engine blades [4]. The presence of Aluminum (6%) and Vanadium (4%) enhances the mechanical properties of Titanium which can be machined to conform to the irregular surfaces of fractured bones. The alloy can be welded well and has a high toughness, [5]. Ti6Al4V is the most widely used titanium alloy also in biomedical applications [6].
The presence of spectral lines of ionized Titanium (Ti II) and ionized Vanadium (V II) in the full spectrum (from UV to IR) of Ti6Al4V alloy obtained by Laser Induced Breakdown Spectroscopy (LIBS) allows establishing correlations between Titanium and Vanadium that may be of astrophysical interest: a recent published paper [7] about the abundances of iron-group elements in three metal-poor stars states that the correlation between scandium, titanium, and vanadium proposed in models of element production in these stars should be revised. Although it might seem a goal to directly study the spectrum of Ti6Al4V, the spectrum of Ti6Al4V is very complex (in the wavelength range 3800 - 4000 Å there are 519 spectral lines of Titanium, Vanadium and Aluminum collected at NIST [3] wich are very overlapped in the experimental conditions of LIBS spectra).
Authors of this work have already carried out previous studies on Aluminum and Vanadium. In order to proceed in a future study the analysis of Ti6Al4V spectra in LIBS experiments, we must first perform a study on Titanium spectra.
There are several experimental and theoretical papers on Ti II published recently due to the importance of titanium and their alloys in industry and astrophysics.
In 2016, using time-resolved laser-induced fluorescence, the experimental radiative lifetimes of six 3d2(3F)5s levels in singly ionized titanium with energy around 63 000 cm-1 and four odd-parity 3d2(3F)4p levels were measured by Lundberg et al. [8]. Combining the new 5s lifetimes with branching fractions measured previously by Pickering et al. [9], also they reported 57 experimental log gf values for transitions from the 5s levels.
In 2022, a very complete theoretical work on the energy levels and transition probabilities for the Ti II ion was published by Alkallas et al. [10]. In addition to the calculations, a compilation of the experimental energy levels of Ti II collected at NIST appears in that paper, which represents a great added value to the contributions of the paper.
There are in the bibliography experimental and theoretical information related to Stark broadening and displacement parameters for lines of Ti II (Hermann et al. [11], TANKOSI’C et al. [12], Sahal-Bréchot et al. [13], Manrique et al. [14] and in the Stark-B database [15]). Unfortunately, in our range of study they have only provided data for 16 lines. The data gap should be compensated with our study.
The objective of this work is, therefore, to provide the broadening and displacement parameters of the profiles of 58 of these spectral lines, ranging between 3075-5418 Å and 9432.15 Å to facilitate their identification and to avoid possible errors and discrepancies.
Using the semiempirical formalism [16],the Stark broadening parameters (line widths and shifts) have been calculated for 58 single ionized titanium spectral lines in this work. As in our work on ionized vanadium [17] we have performed two sets of calculations: some using Gaunt factors provided by [16] and others using those provided [18]. We have also made some experimental measurements that have served to contrast previous experimental data present in the literature and to add a new original experimental value in this work.
In the following sections, we present our experimental measurements, our calculations for final results for the Stark broadening parameters. For the lines of astrophysical interest on which we focus our experimental measurements, we show their Stark broadening parameters versus temperature in a graphical representation. This representation includes the previous calculations, the final calculations and the experimental measurements, both our own and those from the literature.
2. Experimental Setup
Different fluoride-lead-diluted titanium glass samples were prepared in our laboratory. The mixtures were heated at 700 ºC in ceramic crucible in an air atmosphere for 12 h. The glass sample is not prepared with silica due to probably UV radiation silicate absorption.
Fundamental wavelength (1.06 m) of a Q-switched Nd:YAG laser (Quanta-Ray PRO-350 de Spectra-Physics) was focused on these samples in several Laser Induced Breakdown (LIB) experiments,to obtain several spectral lines of single ionized Titanium (including the 3504.89 Å, 3510.83 Å and 3587.13 Å spectral lines), neutral Lead and the H line .The energy per pulse (10 ns width) was measured at the target surface and was found to be 2.5 J. To avoid self-absorption of the titanium spectral lines, the titanium content in the samples was about 0,07% - 0.02%.
A picture of the experimental set-up is shown in Figure 1 and is analogous to the one used by those authors in a recent work [17].
A simple lens(f = 20 cm, biconvex) focuses the laser light on the sample. There is also a vessel with water supply system via hose connection, which provides a confined environment in permanent circulation (used only in LSP experiments) and a programmable 3D positioning system, the sample is over it, which allows us to control the distances between the lens and the sample and thus the spot size. The emission spectra were acquired using a spectrograph (Horiba Jobin Ybon FHR1000) equipped with a CCD camera (Andor,model iStar 334T). This camera’s CCD is bidimensional, 1024x1024 pixels (26x26 m size per pixel) which has allowed us to study the plasma spatially. The camera is time controlled in both gate and delay with a maximum resolution of 100 ns. The spectrometer is equipped with a diffraction grating of 1800 groves/mm and covers a wavelength region from 200 to 700 nm. The emitted light is transferred to the spectrograph through a quartz fiber cable of 0.5 mm diameter. The data were taken by placing the optical fiber in the direction normal to the plasma emission and at a distance of 2 mm from the target surface (where the best signal-to-noise ratio was found). The spectra obtained were stored in a computer for further analysis. The analysis of the spectral lines was performed by fitting the observed line shapes to numerically generated Voigt profiles, which consist of the convolution obtained with the Lorentz and Gauss profiles. The identification of the lines was performed using the NIST Tables (Kramida et al., 2014).
A procedure analogous to the one described in Moreno-Díaz et al. [19] was used to perform plasma diagnostics. Using the Stark width of the H line we estimated the electron density numbers. In Figure 2 we display a sample of the H line.
The following expression 1 (Ashkenazy et al. [20] )was used to obtain the electron number density, Ne, from the width of the H alpha line.
where ■2 is the FWHM (Full Width at Half Maximum) of the line in Å, and is half the width of the reduced Stark profiles in Å, and their precise values can be found in Kepple and Griem [21]. A value between 10 000 and 20 000 K was used (values compatible with the redshift of the line Hα ) to choose the value of from the table included in the above-mentioned paper.
The electron density obtained in our experiments for a delay from the laser pulse of 3 s was (2.31 ± 0.50)·10 cm.
The plasma temperature at the different time windows were determinated from Boltzmann plots using several Pb I lines (see Figure 3) with upper level energies in the range 4.4–6.1 eV and well-known transition probabilities [3]. The resulting temperature before a self-absorption correction at 3.0 s was of (12 500 ± 1 500)K. The self-absorption correction was obtained using the procedure described by [22]. In this procedure we used our experimental lorentzian FWHM for the spectral lines and the experimental Stark broadening parameters of [23].The resulting temperature after a self-absorption correction at 3.0 s was of (11 700 ± 1 500)K.
3. Theoretical Calculations
In the same way of our previous studies, the Stark broadening parameters were calculated using the semiempirical Griem approximation [16]. The procedure involved equations 2 and 3, where Griem incorporated Baranger’s work [24] . The Stark line width (HWHM) and shift, in angular frequency units, were determined using these equations. Initially, the effective Gaunt factors by [25] and van Regemorter [26], denoted as and , were utilized.
Additionally, E and E=3/2 kT represented the hydrogen ionization energy and the perturbing electron’s energy, respectively, with k as the Boltzmann constant. The free electron density and electron temperature were denoted as N and T. The transitions’ initial and final levels were labeled as i and f with i’ and f’ representing the levels of Ti II with optical transitions corresponding to i and f. The energy differences between levels i’ and i and levels f’ and f, were denoted as and , respectively. The expressions of the type are the square of matrix elements of the optical transitions.
To facilitate the spectroscopic use of our results, the conversion of angular frequency obtained in Griem’s expressions into units of wavelength was essential. This conversion was achieved using the equation = /. In this equation, represents the Stark broadening (full-width at half maximum, FWHM), denotes the wavelength, and c stands for the speed of light.
In this study, the matrix elements required for equations 2 and 3 were derived using Cowan’s code [27] based on energy levels from a previous work by Alkallas et al. [10].Since our goal was a good set of matrix elements and not a very tight fit to the experimental energy levels, which is almost always achieved at the cost of worsening the fit of the transition probabilities (or in other words, of the matrix elements), we have used in our calculations a reduced number of configurations and following Cowan’s recommendations we have not forced the fits more than 1 %. We have considered the interaction of seven configurations of even parity namely, 3d-3d4s-3d5s-3d6s-3d4d-3d5d-3d4s and five configurations of odd parity namely, 3d4p-3d5p-3d4f-3d4s4p-3d4s5p.
As in our previous work, we have performed two sets of calculations: the first using Regemorter’s Gaunt factors, the second using for the calculation of these factors the expression 4 and the tables provided by [18].
where I is the ionization energy for level i and the H, r and A values were tabulated by Sampson and Zhang.
4. Discussion
In Table 1 we show our experimental and theoretical values (using Sampson’s Gaunt factors) for the Stark broadening parameters of four spectral lines of Titanium II. In Figure 4 we show an example of our experimental measurements. By simple inspection in Table 1,it can be seen that our values agree well with the experimental results of other authors.
Table 2 presents the results obtained in our calculations using the Gaunt factors provided by Regemorter and Sampson. The second column indicates the wavelength of each line and gives information about the multiplets of these lines Upper and Lower levels. The third column gives the temperatures used in the calculations. In the remaining columns we show, in pm, our theoretical values of the Stark line-widths, compared with the experimental values presented in the bibliography, and normalized at an electron density of 10 cm. It is observed that the calculations with the Gaunt factors of Regemorter differ from the experimental values by a factor between 5 and 7, while the calculations performed with the expression proposed by Sampson and Zhang are very close to the experimental values of [14] (see as an example the lines of 3241.98 and 4443.80Å)and our experimental value for the 3510.83 Å line. For this last line both, experimental and theoretical value, are new in the literature. We believe that this result should be extrapolated to the calculations made for the spectral lines in our study, from 3075.22 to 5418.76 Å, for many of which there are no experimental data.
5. Conclusions
In this work we have performed Stark broadening measurements of 3504.89 and 3510.83 Å spectral line of single ionized titanium which confirmed the previous measurements of 2016 obtained for others authors. Also, we have calculated the Stark broadening parameters, using the procedure suggested by Sampson to obtain the Gaunt factors, of 54 spectral lines of Ti II. In this way we have obtained results very close to the experimental values for 12 of these spectral lines. They have allowed us to assume that the calculations performed for 42 lines ranging between 3075-5419 Å (present in the photospheres of the Sun and the metal-poor star HD 8493), and without experimental information, are accurate using the Gaunt factors proposed by Sampson.
Author Contributions
All authors have participated in all stages of the work.
Funding
This research received no external funding.
Informed Consent Statement
Not applicable.
Data Availability Statement
All data required are available in this paper or in the cited bibliography.
Acknowledgments
Work partly supported by MINECO (Spain; Grants MAT2015–63974-C4–2-R and PID2019–104351GB-C21).
Conflicts of Interest
The authors declare no conflict of interest.
References
- Woosley, S.E.; Weaver, T.A. The Evolution and Explosion of Massive Stars. II. Explosive Hydrodynamics and Nucleosynthesis. apjs 1995, 101, 181. [Google Scholar] [CrossRef]
- Wood, M.P.; Lawler, J.E.; Sneden, C.; Cowan, J.J. IMPROVED Tiii log(gf) VALUES AND ABUNDANCE DETERMINATIONS IN THE PHOTOSPHERES OF THE SUN AND METAL-POOR STAR HD 84937. The Astrophysical Journal Supplement Series 2013, 208, 27. [Google Scholar] [CrossRef]
- Kramida, A.; Ralchenco, Y.; Reader, J. NIST ASD Team (2013) NIST Atomic Spectra Database (v.5.3), 2013. http://physics.nist.gov/asd.
- Yadav, M.; Misra, A.; Malhotra, A.; Kumar, N. Design and analysis of a high-pressure turbine blade in a jet engine using advanced materials. Materials Today: Proceedings 2020, 25, 639–645, 2nd International Conference on Computational and Experimental Methods in Mechanical Engineering. [Google Scholar] [CrossRef]
- Warzanskyj, W.; Angulo, I.; Cordovilla, F.; Díaz, M.; Porro, J.; García-Beltrán, A.; Cabeza, S.; Ocaña, J. Analysis of the thermal stability of residual stresses induced in Ti-6Al-4 V by high density LSP treatments. Journal of Alloys and Compounds 2023, 931, 167530. [Google Scholar] [CrossRef]
- Moayedee, Y.; Nikzad, L.; Fakhraei, O.; Paykar, Z.; Zekavat, E. Improvement of mechanical, biological, and electrochemical properties of Ti6Al4V alloy modified with Nb and Ag for biomedical applications. Journal of Alloys and Compounds 2024, 972, 172736. [Google Scholar] [CrossRef]
- Cowan, J.J.; Sneden, C.; Roederer, I.U.; Lawler, J.E.; Hartog, E.A.D.; Sobeck, J.S.; Boesgaard, A.M. Detailed Iron-peak Element Abundances in Three Very Metal-poor Stars. apj 2020, 890, 119. [Google Scholar] [CrossRef]
- Lundberg, H.; Hartman, H.; Engström, L.; Nilsson, H.; Persson, A.; Palmeri, P.; Quinet, P.; Fivet, V.; Malcheva, G.; Blagoev, K. Oscillator strengths for high-excitation Ti ii from laboratory measurements and calculations. Monthly Notices of the Royal Astronomical Society 2016, 460, 356–362, [https://academic.oup.com/mnras/articlepdf/460/1/356/13772960/stw922.pdf]. [Google Scholar] [CrossRef]
- Pickering, J.C.; Thorne, A.P.; Perez, R. Oscillator Strengths of Transitions in Ti II in the Visible and Ultraviolet regions. The Astrophysical Journal Supplement Series 2001, 132, 403. [Google Scholar] [CrossRef]
- Alkallas, F.H.; Abu El Maati, L.; Ben Nessib, N.; Dimitrijević, M.S. Energy levels of the singly ionized titanium: Ti II ion. Astronomische Nachrichten 2022, 343, e210059, [https://onlinelibrary.wiley.com/doi/pdf/10.1002/asna.20210059].e210059 ASNA.20210059]. [Google Scholar] [CrossRef]
- Hermann, J.; Thomann, A.L.; Boulmer-Leborgne, C.; Dubreuil, B.; De Giorgi, M.L.; Perrone, A.; Luches, A.; Mihailescu, I.N. Plasma diagnostics in pulsed laser TiN layer deposition. Journal of Applied Physics 1995, 77, 2928–2936, [https://pubs.aip.org/aip/jap/article-pdf/77/7/2928/18674760/2928_1_online.pdf]. [Google Scholar] [CrossRef]
- TANKOSI’C, D.; POPOVIC, L.C.; DIMITRIJEVIC, M.S. ELECTRON-IMPACT STARK BROADENING PARAMETERS FOR Ti II AND Ti III SPECTRAL LINES. Atomic Data and Nuclear Data Tables 2001, 77, 277–310. [Google Scholar] [CrossRef]
- Sahal-Bréchot, S.; Dimitrijević, M.S.; Moreau, N.; Nessib, N.B. The STARK-B database VAMDC node: a repository for spectral line broadening and shifts due to collisions with charged particles. Physica Scripta 2015, 90, 054008. [Google Scholar] [CrossRef]
- Manrique, J.; Aguilera, J.A.; Aragón, C. Experimental Stark widths and shifts of Ti ii spectral lines. Monthly Notices of the Royal Astronomical Society 2016, 462, 1501–1507, [https://academic.oup.com/mnras/articlepdf/462/2/1501/13773749/stw1641.pdf]. [Google Scholar] [CrossRef]
- Sahal-Brechot, S.; Dimitrijevic, M.; Nessib, N.B.; Moreau, N. STARK-B, 2020. http://stark-b.obspm.fr/index.php/contact.
- Griem, H.T. Semiempirical formulas for the Electron-Impact widths and shifts of isolated ion lines in plasmas. Physical Review 1968, 165, 258–266. [Google Scholar] [CrossRef]
- de Andrés-García, I.; Isidoro-García, L.; Fernández, F.; Porro, J.; Colón, C. Influence of Gaunt factors on the calculation of the Stark broadening parameters for 56 spectral lines of Vii with high industrial and astrophysical interest. Monthly Notices of the Royal Astronomical Society 2023, 523, 2146–2157, [https://academic.oup.com/mnras/article-pdf/523/2/2146/50503117/stad1555.pdf]. [Google Scholar] [CrossRef]
- Sampson, D.H.; Zhang, H.L. Semiempirical Formulae for Electron Impact Excitation and Ionization of Hydrogenic Ions. apj 1988, 335, 516. [Google Scholar] [CrossRef]
- Moreno-Díaz, C.; Alonso-Medina, A.; Colón, C.; Porro, J.; Ocaña, J. Measurement of plasma electron density generated in an experiment of Laser Shock Processing, utilizing the Halpha-line. Journal of Materials Processing Technology 2016, 232, 9–18. [Google Scholar] [CrossRef]
- Ashkenazy, J.; Kipper, R.; Caner, M. Spectroscopic measurements of electron density of capillary plasma based on Stark broadening of hydrogen lines. Phys. Rev. A 1991, 43, 5568–5574. [Google Scholar] [CrossRef] [PubMed]
- Kepple, P.; Griem, H.R. Improved Stark Profile Calculations for the Hydrogen Lines Hα, Hβ, Hγ, and Hδ. Phys. Rev. 1968, 173, 317–325. [Google Scholar] [CrossRef]
- El Sherbini, A.; El Sherbini, T.; Hegazy, H.; Cristoforetti, G.; Legnaioli, S.; Palleschi, V.; Pardini, L.; Salvetti, A.; Tognoni, E. Evaluation of self-absorption coefficients of aluminum emission lines in laser-induced breakdown spectroscopy measurements. Spectrochimica Acta Part B: Atomic Spectroscopy 2005, 60, 1573–1579. [Google Scholar] [CrossRef]
- Alonso-Medina, A. Experimental determination of the Stark widths of Pb I spectral lines in a laser-induced plasma. Spectrochimica Acta Part B: Atomic Spectroscopy 2008, 63, 598–602. [Google Scholar] [CrossRef]
- Baranger, M. General Impact Theory of Pressure Broadening*. Physical Review 1958, 112, 855–865. [Google Scholar] [CrossRef]
- Seaton, M.J. The Theory of Excitation and Ionization by Electron Impact. In Proceedings of the Atomic and Molecular Processes; Bates, D.R., Ed. 1962. [Google Scholar]
- van Regemorter, H. Rate of Collisional Excitation in Stellar Atmospheres. The Astrophysical Journal 1962, 136, 906. [Google Scholar] [CrossRef]
- Cowan, R. The theory of atomic struture and spectra; University of California Press, 1981; p. 57. [CrossRef]
Figure 1.
Photographic view of the LIB (and LSP) irradiation experimental setup.
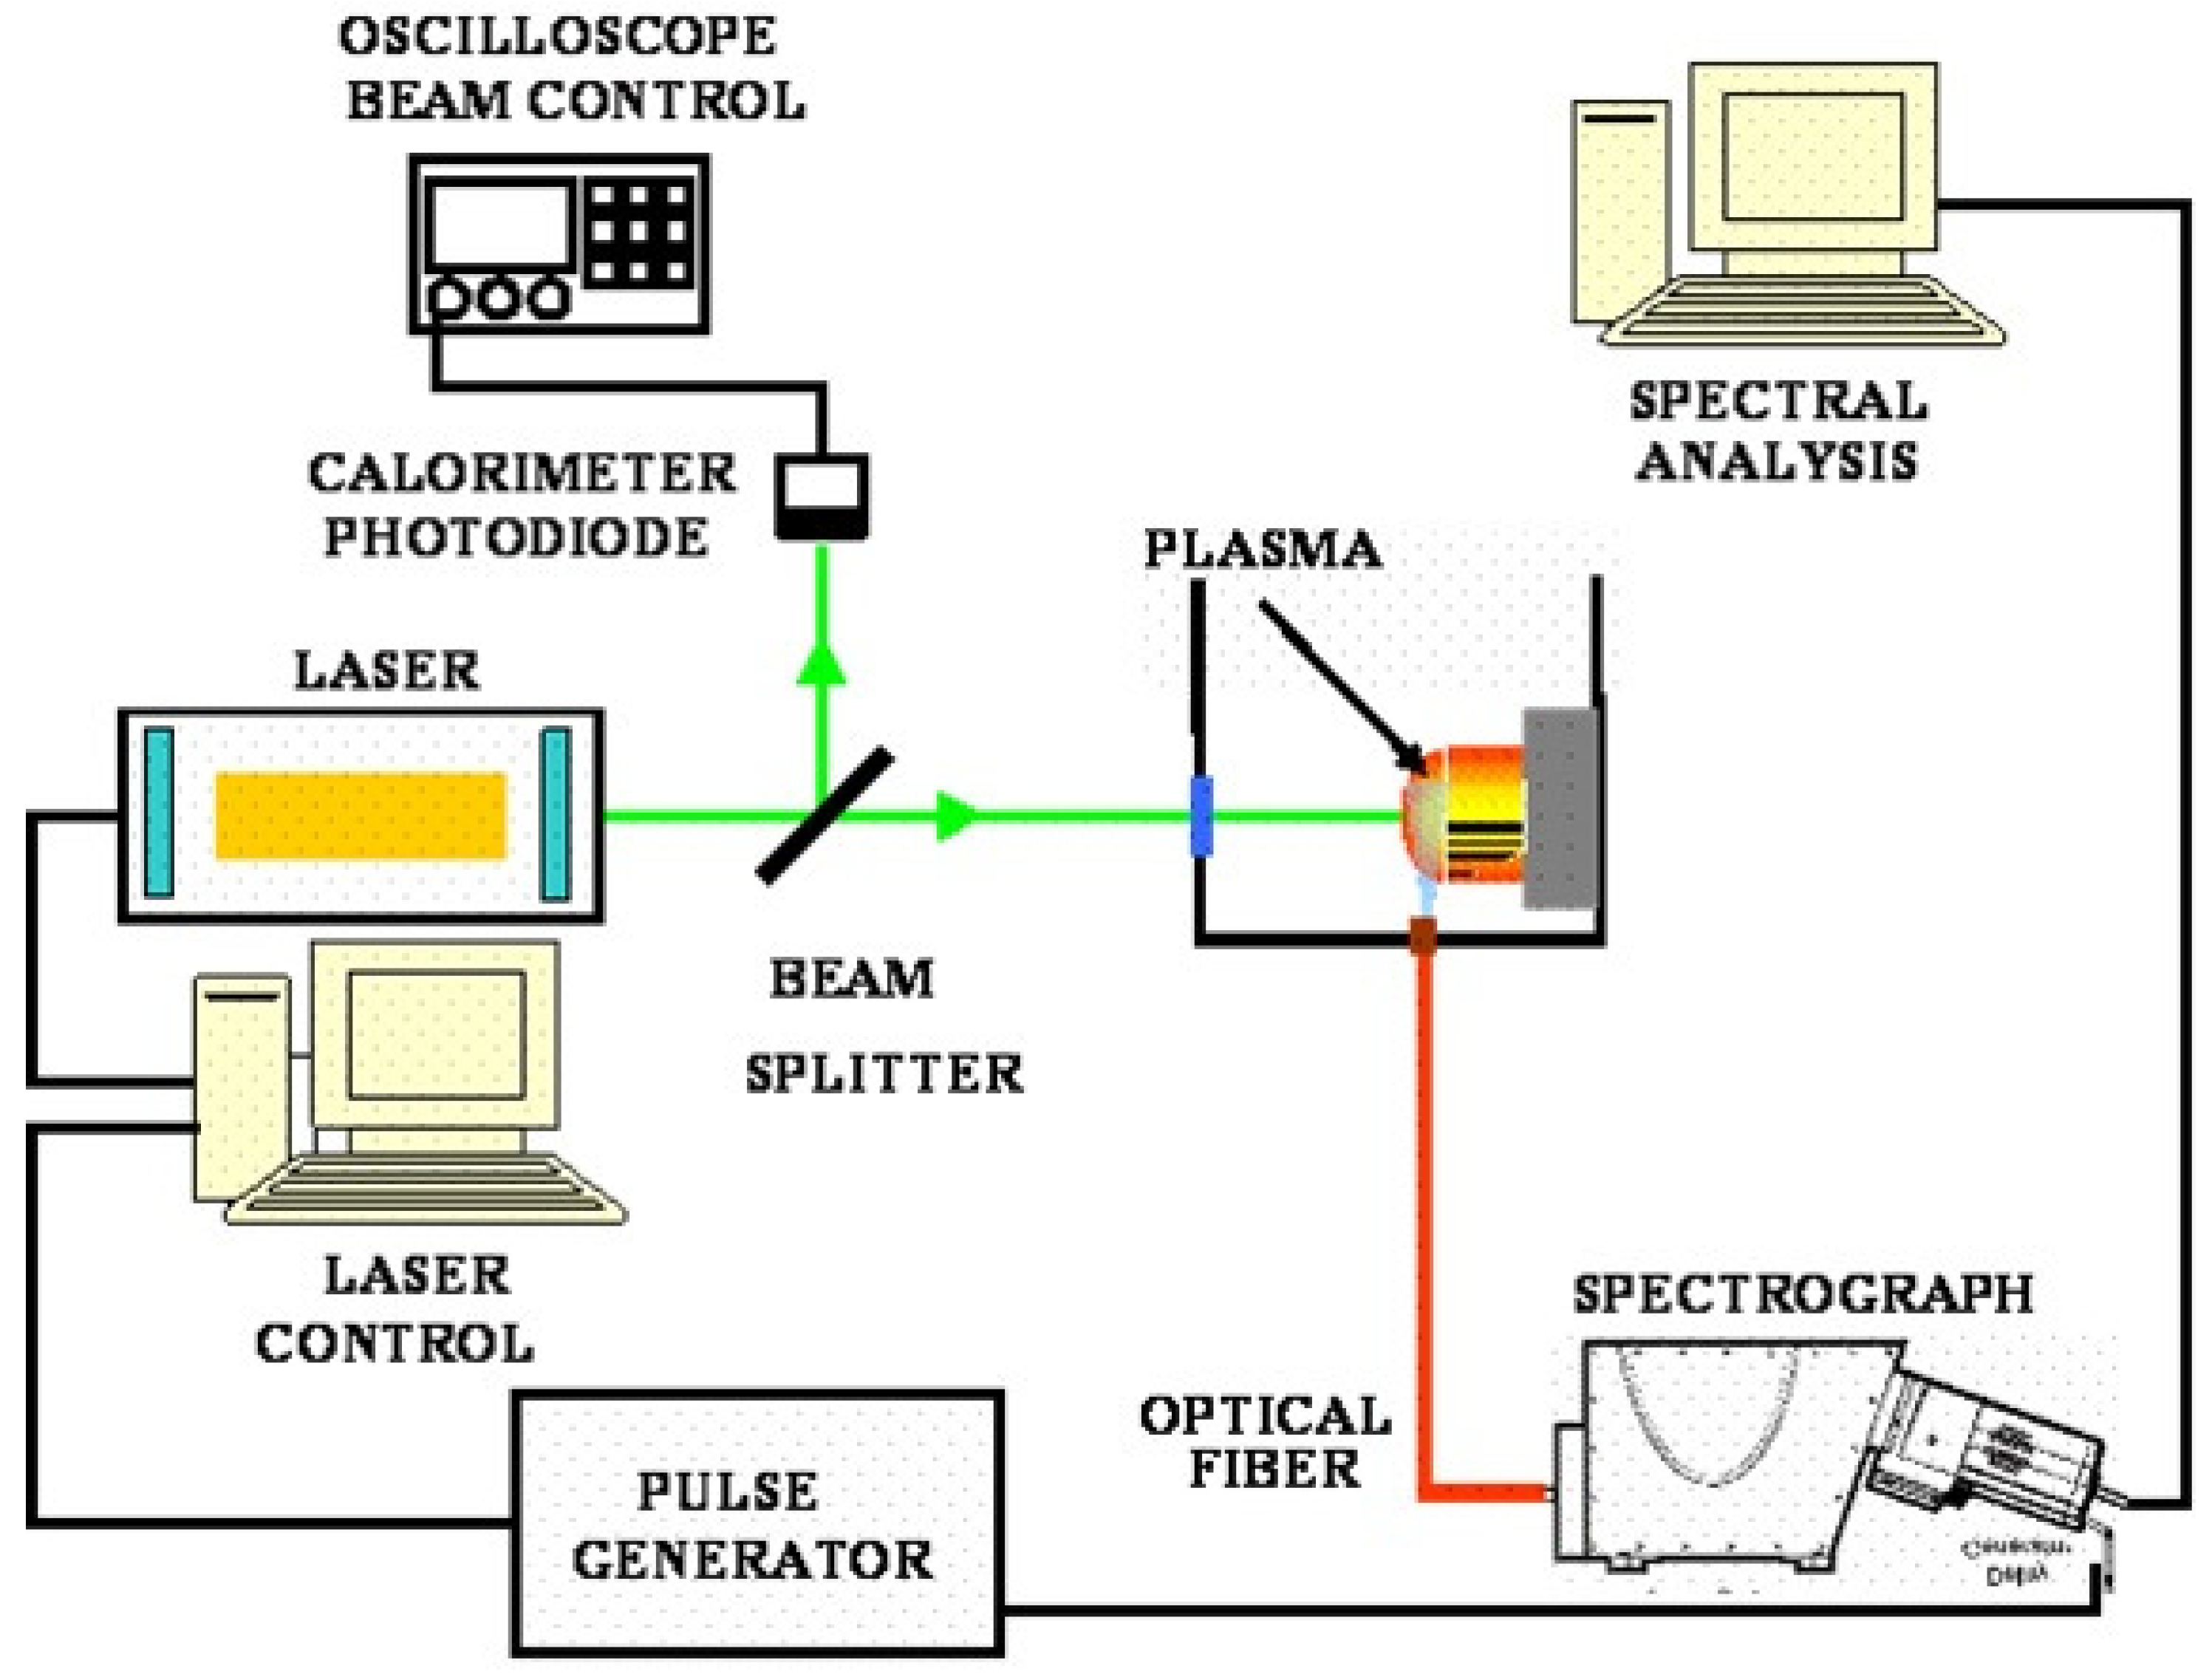
Figure 2.
Fitting of a Voigt profile to the experimental H line emission from the plasma with a gate time of 500 ns at 3 s delay time with a wavelength range from 6530 to 6590 Å.
Figure 2.
Fitting of a Voigt profile to the experimental H line emission from the plasma with a gate time of 500 ns at 3 s delay time with a wavelength range from 6530 to 6590 Å.
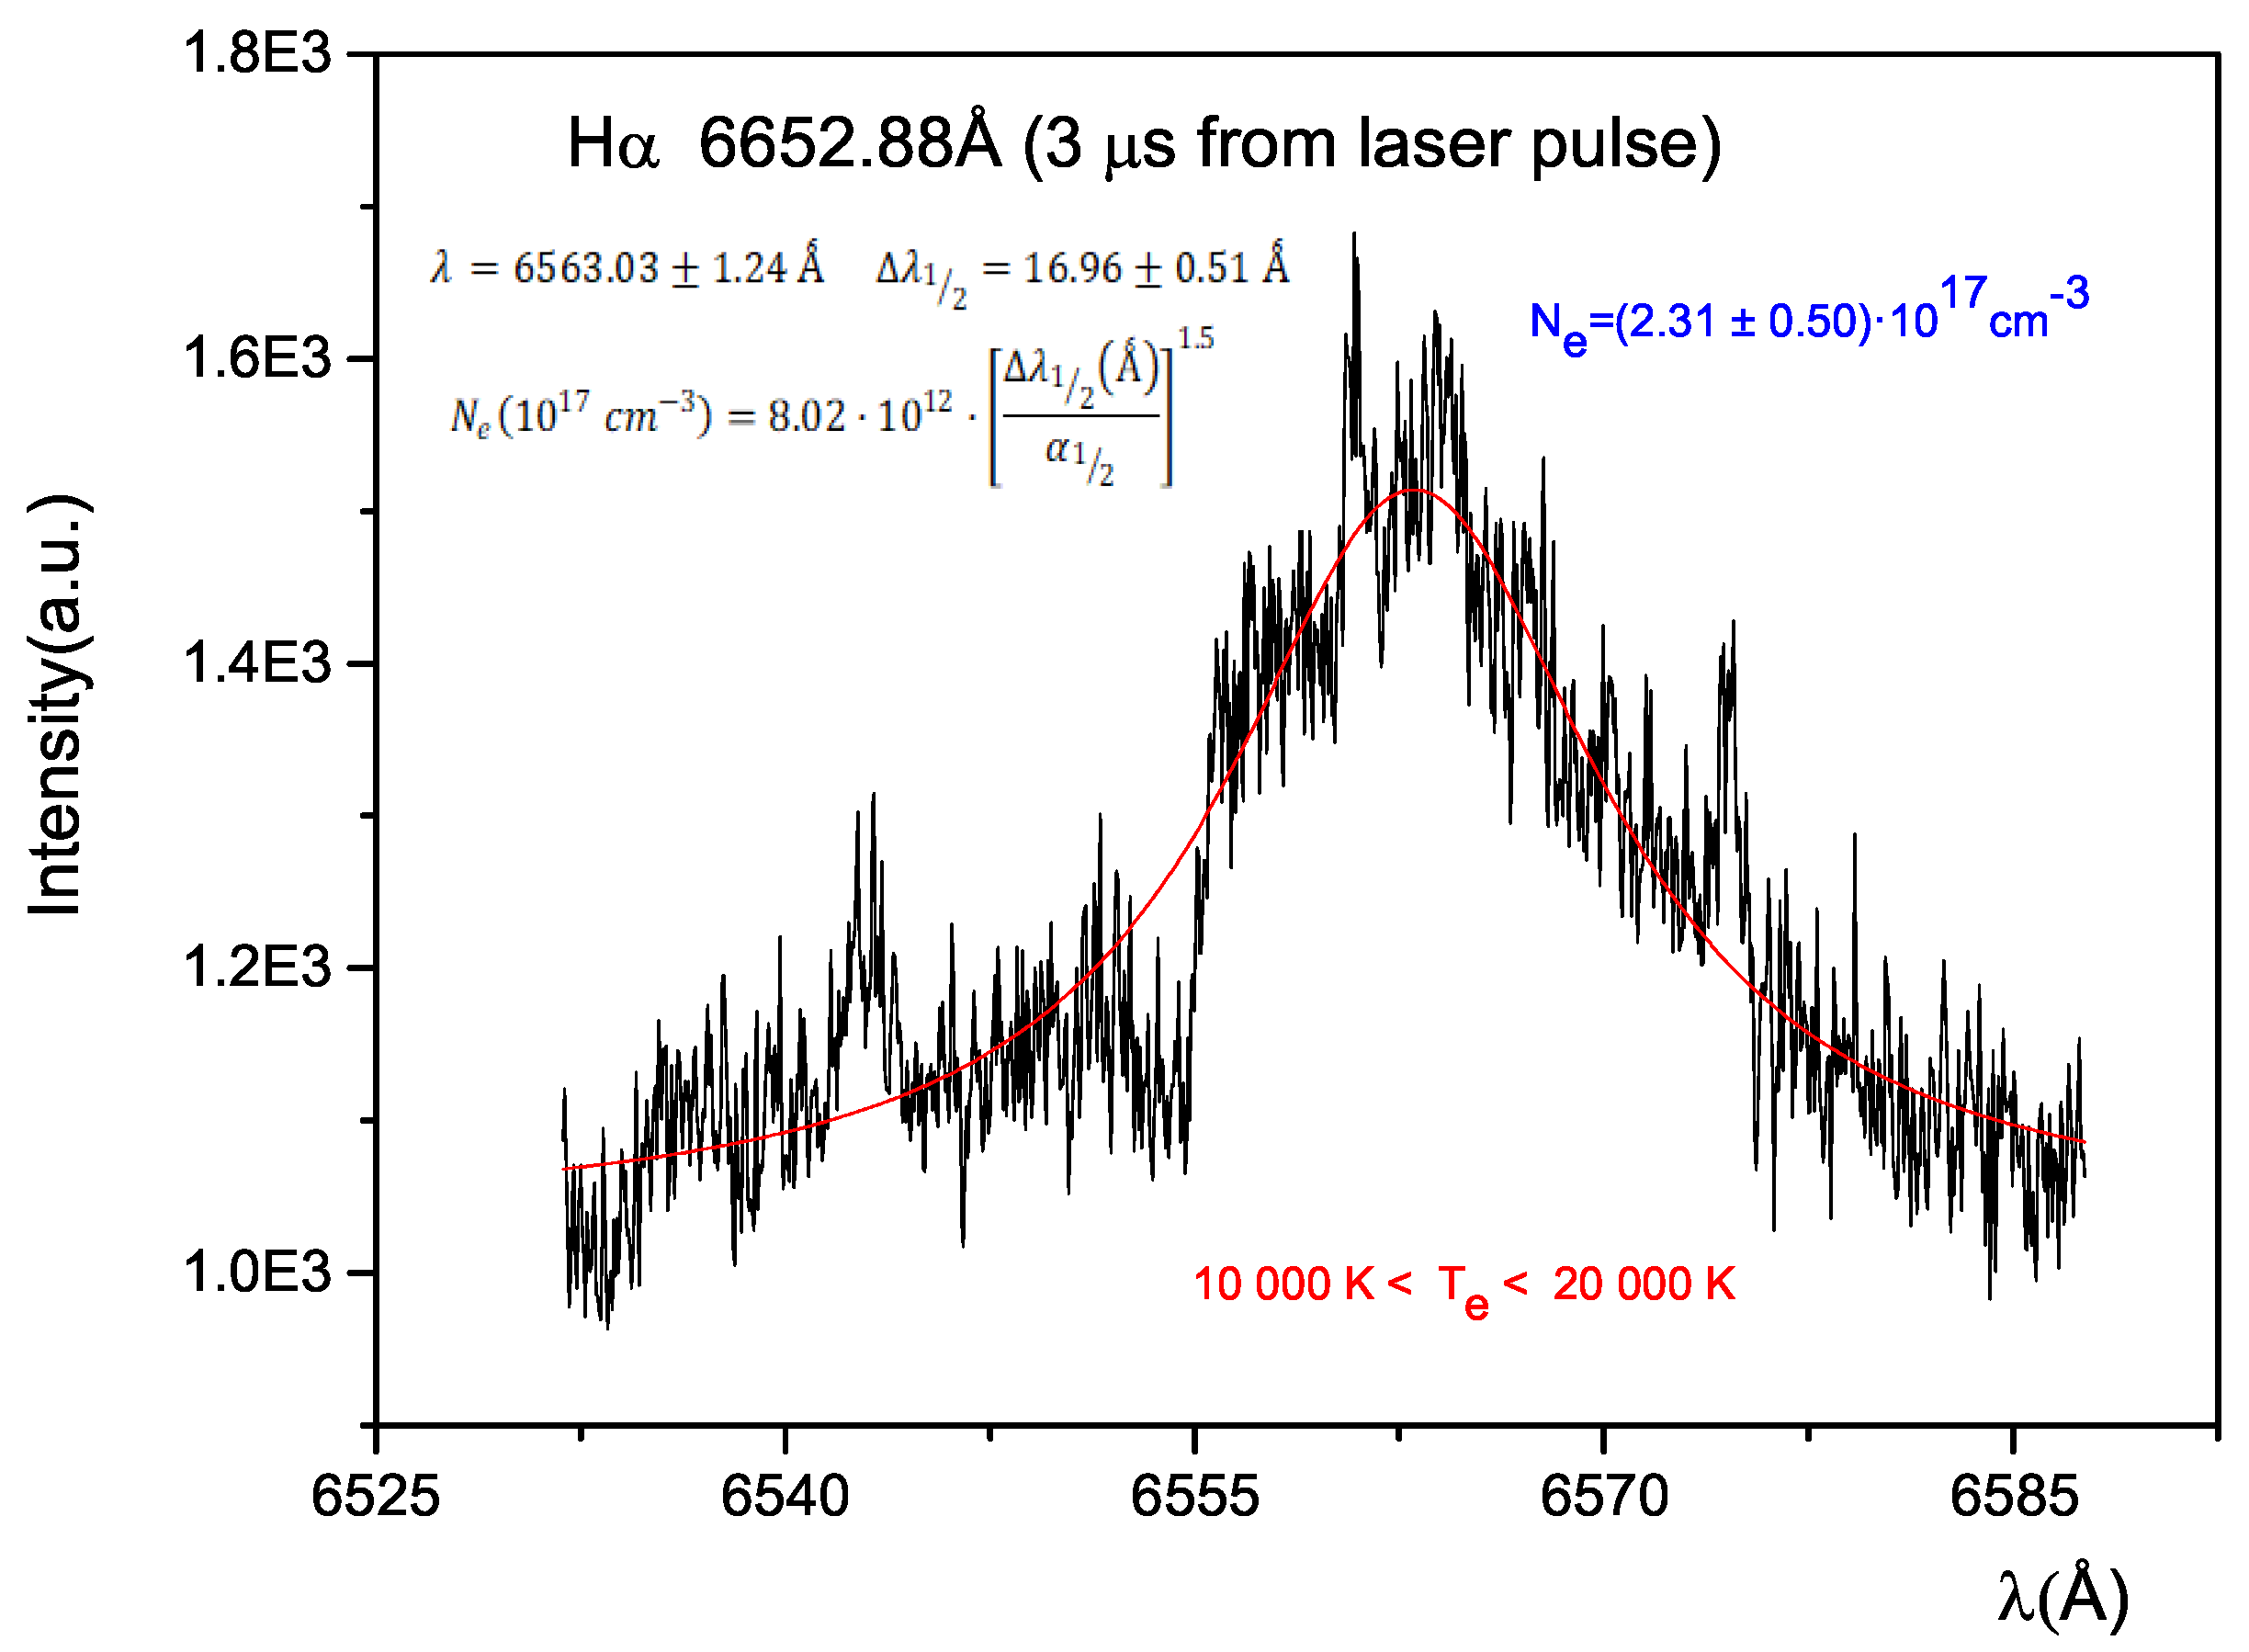
Figure 3.
3a:Spectral emission of Ti Pb sample at 3 s after laser pulse in the 3630 at 3755 Å range. 3b:Plasma temperature, at 3 s after the laser pulse, estimated by a Boltzmann-plot from the lines displayed in Figure 3a.
Figure 3.
3a:Spectral emission of Ti Pb sample at 3 s after laser pulse in the 3630 at 3755 Å range. 3b:Plasma temperature, at 3 s after the laser pulse, estimated by a Boltzmann-plot from the lines displayed in Figure 3a.

Figure 4.
4a:Fitting of a Voigt profile to the experimental 3504.89 and 3510.83 Å emission lines from the plasma with a gate time of 500 ns at 3 s delay time. 4b and 4c Stark width (FWHM)normalized to Ne= 10 cm vs. temperature for 3504.89 and 3510.83 Å spectral lines of single ionized titanium.
Figure 4.
4a:Fitting of a Voigt profile to the experimental 3504.89 and 3510.83 Å emission lines from the plasma with a gate time of 500 ns at 3 s delay time. 4b and 4c Stark width (FWHM)normalized to Ne= 10 cm vs. temperature for 3504.89 and 3510.83 Å spectral lines of single ionized titanium.
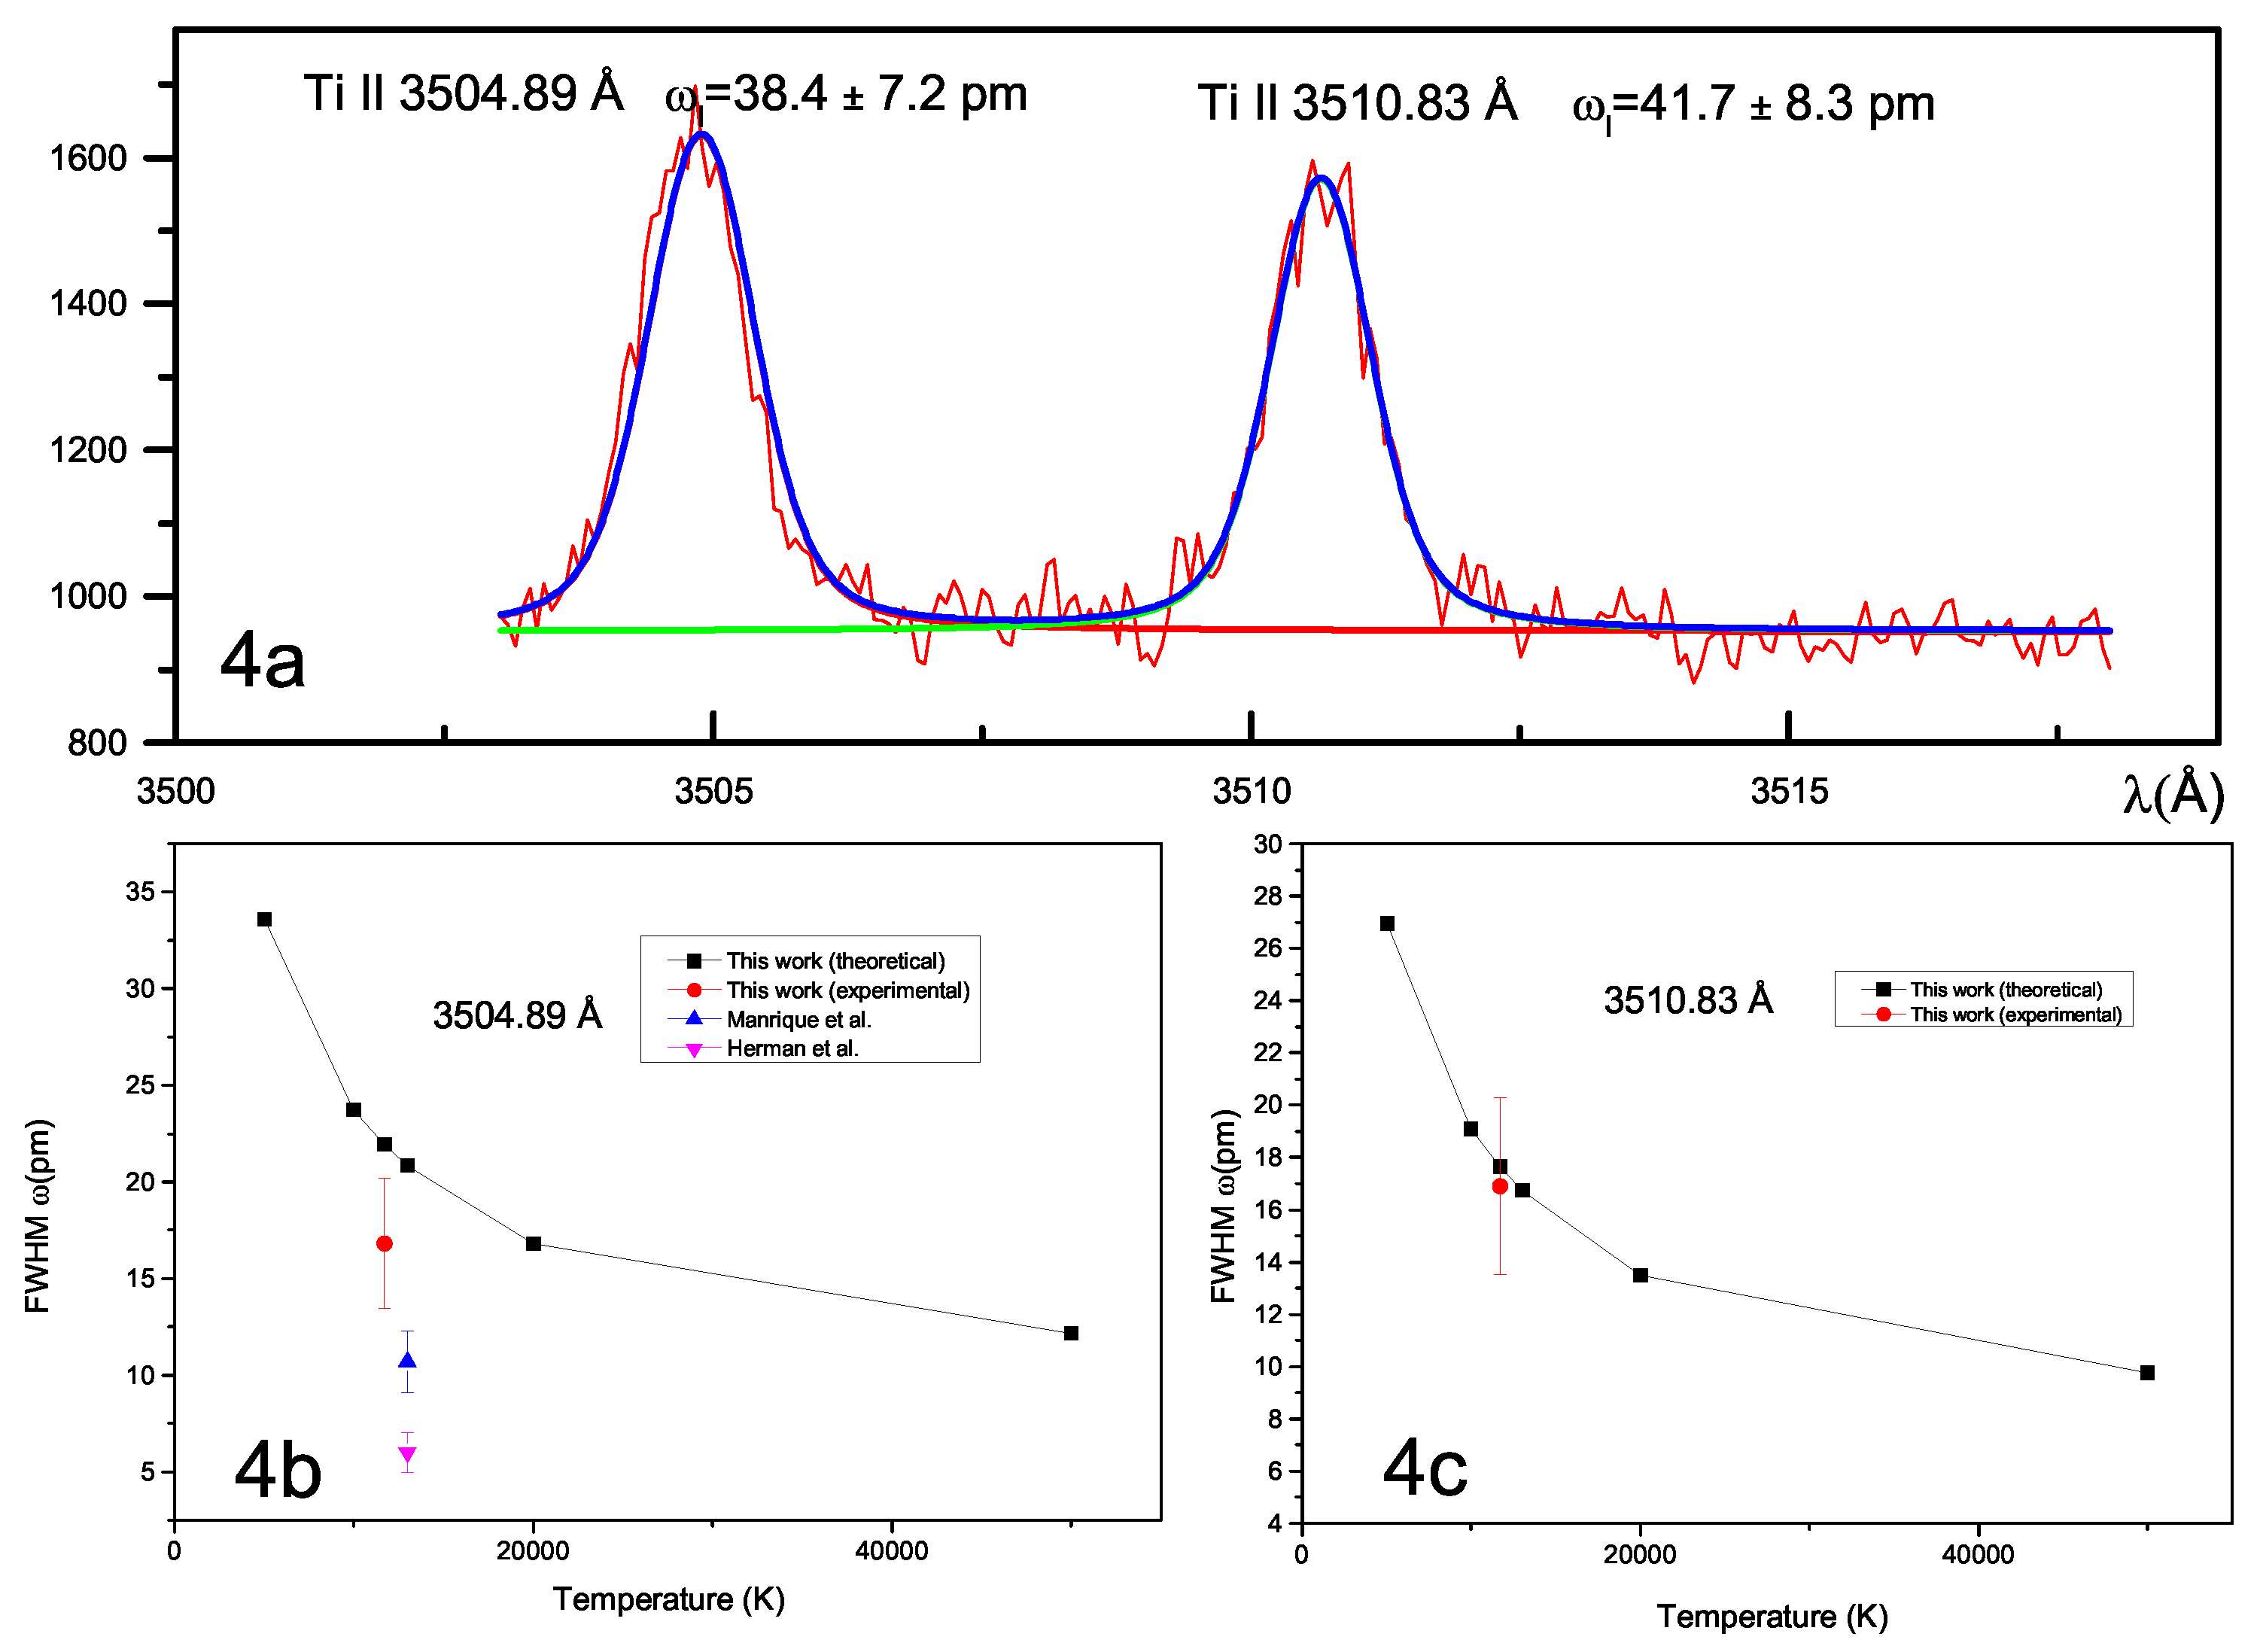

Table 1.
Ti II linewidths (FWHM) and lineshifts, (pm)andd (pm)at 13 000 K, normalized to Ne= 10cm
| Wavelength | Transition Levels | This work | Bibliography | |||||
|---|---|---|---|---|---|---|---|---|
| d | Ref b | Ref c | ||||||
| (Å) | Upper | Lower | d | d | ||||
| 3461.49 | 3d4p | 3d | 13.03 | -3.97 | 10.6±1.6 | 3.6±0.5 | 6±1 | -2±1 |
| 3465.54 | 3d4p | 3d4s | 4.96 | -1.89 | 10.5±1.6 | 0.5±0.1 | ||
| 3504.89 | 3d4p | 3d4s | 20.83 16.8±3.6 | -7.45 | 10.7±1.6 | 0.8±0.1 | 6±1 | 0.4±0.3 |
| 3510.83 | 3d4p | 3d4s | 16.73 16.9±3.8 | -5.99 | ||||
Note. A negative shift is towards the red.a NIST. b Manrique et al. 2016. c Hermann et al. 1995. * Experimental value . ** New in the bibliography. Our experimental and theoretical values for the 3504.89 Åand 3510.83 Ålines are displayed at 11 700 K
Table 2.
Ti II linewidths (FWHM), (pm),normalized to Ne= 10cm.
| Wavelength | T (10K) | (pm) | ||||
|---|---|---|---|---|---|---|
| This work | Bibliography | |||||
| (Å) | Reg | Samp | Ref c | Ref d | ||
| 1 | 3075.22 | 5 | 31.6 | 6.48 | ||
| Upper | 3d4p | 10 | 22.35 | 4.58 | ||
| Lower | 3d4s | 13 | 19.60 | 4.02 | 7.27 | 10.35 |
| 20 | 15.8 | 3.24 | ||||
| 50 | 10.01 | 2.3 | ||||
| 2 | 3202.53 | 5 | 71.97 | 14.75 | ||
| 3d4p | 10 | 50.89 | 10.43 | |||
| 3d4s | 20 | 35.99 | 7.38 | |||
| 50 | 22.7 | 5.41 | ||||
| 3 | 3218.26 | 5 | 81.43 | 16.69 | ||
| 3d4p | 10 | 57.58 | 11.8 | |||
| 3d | 13 | 50.50 | 10.35 | 9.18 | ||
| 20 | 40.72 | 8.34 | ||||
| 50 | 25.89 | 6.96 | ||||
| 4 | 3241.98 | 5 | 55.95 | 11.47 | ||
| 3d4p | 10 | 39.56 | 8.11 | |||
| 3d4s | 13 | 34.7 | 7.11 | 7.74 | 9.95 | |
| 20 | 27.97 | 5.73 | ||||
| 50 | 17.69 | 3.63 | ||||
| 5 | 3276.772 | 5 | 42.19 | 8.65 | ||
| 3d4p | 10 | 29.83 | 6.12 | |||
| 3d | 20 | 21.09 | 4.32 | |||
| 50 | 13.38 | 3.27 | ||||
| 6 | 3276.99 | 5 | 70.48 | 0.1445 | ||
| 3d4p | 10 | 49.83 | 0.1022 | |||
| 3d | 20 | 35.31 | 0.0744 | |||
| 50 | 22 | 0.0777 | ||||
| 7 | 3278.288 | 5 | 56.16 | 0.1151 | ||
| 3d4p | 10 | 39.71 | 0.0814 | |||
| 3d4s | 20 | 28.08 | 0.0576 | |||
| 50 | 17.75 | 0.0375 | ||||
| 8 | 3278.92 | 5 | 66.53 | 13.64 | ||
| 3d4p | 10 | 47.04 | 9.64 | |||
| 3d4s | 20 | 33.27 | 6.82 | |||
| 50 | 21.05 | 4.77 | ||||
| 9 | 3318.023 | 5 | 72.3 | 14.82 | ||
| 3d4p | 10 | 51.13 | 10.48 | |||
| 3d | 13 | 44.84 | 9.19 | 9.21 | ||
| 20 | 36.15 | 7.41 | ||||
| 50 | 22.87 | 4.69 | ||||
| 10 | 3409.808 | 5 | 54.78 | 11.23 | ||
| 3d4p | 10 | 38.74 | 7.94 | 12.0 | ||
| 3d4s | 20 | 27.39 | 5.62 | |||
| 50 | 17.32 | 3.57 | ||||
| 11 | 3452.465 | 5 | 30.2 | 6.19 | ||
| 3d4p | 10 | 21.35 | 4.38 | |||
| 3d4s | 20 | 15.1 | 3.1 | |||
| 50 | 9.68 | 2.67 | ||||
| 12 | 3533.854 | 5 | 64.56 | 13.23 | ||
| 3d4p | 10 | 45.65 | 9.36 | |||
| 3d4s | 20 | 32.28 | 6.62 | |||
| 50 | 20.48 | 6.23 | ||||
| 13 | 3535.407 | 5 | 88.12 | 18.06 | ||
| 3d4p | 10 | 62.31 | 12.77 | |||
| 3d4s | 13 | 54.65 | 11.2 | 12.3 | ||
| 20 | 44.06 | 9.03 | ||||
| 50 | 27.96 | 8.66 | ||||
| 14 | 3561.576 | 5 | 97.22 | 19.93 | ||
| 3d4p | 10 | 68.75 | 14.09 | |||
| 3d4s | 20 | 48.64 | 10.07 | |||
| 50 | 30.43 | 9.26 | ||||
| 15 | 3565.96 | 5 | 26.43 | 5.42 | ||
| 3d4p | 10 | 18.69 | 3.83 | |||
| 3d4p | 20 | 13.22 | 2.71 | |||
| 50 | 8.41 | 2.47 | ||||
| 16 | 3706.21 | 5 | 51.93 | 10.65 | ||
| 3d4p | 10 | 36.72 | 7.53 | |||
| 3d | 13 | 32.21 | 6.6 | 12.9 | ||
| 20 | 25.97 | 5.32 | ||||
| 50 | 16.41 | 4.23 | ||||
| 17 | 3741.638 | 5 | 79.79 | 16.36 | ||
| 3d4p | 10 | 56.42 | 11.57 | |||
| 3d | 20 | 39.9 | 8.18 | |||
| 50 | 25.22 | 6.49 | ||||
| 18 | 4307.866 | 5 | 71.71 | 14.7 | ||
| 3d4p | 10 | 50.71 | 10.4 | |||
| 3d | 13 | 44.47 | 9.12 | 14.9 | ||
| 20 | 35.86 | 7.35 | ||||
| 50 | 22.76 | 5.79 | ||||
| 19 | 4316.794 | 5 | 44.46 | 9.12 | ||
| 3d4p | 10 | 31.44 | 6.45 | |||
| 3d4s | 20 | 22.23 | 4.56 | |||
| 50 | 14.1 | 3.3 | ||||
| 20 | 4320.95 | 5 | 41.27 | 8.46 | ||
| 3d4p | 10 | 29.18 | 5.98 | |||
| 3d | 20 | 20.64 | 4.23 | |||
| 50 | 13.1 | 3.51 | ||||
| 21 | 4330.238 | 5 | 73.43 | 15.05 | ||
| 3d4p | 10 | 51.92 | 10.64 | |||
| 3d4s | 20 | 36.72 | 7.53 | |||
| 50 | 23.09 | 5.74 | ||||
| 22 | 4337.91 | 5 | 35.39 | 19.95 | ||
| 3d4p | 10 | 25.03 | 14.11 | |||
| 3d4s | 20 | 17.7 | 10.16 | |||
| 50 | 11.18 | 7.73 | ||||
| 23 | 4421.938 | 5 | 65.3 | 13.39 | ||
| 3d4p | 10 | 46.17 | 9.47 | |||
| 3d4s | 20 | 32.65 | 6.69 | |||
| 50 | 20.7 | 4.45 | ||||
| 24 | 4443.801 | 5 | 134.04 | 27.48 | ||
| 3d4p | 10 | 94.78 | 19.43 | |||
| 3d4s | 13 | 83.1 | 17.19 | 16.3 | ||
| 20 | 67.09 | 13.98 | ||||
| 50 | 41.92 | 13.51 | ||||
| 25 | 4444.554 | 5 | 146.89 | 30.12 | ||
| 3d4p | 10 | 103.87 | 21.29 | |||
| 3d | 20 | 73.56 | 15.46 | |||
| 50 | 45.84 | 16.54 | ||||
| 26 | 4450.482 | 5 | 153.61 | 31.49 | ||
| 3d4p | 10 | 108.62 | 22.27 | |||
| 3d4s | 20 | 76.88 | 15.99 | |||
| 50 | 48.1 | 14.98 | ||||
| 27 | 4468.492 | 5 | 131.05 | 26.86 | ||
| 3d4p | 10 | 92.67 | 19 | |||
| 3d | 20 | 65.64 | 13.84 | |||
| 50 | 40.9 | 14.45 | ||||
| 28 | 4469.151 | 5 | 188.07 | 38.55 | ||
| 3d4p | 10 | 132.98 | 27.26 | |||
| 3d4s | 20 | 94.03 | 19.28 | |||
| 50 | 59.44 | 12.83 | ||||
| 29 | 4488.324 | 5 | 216.77 | 44.44 | ||
| 3d4p | 10 | 153.28 | 31.42 | |||
| 3d4s | 20 | 108.59 | 22.87 | |||
| 50 | 69.46 | 18.08 | ||||
| 30 | 4501.26 | 5 | 117.09 | 24 | ||
| 3d4p | 10 | 82.8 | 16.97 | |||
| 3d | 13 | 72.6 | 15.04 | 18.6 | ||
| 20 | 58.62 | 12.25 | ||||
| 50 | 36.5 | 13.25 | ||||
| 31 | 4518.332 | 5 | 105.42 | 21.61 | ||
| 3d4p | 10 | 74.54 | 15.28 | |||
| 3d4s | 20 | 52.71 | 10.81 | |||
| 50 | 33.32 | 7.29 | ||||
| 32 | 4533.96 | 5 | 113.23 | 23.21 | ||
| 3d4p | 10 | 80.07 | 16.41 | |||
| 3d | 20 | 56.65 | 11.76 | |||
| 50 | 35.74 | 10.44 | ||||
| 33 | 4545.133 | 5 | 158.28 | 32.45 | ||
| 3d4p | 10 | 111.92 | 22.94 | |||
| 3d | 20 | 79.14 | 16.23 | |||
| 50 | 49.96 | 11.77 | ||||
| 34 | 4549.22 | 5 | 214.83 | 44.04 | ||
| 3d4p | 10 | 151.91 | 31.14 | |||
| 3d | 13 | 133.23 | 27.31 | 19.6 | ||
| 20 | 107.41 | 22.02 | ||||
| 50 | 68.5 | 18.93 | ||||
| 35 | 4563.76 | 5 | 74.22 | 15.21 | ||
| 3d4p | 10 | 52.48 | 10.76 | |||
| 3d | 13 | 46.03 | 9.44 | 16.5 | ||
| 20 | 37.15 | 7.81 | ||||
| 50 | 23.76 | 6.29 | ||||
| 36 | 4571.97 | 5 | 174.49 | 35.77 | ||
| 3d4pGº | 10 | 123.38 | 25.3 | |||
| 3d | 13 | 108.21 | 22.18 | 18.7 | ||
| 20 | 87.24 | 17.88 | ||||
| 50 | 55.67 | 15.42 | ||||
| 37 | 4583.409 | 5 | 114.06 | 23.38 | ||
| 3d4pFº | 10 | 80.65 | 16.53 | |||
| 3d | 20 | 57.1 | 11.95 | |||
| 50 | 35.63 | 12.79 | ||||
| 38 | 4589.94 | 5 | 80.37 | 16.47 | ||
| 3d4pDº | 10 | 56.83 | 11.65 | |||
| 3d | 20 | 40.22 | 8.45 | |||
| 50 | 25.73 | 7.07 | ||||
| 39 | 4779.97 | 5 | 51.88 | 10.64 | ||
| 3d4pSº | 10 | 36.68 | 7.52 | |||
| 3d4s | 20 | 25.94 | 5.32 | |||
| 50 | 16.44 | 4.27 | ||||
| 40 | 4805.09 | 5 | 68.9 | 14.12 | ||
| 3d4pSº | 10 | 48.72 | 9.99 | |||
| 3d4s | 20 | 34.45 | 7.06 | |||
| 50 | 21.84 | 5.68 | ||||
| 41 | 4865.61 | 5 | 132.2 | 27.1 | ||
| 3d4pGº | 10 | 93.48 | 19.16 | |||
| 3d | 20 | 66.1 | 13.55 | |||
| 50 | 41.73 | 9.96 | ||||
| 42 | 4874.009 | 5 | 108.34 | 22.21 | ||
| 3d4pPº | 10 | 76.61 | 15.7 | |||
| 3d4s | 20 | 54.31 | 11.55 | |||
| 50 | 34.98 | 10.03 | ||||
| 43 | 4911.194 | 5 | 186.64 | 38.26 | ||
| 3d4pPº | 10 | 131.98 | 27.06 | |||
| 3d4s | 20 | 93.57 | 19.92 | |||
| 50 | 60.41 | 17.52 | ||||
| 44 | 5005.167 | 5 | 98.23 | 20.14 | ||
| 3d4p | 10 | 69.46 | 14.24 | |||
| 3dDº | 20 | 49.11 | 10.07 | |||
| 50 | 31.27 | 7.68 | ||||
| 45 | 5069.09 | 5 | 201.31 | 41.27 | ||
| 3d4pDº | 10 | 142.35 | 29.18 | |||
| 3d4s | 20 | 100.92 | 21.48 | |||
| 50 | 64.68 | 19.91 | ||||
| 46 | 5072.286 | 5 | 249.94 | 51.24 | ||
| 3d4pDº | 10 | 176.74 | 36.23 | |||
| 3d4s | 20 | 125.24 | 26.46 | |||
| 50 | 80.11 | 24.93 | ||||
| 47 | 5154.06 | 5 | 147.29 | 30.2 | ||
| 3d4pDº | 10 | 104.15 | 21.35 | |||
| 3d | 20 | 73.71 | 15.33 | |||
| 50 | 47.11 | 12.01 | ||||
| 48 | 5185.902 | 5 | 300.11 | 61.52 | ||
| 3d4p | 10 | 212.21 | 43.5 | |||
| 3d4s | 20 | 150.06 | 30.77 | |||
| 50 | 95.23 | 23.05 | ||||
| 49 | 5188.68 | 5 | 156.63 | 32.11 | ||
| 3d4p | 10 | 110.75 | 22.7 | |||
| 3d | 20 | 78.38 | 16.29 | |||
| 50 | 50.14 | 12.94 | ||||
| 50 | 5226.54 | 5 | 105.75 | 21.68 | ||
| 3d4p | 10 | 74.77 | 15.33 | |||
| 3d | 20 | 52.93 | 11.11 | |||
| 50 | 33.96 | 9.01 | ||||
| 51 | 5336.786 | 5 | 211.2 | 43.3 | ||
| 3d4pFº | 10 | 149.34 | 30.62 | |||
| 3d | 20 | 105.77 | 22.22 | |||
| 50 | 66.26 | 23.2 | ||||
| 52 | 5381.022 | 5 | 158.84 | 32.56 | ||
| 3d4pFº | 10 | 112.32 | 23.03 | |||
| 3d | 20 | 79.53 | 16.64 | |||
| 50 | 49.75 | 17.46 | ||||
| 53 | 5418.768 | 5 | 169.1 | 34.66 | ||
| 3d4pFº | 10 | 119.57 | 24.51 | |||
| 3d | 20 | 84.65 | 17.69 | |||
| 50 | 53.06 | 18.55 | ||||
| 54 | 9432.151 | 5 | 667.96 | 136.94 | ||
| 3d4pFº | 10 | 472.32 | 96.83 | |||
| 3d | 20 | 334.46 | 70.59 | |||
| 50 | 209.25 | 80 | ||||
Note. A negative shift is towards the red. a NIST. b Line of Ti II in the Sun. c Manrique et al. 2016. d Tankosić et al. 2001.
Disclaimer/Publisher’s Note: The statements, opinions and data contained in all publications are solely those of the individual author(s) and contributor(s) and not of MDPI and/or the editor(s). MDPI and/or the editor(s) disclaim responsibility for any injury to people or property resulting from any ideas, methods, instructions or products referred to in the content. |
© 2024 by the authors. Licensee MDPI, Basel, Switzerland. This article is an open access article distributed under the terms and conditions of the Creative Commons Attribution (CC BY) license (http://creativecommons.org/licenses/by/4.0/).
Copyright: This open access article is published under a Creative Commons CC BY 4.0 license, which permit the free download, distribution, and reuse, provided that the author and preprint are cited in any reuse.


