1. Introduction
Wearable technologies have seen significant advances and development in recent years for health and well-being purposes enabling the creation of personalised medicine and assistance platforms [
1]. Using wearable technologies for individual health monitoring has garnered the attention of not only clinicians but that of the wider public who want to have access to increased knowledge and awareness of their own medical status. An important enabler for these possibilities is the capability of human biomarkers to be detected more effectively and with as little impact to the individual as possible [
2]. Continuous biomarker monitoring is known for providing significant insight into long-term and current health status of an individual [
3,
4]. Technologies focused on biomarkers have been developed to gather and process data, monitor actions, and then tailor the experiences to meet the needs of the users depending on the obtained and recorded data [
5]. The current value of the global wearable technologies market is 61.30 billion USD and expected to grow exponentially at a compound annual growth rate (CAGR) of 14.6% from 2023 to 2030 [
6].
The vital signs of an individual are one of the most significant measures of the health of a human. A change in heart rate, temperature or respiration rate can signify a potentially significant health issue and these are therefore carefully monitored in point of care (POC) environments [
7]. However, as people become ever more health conscious the requirement to be able to measure these signs in a day-to-day manner has increased leading to the introduction of smart monitoring systems that not only measure these vital signs but also track any changes over time [
8]. Early iterations of this technology were primarily used within physical activity monitoring. Their usage has gained popularity and their functionality improved as increased focus research/development was put into this area [
9]. These technologies have grown in accessibility and affordability in recent times and their functionality variability has progressed since their introduction to the health monitoring markets. Smaller and more sensitive components have made it feasible to create more compact accessories, that were before harder if not impossible to achieve [
5].
Whilst these vital signs are relatively easy to measure, they provide little information on the underlying cause for an elevation, reduction or overall tracked change in these levels, meaning that further investigation is always required to identify the route cause. This either involves taking scans of the body (X-ray, CT, MRI, etc) or samples of bodily fluids with blood samples being the most common. Blood samples can provide additional information on blood glucose levels, cholesterol, inflammation [
10] markers all of which are identifiable by the levels of biomarkers present in the sample [
11,
12]. As blood tests require an invasive sampling method these tend to have to be performed in a healthcare setting with the sample being sent to laboratories for the specific testing required. This means that cold chain movement of the samples can be required, increasing overall costs of performing the tests as well as a sometimes-significant waiting time for results to reach the patient. Blood glucose measurements are however an exception to this where devices to both take a sample and read the glucose level have been developed and are widely used by patients within their own homes.
Biomarkers can also be identified in other forms of bio-fluids such as saliva, urine and sweat the collection of which are classified as non-invasive methodologies for obtaining a sample[
2]. Non-invasive methods have their advantages as they address the issue of patient comfort, however the types of biomarkers present within the sample type varies and is generally at a lower level than the biomarkers present in blood samples, requiring tests with lower detection limits [
13] or a higher sample volume [
14]. Sample contamination is another problem that these sample types encounter as they are more susceptible to contact with external contaminants. Salivary samples are generally contaminated by food or drink consumed by the individual but the samples can also be contaminated by the prior cleaning procedure with things such as mouthwash [
15]. Sweat can be obtained more readily from a range of non-invasive ways at areas of high concentration of sweat glands or via iontophoresis [
16] and is suitable for continuous monitoring [
2,
17,
18] but is still susceptible to contamination via biofouling [
19]. In 2012, Moyer
et al. [
20] performed a study which showed the correlation between glucose measurements taken from capillary blood and those measured in sweat. Sweat sensing has also been effectively demonstrated using electrochemical sensors operating usually in amperometric, potentiometric and voltammetric modalities using electrodes and via electrical connection to the electrodes [
21]. The electrodes can be in various form factors and an effective way to increase the sensitive area of an electrode is by using interdigitated electrodes. Devices using these electrodes are called interdigitated transducer (IDT) enabling various detection modalities including capacitive and acoustomechanical sensing techniques [
22,
23].
In order for the measurement of biomarkers to become part of everyday life, tracking the change in the levels of biomarkers has to be done in a continuous manner which inevitably requires the use of a non-invasive technique which ideally could be performed with little input from the user [
1,
2,
16]. Wearable technologies have been widely used for many years in the form of smart watches/devices to monitor vital signs and have more recently expanded to perform an invasive measurement of insulin for diabetic patients. The first wearable sensor to measure a biomarker was created to measure lactate levels via electrochemical tattoo which was capable of performing real-time measurements [
24]. However, the sensor surface required functionalisation to be specifically sensitive to this biomarker. The method of functionalisation depends on the specific biomarker that is being targeted and can therefore make a sensor specific to a certain measurement.
The breadth of modalities and form factors for wearable devices has been increasing including emergence of fabric-based sensors as potential progression pathway for wearable technologies in the future and reducing some of the barriers to implementation [
18,
25]. Embroidered sensors could be advantageous as this would allow for seamless integration into any item of clothing, offering a unique approach to capturing personal data without disrupting a person’s usual routine [
26,
27]. Thread based multiplexing sweat sensors [
28], fibre [
29] and gold woven sensors [
30] have been shown to detect targeted biomarkers each method providing two different methodologies to apply the sensing material to fabrics and clothing.
The requirement of these measurements to also be performed wirelessly and to seamlessly integrate with current technologies is also an increasing demand [
16]. Wireless sensing opportunities have been demonstrated using IDTs coupled with external antenna structures [
31,
32], however the reading and transfer of data can require large items of equipment which is not suitable for all application spaces. In an extreme environment such as space, the desert or deep underwater the tracking of an individuals overall health becomes ever more important but more difficult to monitor. Environmental factors such as extreme cold, immense hyperbaric pressure or submersion in water, can not only pose challenges for effective measurements [
33] but can also add communication issues between the measurement device and the system to process this.
In this work, embroidered fabric-based IDT sensors have been investigated for droplet sensing applications. The sensor was manufactured using unique embroidery techniques with different combinations of threads and the subsequent IDT frequency response monitored with an external antenna for non-contact wireless measurements. Changes in frequency were measured in the presence of pure de-ionised (DI) water and for increasing levels of glucose concentration providing a feasibility path for the detection of glucose present within human sweat. The results demonstrate the effectiveness of a wireless sensing mechanism for embroidered IDT-based sensors. The structures have been systematically investigated for their coupling with external antennas for measuring liquid droplets. These will be followed by investigation of added functionalities for sampling and data interpretation towards a sweat analysis platform.
2. Materials and Methods
In order to produce a flexible fabric-based sensor, an IDT design is embroidered onto Calico fabric (Brother Entrepreneur Pro-X PR1050X). The IDT consists of two different types of thread; a standard Brother polyester thread (135 dtex/2), which is wound onto the top spool, and a silver coated liquid crystal polymer fibre (Liberator Kururay Vectran) which is run through the bottom bobbin. Having the threads in this configuration allows the thread tensions to be varied. The Calico was made inflexible through the embroidery process by using a tearaway stabiliser to ensure the distortion of the design is minimised. The silver thread has to be coated with a layer of gold to provide the correct structure onto which specific sensing chemicals can be attached. 100 nm of gold was thermally evaporated at a base pressure of mbar in a Leybold Univex 250 thermal evaporation system. Gold was purchased from Testbourne Ltd., Hampshire, UK at a purity of %. The tearaway stabiliser acted as a shadow mask, ensuring that only the silver threaded area and not the Calico base was coated. The stabiliser can then be easily removed from the sensor for testing.
Precoated gold thread (Swicogold, Swicofil AG, Emmenbrucke, Switzerland) was also investigated as a thread option to eliminate the need for post gold coating.
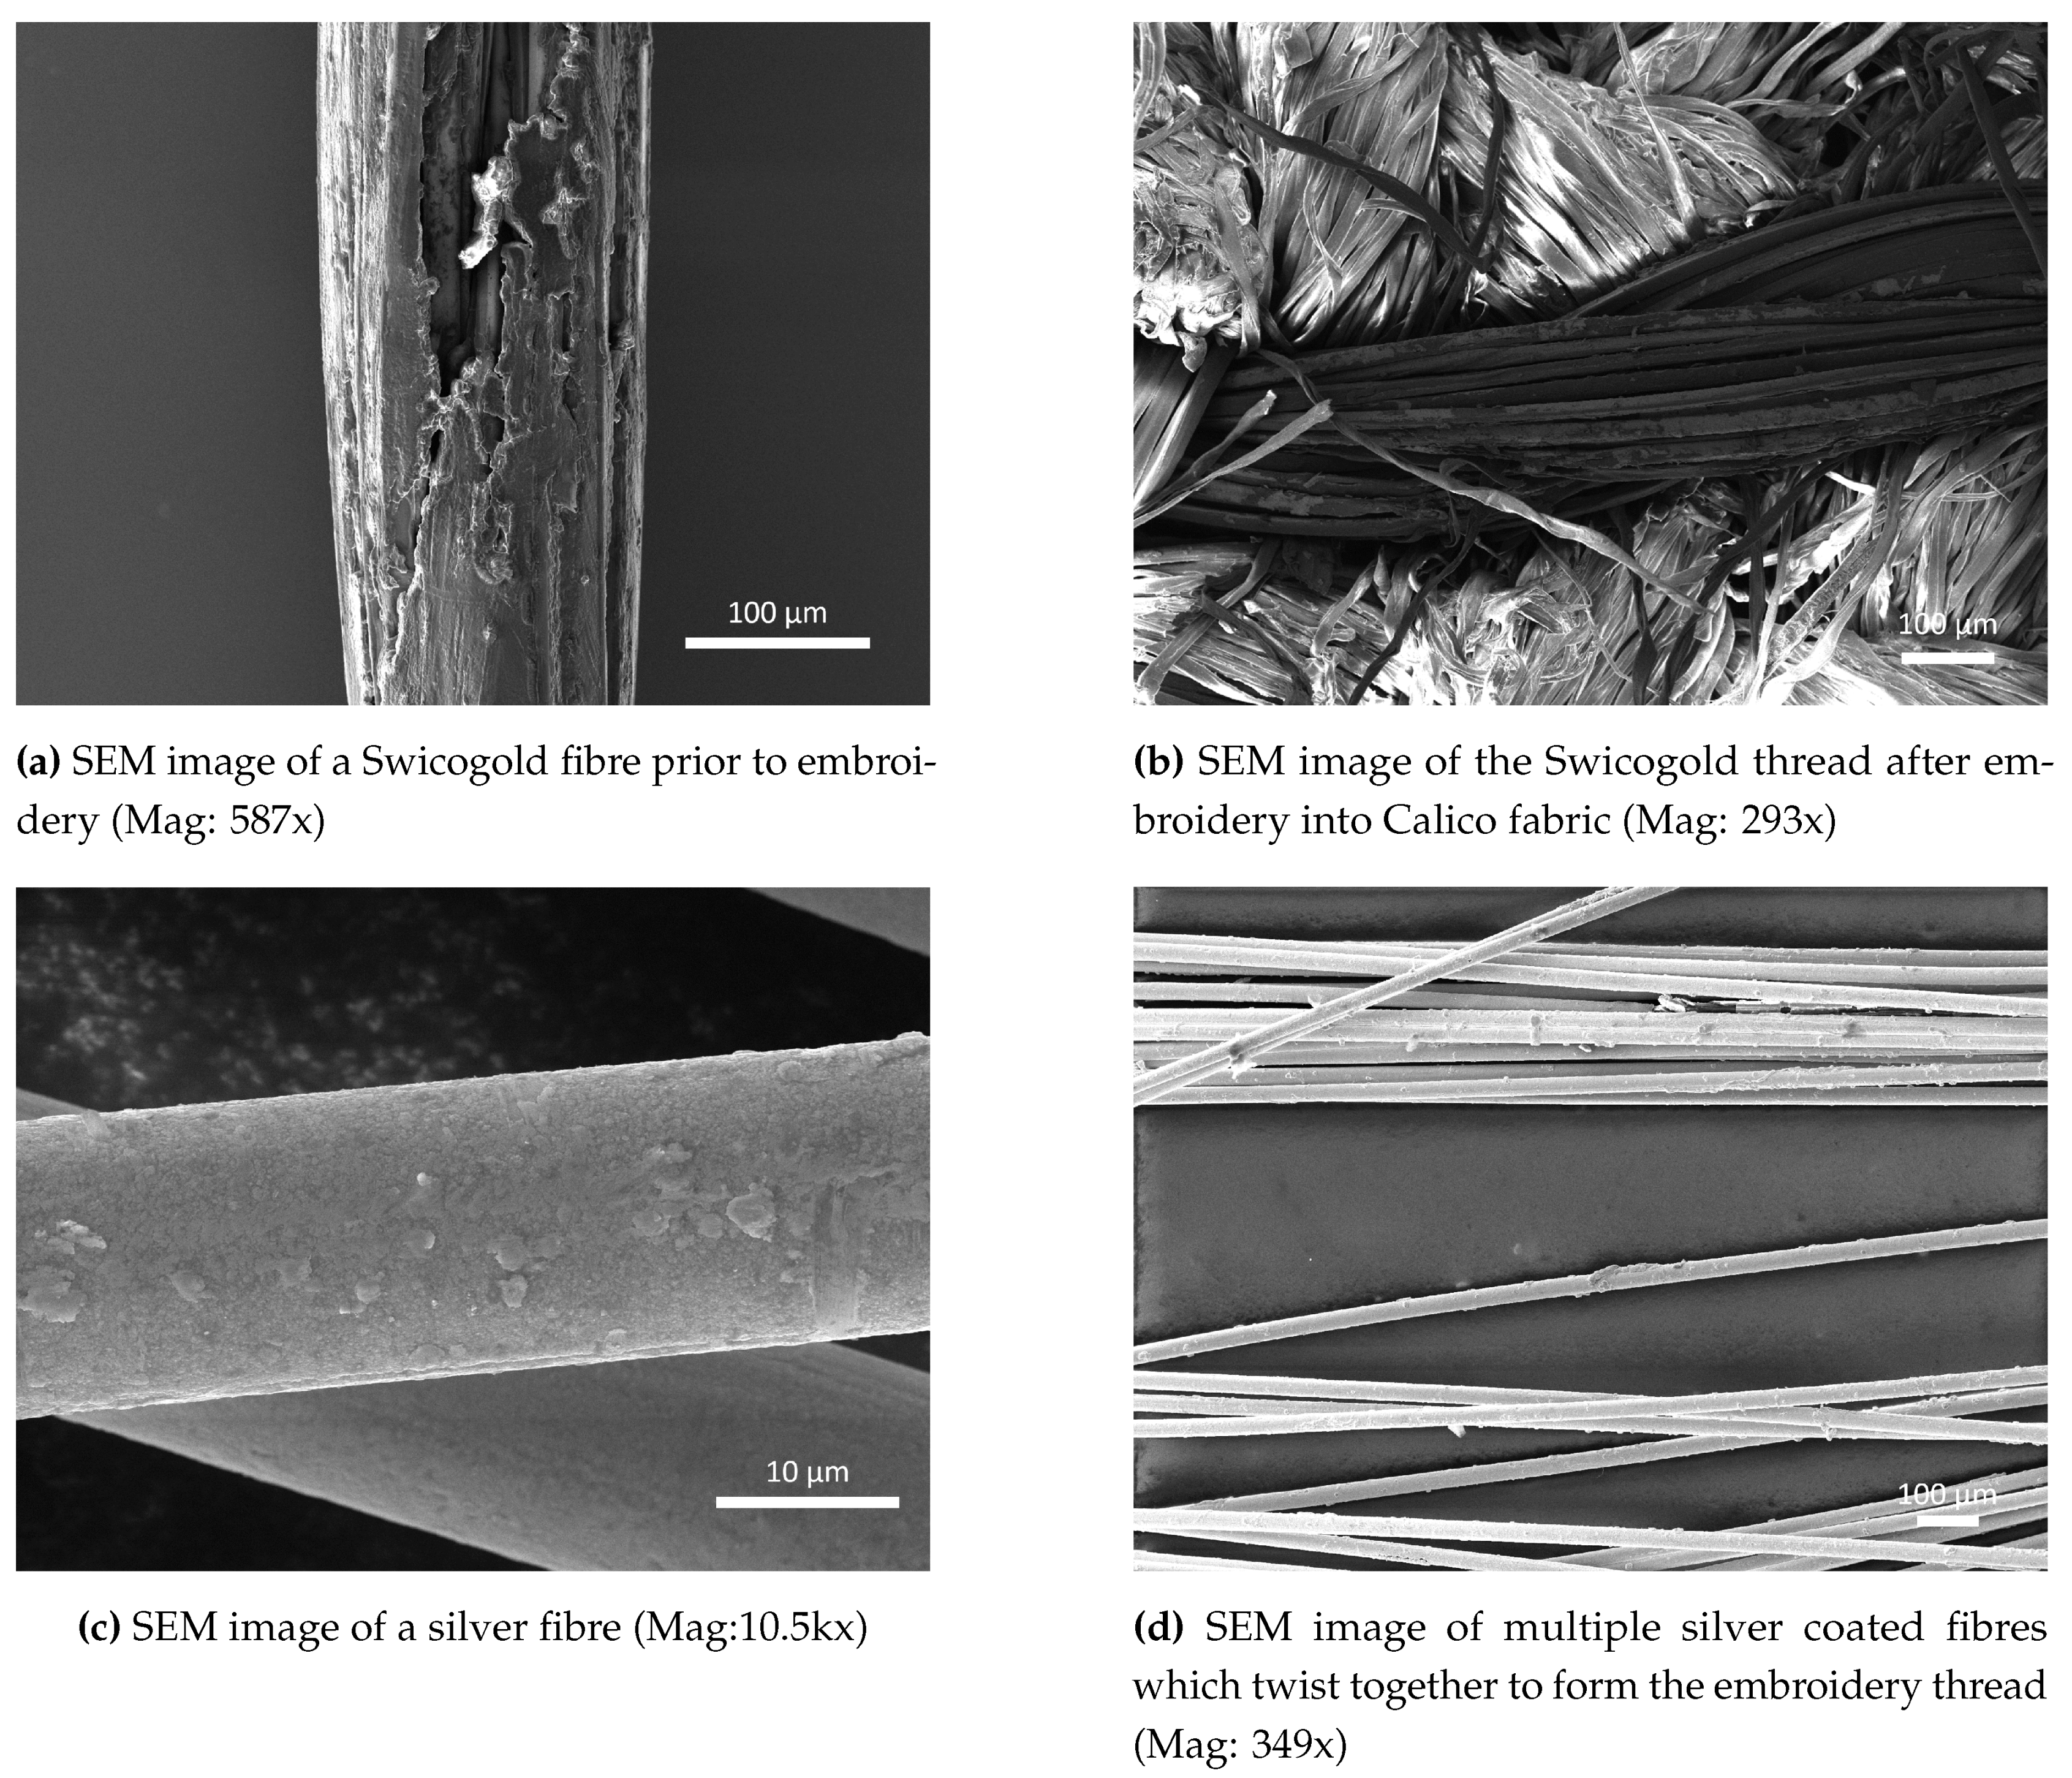
Figure 1a shows an SEM image of a Swicogold thread fibre with an average diameter of 200 µm with the gold coated on top of a Polyethylene Terephthalate (also known as polyester) Fully Drawn Yarn (PET FDY) base. In the centre of the image it can be seen that the gold coating is not uniform with an area of exposed polymer visible, possibly caused by the coating process or the fragile nature of the coating. After undergoing embroidery, further damage has occurred to the gold coating of the thread (
Figure 1b) with larger areas of uncoated fibres appearing throughout the thread, leaving a non-uniform gold sensing surface which would subsequently require an additional coating of gold to obtain a uniform coating.
Comparing the SEM image of the single fibre of Swicofil Swicogold thread with a single fibre of Syscom Advanced Materials Liberator silver (
Figure 1c) the differences in metal coating uniformity can be seen with the silver uniformly coating the underlying polymer fibre, with very few areas of damage evident, but some roughness present. Expanding this analysis out to multiple fibres within the thread (
Figure 1d) the evidence of coating roughness increases however the coating again appears to be fairly uniform with no identifiable areas of coating damage. This surface provides a uniform metal base onto which the gold can be deposited creating an overall uniform layer of gold for subsequent sensing chemical attachment.
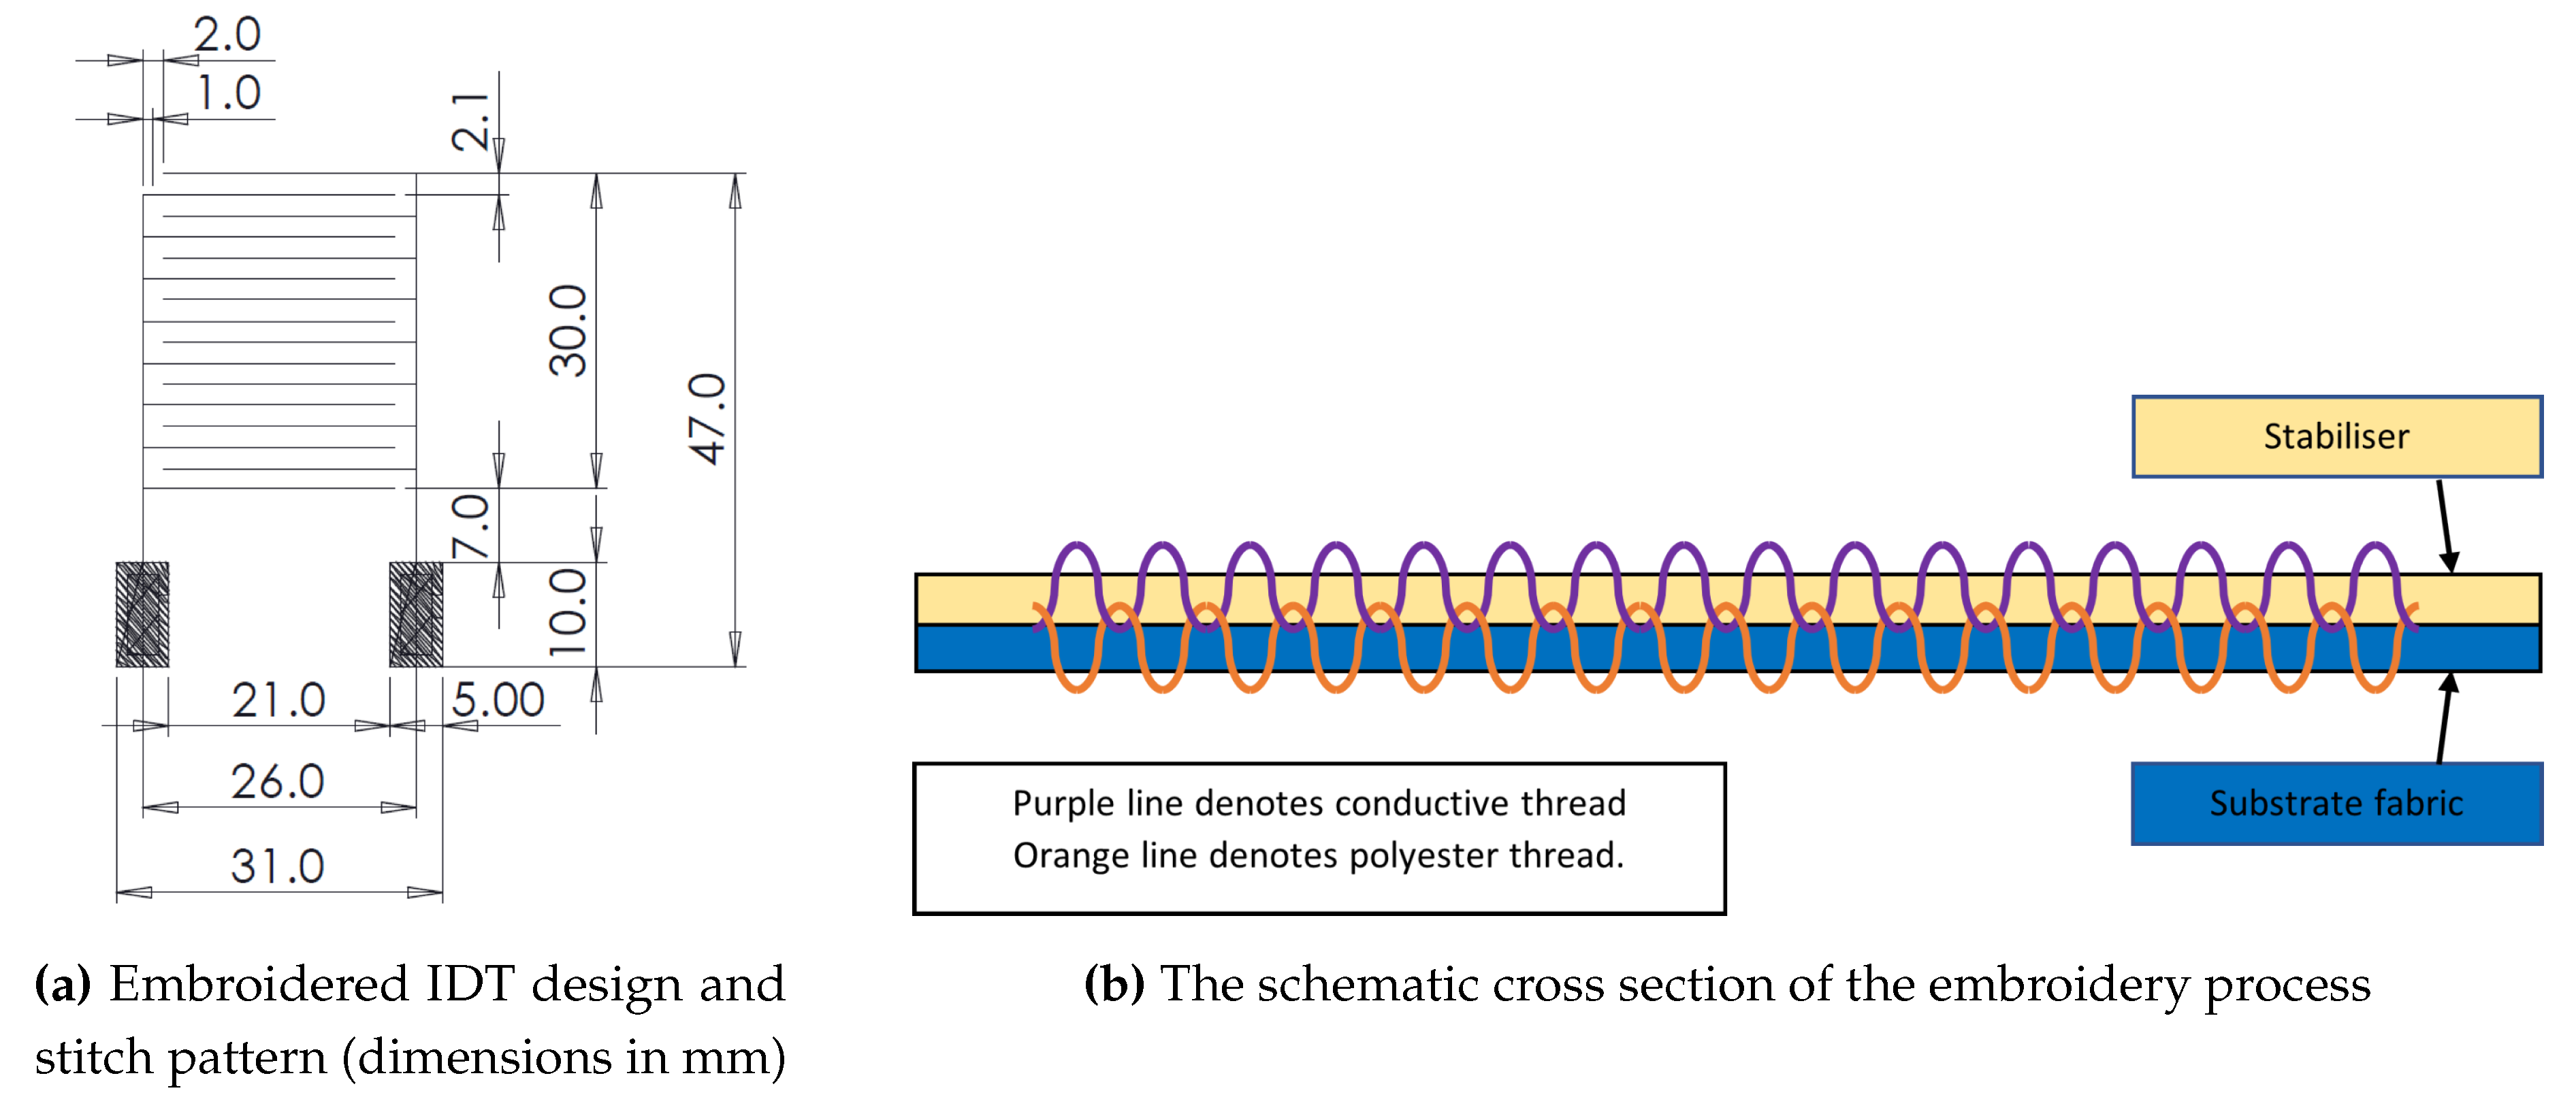
Figure 2 shows the design parameters of the IDT and the method of embroidery on a fabric substrate. The structures are transferred on the fabric substrate using a pair of conductive and polyester threads with the help of a stabiliser as shown in
Figure 2b. The frequency response of the IDT sensor was measured using a Vector Network Analyser (VNA: Agilent Technologies E8364B). The sensor was placed onto a grid to allow the the exact position of the sensor in relation to a fixed copper loop antenna to be measured and controlled. The copper loop antenna (thickness
, diameter 48
) was placed at an average fixed distance of 2 mm above the IDT, ensuring that no stray fibres from the sensor contacted the antenna. The VNA was set to perform 3201 sweep points across a frequency range of 1.2GHz–2.5GHz. The sensor was moved to produce a resonant frequency response map (
Figure 3a), indicating that along the legs of the IDT, which connect the IDT digits to the pads, the frequency is highest at
GHz and along the middle of the IDT where the overlap of the digits is furthest away from either the left or right leg, the lowest region of frequency is seen at
GHz. By plotting the change in position as a function of the magnitude of the resonant peak (
Figure 3b), it can now be seen that the area of highest magnitude is located along the left leg of the IDT, matching one of the areas of highest frequency. The magnitude then decreases when moving along the x-direction towards the right hand leg. A further area of high magnitude is not seen along the right hand leg due to the orientation of the antenna used (
Figure 3c inset).
To achieve a maximum detection region the sensor should be placed at location the most central location incorporating both the digits and the pads at x =
and y =
(
Figure 3c); this however only provided a resonant frequency magnitude dip of -16.2 dB. The optimum magnitude dip of -63.0 dB is located at position x =
and y =
which provides very little coverage of the sensor, minimising the detection region (
Figure 3d). In order to optimise both magnitude dip and detection region a compromised measurement position at x =
and y =
, this brings the antenna further up from the pads and centred with the left-hand leg, providing a magnitude dip of
dB (
Figure 3e).
If the sensor was inverted with the gold IDT facing away from the antenna the magnitude of the significant resonance dip is reduced from dB to dB but was still located in the same area and so the sensor could be used in either orientation. The resonance dip was also seen in the same location across sensors with the same design parameters. All subsequent experiments took place with the conductive side of the IDT facing upwards.
3. Results and Discussion
It was previously demonstrated that IDT-based structures can be coupled with interrogating antennas to excite the IDTs electromagnetically. For example, IDTs in circular [
32] and rectangular [
31] geometries have been coupled with loop antennas for sensing applications. Specific resonances can be induced when the excitation conditions help inducing circulating current across the IDTs or the fingers are electrically polarised. The resonances can be observed by measuring the frequency response of the interrogating antenna. Specifically for a loop antenna, the resultant resonant frequencies arising due to the coupling of the antenna with the IDT can be observed on the S11 spectrum. The resonant frequency depends on the geometry of the IDT as well as the effective capacitance and the inductance imposed by the environmental parameters.
To first examine the most sensitive location over the surface of the sensor, the surface of the sensor was covered with heat-resistant tape (Kapton tape) to provide a temporary waterproofing layer and 10 μ
droplets of DI water ( 18
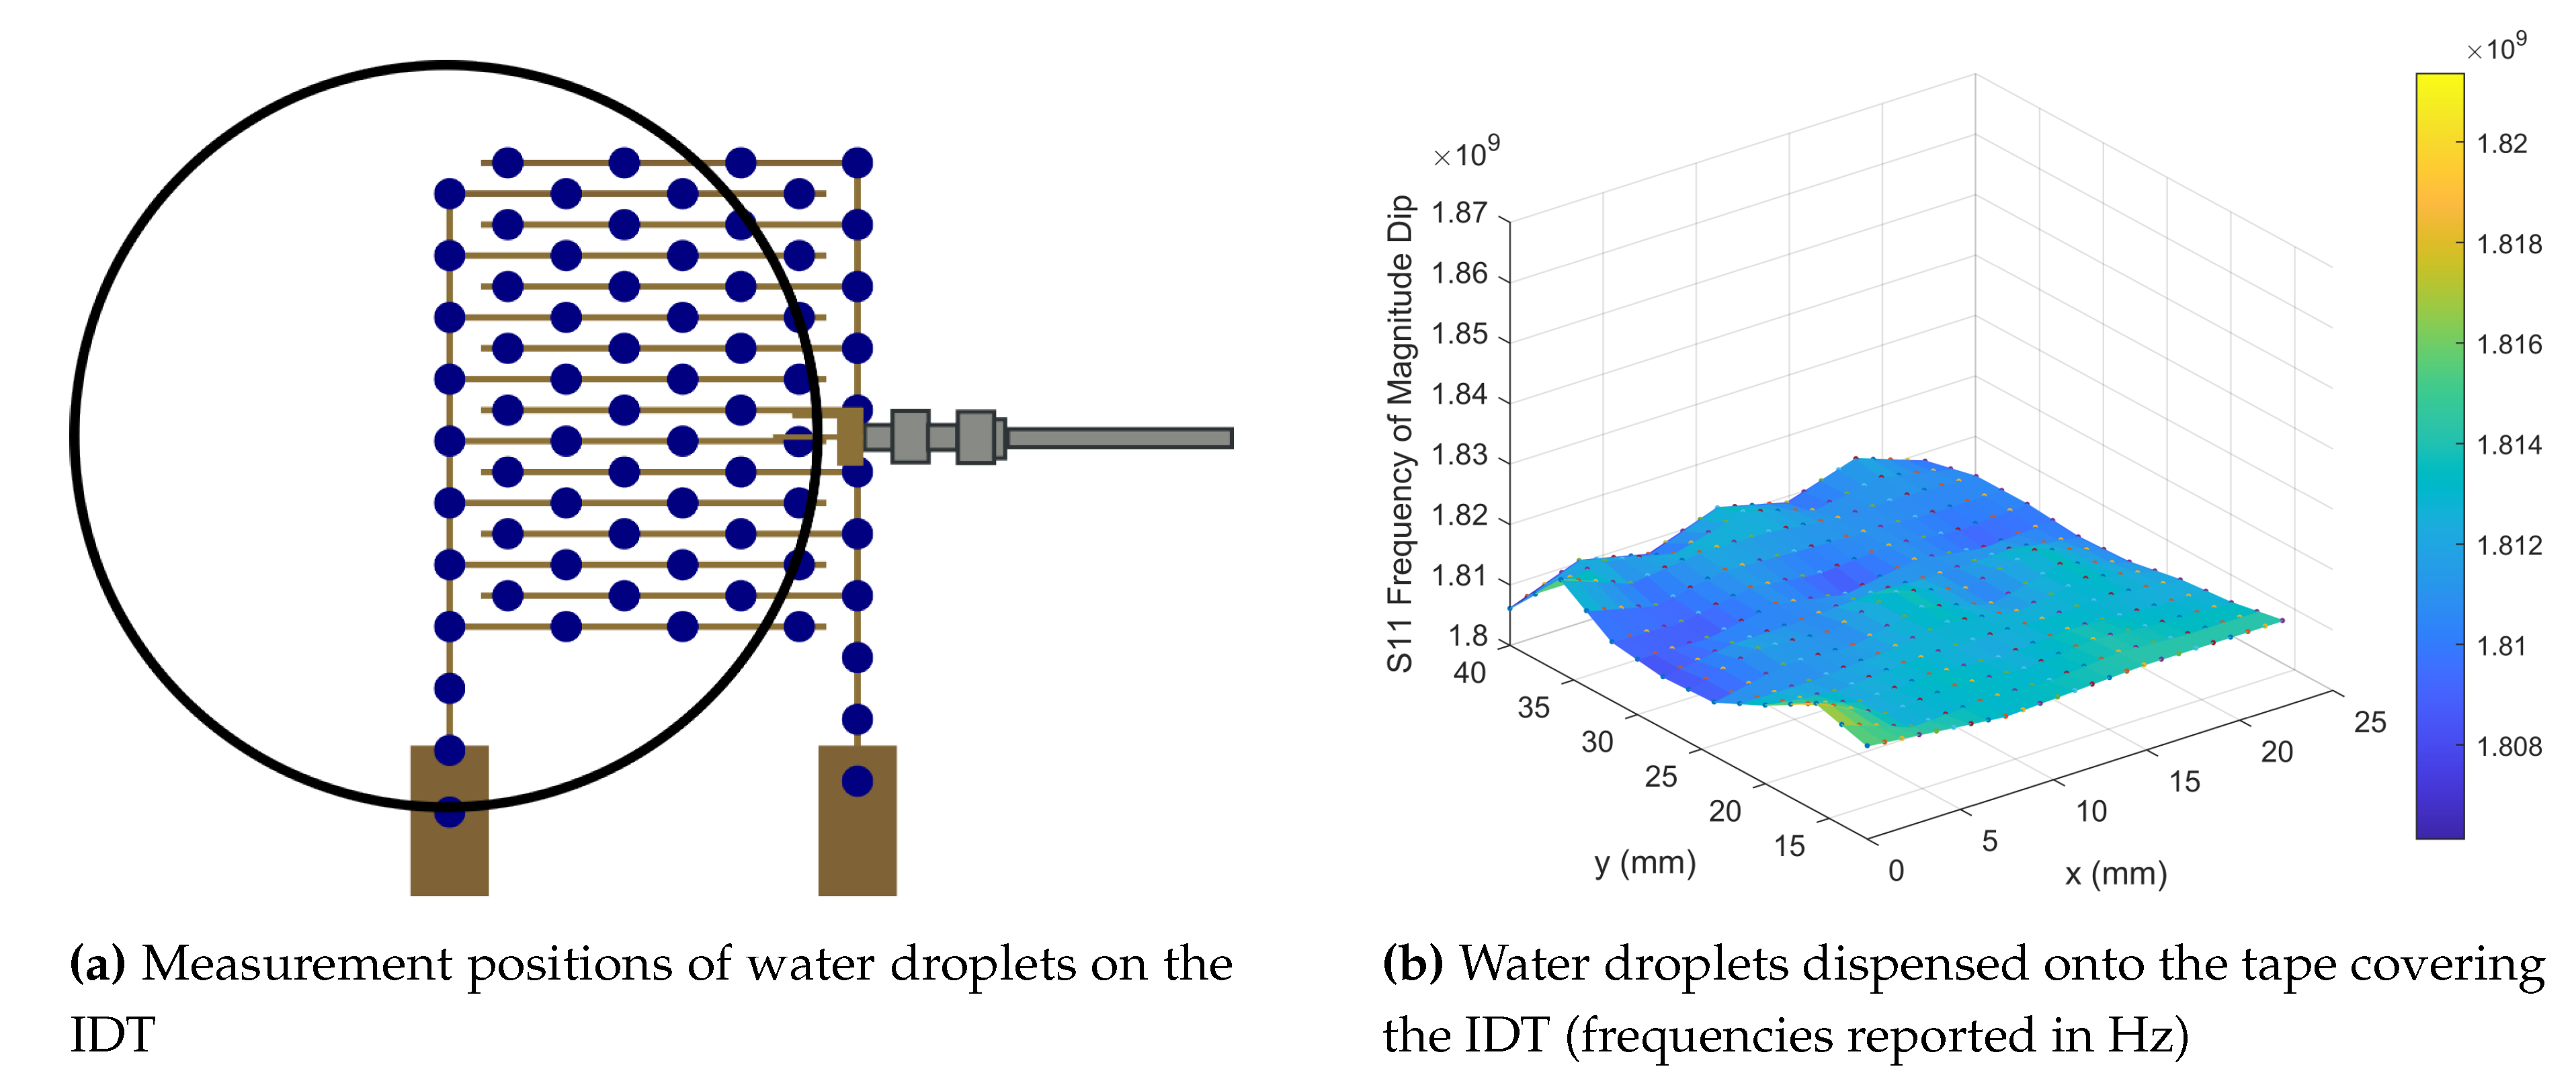
Ω.cm Millipore) were dispensed onto the covered surface of the IDT sensor, in positions detailed in
Figure 4a. S11 spectra of the antenna-sensor coupled structure were measured while the droplets are in each set stationary position over the surface as shown in
Figure 4b. The Kapton tape and DI water droplets introduce dielectric loading on to the IDT, increasing the effective capacitance thus decreasing the resonant frequency of the antenna-sensor coupled structure. Once the position of the antenna was now fixed, the range of positions for droplet placement was reduced, resulting in a new x position range of 0mm–20mm and a y position range of 0mm–12mm.
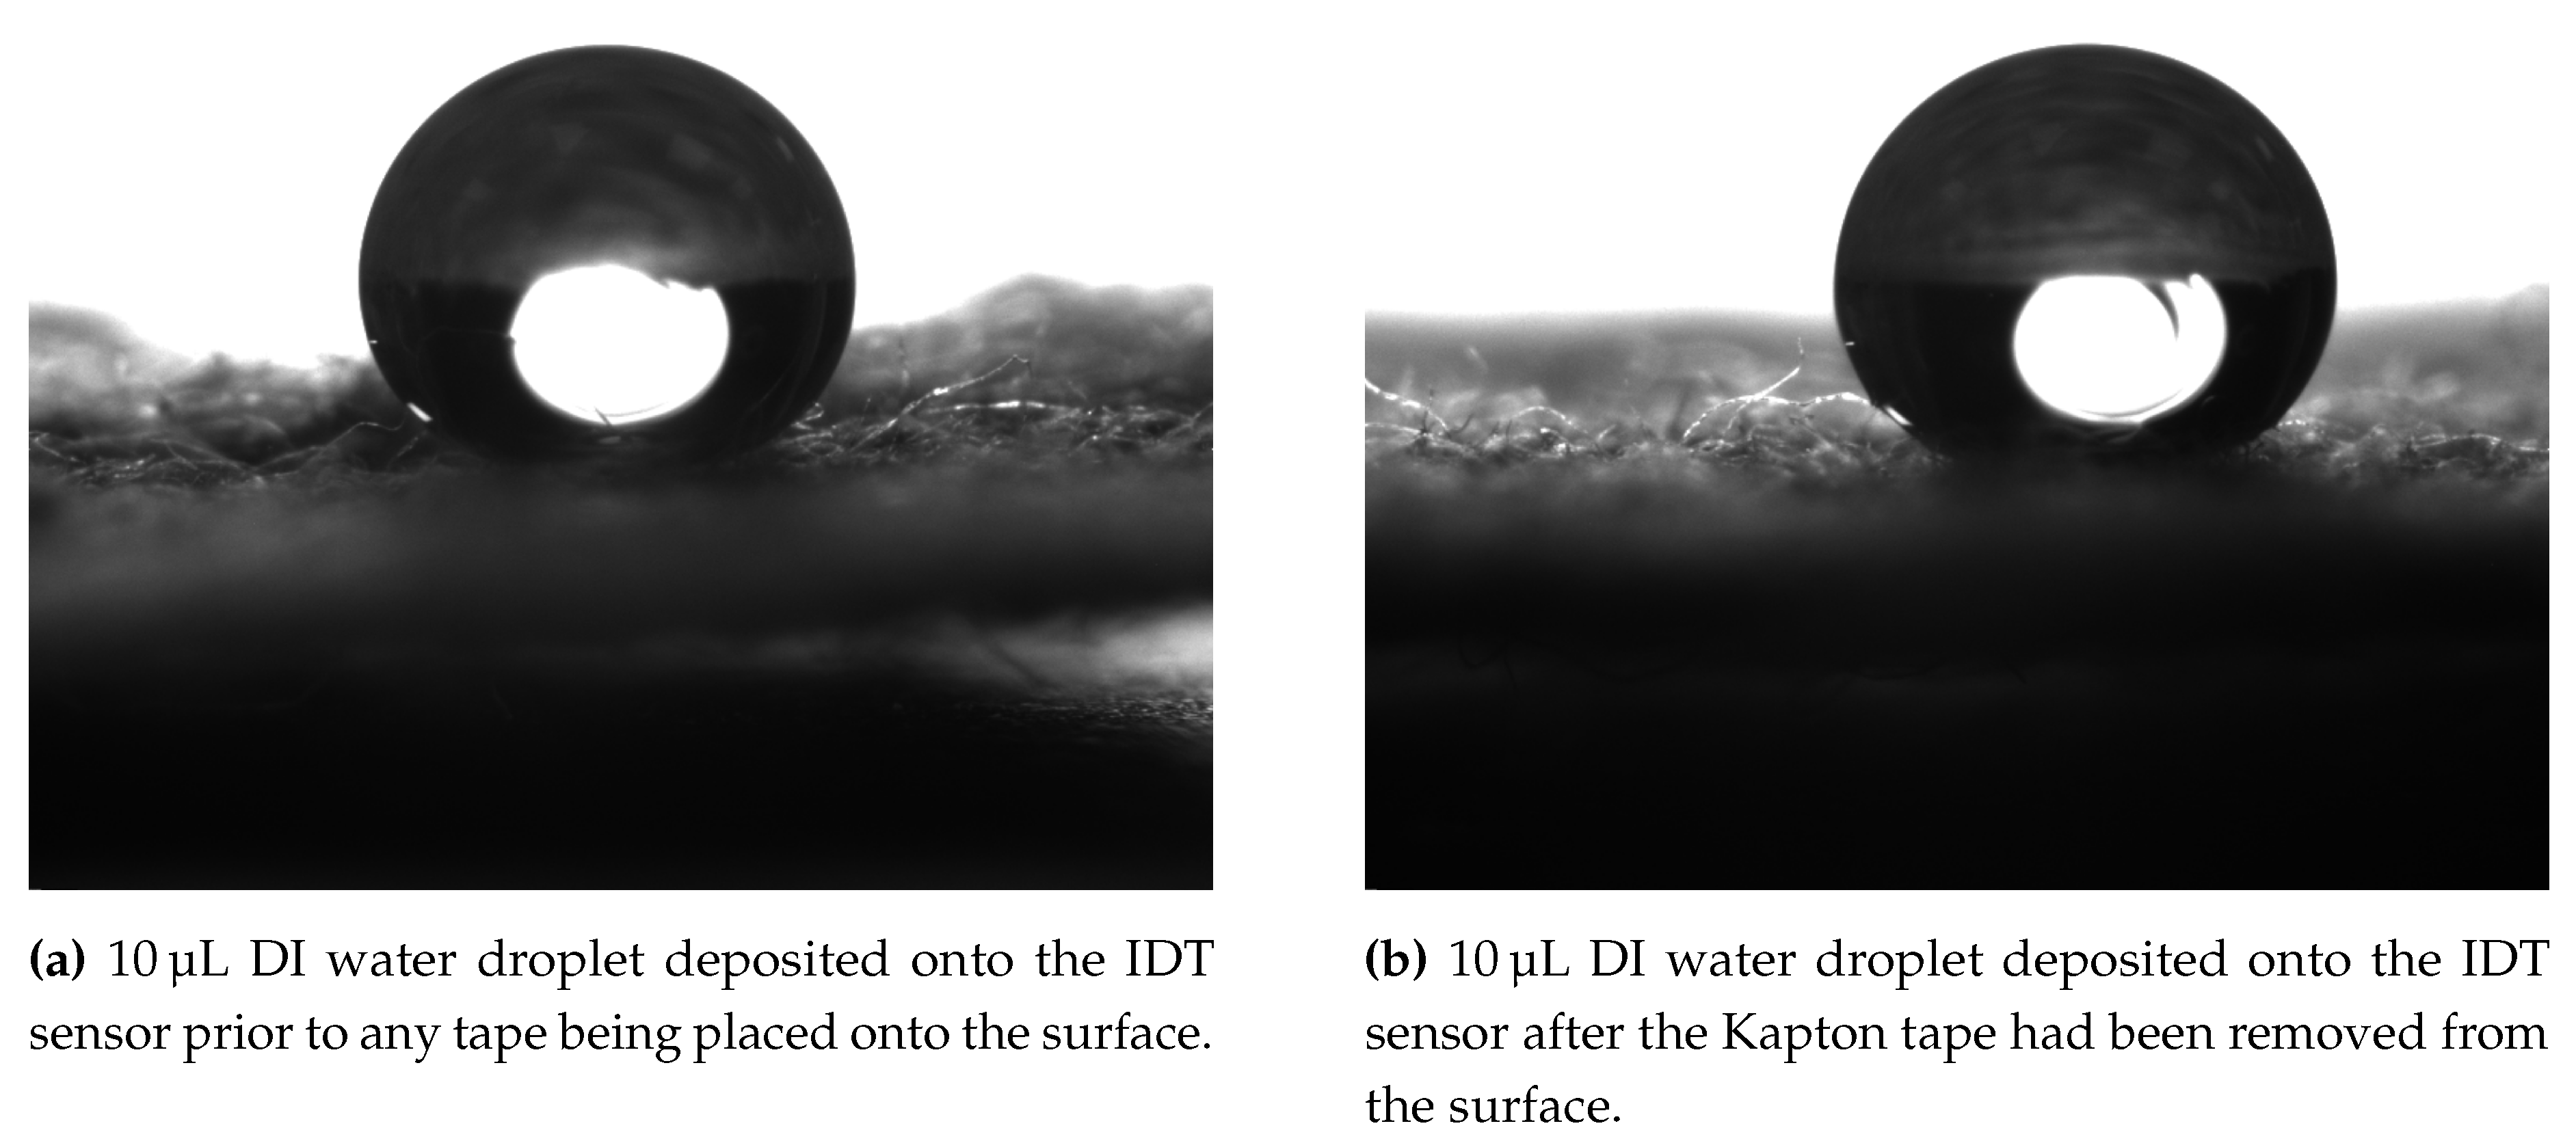
The Kapton tape waterproofing layer was removed from the sensor surface, exposing the IDTs and the single droplet experiment repeated. When the droplets were placed onto the sensor a high static water contact angle of approximately 140 °C; was observed. Static contact angle measurements were carried out using a Krüss DSA 30 on the sensor prior to the Kapton tape being applied and after removal to ensure that the measured angle had not been caused by the residue of adhesive from the tape. 10 μ
droplets were placed onto the surface however due to the hydrophobic nature of the surface multiple deposition attempts were required in the same area before the droplet detached from the
mm diameter needle.
Figure 5 shows two example droplet images on the surface prior to the application of tape (
Figure 5a) and after tape removal (
Figure 5b). In both of these images it can be seen that the contact angle is large however the contact points are obscured by the uneven nature of the fabric based sensor surface. ImageJ is used to enhance the brightness and contrast of the two images to highlight the contact points and baseline of the droplet before the inbuilt angle tool is used to measure the static contact angle. The measured contact angle prior to the addition of tape was measured to be
°C and post tape application and removal
°C. This indicates that the tape is not leaving a residue that is impacting the wettability of the surface and the observed hydrophobic nature is in fact and inherent property of the fabric and thread used to create the sensor.
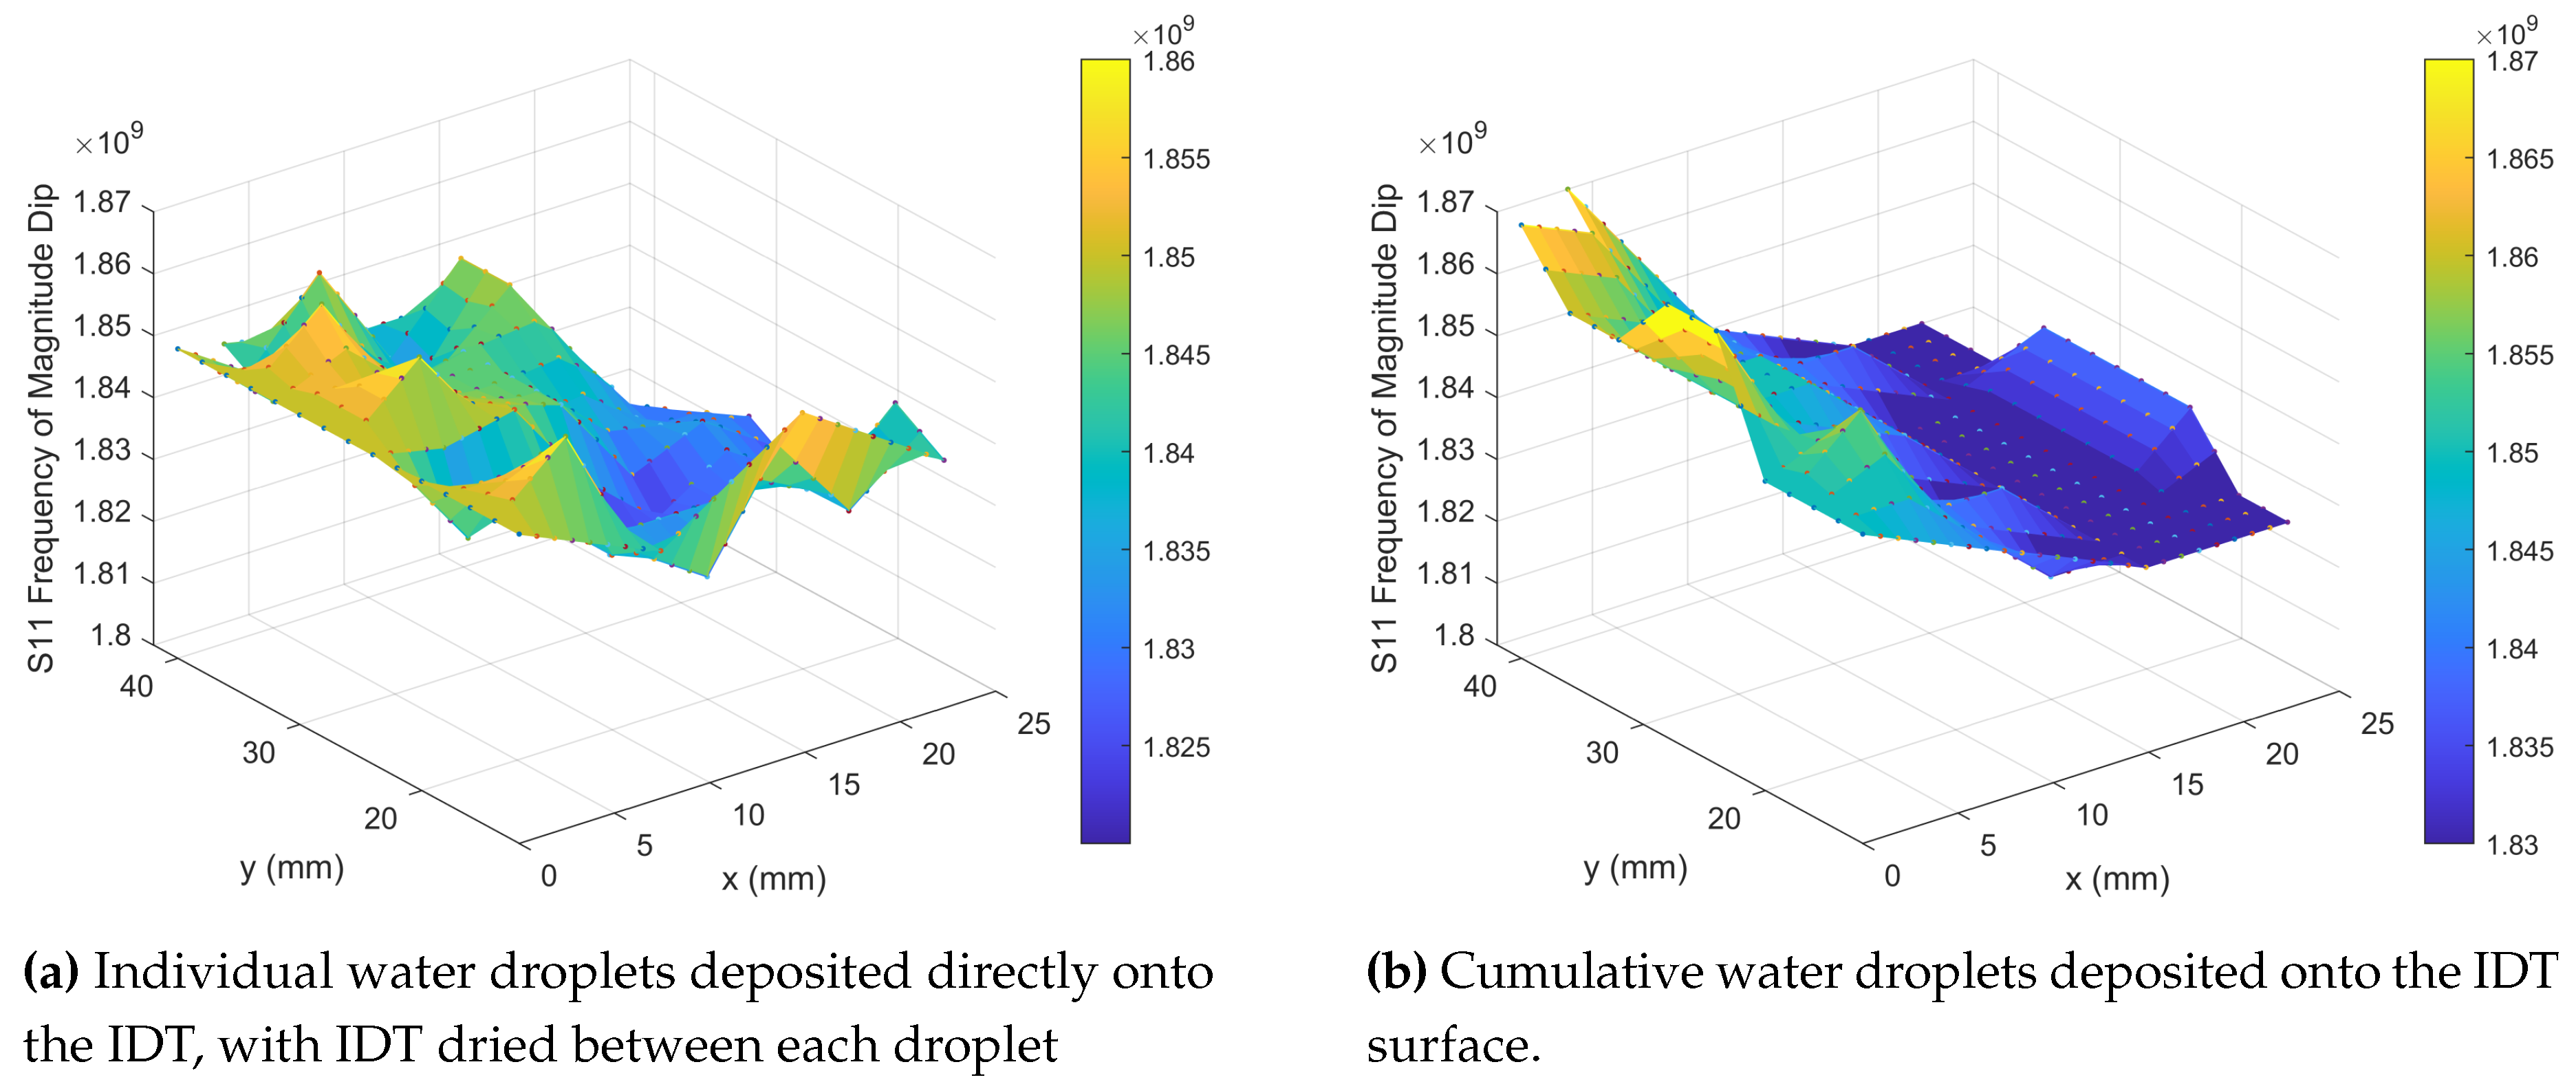
As the static contact angle is large there is very little water in direct contact with the surface and so the droplet can easily be removed by an absorbent material. To ensure the droplet has not wetted the sensor, weight measurements before and after droplet placement were performed using a precision balance (Denver Instrument TP-214); these confirmed that the entirety of the droplet was removed from the surface and so the sensor did not require drying prior to the next droplet measurement. From the frequency shift data of the single droplets (
Figure 6a) an area of higher frequency can be seen along y for x = 0mm–5mm which is the same position, along the left hand leg of the IDT, where the significant magnitude dip in
Figure 3b and high frequencies of
Figure 3a were also located. The frequency measured along this left hand leg is equivalent to the frequencies measured for no object on the surface (
Figure 3e), however the frequency is shifted and reduced as the droplets are placed at positions further away from this left hand side (x = 5mm–20mm), giving a maximum reduction of
GHz from a starting frequency of 1.81GHz–1.85GHz.
Using the droplet placing system detailed in
Figure 4a the droplets footprint covered only a single metallic line over the area of the IDT during measurements. Any water droplet bridging two metallic lines would introduce alter the single resonant frequency dip in a way or introduce additional dips that would prevent tracking the frequency effectively.
Single droplet experiments allowed for the measurement of the sensor’s response in the areas where the droplets were deposited. In order to measure the entire sensor’s response a cumulative droplet experiment was performed.
To simulate the accumulation of fluid on the sensor droplets were placed one after the other onto the IDT in the same positions shown in
Figure 4a, starting from the top left hand corner and working from left to right down the IDT fingers. Instead of removing the previous droplet before placing the next the previous droplet was left in place on the surface. The initial ten droplets sat on the surface at a high static contact angle (CA approximately 140 °C). As the number of droplets continued to increase a breakthrough threshold was reached at an approximate total volume of 150 μ
with the liquid eventually penetrating and wetting the fabric.
Figure 6b details the frequency response measured with the left hand leg of the sensors exhibiting the highest frequency, as seen in
Figure 6a, and the frequencies decreasing as the right hand leg is approached. However for the single droplet experiment (
Figure 6a) there is a clear small area of greatest frequency shift, dependent on both y and x measurement position whereas for the cumulative droplets (
Figure 6b) the y position appears to have less of an effect on the frequencies measured hence the greatest frequency shift can be seen by moving only in the x direction. Once the test was complete the sensor was allowed to dry in ambient laboratory conditions (Temperature: 20°C–25
°C, Humidity: 35%–50% RH).
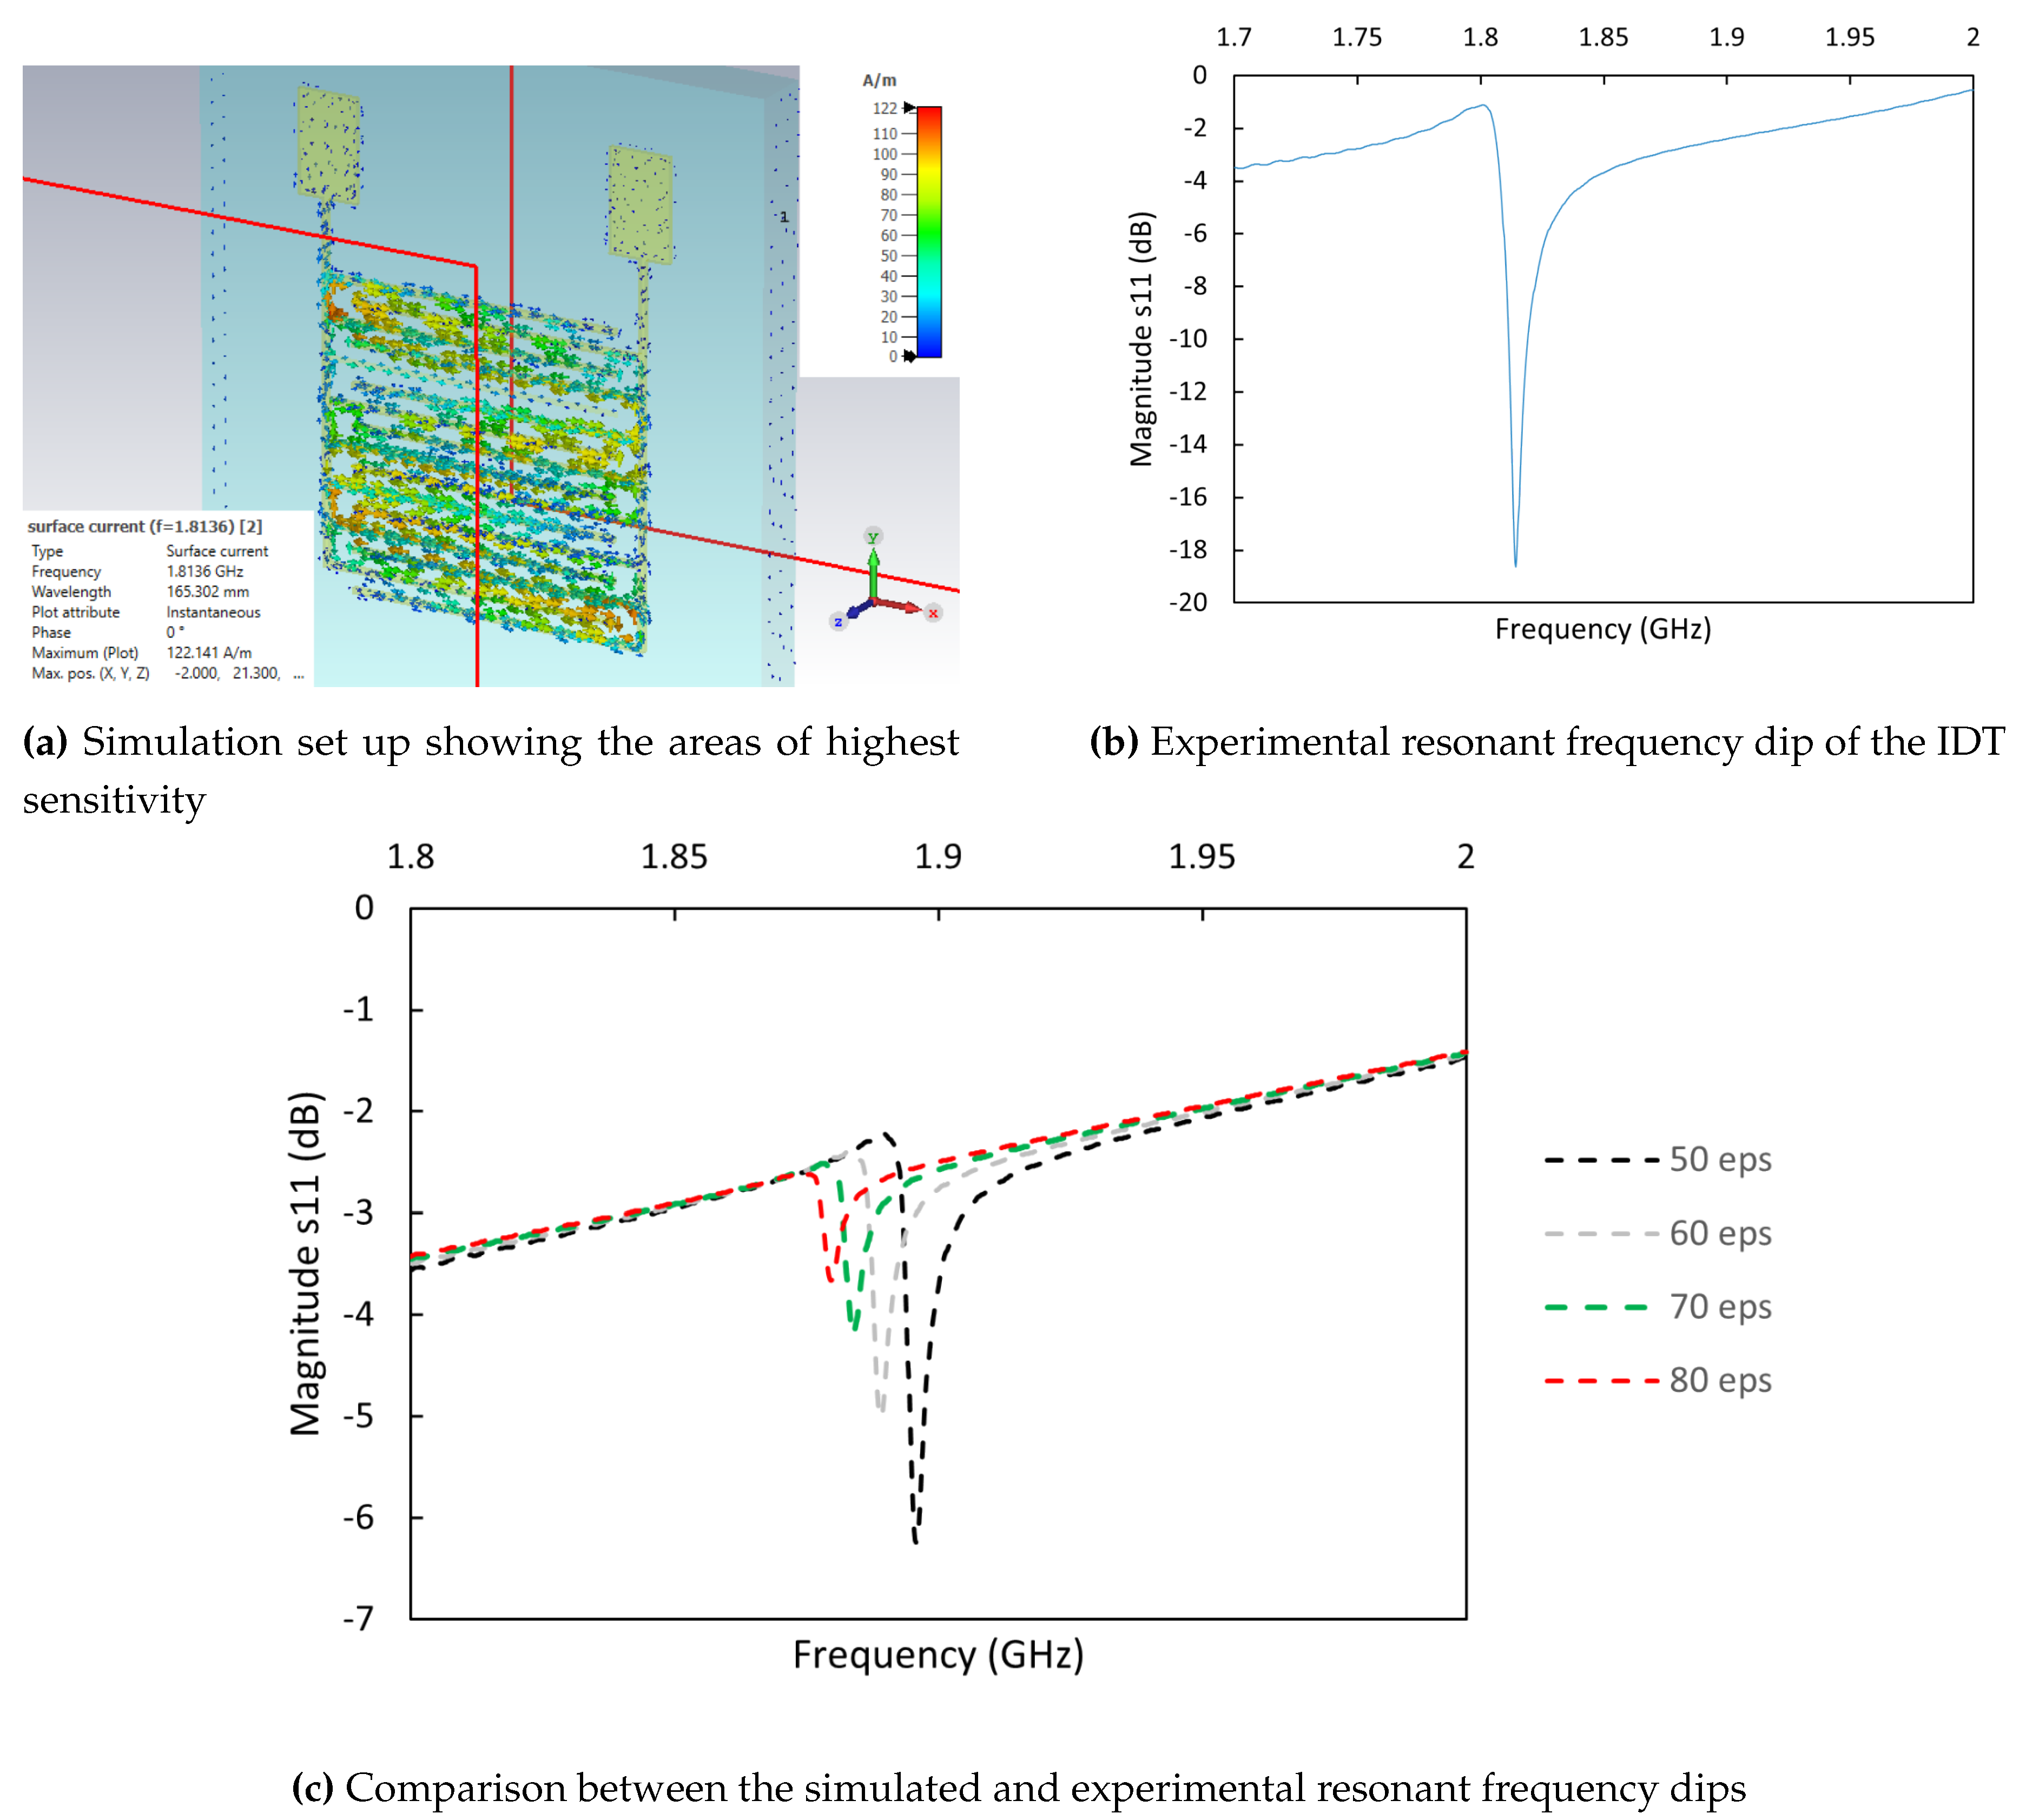
The IDTs have also been modelled using CST Microwave Studio, 3D EM analysis software, with the structures excited by plane waves to obtain their resonant frequencies (
Figure 7a). The experimental resonant frequency dip of the sensor is shown in
Figure 7b. A liquid droplet consisting of water with a fixed volume and varying permittivity was then placed on the IDT, at the previously described optimal location, to replicate the effects of different concentrations of glucose in sweat. This simulation revealed frequency shifts, with the resonant dip decreasing in frequency with increasing permittivity, as seen in
Figure 7c. Inevitable geometrical alterations due to embroidery process, such as small defects between adjacent stitches, results in frequency differences between simulated and experimental values. However, the magnitude of the frequency shifts in both the simulations and experiments were comparable, validating the simulation model.
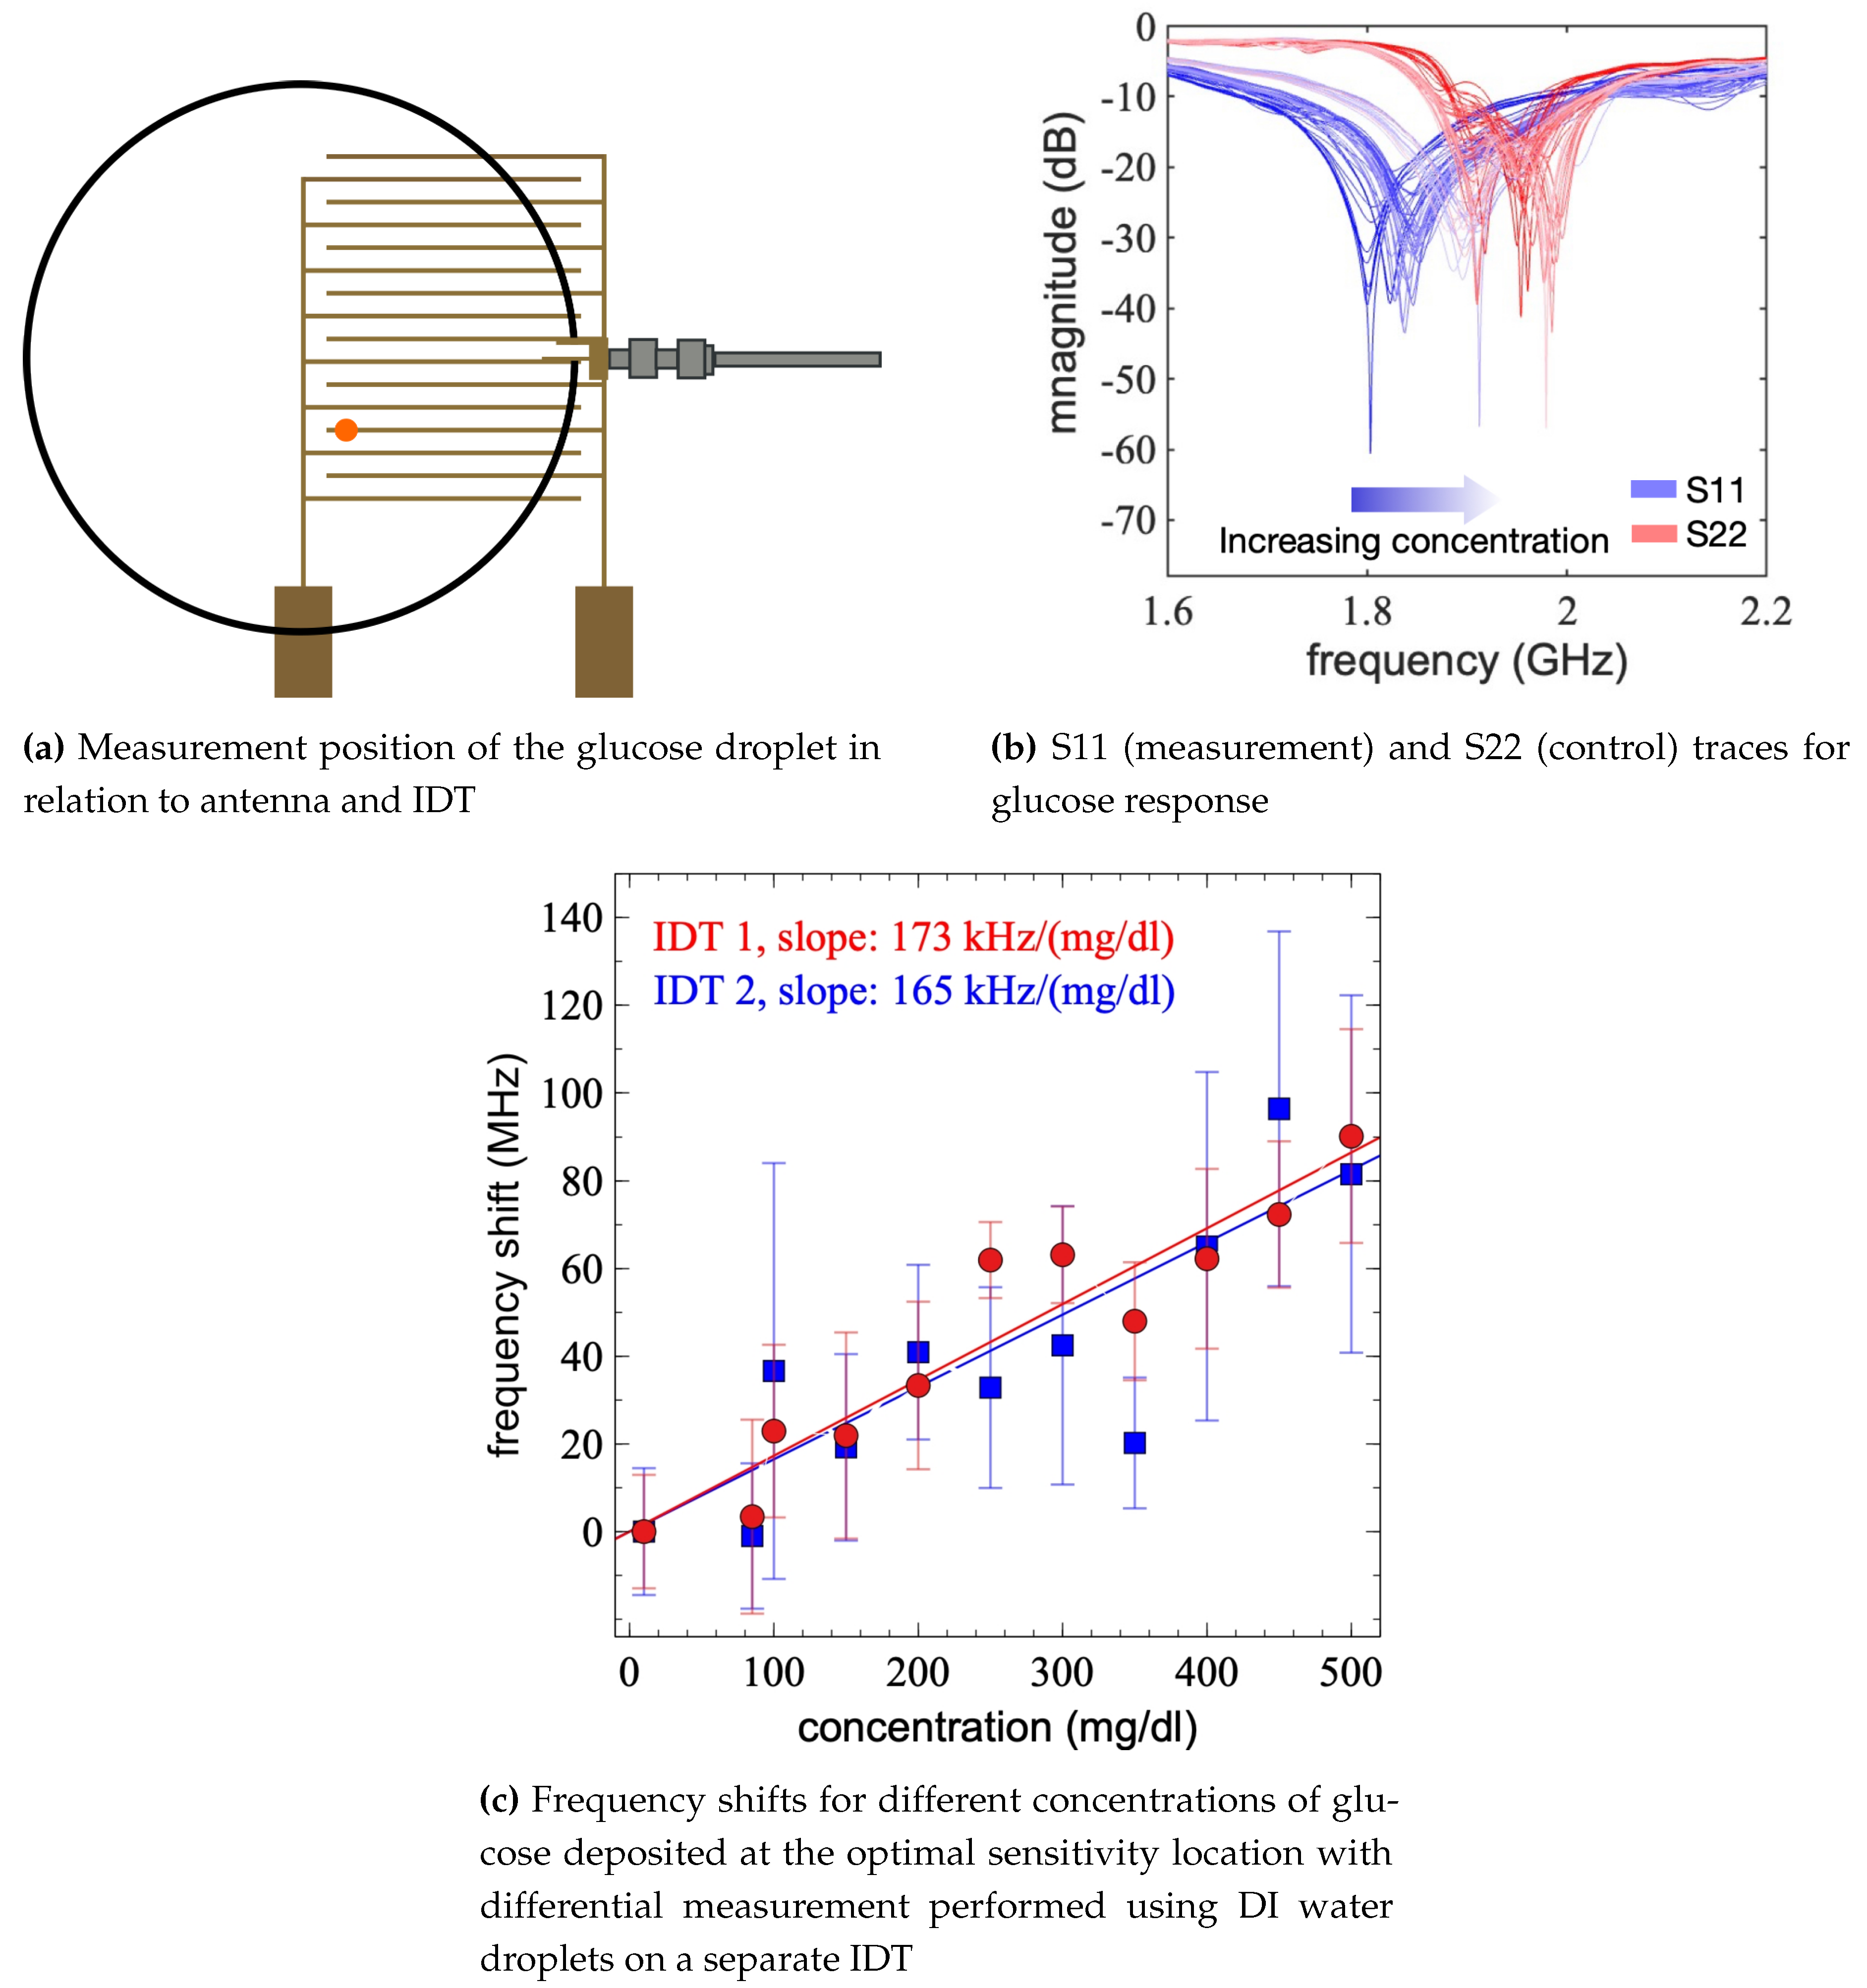
As a case study, droplets with various concentrations of glucose within the physiological range (10mg/dl–500mg/dl) were used in the subsequent experiments. Samples were prepared by mixing DI water with glucose at various concentrations. Each droplet of glucose was placed onto the sensor in the highest sensitivity region (
Figure 8a) and the frequency response was measured. A pair of IDTs were used in these experiments to compensate for the ambient variations that may effect the resonant frequency of the sensors. Specifically, the sensing IDT was connected to the first port. Droplets with varying concentrations of glucose were applied on its surface while S11 spectra were obtained. A control IDT was connected to the second port. DI water droplets were placed on its surface while its S22 spectra were obtained.
As the static contact angles of glucose on the sensor were of a similar value to pure water, the droplets could easily be removed from the sample. However, to ensure that there was no glucose remaining on the surface, the measurement area was cleaned by placing five 10 μ
DI water droplets onto the same area. By placing these droplets in quick succession onto the same position the wetting breakthrough limit of the surface was reached after the third droplet, therefore the surface required a drying step after the deposition of the five DI water cleaning droplets. A hot air gun (Aouye Int 852A+) was used to quickly dry the sensor with the flow rate set to 99 (383 ml/s) and temperature to 100°C. A brief period of time was allotted for the cooling of the sensor and the antenna before the next measurement was performed. The sensor and antenna were determined to be ready for the next measurement when the measured frequency returned to the starting resonant frequency, this period of time was dependent on the ambient conditions at time of measurement. The frequency measurements for the glucose droplets were performed by taking readings on S11 and S22 was used as the control where DI water droplets were placed in the same position. As ambient conditions such as temperature and relative humidity were not controlled over the course of these experiments this accounted for any changes to the resonant frequencies and therefore measured frequencies caused by external factors. As can be seen in
Figure 8b there has been a shift in the frequencies measured on S22, indicating that the external conditions have had an effect on the experimental parameters. By using both S11 and the control S22 a normalised change in frequency can be calculated. This protocol was followed for two pair of IDTs and similar responses were obtained as shown in (
Figure 8c). The measured frequency shift increases with increasing glucose concentration with a slope of
MHz/(mg/dl) (
Figure 8c). For each concentration the measurements were repeated five times, and the error bars in
Figure 8c show the standard deviation of the measured frequencies. The increasing frequency shift by concentration indicates the effective capacitance of the device is decreasing consistent with literature [
32,
34].
The experimental results show that the concentration of glucose can be detected in water wirelessly using the embroidered structures and the readout antenna. The experiments were performed within the physiologically relevant concentration ranges using two different pairs of embroidered structures with similar responsivity values. The obtained results are promising towards a sensor that can be further improved including better controls to reduce the uncertainties in the measurements. It is important to note that the experiments were performed with droplets introduced on the surface of the structures without any specific controls and the antenna was coupled to the structures without any housing and any mechanism for precise registration. Relatively relaxed conditions were deliberately selected to resemble a use chase where the embroidered structures can be used as wearable daily items. Nevertheless, the experimental results show the ability of the sensor to detect the presence of both water and glucose droplets, as well as changes to the concentration of glucose, all without the use of chemically specific substances being attached to the sensor, indicates that the IDT based fabric sensor has the potential to non-invasively monitor biomarkers. The addition of specific biomarker-selective chemicals could not only enhance the sensitivity of glucose detection but by choosing the correct chemical structure other biomarkers could also be identified and levels of these monitored, leading to a full suite of non-invasive biomarker detection sensors.
4. Conclusion
In conclusion, this study unveils the potential of fabric-based IDT sensors as an innovative solution for non-invasive/continuous health monitoring, which can be tailored to an individual. By leveraging innovative embroidery techniques, the fabrication of flexible sensors on fabric swatches or directly into clothing items with gold-coated IDTs presents a novel approach. The demonstrated capability of these sensors to effectively and wirelessly detect water droplets and various concentrations of glucose in water marks a significant advancement in health monitoring technology. This work demonstrates the feasibility of using an embroidered sensor that can be easily added to daily items for molecule sensing without a need for electrical connections to the sensor. It is envisaged to use this sensor and the method eventually for sweat analysis. Additional functionalities such as sweat sampling will be added to the sensors towards this goal. In addition, the complex composition of sweat samples including several molecules will be investigated using the proposed platform. This study is the first important step towards this goal presenting the sensor structure, its fabrication and the wireless readout mechanism.
The embroidered IDT sensors offer unique advantages, including seamless integration into everyday clothing. This feature ensures a non-disruptive, user-friendly experience, aligning with the contemporary shift towards continuous, personalised health data capture. The study’s findings open avenues for further research and development in the realm of embroidered sensor technology, suggesting its potential for broader applications beyond glucose monitoring. Whilst the current method of measuring the frequency shift is not designed for portable and wearable systems, advances in wireless sensing technology could facilitate a move from the current, lab-based measurements to a fully wearable suite of sensors which could feasibly be used in any conceived environment.
