Preprint
Article

Wheat Straw Ash and Silica Fume Replacing Model for Lowering the Carbon Footprint of Cement Paste

Altmetrics

Downloads

90

Views

28

Comments

0

Submitted:

13 June 2024

Posted:

14 June 2024

You are already at the latest version

Alerts
Abstract
A model for enabling the production of lower carbon cement paste is proposed in this research. The model is based on predicting the strength of cement pastes with partial replacement of wheat straw ash (WSA) and silica fume (SF), two major wastes of agricultural and industrial production. The model is set up based on response surface methodology and Box-Behnken design, and included a suite of mechanical tests with distinct replacements following a micro an meso characterization. The model shows capability for predicting strength of any cement paste, including partial substitution of WSA and/or SF at any combination level with excellent accuracy, which is verified with three validation mixtures demonstrating maximum errors of less than 6% at the three ages. The analysis of the response surface evidences that any cement replacement in the range of 0-20% WSA and above 5% SF allows the reduction of the carbon footprint by maximizing the incorporation of both wastes. The proposed model can be used by setting the required strength of cement paste and calculating the maximum possible replacement, which should contribute to making the construction industry more sustainable by utilizing local waste.
Keywords: 
Subject: Engineering  -   Architecture, Building and Construction

1. Introduction

According to data provided by the Global Cement and Concrete Association, 14 billion m3 of Portland cement concrete (PCC) were produced in 2020 [1], and it is estimated that this production was responsible for 5%–8% of global anthropogenic carbon dioxide emissions [2]. Because conventional PCC is a mixture of cement, water, admixtures, and mineral aggregates, its most polluting aspect is the Portland cement manufacturing process, with emissions of approximately 866 kg CO2eq per ton [3], and currently about 4.5 billion tons of cement are yearly produced worldwide [4]. On the other hand, due to an increase in housing and infrastructure demands, especially in developing countries, it is estimated that cement production will continue to increase to 5–6 billion tons per year by 2050 [5]. For example, in Chile, the housing shortage in 2020 was 3.3%, equivalent to 641.421 houses [6], and in other South American countries, similar amounts are demanded. Among them, the Brazilian housing deficit stands out with a shortage of more than 6 million dwellings [7]. In Colombia, during 2021, the housing deficit was estimated for the first time, and the results showed a deficit of 5.24 million households, equivalent to 31% of the country’s households [8]. Likewise, in 2015, the Argentine Chamber of Construction estimated the housing deficit based on data from the 2010 census at 1.8 million homes, equivalent to 16.1% of the total housing stock [9]. It is important to emphasize that, in general, in Latin America, concrete is used in both housing and infrastructure, among other type of construction.
For the previous reasons, the concrete industry must move towards sustainability, and one of the significant measures of such would be reducing CO2 emissions related to the cement content per cubic meter of PCC acting in the reduction of the clinker factor, which may be accomplished by using supplementary cementitious materials (SCMs) because such materials have been shown to be effective in significantly reducing emissions [10]. These replacements have been used either on site or in cement production and have been extensively studied. Among the best known are industrial by-products such as fly ash, silica fume (SF), ground granulated blast furnace slag, limestone dust, and metakaolin, among others [11,12,13,14,15,16,17,18,19]. Micro silica, for example, is an industrial by-product from ferrosilicon alloys or silicon industries [20], which has been widely studied and used to improve the physical and chemical properties of concrete because it accelerates the hydration process of cement at early ages given its fine particle size [21]. Although agricultural as well as industrial wastes are varied, the literature supports that the most-studied such wastes are viable to be used as SCMs in concrete due to their high content of calcium oxide (CaO), silica oxide (SiO2), and alumina (Al2O3), which can react with the chemical components of cement and form hydrated secondary calcium silicates (C-S-H) from the remaining calcium hydroxides (CH) in the cement paste through a pozzolanic reaction [22]. SCMs improve hydration kinetics, which is mainly favored by the filler effect. Due to the smaller particle size, SCMs provide an extra surface area capable of acting as a nucleation site for C-S-H precipitation, in addition to affecting the acceleration and deceleration periods of hydration, increasing the number of nucleation sites for the generation of hydration products [10]. Regarding strengthening effects, most SCMs increase the compressive strength of concrete at late ages due to an improved pozzolanic reaction but decrease the strength at early ages due to a decreased amount of cement [23]. Regarding the durability of concrete, SCMs tend to act positively due to a decrease in or refinement of the pores [24,25,26], decrease in chloride permeability [27,28], reduction of expansion due to alkali-silica reaction [29], or shrinkage reduction [30,31], among others. When the excess of CH, which is one of the main factors responsible for the deterioration of the cement matrix, is reduced, the physical and transport properties of the concrete are improved [32] thereby also improving its durability. In addition, the mixture of SCM with cement results in a more complex combination because the simultaneous hydration can influence the reactivity of the other due to the differences in chemical composition and fineness, among others [10]. In summary, in addition to the environmental properties, SCMs are also able to improve concrete microstructure, mechanical properties, and durability.
One limitation of SCMs is the fact that they are not always locally available, mainly due to their asymmetric distribution in some regions [33]; therefore, it is recommended to produce and use SCMs locally available. A major source of waste in the world is agriculture because 9.4 billion tons of primary crops such as sugarcane, corn, wheat, and rice are produced annually to feed the population, and these crops all have by-products [34]. Many of these by-products can be converted into SCMs, given the large amounts of biomass residues derived from the harvest, such as leaves, stalks, husks, or straw [35]. Among the best known are rice husk ash [36,37,38], sugarcane bagasse ash [39,40,41], wheat straw ash (WSA) [42,43,44], coconut shell ash [39,40,41,45], and corn cob ash [48,49].
According to cereal production data, wheat is one of the three most-produced cereals, with an estimated production from 2022–2023 of 776.7 million tons, and its consumption is expected to continue increasing as a result of population growth [50]. On the other hand, to obtain 1 kg of wheat grain, 1.3–1.4 kg of wheat straw is generated [51]. Although wheat straw is sometimes used to feed livestock, a large amount is still considered waste, so, in many countries, it is typically burned in the fields because it is a fast and economical method to eliminate it. However, method brings negative consequences such as oxidation of soil organic matter; generation of greenhouse gases; increased water erosion; air pollution with particulate matter, which leads to serious health problems; increased risk of fires; and decreased water permeability, among others [52]. Even though there are alternatives to burning, none have completely solved the problem [53]. In Chile, this problem persists given that there is a planted area of more than 623,000 ha, which translates into more than 5 million tons of total stubble throughout the country [54], including crops such as wheat, oats, malting barley, corn, rice, beans, and lentils. One of the most relevant research projects carried out in Chile on the addition of agricultural residues in construction used grapevine shoots with the aim of improving the thermal conductivity of fired clay bricks [55].
Taking into consideration the previous context, this research considered the use of WSA, started by Biricik et al. (1999) who demonstrated that this material possessed pozzolanic activity and triggered the study of this new potential SCM. It is known that the chemical composition of WSA changes depending on different factors, some related to its place of origin such as variations in soil conditions and climate, thus directly affecting its pozzolanic efficiency [42]. Furthermore, calcination temperature and particle size are also important when using WSA as an SCM [42]. Early research investigated the controlled combustion of WSA for 5 hr at temperatures of 570°C and 670°C [56] and showed that WSA obtained at 670°C had better pozzolanic behavior. It was then reported that the mechanical properties “of autoclaved mortar specimens” were improved with WSA obtained by burning straw at 650°C for 20 hr [57]. Since those studies, several other similar studies have concluded that the optimum WSA calcination temperature is roughly 600°C, evidencing that upper temperatures tend to transform the amorphous silica into crystalline silica, thus reducing the pozzolanic efficiency [58,59].
Although the WSA is a promising material, its incorporation into cement pastes presents some negative impacts such as the loss of strength, which can be improved using another type of SCM such as SF. Additionally, the behavior, properties, and modeling of the incorporation of both WSA and SF so far have not been researched fully.
Therefore, the objective of this study was to set up a model to predict the behavior of concrete with the addition of WSA in order to allow for the utilization of that agricultural waste in the partial replacement of cement. Furthermore, the addition of WSA was investigated in combination with SF. Finally, it is important to highlight that this research was conducted under the umbrella of a larger research project related to timber-concrete composites slabs. Particularly, this type of structures allows concrete with relatively low strength.

2. Materials and Methods

2.1. Materials

2.1.1. Raw Materials

For this study, high-strength pozzolanic Portland cement supplied by Melon S.A., Santiago, Chile, in accordance with ASTM C595 [60] was used with a density of 3,000 kg/m3. WSA was prepared in the lab according to the procedure explained next. SF use in the research was obtained from a supplier (Sika) that corresponded to the product SikaFume®, which has a density of 2,200 kg/m3.
The CO2eq values of the raw materials were obtained from the literature and are shown in Table 1; specifically, values for the WSA were not found, so an approximate value for biomass ash is shown.

2.1.2. Preparation of WSA

The straw waste used in this investigation was obtained from durum wheat (Triticum turgidum var. Durum L.) harvested in Linares, a central region of Chile with a mild Mediterranean climate, Csb according to the Köppen climate classification. The wheat straw was burned in an electric furnace with an initial temperature of 50°C and subsequent heating at a rate of 10°C/min up to 600°C for 120 min, following previous pozzolanic efficiency studies [59,63,64]. Once burned, the wheat straw was rapidly cooled by setting the ashes at a controlled room temperature of 20°C. For each calcination, a consistent ash yield of 7% of the original straw weight content was obtained. The resulting ash was then filtered through a #50 sieve to reduce the particle size and thus increase surface area because fineness has been reported to yield higher pozzolanic performance [42]. The density of this material was 2,210 kg/m3 [63].

2.1.3. Definitions of the Design of Mixtures

The definitions of the input levels of the different variables necessary for setting up the theoretical model were determined from the literature so that calculations could be made to properly infer intermediate values not studied experimentally [65]. The proportion of cement to be replaced in mass was based on a literature review so that the maximum WSA replacement ranged up to 20%, beyond which several authors reported significant decreases of the pozzolanic reaction [42,66]. Likewise, the maximum SF replacement percentage was set up to 10% because multiple studies demonstrated a relevant worsening of the mechanical properties beyond this value [67,68,69]. Additionally, the water content represented by the water-binder ratio (W/B) ranged from 0.4 to 0.6 to obtain complete hydration of the cement particles. The designed mixtures were classified in three categories or combinations: 100% cement (mono), binary, and ternary mixes using the two SCMs. In conclusion, the final selected variants entailed W/B ratios of 0.4, 0.5, and 0.6 and WSA and SF replacements of 0%, 5%, and 10%.

2.2. Methods

2.2.1. Experimental Design and Predicting Modeling/Carbon Footprint

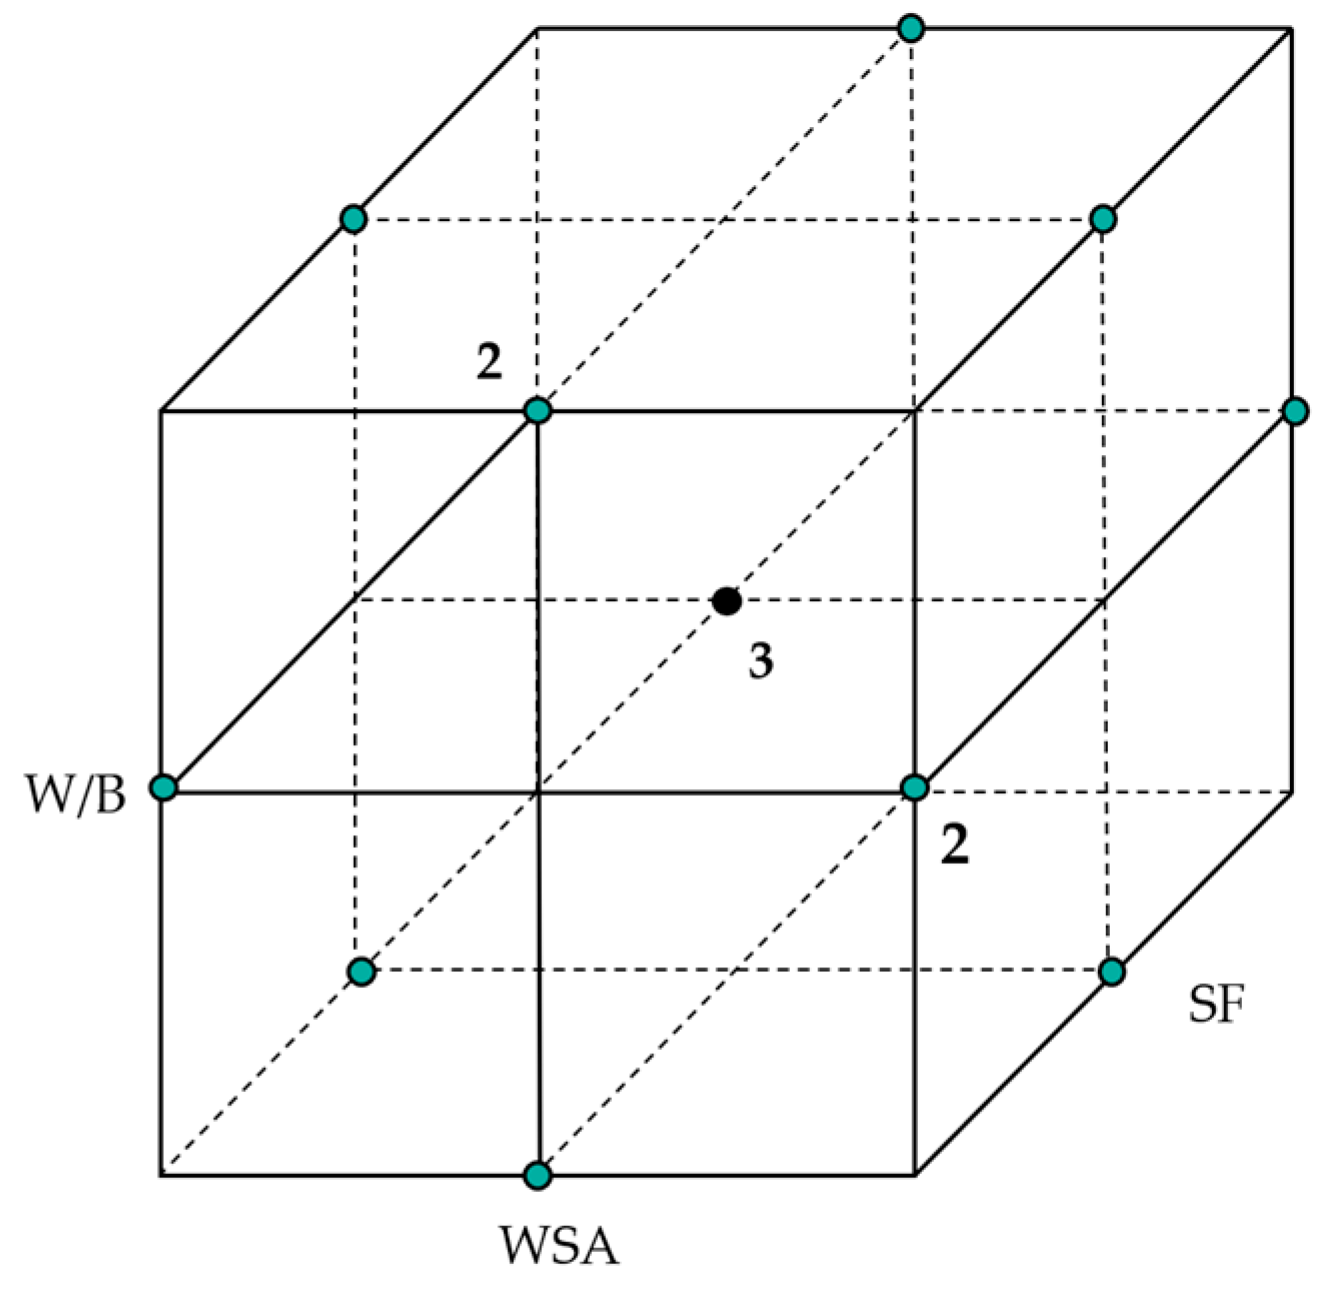
The experimental design was set up to subsequently build a Box-Behnken design (BBD) model capable of inferring intermediate values not necessarily tested in this investigation. Figure 1 presents an illustration of the BBD model experimental design space. The BBD allows for fewer experimental runs than does a central composite design (CCD) because the BBD needs only three levels defined (-1,0,1) whereas the CCD needs five (-α,-1,0,1,α). This methodology was used to predict the response variable with three input variables, in which the coefficients were estimated and adjusted to a mathematical model capable of being adjusted to check the effectiveness of the model [65]. The response surface methodology (RSM) allowed for the correct multivariable analysis, in which the variables of interest were affected by others. The objective of setting the BBD was that the experiments and thus the data collection would permit a model that fit in such a way that the response variable obtained accurate values, thus predicting the behavior of the variable in question. An example would be the determination of local tendencies, maxima, or minima [70], with the objective of improving the processes involved. The mathematical formulation of the BDD can be expressed as a quadratic or higher-order polynomial as shown in Equation (1):
Y = β 0 + i = 1 n β i x i + i = 1 n β i x i 2 + j = 1 n i = 1 n β i j x i x j + ε
where Y represents the variable to be predicted, x the values of each decision variable, β the regression coefficients, β 0 the expected value of Y if all the variables associated with the response are equal to 0, n the number of variables i, and j and ε a random error of the system [71].
To calculate the impact of using SCMs on the reduction of the carbon footprint, CO2eq/m3 was calculated using the CO2eq values (kg/kg) obtained from the literature with the mix ratios used according to the design considered above.
It can be seen how this value was obtained from Equation (2), which shows the CO2eq/m3 of a ternary mixture:
T e r n a r y   m i x t u r e C O 2 e q m 3 = C e m e n t C o n t e n t   k g m 3 x   C O 2 e q C e m e n t   k g k g + W S A C o n t e n t   k g m 3 x   C O 2 e q B i o m a s s A s h   k g k g + S F C o n t e n t   k g m 3 x   C O 2 e q S F   k g k g
As Equation 2 shows, increasing the replacement with both WSA and SF will decrease the CO2eq/m3. Therefore, in order to compare how the resistance obtained was related to the carbon footprint emitted, the intensity indicator was analyzed, which allowed the estimation of the global warming potential in the formulations by calculating the amount of binder required (kg/m3) to provide 1 MPa of resistance and was expressed as CO2eq/m3/MPa.

2.2.2. Mixing and Preparation of Specimens

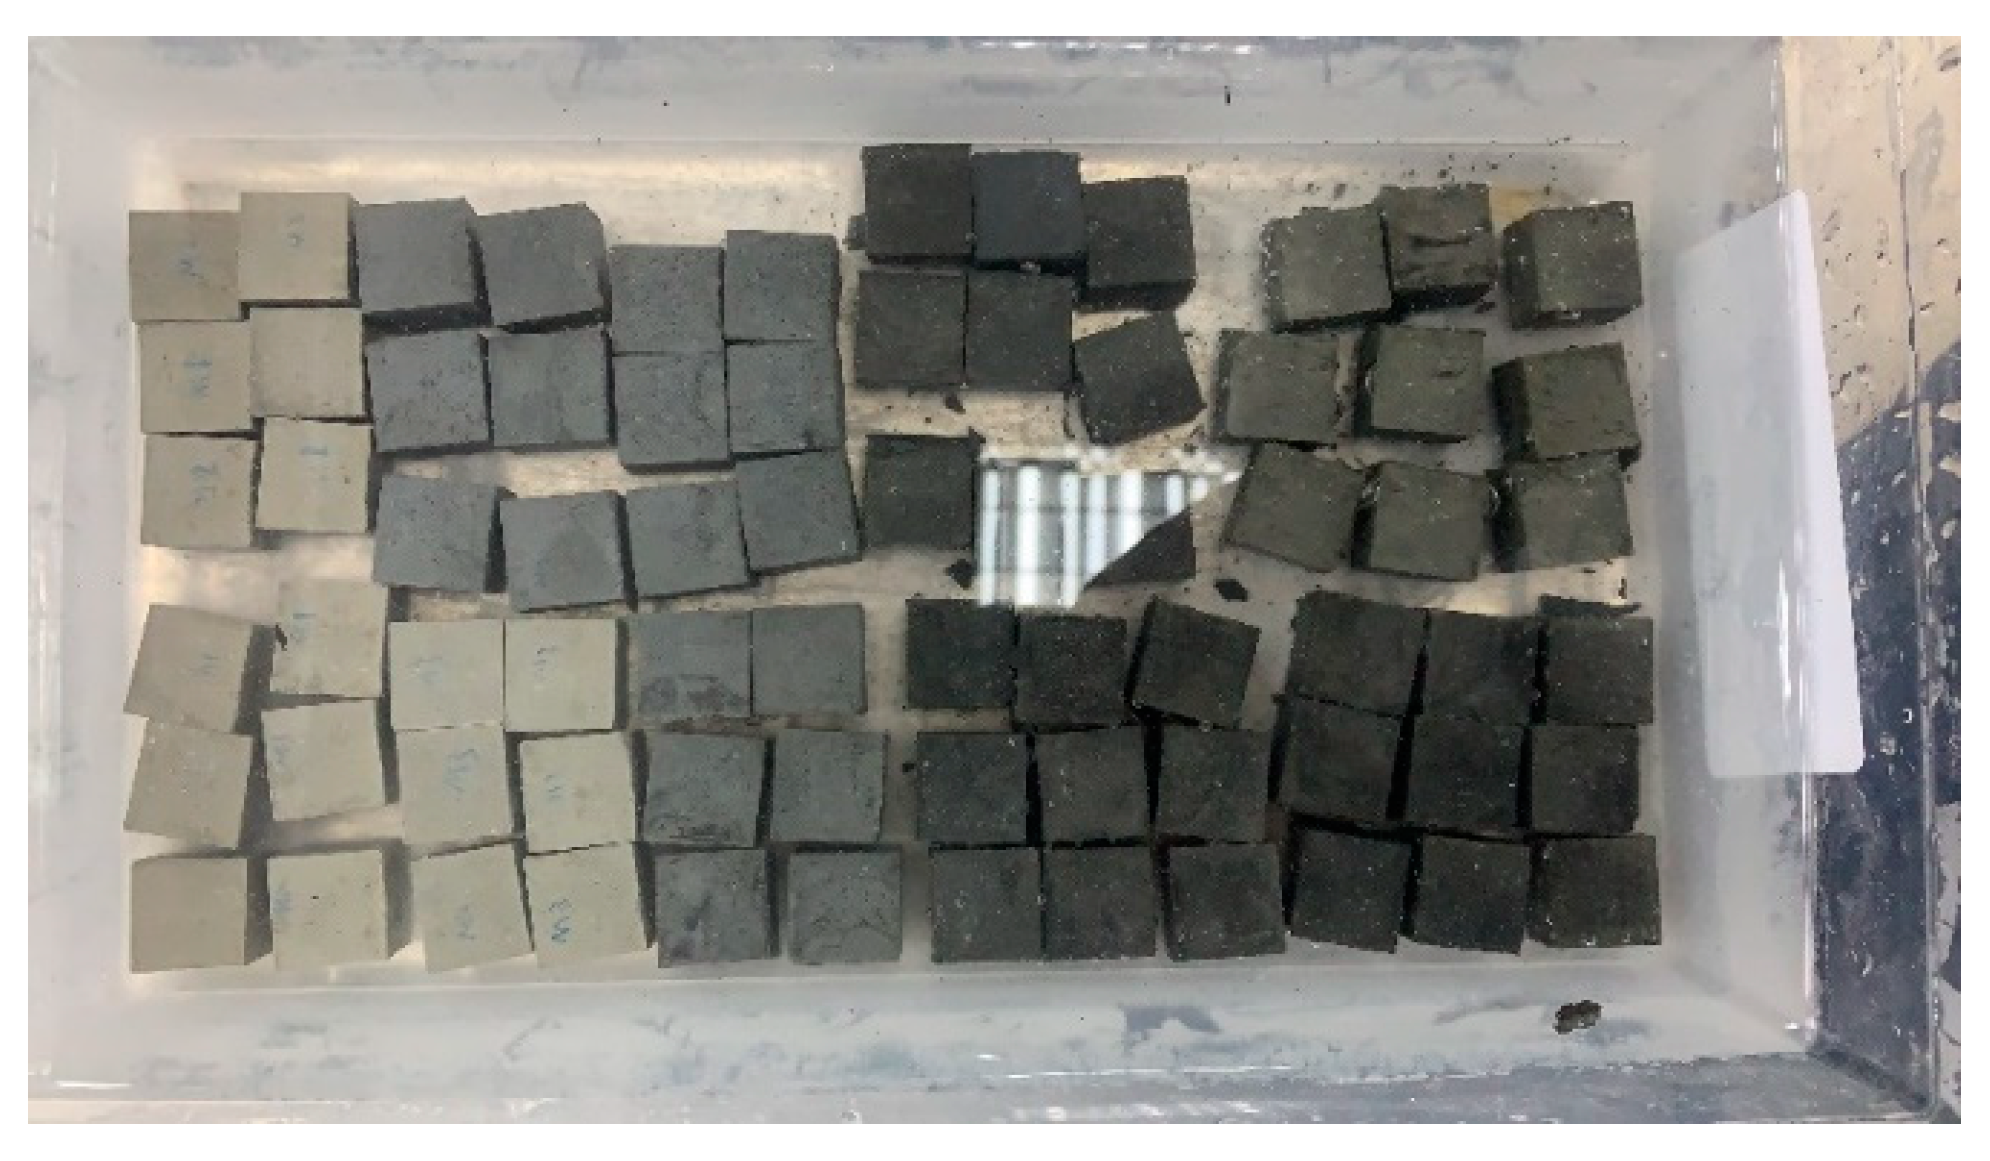
The materials were mixed in accordance with the ASTM C305-20 standard [72] using a mechanical overhead stirrer to homogenize the dry components prior to the addition of water. Cubic specimens were manufactured following ASTM C109-21 [73], with dimensions of 20 mm to optimize resource utilization. A total of nine specimens were cast for each cement paste mixture with the aim of assessing the evolution of compressive strength after 7, 28, and 56 days of curing (three identical specimens for each time interval). The specimens were stored in a curing chamber, maintaining temperature and relative humidity conditions as prescribed by ASTM C511-13 [74] for a duration of 24 hr. Subsequently, the specimens were demolded and immersed in water until testing as can be seen in Figure 2.

2.2.3. Particle Size Distribution

The particle size distribution was performed in the raw materials by wet method laser diffraction using a Mastersizer 2000 (Malvern Instruments) Hydro 2000S wet sample dispersion unit with recirculating pump. The dispersant used was isopropyl alcohol.

2.2.4. Compressive Strength Tests

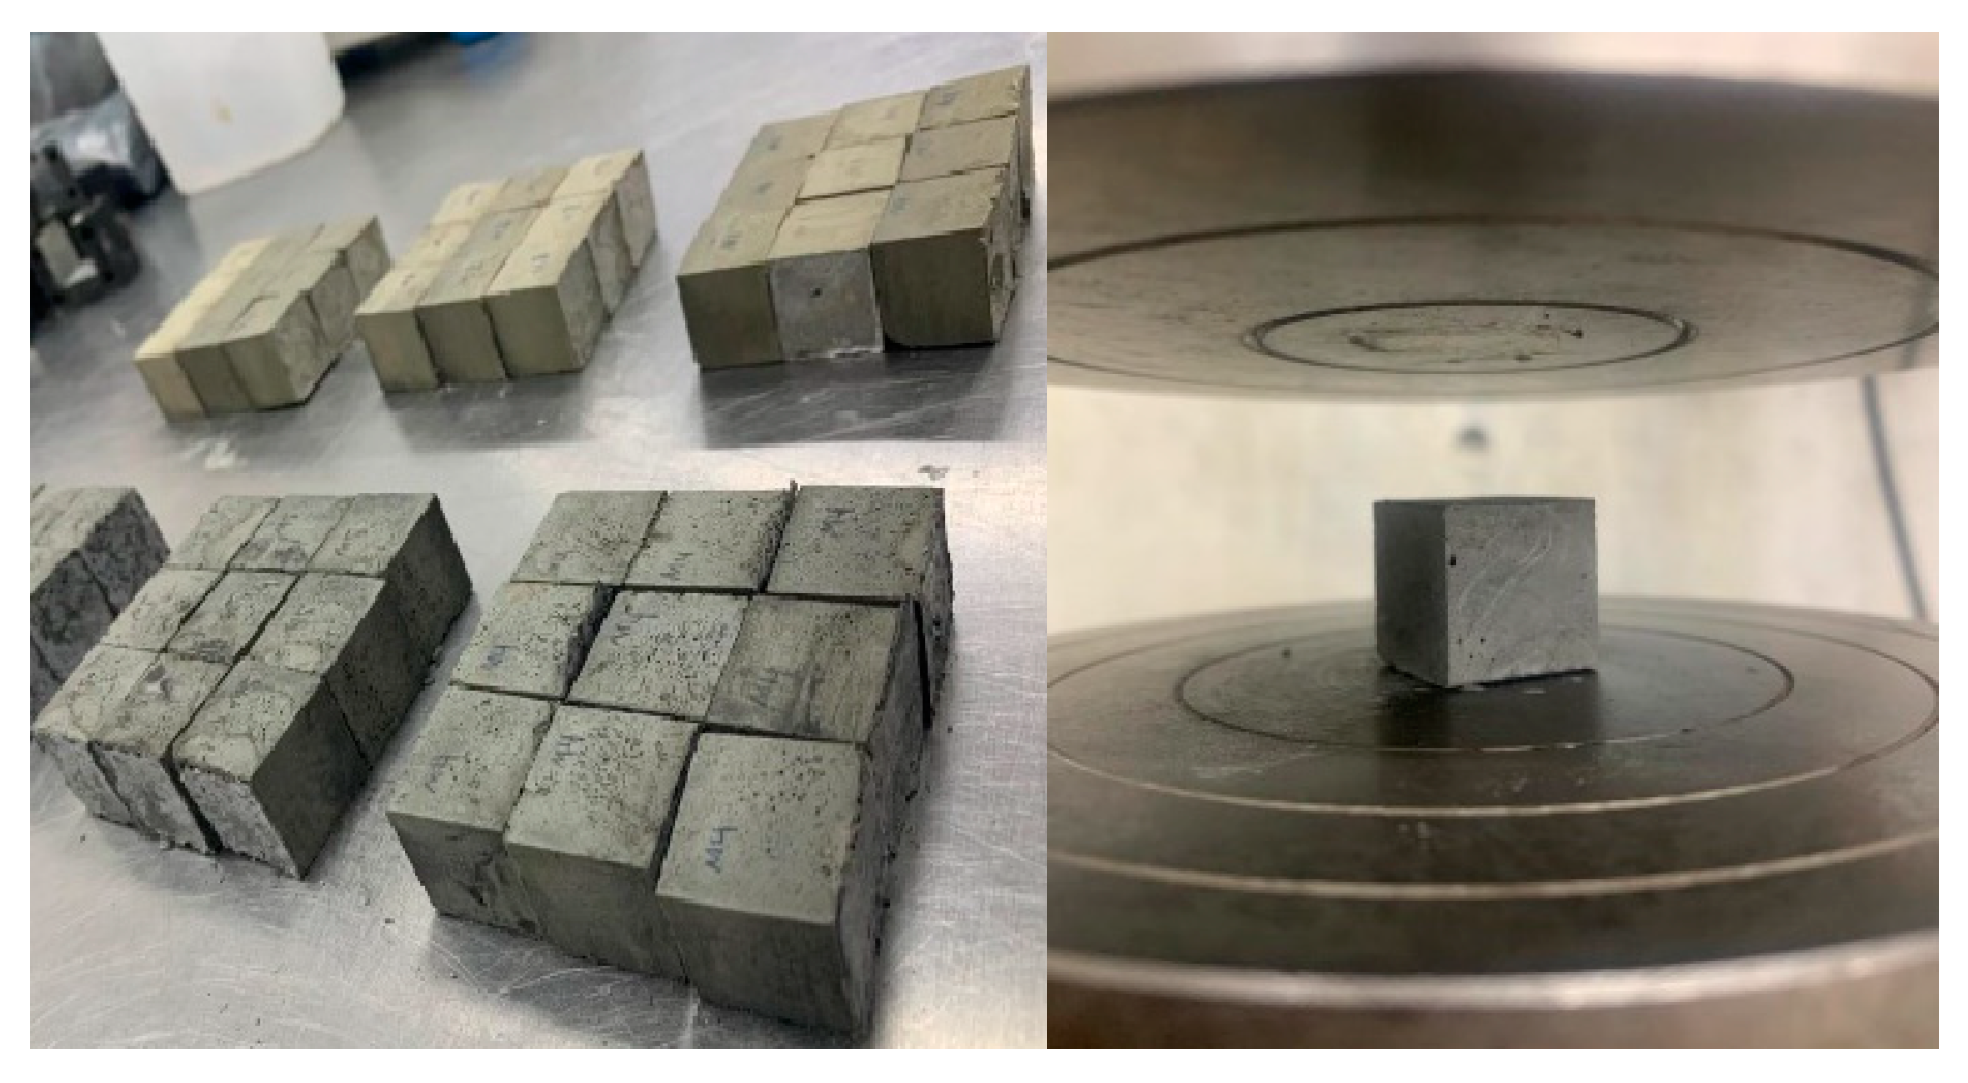
As per the ASTM C109-21 [73] standard, compression tests were performed on cubic specimens using a 300 kN-capacity universal testing machine Laryee UE34300 at a loading rate of 2.4 kN/s at 7, 28, and 56 days old with three specimens tested at each age. Figure 3 shows the different samples that were tested in compression.

2.2.5. Field Emission Scanning Electron Microscopy/Energy-Dispersive X-ray Spectroscopy

The field emission scanning electron microscopy (FE-SEM) analysis of all paste mixes was performed on crushed specimens at 56 days old. Samples of raw materials (cement, WSA, SF) were also analyzed using a Quanta FEG250 microscope. All specimens were examined for changes in morphology and composition, and magnification scales were chosen according to representative particle sizes. All the samples were spread on carbon tape and coated with a gold layer approximately 5 nm thick to improve sample conductance.

2.2.6. Isothermal Calorimetry

The isothermal calorimetry was performed in the paste mixtures according to ASTM C1679– 14 [75] using a TAM Air isothermal calorimeter at 23°C for 7 days with duplicated samples for each mixture. The fresh mixtures were weighted with an ampoule and directly placed in the calorimeter. The heat-release rate was normalized according to the weight of cementitious materials.

2.2.7. X-ray Fluorescence

The analysis of the samples was conducted using a wavelength dispersive sequential spectrometer (WDX, S4 equipment). The measurement was performed using the Fast-Vac34 method.

3. Results and Discussion

3.1. Discussion of the Experimental Results

3.1.1. Particle Size Distribution

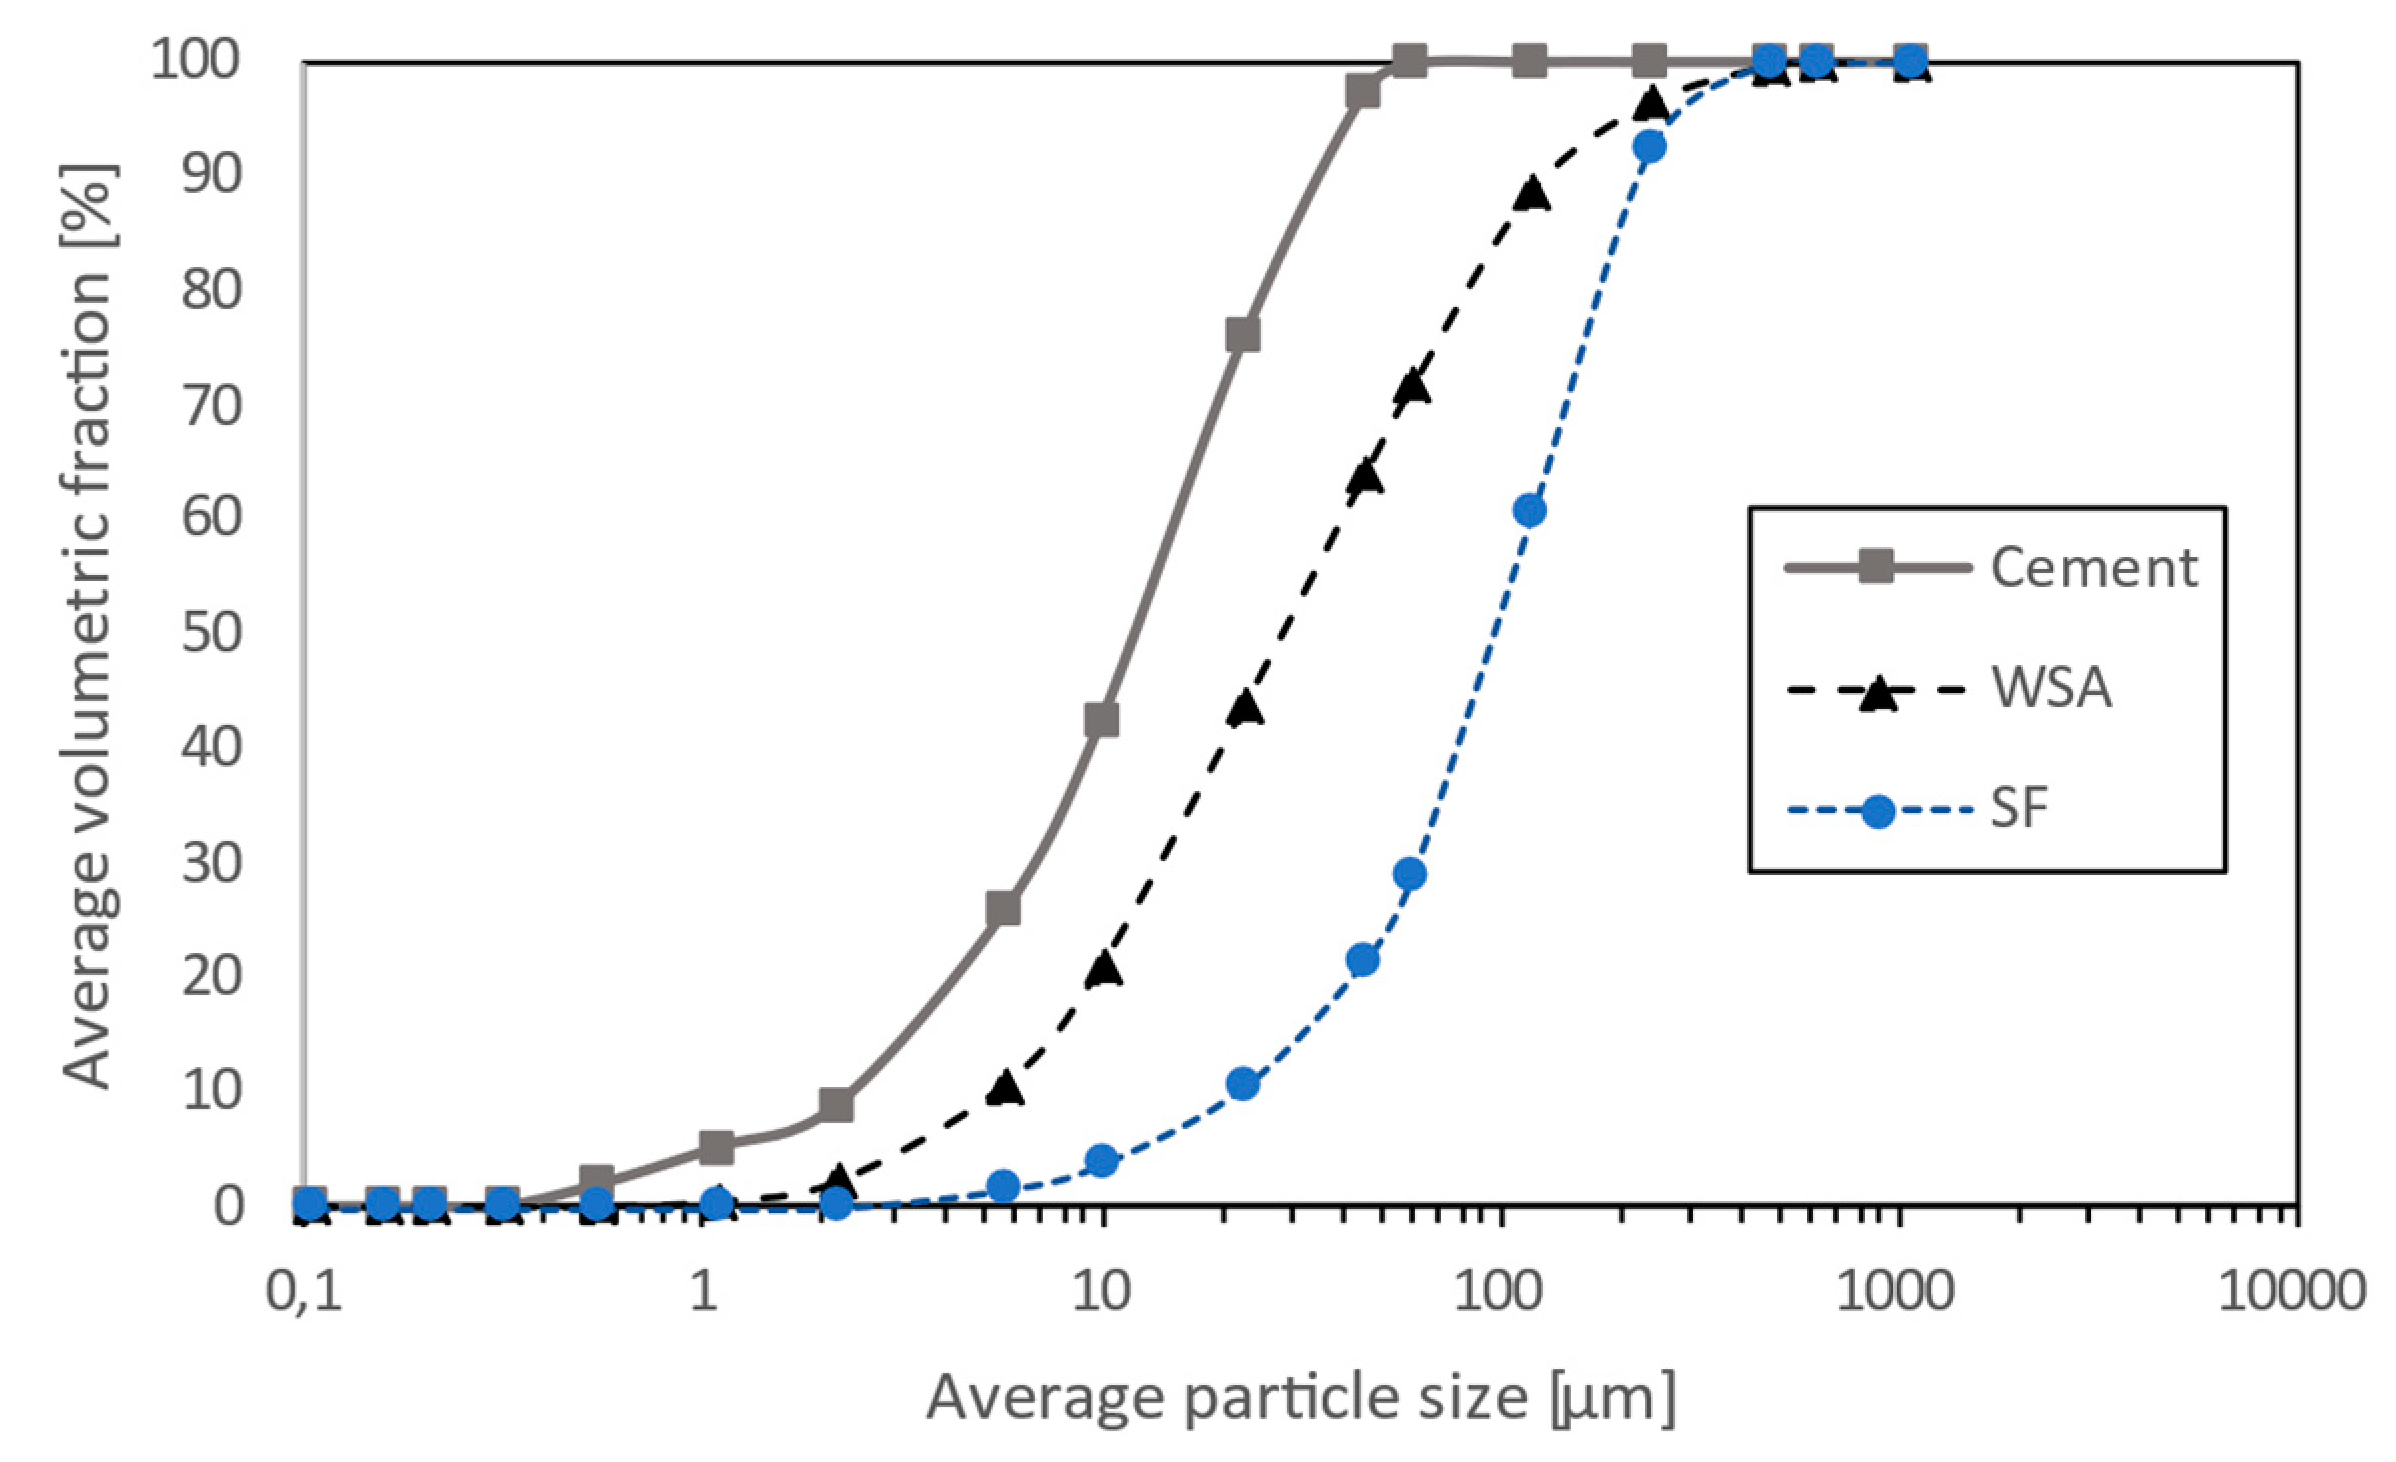
The particle size distribution (PSD) is summarized in Figure 4. The cement particles had an average particle size ( D 50 ) of 14.22 μm. WSA had a D 50   of 32.2 μm and presented a wider distribution, which therefore could have improved the packing density of the blends [76]. SF was the finest material, with a D 50   of 0.674 μm; however, in Figure 4, it appears as the coarsest material, with a D 50 of 113 μm, because particles were agglomerated, so the properties of blended cement pastes may have been controlled by the agglomerated size of this particle, which led to the pozzolanic reactivity potential of this SCM decreasing considerably, resulting in an increase in the late-age strength of the mixtures [77].

3.1.2. Field Emission Scanning Electron Microscopy

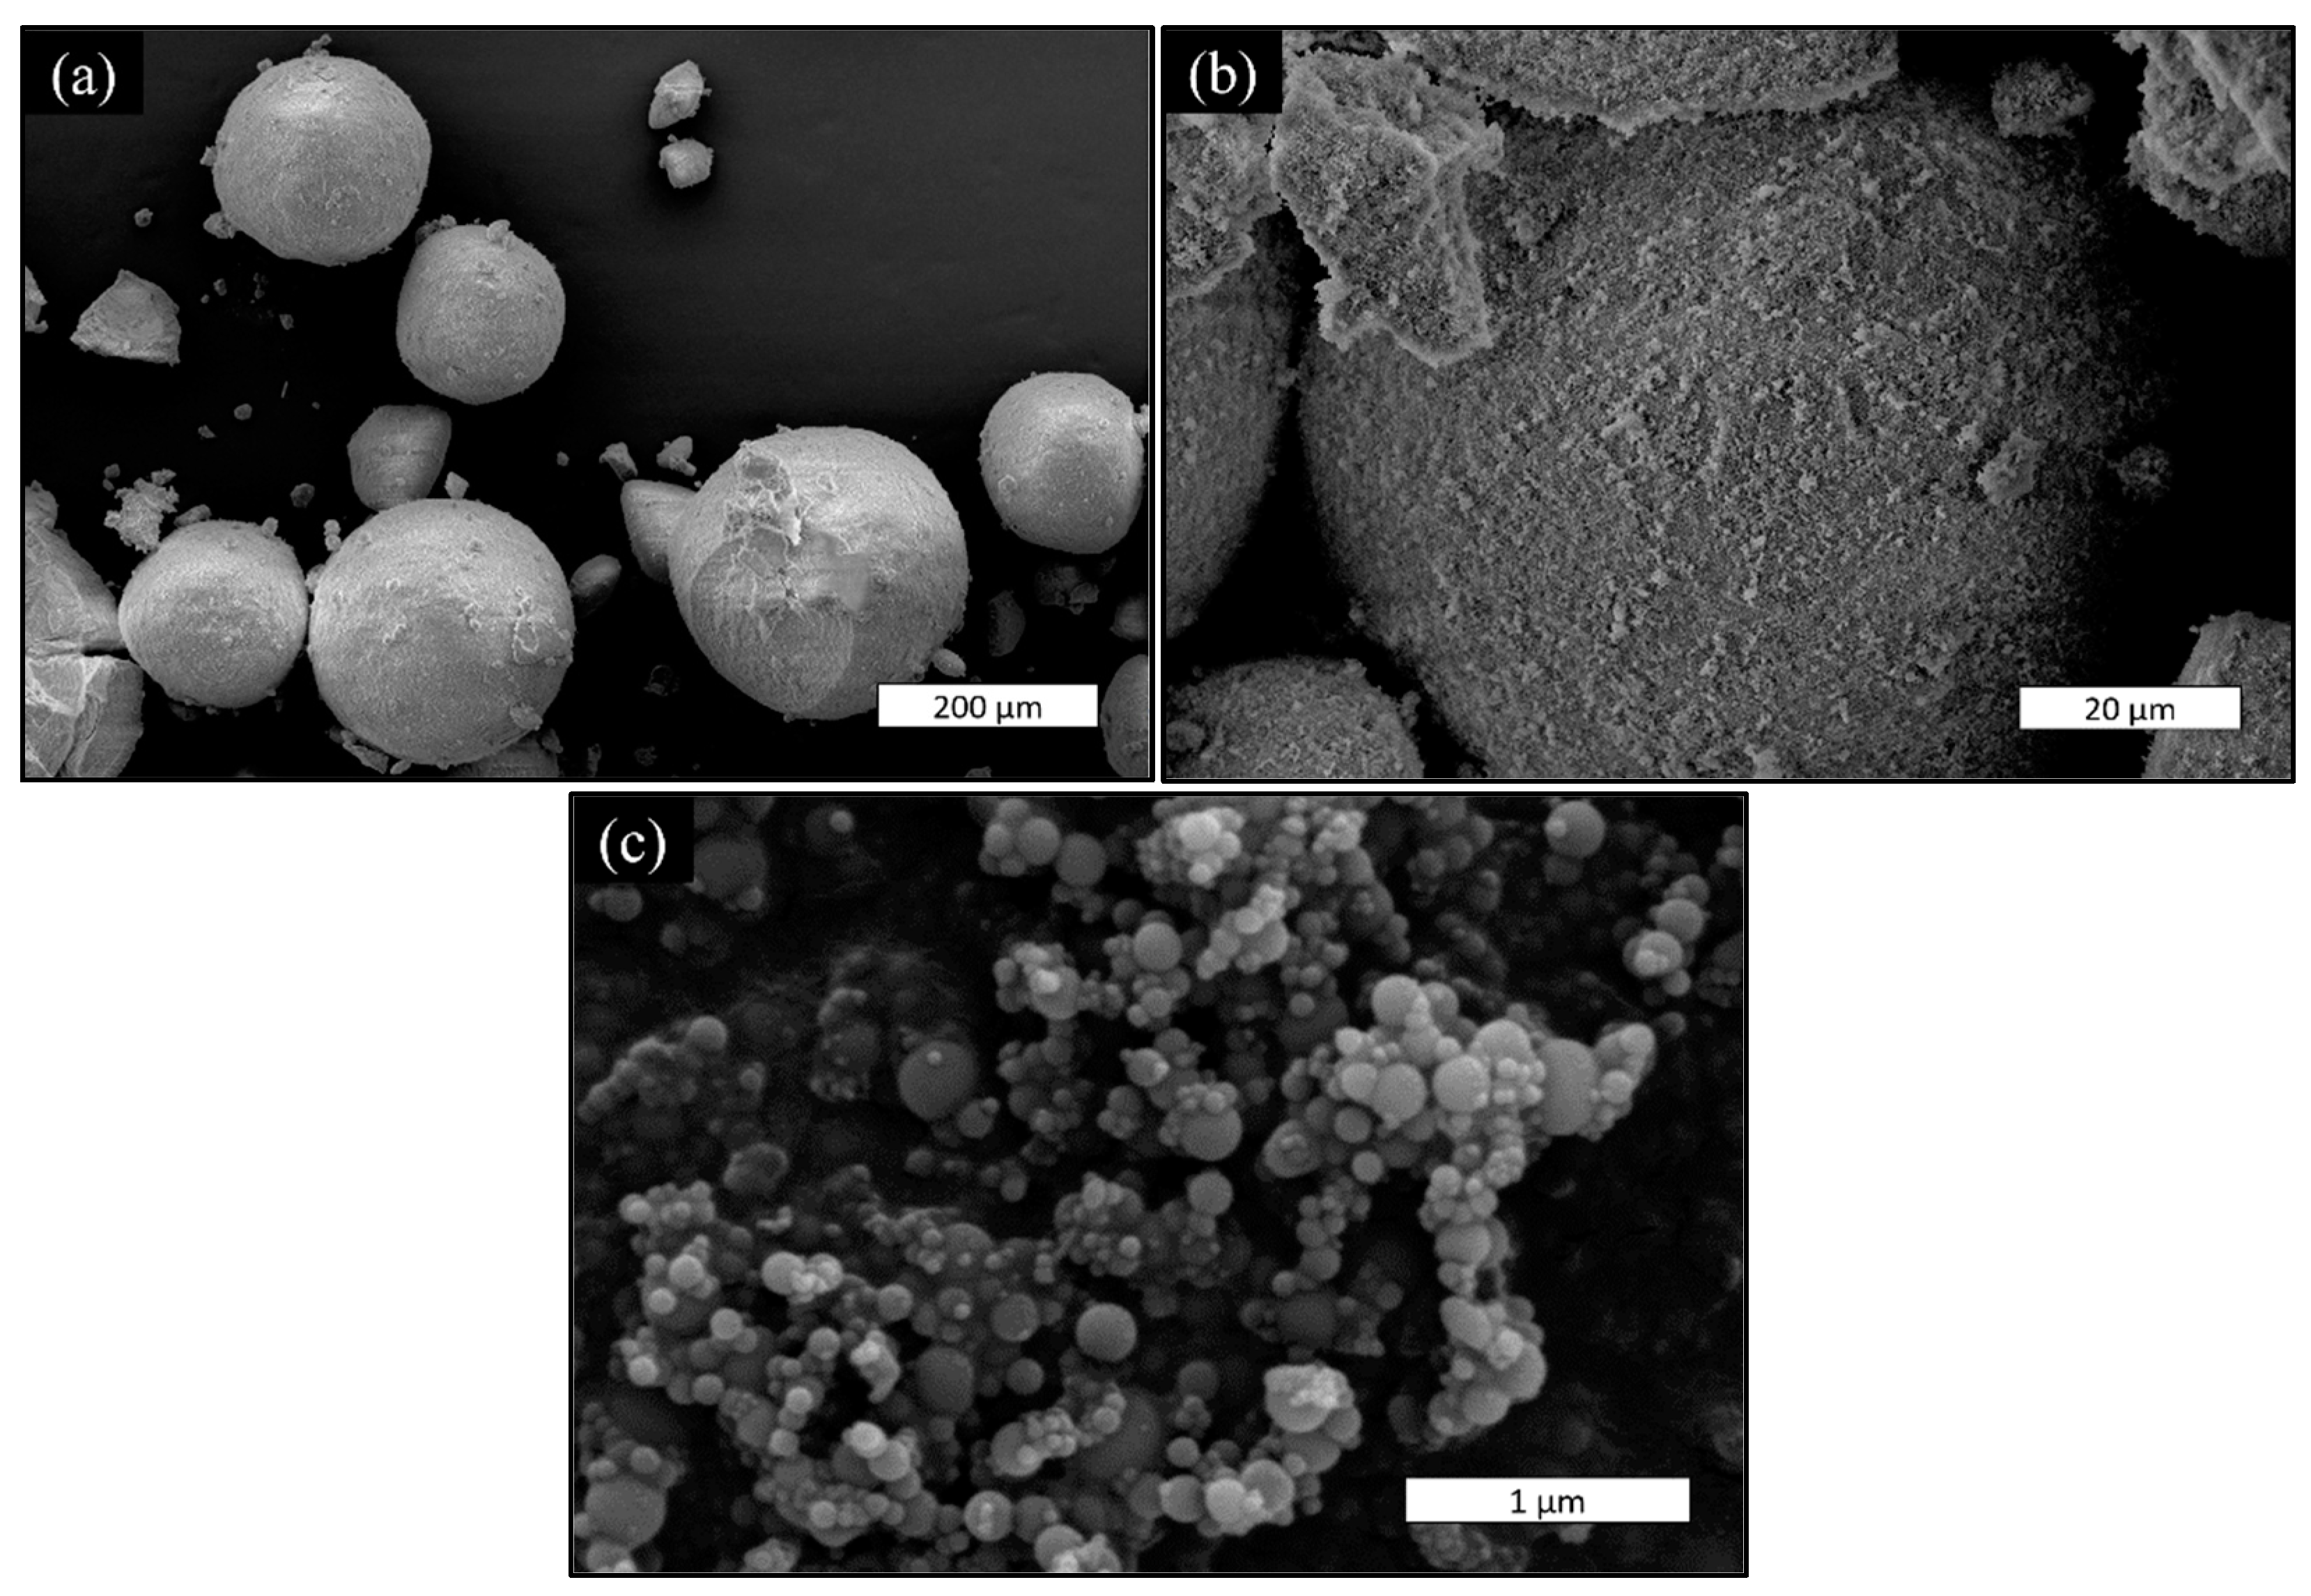
The morphological characteristics of the materials were visualized by Field Scanning Electron Microscopy (FE-SEM). It was observed that the SF was in an agglomerated state with a large spherical shape (see Figure 5 (a and b)) by a large number of fine SF particles, approximately < 1 um (see Figure 5 (c)), which was in concordance with the PSD test shown in Figure 4.
This size of the agglomerated silica particles directly affected the strength of the cementitious mixes. Since the pozzolanic reaction would only take place at the agglomeration surface and at early ages, the strength of cement pastes would be most affected because, for conventional concrete mixes, the aggregates are able to separate these particles [78,79].
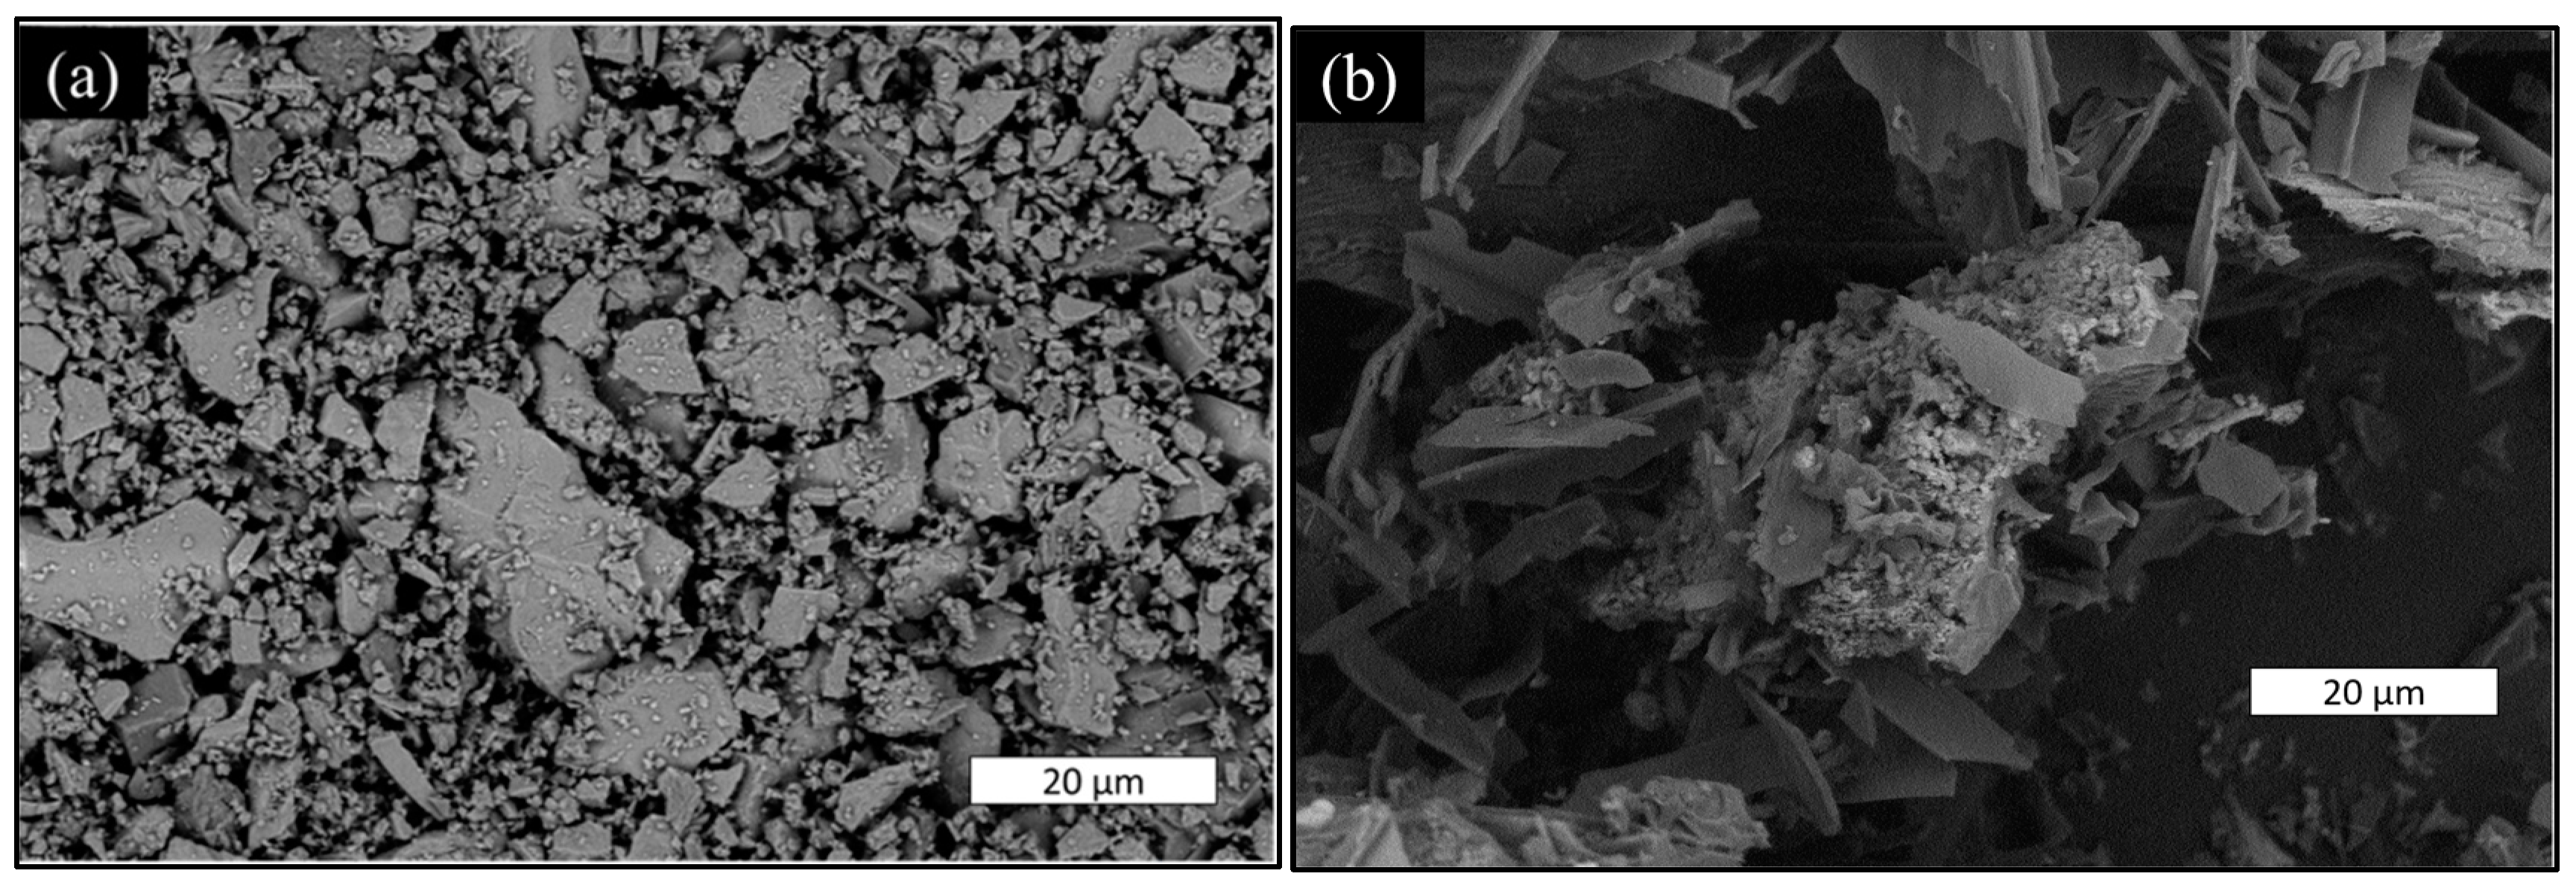
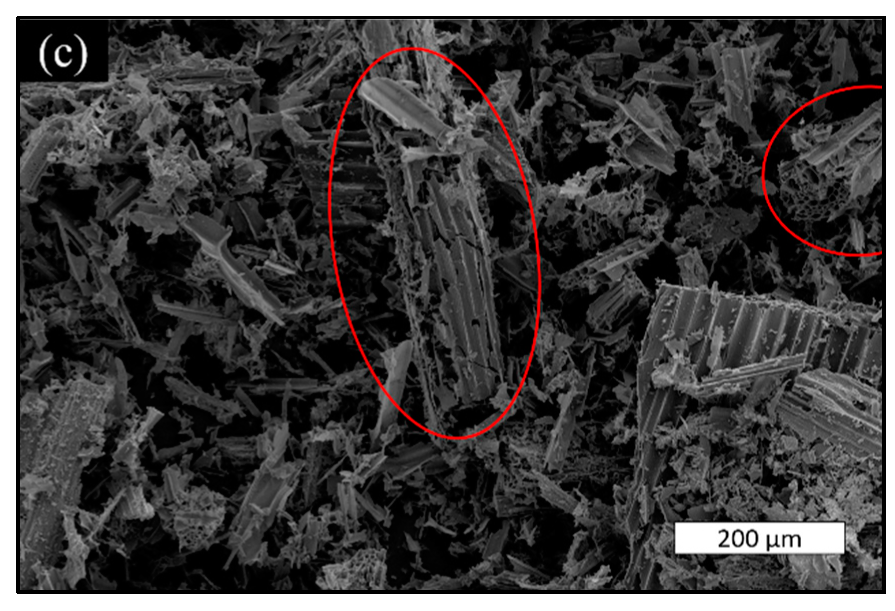
The FE-SEM of the rest of the constituents at a scale of 20 mm is shown in Figure 6. As can be seen in this figure, cement particles were the smallest, followed by WSA and SF, respectively. Figure 6 (a) shows the cement with particles of different sizes, where an angular morphology can be appreciated. Figure 6 (b) and (c) show two distinct structures: on the one hand, elongated and flat structures in the longitudinal direction and, on the other hand, a honeycomb structure corresponding to a cross section of the WSA particle. Moreover, as can be observed, these ashes are very porous, thus explaining the decrease of workability in the mixtures because the pores absorbed the mixing water [80].

3.1.3. Isothermal Calorimetry

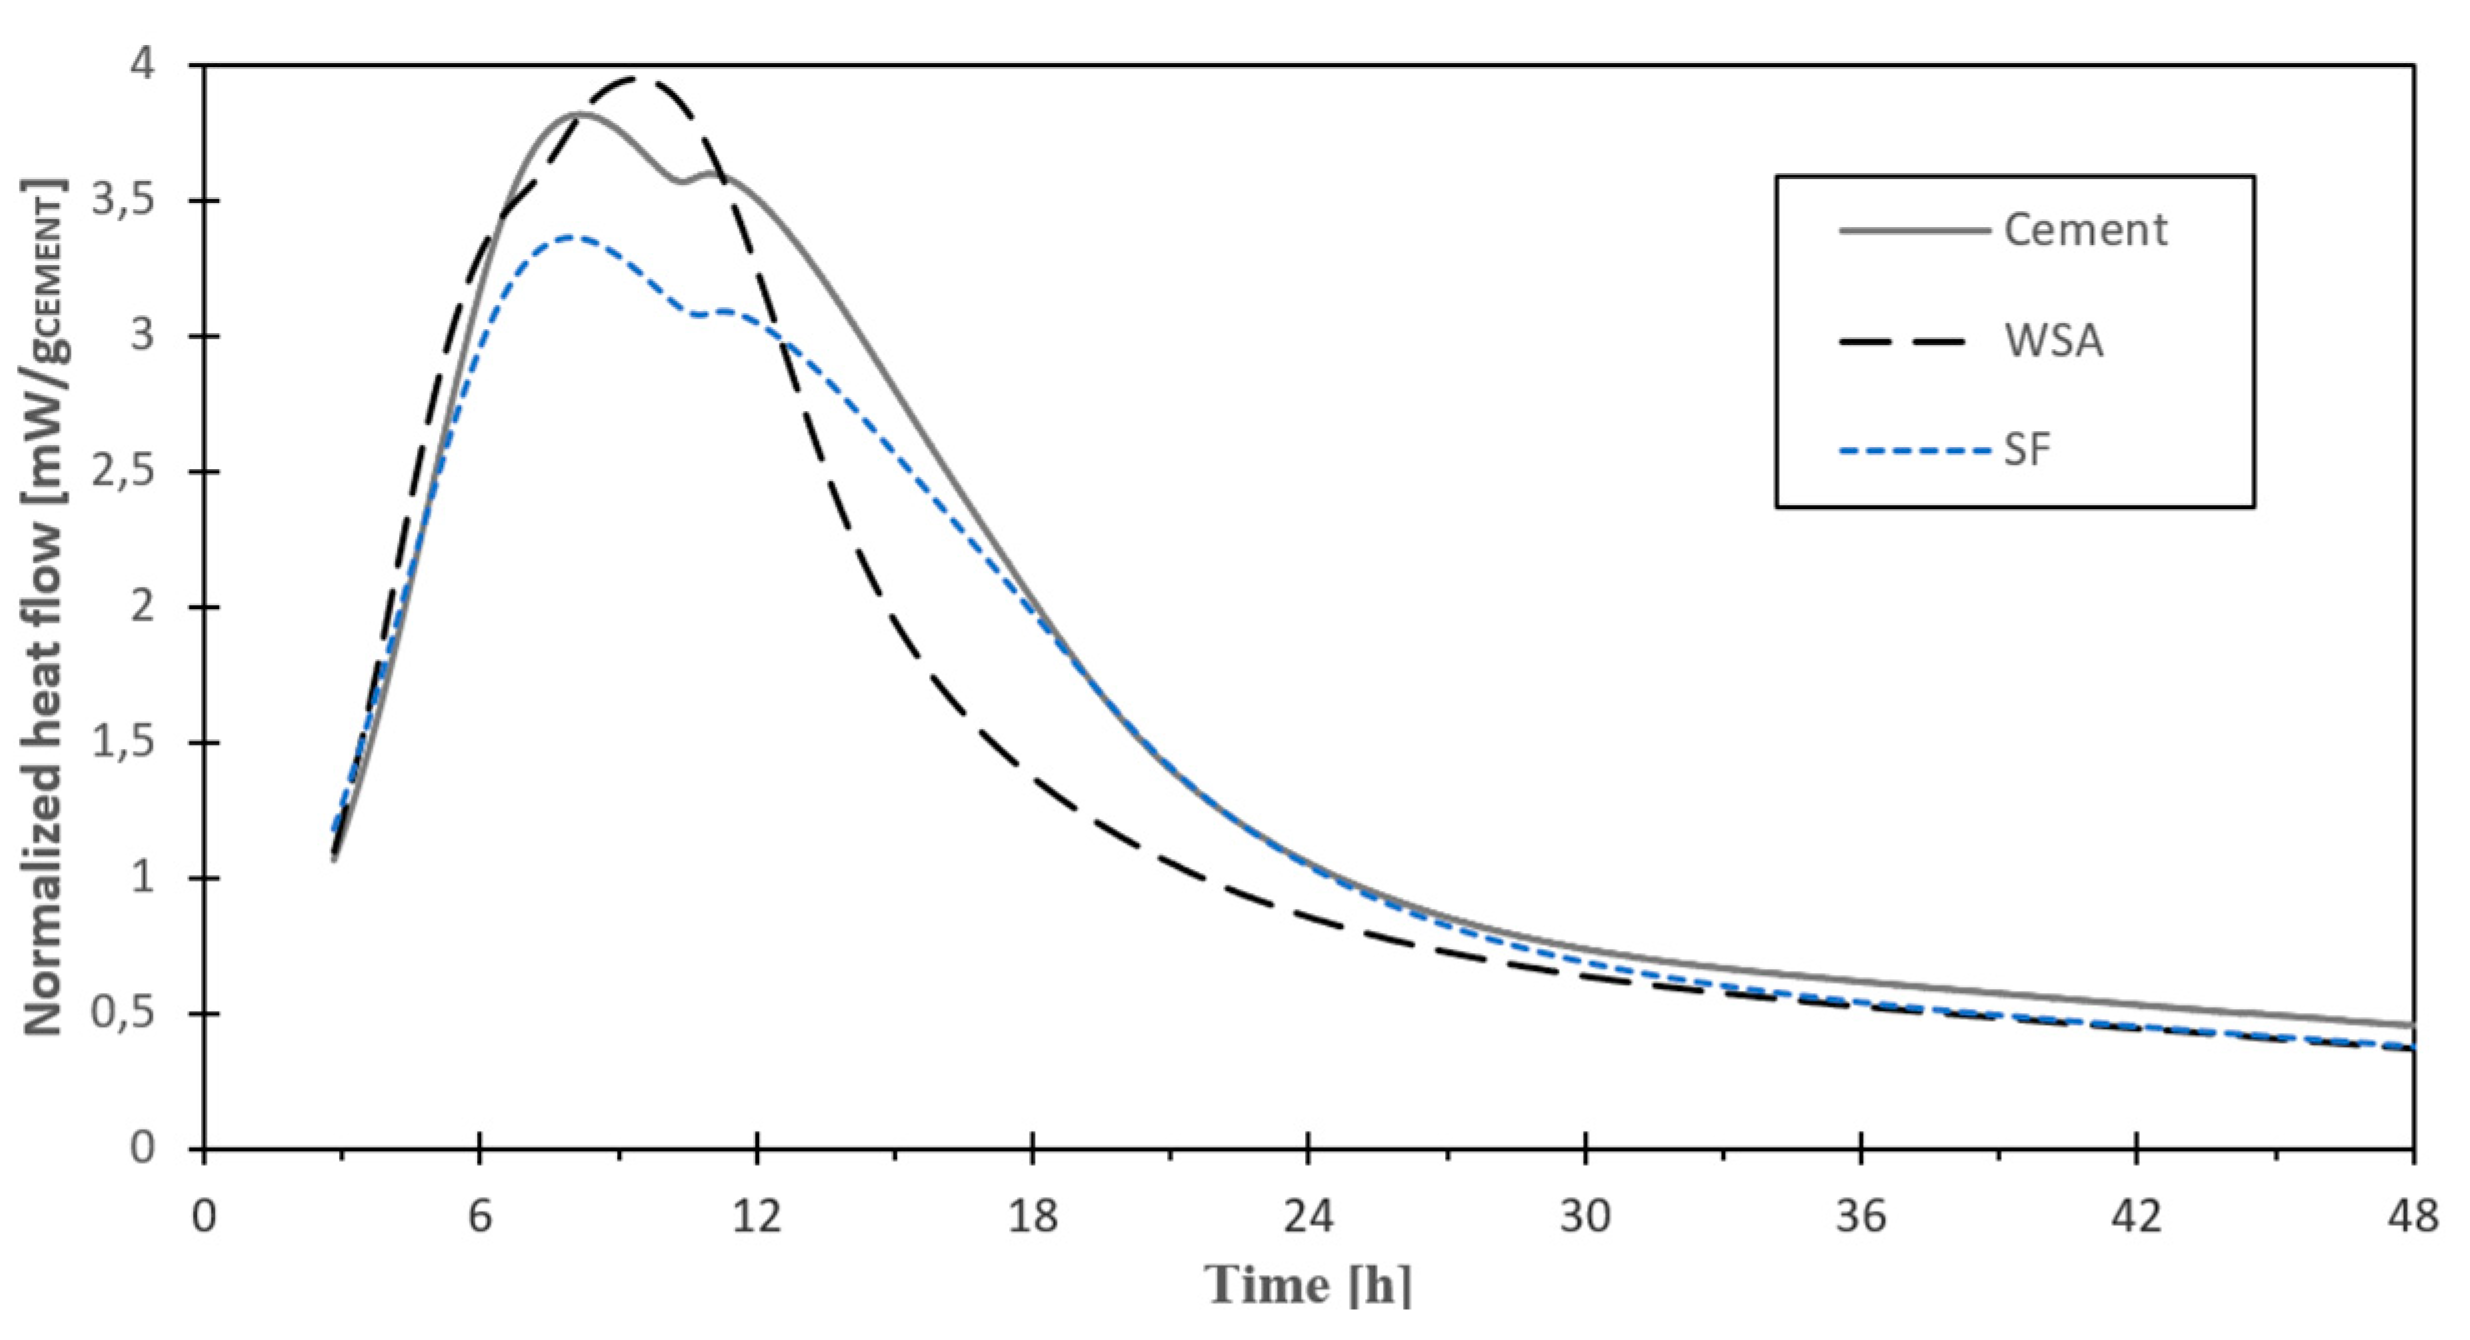
The normalized hydration heat and the normalized heat flow from selected mixtures at 48 hr are presented in Figure 7 and Figure 8, respectively. In the mixes nomenclature of BBD experimental design that it is explained in Section 3.1.5, B corresponds to the W/B ratio, W to WSA, and S to SF. A water-cement ratio of W/B = 0.5 was used for all the mixtures in the calorimetry test. The mixtures used for the analysis corresponded to a cement-only mixture (B0.5W0S0), a binary mixture with WSA (B0.5W20S0), and another with SF (B0.5W0S0). The B0.5W0S10 mix showed the highest value of hydration heat when the calorimetry data were normalized by cement. This result indicated that the B0.5W0S10 mix produced the highest number of hydration products during the first 24 hr.

3.1.4. X-ray Fluorescence of Raw Materials

As shown in Table 2, the cement was mainly composed of CaO , SiO 2 , Al 2 O 3 , and Fe 2 O 3 , which were present in silicate and aluminate forms. SF was composed almost entirely of SiO 2 in 95.5% of its weight. Finally, the WSA obtained was mainly composed of SiO 2 , K 2 O , and CaO. However, the oxides did not total 100% because there was organic matter that was calcined in the form of carbon, and this was not detected by the equipment.

3.1.5. BBD Experimental Design

In order to determine the compressive strength of the 15 mixes (combinations), Table 3 presents how the different levels (-1,0,1) were distributed for the three studied variables, W/B, WSA and SF, where the last two show the percentage of cement replacement by weight; for example, for the first mix, the levels were -1, -1, and 0, which means a water-cement ratio of 0.4, with 0% WSA cement replacement and 5% SF cement replacement.
In the mixture’s nomenclature of BBD experimental design, B corresponds to the W/B ratio, W to WSA, and S to SF.

3.1.6. Compressive Strength of Hardened Samples

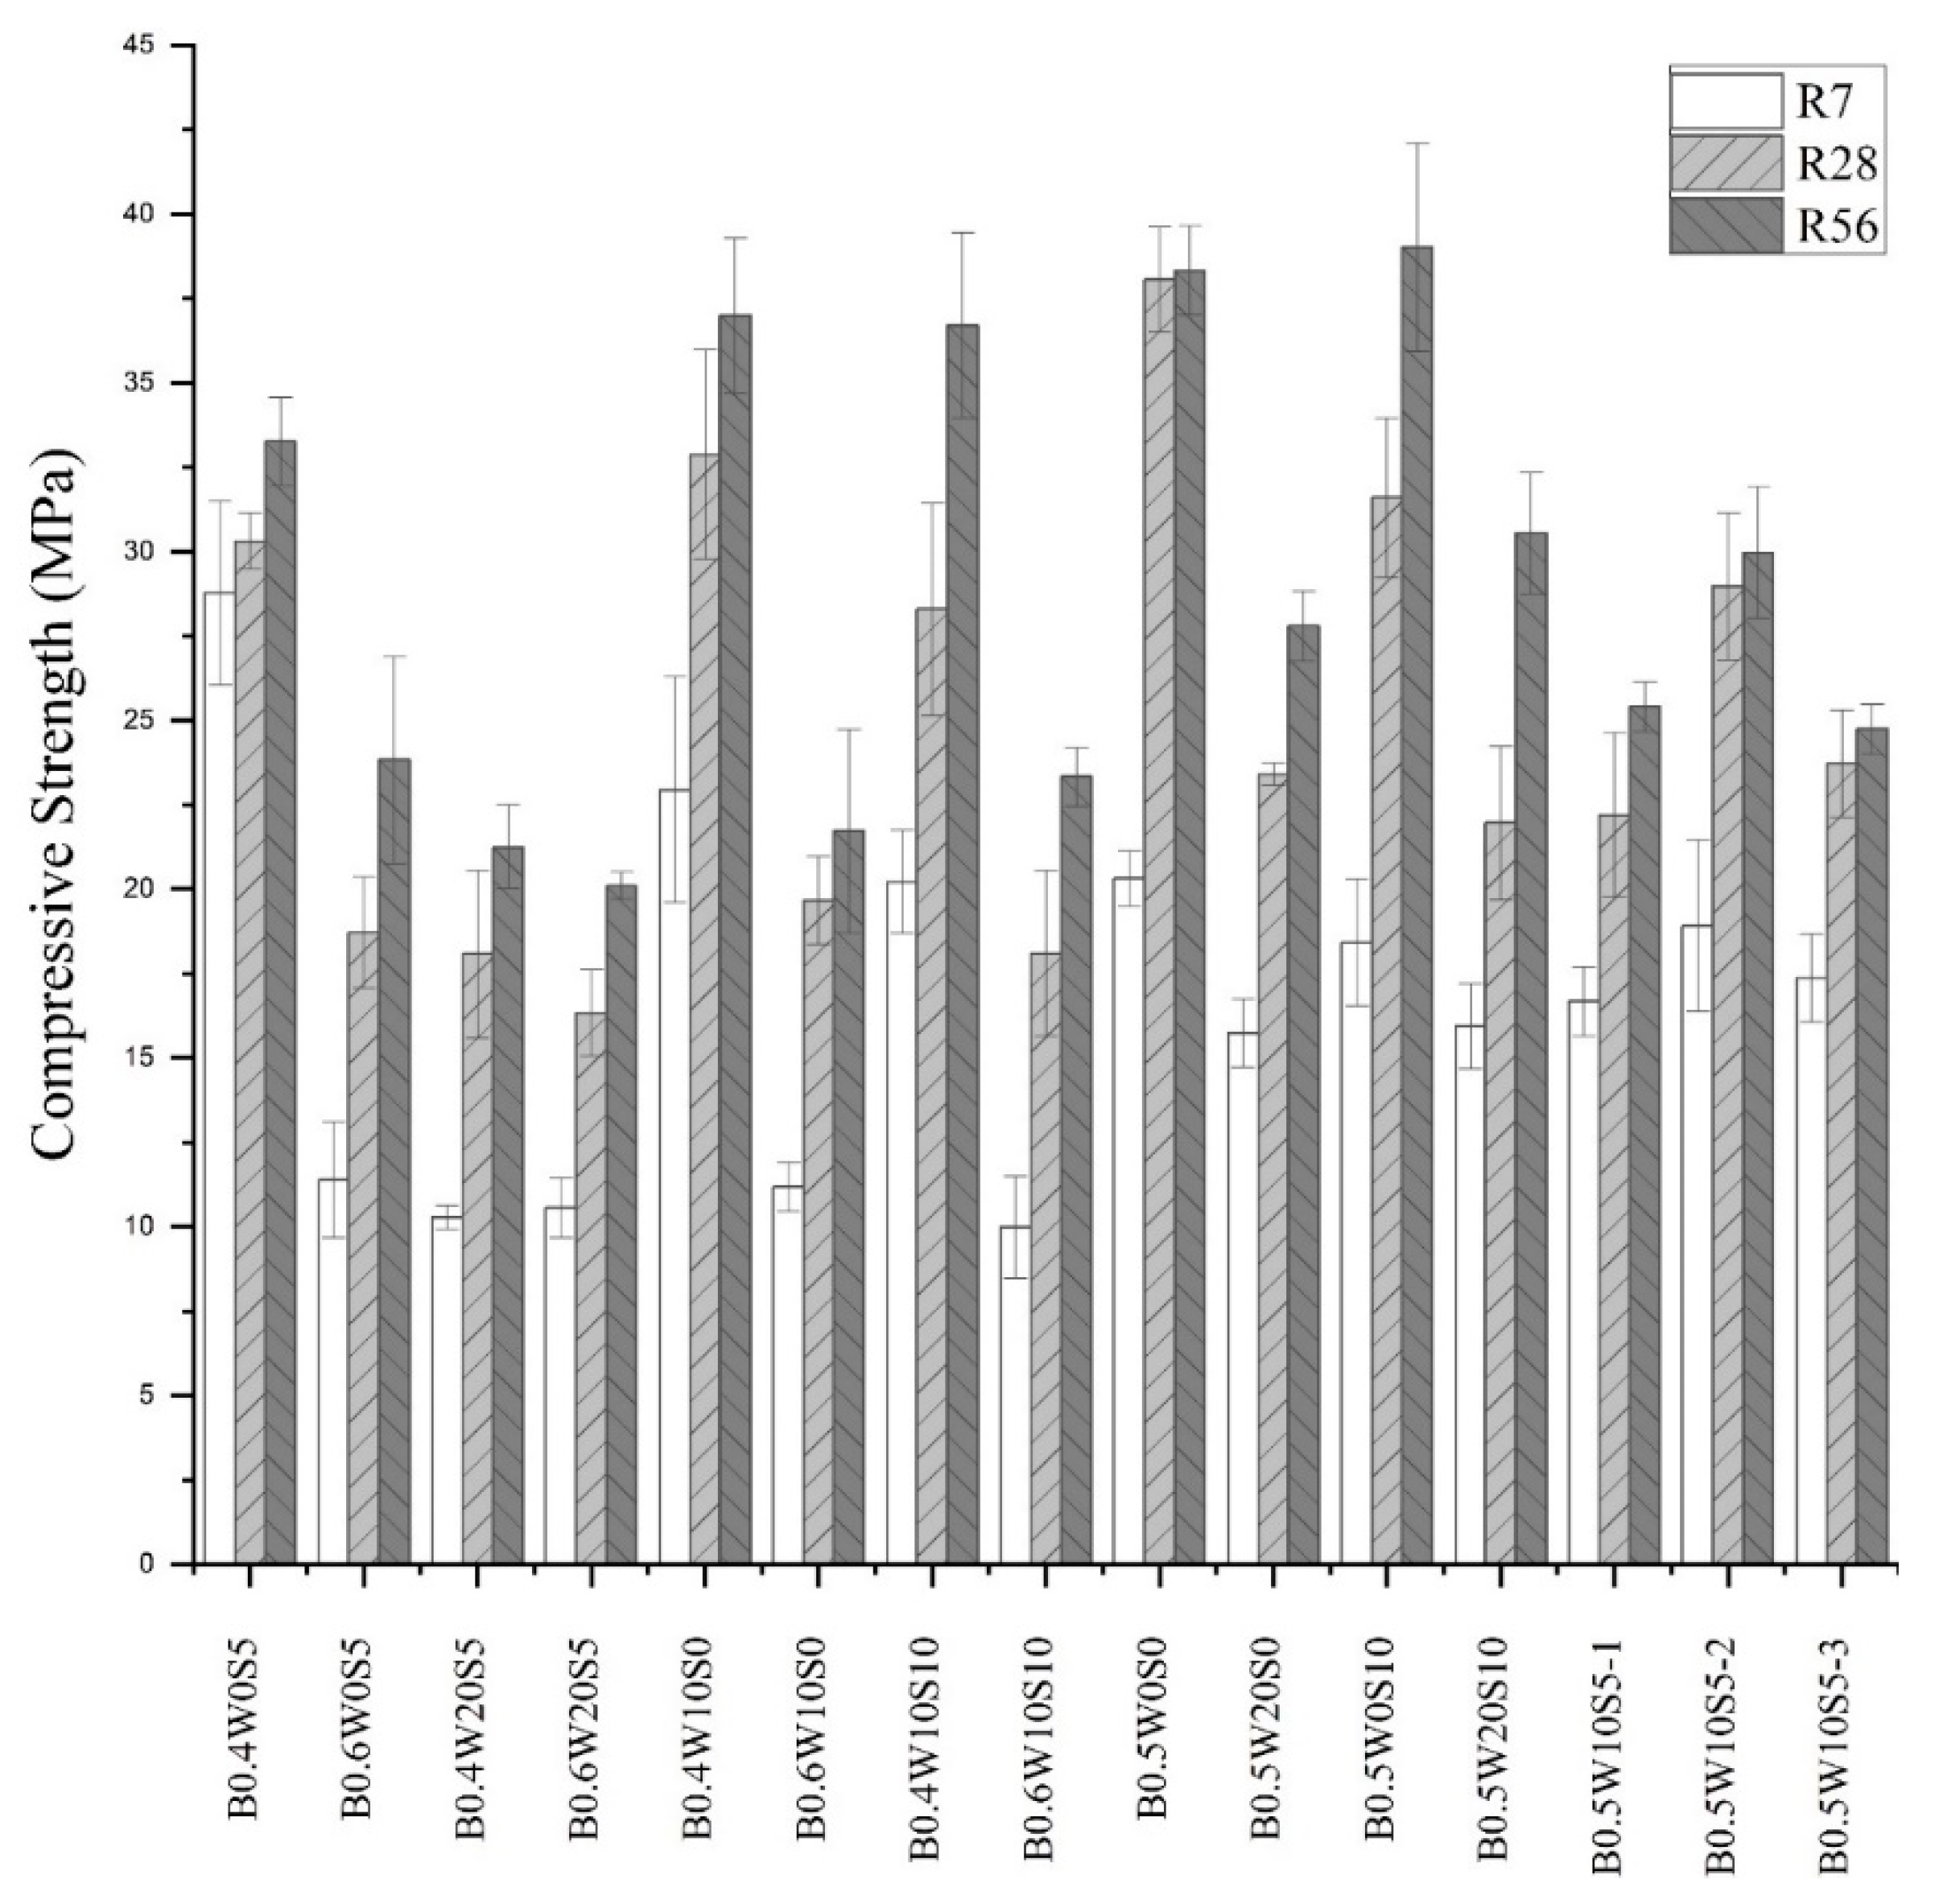
Figure 9 presents the results of compressive strengths for each mix at 7, 28, and 56 days of curing. From Figure 9 it is possible to determine that, in general, compressive strength increased with age. Also, these results are used to build the model and the regression analysis presented in the next section.
As evidenced in Figure 9, the compressive strength of the different combinations presented some variability as expected, and some combinations did not have high strength. The agglomerated silica particles may have directly affected the strength of the cementitious mixes. Since the pozzolanic reaction only took place at the agglomeration surface and at early ages, the strength of cement pastes would have been most affected because, for conventional concrete mixes, the aggregates were able to separate these particles [78,79]. Therefore, based on the literature and results obtained by SEM and PSD, in the mixtures in this study, the particle size of the agglomerated micro silica was the one that controlled the mechanical properties of the cement pastes.
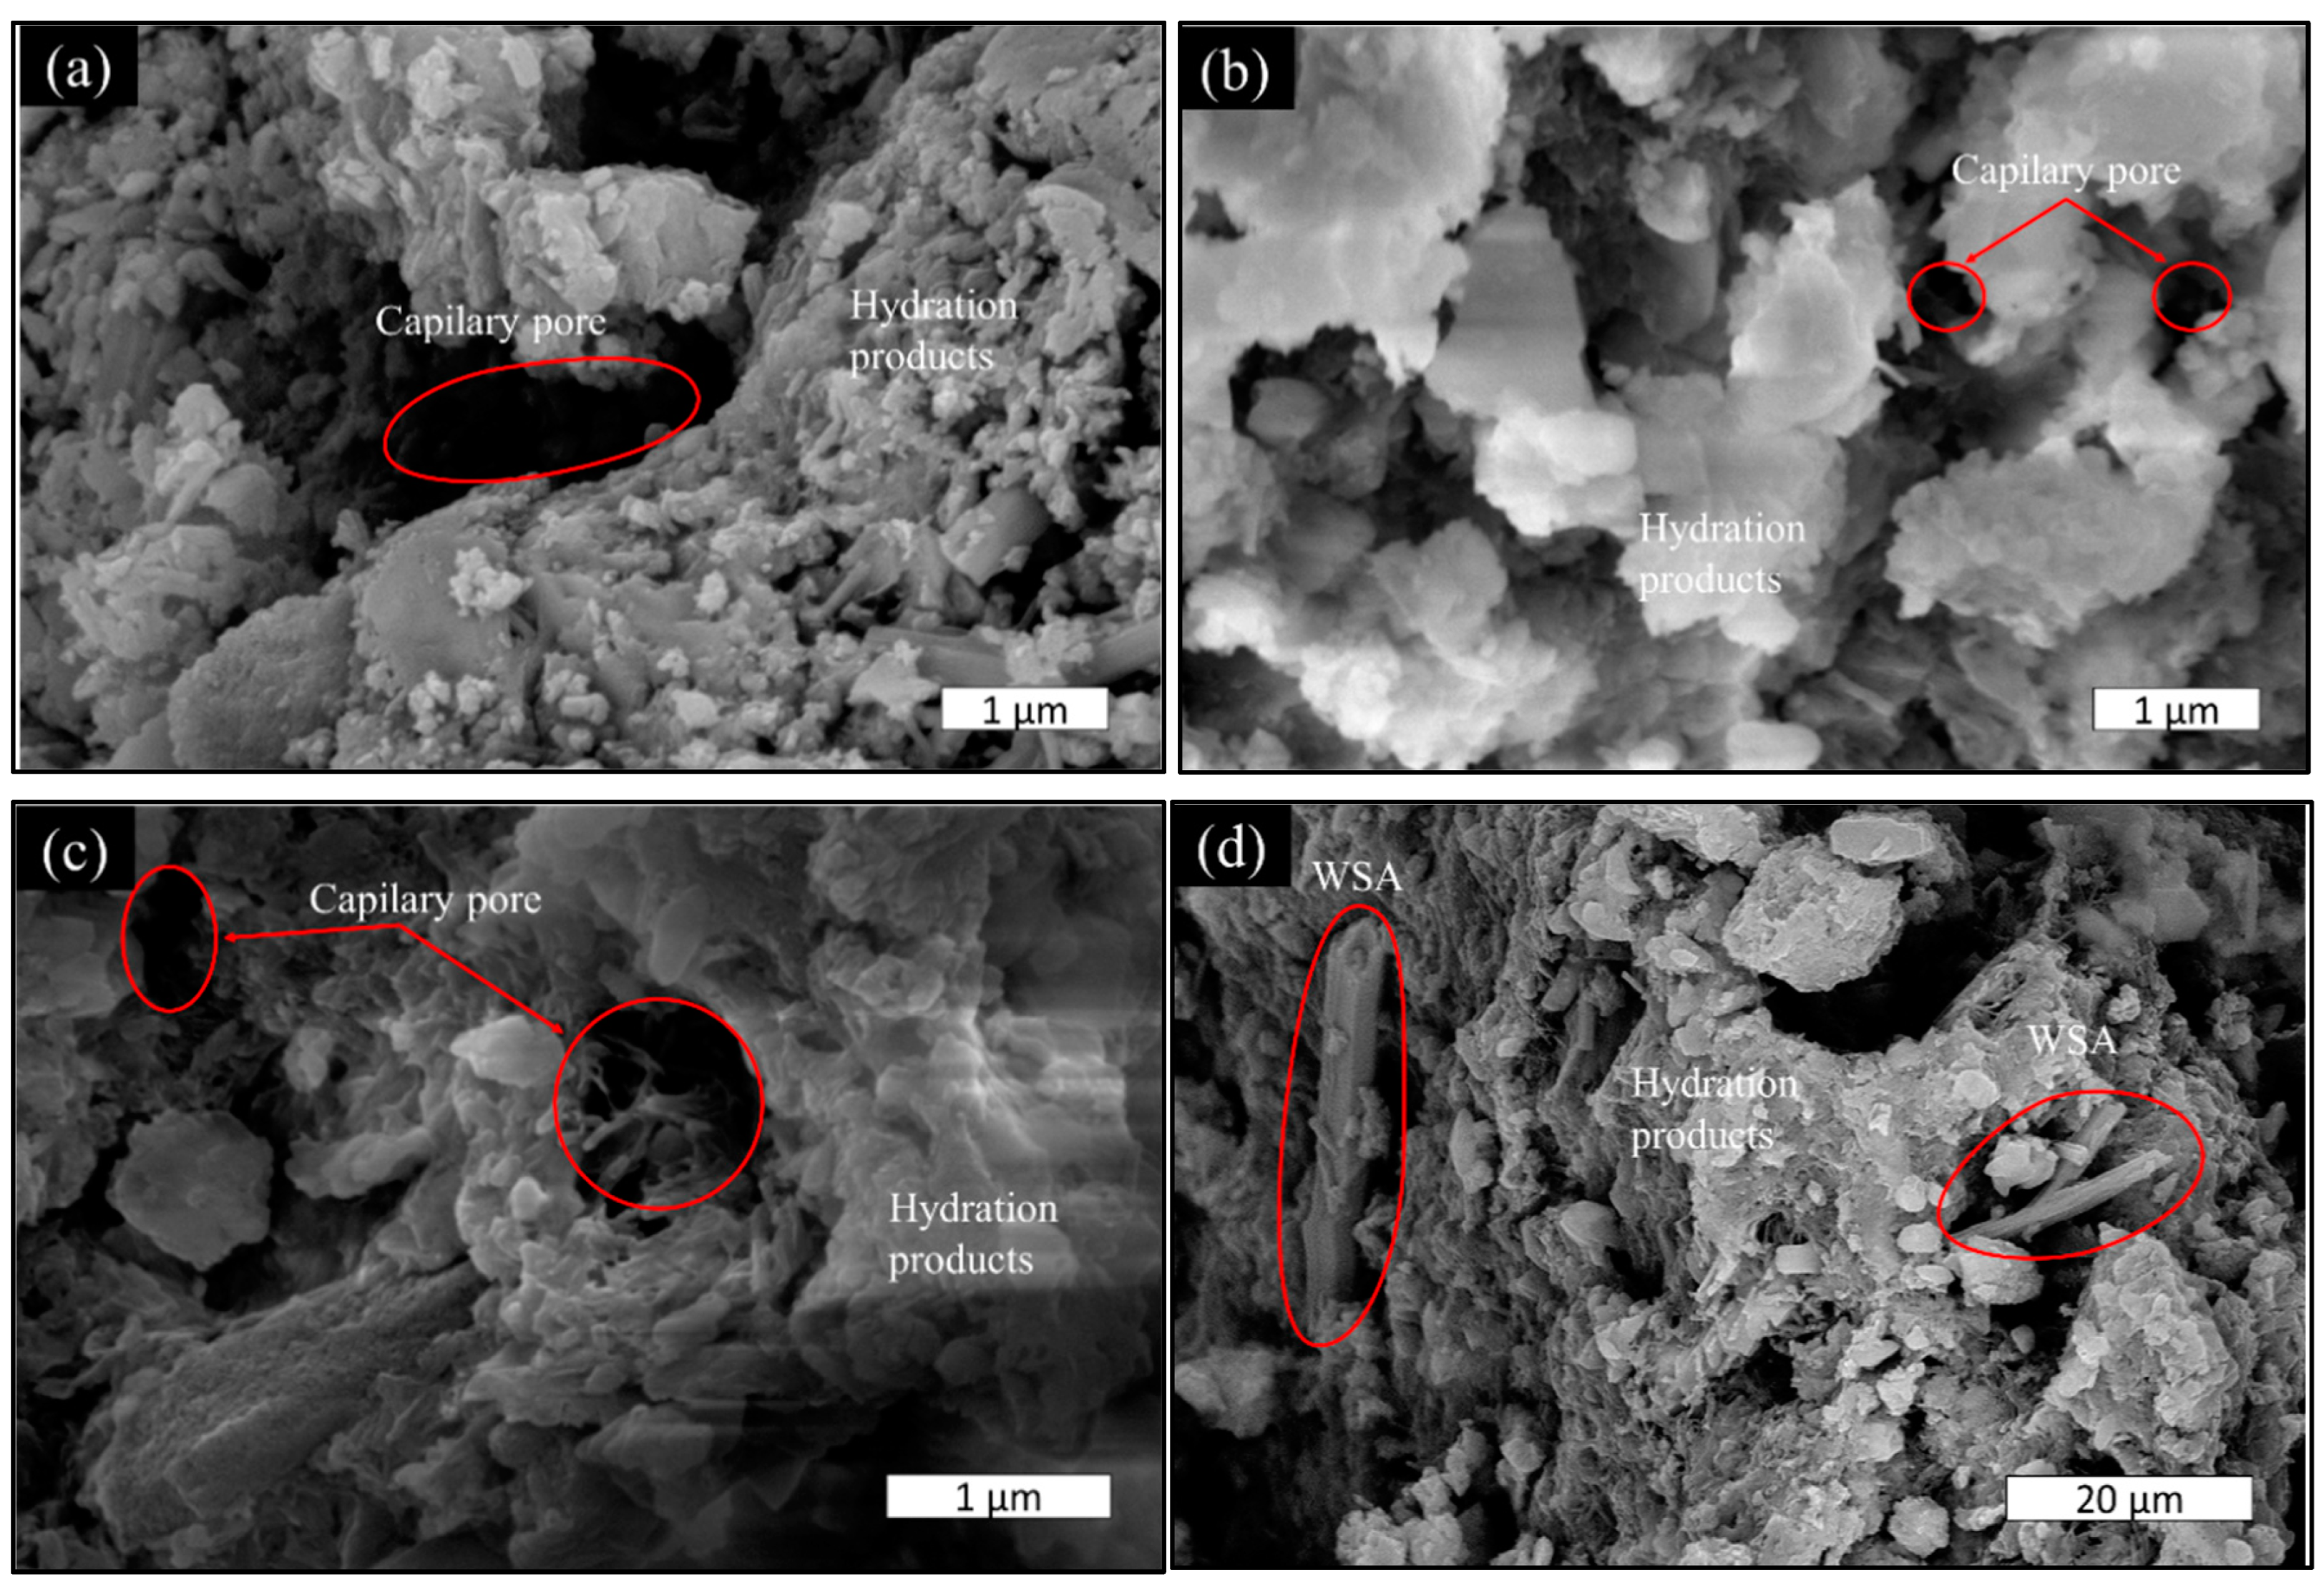
The microstructure of samples at 56 days obtained by FE-SEM is shown in Figure 10. By comparing Figure 10 (a) and (b), it can be noticed that the latter shows more amorphous structures due to the pozzolanic reaction of SF with unreacted compounds of the cement to form secondary calcium silicates. In addition, the pore size decreased due to the nucleation of the cement causing a more compact microstructure and therefore increasing the strength of the cement pastes. Figure 10 (d) shows how WSA was incorporated into the mixture whereas Figure 10 (c), being on the same scale as the control paste, showed a decrease in pore size, an increase in hydration products, and a densification of the matrix.

3.2. Multiple Regression Analysis and Design Model

3.2.1. Data Analysis and Model Adjustment

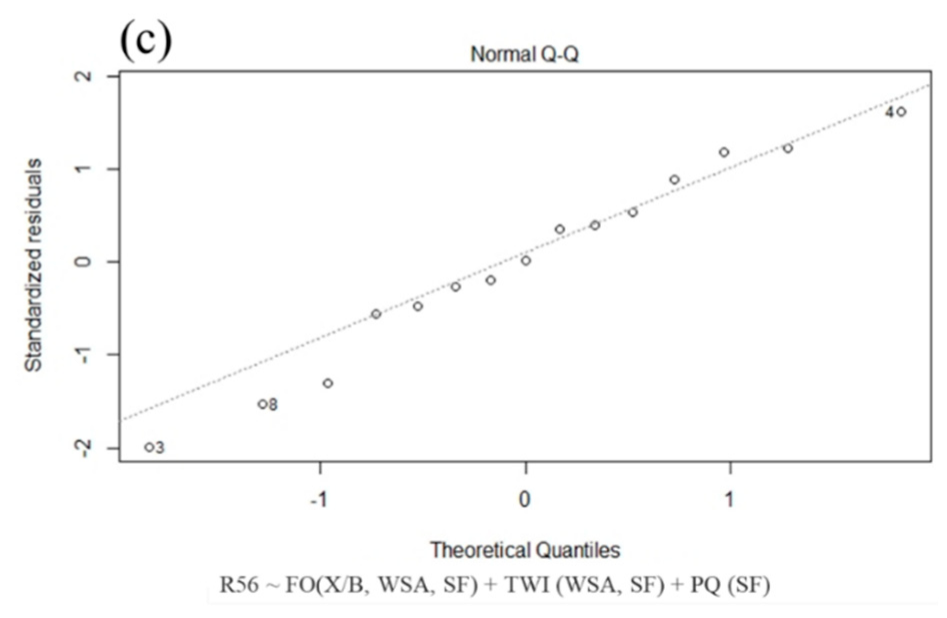
The results of the Shapiro-Wilk test, which is a statistical test used to determine whether a set of data comes from a normal distribution, is presented in Table 4. As shown in the table, a p value > 0.05 was obtained at all ages; therefore, the null hypothesis could not be rejected, and the population of data was normally distributed. In addition, the quantile-quantile graphs shown in Figure 11 for all ages and mixtures evidenced a tendency towards a straight line, further confirming their normal distribution.
The results of the analysis of variance of the strength prediction model at 7, 28, and 56 days are shown in Table 5, Table 6, and Table 7, respectively. The validation method was based on demonstrating, through the p values < 0.05, which variables were the most important to represent the regression model. Those variables were to be kept or eliminated from the model depending on how they affected the predictive fit of the model over the entire response surface. For all the above reasons, to complete the validation and correct the model, we also computed the R 2 , R A d j 2 , and lack of fit.
The R 2 obtained from the model already adjusted for the three ages (7, 28, and 56) corresponded to R 7 d a y s 2 = 92 % , R 28 d a y s 2 = 93 % , and R 56 d a y s 2 = 83 % , respectively. This indicated a good fit of the regression model and explained more than 80% of the variability of the data as well as a significant relationship between predicted and calculated values for all ages. By taking into account the predictor variables of the three models, we obtained the R A d j 2 for the three ages, with values of R A d j 7 d a y s 2 = 89 % , R A d j 28 d a y s 2 = 88 % , and R A d j 56 d a y s 2 = 77 % , meaning that the parameters investigated explained a large percentage of the variation in the sample while the difference was the overall variance not explained by the model. The predictor variables were chosen through a process of iteration that allowed the improvement of the model at a global level, with the criteria described above. Finally, to complete the validation, we analyzed the lack-of-fit, yielding a p   value 7 days = .065 , p   value 28 days = .92 , and p   value 56 days = .47 , which is non-significant, implying that the predictions made by the model were as good as if additional experiments were performed (maintaining the experimental conditions).

3.2.2. Models and Interactions Effect of Factors

With the adjustments made and the validations obtained, the following equations for the compressive strength regression models could be determined, where the variables were normalized:
C 7 d a y s = 17.62 4.69   W B 3.13   W S A + 4.13 W B WSA 2.14 W B 2
C 28 d a y s = 25.13 5.31   W B 5.35   W S A 1.53   S F + 3.48   W B W S A 3.39   W B 2 + 3.52   S F 2
C 56 d a y s = 26.21 5.21   W B 5.08   W S A + 0.8   S F + 5.52   S F 2  
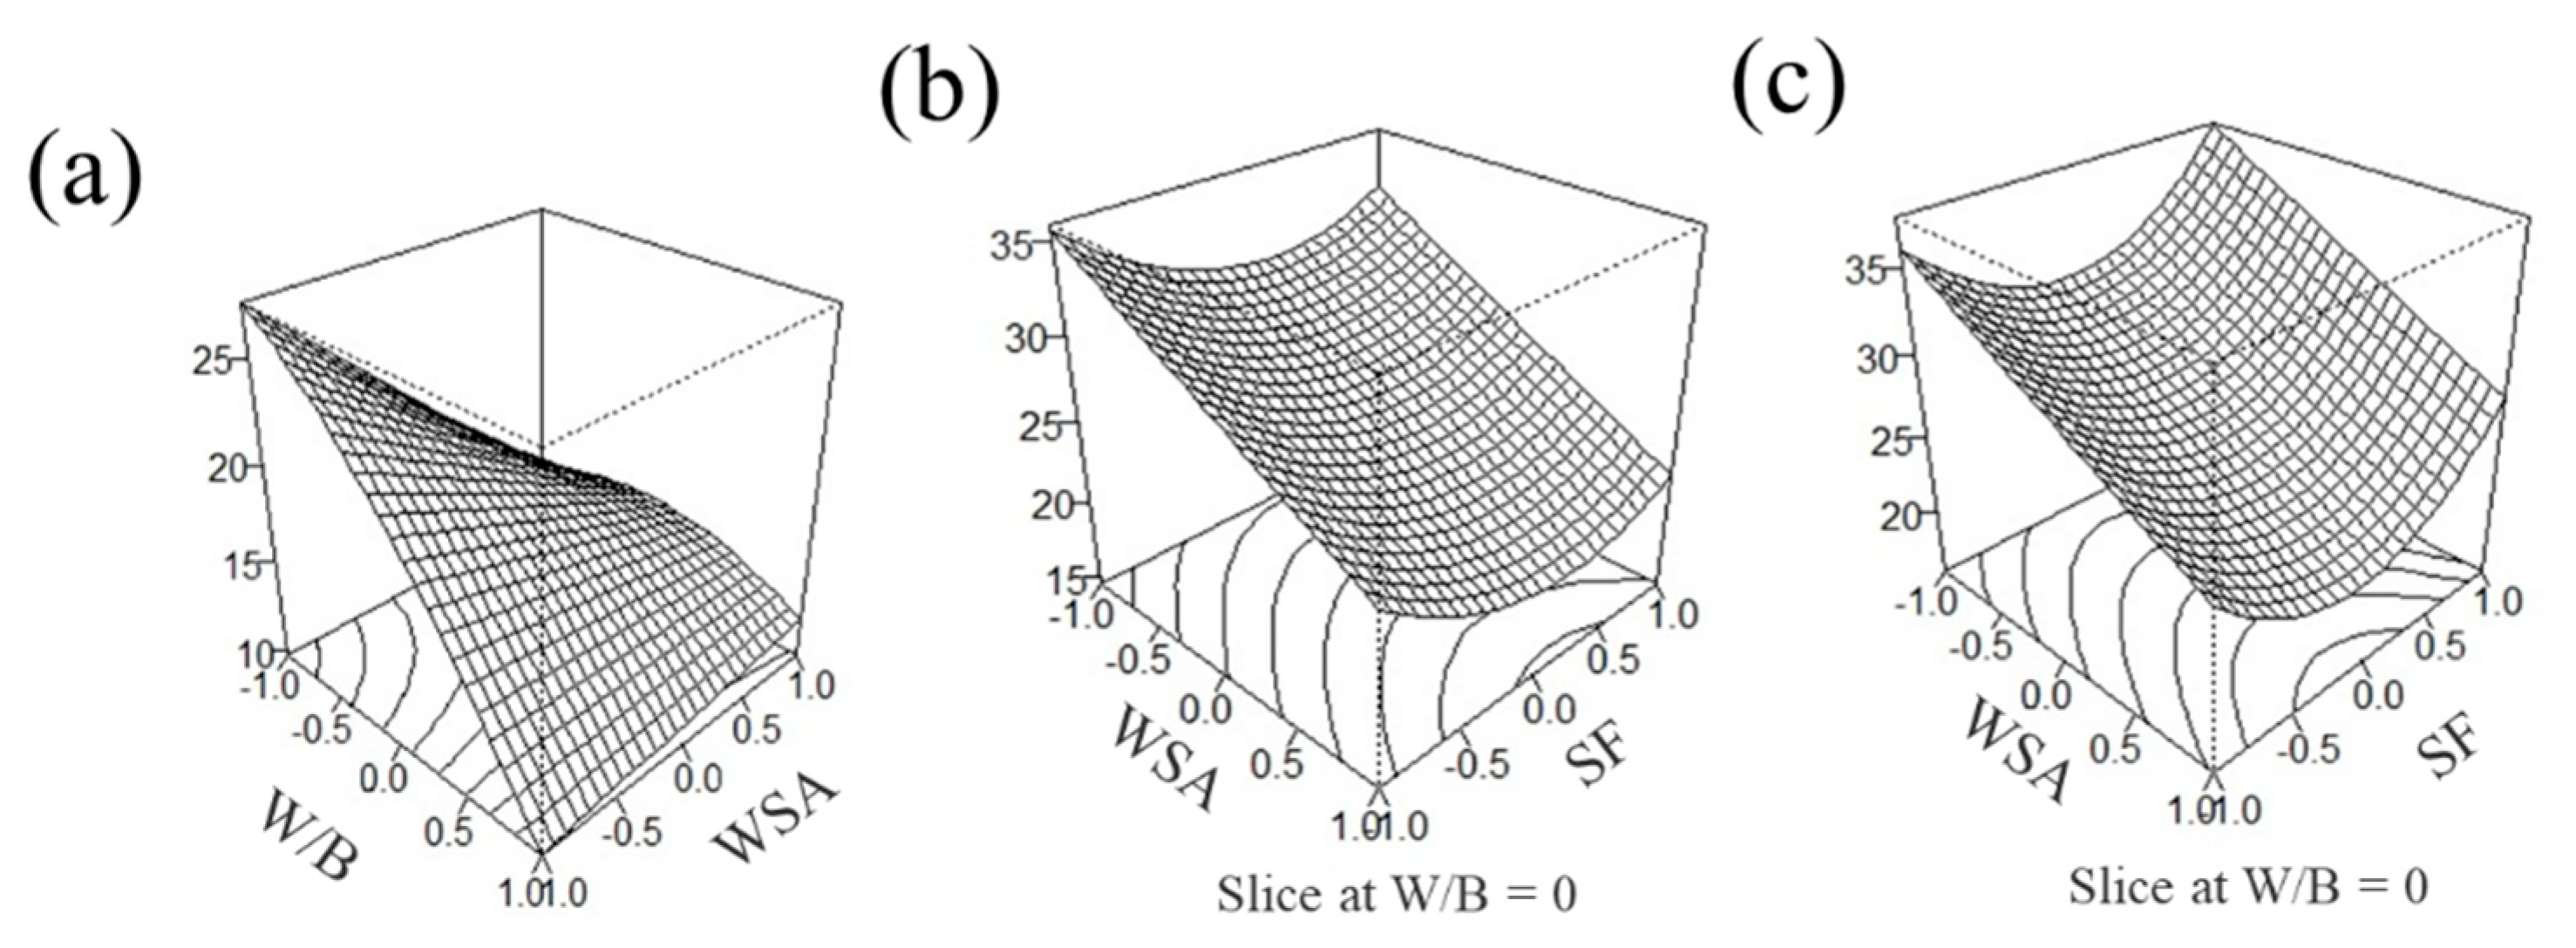
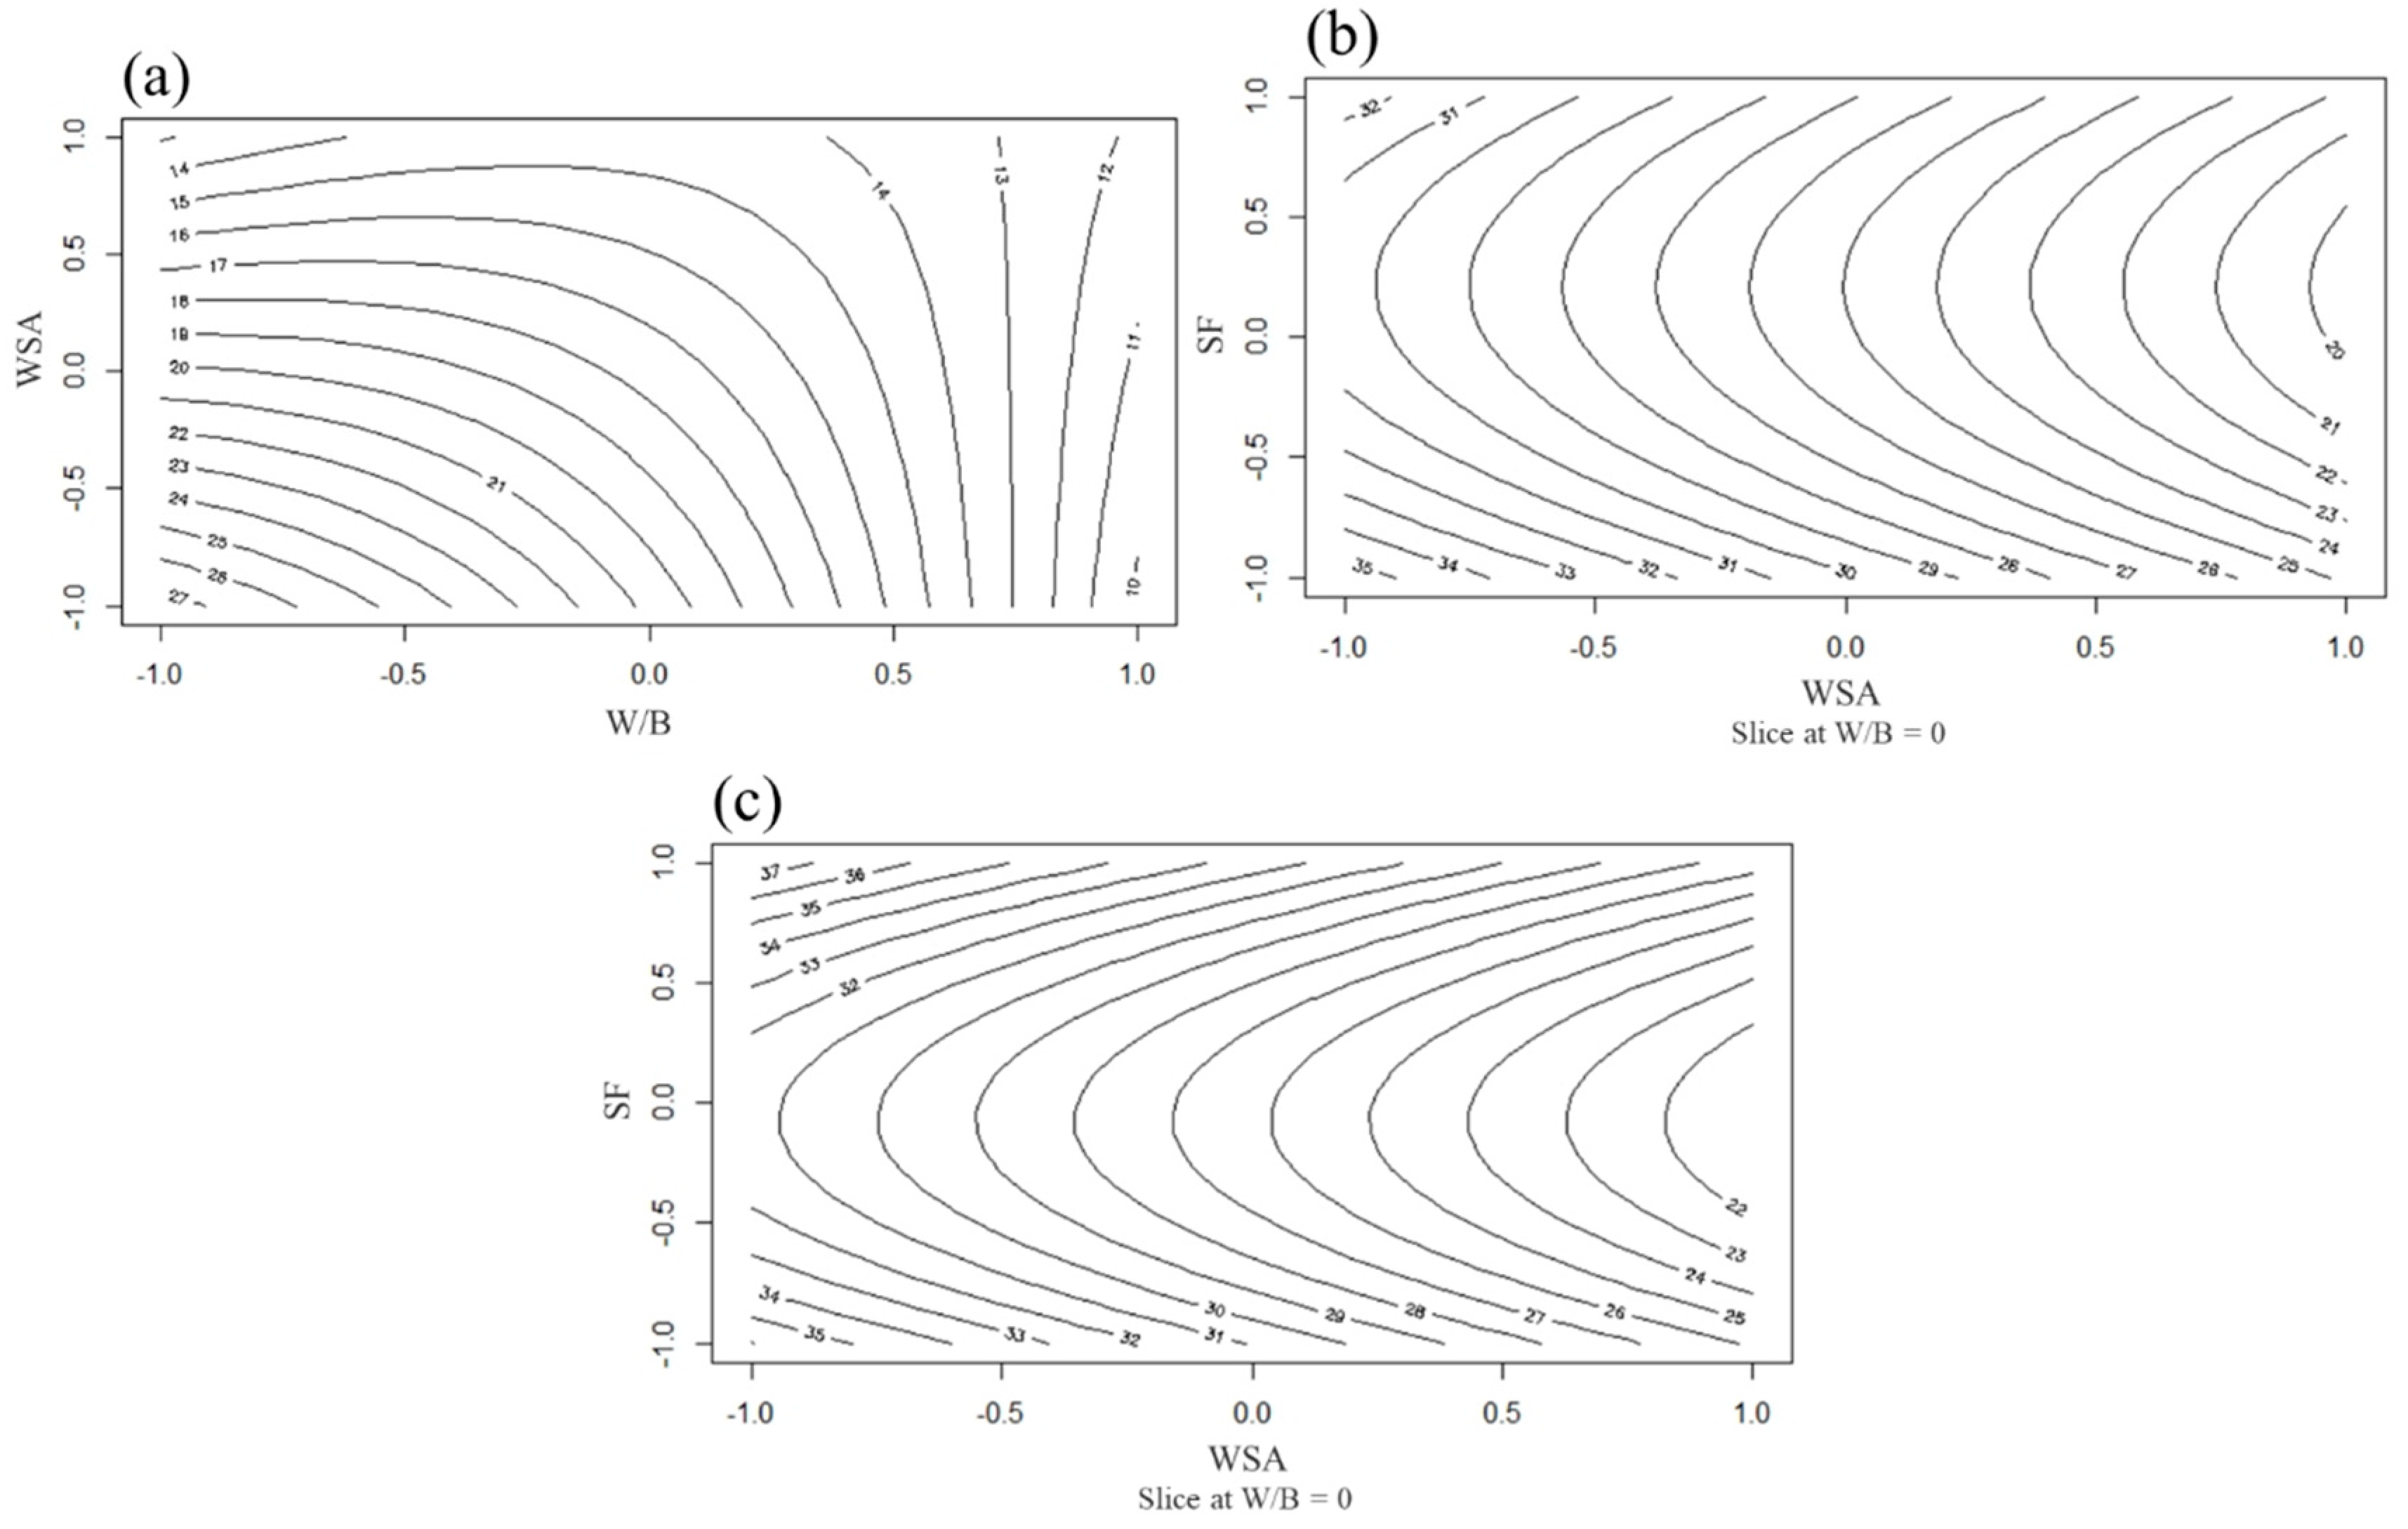
Once the models for each age were defined, it was possible to identify the behavior of the most important variables and how they affected the compressive strength of the mixes. Figure 12 illustrates the response surface at different ages: (a) shows the interaction among the significant variables of the model at 7 days W/B with WSA, and (b) and (c) show the interaction at 28 and 56 days, respectively, between the variables SF and WSA keeping W/B constant at the mean level of 0.5.
In general, the effect of the W/B cementitious water ratio decreased the mechanical compressive strength as its levels increased at all ages, which can be observed in Equations (3), (4), and (5) above, so this ratio was identified as a significant variable in them.
In the 7-day model, we observed that the substitution of cement by WSA was a significant first-order variable that negatively affected the strength throughout the response zone and was observed in the regression equation (see Equation (3)). As shown in Table 5, the interaction between W/B and WSA was significant, mainly because of the variations in strength caused by both variables (see Figure 13 (a)), because by reducing the W/B ratio from 0.55 to 0.4, the replacement of cement by WSA contributed to the loss of strength more directly by replacing more mass.
For the 28-day model, the significance of the variables exposed at 7 days was maintained, for both the first-order variables and the interaction between W/B and WSA, but the main difference was that now the second-order terms for the variables W/B and SF were significant. It is important to take into account that due to the chemical and morphological composition of SF, it was to be expected that at late ages, it would begin to have relevance in the increase of resistance, which was also confirmed by the regression model in Equation (4). It is also possible to observe the effect of the second-order factors on the response surface in Figure 12 (b), which shows concavity on the axis associated with SF. In the same line, in the contour plots (see Figure 13) relating WSA to SF (see Figure 12 (b)), it is possible to observe that for the SF axis, approximately from levels -5%–5%, where the concavity was found, the resistance decreased.
Finally, the 56-day model further confirmed what was described above because, for this model, the second-order coefficient corresponding to SF was the only significant one and largely determined the strength increase at this age (see Equation (5)) because the highest level of substitution (10%) managed to overcome the strength of the cement-only mix (see Figure 10). Likewise, from Figure 13 (c), we can see that from the intermediate level of replacement, i.e., 5%, up to the highest level of SF, the strength of the mixes increased independently of the amount of WSA replacement, maximizing in this range the total amount of replacement that could be generated with both SCMs.

3.2.3. Model Validation

To validate the RSM, three mixtures were chosen and are shown in Table 8.
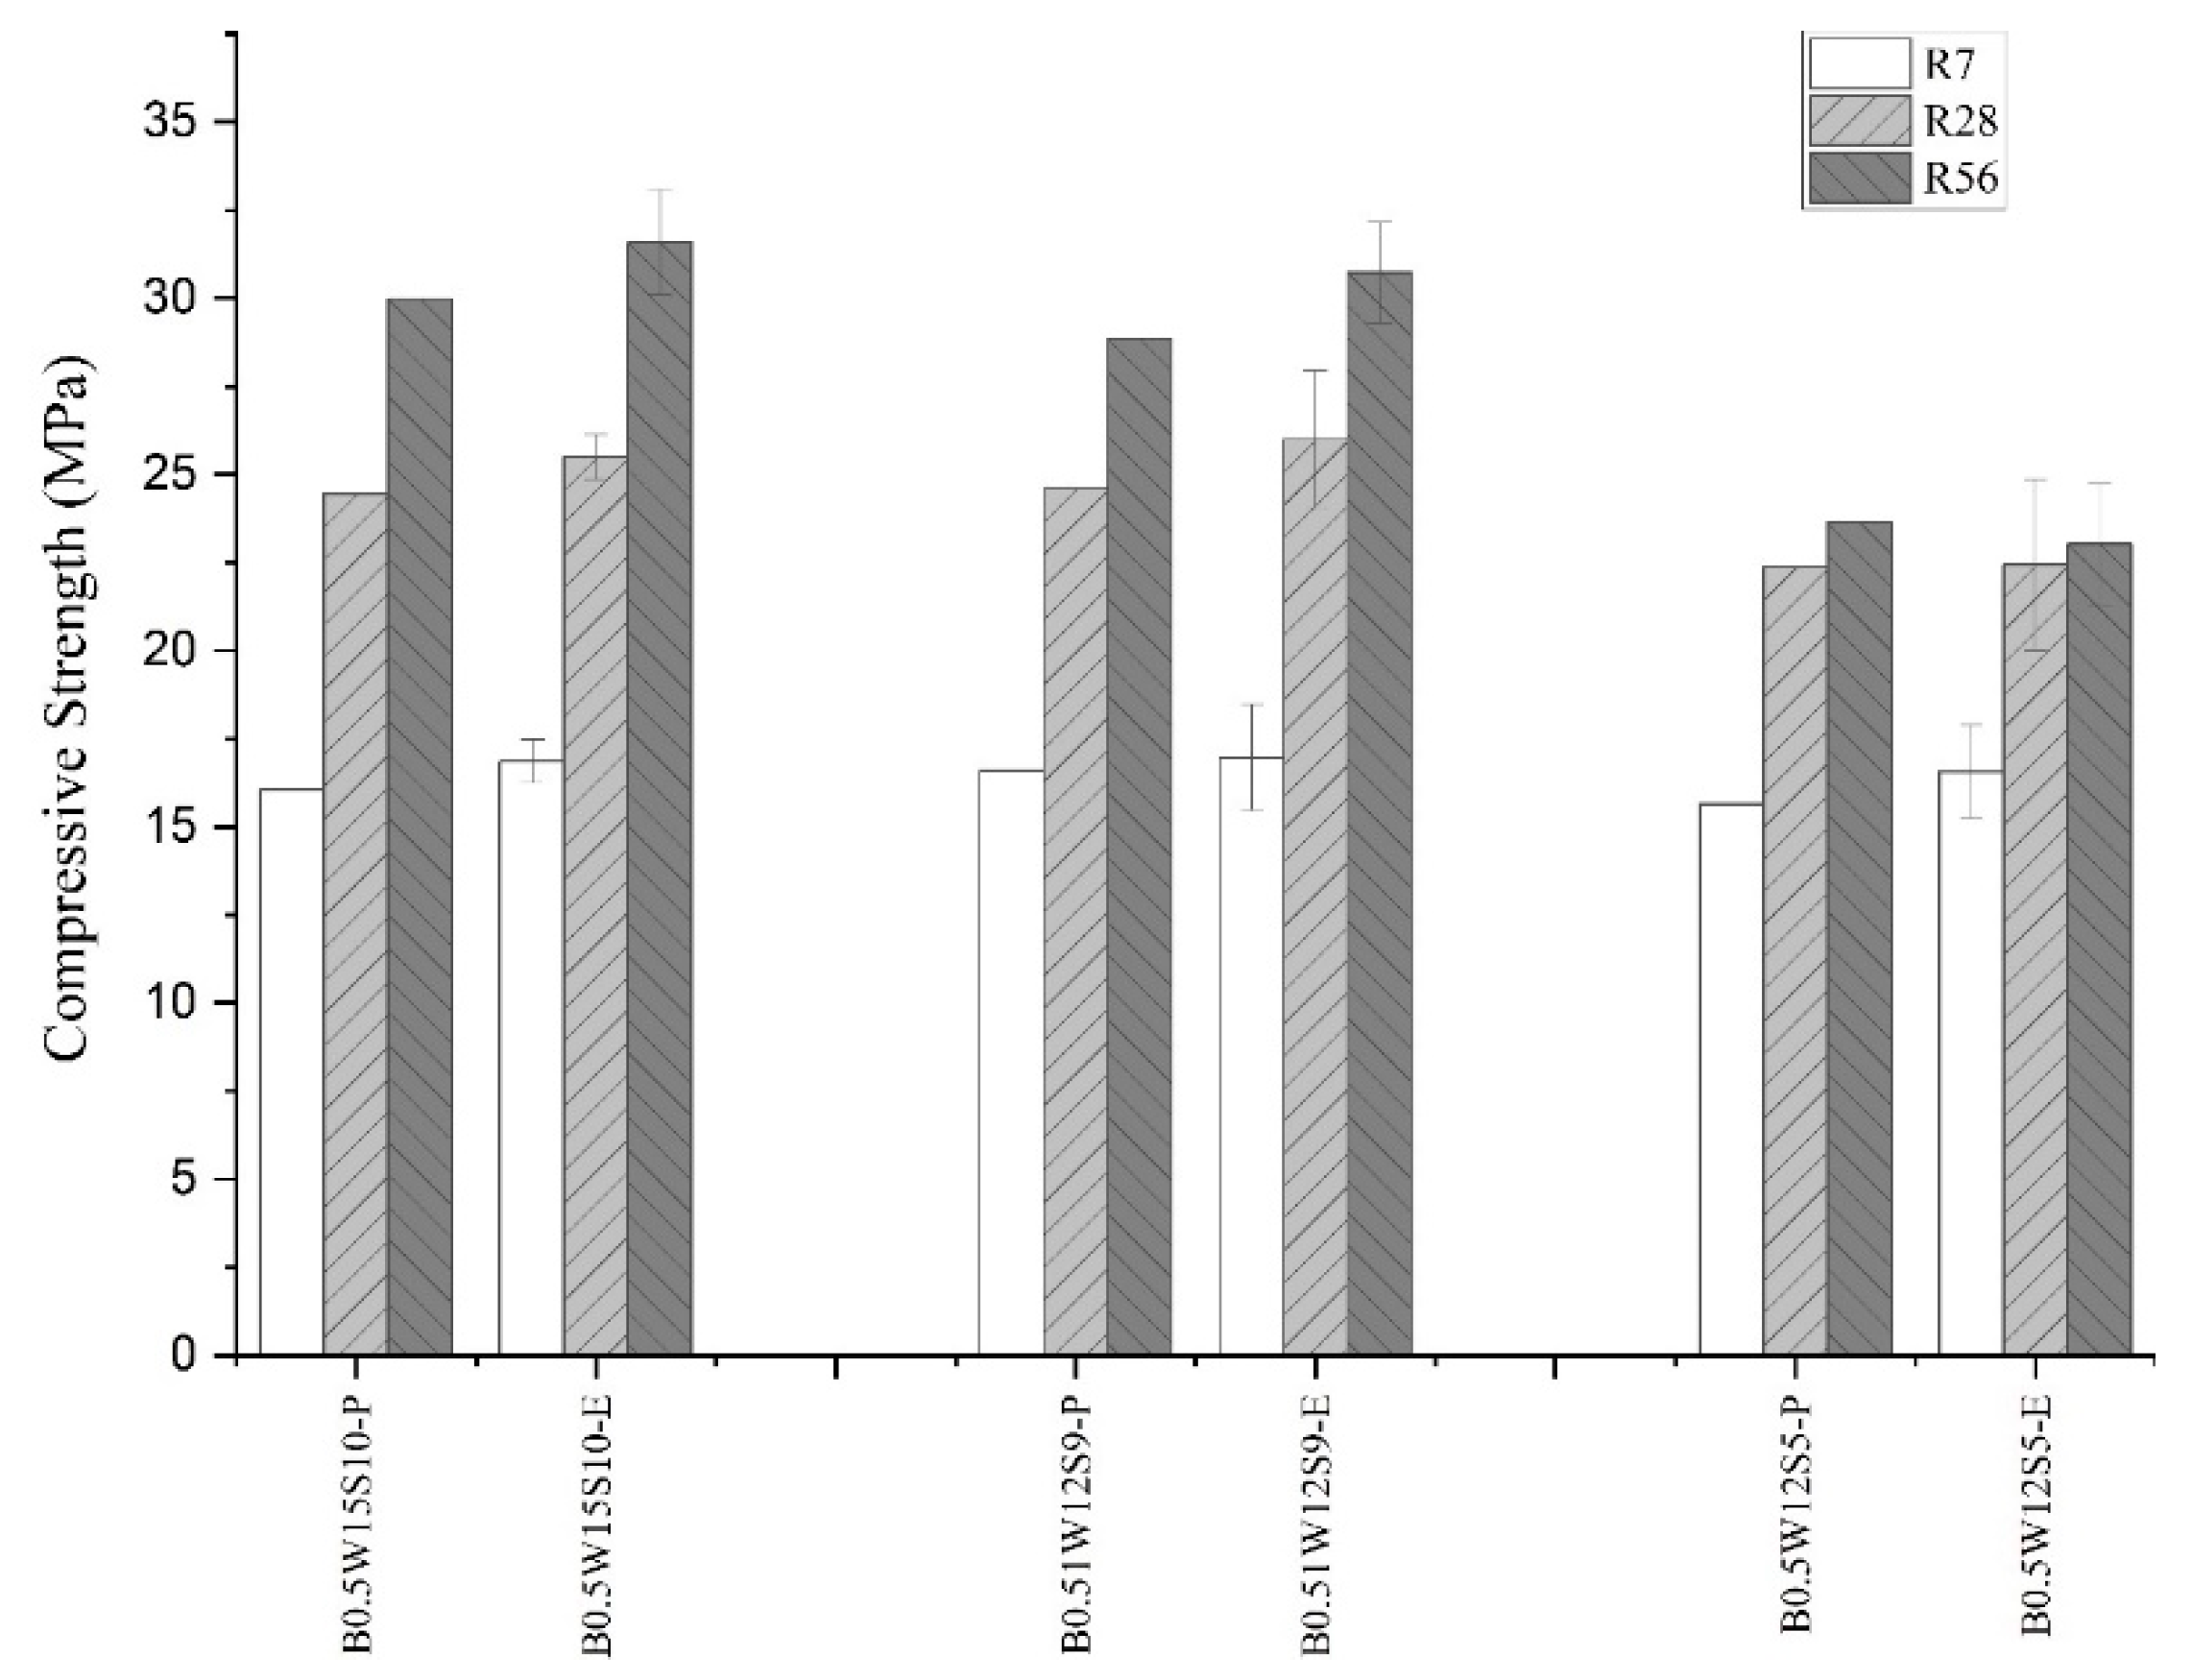
The experimental results can be seen in Figure 14 where the -P mixtures correspond to the values predicted by the model while the -E mixtures correspond to the experimental values obtained at 7, 28, and 56 days. Table 9 shows the model errors with respect to the mean of the experimental results at each age, where a conservative model was observed, because in 90% of the cases, the experimental results showed higher values than the model. Therefore, in addition to accurately approaching the values predicted by the model, the low errors (the maximum was 6.1%) confirmed the use of the BBD and the RSM to optimize the design of mixes with SCM cement substitution.

3.2.4. Carbon Footprint

In order to analyze the CO2eq emissions of pastes, the kg of CO2 per unit volume (m3) of pastes with a W/B ratio of 0.5 were calculated because this W/B ratio contained mono, binary, and ternary mixes. First, considering the CO2eq values (see Table 1), as the replacement of cement by SCM increased, the CO2/m3 decreased, which is why we analyzed it on the basis of the intensity index.
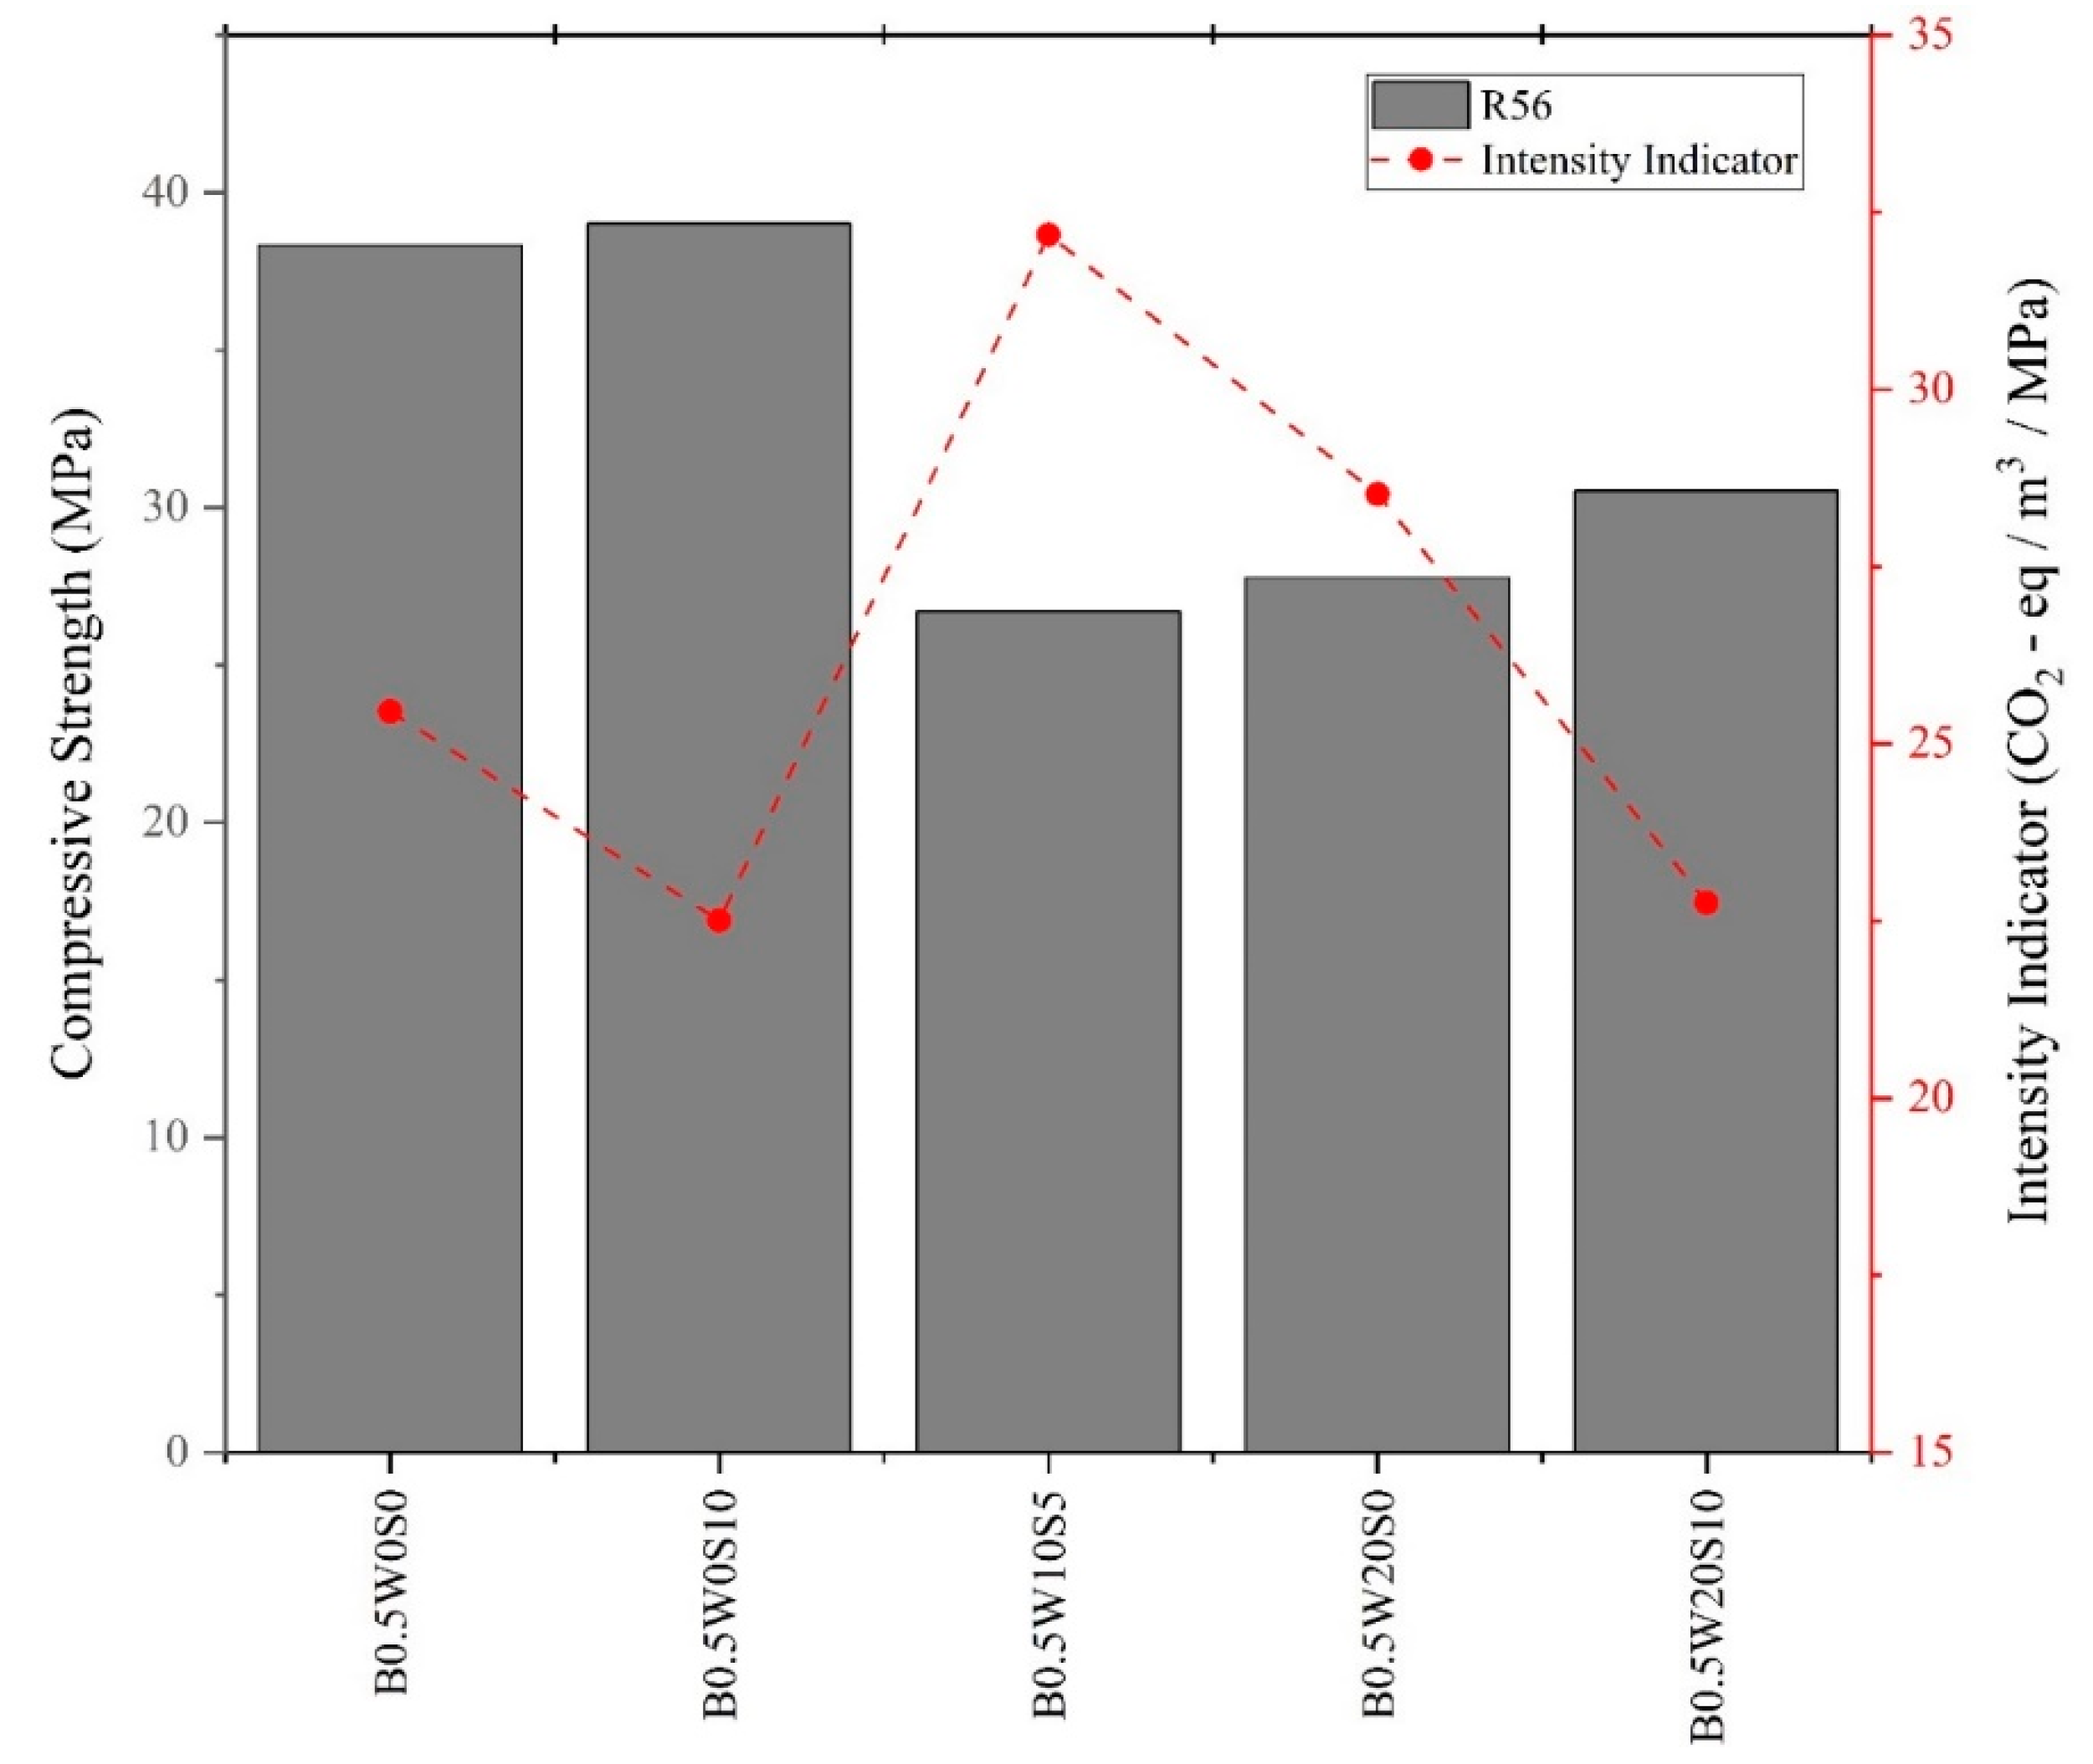
Figure 15 shows the compressive strength and the intensity index, which, as described in previous paragraphs, allowed us to measure the amount of binder required for 1 MPa of compressive strength, defined as CO2eq (kg/m3) / strength (MPa) at 56 days. In order to have a reduction of CO2eq emissions with an increase in compressive strength, the intensity index needed to be lower.
According to the results, the ternary mixture B0.5W10S5 had the highest intensity index because, although the total replacement was 15%, the levels used were intermediate and, as explained in previous paragraphs, it was the most unfavorable region in terms of resistance. However, the opposite scenario was the case with B0.5W20S10 (also ternary), which was in the optimal region of replacement to obtain higher mechanical properties. Comparing both cases, it was possible to determine that the last mix was 29% lower in terms of CO2eq / strength and had a higher resistance at 56 days, confirming that the proposed region was better in terms of both resistance and reduction of CO2 emissions. Furthermore, compared to the cement-only mix (B0.5W0S0), B0.5W20S10 was 11% lower in terms of CO2 emissions.
Finally, it is important to highlight that B0.5W20S10 presented lower CO2 emissions per m3, even though its strength was not the highest. At the same time, B0.5W20S0 (only WSA replacement) presented lower compressive strength and the highest CO2 emissions.

4. Conclusions

In this research it was evidenced that the use of agricultural and industrial wastes as SCMs, more specifically wheat straw ash (WSA) and silica fume (SF), was technically feasible in certain proportions. Their utilization as replacements could be maximized using an RSM because this approach effectively achieved cement paste formulations, allowing lower CO2 given a required strength at different ages, namely 7, 28, and 56 days. In addition, the physicochemical characterization of the materials allowed for better understanding and explanation of the resulting design model. The main results and conclusions of this investigation are outlined in the following.
Three statistical models were developed using the BBD, which accurately enabled us to predict the strength of all possible combinations of the variables W/B in the range 0.4–0.6, SF in cement replacement by mass from 0%–10%, and WSA from 0%–20% with good values of R A d j 2 ( R A d j 7 d a y s 2 = 89 % , R A d j 28 d a y s 2 = 88 % , and R A d j 56 d a y s 2 = 77 % ). This demonstrated that a large part of the variance was explained by the models. In addition, a good fit over the experimental points was prioritized over the whole response surface with the values of the lack of fit, which were non-significant, with p > .05 ( p   value 7 days = .065 , p   value 28 days = .92 , and p   value 56 days = .474 ). The predictions were as accurate as if additional experiments had been performed, so the regression model showed an excellent fit. To confirm the model, three mixes were tested with different proportions of SCM at a W/B ratio = 0.5 with a high percentage of cement substitution, which resulted in values close to the predicted values, with maximum errors of 6% at the three ages. Therefore, the proposed model may be a suitable means of predicting the strength of this type of mix.
With values based on the models, we established that, for any addition of WSA between 0%–20% and SF between 5%–10%, the mechanical strength losses generated by the incorporation of WSA were reduced, maximizing the incorporation of both SCMs. Furthermore, with this response surface analysis together with the regression equations, it was possible to predict compressive strength at different ages. Therefore, a good strategy for minimizing the carbon footprint may be setting the required strength and calculating the maximum possible cement replacements, which should contribute to making the construction industry more sustainable by utilizing local waste.
Overall, the findings of this research extend the knowledge associated with the possibility of including WSA as a supplementary cementitious material (SCM) that is synergic with other SCMs such as SF; as a result, the clinker factor and the CO2 emissions in the material can be reduced, thus allowing a cement pastes with a lower carbon footprint.

Author Contributions

Conceptualization, M.G and P.G.; methodology, M.G and P.G.; software, B.B.; validation, B,B.; formal analysis, B.B.; investigation, B.B. and G.V..; resources, P.G. and M.G..; data curation, B.B.; writing—original draft preparation, B.B..; writing—review and editing, M.G. and P.G..; visualization, B.B..; supervision, M.G and P.G..; project administration, P.G.; funding acquisition, P.G.. All authors have read and agreed to the published version of the manuscript.

Funding

This research was funded CENAMAD (ANID BASAL FB210015), FONDEF project ID20I20312 and the Concrete Innovation Hub UC (CIHUC) from the Pontificia Universidad Católica de Chile. The APC was funded by Universidade da Coruña.

Institutional Review Board Statement

Not applicable.

Informed Consent Statement

Not applicable.

Data Availability Statement

Data can be available upon request.

Acknowledgments

CENAMAD (ANID BASAL FB210015), Sika and Melon, and Universidade da Coruña for allowing us the Open Access.

Conflicts of Interest

The authors declare no conflicts of interest.

References

  1. Global Cement and Concrete Association, Concrete Future - The GCCA 2050 Cement and Concrete Industry Roadmap for Net Zero Concrete, (2021) 1–48. https://gccassociation.org/concretefuture/wp-content/uploads/2021/10/GCCA-Concrete-Future-Roadmap.pdf.
  2. J. Skocek, M. Zajac, M. Ben Haha, Carbon Capture and Utilization by mineralization of cement pastes derived from recycled concrete, Sci. Rep. 10 (2020) 1–12. [CrossRef]
  3. D.L. Summerbell, C.Y. Barlow, J.M. Cullen, Potential reduction of carbon emissions by performance improvement: A cement industry case study, J. Clean. Prod. 135 (2016) 1327–1339. [CrossRef]
  4. K.L. Scrivener, V.M. John, E.M. Gartner, Eco-efficient cements: Potential economically viable solutions for a low-CO2 cement-based materials industry, Cem. Concr. Res. 114 (2018) 2–26. [CrossRef]
  5. N. Müller, J. Harnisch, A blueprint for a climate friendly cement industry, Rep. WWF–Lafarge Conserv. Partnership. (2008).
  6. Centro UC Políticas Públicas, déficit cero, Déficit Habitacional: ¿Cuántas familias necesitan una vivienda y en qué territorios?, (2022). https://cchc.cl/uploads/comunicacion/archivos/ESTUDIO_DEFICIT_HABITACIONAL_BOLETIN1.pdf.
  7. Habitat for Humanity, Annual Report 2020, (2020) 4–10. https://habitatbrasil.org.br/wp-content/uploads/2021/06/Annual-Report-2020.pdf.
  8. Departamento Administrativo Nacional De Estadistica, Boletín Técnico: Déficit Habitacional CNPV 2018, (2022) 20. https://www.dane.gov.co/files/investigaciones/deficit-habitacional/Boletin-tec-deficit-hab-2021.pdf.
  9. F. Lago, Estimación de la evolución del déficit habitacional en la Argentina, Buenos Aires, 2016. https://biblioteca.camarco.org.ar/PDFS/Serie 26 Libros Completos/03 - Estimación de la evolución del Déficit H. Arg (dig).pdf.
  10. B. Lothenbach, K. Scrivener, R.D. Hooton, Supplementary cementitious materials, Cem. Concr. Res. 41 (2011) 1244–1256. [CrossRef]
  11. J.J. Brooks, M.A. Megat Johari, Effect of metakaolin on creep and shrinkage of concrete, Cem. Concr. Compos. 23 (2001) 495–502. [CrossRef]
  12. C.H. Huang, S.K. Lin, C.S. Chang, H.J. Chen, Mix proportions and mechanical properties of concrete containing very high-volume of Class F fly ash, Constr. Build. Mater. 46 (2013) 71–78. [CrossRef]
  13. K.M. Liew, A.O. Sojobi, L.W. Zhang, Green concrete: Prospects and challenges, Constr. Build. Mater. 156 (2017) 1063–1095. [CrossRef]
  14. P. Łukowski, A. Salih, Durability of mortars containing ground granulated blast-furnace slag in acid and sulphate environment, Procedia Eng. 108 (2015) 47–54. [CrossRef]
  15. M.S. Meddah, M.A. Ismail, S. El-Gamal, H. Fitriani, Performances evaluation of binary concrete designed with silica fume and metakaolin, Constr. Build. Mater. 166 (2018) 400–412. [CrossRef]
  16. E. Özbay, M. Erdemir, H.I. Durmuş, Utilization and efficiency of ground granulated blast furnace slag on concrete properties - A review, Constr. Build. Mater. 105 (2016) 423–434. [CrossRef]
  17. R. Siddique, J. Klaus, Influence of metakaolin on the properties of mortar and concrete: A review, Appl. Clay Sci. 43 (2009) 392–400. [CrossRef]
  18. Z. Zhang, B. Zhang, P. Yan, Comparative study of effect of raw and densified silica fume in the paste, mortar and concrete, Constr. Build. Mater. 105 (2016) 82–93. [CrossRef]
  19. P.P. Li, H.J.H. Brouwers, W. Chen, Q. Yu, Optimization and characterization of high-volume limestone powder in sustainable ultra-high performance concrete, Constr. Build. Mater. 242 (2020). [CrossRef]
  20. P. Stutzman, SEM Analysis and Computer Modelling of Hydration of Portland Cement Particles, (1994).
  21. F.U.A. Shaikh, S.W.M. Supit, P.K. Sarker, A study on the effect of nano silica on compressive strength of high volume fly ash mortars and concretes, Mater. Des. 60 (2014) 433–442. [CrossRef]
  22. F. Zunino, M. Lopez, Decoupling the physical and chemical effects of supplementary cementitious materials on strength and permeability: A multi-level approach, Cem. Concr. Compos. 65 (2016) 19–28. [CrossRef]
  23. M.C.G. Juenger, R. Siddique, Recent advances in understanding the role of supplementary cementitious materials in concrete, Cem. Concr. Res. 78 (2015) 71–80. [CrossRef]
  24. A.M. Ramezanianpour, R.D. Hooton, A study on hydration, compressive strength, and porosity of Portland-limestone cement mixes containing SCMs, Cem. Concr. Compos. 51 (2014) 1–13. [CrossRef]
  25. M. Antoni, J. Rossen, F. Martirena, K. Scrivener, Cement substitution by a combination of metakaolin and limestone, Cem. Concr. Res. 42 (2012) 1579–1589. [CrossRef]
  26. R. San Nicolas, M. Cyr, G. Escadeillas, Performance-based approach to durability of concrete containing flash-calcined metakaolin as cement replacement, Constr. Build. Mater. 55 (2014) 313–322. [CrossRef]
  27. R. Madandoust, M.M. Ranjbar, H.A. Moghadam, S.Y. Mousavi, Mechanical properties and durability assessment of rice husk ash concrete, Biosyst. Eng. 110 (2011) 144–152. [CrossRef]
  28. Nadeem, S.A. Memon, T.Y. Lo, Mechanical performance, durability, qualitative and quantitative analysis of microstructure of fly ash and Metakaolin mortar at elevated temperatures, Constr. Build. Mater. 38 (2013) 338–347. [CrossRef]
  29. T. Chappex, K.L. Scrivener, Cement and Concrete Research The in fl uence of aluminium on the dissolution of amorphous silica and its relation to alkali silica reaction, Cem. Concr. Res. 42 (2012) 1645–1649. [CrossRef]
  30. T. Özturan, Construc tion and Buildi ng Materi als Experimental evaluation and modeling of drying shrinkage behavior of metakaolin and calcined kaolin blended concretes, 43 (2013) 337–347. [CrossRef]
  31. S. Karaog, K. Mermerdas, E. Güneyisi, M. Gesog, Strength , permeability and shrinkage cracking of silica fume and metakaolin concretes, 34 (2012) 120–130. [CrossRef]
  32. S. Shahas, K. Girija, M. Nazeer, Materials Today : Proceedings Evaluation of pozzolanic activity of ternary blended supplementary cementitious material with rice husk ash and GGBS, Mater. Today Proc. (2023) 2–7. [CrossRef]
  33. S. Gupta, S. Chaudhary, State of the art review on supplementary cementitious materials in India – II: Characteristics of SCMs, effect on concrete and environmental impact, J. Clean. Prod. 357 (2022) 131945. [CrossRef]
  34. FAO, World Food and Agriculture - Statistical Yearbook 2021, Rome, 2021. [CrossRef]
  35. B.S. Thomas, J. Yang, K.H. Mo, J.A. Abdalla, R.A. Hawileh, E. Ariyachandra, Biomass ashes from agricultural wastes as supplementary cementitious materials or aggregate replacement in cement/geopolymer concrete: A comprehensive review, J. Build. Eng. 40 (2021) 102332. [CrossRef]
  36. H. Huang, X. Gao, H. Wang, H. Ye, Influence of rice husk ash on strength and permeability of ultra-high performance concrete, Constr. Build. Mater. 149 (2017) 621–628. [CrossRef]
  37. F.C. Lo, M.G. Lee, S.L. Lo, Effect of coal ash and rice husk ash partial replacement in ordinary Portland cement on pervious concrete, Constr. Build. Mater. 286 (2021) 122947. [CrossRef]
  38. V. Saraswathy, H.W. Song, Corrosion performance of rice husk ash blended concrete, Constr. Build. Mater. 21 (2007) 1779–1784. [CrossRef]
  39. L.C. Larissa, M.A. Marcos, M. V. Maria, N. S. L. de Souza, E.C. de Farias, Effect of high temperatures on self-compacting concrete with high levels of sugarcane bagasse ash and metakaolin, Constr. Build. Mater. 248 (2020) 118715. [CrossRef]
  40. V. Ríos-Parada, V.G. Jiménez-Quero, P.L. Valdez-Tamez, P. Montes-García, Characterization and use of an untreated Mexican sugarcane bagasse ash as supplementary material for the preparation of ternary concretes, Constr. Build. Mater. 157 (2017) 83–95. [CrossRef]
  41. P. Setayesh Gar, N. Suresh, V. Bindiganavile, Sugar cane bagasse ash as a pozzolanic admixture in concrete for resistance to sustained elevated temperatures, Constr. Build. Mater. 153 (2017) 929–936. [CrossRef]
  42. M.N. Amin, T. Murtaza, K. Shahzada, K. Khan, M. Adil, Pozzolanic potential and mechanical performance of wheat straw ash incorporated sustainable concrete, Sustain. 11 (2019) 1–20. [CrossRef]
  43. H. Binici, F. Yucegok, O. Aksogan, H. Kaplan, Effect of Corncob, Wheat Straw, and Plane Leaf Ashes as Mineral Admixtures on Concrete Durability, J. Mater. Civ. Eng. 20 (2008) 478–483. [CrossRef]
  44. Qudoos, H.G. Kim, Atta-ur-Rehman, J.S. Ryou, Effect of mechanical processing on the pozzolanic efficiency and the microstructure development of wheat straw ash blended cement composites, Constr. Build. Mater. 193 (2018) 481–490. [CrossRef]
  45. Jayaprithika, S.K. Sekar, Stress-strain characteristics and flexural behaviour of reinforced Eco-friendly coconut shell concrete, Constr. Build. Mater. 117 (2016) 244–250. [CrossRef]
  46. M. Khan, M. Ali, Improvement in concrete behavior with fly ash, silica-fume and coconut fibres, Constr. Build. Mater. 203 (2019) 174–187. [CrossRef]
  47. Oyedepo, L.M. Olanitori, S.P. Akande, Performance of coconut shell ash and palm kernel shell ash as partial replacement for cement in concrete, J. Build. Mater. Struct. 2 (2015) 18–24. [CrossRef]
  48. S. Assefa, Production of Lightweight Concrete Using Corncob Ash as Replacement of Cement in Concrete, Am. J. Civ. Eng. 7 (2019) 17. [CrossRef]
  49. J. Kamau, A. Ahmed, P. Hirst, J. Kangwa, Suitability of corncob ash as a supplementary cementitious material, Int. J. Mater. Sci. Eng. 4 (2016) 215–228. [CrossRef]
  50. FAO, Global cereal production heading for a record high, (2023). https://www.fao.org/worldfoodsituation/csdb/en/.
  51. X. Pan, Y. Sano, Fractionation of wheat straw by atmospheric acetic acid process, Bioresour. Technol. 96 (2005) 1256–1263. [CrossRef]
  52. FAO, Global Forest Resources Assessment 2010 Main Report, FAO For. Pap. 163 (2010) 37–72. https://www.fao.org/3/i1757e/i1757e.pdf.
  53. E. Ungerfeld, M. Vial, C. Jobet, M. Mathias, K. Peñalillo, Problemas de la quema de rastrojos y alternativas posibles - Mundoagro, (2021). https://mundoagro.cl/problemas-de-la-quema-de-rastrojos-y-alternativas-posibles/# (accessed June 29, 2023).
  54. Ruiz, M. Wolff, M. Claret, Rastrojos de cultivos anuales y residuos forestales, Rastrojos Cultiv. Anu. y Residuos For. (2015) 10–29.
  55. P. Muñoz, M.A. Mendívil, V. Letelier, M.P. Morales, Thermal and mechanical properties of fired clay bricks made by using grapevine shoots as pore forming agent. Influence of particle size and percentage of replacement, Constr. Build. Mater. 224 (2019) 639–658. [CrossRef]
  56. H. Biricik, F. Aköz, I. Berktay, A.N. Tulgar, Study of pozzolanic properties of wheat straw ash, 29 (1999) 637–643.
  57. [N.M. Al-akhras, B.A. Abu-alfoul, Effect of wheat straw ash on mechanical properties of autoclaved mortar, 8846 (2002) 0–5. [CrossRef]
  58. F.F. Ataie, K.A. Riding, Thermochemical Pretreatments for Agricultural Residue Ash Production for Concrete, J. Mater. Civ. Eng. 25 (2013) 1703–1711. [CrossRef]
  59. S.A. Memon, I. Wahid, M.K. Khan, M.A. Tanoli, M. Bimaganbetova, Environmentally friendly utilization of wheat straw ash in cement-based composites, Sustain. 10 (2018) 1–21. [CrossRef]
  60. ASTM C595-21, Standard Specification for Blended Hydraulic Cements, Astm . (2021) 1–10. www.astm.org,.
  61. R. Maddalena, J.J. Roberts, A. Hamilton, Can Portland cement be replaced by low-carbon alternative materials? A study on the thermal properties and carbon emissions of innovative cements, J. Clean. Prod. 186 (2018) 933–942. [CrossRef]
  62. R.N. González-Kunz, P. Pineda, A. Bras, L. Morillas, Plant biomass ashes in cement-based building materials. Feasibility as eco-efficient structural mortars and grouts, Sustain. Cities Soc. 31 (2017) 151–172. [CrossRef]
  63. K. Khan, M. Ishfaq, M.N. Amin, K. Shahzada, N. Wahab, M.I. Faraz, Evaluation of Mechanical and Microstructural Properties and Global Warming Potential of Green Concrete with Wheat Straw Ash and Silica Fume, Materials (Basel). 15 (2022) 3177. [CrossRef]
  64. M.A. Al-Kadhim Hameed, A.K. Razzq Alzerjawi, Z.A. Mahdi, Studying the behavior of the concrete mixture with wheat straw as part of the cement, J. Phys. Conf. Ser. 1973 (2021). [CrossRef]
  65. M. Muthukumar, D. Mohan, M. Rajendran, Optimization of mix proportions of mineral aggregates using Box Behnken design of experiments, Cem. Concr. Compos. 25 (2003) 751–758. [CrossRef]
  66. S.A. Memon, U. Javed, M. Haris, R.A. Khushnood, J. Kim, Incorporation of wheat straw ash as partial sand replacement for production of eco-friendly concrete, Materials (Basel). 14 (2021). [CrossRef]
  67. T. Luo, C. Hua, F. Liu, Q. Sun, Y. Yi, X. Pan, Effect of adding solid waste silica fume as a cement paste replacement on the properties of fresh and hardened concrete, Case Stud. Constr. Mater. 16 (2022) 1–14. [CrossRef]
  68. S. Bhanja, B. Sengupta, Influence of silica fume on the tensile strength of concrete, Cem. Concr. Res. 35 (2005) 743–747. [CrossRef]
  69. S.K. Das, S.M. Mustakim, A. Adesina, J. Mishra, T.S. Alomayri, H.S. Assaedi, C.R. Kaze, Fresh, strength and microstructure properties of geopolymer concrete incorporating lime and silica fume as replacement of fly ash, J. Build. Eng. 32 (2020) 101780. [CrossRef]
  70. G.E.P. Box, K.B. Wilson, On the Experimental Attainment of Optimum Conditions, J. R. Stat. Soc. Ser. B. 13 (1951) 1–38. [CrossRef]
  71. M.A. DeRousseau, J.R. Kasprzyk, W. V. Srubar, Computational design optimization of concrete mixtures: A review, Cem. Concr. Res. 109 (2018) 42–53. [CrossRef]
  72. ASTM-C305-20, Standard Practice for Supplementation, ASTM Stand. Guid. (2020). [CrossRef]
  73. ASTM Committee C109, Standard Test Method for Compressive Strength of Hydraulic Cement Mortars, Annu. B. ASTM Stand. 04 (2021) 109. [CrossRef]
  74. ASTM-C511-13, Standard Specification for Mixing Rooms , Moist Cabinets , Moist Rooms , and Water, ASTM Stand. Guid. (2015) 23–25.
  75. ASTM C1679, Standard Practice for Measuring Hydration Kinetics of Hydraulic Cementitious Mixtures Using Isothermal Calorimetry, Am. Soc. Test. Mater. West Conshohocken, PA, USA. 04 (2014) 1–15.
  76. J. Mena, M. González, J.C. Remesar, M. Lopez, Developing a very high-strength low-CO2 cementitious matrix based on a multi-binder approach for structural lightweight aggregate concrete, Constr. Build. Mater. 234 (2020) 117830. [CrossRef]
  77. J. Yajun, J.H. Cahyadi, Effects of densified silica fume on microstructure and compressive strength of blended cement pastes, 33 (2003) 1543–1548. [CrossRef]
  78. M.I.S. De Rojas, J. Rivera, M. Frías, Influence of the microsilica state on pozzolanic reaction rate, 29 (1999) 945–949.
  79. D.R.G. Mitchell, I. Hinczak, R.A. Day, INTERACTION OF SILICA FUME WITH CALCIUM HYDROXIDE SOLUTIONS, 28 (1998) 1571–1584.
  80. I.A. Shar, F.A. Memon, N. Bheel, Z.H. Shaikh, A.A. Dayo, Use of Wheat Straw Ash as Cement Replacement Material in the Concrete, 3 (2019) 5–7.
Figure 1. BBD model.
Preprints 109211 g001
Figure 2. Curing of specimens in water.
Preprints 109211 g002
Figure 3. Compression test of samples.
Preprints 109211 g003
Figure 4. Particle size distribution of raw materials.
Preprints 109211 g004
Figure 5. (a) Morphology of silica fume by electron microscope, (b) agglomeration and (c) silica fume.
Preprints 109211 g005
Figure 6. Morphology of cement and WSA. (a) cement particles, (b) and (c) WSA.
Preprints 109211 g006aPreprints 109211 g006b
Figure 7. Normalized hydration heat.
Preprints 109211 g007
Figure 8. Normalized heat flow.
Preprints 109211 g008
Figure 9. Compressive strength.
Preprints 109211 g009
Figure 10. FE-SEM images of pastes at 56 days. (a) cement, (b) SF and (c) WSA at 1 μ m, (d) WSA at 20 μ m.
Preprints 109211 g010
Figure 11. (a) 7-day, (b) 28-day (c) 56-day quantile-quantile plots.
Preprints 109211 g011aPreprints 109211 g011b
Figure 12. 3D model of RSM. (a) 7, (b) 28, and (c) 56 days with W/B=0.5.
Preprints 109211 g012
Figure 13. Contour plots for (a) 7, (b) 28, and (c) 56 days with W/B=0.5.
Preprints 109211 g013
Figure 14. Predicted (-P) and experimental (-E) mixes from RSM.
Preprints 109211 g014
Figure 15. Carbon footprint (intensity index) versus 56-day compressive strength.
Preprints 109211 g015
Table 1. Emissions of CO2 in kg per kg of raw material.
Material CO2eq (kg/kg) Reference
Cement 0.813 [61]
Biomass ash 0.05 [62]
SF 0.00001 [61]
Table 2. Chemical composition of raw materials.
Compounds Cement (%) WSA (%) SF (%)
CaO 59.0 5.33 0.18
SiO 2 24.8 27.12 94.50
Al 2 O 3 5.80 0.57 -
Fe 2 O 3 3.29 0.15 0.14
SO 3 2.88 0.79 -
MgO 1.07 0.52 -
K 2 O 0.79 6.81 0.45
TiO 2 0.23 - -
SrO 0.09 - -
Cl - 1.18 -
P 2 O 5 - 0.69 -
Na 2 O - 0.42 -
MnO - 0.17 -
LOI 2.01 - 4.76
Table 3. Summary of the different paste mixes with cement replacement by WSA and SF.
Levels in the BBD model Experimental composition
Mixes nomenclature W/B WSA SF W/B WSA (%) SF (%)
B0.4W0S5 -1 -1 0 0.4 0 5
B0.6W0S5 1 -1 0 0.6 0 5
B0.4W20S5 -1 1 0 0.4 20 5
B0.6W20S5 1 1 0 0.6 20 5
B0.4W10S0 -1 0 -1 0.4 10 0
B0.6W10S0 1 0 -1 0.6 10 0
B0.4W10S10 -1 0 1 0.4 10 10
B0.6W10S10 1 0 1 0.6 10 10
B0.5W0S0 0 -1 -1 0.5 0 0
B0.5W20S0 0 1 -1 0.5 20 0
B0.5W0S10 0 -1 1 0.5 0 10
B0.5W20S10 0 1 1 0.5 20 10
B0.5W10S5-1 0 0 0 0.5 10 5
B0.5W10S5-2 0 0 0 0.5 10 5
B0.5W10S5-3 0 0 0 0.5 10 5
Table 4. Shapiro-Wilk normality test.
Age W p value
7 days 0.97 0.86
28 days 0.97 0.89
56 days 0.97 0.85
Table 5. Analysis of variance and estimated coefficients of compressive strength for the 7-day model.
Factor Coefficient Std. Error t value Pr ( > |t|)
Constant 17.62 0.65 27.07 0.0000000001093***
W/B -4.69 0.61 -7.7 0.01649***
WSA -3.3 0.61 -5.14 0.0004356***
W/B:WSA 4.13 0.86 4.8 0.0007220***
(W/B)2 -2.14 0.89 -2.4 0.0373727*
Note: significance codes: 0 ‘***’ 0.001 ‘**’ 0.01 ‘*’ 0.05 ‘.’ 0.1 ‘ ’ 1
Table 6. Analysis of variance and estimated coefficients of compressive strength for the 28-day model.
Factor Coefficient Std. Error t value Pr ( > |t|)
Constant 25.13 1.14 22.04 0.00001896***
W/B -5.31 0.84 -6.32 0.0002274***
WSA -5.35 0.84 -6.38 0.0002136***
SF -1.53 0.84 -1.82 0.1057541
W/B:WSA 3.48 1.19 2.93 0.0189174*
(W/B)2 -3.39 1.23 -2.75 0.0249159*
(SF)2 3.52 1.23 2.86 0.0211537*
Note. Significance codes: 0 ‘***’ 0.001 ‘**’ 0.01 ‘*’ 0.05 ‘.’ 0.1 ‘ ’ 1
Table 7. Analysis of variance and estimated coefficients of compressive strength for the 56-day model.
Factor Coefficient Std. Error t value Pr ( > |t|)
Constant 26.21 1.25 21.04 0.000001308***
W/B -5.21 1.17 -4.47 0.001203**
WSA -5.08 1.17 -4.36 0.001423**
SF 0.8 1.17 0.68 0.510685
(SF)2 5.52 1.71 3.23 0.008980**
Note. Significance codes: 0 ‘***’ 0.001 ‘**’ 0.01 ‘*’ 0.05 ‘.’ 0.1 ‘ ’ 1
Table 8. Validation mixtures to confirm the predictive model.
Mixtures W/B WSA SF W/B WSA (%) SF (%)
B0.5W15S10 0 0.5 1 0.5 15 10
B0.51W12S9 0.1 0.2 0.8 0.51 12 9
B0.5W12S5 0 0.2 0 0.5 12 5
Table 9. Model prediction errors as per the validation experiments.
Mixtures Model error 7 days (%) Model error 28 days (%) Model error 56 days (%)
B0.5W15S10 4.8 4.1 5.1
B0.51W12S9 2.2 5.4 6.1
B0.5W12S5 5.6 0.3 -2.7
Disclaimer/Publisher’s Note: The statements, opinions and data contained in all publications are solely those of the individual author(s) and contributor(s) and not of MDPI and/or the editor(s). MDPI and/or the editor(s) disclaim responsibility for any injury to people or property resulting from any ideas, methods, instructions or products referred to in the content.
Copyright: This open access article is published under a Creative Commons CC BY 4.0 license, which permit the free download, distribution, and reuse, provided that the author and preprint are cited in any reuse.
Prerpints.org logo

Preprints.org is a free preprint server supported by MDPI in Basel, Switzerland.

Subscribe

© 2024 MDPI (Basel, Switzerland) unless otherwise stated