
Submitted:
13 June 2024
Posted:
17 June 2024
You are already at the latest version
Abstract
Background: Potential calcium-related adverse events of vitamin D supplement use have not been addressed in large-scale, real-world data so far.
Methods: Leveraging data from the UK Biobank, encompassing 445,493 individuals aged 40-69, we examined associations of high 25-hydroxyvitamin (25[OH]D) levels ≥100 nmol/L and vitamin D supplementation with hypercalcemia (plasma calcium >2.6 mmol/L), kidney stones, and atherosclerosis assessments (pulse wave arterial stiffness index and carotid intima-medial thickness). Regression models were comprehensively adjusted for 49 covariates.
Results: Approximately 1.5% of the participants had high 25(OH)D levels, 4.3% regularly used vitamin D supplements, and 20.4% reported regular multivitamin use. At baseline, the hypercalcemia prevalence was 1.6%, and 1.1% were diagnosed with kidney stones during follow-up. High 25(OH)D levels were neither associated with calcium-related adverse events nor atherosclerosis assessments. Vitamin D and multivitamin supplementation were associated with an increased prevalence of hypercalcemia (odds ratios and 95% confidence intervals: 1.46[1.32-1.62] and 1.11[1.04-1.18], respectively) but were neither associated with atherosclerosis nor future kidney stones.
Conclusion: High 25(OH)D levels observable in routine care were not associated with any adverse outcome. Vitamin D users have a slightly higher prevalence of hypercalcemia, possibly due to co-supplementation with calcium, but without higher atherosclerosis prevalence or risk of kidney stones.
Keywords:
Vitamin D supplementation
; high 25-hydroxyvitamin D concentration
; adverse events
; real-world evidence
1. Background
Vitamin D, a critical regulator of calcium homeostasis and bone health, has garnered substantial attention in recent years for its multifaceted role in human physiology. The active hormone derived from vitamin D, known as 1,25-dihydroxyvitamin D (1,25(OH)2D3), has the capacity to bind to the vitamin D receptor found on a wide array of cells throughout the human body, including bone, muscle, immune cells, and kidney [1,2,3,4,5,6]. Beyond its established influence on bone health, vitamin D has been found to be associated with an array of health benefits [2,3,4,5,7,8,9,10]. Media reports on the health effects of vitamin D have led to a strong public interest in the intake of vitamin D supplements, often without prescription or even knowledge by the general practitioners. There are concerns regarding the safety of this widespread vitamin D supplements use in the public due to the profound influence of vitamin D on calcium absorption and utilization, which might lead to hypercalcemia, and in turn could precipitate the formation of kidney stones, a process intricately associated with calcium regulation [11,12]. Hence, there is keen interest in exploring whether routine vitamin D supplementation in the general population is associated with adverse events related to hypercalcemia, such as kidney stones, in large real-world data.
Furthermore, in consideration of the potential deleterious impact of elevated blood calcium levels on arterial stiffness and atherosclerosis [13,14], our investigation extended its scope to evaluate the cross-sectional association of high 25(OH)D status, and vitamin D supplementation with two surrogate markers of atherosclerosis - pulse wave arterial stiffness index (PASI) and carotid intima-medial thickness (CIMT).
In summary, this study will utilize real-world data from the large, population-based UK Biobank to investigate whether high serum 25(OH)D levels and vitamin D supplement use are cross-sectionally associated with hypercalcemia, PASI, and CIMT, and to investigate the longitudinal associations with kidney stones.
2. Materials and Methods
2.1. Data Source
This study used data from the UK Biobank, a comprehensive prospective cohort comprising over 500,000 participants from the United Kingdom (UK) aged between 40 and 69 years at enrolment [15]. From 2006 to 2010, biomedical information was systematically collected through the 22 assessment centers situated across England, Scotland, and Wales [15]. During the assessment visit, participants provided electronically signed consent, a filled touch-screen questionnaire, a brief interview, and a broad spectrum of physical and functional assessments [15,16]. Subsequent follow-up data on health outcomes were obtained through linkages to multiple healthcare records, encompassing the UK National Health Service (NHS) data, primary care records, primary care data, cancer screening data, and disease-specific registers [17]. The study adhered to the principles outlined in the Declaration of Helsinki and received approval from the North West Haydock Research Ethics Committee (#16/NW/0274, 13 May 2016).
2.2. Vitamin D Status
The quantification of 25(OH)D concentrations was conducted utilizing the Chemiluminescent Immunoassay on the DiaSorin Liaison XL platform (manufactured by Diasorin S.p.A), and additionally verified through the RIQAS Immunoassay Specialty I scheme [18]. Vitamin D deficiency and insufficiency were classified according to the thresholds recommended by the Institute of Medicine in the US, wherein serum 25(OH)D concentrations below 30 nmol/L and between 30 and < 50 nmol/L are labelled as vitamin D deficiency and insufficiency, respectively [19]. Adequate vitamin D status was delineated by 25(OH)D levels ranging from 50 to < 100 nmol/L. We considered 25(OH)D concentrations of ≥ 100 nmol/L as high vitamin D status to assess the potential for vitamin D overdose.
2.3. Vitamin D Supplements Use
The data regarding the usage of vitamin D and multivitamin supplements were extracted from the baseline questionnaire administered by the UK Biobank, utilizing the query (Data Field 6155): “Do you regularly take any of the following?”. The available response options of “Vitamin D” and “Multivitamins with or without minerals” were extracted for analyses. Of the individuals who indicated regular consumption of vitamin D supplements, 16.7% procured them through prescriptions, and 83.3% acquired them over-the-counter (OTC).
2.4. Study Outcomes
The study examined four outcomes: hypercalcemia, PASI, and CIMT in cross-sectional analyses, as well as kidney or ureteral calculus in longitudinal analysis. The latter outcome is abbreviated as “kidney stones” in the following.
2.4.1. Hypercalcemia
2.4.2. PASI
Pulse wave velocity (PWV) was measured with the PulseWave PCA2 device (CareFusion, San Diego, CA) during the initial visit to the UK Biobank assessment center using the pulse waveform obtained from the finger utilizing an infrared sensor (Data Field 21021) [23,24]. The configuration of the volume waveform in the finger is intricately associated with the temporal dynamics of pulse wave propagation through the arterial network in the lower extremities and its subsequent rebound to the finger [23,24]. The apparatus was affixed to a digit, with measurements conducted over a period of 10–15 seconds. The stiffness index in meters per second (m/s) was derived from the interval between consecutive peaks of the waveform and normalized based on the height of individuals [23].
Given the absence of a consensus on PASI cut-offs to delineate normalcy and abnormality, we referenced the normal range from the device manual, which provided a normal range of stiffness index based on subject ages [25]. PASI values exceeding the upper limit of the age-specific normal stiffness index range were classified as an adversely high PASI. The equation for calculating the upper limit of the normal range was [25]:
Cut-off (adversely high PASI) = 0.1663 × age + 4.3858.
2.4.3. CIMT
CIMT serves as a non-invasive method to assess subclinical changes indicative of cardiovascular disease. In the UK Biobank, CIMT measurements were documented during imaging visits commencing in 2014 (Data Fields 22670-22681) [26]. Ultrasound measurements were conducted on the far wall of the distal common carotid artery, with recordings taken at two angles on each side (left and right). Automated software facilitated the capture of images and measurements of the minimum, mean, and maximum intima-media thickness.
In this study, the average of four mean measures (two from each of the left and right carotid arteries) was computed to determine the mean CIMT value. An adversely high CIMT was defined as an average mean CIMT exceeding 0.9 mm, as recommended by the European Society of Hypertension/European Society of Cardiology hypertension guideline [27].
2.4.4. Kidney Stones
Follow-up data pertaining to the initial diagnosis of kidney stones till 31 October 2022 was gathered through a variety of sources including the death register, primary care records, hospital admission data, and self-reported information, as well as amalgamated data from multiple sources within the UK Biobank using the 10th revision of the International Statistical Classification of Diseases (ICD-10) code N20 “calculus of kidney and ureter” (Data Field 132037) [28,29]. Data obtained solely from self-reports were censored during the follow-up in the analyses.
2.5. Covariates
The study incorporated factors previously identified to be statistically and independently associated with either vitamin D deficiency (n=48) or vitamin D supplementation use (n=49) from earlier analyses of the UK Biobank cohort [30]. These encompass sociodemographic factors, dietary and lifestyle factors, and a broad spectrum of biomarkers and diseases (e.g., cancer, coronary heart diseases [CHD] and diabetes), as well as vitamin D-specific factors, such as season of blood draw and geographic latitudes. Notably, we also included hyperparathyroidism diagnosed prior to or at the study baseline (Data Field 130723) as an additional covariate in all analyses. Both hyperparathyroidism and cancer are significant etiologies of hypercalcemia [31,32]. The baseline distributions of all covariates in the population analysed are presented in Supplemental Table 1. Detailed descriptions of the assessment methods of the covariates have been outlined in a previous publication [30].
2.6. In- and Exclusion Criteria
From the total population of n=502,366 in the UK Biobank database, we excluded individuals without serum 25(OH)D measurements at baseline, as well as those without information on vitamin D or multivitamin supplement use, resulting in the population of n=445,493 available for the subsequent analyses (see flow-chart, Figure 1). Due to variations in data availability for each outcome, individuals with missing data for the corresponding outcomes were further excluded from the cross-sectional analyses in the corresponding analytical dataset of hypercalcemia, PASI, and CIMT. Therefore, n=407,185, n=150,117, and n=43,958 participants were included in the three analytical datasets, respectively. In the longitudinal analysis, individuals with a history of kidney stones at or before baseline were excluded and n=439,189 individuals were included in the analysis for this outcome.
2.7. Statistical Analyses
2.7.1. General Remarks
Statistical analyses were conducted using SAS statistical software (version 9.4, SAS Institute, Inc., Cary, NC, USA). The assumption of proportional hazards was assessed using Schoenfeld residuals, revealing no violations of this assumption. All statistical tests were two-tailed, with a significance level set at α = 0.05. Multiple imputation with the Markov chain Monte Carlo method was employed to address missing data, generating five imputed datasets [33,34]. Analytical outcomes from imputed datasets were amalgamated using the SAS procedure 'PROC MIANALYZE'.
2.7.2. The Association of 25(OH)D Levels with the Study Outcomes
We used logistic regression to conduct the cross-sectional analyses examining the association of vitamin D deficiency, and vitamin D insufficiency and high vitamin D status with reference to adequate vitamin D status with hypercalcemia, adversely high PASI and CIMT and Cox proportional hazard regression to assess the longitudinal association with kidney stones. Two distinct models were applied: model 1, which was adjusted for age and sex, and model 2, which was adjusted for all covariates (n=49) previously identified as determinants of vitamin D deficiency (please see legend of Table 2) [30].
Furthermore, dose-response curves of 25(OH)D levels with the four outcomes were generated using restricted cubic splines (RCS) with three knots positioned at the 25th, 50th, and 75th percentiles of 25(OH)D values and full adjustment for 49 covariates [35,36]. A reference point of 75 nmol/L for 25(OH)D was used.
2.7.3. The Association of Vitamin D Supplements Use with the Study Outcomes
In tandem with 25(OH)D status, logistic regression and Cox proportional hazards regressions were utilized to investigate the association of vitamin D supplements and multivitamin use with the study outcomes in cross-sectional and longitudinal analyses, respectively. The covariates present in the full models were substituted with the array of the factors previously identified as determinants of vitamin D supplement use (n=50, see legend of Table 2).
2.7.4. Subgroup Analyses
Subgroup analyses were conducted to explore the association of 25(OH)D levels and vitamin D supplement use with hypercalcemia and kidney stones across different demographic strata, including age groups (<60/≥60 years old), sexes (female/male) and levels of kidney function categorized by the estimated glomerular filtration rate (eGFR): <60, 60-<90, and ≥90 ml/min/1.73m2.
3. Results
3.1. Description of the Study Population
Table 1 shows the overview of the characteristics of the available population (n=445,493) in the UK Biobank. The median age was 58 (interquartile range [IQR]: 50; 63) years at the time of enrolment. Slightly more females (53.6%) than males participated in the study. Two thirds (66.7%) of the population were either overweight or obese and almost half of the participants (45.1%) ever smoked during life-time. Approximately one third (31%) of the population were alcohol abstainers, while 12% had a high level of alcohol consumption per day. At the study baseline, over a quarter (26.9%) of the population had hypertension, while diabetes (5.0%), CHD (4.7%), hyperparathyroidism (0.1%), and an impaired eGFR < 60 ml/min/1.73m2 (2.3%) were less frequent. The median number of chronic diseases per person was 2 (IQR: 1; 3). The distribution of all covariates considered in this study is provided in Supplemental Table 1.
In terms of the study outcomes, the median blood calcium concentration was 2.37 mmol/L (IQR: 2.31; 2.43 mmol/L), with hypercalcemia (>2.6 mmol/L) identified in 1.6% of the total population. The prevalence of hypercalcemia was twofold higher in females compared to males (2.0% versus [vs.] 1.0%). Over the median follow-up of 12.8 years, approximately 1.1% of the population had a diagnosis of kidney stones. Males had a twice as high incidence of kidney stone formation compared to females (1.6% vs. 0.8%). The median values for PASI and CIMT were 9.0 (IQR: 6.9; 11.1) and 0.67 (IQR: 0.60; 0.76), respectively, and adversely high PASI and CIMT were observed for 7.6% and 6.2% of the population with the data available, respectively.
A considerable proportion of the study population exhibited either vitamin D deficiency (21.0%) or insufficiency (34.3%), while approximately 1.5% of the population had high 25(OH)D levels of 100 nmol/L and above. Notably, only 4.3% of the population reported regular intake of vitamin D supplements, with an additional 20.4% using multivitamin products.
The distribution of the baseline characteristics across the four different datasets used for the four outcomes was generally similar (Supplemental Table 2), with the exception of a lower proportion of CHD (2.4%) observed in the dataset used for the CIMT.
3.2. Association of Vitamin D Exposure with Hypercalcemia
The cross-sectional associations of 25(OH)D level status and vitamin D supplement use with hypercalcemia are shown in Table 2. Compared to vitamin D sufficiency (25[OH]D between 50 - <100 nmol/L), high vitamin D serum status (25(OH)D ≥ 100 nmol/L) was not associated with an increased prevalence of hypercalcemia. However, both vitamin supplements use, and multivitamin use were associated with a significantly increased odds of hypercalcemia by 46% and 11%, respectively.
To investigate, whether the hypercalcemia cases could be caused by a vitamin D overdose, we compared the distribution of 25(OH)D concentrations among users of vitamin D supplements with and without the presence of hypercalcemia (Supplemental Figure 1). The median 25(OH)D level of individuals with hypercalcemia (59.6, IQR: 44.9; 72.1, nmol/L) was not statistically significant different (p=0.14, Wilcoxon rank-sum test) from the median 25(OH)D level of individuals without hypercalcemia (57.4, IQR: 43.3; 71.0, nmol/L). Thus, the observed association between vitamin D supplement use and increased hypercalcemia risk is independent from the 25(OH)D levels.
Subgroup analyses for the association of high 25(OH)D status of ≥ 100 nmol/L and vitamin D supplement use with hypercalcemia did not show relevant differences between age groups, sexes and kidney function (pinteraction>0.05, Supplemental Tables S3–5).
3.3. Association of Vitamin D Exposure with Kidney Stones
In the longitudinal analyses assessing the association of high vitamin D status, vitamin D supplements use or multivitamin use with kidney stones, no statistically significant associations were observed (Table 3). In contrast, vitamin D deficiency and insufficiency were associated with a 7% and 11% increased risk of kidney stones in the fully adjusted model 2, respectively, but only the finding for vitamin D insufficiency was statistically significant.
Subgroup analyses showed that vitamin D supplement use and multivitamin use were associated with 23% and 11% decreased risk of kidney stone among younger participants, respectively. Other findings regarding the associations of high 25(OH)D levels ≥ 100 nmol/L and vitamin D supplement use with kidney stones across age groups, sexes, and kidney functions were comparable to the results of the main analysis (pinteraction>0.05, Supplemental Tables S6–8).
3.4. Association of Vitamin D Exposure with PASI and CIMT
No statistically significant associations were observed between high 25(OH)D levels, vitamin D use or multivitamin use and either abnormal PASI or CIMT (Table 4). In contrast, vitamin D insufficiency was associated with a 6% increased risk of abnormal PASI levels in the full model. The association for vitamin D deficiency was the same (6% risk increase) but not statistically significant.
3.5. Dose-Response Association of 25(OH)D Levels with the Study Outcomes
The RCS curves depicting the dose-response associations of serum 25(OH)D concentration and hypercalcemia, kidney stones, PASI, and CIMT did not reveal that 25(OH)D levels exceeding 100 nmol/L were associated with increased risk of any adverse events, compared to the reference value of 75 nmol/L (Figure 2 and 3). In contrast, even a statistically significant decrease in the risk of kidney stones was observed for high 25(OH)D levels (Figure 2b). Furthermore, the risk of kidney stones (Figure 2b) and an adversely high PASI (Figure 3a) were statistically significantly increased at lower 25(OH)D levels in the insufficiency/deficiency range but these were small effect estimates with OR or HR point estimates of 1.10 or lower.
4. Discussion
4.1. Summary of the Study Findings
This study leveraged the data from 445,493 middle-aged and older adults of the UK Biobank to investigate the associations of high 25(OH)D levels and vitamin D supplement use with potential adverse outcomes, including hypercalcemia, kidney stones, as well as adversely high PASI and CIMT - two surrogate parameters of atherosclerosis. A high 25(OH)D level of ≥ 100 nmol/L did not show an association with any of the study outcomes in models comprehensively adjusted for 49 covariates. In contrast, we observed cross-sectional associations of low 25(OH)D levels in the vitamin D deficiency/insufficiency range with adversely high PASI, and a longitudinal association with an increased risk of kidney stones. Both regular vitamin D use and multivitamin supplements use were associated with a higher prevalence of hypercalcemia but neither with atherosclerosis nor future kidney stones. In addition, the observed association was improbable attributable to vitamin D overdosing, as no statistically significant difference was observed between the distributions of 25(OH)D concentration in vitamin D users with and without hypercalcemia.
4.2. Vitamin D and Hypercalcemia
As of present, no meta-analysis is available for the association between high 25(OH)D concentrations and hypercalcemia. The finding of our study is consistent with observations from a single study that investigated the prevalence of hypercalcemia among 282,932 patients from a Turkish hospital encompassing 495 individuals with notably elevated 25(OH)D levels exceeding 88 ng/mL (equivalent to 220 nmol/L) [37]. Similarly to our results, a study from Turkey did not show a statistically significant association between high 25(OH)D levels and blood calcium levels [37].
However, a Mendelian randomization study using genome-wide data from the UK Biobank showed an association between genetically predicted 25(OH)D levels and blood calcium levels [38]. This finding is an agreement with results from RCTs. A meta-analysis encompassing 37 RCTs showed an increased risk of hypercalcemia in individuals receiving vitamin D supplements compared to those receiving a placebo (relative risk [RR], 95% CI: 1.54, 1.09; 2.18) [39]. This effect estimate is consistent with the one from our study, using extensive real-world data from the general population (OR, 95%CI: 1.46, 1.32; 1,62 for comparison of vitamin D supplements users and non-users). Another recent meta-analysis of 10 RCTs including only trials with high-dose vitamin D supplementation (3200 to 4000 IU per day) showed an even higher risk of hypercalcemia (RR, 95% CI: 2.21, 1.26; 3.87) [40]. However, the association between vitamin D supplement use and increased hypercalcemia risk observed in our study is unlikely to be due to vitamin D overdosing since none of the vitamin D users who were diagnosed with hypercalcemia did exhibit excessively high 25(OH)D levels > 300 nmol/L, which was previously found to be safe with regards to hypercalcemia events [41].
Given the comprehensive adjustment for numerous covariates including the most common cause of hypercalcemia (i.e., hyperparathyroidism) in our analyses, the observed association might be explained by genetic factors resulting in a higher sensitivity of the calcium metabolism towards vitamin D and calcium co-supplementation. Studies suggest that insufficient suppression of calcitriol in susceptible individuals may trigger excessive absorption of calcium in the intestines when exposed to significant calcium intake [42,43]. Of note, in our study population, 60% of individuals who received vitamin D prescriptions from their general practitioners (GPs) received calcium prescriptions as well. It appears plausible to assume that the increased hypercalcemia risk observed in the UK Biobank cannot be explained by vitamin D supplements use alone and is rather attributable to co-supplementation of vitamin D and calcium to individuals genetically susceptible to develop this adverse event.
4.3. Vitamin D and Kidney Stones
The association of vitamin D with kidney stones has frequently been explored. Mendelian Randomization studies showed an association of genetically predicted 25(OH)D with the risk of kidney stones [38,44]. In contrast, a meta-analysis of 32 observational studies involving 23,228 participants did not show a significant difference in serum 25(OH)D levels between individuals with and without nephrolithiasis but their 1,25(OH)2D levels differed [45]. It is noteworthy that the majority of observational studies included in the meta-analysis were subject to limitations, such as a cross-sectional design, small sample sizes, and inadequate adjustment of important vitamin D-related confounding factors [39,40,45,46,47]. Nevertheless, our longitudinal analysis was in agreement with the meta-analysis with regard to the absence of an association of high 25(OH)D levels with an increased risk of kidney stone formation. Likewise, there is no evidence from meta-analyses of RCTs that vitamin D supplementation increases the risk of kidney stones [39,40].
Contrary to the anticipated adverse impact of high 25(OH)D levels on kidney stones, we observed that low 25(OH)D levels were statistically significantly, yet weakly, associated with increased risk of kidney stones. This finding could be supported by prior studies that have reported a notable prevalence of vitamin D deficiency in stone formers. For instance, a case-control study involving 884 patients with idiopathic calcium nephrolithiasis compared to 967 controls revealed a higher prevalence of 25(OH)D levels < 50 nmol/L (56%) in stone formers than in controls (44%; p < 0.001) [48]. Similarly, another case-control study examining 239 calcium stone formers vs. 127 controls yielded a comparable pattern (28% vs. 15.7%; p=0.009) [49].
4.4. Vitamin D and PASI
In our study, we did not find evidence indicating an elevated risk of an adversely increased PASI associated with high 25(OH)D concentrations. Conversely, we observed a significant association between low 25(OH)D levels with an adversely increased PASI. Consistent with our findings, an observational study conducted among 544 healthy participants aged 20-79 years in the US showed an association between vitamin D insufficiency and increased arterial stiffness [50]. Similar findings regarding the association between 25(OH)D levels and arterial stiffness were also observed in two out of three smaller-scale observational studies conducted in Canadian, Turkish and Chinese populations (n=123-175) [51,52,53,54].
A positive effect of adequate 25(OH)D levels on arterial stiffness is also supported by evidence from RCTs. A meta-analysis of 9 RCTs showed an improvement in arterial stiffness following vitamin D supplementation, particularly in subgroup analyses targeting individuals with vitamin D deficiency, with study durations of ≥ 4 months and daily doses of vitamin D3 ≥ 2000 IU [55].
4.5. Vitamin D and CIMT
A meta-analysis incorporating data from 17 observational studies revealed an inverse association between 25(OH)D concentrations and the continuous CIMT scale [56]. However, upon pooling the risk estimates from another three observational studies using ORs for adverse CIMT scales, no significant association was observed between serum vitamin D status and the risk of CIMT (OR, 95% CI: 0.96, 0.74; 3.86) [56]. This observation is further corroborated by several other observational studies that likewise failed to identify such an association [57,58], which is in agreement with our findings from the large UK Biobank. Although there is some evidence for an efficacy of vitamin D supplementation on a reduction of CIMT from RCTs, this needs to be interpreted with caution because it is only based on 3 RCTs involving a total of 99 participants [56].
4.6. Dose-Response Relationships of 25(OH)D Concentration with the Study Outcomes
To our knowledge, this study marks the first exploration of dose-response relationships between 25(OH)D concentrations and calcium metabolism related safety outcomes. No U-shaped associations were observed, which was consistent with the reported effect estimates for vitamin D deficiency, insufficiency and high vitamin D status.
4.7. Strengths and Limitations
To our knowledge, this is the largest study investigating the potential adverse events of regular vitamin D supplementation in the general population. The utilization of data from the large UK Biobank provided the investigation sufficient statistical power to detect potential associations despite the low frequency of these events in the general population. Moreover, the UK Biobank offers valuable information on the usage of vitamin D supplements obtained over the counter, a practice more common than prescription-based supplementation. Thus, allowing for the investigation of actual vitamin D supplement usage patterns. Furthermore, the comprehensive adjustment for a maximum of 50 covariates, including vitamin D-specific factors, controlled for confounding to a large extent, although residual confounding can never be completely excluded in observational studies.
However, this study also has limitations. The UK Biobank is subject to the well-known "healthy volunteer" bias, potentially influencing the estimation of disease prevalence [59]. Nevertheless, the relative risk estimates derived from exposure-outcome associations are expected to be less susceptible to this bias. Additionally, the study lacks information regarding the dosage and chemical properties of the vitamin D supplements used. Unfortunately, urinary calcium levels were not assessed in the UK Biobank, which precluded adding hypercalciuria as an endpoint to this investigation.
Regarding the potential adverse events studied, we did not look into other potential concequences of hypercalcemia than kindey stones or atherosclerosis (e.g. cardiac arrhythmias, hyporeflexia, and muscle weakness). These are areas for future research. Futhermore, we employed ICD-10 code N20 to identify kidney stones, which includes, but is not limited to, calcium-based stones. However, since approximately 80% of kidney stones are calcium-based [60], we think that the inclusion of other stone types in the endpoint definition will have influences the results to a minimal extent.
Last, the findings of this study could be primarily generalizable to individuals of European ancestry residing in regions without widespread vitamin D food fortification. Variations in results might be observed in regions with food fortification, differing levels of sun exposure, and non-White ethnicities.
5. Conclusions
In the large, population-based UK Biobank cohort, high 25(OH)D levels did not demonstrate any associations with potential adverse calcium metabolism related outcomes, including hypercalcemia, kidney stones, and surrogate parameters of atherosclerosis. Although regular vitamin D supplements use was associated with a higher prevalence of hypercalcemia, it was neither associated with atherosclerosis nor future kidney stones. Moreover, we provide additional analyses showing that the hypercalcemia cases are likely not caused by vitamin D supplementation alone. We assume that these cases have been caused by vitamin D and calcium co-supplementation in specifically, genetically susceptible individuals.
We conclude that the use of multivitamin and vitamin D supplements in the real-life setting in the UK is practiced safely. This finding is not surprising when keeping in mind that 10,000 IU (=250 µg) vitamin D3/day is the lowest dose in clinical trials at which adverse effects were observed and that 4,000 IU (=100 µg) vitamin D3/day is the official tolerable upper intake level for adults in the European Union [61]. Such high intakes are likely rarely present in the general population.
Conflicts of Interest:
All authors declare no conflict of interest.
Author Contributions
BS accounted for conceptualization, data curation, funding acquisition, project administration, reviewing and editing of the manuscript, as well as supervision of the study. SS accounted for data curation, formal analysis, methodology, and drafting the original manuscript. All co-authors accounted for reviewing & editing of the manuscript. SS and BS are accountable for all aspects of the work in ensuring that questions related to the accuracy or integrity of any part of the work are appropriately investigated and resolved.
Funding
This investigation was conducted utilizing data from the UK Biobank Resource, acquired under application number "62848". The UK Biobank project was established through collaboration between various entities including the Wellcome Trust, the Medical Research Council, Department of Health, Scottish Government, and the Northwest Regional Development Agency. Additional funding was provided by the Welsh Assembly Government, British Heart Foundation, Cancer Research UK, and Diabetes UK, with support from the National Health Service (NHS). It's important to emphasize that the sponsors were not involved in data acquisition, analyses or the decision-making process related to publishing these findings. The authors assume full responsibility for the analysis and interpretation of the data.
Data Availability Statement
The study used data from the UK Biobank. Publicly available data is accessible to researchers via an open application on https://www.ukbiobank.ac.uk/register-apply/.
References
- Afzal, S.; Brøndum-Jacobsen, P.; Bojesen, S.E.; Nordestgaard, B.G. Genetically low vitamin D concentrations and increased mortality: mendelian randomisation analysis in three large cohorts. BMJ 2014, 349, g6330–g6330. [Google Scholar] [CrossRef] [PubMed]
- Autier, P.; Boniol, M.; Pizot, C.; Mullie, P. Vitamin D status and ill health: a systematic review. Lancet Diabetes Endocrinol. 2014, 2, 76–89. [Google Scholar] [CrossRef] [PubMed]
- Brown AJ, Dusso A, Slatopolsky E. Vitamin D. Am J Physiol. 1999;277(2):F157-75.
- Feldman, D.; Krishnan, A.V.; Swami, S.; Giovannucci, E.; Feldman, B.J. The role of vitamin D in reducing cancer risk and progression. Nat. Rev. Cancer 2014, 14, 342–357. [Google Scholar] [CrossRef] [PubMed]
- Veldman CM, Cantorna MT, DeLuca HF. Expression of 1,25-dihydroxyvitamin D(3) receptor in the immune system. Arch Biochem Biophys. 2000;374(2):334-8.
- Dusso, A.S. Renal vitamin D receptor expression and vitamin D renoprotection. Kidney Int. 2012, 81, 937–939. [Google Scholar] [CrossRef]
- Afzal, S.; Brøndum-Jacobsen, P.; Bojesen, S.E.; Nordestgaard, B.G. Genetically low vitamin D concentrations and increased mortality: mendelian randomisation analysis in three large cohorts. BMJ 2014, 349, g6330–g6330. [Google Scholar] [CrossRef] [PubMed]
- Chiang, K.-C.; Yeh, C.-N.; Chen, T.C. Vitamin D and Pancreatic Cancer—An Update. Cancers 2011, 3, 213–226. [Google Scholar] [CrossRef] [PubMed]
- Khammissa, R.A.G.; Fourie, J.; Motswaledi, M.H.; Ballyram, R.; Lemmer, J.; Feller, L. The Biological Activities of Vitamin D and Its Receptor in Relation to Calcium and Bone Homeostasis, Cancer, Immune and Cardiovascular Systems, Skin Biology, and Oral Health. BioMed Res. Int. 2018, 2018, 1–9. [Google Scholar] [CrossRef] [PubMed]
- Agrawal, D.; Yin, K. Vitamin D and inflammatory diseases. J. Inflamm. Res. 2014, 7, 69–87. [Google Scholar] [CrossRef] [PubMed]
- Coe FL, Evan A, Worcester E. Kidney stone disease. J Clin Invest. 2005;115(10):2598-608.
- Alexander, R.; Fuster, D.; Dimke, H. Mechanisms Underlying Calcium Nephrolithiasis. Annu. Rev. Physiol. 2022, 84, 559–583. [Google Scholar] [CrossRef] [PubMed]
- Kimura, K.; Tomiyama, H.; Matsumoto, C.; Odaira, M.; Shiina, K.; Nagata, M.; Yamashina, A. Longitudinal changes of the serum calcium levels and accelerated progression of arterial stiffness with age. Atherosclerosis 2015, 243, 486–492. [Google Scholar] [CrossRef]
- Shin, S.; Kim, K.-J.; Chang, H.-J.; Cho, I.; Kim, Y.J.; Choi, B.-W.; Rhee, Y.; Lim, S.-K.; Yang, W.-I.; Shim, C.-Y.; et al. Impact of serum calcium and phosphate on coronary atherosclerosis detected by cardiac computed tomography. Eur. Hear. J. 2012, 33, 2873–2881. [Google Scholar] [CrossRef] [PubMed]
- UK Biobank. UK Biobank Showcase User Guide: Getting Started: UK Biobank; 2017 [cited 21.07.2021]. Available from: https://biobank.ndph.ox.ac.uk/showcase/.
- Elliott, P.; Peakman, T.C.; Biobank, O.B.O.U. The UK Biobank sample handling and storage protocol for the collection, processing and archiving of human blood and urine. Leuk. Res. 2008, 37, 234–244. [Google Scholar] [CrossRef] [PubMed]
- Sudlow, C.; Gallacher, J.; Allen, N.; Beral, V.; Burton, P.; Danesh, J.; Downey, P.; Elliott, P.; Green, J.; Landray, M.; et al. UK Biobank: An Open Access Resource for Identifying the Causes of a Wide Range of Complex Diseases of Middle and Old Age. PLoS Med. 2015, 12, e1001779. [Google Scholar] [CrossRef] [PubMed]
- Fry D, Almond R, Moffat S, Gordon M, Singh P. UK Biobank Biomarker Project Companion Document to Accompany Serum Biomarker Data: UK Biobank 2019 [cited 23.07.2021]. Available from: https://biobank.ndph.ox.ac.uk/showcase/showcase/docs/serum_biochemistry.pdf.
- Institute of Medicine Committee to Review Dietary Reference Intakes for Vitamin D, Calcium. The National Academies Collection: Reports funded by National Institutes of Health. In: Ross AC, Taylor CL, Yaktine AL, Del Valle HB, editors. Dietary Reference Intakes for Calcium and Vitamin D. Washington (DC): National Academies Press (US). Copyright © 2011, National Academy of Sciences.; 2011.
- Minisola, S.; Pepe, J.; Piemonte, S.; Cipriani, C. The diagnosis and management of hypercalcaemia. BMJ 2015, 350, h2723–h2723. [Google Scholar] [CrossRef]
- Soar, J.; Perkins, G.D.; Abbas, G.; Alfonzo, A.; Barelli, A.; Bierens, J.J.; Brugger, H.; Deakin, C.D.; Dunning, J.; Georgiou, M.; et al. European Resuscitation Council Guidelines for Resuscitation 2010 Section 8. Cardiac arrest in special circumstances: Electrolyte abnormalities, poisoning, drowning, accidental hypothermia, hyperthermia, asthma, anaphylaxis, cardiac surgery, trauma, pregnancy, electrocution. Resuscitation 2010, 81, 1400–1433. [Google Scholar] [CrossRef] [PubMed]
- UK Biobank. Data-Field 30680 2023 [cited 26 Nov.2023]. Available from: https://biobank.ndph.ox.ac.uk/showcase/field.cgi?id=30680.
- UK Biobank. Data-Field 21021 2023 [cited 24 Nov.2023]. Available from: https://biobank.ndph.ox.ac.uk/showcase/field.cgi?id=21021.
- UK Biobank. UK Biobank Arterial Pulse-Wave Velocity Version 1.0 2011 [cited 26 Nov.2023]. Available from: https://biobank.ndph.ox.ac.uk/ukb/ukb/docs/Pulsewave.pdf.
- CareFusion, UK. PulseTrace PCA2. Operating Manual English 2010 [cited 26 Nov.2023]. Available from: https://docplayer.es/23504573-Pulsetrace-pca2-operating-manual-english-manual-operativo-espanol.html.
- UK Biobank. Category 101 Carotid ultrasound 2023 [cited 29 Oct.2023]. Available from: https://biobank.ctsu.ox.ac.uk/crystal/label.cgi?id=101.
- Mancia, G.; De Backer, G.; Dominiczak, A.; Cifkova, R.; Fagard, R.; Germano, G.; Grassi, G.; Heagerty, A.M.; Kjeldsen, S.E.; Laurent, S.; et al. 2007 Guidelines for the management of arterial hypertension: The Task Force for the Management of Arterial Hypertension of the European Society of Hypertension (ESH) and of the European Society of Cardiology (ESC). Eur. Heart J. 2013, 34, 1462–1536. [Google Scholar] [CrossRef] [PubMed]
- UK Biobank. Data-Field 132036 2023 [cited 20 Nov.2023]. Available from: https://biobank.ndph.ox.ac.uk/ukb/field.cgi?id=132036.
- UK Biobank. Data-Field 132037 2023 [cited 20 Nov.2023]. Available from: https://biobank.ndph.ox.ac.uk/ukb/field.cgi?id=132037.
- Sha, S.; Nguyen, T.M.N.; Kuznia, S.; Niedermaier, T.; Zhu, A.; Brenner, H.; Schöttker, B. Real-world evidence for the effectiveness of vitamin D supplementation in reduction of total and cause-specific mortality. J. Intern. Med. 2022, 293, 384–397. [Google Scholar] [CrossRef] [PubMed]
- Pokhrel B, Leslie SW, Levine SN. Primary Hyperparathyroidism. StatPearls. Treasure Island (FL) ineligible companies. Disclosure: Stephen Leslie declares no relevant financial relationships with ineligible companies. Disclosure: Steven Levine declares no relevant financial relationships with ineligible companies.: StatPearls Publishing. Copyright © 2024, StatPearls Publishing LLC.; 2024.
- Seccareccia, D. Cancer-related hypercalcemia. . 2010, 56, 244–6. [Google Scholar] [PubMed]
- Sterne, J.A.C.; White, I.R.; Carlin, J.B.; Spratt, M.; Royston, P.; Kenward, M.G.; Wood, A.M.; Carpenter, J.R. Multiple imputation for missing data in epidemiological and clinical research: potential and pitfalls. BMJ 2009, 338, b2393–b2393. [Google Scholar] [CrossRef]
- Yuan, YC. Multiple Imputation for Missing Data: Concepts and New Development (Version 9.0). SAS Institute Inc.; 2011. Available from: https://facweb.cdm.depaul.edu/sjost/csc423/documents/multipleimputation.pdf.
- Desquilbet, L.; Mariotti, F. Dose-response analyses using restricted cubic spline functions in public health research. Stat. Med. 2010, 29, 1037–1057. [Google Scholar] [CrossRef]
- Holick, M.F.; Binkley, N.C.; Bischoff-Ferrari, H.A.; Gordon, C.M.; Hanley, D.A.; Heaney, R.P.; Murad, M.H.; Weaver, C.M. Evaluation, Treatment, and Prevention of Vitamin D Deficiency: An Endocrine Society Clinical Practice Guideline. Med. J. Clin. Endocrinol. Metab. 2011, 96, 1911–1930. [Google Scholar] [CrossRef] [PubMed]
- Batman, A.; Saygili, E.S.; Yildiz, D.; Sen, E.C.; Erol, R.S.; Canat, M.M.; Ozturk, F.Y.; Altuntas, Y. Risk of hypercalcemia in patients with very high serum 25-OH vitamin D levels. Int. J. Clin. Pr. 2021, 75, e14181. [Google Scholar] [CrossRef]
- Jian, Z.; Huang, Y.; He, Y.; Jin, X.; Li, H.; Li, S.; Wang, K. Genetically Predicted Lifelong Circulating 25(OH)D Levels are Associated With Serum Calcium Levels and Kidney Stone Risk. J. Clin. Endocrinol. Metab. 2021, 107, e1159–e1166. [Google Scholar] [CrossRef]
- Malihi, Z.; Wu, Z.; Stewart, A.W.; Lawes, C.M.; Scragg, R. Hypercalcemia, hypercalciuria, and kidney stones in long-term studies of vitamin D supplementation: a systematic review and meta-analysis. Am. J. Clin. Nutr. 2016, 104, 1039–1051. [Google Scholar] [CrossRef]
- Zittermann, A.; Trummer, C.; Theiler-Schwetz, V.; Pilz, S. Long-term supplementation with 3200 to 4000 IU of vitamin D daily and adverse events: a systematic review and meta-analysis of randomized controlled trials. Eur. J. Nutr. 2023, 62, 1833–1844. [Google Scholar] [CrossRef]
- Kimball, S.M.; Mirhosseini, N.; Holick, M.F. Evaluation of vitamin D3 intakes up to 15,000 international units/day and serum 25-hydroxyvitamin D concentrations up to 300 nmol/L on calcium metabolism in a community setting. Dermato-Endocrinology 2017, 9, e1300213. [Google Scholar] [CrossRef] [PubMed]
- Broadus, A.E.; Insogna, K.L.; Lang, R.; Ellison, A.F.; Dreyer, B.E. Evidence for Disordered Control of 1,25-Dihydroxyvitamin D Production in Absorptive Hypercalciuria. New Engl. J. Med. 1984, 311, 73–80. [Google Scholar] [CrossRef]
- Machado, M.C.; Bruce-Mensah, A.; Whitmire, M.; Rizvi, A.A. Hypercalcemia Associated with Calcium Supplement Use: Prevalence and Characteristics in Hospitalized Patients. J. Clin. Med. 2015, 4, 414–424. [Google Scholar] [CrossRef]
- Liu, W.; Wang, M.; Liu, J.; Yan, Q.; Liu, M. Causal effects of modifiable risk factors on kidney stones: a bidirectional mendelian randomization study. BMC Med Genom. 2023, 16, 1–12. [Google Scholar] [CrossRef] [PubMed]
- Hu, H.; Zhang, J.; Lu, Y.; Zhang, Z.; Qin, B.; Gao, H.; Wang, Y.; Zhu, J.; Wang, Q.; Zhu, Y.; et al. Association between Circulating Vitamin D Level and Urolithiasis: A Systematic Review and Meta-Analysis. Nutrients 2017, 9, 301. [Google Scholar] [CrossRef]
- Taylor EN, Stampfer MJ, Curhan GC. Dietary Factors and the Risk of Incident Kidney Stones in Men: New Insights after 14 Years of Follow-up. J Am Soc Nephrol. 2004;15(12):3225-32.
- Curhan GC, Willett WC, Knight EL, Stampfer MJ. Dietary Factors and the Risk of Incident Kidney Stones in Younger Women: Nurses' Health Study II. Arch Intern Med. 2004;164(8):885-91.
- Ticinesi, A.; Nouvenne, A.; Ferraro, P.M.; Folesani, G.; Lauretani, F.; Allegri, F.; Guerra, A.; Cerundolo, N.; Aloe, R.; Lippi, G.; et al. Idiopathic Calcium Nephrolithiasis and Hypovitaminosis D: A Case-control Study. Urology 2016, 87, 40–45. [Google Scholar] [CrossRef] [PubMed]
- Girón-Prieto, M.S.; Cano-García, M.d.C.; Arrabal-Polo, M. .; Poyatos-Andujar, A.; Quesada-Charneco, M.; de Haro-Muñoz, T.; Arias-Santiago, S.; Arrabal-Martín, M. Analysis of vitamin D deficiency in calcium stone-forming patients. Int. Urol. Nephrol. 2016, 48, 1243–1246. [Google Scholar] [CrossRef] [PubMed]
- Al Mheid, I.; Patel, R.; Murrow, J.; Morris, A.; Rahman, A.; Fike, L.; Kavtaradze, N.; Uphoff, I.; Hooper, C.; Tangpricha, V.; et al. Vitamin D Status Is Associated With Arterial Stiffness and Vascular Dysfunction in Healthy Humans. Circ. 2011, 58, 186–192. [Google Scholar] [CrossRef] [PubMed]
- Andrade, J.; Er, L.; Ignaszewski, A.; Levin, A. Exploration of Association of 1,25-OH2D3 with Augmentation Index, a Composite Measure of Arterial Stiffness. Clin. J. Am. Soc. Nephrol. 2008, 3, 1800–1806. [Google Scholar] [CrossRef] [PubMed]
- Gürel. M.; Bilgiç, A.; Demirçelik, B.; Özaydin, M.; Bozduman, F.; Aytürk, Z.; Yilmaz, H.; Atar, A.; Selçoki, Y.; Eryonucu, B. The relationship between 25-hydroxyvitamin D levels and ambulatory arterial stiffness index in newly diagnosed and never-treated hypertensive patients. Blood Press. Monit. 2016, 21, 49–53. [Google Scholar] [CrossRef] [PubMed]
- Şeker, T.; Gür, M.; Kuloğlu, O.; Kalkan, G.Y.; Şahin, D.Y.; Türkoğlu, C.; Elbasan, Z.; Baykan, A.O.; Gözübüyük, G.; Çaylı, M. Serum 25-hydroxyvitamin D is associated with both arterial and ventricular stiffness in healthy subjects. J. Cardiol. 2013, 62, 361–365. [Google Scholar] [CrossRef] [PubMed]
- Zuo, J.; Qian, K.; He, Y.; Tan, I.; Butlin, M.; Avolio, A.; Chen, P. Serum 25-Hydroxyvitamin D Deficiency and Insufficiency are Associated with Ankle-Brachial Index but not Arterial Stiffness in an Elderly Community-dwelling Chinese Population. Artery Res. 2019, 25, 113–119. [Google Scholar] [CrossRef]
- Chen, N.-C.; Hsu, C.-Y.; Mao, P.C.-M.; Dreyer, G.; Wu, F.-Z.; Chen, C.-L. The effects of correction of vitamin D deficiency on arterial stiffness: A systematic review and updated meta-analysis of randomized controlled trials. J. Steroid Biochem. Mol. Biol. 2019, 198, 105561. [Google Scholar] [CrossRef]
- Säidifard, N.; Tangestani, H.; Djafarian, K.; Shab-Bidar, S. Serum Vitamin D Level and Carotid Intima-Media Thickness: A Systematic Review and Meta-Analysis of Observational Studies and Randomized Control Trials. Horm. Metab. Res. 2020, 52, 305–315. [Google Scholar] [CrossRef]
- Winckler K, Tarnow L, Lundby-Christensen L, Almdal TP, Wiinberg N, Eiken P, et al. Vitamin D, carotid intima-media thickness and bone structure in patients with type 2 diabetes. Endocr Connect. 2015;4(2):128-35.
- Taskiran, B.; Cansu, G.B.; Bahadir, E.; Mutluay, R. Role of Vitamin D in Intima Media Thickness in Patients with Type 1 Diabetes Mellitus. J. Natl. Med Assoc. 2017, 109, 14–20. [Google Scholar] [CrossRef]
- Batty, G.D.; Gale, C.R.; Kivimäki, M.; Deary, I.J.; Bell, S. Comparison of risk factor associations in UK Biobank against representative, general population based studies with conventional response rates: prospective cohort study and individual participant meta-analysis. BMJ 2020, 368, m131. [Google Scholar] [CrossRef] [PubMed]
- Dawson, C.H.; Tomson, C.R. Kidney stone disease: pathophysiology, investigation and medical treatment. Clin. Med. 2012, 12, 467–471. [Google Scholar] [CrossRef] [PubMed]
- Nutrition, N.F.a.F. (.E.P.o.; Turck, D.; Bohn, T.; Castenmiller, J.; de Henauw, S.; Hirsch-Ernst, K.; Knutsen, H.K.; Maciuk, A.; Mangelsdorf, I.; McArdle, H.J.; et al. Scientific opinion on the tolerable upper intake level for vitamin D, including the derivation of a conversion factor for calcidiol monohydrate. EFSA J. 2023, 21, e08145. [Google Scholar] [CrossRef] [PubMed]
Figure 1.
Flow chart of the study population inclusion and exclusion. Abbreviation: 25(OH)D: 25-hydroxyvitamin D, CIMT: carotid intima medial thickness, ICD-10: the 10th revision of the international classification of disease, PASI: pulse wave arterial stiffness index a Sourced from self-reported, primary care, hospital admission, and death register data.
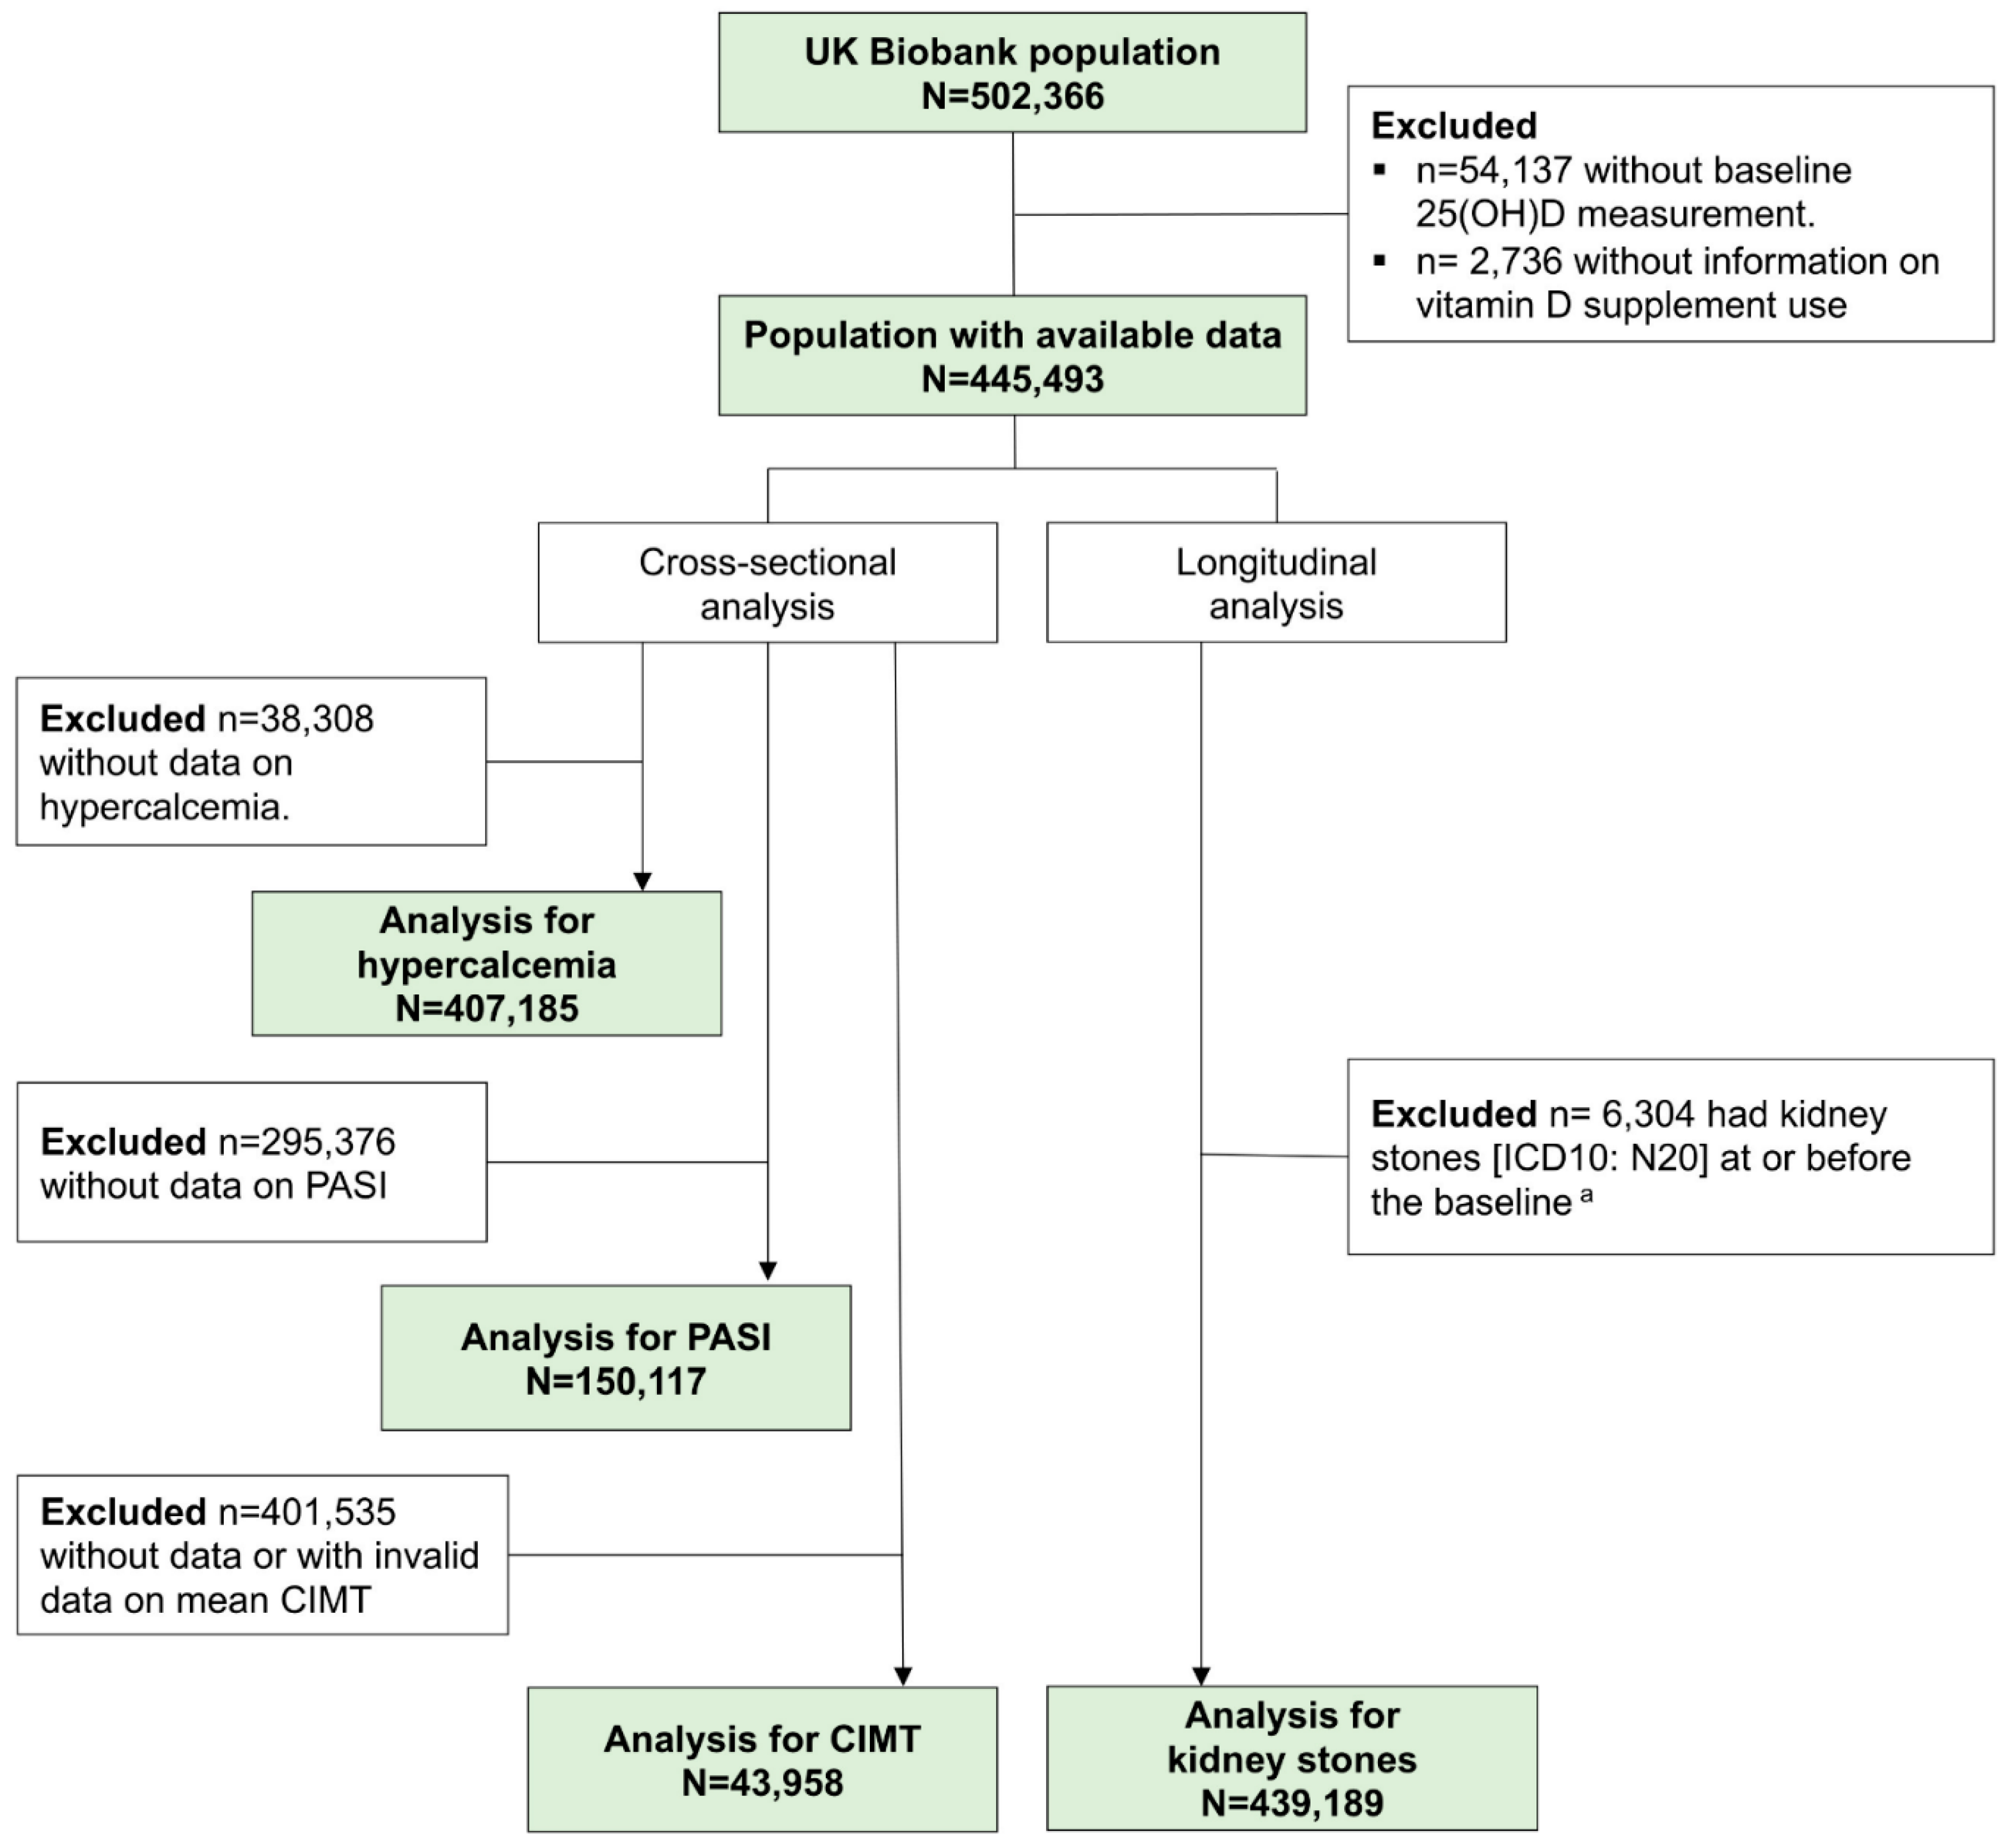
Figure 2.
Dose-response relationship of serum 25-hydroxyvitamin D concentration with a) hypercalcemia (cross-sectional analysis), and b) kidney stones (longitudinal analysis). Note: 3 knots were used and located at the 25th, 50th, and 75th serum 25-hydroxyvitamin D percentile and the 75 nmol/L was used as the reference. Horizontal lines represent the odds ratio or hazard ratio of 1. Solid lines are estimates of odds ratio or hazard ratios and dashed lines are their 95% confidence intervals. Knots are represented by dots. The models are adjusted for all covariates included (n=49, see legend of Table 2).
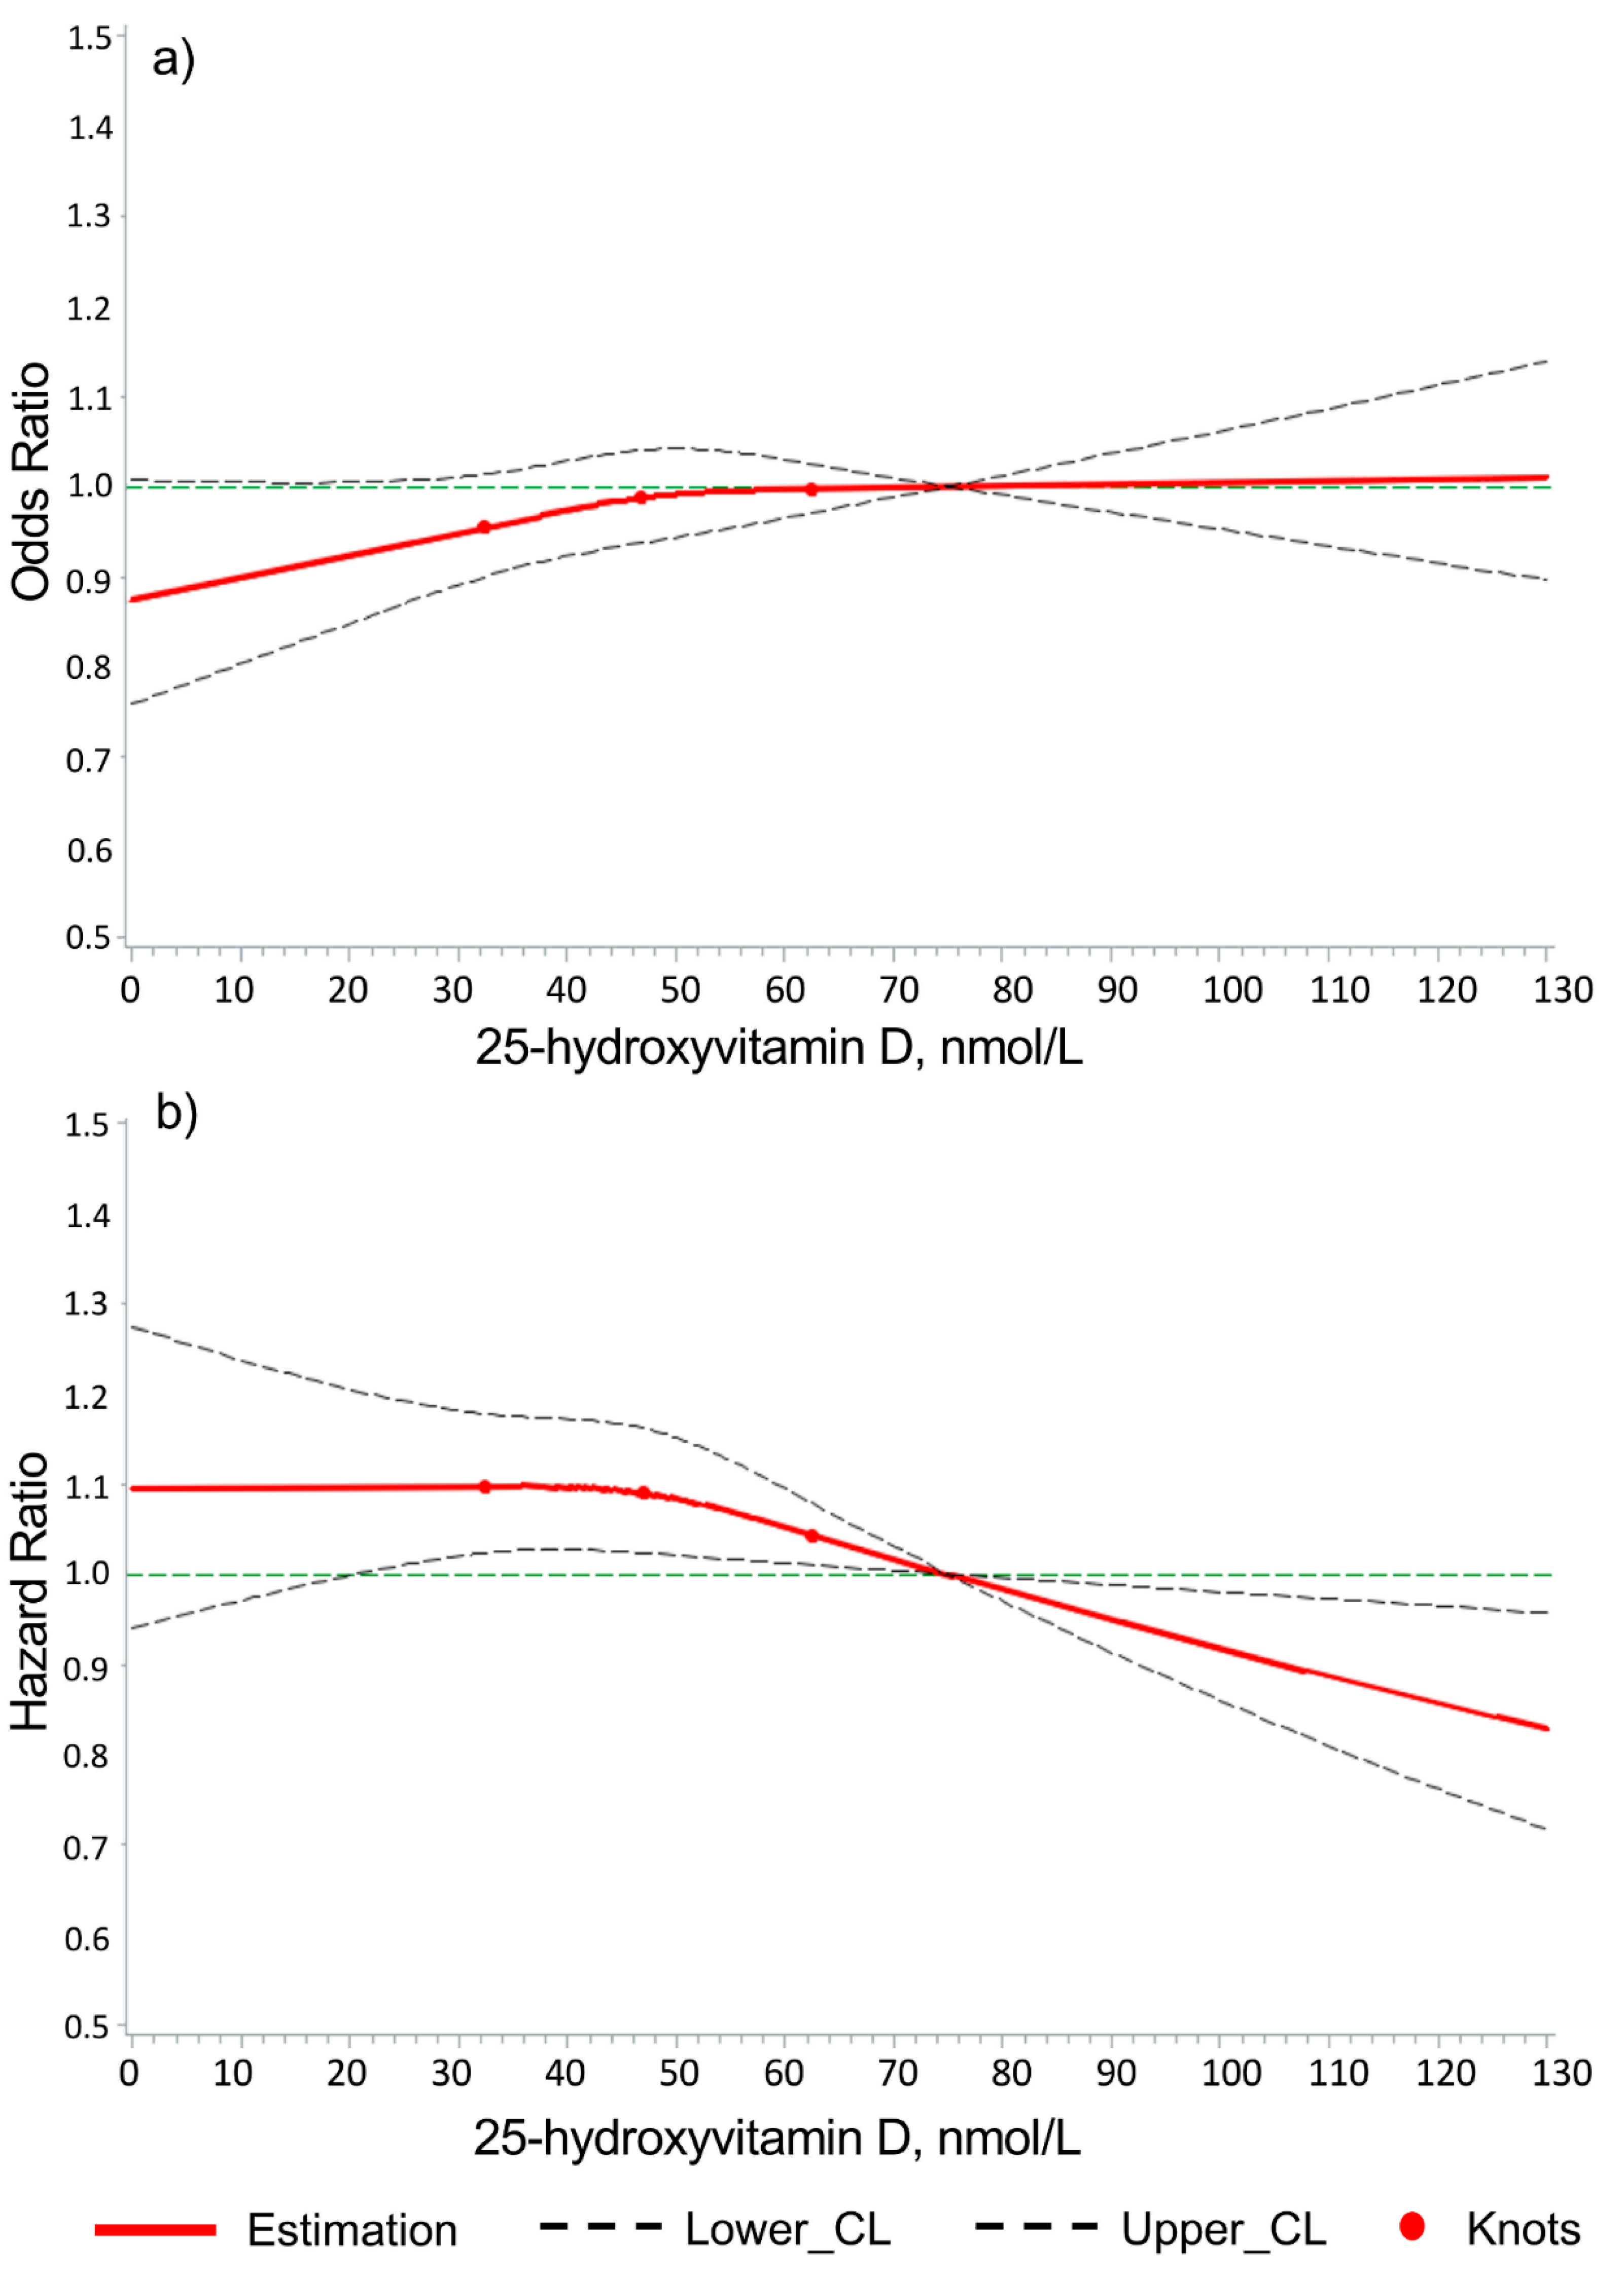
Figure 3.
Dose-response relationship of serum 25-hydroxyvitamin D concentration with a) pulse wave arterial stiffness index, and b) carotid intima medial thickness. Note: 3 knots were used and located at the 25th, 50th, and 75th serum 25-hydroxyvitamin D percentile and the 75 nmol/L was used as the reference. Horizontal lines represent the odds ratio of 1. Solid lines are estimates of odds ratios and dashed lines are their 95% confidence intervals. Knots are represented by dots. The models are adjusted for all covariates included (n=49, see legend of Table 2).
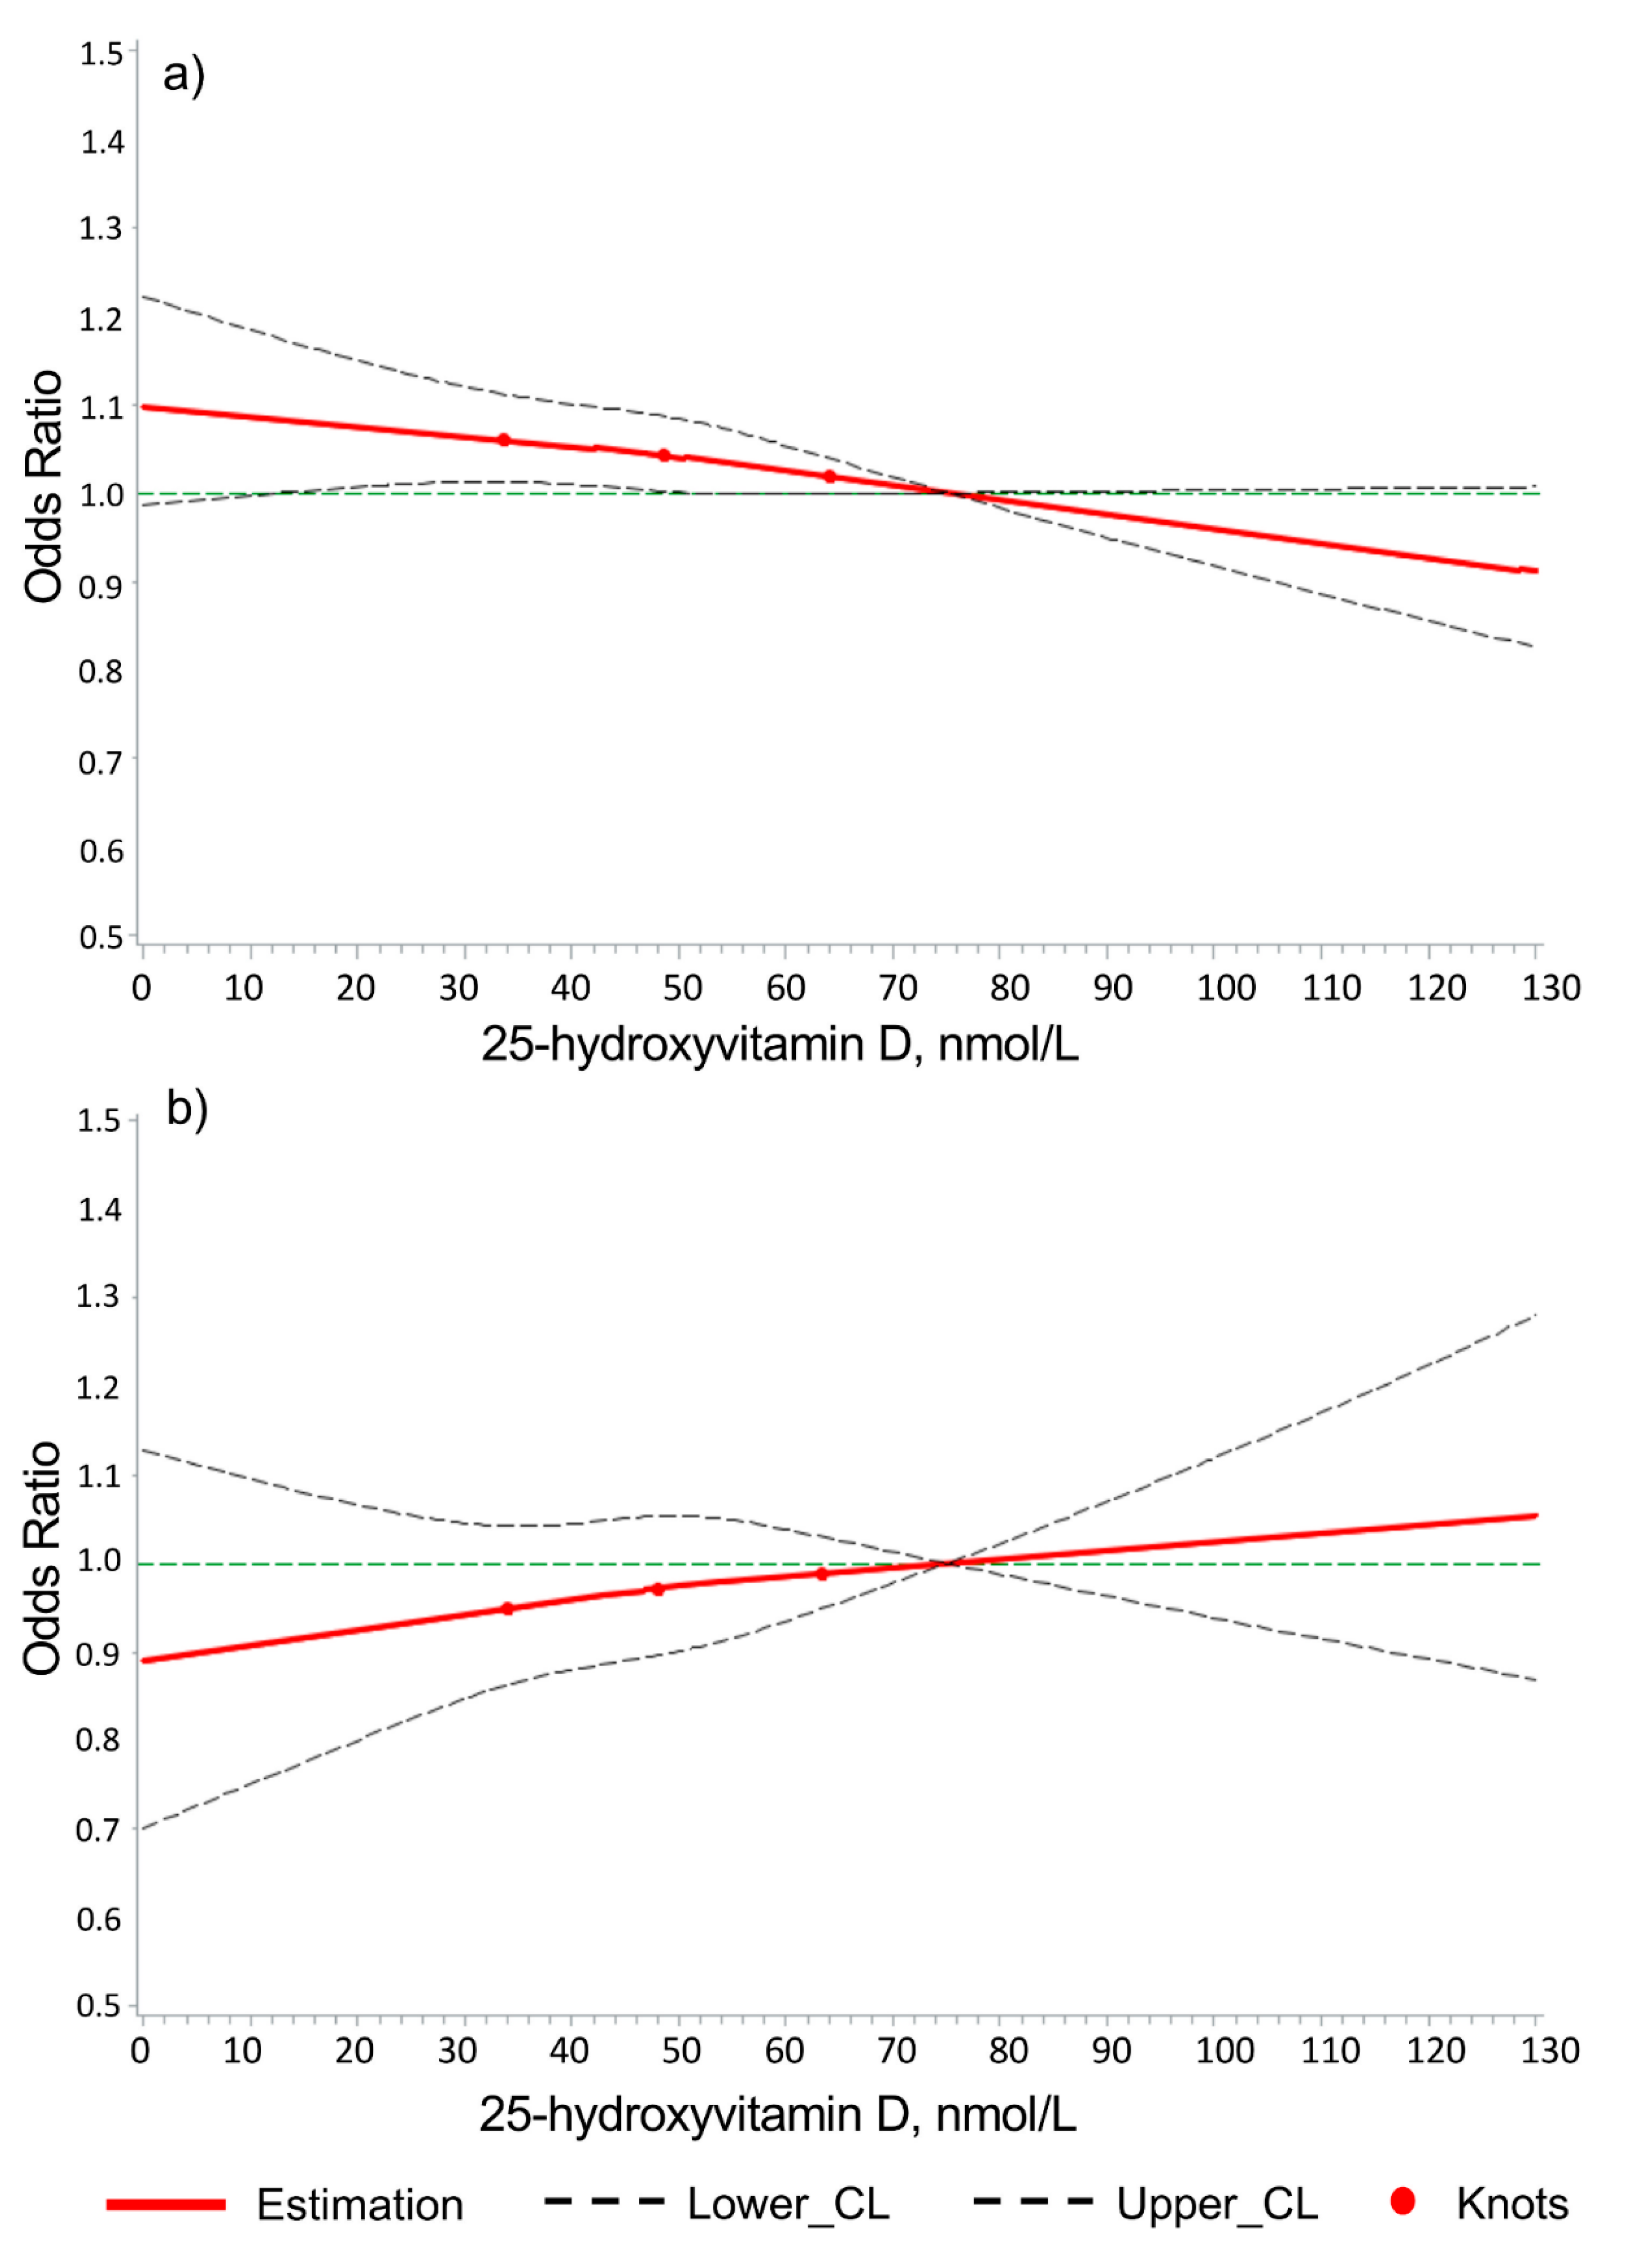

Table 1.
Baseline characteristics of the UK Biobank study population with vitamin D related data (N=445,493).
Table 1.
Baseline characteristics of the UK Biobank study population with vitamin D related data (N=445,493).
| Variables | N (%) a /Median (IQR) |
|---|---|
| Sex, n (%) | |
| Female | 238,942 (53.6) |
| Male | 206,551 (46.4) |
| Age (years) | |
| Mean (SD) | 56.5 (8.1) |
| Median (IQR) | 58 (50; 63) |
| BMI, n (%) | |
| < 18.5 | 2,285 (0.5) |
| 18.5 - <25 | 145,608 (32.8) |
| 25 - < 30 | 188,111 (42.4) |
| ≥30 | 107,814 (24.3) |
| Smoking, n (%) | |
| Never | 244,481 (54.9) |
| Ever | 200,868 (45.1) |
| Alcohol consumptionb, n (%) | |
| Abstainer | 137,944 (31.0) |
| Low | 178,258 (40.0) |
| Medium | 75,677 (17.0) |
| High | 53,614 (12.0) |
| Hypertension, n (%) | 119,924 (26.9) |
| Diabetes, n (%) | 22,264 (5.0) |
| CHD, n (%) | 20,841 (4.7) |
| eGFR (ml/min/1.73 m2), n (%) | |
| ≥ 90 | 264,715 (59.5) |
| 60-< 90 | 170,102 (38.2) |
| < 60 | 10,135 (2.3) |
| Hyperparathyroidism, n (%) | 583 (0.1) |
| Calcium (mmol/L), Median (IQR) | 2.37 (2.31; 2.43) |
| Hypercalcemia, n (%) | 6,325 (1.6) |
| Kidney stones (during follow-up), n (%) | 5,097 (1.1) |
| PASI (m/s), Median (IQR) | 9.0 (6.9; 11.1) |
| Adversely high PASI c, n (%) | 11,473 (7.6) |
| Average of mean CIMT (mm), Median (IQR) | 0.67 (0.60; 0.76) |
| Adversely high CIMT > 0.9 mm, n (%) | 2,713 (6.2) |
| No. of chronic diseases, Median (IQR) | 2 (1; 3) |
| 25(OH)D concentration (nmol/L), Median (IQR) | 46.9 (32.4; 62.5) |
| Vitamin D status, n (%) | |
| Vitamin D deficiency (<30 nmol/L) | 93,406 (21.0) |
| Vitamin D insufficiency (30- <50 nmol/L) | 152,925 (34.3) |
| Vitamin D sufficiency (50 - < 100 nmol/L) | 192,488 (43.2) |
| High vitamin D status (≥ 100 nmol/L) | 6,674 (1.5) |
| Regular vitamin supplement use, n (%) | |
| None | 335,562 (75.3) |
| Multivitamin ± minerals product | 90,752 (20.4) |
| Vitamin D specific medication | 19,179 (4.3) |
Note: 25(OH)D: 25-hydroxyvitamin D, AVD: atherosclerotic vascular disease, BMI: body mass index, CHD: coronary heart disease, CIMT: carotid intima-medial thickness, eGFR: estimated glomerular filtration rate, IQR: interquartile range, PASI: pulse wave arterial stiffness index, SD: standard deviation. a Denominators in proportion calculation do not include missing values. b Alcohol consumption: Low: Women > 0-19.99 grams of ethanol per day (g/d) or men > 0-39.99 g/d; Medium: Women 20-39.99 g/d or men 40-59.99 g/d; High: Women ≥ 40g/d or men ≥ 60 g/d. c Based on calculated age specific cut-off values.
Table 2.
Associations of vitamin D serum status with hypercalcemia prevalence (cross-sectional analysis).
Table 2.
Associations of vitamin D serum status with hypercalcemia prevalence (cross-sectional analysis).
| Vitamin D exposure | Hypercalcemia prevalence | |||
|---|---|---|---|---|
| Ntotal | Ncase (%) | Odds ratio (95%CI) | ||
| Model 1a | Model 2b, c | |||
| Vitamin D serum status, (25[OH]D, nmol/L) | ||||
| Deficiency (<30) | 85,776 | 1,214 (1.4) | 0.93 (0.87; 0.99) | 0.94 (0.87; 1.02) |
| Insufficiency (30-<50) | 140,013 | 2,144 (1.5) | 0.96 (0.91; 1.02) | 0.98 (0.93; 1.04) |
| Sufficiency (50-<100) | 175,302 | 2,871 (1.6) | Ref | Ref |
| High status (≥100) | 6,094 | 96 (1.6) | 1.01 (0.82; 1.24) | 0.98 (0.80; 1.21) |
| Vitamin supplements users | ||||
| Non-users | 306,849 | 4,470 (1.5) | Ref | Ref |
| Multivitamin user | 82,793 | 1,374 (1.7) | 1.08 (1.01; 1.15) | 1.11 (1.04; 1.18) |
| Vitamin D user | 17,543 | 481 (2.7) | 1.57 (1.43; 1.73) | 1.46 (1.32; 1.62) |
Abbreviation: 25(OH)D: 25-hydroxyvitamin D, CI: confidence interval, Ref: reference. a Model 1 is adjusted for age and sex. b For vitamin D serum status, model 2 is adjusted for age, sex, skin colour, latitude of study center and calendar month of attending the assessment center, socio-economic factors (education, Townsend deprivation index, no of individuals in household, and household income), life-style factors (smoking, alcohol consumption, physical activity, frequency of visiting friends/family and consumption of oily fish, cereal, processed meat, milk, bread and spread), and vitamin D specific factors (time spend outdoors in summer and winter, ease of skin tanning, use of sun screen/UV protection, and solarium/sunlamp use), weight variables (body mass index and waist circumference), diseases and disease symptoms (hyperparathyroidism, diabetes, stroke, coronary heart disease, chronic obstructive pulmonary disease, osteoporosis, arthritis, gout, Parkinson, depressed mood, and tiredness/lethargy), biomarkers (estimated glomerular filtration rate, HbA1c, HDL cholesterol, systolic blood pressure, diastolic blood pressure, C-reactive protein, forced expiratory volume in 1-second, and hand grip strength), and general health status (no. of drugs, no. of chronic diseases, disability, and general self-rated health). c For vitamin supplements use, model 2 is adjusted for age, sex, skin colour, latitude of study center and calendar month of attending the assessment center, socio-economic factors (Townsend deprivation index, no of individuals in household, and household income), life-style factors (smoking, alcohol consumption, physical activity, venturesome personality, frequency of visiting friends/family) and vitamin D specific factors (consumption of oily fish, processed meat, milk, bread, spread, time spend outdoors in summer, ease of skin tanning, use of sun screen/UV protection, and solarium/sunlamp use), weight variables (body mass index and waist circumference), diseases & disease symptoms (hyperparathyroidism, cancer, hypertension, stroke, coronary heart disease, chronic obstructive pulmonary disease, asthma, osteoporosis, fractured in last 5 years, arthritis, gout, diabetes, hypothyroidism, chronic fatigue syndrome, tiredness/lethargy in last 2 weeks, dementia, Parkinson, and depressed mood), biomarkers (estimated glomerular filtration rate, C-reactive protein), general health status (disability, general self-rated health and no. of drugs), and medication intake (low dose aspirin, lipid-lowering drugs, and anti-depression drugs).
Table 3.
Associations of vitamin supplements use with kidney stone incidence (longitudinal analysis).
Table 3.
Associations of vitamin supplements use with kidney stone incidence (longitudinal analysis).
| Vitamin D Exposure | Kidney Stone Incidence | |||
|---|---|---|---|---|
| Ntotal | Ncase (%) | Hazard Ratio (95%CI) | ||
| Model 1a | Model 2b | |||
| Vitamin D serum status, (25[OH]D, nmol/L) | ||||
| Deficiency (<30) | 92,063 | 1,172 (1.3) | 1.28 (1.19; 1.38) | 1.07 (0.98; 1.16) |
| Insufficiency (30-<50) | 150,657 | 1,859 (1.2) | 1.20 (1.13; 1.28) | 1.11 (1.04; 1.19) |
| Sufficiency (50-<100) | 189,875 | 1,994 (1.1) | Ref | Ref |
| High status (≥100) | 6,594 | 72 (1.1) | 1.03 (0.81; 1.30) | 1.03 (0.81; 1.30) |
| Vitamin supplements users | ||||
| Non-users | 330,625 | 3,980 (1.2) | Ref | Ref |
| Multivitamin user | 89,638 | 925 (1.0) | 0.92 (0.85; 0.99) | 0.96 (0.89; 1.03) |
| Vitamin D user | 18,926 | 192 (1.0) | 0.97 (0.84; 1.12) | 0.95 (0.82; 1.10) |
Abbreviation: 25(OH)D: 25-hydroxyvitamin D, CI: confidence interval, Ref: reference. a Model 1 adjusted for age and sex. b For covariates of model 2, please see legend of Table 2.
Table 4.
Cross-sectional associations of vitamin D serum status as well as vitamin supplements use with pulse wave arterial stiffness index and carotid intima-medial thickness (cross-sectional analysis).
Table 4.
Cross-sectional associations of vitamin D serum status as well as vitamin supplements use with pulse wave arterial stiffness index and carotid intima-medial thickness (cross-sectional analysis).
| Vitamin D exposure | PASI | CIMT | ||||||
|---|---|---|---|---|---|---|---|---|
| Ntotal | Ncase(%) | Odds ratio (95%CI) | Ntotal | Ncase(%) | Odds ratio (95%CI) | |||
| Model 1a | Model 2b | Model 1a | Model 2b | |||||
| Vitamin D serum status, (25[OH]D, nmol/L) | ||||||||
| Deficiency (<30) | 28,842 | 2,519 (8.7) | 1.22 (1.16; 1.28) | 1.06 (0.99; 1.12) | 8,091 | 456 (5.6) | 1.09 (0.97; 1.22) | 0.97 (0.85; 1.11) |
| Insufficiency (30-<50) | 49,880 | 3,960 (7.9) | 1.13 (1.08; 1.18) | 1.06 (1.01; 1.11) | 15,327 | 918 (6.0) | 1.02 (0.93; 1.12) | 0.96 (0.87; 1.06) |
| Sufficiency (50-<100) | 68,827 | 4,813 (7.0) | Ref | Ref | 19,844 | 1,297 (6.5) | Ref | Ref |
| High status (≥100) | 2,568 | 181 (7.1) | 0.98 (0.84; 1.15) | 1.04 (0.89; 1.21) | 696 | 42 (6.0) | 0.90 (0.65; 1.24) | 0.86 (0.62; 1.20) |
| Vitamin supplements use | ||||||||
| Non-users | 112,249 | 8,764 (7.8) | Ref | Ref | 32,925 | 2,045 (6.2) | Ref | Ref |
| Multivitamin user | 30,863 | 2,203 (7.1) | 0.94 (0.89; 0.98) | 0.98 (0.94; 1.03) | 9,246 | 555 (6.0) | 1.05 (0.95; 1.16) | 1.06 (0.96; 1.17) |
| Vitamin D user | 7,005 | 506 (7.2) | 1.02 (0.93; 1.13) | 1.08 (0.98; 1.19) | 1,787 | 113 (6.3) | 1.02 (0.84; 1.25) | 1.13 (0.92; 1.38) |
Abbreviation: 25(OH)D: 25-hydroxyvitamin D, CI: confidence interval, CIMT: carotid intima medial thickness, PASI: pulse wave arterial stiffness index, Ref: reference. a Model 1 adjusted for age and sex. b Model 2 adjusted for all covariates (see legend of Table 2).
Disclaimer/Publisher’s Note: The statements, opinions and data contained in all publications are solely those of the individual author(s) and contributor(s) and not of MDPI and/or the editor(s). MDPI and/or the editor(s) disclaim responsibility for any injury to people or property resulting from any ideas, methods, instructions or products referred to in the content. |
© 2024 by the authors. Licensee MDPI, Basel, Switzerland. This article is an open access article distributed under the terms and conditions of the Creative Commons Attribution (CC BY) license (http://creativecommons.org/licenses/by/4.0/).
Copyright: This open access article is published under a Creative Commons CC BY 4.0 license, which permit the free download, distribution, and reuse, provided that the author and preprint are cited in any reuse.


