Submitted:
14 June 2024
Posted:
17 June 2024
You are already at the latest version
Abstract
Keywords:
1. Introduction
2. Imputing with MICE
- Type of imputation distribution. One of the main advantages of MICE, in contrast to other approaches, is that a large variety of different distributions are available and that virtually all types of variables can be imputed. For example, continuous and normally distributed variables, such as body height or intelligence, can be imputed but also binary, ordinal, multinomial, or count variables. While some limitations are apparent (e.g., a multinomial variable should never be imputed using a linear model), other decisions are less clear. For example, a continuous and normally distributed variable can be imputed using a linear model and predictive mean matching (PMM). The advantage of PMM is that due to using donors from the data, only values are imputed that are already present in the data, and no impossible values can be generated (Landerman et al., 1997). However, PMM also requires the researcher to set another parameter, the number of potential donors to use (White et al., 2011). Furthermore, some variables have natural boundaries (such as height or income) which can never fall below zero. Some algorithms, such as truncated regression models, respect these limitations, while others do not.
- Adding auxiliary variables to the model. As described above, the imputation model must contain all variables of the analytic model. However, adding even more variables to the imputation model only can be beneficial to improve the quality. Usually, these are variables that have none or only very little missing information and are highly correlated with the other variables, making them good predictors (Schafer, 2003). These variables will not show up in the analytic models (since this potentially leads to high multicollinearity or undermines the effect of interest due to being mediators). However, they can increase the precision of the imputed values and decrease bias. The question arises of which auxiliary variables to use and how many. Large datasets can potentially contain many of these, and researchers can use other statistical approaches, such as correlation analyses, to select them. While the consensus is that auxiliary variables, in general, can be helpful, there are no strict guidelines. Also, survey weights can benefit the imputation model as they add further information to the statistical model (Kim et al., 2006).
- Adding interaction terms or higher order terms. As a rule of thumb, when the analytic model contains an interaction term or a higher order term (squares of cubes of variables), these should also be added to the imputation model (often as “just another variable”) (Seaman et al., 2012). However, when the analytic model does not contain them, they might still be helpful in the imputation model. Which interactions or how many to include is less clear.
- Delete missing ys or not. When the dependent variable also has missing values, it is clear that it still must be included in the imputation model. Some researchers argue, however, that these cases, where the dependent variable has been imputed, should be deleted afterward and not be used in the analytic model (von Hippel, 2007). Others argue that this step is unnecessary, especially when strong predictors of the dependent variable are available (Sullivan et al., 2015). While some simulation results are available, no clear consensus is reached.
- Bootstrapping or not. Bootstrapping can generated standard errors and derived statistics, such as confidence intervals, by sampling repeatedly from the available data with replacement and is an alternative to (parametric) approaches (Bittmann, 2021; Efron & Tibshirani, 1994). Posterior estimates of model parameters can be obtained using sampling with replacement, which is called bootstrapping. Otherwise, most algorithms use a large-sample normal approximation of the posterior distribution. While bootstrapping can be beneficial when asymptotic normality of parameter estimates is not given, it is mostly unclear how influential this decision is. Note that this specification must be distinct from the fact that one can combine bootstrapping and imputation methods to generate confidence intervals for a statistic that has no analytic standard errors (Brand et al., 2019).
- Number of imputations. In general, the higher the number of imputations produced under MICE, the better the quality, as the influence of random Monte-Carlo error is decreasing (von Hippel, 2020). While in the past, even five imputations were seen as sufficient, increased computational power has made the usage of dozens or even hundreds of imputations feasible. While more is better, selecting a final number of imputations is not written in stone and only rules of thumb are available.
3. Empirical Analyses
3.1. Data
3.2. Strategy of Analysis
- Imputation algorithm (OLS regression, truncated regression (for variable wage only), predictive mean matching with 2, 6, 10, or 14 matches)
- Analytic or bootstrap standard errors in imputation models
- Adding higher-order terms and / or interaction terms
- Using up to three auxiliary variables
- Removing cases where the dependent variable has been imputed or not before the estimation of the analytic model
4. Results
5. Discussion and Conclusion
Funding
Data availability
Conflict of interest
Appendix A
| Missing wage | Missing age | Missing hours | Missing ttl_exp | |
| Low missingness | ||||
| Hours per week | 0.200*** | 0.178*** | 0.126*** | |
| Age | 0.0877* | 0.0249 | 0.112** | |
| Total work experience | 0.177*** | 0.183*** | 0.178*** | |
| Completed school years* | 0.166*** | 0.220*** | 0.109** | 0.165*** |
| Current work experience* | 0.168*** | 0.191*** | 0.147*** | 0.142*** |
| Wage (t-1)* | 0.171*** | 0.200*** | 0.177*** | 0.233*** |
| Wage | 0.200*** | 0.265*** | 0.181*** | |
| High missingness | ||||
| Hours per week | 0.243*** | 0.205*** | 0.229*** | |
| Age | 0.0481 | -0.00207 | 0.101** | |
| Total work experience | 0.227*** | 0.208*** | 0.195*** | |
| Completed school years | 0.170*** | 0.164*** | 0.221*** | 0.196*** |
| Current work experience | 0.234*** | 0.251*** | 0.215*** | 0.223*** |
| Wage (t-1) | 0.259*** | 0.217*** | 0.263*** | 0.163*** |
| Wage | 0.248*** | 0.298*** | 0.199*** | |
| Observations | 750 | 750 | 750 | 750 |
References
- Allison, P. (2002). Missing Data. Thousand Oaks, CA: Sage.
- Azen, R., & Budescu, D. V. (2003). The dominance analysis approach for comparing predictors in multiple regression. Psychological Methods, 8(2), 129–148. [CrossRef]
- Azur, M. J., Stuart, E. A., Frangakis, C., & Leaf, P. J. (2011). Multiple imputation by chained equations: What is it and how does it work?: Multiple imputation by chained equations. International Journal of Methods in Psychiatric Research, 20(1), 40–49. [CrossRef]
- Bittmann, F. (2021). Bootstrapping: An Integrated Approach with Python and Stata (1st ed.). De Gruyter. [CrossRef]
- Brand, J., Buuren, S., Cessie, S., & Hout, W. (2019). Combining multiple imputation and bootstrap in the analysis of cost-effectiveness trial data. Statistics in Medicine, 38(2), 210–220. [CrossRef]
- Budescu, D. V. (1993). Dominance analysis: A new approach to the problem of relative importance of predictors in multiple regression. Psychological Bulletin, 114(3), 542–551. [CrossRef]
- Efron, B., & Tibshirani, R. J. (1994). An introduction to the bootstrap. CRC press.
- Horton, N. J., & Kleinman, K. P. (2007). Much Ado About Nothing: A Comparison of Missing Data Methods and Software to Fit Incomplete Data Regression Models. The American Statistician, 61(1), 79–90. [CrossRef]
- Kim, J. K., Michael Brick, J., Fuller, W. A., & Kalton, G. (2006). On the bias of the multiple-imputation variance estimator in survey sampling. Journal of the Royal Statistical Society: Series B (Statistical Methodology), 68(3), 509–521. [CrossRef]
- Knol, M. J., Janssen, K. J. M., Donders, A. R. T., Egberts, A. C. G., Heerdink, E. R., Grobbee, D. E., Moons, K. G. M., & Geerlings, M. I. (2010). Unpredictable bias when using the missing indicator method or complete case analysis for missing confounder values: An empirical example. Journal of Clinical Epidemiology, 63(7), 728–736. [CrossRef]
- Landerman, L. R., Land, K. C., & Pieper, C. F. (1997). An Empirical Evaluation of the Predictive Mean Matching Method for Imputing Missing Values. Sociological Methods & Research, 26(1), 3–33. [CrossRef]
- Luchman, J. N. (2015). “DOMIN”: Module to conduct dominance analysis. Boston College Department of Economics. https://ideas.repec.org/c/boc/bocode/s457629.html.
- Rubin, D. B. (2004). Multiple imputation for nonresponse in surveys (Vol. 81). John Wiley & Sons.
- Schafer, J. L. (2003). Multiple Imputation in Multivariate Problems When the Imputation and Analysis Models Differ. Statistica Neerlandica, 57(1), 19–35. [CrossRef]
- Seaman, S. R., Bartlett, J. W., & White, I. R. (2012). Multiple imputation of missing covariates with non-linear effects and interactions: An evaluation of statistical methods. BMC Medical Research Methodology, 12(1), 46. [CrossRef]
- Sullivan, T. R., Salter, A. B., Ryan, P., & Lee, K. J. (2015). Bias and Precision of the “Multiple Imputation, Then Deletion” Method for Dealing With Missing Outcome Data. American Journal of Epidemiology, 182(6), 528–534. [CrossRef]
- van Buuren, S. (2018). Flexible imputation of missing data (Second edition). CRC Press, Taylor and Francis Group.
- von Hippel, P. T. (2007). 4. Regression with Missing Ys: An Improved Strategy for Analyzing Multiply Imputed Data. Sociological Methodology, 37(1), 83–117. [CrossRef]
- von Hippel, P. T. (2020). How Many Imputations Do You Need? A Two-stage Calculation Using a Quadratic Rule. Sociological Methods & Research, 49(3), 699–718. [CrossRef]
- White, I. R., Royston, P., & Wood, A. M. (2011). Multiple imputation using chained equations: Issues and guidance for practice. Statistics in Medicine, 30(4), 377–399. [CrossRef]
- Wulff, J. N., & Jeppesen, L. E. (2017). Multiple imputation by chained equations in praxis: Guidelines and review. Electronic Journal of Business Research Methods, 15(1), 41–56.


| Complete data | Low missingness | High missingness | |||||||
| N | Mean | SD | N | Mean | SD | N | Mean | SD | |
| Wage | 750 | 8.07 | 5.98 | 644 | 7.80 | 5.89 | 534 | 7.24 | 5.38 |
| Total work experience | 750 | 13.7 | 3.92 | 624 | 13.5 | 3.97 | 484 | 13.3 | 3.99 |
| Hours per week | 750 | 37.8 | 9.72 | 656 | 37.7 | 9.92 | 565 | 37.5 | 9.84 |
| Age | 750 | 39.2 | 3.11 | 627 | 39.1 | 3.14 | 545 | 39.1 | 3.09 |
| Wage (t-1)* | 750 | 6.34 | 3.14 | 750 | 6.34 | 3.14 | 750 | 6.34 | 3.14 |
| Current work experience* | 750 | 6.84 | 5.70 | 750 | 6.84 | 5.70 | 750 | 6.84 | 5.70 |
| Completed school years* | 750 | 12.9 | 2.41 | 750 | 12.9 | 2.41 | 750 | 12.9 | 2.41 |
| Complete data | Low missingness | High missingness | |
| Total work experience | 0.318*** | 0.251*** | 0.143* |
| (0.0558) | (0.0506) | (0.0556) | |
| Hours per week | 0.0467* | 0.0449* | 0.0288 |
| (0.0223) | (0.0203) | (0.0224) | |
| Age | -0.106 | -0.201** | 0.0570 |
| (0.0695) | (0.0650) | (0.0696) | |
| Constant | 6.106* | 9.571*** | 0.666 |
| (2.861) | (2.704) | (2.944) | |
| Observations | 750 | 428 | 241 |
| R2 | 0.054 | 0.092 | 0.037 |
| Low missingness | High missingness | |||||||
| mean | sd | p5 | p95 | mean | sd | p5 | p95 | |
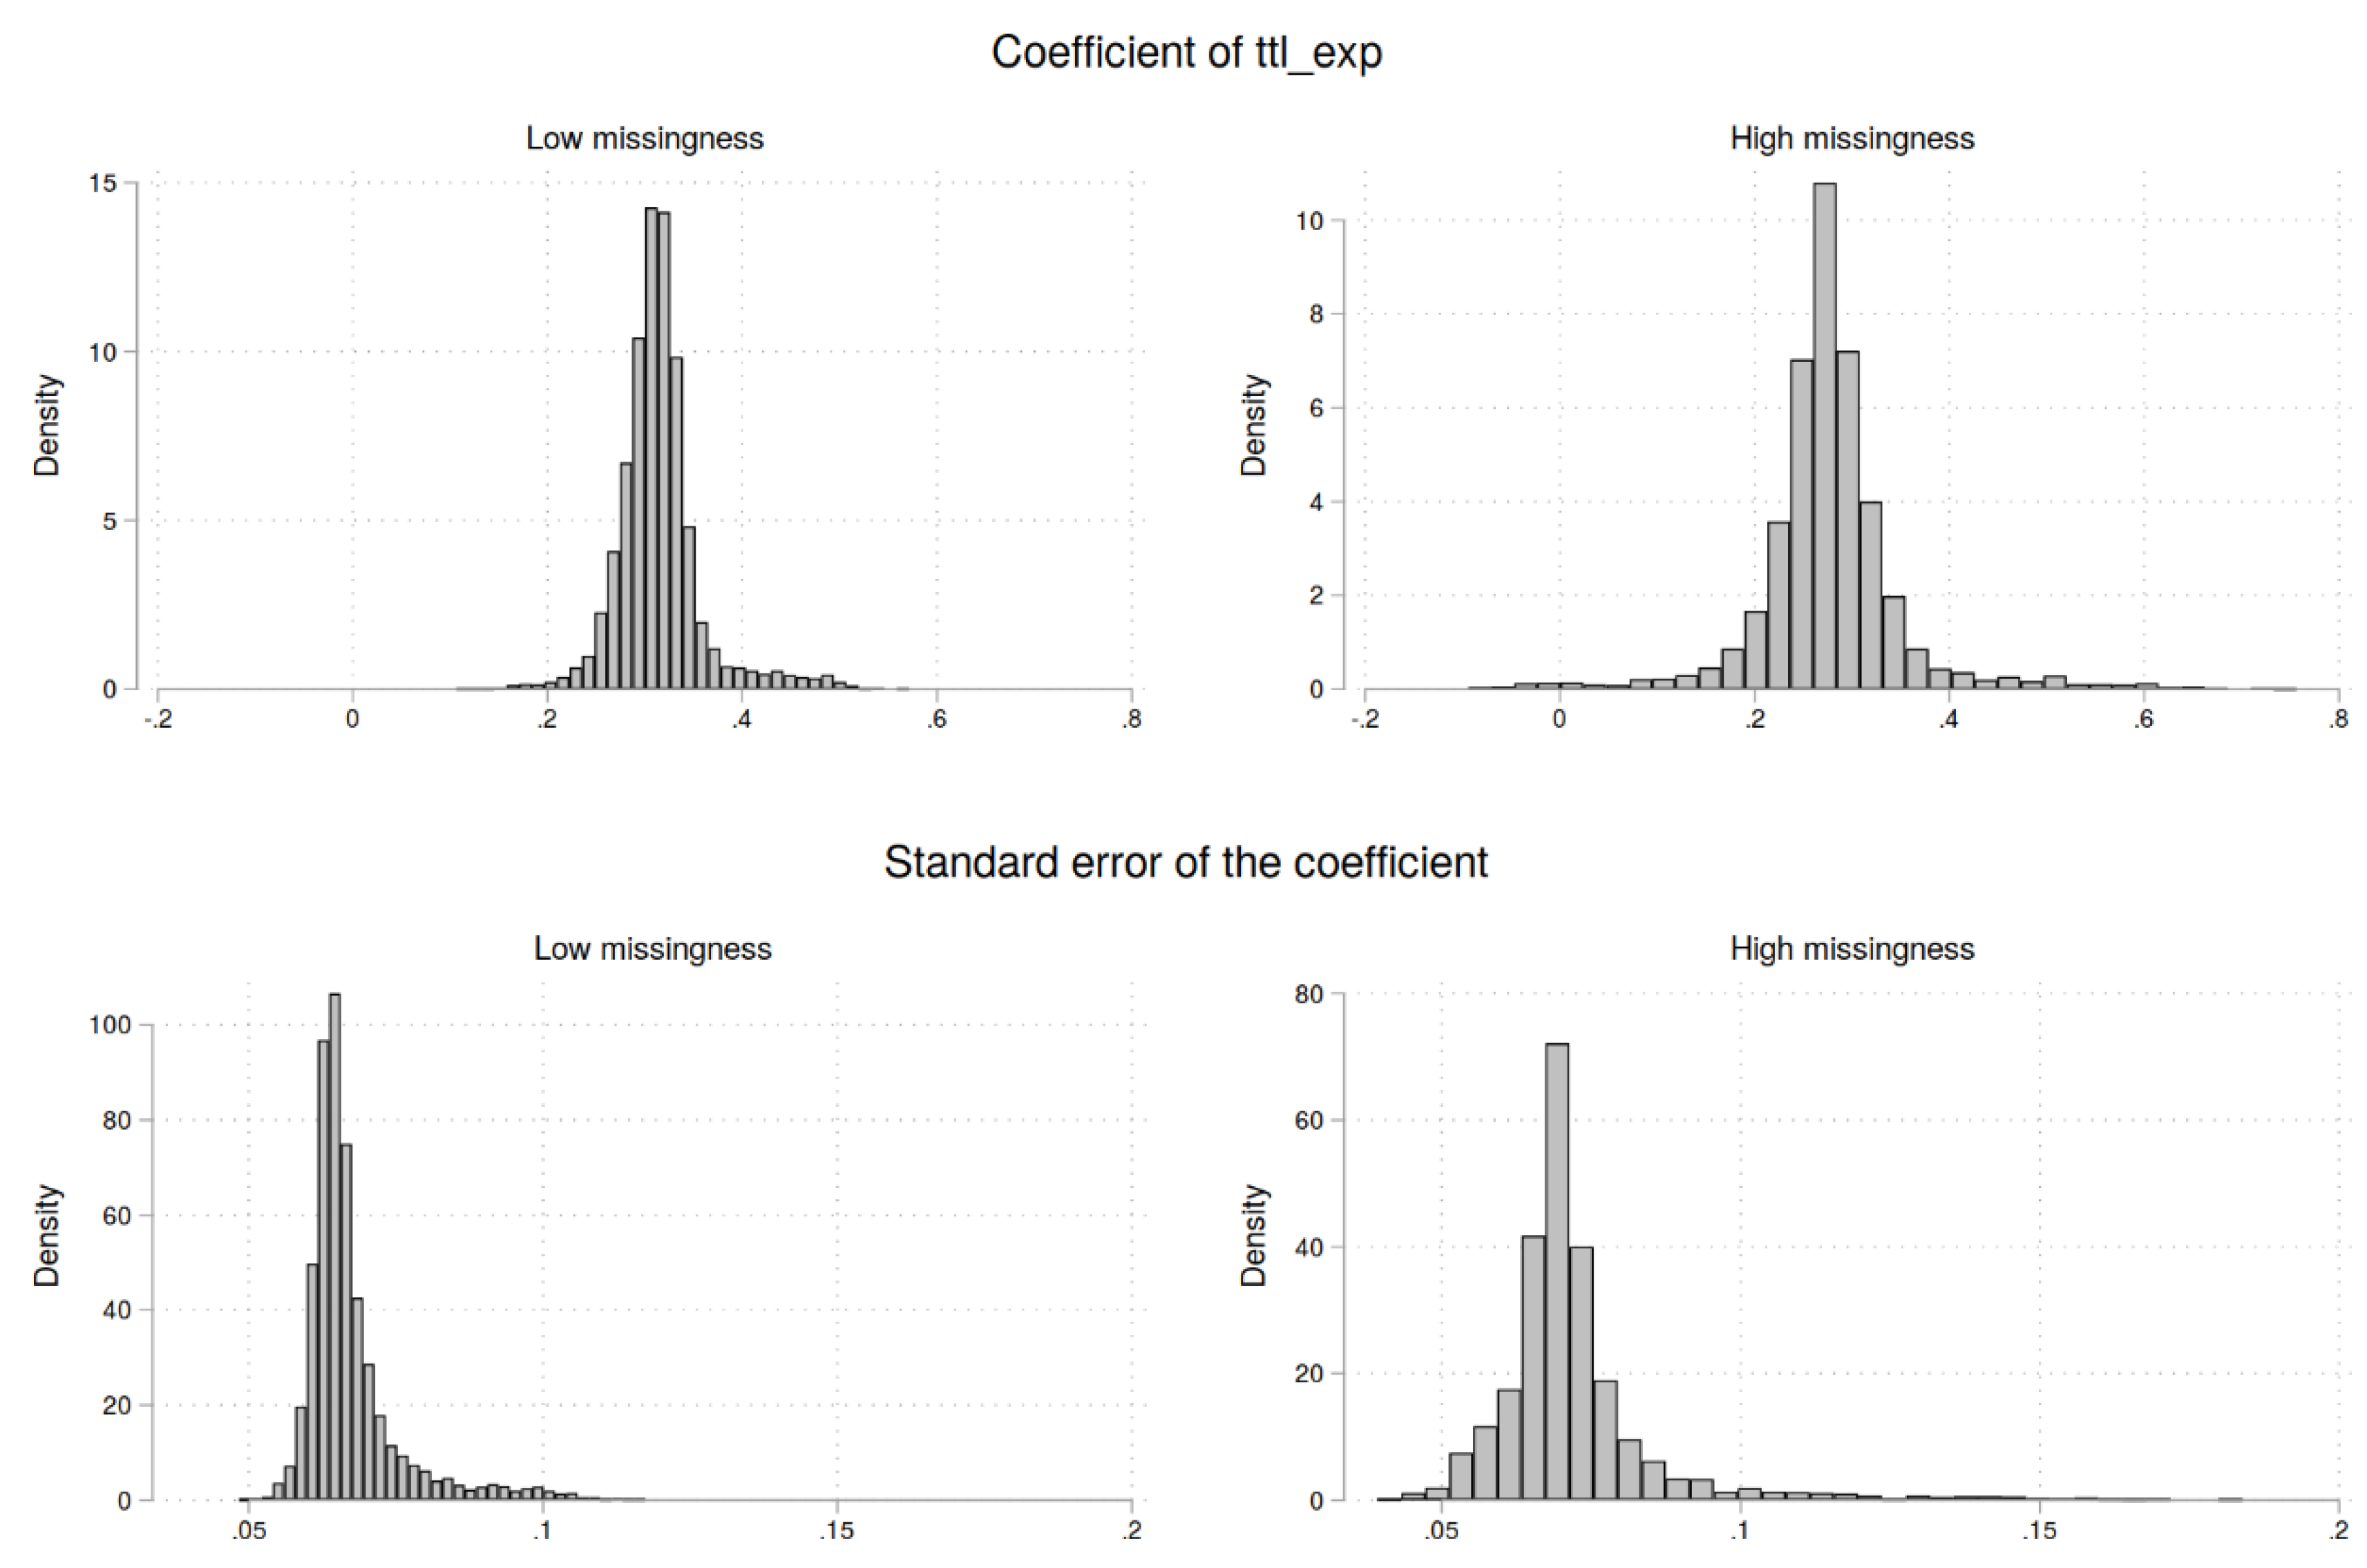
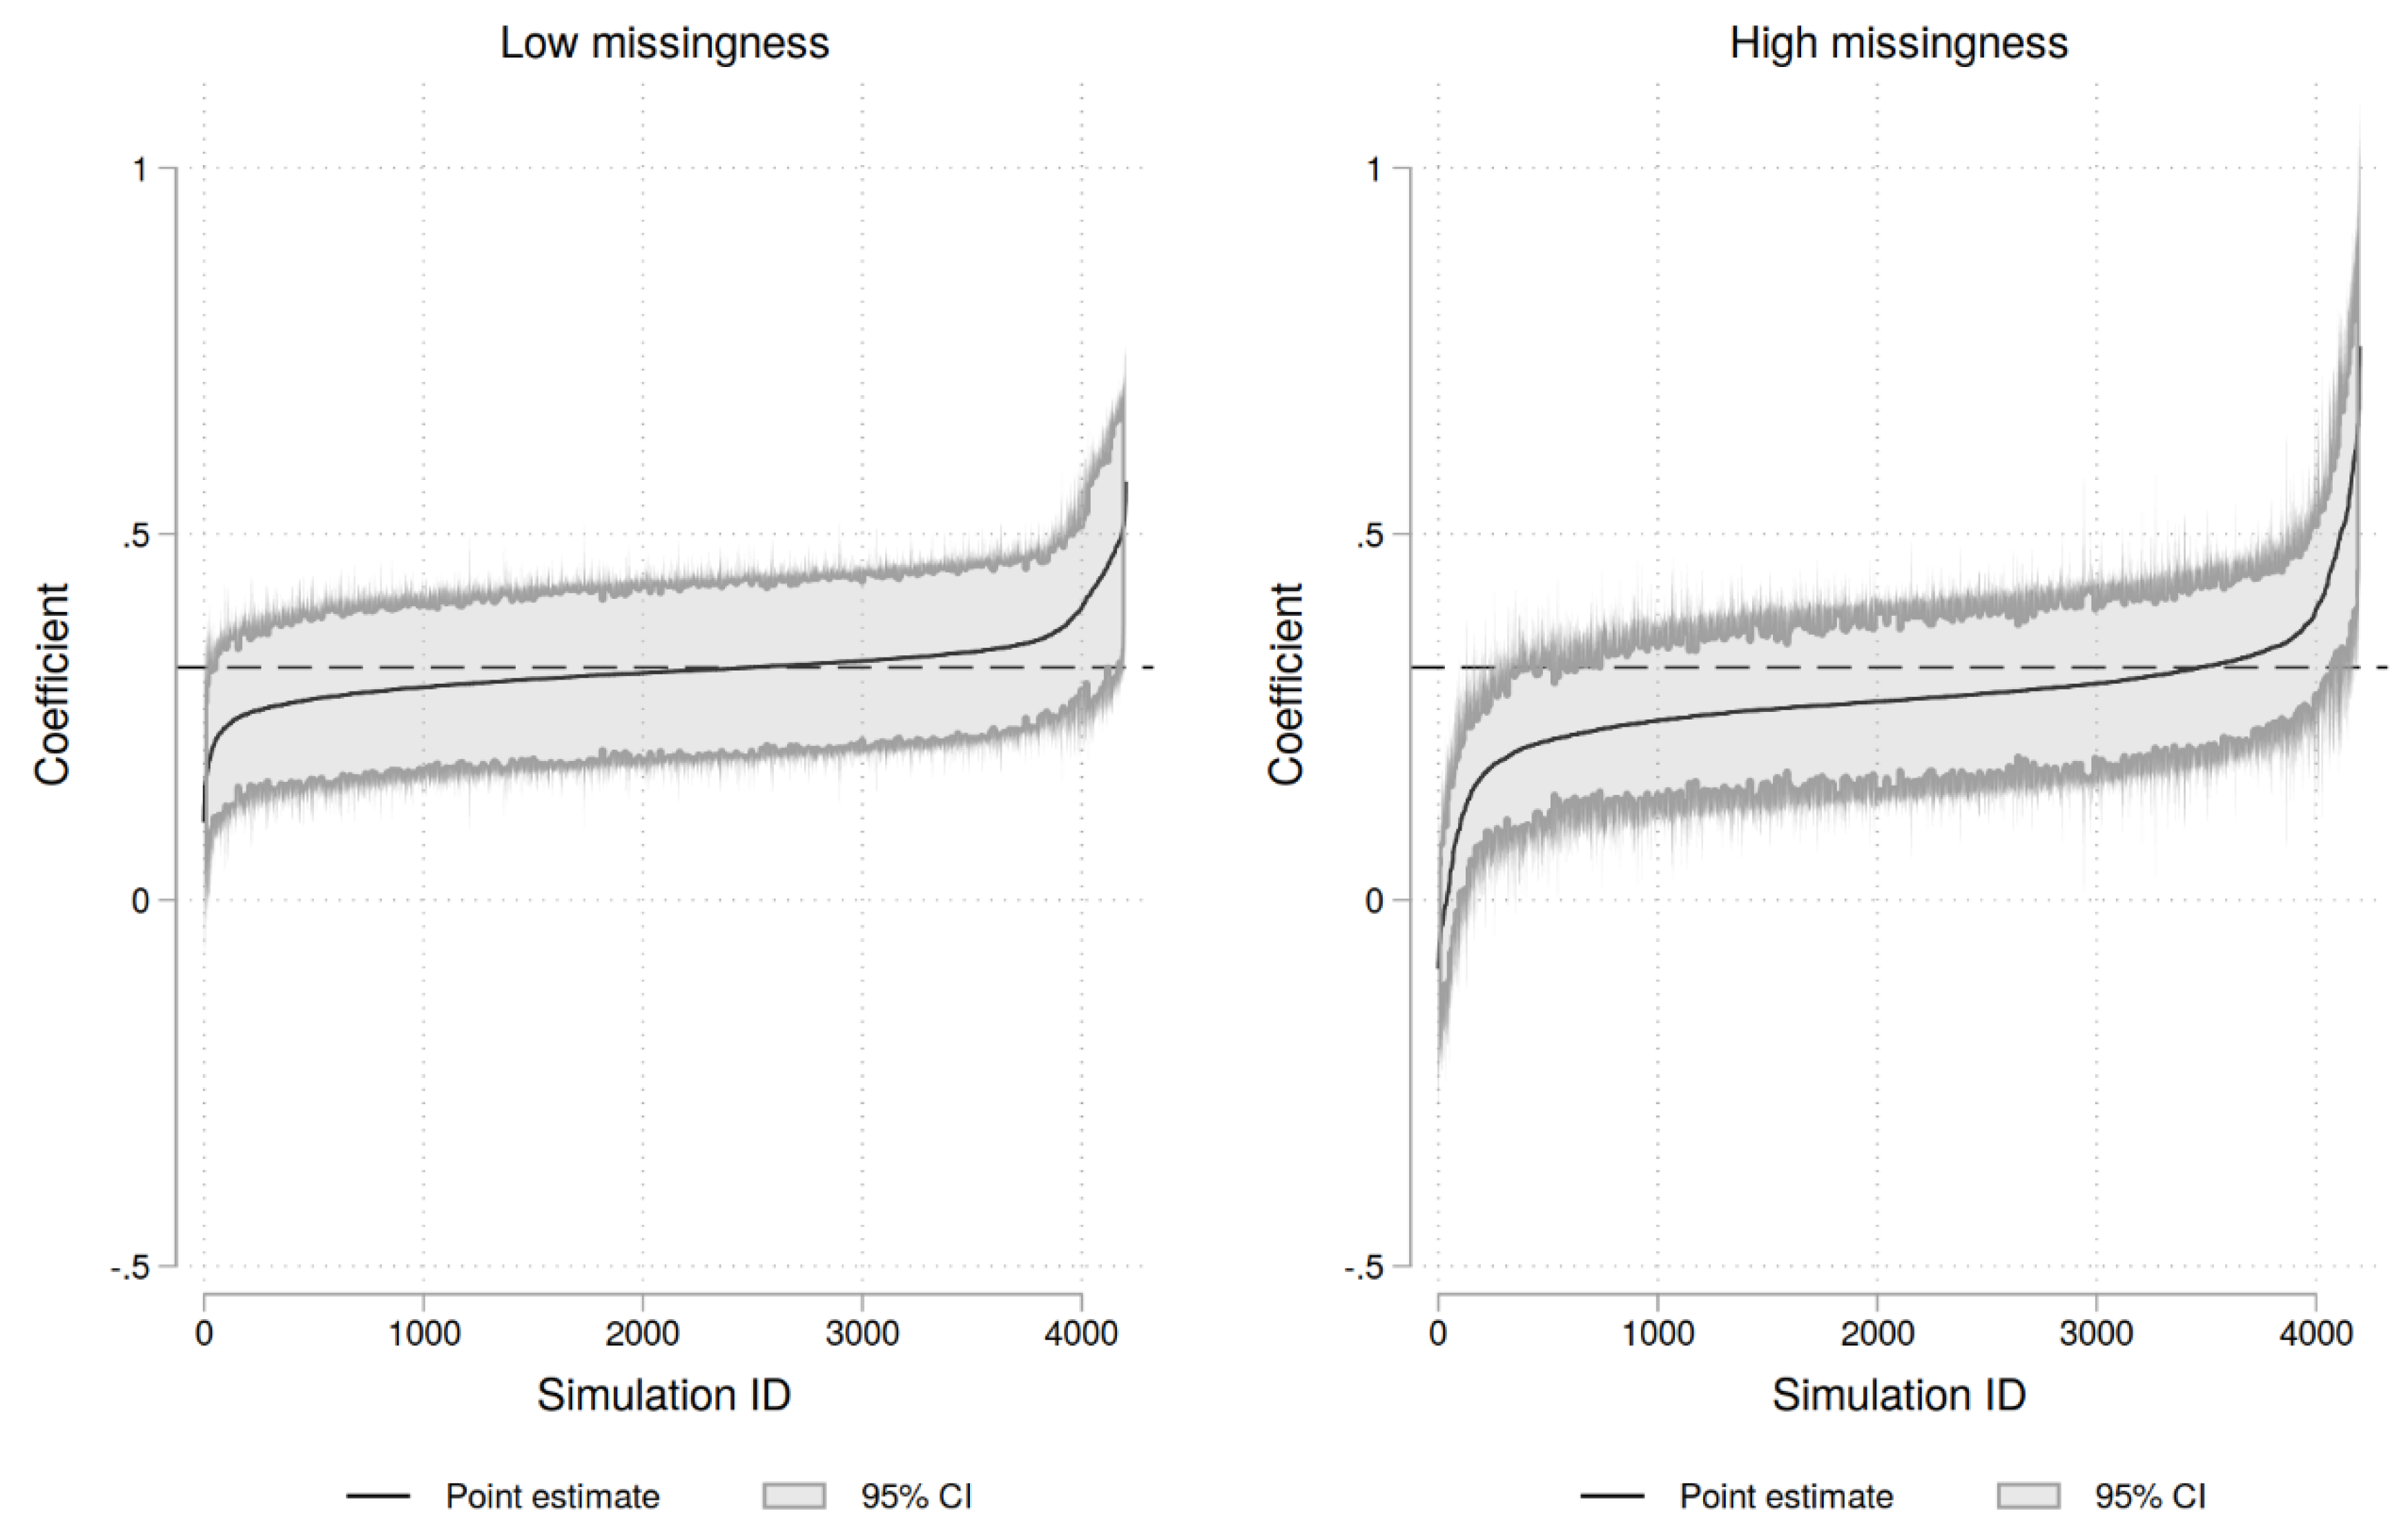
| Coef. ttl_exp | 0.31 | 0.044 | 0.26 | 0.39 | 0.28 | 0.078 | 0.17 | 0.39 |
| SE of ttl_exp | 0.067 | 0.0085 | 0.060 | 0.086 | 0.072 | 0.015 | 0.056 | 0.099 |
| Better than listwise deletion | 0.90 | 0.30 | 0 | 1 | 0.94 | 0.23 | 0 | 1 |
| Bootstrap wage | 0.51 | 0.50 | 0 | 1 | 0.50 | 0.50 | 0 | 1 |
| Bootstrap hours | 0.49 | 0.50 | 0 | 1 | 0.49 | 0.50 | 0 | 1 |
| Bootstrap age | 0.50 | 0.50 | 0 | 1 | 0.51 | 0.50 | 0 | 1 |
| Bootstrap ttl_exp | 0.50 | 0.50 | 0 | 1 | 0.49 | 0.50 | 0 | 1 |
| Auxil. tenure | 0.50 | 0.50 | 0 | 1 | 0.50 | 0.50 | 0 | 1 |
| Auxil. education | 0.52 | 0.50 | 0 | 1 | 0.52 | 0.50 | 0 | 1 |
| Auxil. wage (t-1) | 0.52 | 0.50 | 0 | 1 | 0.52 | 0.50 | 0 | 1 |
| Number of higher-order terms | 1.43 | 0.85 | 0 | 3 | 1.42 | 0.84 | 0 | 3 |
| Number of interactions | 1.58 | 0.95 | 0 | 3 | 1.60 | 0.93 | 0 | 3 |
| Drop missing ys before estimation | 0.49 | 0.50 | 0 | 1 | 0.52 | 0.50 | 0 | 1 |
| Observations | 4200 | 4200 | ||||||
| Low missingness | High missingness | |||||||
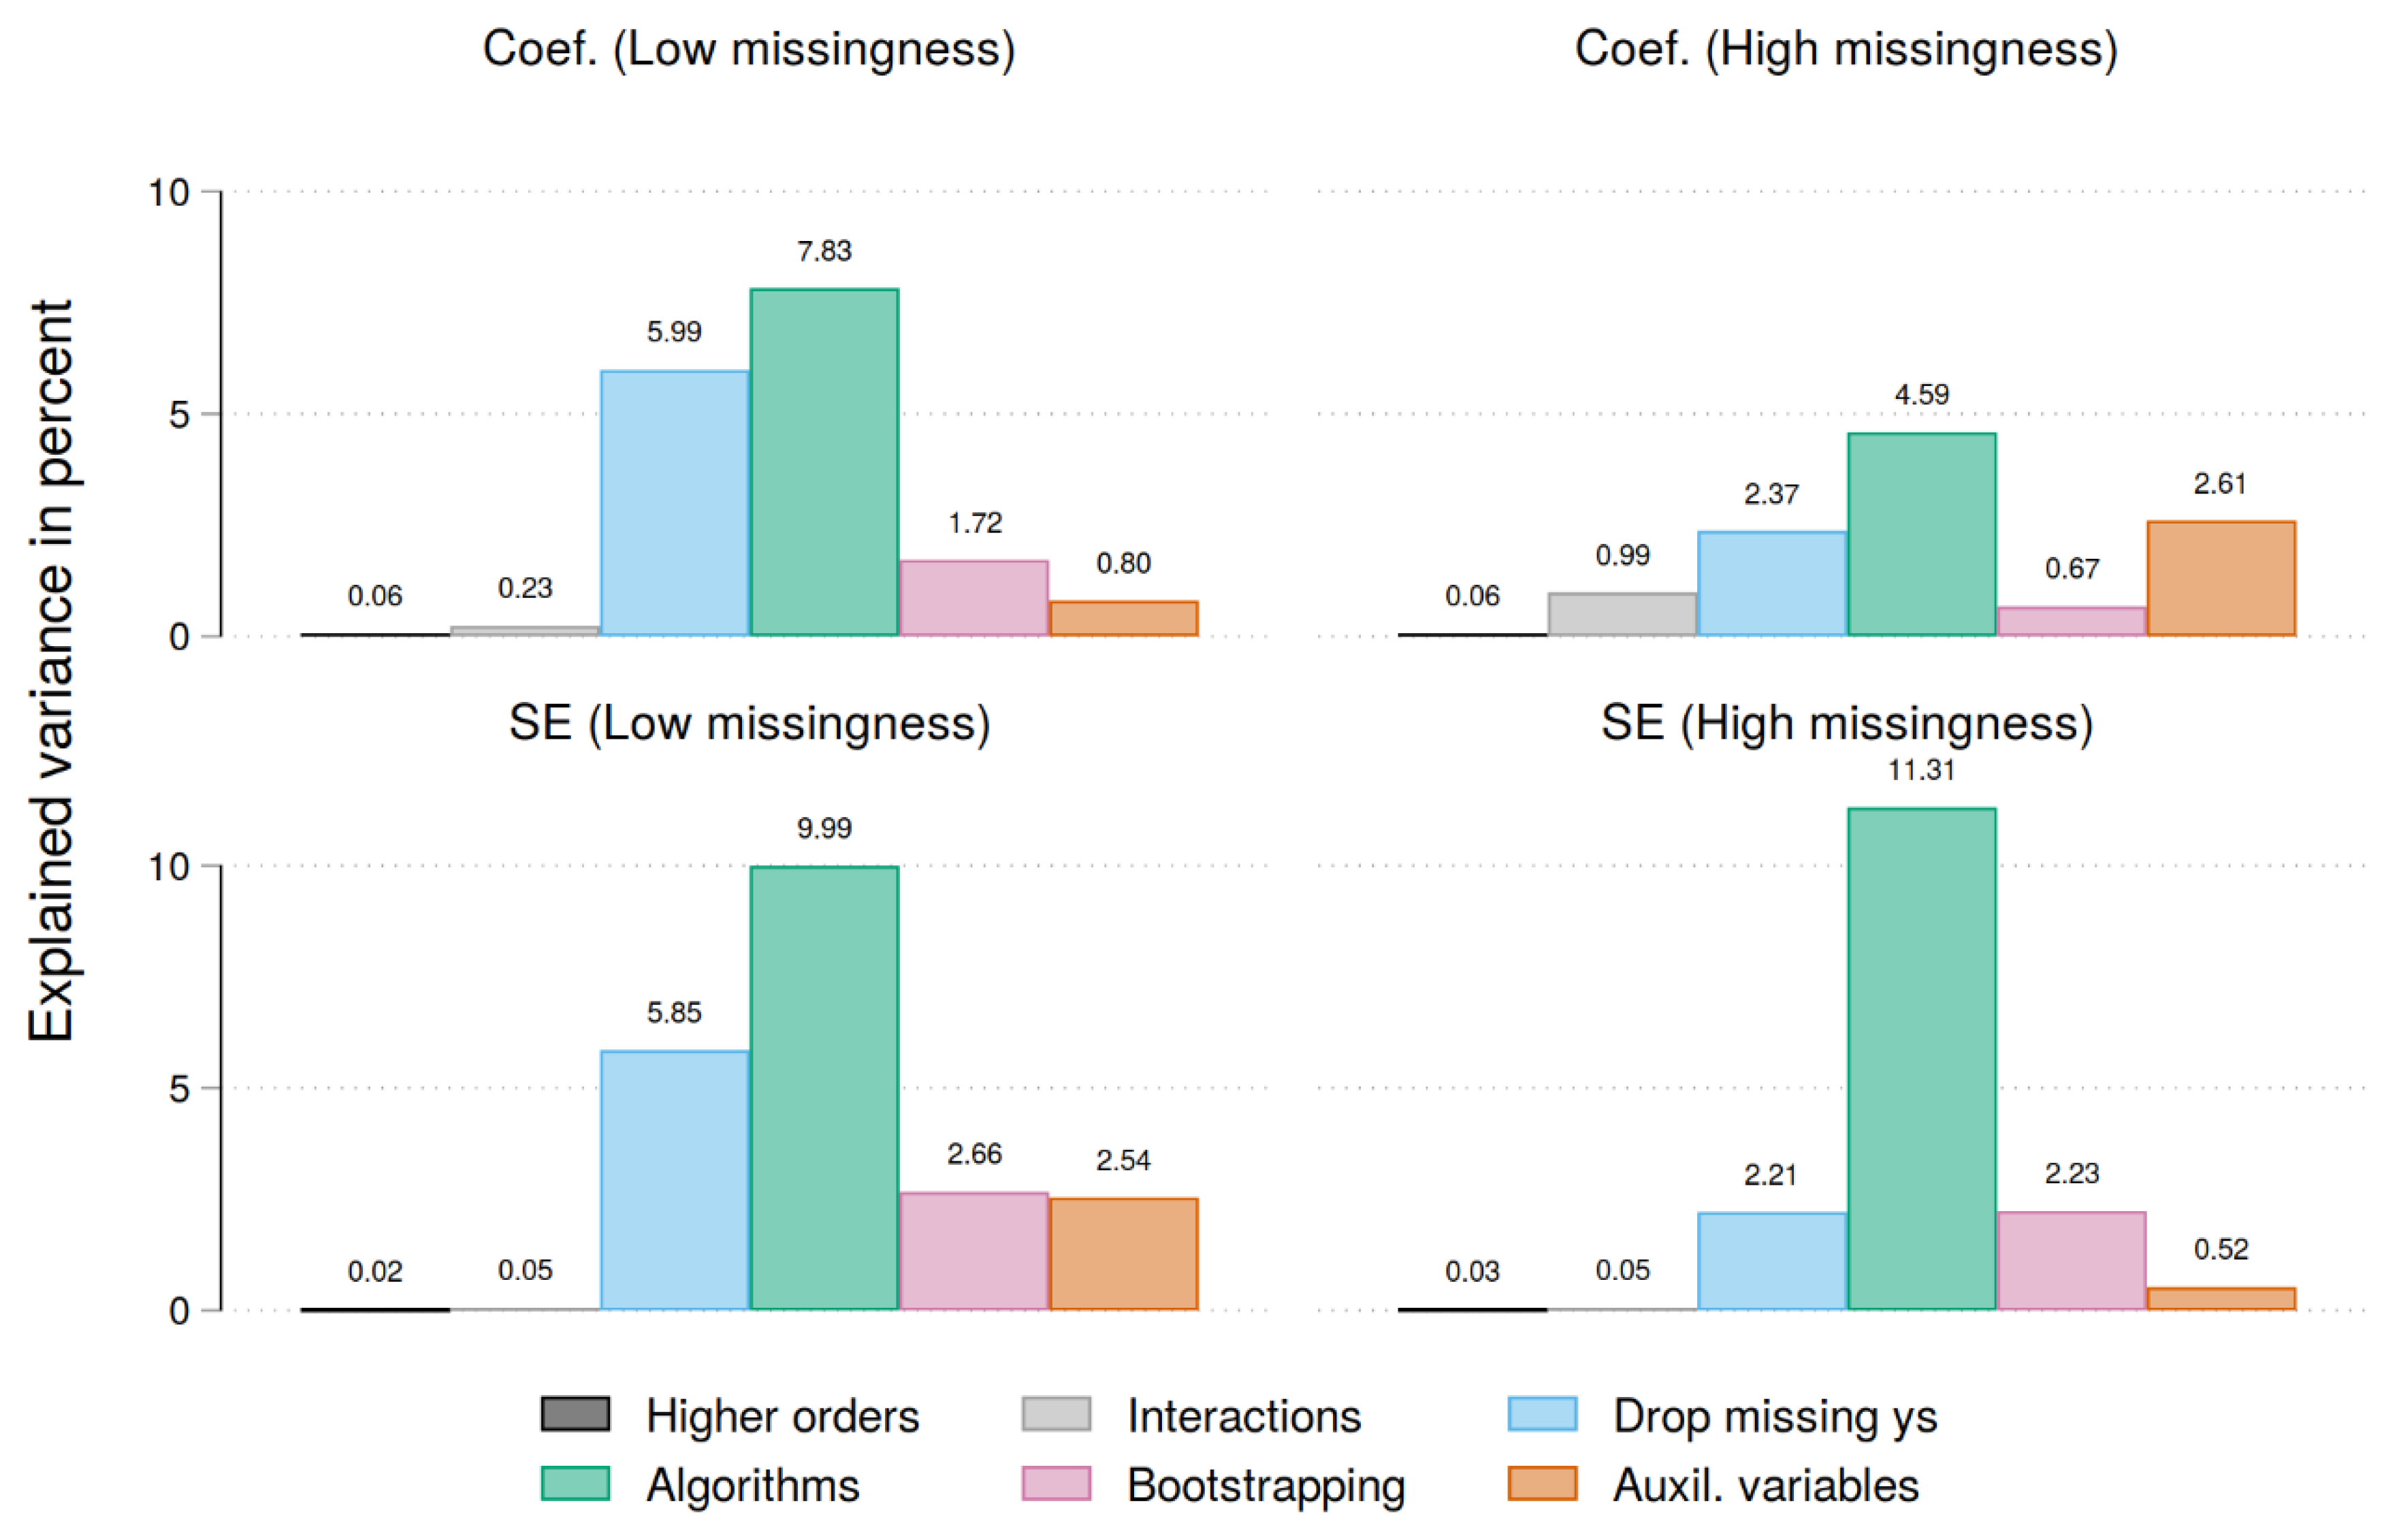
| Abs. diff. to unbiased coef. | Abs. diff. to unbiased SE | Abs. diff. to unbiased coef. | Abs. diff. to unbiased SE | |||||
| Bootstrap wage | 0.132*** | (0.001) | 0.163*** | (0.000) | 0.079*** | (0.002) | 0.149*** | (0.000) |
| Bootstrap hours | -0.005 | (0.001) | 0.013 | (0.000) | -0.025 | (0.002) | -0.015 | (0.000) |
| Bootstrap age | -0.002 | (0.001) | 0.011 | (0.000) | 0.002 | (0.002) | -0.021 | (0.000) |
| Bootstrap experience | -0.004 | (0.001) | 0.021 | (0.000) | -0.005 | (0.002) | 0.020 | (0.000) |
| Auxil. tenure | -0.021 | (0.001) | -0.108*** | (0.000) | 0.069*** | (0.002) | -0.035* | (0.000) |
| Auxil. education | -0.001 | (0.001) | 0.009 | (0.000) | -0.017 | (0.002) | -0.010 | (0.000) |
| Auxil. wage (t-1) | -0.087*** | (0.001) | -0.099*** | (0.000) | -0.175*** | (0.002) | -0.060*** | (0.000) |
| Number of higher order terms | 0.037* | (0.001) | -0.005 | (0.000) | 0.031 | (0.001) | 0.007 | (0.000) |
| Number of interactions | 0.053*** | (0.001) | 0.013 | (0.000) | 0.107*** | (0.001) | 0.013 | (0.000) |
| Drop missing ys | -0.247*** | (0.001) | -0.242*** | (0.000) | -0.160*** | (0.002) | -0.154*** | (0.000) |
| Algorithm (wage) | ||||||||
| OLS reg. | Ref. | Ref. | Ref. | Ref. | ||||
| PMM (2) | -0.000 | (0.002) | 0.003 | (0.000) | 0.008 | (0.003) | 0.033* | (0.001) |
| PMM (6) | -0.005 | (0.002) | -0.002 | (0.000) | -0.015 | (0.003) | -0.016 | (0.001) |
| PMM (10) | 0.005 | (0.002) | -0.015 | (0.000) | 0.008 | (0.003) | -0.029 | (0.001) |
| PMM (14) | -0.016 | (0.002) | -0.051*** | (0.000) | 0.007 | (0.003) | -0.074*** | (0.001) |
| Algorithm (hours) | ||||||||
| OLS reg. | Ref. | Ref. | Ref. | Ref. | ||||
| Trunc. reg. | 0.270*** | (0.001) | 0.296*** | (0.000) | 0.176*** | (0.002) | 0.308*** | (0.001) |
| PMM (2) | -0.036* | (0.002) | -0.015 | (0.000) | -0.006 | (0.003) | 0.023 | (0.001) |
| PMM (6) | -0.024 | (0.001) | -0.015 | (0.000) | 0.000 | (0.003) | 0.000 | (0.001) |
| PMM (10) | -0.003 | (0.001) | -0.012 | (0.000) | -0.009 | (0.003) | 0.024 | (0.001) |
| PMM (14) | 0.003 | (0.001) | 0.011 | (0.000) | -0.022 | (0.003) | 0.009 | (0.001) |
| Algorithm (ttl_exp) | ||||||||
| OLS reg. | Ref. | Ref. | Ref. | Ref. | ||||
| PMM (2) | -0.026 | (0.002) | -0.029* | (0.000) | -0.074*** | (0.003) | -0.026 | (0.001) |
| PMM (6) | -0.018 | (0.002) | -0.017 | (0.000) | -0.108*** | (0.003) | -0.062*** | (0.001) |
| PMM (10) | -0.032* | (0.001) | -0.041** | (0.000) | -0.064*** | (0.003) | -0.041** | (0.001) |
| PMM (14) | -0.034* | (0.001) | -0.031* | (0.000) | -0.085*** | (0.003) | -0.035* | (0.001) |
| Algorithm (age) | ||||||||
| OLS reg. | Ref. | Ref. | Ref. | Ref. | ||||
| PMM (2) | -0.011 | (0.001) | -0.027 | (0.000) | -0.010 | (0.003) | -0.005 | (0.001) |
| PMM (6) | 0.015 | (0.001) | 0.015 | (0.000) | -0.013 | (0.003) | -0.004 | (0.001) |
| PMM (10) | 0.013 | (0.001) | 0.026 | (0.000) | 0.016 | (0.003) | 0.021 | (0.001) |
| PMM (14) | 0.035* | (0.002) | 0.011 | (0.000) | -0.011 | (0.003) | 0.003 | (0.001) |
| Observations | 4200 | 4200 | 4200 | 4200 | ||||
| R2 | 0.166 | 0.211 | 0.113 | 0.164 | ||||
| Adjusted R2 | 0.161 | 0.206 | 0.107 | 0.158 | ||||
Disclaimer/Publisher’s Note: The statements, opinions and data contained in all publications are solely those of the individual author(s) and contributor(s) and not of MDPI and/or the editor(s). MDPI and/or the editor(s) disclaim responsibility for any injury to people or property resulting from any ideas, methods, instructions or products referred to in the content. |
© 2024 by the authors. Licensee MDPI, Basel, Switzerland. This article is an open access article distributed under the terms and conditions of the Creative Commons Attribution (CC BY) license (http://creativecommons.org/licenses/by/4.0/).


