Submitted:
14 June 2024
Posted:
17 June 2024
You are already at the latest version
Abstract
We analyzed the interaction of two acceptor materials, reduced graphene oxide (RGO) and [6,6]-phenyl-C6-butyric acid methyl ester (PCBM), and poly(3-hexylthiphene) (P3HT), as well as the dependence of its photophysical properties with the temperature in the range 90 to 300 K. The nanocomposite of the films was analyzed by optical absorption ultraviolet-visible (UV-Vis) and photoluminescence (PL) and emission ellipsometry (EE) in a function of sample temperature. The surface morphology was studied by atomic force microscopy (AFM). We noted that onset levels (Eonset) of the nanocomposite of P3HT and RGO is smaller than the others. The PL spectra showed the presence of anomalies in the emission intensities in the nanocomposite of P3HT and PCBM. It was also possible to determine the electron-phonon coupling by calculating the Huang-Hys parameters and its dependence with the sample’s temperature. Through EE it was possible to analyze the degree of polarization and the anisotropy. We observed a high degree of polarized emission of the P3HT films which varies subtly according to the temperature. For nanocomposites with RGO the polarization degree in the emission decreases and the roughness on the surface increases. As a result, the RGO improves the energy transfer between adjacent polymer chains at the cost of greater surface roughness. Then, the greater energy transfer may favor applications of this type nanocomposite in OPVC's with enhancement in energy conversion efficiency.
Keywords:
poly(3-hexilthiophene)
; PCBM
; energy transfer
; photoluminescence
; reduced graphene oxide
1. Introduction
In the last decades, the study of the polymeric interface has proved to be increasingly important for the development of organic optoelectronic devices [1,2,3,4,5,6,7], especially the donor-acceptor (D/A) interface. The D/A interface is necessary for the carriers to interpenetrate in the hetero-junction and increase the probability of charge separation, i.e., facilitating the formation of excitons and improving the charge transfer between the electron transport layer (ETL) hole transport layer (HTL) in the device [7], which currently led to a 15% PCE in an organic photovoltaic cell [8]. In this context, two semiconductors, commonly used as D/A materials, respectively, poly (3-hexylthiophene) (P3HT) and [6,6]-phenyl-C6-butyric acid methyl ester (PCBM), perform well as an active layer in photovoltaic devices. However, they have some problems such as poor electronic correlation and morphological instabilities [1]. To attempt to solve this apparent problem, many solutions are suggested, such as chemical modifications in one of the species, as well as the complete replacement of the donor or acceptor [1,2,7].
The replacement of PCBM by 2D materials has been constantly suggested in the literature [1,2,9,10], mainly due to the great difficulty of synthesizing side groups in fullerene, precursor of PCBM [1,2,9,11]. Graphene, a carbon-based 2D material, is a promising material to be used in photovoltaic devices with potential to increase the efficiency of the photo-conversion [2]. Among all graphitic materials, graphene has the largest conjugated basal plane and is the most favorable binding to the various conjugated polymers found in photovoltaic cells. Graphene is flexible, exhibits high charge mobility (20 000 cm2 V-1 s-1) and good conductivity (~108 S m-2) [12]. Its semi-metallic character makes graphene a potential candidate to be an excellent extractor or charge carrier, in other words, Graphene can be used with ETL or HTL [2,12]. However, it is necessary to modify its work function and Eonset, which can be done through doping or chemical functionalization, allowing HOMO-LUMO to coincide with the active layer. The most common procedure employed in laboratories to obtain graphene is, in fact, the method to produce reduced graphene oxide (RGO), a graphene derivative. This method is cheap and easily produced on a large scale [13]. It starts with the synthesis of graphene oxide (GO) by the Hummers method [14] based on the oxidation of graphite in an acidic media. Subsequently, the graphene oxide can be reduced into RGO, in which the most common treatments used are the hydrazine reduction and thermal annealing [13].
In summary, the interface effects in the operating of the device operation are the cause of a large loss of the photo-excited carriers and it can be investigated through conventional spectroscopy techniques [7,15,16]. Whereas the energy transfer processes depend on a series of photophysical processes it is, in general, necessary to correlate different experimental techniques to be fully clarified. Specifically, for studies involving energy transfer, the Emission Ellipsometry (EE) [17] using Stokes Parameter Spectroscopy (SPS) [18] is a powerful technique that allows to fully describe the polarization state of the light emitted with the aid of Stokes Theory [19]. Thus, it is possible to apply EE to study energy transfer from photo-excited carriers in polymeric and conjugated materials [18,19,20,21]. Furthermore, as EE describes all analyzed light polarization states, it is possible to obtain complete information on molecular ordering, [19] anisotropy factor [22] and, asymmetry factor [23].
In this way, the aim of this work was to study the photophysical properties of the interfaces in nanocomposite films of P3HT:PCBM, P3HT:PCBM:RGO and P3HT:RGO. Our work highlights that the RGO has a role to improve the transfer of energy over the PCBM, in the interface with the P3HT. In addition, it was observed that PCBM can function as a potential barrier between P3HT adjacent chains, which makes energy transfer difficult, causing carriers to recombine in the same chains that were photo-excited, corroborating the low electronic correlation of the interface P3HT:PCBM. On the other hand, this result can strengthen the role of PCBM as a good load separator.
2. Materials and Methods
Figure 1 presents the chemical structure of all materials used. The samples were prepared by spin-coating using a spin-coater Laurell model WS-650MZ-23NPPB6. First a layer of poly(3,4-ethylenedioxythiophene) polystyrene sulfonate (PEDOT:PSS) as HTL was deposited onto the indium tin oxide (ITO) substrate. ITO substrates were soaked in a piranha solution (five parts of concentrated H2SO4 and two parts of H2O2 (30%)) for 10 minutes, and then rinsed, first in water, then in isopropanol and dried under N2 flow. The PEDOT:PSS dispersed in water in the concentration of 0.5-1 wt.% was bought from Sigma-Aldrich (cas: 155090-83-8).
The active layer P3HT was deposited on top of HTL PEDO:PSS, together with an electron- or acceptor-carrying material, thus forming a nanocomposite. The P3HT regioregular conductive polymer and PCBM were purchased from Sigma-Aldrich with ≥90% and >99.5% of purity, respectively. RGO was also used with the PCBM or replacing the PCBM. The RGO was obtained from the reduction of graphene oxide (GO), obtained by the method of Hummers and modified Offeman [14]. An aliquot of the aqueous GO dispersion was diluted in ethanol (2.8 mg ml-1) containing tetrabutylammonium hydroxide to aid dispersion, and then hydrazine hydrate was added (N2H4·H2O 80% v/v in H2O, Merck). The 24 hours of chemical reaction followed the procedure already described in the literature [24]. Then, the active layer P3HT:RGO is also the electron transport layer (ETL). We prepared the following composites: (i) P3HT:PCBM, (ii) P3HT:PCBM:RGO and, (iii) P3HT:RGO. Therefore, it was possible to obtain the following sets of samples that consisted of ITO/PEDOT:PSS/ETL shown schematically in Figure 2. The regioregular P3HT 1 molar and PCBM 0.1 molar were prepared in chlorobenzene and RGO of 0.1 molar in water. Likewise, PEDOT:PSS and RGO were also prepared at the same concentration of 1 molar in water for each composite. For the formation of ETL, 35 μL was deposited on ITO/HTL and rotated at 1000 rpm during 90 seconds and after the formation of the thin film, it was heated to 100° C during 5 minutes in environmental conditions. HTL was deposited by spin-coating at 2000 rpm during 60 seconds using 200 μL of the precursor solution and, after deposition, the PEDOT: PSS thin film was heated in a muffle at 100 °C for 30 minutes in environmental conditions.
The measures of optical absorption at ultraviolet-visible (UV-Vis) were obtained at room temperature in an Agilent Cary 60 Absorption Spectrophotometer, operating in the 215-2500 nm range. Photoluminescence measurements (PL) were obtained for different sample temperatures, from 90 to 300 K, using a cryostat coupled to a closed helium system reaching pressures in the order of 10-6 Torr. As a source of excitation, a diode laser (LaserLine iZi 405) at 405 nm (3.06 eV) and 30 mW of power was used, then the luminescence of the polymer was captured by the CCD spectrophotometer USB2000 from Ocean Optics. For the emission ellipsometry (EE) spectroscopy technique, the optical path traveled is the same as that of PL, but with the addition of an analyzer polarizer and a quarter-wave-plate, both achromatic. More details on the EE technique can be found in reference [20]. The morphology of the films was studied with AFM, in the tapping mode, using a Nanosurf FlexAFM 5 microscope. A commercial Si cantilever was used, which had spring constant between 20 and 100 Nm-1 and free oscillation interval between 250 and 300 Hz.
3. Results and Discussion
Figure 3 shows the optical absorption spectra UV-Vis for all analyzed samples, it is possible to observe that the maximum absorption of all the samples is centered around 525 nm. Through the absorption spectra it is possible to obtain the onset levels (Eonset) in a similar way to the Kubelka-Munk [25], which it establishes a value of the cutting wavelength (λc) that corresponds to the length wave at the end of the absorption spectrum [26]. Figure S1 shows how the λc was obtained for all samples, which coincides with the maximum emission in the PL spectra (see below in PL experiment) [27]. Table 1 shows their respective Eonset values. The value of Eonset can be explained to the P3HT in terms of: (i) the conjugation length of the polymeric chains, the shorter the length of the conjugated polymeric segment, the greater the value of Eonset [21] and (ii) the feature regioregular of the polymeric main chain, that is, Eonset increase if the regioregularity decrease of the polymeric chains [28,29]. The data obtained for Eonset are in accordance with the literature [18,30] and in concordance of Kinoshita et al. where the characteristic absorption range for the regioregular P3HT is 415 to 650 nm [29].
The values in Table 1 show Eonset of P3HT decreases in the presence of reduced graphene oxide (RGO). This is due to the high electron transfer ratio of RGO, with non-hybridized states originating π orbitals outside the plane, providing greater electronic mobility. This characteristic is essential for applications in photovoltaic devices. [12]. Still, according to Figure 3, it is possible to observe that the three samples have wide spectra that cover a good part of the visible light and that they had a maximum absorption in an approximate wavelength of 525 nm, being consistent with the literature [5]. AFM images were obtained to investigate the morphology of the films. Figure 4 shows the results of AFM analysis for the samples PEDOT/P3HT:PCBM, PEDOT/P3HT:PCBM:RGO and PEDOT/P3HT:RGO. The mean square roughness values (σRMS), increase as the PCBM is replaced by the RGO, corroborating for a strong change in the electronic properties of the nanocomposite films studied here.
The PEDOT/P3HT:PCBM sample presents a very smooth surface, with a mean roughness <1 nm (Figure 4a and e). The height distribution along the sample is also the lower for this sample, presenting a very narrow distribution centered around 5 nm, but it is possible to see points with much higher heights in the measured region of the sample. When we look at the samples modified with RGO, it is clear that there is an increase in the roughness of the films for sample PEDOT/P3HT:PCBM:RGO (Figure 4b and e) and even more for sample PEDOT/P3HT:RGO (Figure 4c and e). The height distribution for these two samples are shifted to higher heights. Sample PEDOT/P3HT:PCBM:RGO presents a narrow distribution centered around 9 nm whereas the height distribution of sample PEDOT/P3HT:RGO presents a very broad profile and is centered at ~25 nm. Skewness and kurtosis are two important statistical parameters to describe a surface, and the former has a value of 0 (symmetrical height distribution) and the latter of 3 (moderate sharpness) for the surface heights under a Gaussian distribution. A positive skewness means the surface has high peaks and filled valleys, while a negative one means that it has deep scratches (grooves) and lack of peaks. A kurtosis larger than 3 means the surface has high peaks and/or low valleys, while smaller than 3 means that it has low peaks and/or valleys.
The results of the photoluminescence spectra in Figure 5 and Figure 6 were organized by intensity to analyze how the nanocomposite influence the amount of light emitted and normalized to distinguish the regions of emission of each film. According to Janssen et al., the presence of PCBM causes a fluorescence suppression effect in P3HT films, that is, the emission is extinguished by means of light and for this reason the transfer of energy and charge is favored [31].
Figure 5a shows the PL spectra obtained for the sample PEDOT:PSS/P3HT:PCBM at different temperatures, ranging from 90 K to 300 K. The spectra show that the maximum emission intensities vary with the sample temperature, exhibiting a blue shift as the temperature increases, with an 11 nm difference between 90 K and 300 K. The PL spectra of the PEDOT:PSS/P3HT:PCBM sample (Figure 5b) sample (Figure 5b) exhibit similar behavior, with intensity increasing and then decreasing as the temperature ranges from 90 K to 300 K. This introduces an unexpected anomaly in the PL dependence on sample temperature. [31]. For PL spectra of the sample consisting of PEDOT/P3HT:RGO (Figure 5c), unlike the other two samples, the emission intensity gradually decreases with increasing temperature. This is due to the chains becoming stiffer as the temperature decreases, reducing energy transfer by non-radiative modes. Conversely, as the temperature increases, the thermal energy in each chain increases, enhancing energy transfer. In general, local disorder influences the reduction of emission intensity by increasing the availability of non-emissive modes for energy transfer, facilitating energy migration to structural defects and vibrational states, such as through resonance. [32] According to the results, the presence of only the RGO next to the P3HT favors the predictable behavior in organic luminescent semiconductors in the dependence of luminescence intensity in function of the sample temperature. This may be related to the morphology created by the action of the RGO and/or the interface P3HT/RGO. And the anomalous behavior presented by the samples with PCBM may be related to the P3HT:PCBM interface, which notoriously produces a luminescence quenching and certainly interferes with the free volume between the polymeric chains of P3HT causing, with the increase in temperature, the anomaly of emission intensity.
Figure 6 displays the PL spectra normalized at the unit in each maximum for the three samples and they were shifted vertically to provide better visualization. For the three samples, it is possible to observe that with the increase in temperature, the emission maximums shift to the region of greater energy. This was expected and can be explained in terms of the effective conjugation length of the molecules, considering that there is an increase in the torsion angle between the vicinity of the thiophene ring of the P3HT polymer with the increase in temperature of the sample. Consequently, the effective conjugation length of the polymeric chain decreases, and from this shape causes a blue shift in the emission. This effect arises due to this increase in thermal disorder, in which it favors the appearance of these distortions, such as folds and rotations, responsible for breaking the conjugated segments. All samples have a maximum peak around 660 nm due to electronic transitions π-π*. The emission region occurs approximately between 500 and 875 nm. It is also observed in both samples that the band at 730 nm decreases dramatically with increasing temperature. The presence of this contribution represents a transition from the first phonon replica, whereas the peak of maximum emission represents the transition from zero phonon. These transitions are also known as transitions I (peak of maximum intensity in PL) and II (peak around 730 nm). Transition I occurs between LUMO and HOMO, whereas transition II occurs in the vibrational state, also known as HOMO+1 [36], the peak around 550 nm occurs due to conjugation-breaking and defects, causing shorts chains. The loss of the definition of this contribution with the increase in temperature is associated with loss of energy for the vibrational modes, which are activated as the temperature is increased.
To quantify the change in the emission intensity of transition I in relation to transition II, the Huang – Rhys parameter was estimated (S~I1/I0), which denotes information about the electronic structure of the system through electron-phonon interaction [33]. Table 2 shows the S values for each temperature of each sample. In all samples, the lowest temperatures showed lower Huang - Rhys parameters. This may be indicating that at low temperatures the polymer at the interface does not have enough free volume to significantly change its conformation by vibrational modes, which causes the parameter to decrease S (<1). Table 3 shows the energy difference in eV between the value of the wavelength in transition I and in transition II [16]. The values of these energy differences presented in Table 3, are between ~ 1300 to ~1700 cm-1, and correspond to the stretching vibration modes, deformations, among others associated with the thiophene ring, mainly to the stretching of the C=C bond, which corresponds to the formation of polar and bipolaron corroborating with the analysis above the parameters of Huang - Rhys showing the electron-phonon coupling [16].
To understand the mechanisms of energy transfer and understand the polarization states of light [17], EE measurements were performed. Analyzing the sample spectrum using the Fourier method, Stokes parameters, S0, S1, S2 e S3, were determined. These parameters are related to the polarization states of light, and thus are also related to factors linked to the orientation of the sample’s polymer chain. These parameters are related to the polarization states of light, and thus are also related to factors related to the orientation of the sample’s polymer chains. The parameter S0 is associated with the total amount of light emitted, S1, provides the portion of light emitted that is linearly polarized vertically or horizontally, S2 represents the amount of light linearly polarized at +45° or -45° with respect to the coupled polarizer before the spectrophotometer and S3, it represents a circularly polarized light patch on the right or left [17].
Figure 7 shows the EE spectra for a sample consisting of PEDOT:PSS/P3HT:PCBM:RGO at 90 K (a e c) and at 300 K (b e d). For the other samples, the analyzes are similar (see Figures S2 and 3 in Supplementary Materials). It can be seen through spectra a and b that polarized light, P, is mostly formed by linearly polarized light. In the spectrum at a temperature of 90 K (Figure 7a), it is possible to observe that there were changes in the sample spectrum in relation to the spectrum obtained at 300 K (Figure 7b). The main change is the change in the behavior of the curve (S2/S0), which is no longer null between 625 nm at 640 nm and in this range, it presented an amount of linearly polarized light rotated by -45º, indicating greater rotation of the chains that have induced dipoles partially aligned with the excitation source. The values of S3/S0, although varying, are fluctuating within the experimental error, indicating that the film still does not emit circularly polarized light to the left or right [19]. The S1/S0 curve, shown in Figure 7a, represents the amount of linearly polarized light relative to the total light. It shows a negative value, indicating that the emitted light prefers the linear and vertical direction in relation to the laboratory plane, which matches the direction of the excitation light polarization. [17]. A polymeric chain has dipole moments that, when parallel to the excitation of linearly polarized light, are preferentially excited, facilitating exciton diffusion and energy transfer between polymeric chains. [21] Consequently, linear polarization predominates.
The degree of polarization, P (Equation 1), indicates the amount of polarized light without differentiating between circularly or linearly polarized light. [19] The anisotropy factor, r (Equation 2), shows whether the chains are ordered in a preferred direction. The asymmetry factor, g (Equation 3), relates to the emission of circularly polarized light [18]. The greater the anisotropy factor, the greater the molecular ordering of the film and consequently the greater the degree of polarization in the emission, as this value is influenced by the molecular ordering of the film [34]. For the sample measured at 90 K, it is observed, from Figure 7c, that the degree of polarization has a maximum of ~80% around 610 nm and subsequently decays to its minimum value of ~60%. This decay of P and r as the wavelength increases, may be indicating a lesser alignment between the larger molecules. It is also possible to observe through the asymmetry factor curve, g, that there is no circularly polarized light emission in the sample. The spectra at Figure 7d, obtained for the sample analyzed at a temperature of 300 K, shows that the values of the degree of polarization increased for the wavelength range from 625 to 650 nm, in relation to the spectrum obtained at 300 K.
Originally, polymeric films that emit polarized light have molecular ordering in the same order as the polarization of the light emitted [19]. However, the degree of molecular ordering [35], indicates that the samples do not have molecular ordering (see Figures S4, 5 and 6 in Supplementary Materials). Figure 8 shows that the efficiency of energy (or charge) transfer, measured through the polarization of emitted light after excitation by linearly polarized light, depends on the sample’s temperature. The expected behavior for the degree of polarization is that it increases as the temperature decreases. Lower temperatures provide greater free volume and distance between chains, increasing the likelihood of radiative recombination within a single chain rather than energy transfer between chains. However, this behavior is not strongly visualized. The spectra in Figure 8a, obtained for the sample consisting of PEDOT:PSS/P3HT:PCBM:RGO, shows that the measurements of the degree of polarization obtained for temperatures of 150 K, 180 K, 240 K, 270K and 300 K, in the wavelength range from 625 nm to 650 nm, behave approximately the same (~80% to ~60%). After 650 nm all these measurements remain approximately the same, except for the 300 K sample and the measurements taken at 120 K. The spectra of sample PEDOT:PSS/P3HT:PCBM (Figure 8b and d) behave similarly to the sample PEDOT:PSS/P3HT:PCBM:RGO. The degree of polarization has its maximum between ~75% and ~98% and this gradually decreases for longer wavelengths, until it stabilizes and becomes constant after ~660 nm.
Comparing the spectra in Figure 8a-c, we can see an increase in the emission polarization as a function of the sample. The sample that does not have the PCBM presented the values of the degree of polarization at the lowest emission, close to 10%, as well as the values of the anisotropy factor (Figure 8d), indicating that without the PCBM the tendency of greater transfer of energy and less polarization. Generally, greater anisotropy indicates higher molecular ordering of the sample, which in turn results in a higher degree of polarization in the emission. This value is influenced by the molecular ordering of the film. [34]. However, deductions based on the anisotropy factor cannot be considered here, as the value of r calculated using the Stokes’ parameters is based solely on emission data obtained from a polarized light source. Corroborating, it is known that these samples do not have molecular ordering, as was shown by the measures of AFM and the factor of molecular order. Thus, the measurements obtained for these samples should show low values of anisotropy. However, PCBM acts as a barrier between P3HT molecules, increasing the energy transfer time between molecules. This supports the use of PCBM as an effective charge separator in organic photovoltaic devices. So due to this delay in transferring energy, the chance of a radioactive recombination in the direction of the excitation light becomes far greater than the chance of transferring energy to another chain. For this reason, the polarization is very high and thus interferes with the actual measurements of the EE anisotropy factor [21]. When compared to the other samples, the lower degree of polarization at all temperatures in the PEDOT:PSS/P3HT:RGO sample (Figure 8c) indicates that the lower the polarization, the greater the energy transfer. Thus evidencing that the presence of RGO in the P3HT matrix with the absence of PCBM provides efficient dissociation of excitons in the P3HT:RGO interfaces, the greater the weight ratio of RGO to P3HT the greater this effect will be according [36].
In other words, the apparent and unexpected contradiction between the values of r and β may be related to the accommodation of the PCBM between the side chains of the P3HT. PCBM is known as the ideal acceptor when combined with P3HT [37], improving charge transfer in organic photovoltaic devices even in polymeric films without induced ordering. This is explained by the longer lifespan of photo-excited carriers compared to P3HT alone [38]. Here, the EE results are similar. The presence of PCBM hampers energy transfer in chains that do not have their dipoles aligned with the excitation source, causing the recombination time of photo-excited carriers to be less than the energy transfer time between the main chains. Thus, recombination occurs in chains with dipoles aligned with the excitation source, resulting in high polarization in the emission.
Based on the above analysis, the PEDOT:PSS/P3HT:RGO sample shows better energy transfer from photo-excited carriers. Thus, it is possible to infer that the RGO can be a facilitator in the transfer of energy between one chain and another. Therefore, this analysis also shows that RGO is a potential candidate to replace PCBM as a n-type semiconductor in optoelectronic devices, such as OLEDs. It should be noted that, in addition to good conductivity and an adequate Eonset, it facilitates the transfer of energy from photo-excited carriers between the polymeric chains of the P3HT.
4. Conclusions
The values of the Eonset calculated from the absorption spectra showed that the P3HT Eonset decreases in the presence of reduced graphene oxide, due to the high electron transfer kinetics that this component presents. The photoluminescence spectra as a function of temperature showed anomalous behavior in the emission intensities of samples that have the P3HT:PCBM interface. The behavior of the emission intensity of the sample with the P3HT:RGO interface increases with increasing temperature. The emission ellipsometry spectra showed that the temperature influences the degree of polarization of the sample, and this influence changes along the excitation wavelengths. In addition, it showed that the sample emission has polarization and varies depending on the emission wavelength. Still, through the EE spectra, combined with the molecular ordering data (β), it is observed that the PCBM hinders the energy transfer of the photo-excited carriers, causing the carriers to recombine with high polarization, i.e., in same direction of polarization as the excitation source. Thus, it is concluded that the PCBM, besides being a good acceptor, also acts as a barrier between the P3HT chains, favoring a longer lifetime for the photo-excited carriers, strongly implying its use in photovoltaic devices due to the favored separation of loads. On the other hand, replacing PCBM with RGO, which has a slightly smaller Eonset, proves to be potentially favorable. The P3HT interface shows a greater tendency for energy transfer compared to the P3HT interface. In other words, RGO is a potential substitute for PCBM as an n-type semiconductor (acceptor) in photovoltaic devices. Besides having good conductivity and an adequate Eonset, RGO facilitates the transfer of energy from photo-excited carriers between the P3HT polymeric chains.
Author Contributions
Conceptualization: E.M.T. and P.E.M..; data curation: A.C.H.K., E.C.R., P.E.M., M.R.N.S. and E.M.T.; formal analysis: A.C.H.K., E.C.R., P.E.M., M.R.N.S. and E.M.T.; funding acquisition and resources: A.F.N., R.J.R. and E.M.T.; investigation and validation: E.M.T., P.E.M., A.M., A.F.N. and R.J.R; methodology: A.M., P.E.M. and E.M.T.; project administration and supervision: A.F.N. and E.M.T.; writing —original draft: A.C.H.K. and E.C.R..; writing—review and editing: A.M., A.F.N. and E.M.T.. All authors have read and agreed to the published version of the manuscript.
Funding
This research was funded by Brazilian Development Agencies: CNPq (Process: 427526/2016-7 and 314355/2021-9), FAPEMAT (Process: 0273976/2017 and FAPEMAT-PRO.000168/2023).
Data Availability Statement
All data related to this study are available in this article or upon reasonable request.
Acknowledgments
The authors thank the following Brazilian Development Agencies: CNPq, INCT/INEO (Brazil), FAPEMAT, PROPeq/UFMT, PROPG/UFMT and also the Government of the State of Mato Grosso. M.S. was a fellow at the FUFMT. E.R. and A.K. were a fellow at the CAPES.
Conflicts of Interest
The authors declare no conflicts of interest.
References
- Bégué, D.; Guille, E.; Metz, S.; Arnaud, M.A.; Silva, H.S.; Seck, M.; Fayon, P.; Dagron-Lartigau, C.; Iratcabal, P.; Hiorns, R.C. Graphene-Based Acceptor Molecules for Organic Photovoltaic Cells: A Predictive Study Identifying High Modularity and Morphological Stability. RSC Adv. 2016, 6, 13653–13656. [Google Scholar] [CrossRef]
- Tang, H.; Hessel, C.M.; Wang, J.; Yang, N.; Yu, R.; Zhao, H.; Wang, D. Two-Dimensional Carbon Leading to New Photoconversion Processes. Chem. Soc. Rev. 2014, 43, 4281–4299. [Google Scholar] [CrossRef] [PubMed]
- Therézio, E.M.; Rodrigues, P.C.; Tozoni, J.R.; Marletta, A.; Akcelrud, L. Energy-Transfer Processes in Donor–Acceptor Poly(Fluorenevinylene-Alt-4,7-Dithienyl-2,1,3-Benzothiadiazole). The Journal of Physical Chemistry C 2013, 117, 13173–13180. [Google Scholar] [CrossRef]
- Kalonga, G.; Chinyama, K.; Munyati, O.; Maaza, M. Characterization and Optimization of P3HT and PCBM Blends for Photo-Absorption. Journal of Chemical Engineering and Materials Science 2013, 93–102. [Google Scholar] [CrossRef]
- Shrotriya, V.; Ouyang, J.; Tseng, R.J.; Li, G.; Yang, Y. Absorption Spectra Modification in Poly(3-Hexylthiophene):Methanofullerene Blend Thin Films. Chem Phys Lett 2005, 411, 138–143. [Google Scholar] [CrossRef]
- Khan, M.T.; Bhargav, R.; Kaur, A.; Dhawan, S.K.; Chand, S. Effect of Cadmium Sulphide Quantum Dot Processing and Post Thermal Annealing on P3HT/PCBM Photovoltaic Device. Thin Solid Films 2010, 519, 1007–1011. [Google Scholar] [CrossRef]
- Benatto, L.; Bassi, M. de J.; de Menezes, L.C.W.; Roman, L.S.; Koehler, M. Kinetic Model for Photoluminescence Quenching by Selective Excitation of D/A Blends: Implications for Charge Separation in Fullerene and Non-Fullerene Organic Solar Cells. J. Mater. Chem. C 2020, 8, 8755–8769. [Google Scholar] [CrossRef]
- Cui, Y.; Yao, H.; Hong, L.; Zhang, T.; Xu, Y.; Xian, K.; Gao, B.; Qin, J.; Zhang, J.; Wei, Z.; et al. Achieving Over 15% Efficiency in Organic Photovoltaic Cells via Copolymer Design. Advanced Materials 2019, 31. [Google Scholar] [CrossRef] [PubMed]
- Yin, Z.; Zhu, J.; He, Q.; Cao, X.; Tan, C.; Chen, H.; Yan, Q.; Zhang, H. Graphene-Based Materials for Solar Cell Applications. Adv Energy Mater 2014, 4, 1–19. [Google Scholar] [CrossRef]
- Singh, E.; Nalwa, H.S. Stability of Graphene-Based Heterojunction Solar Cells. RSC Adv. 2015, 5, 73575–73600. [Google Scholar] [CrossRef]
- Yan, X.; Cui, X.; Li, B.; Li, L. Large, Solution-Processable Graphene Quantum Dots as Light Absorbers for Photovoltaics. Nano Lett 2010, 10, 1869–1873. [Google Scholar] [CrossRef] [PubMed]
- Geim, A.K.; Novoselov, K.S. The Rise of Graphene. Nat Mater 2007, 6, 183–191. [Google Scholar] [CrossRef] [PubMed]
- Gao, X.; Jang, J.; Nagase, S. Hydrazine and Thermal Reduction of Graphene Oxide: Reaction Mechanisms, Product Structures, and Reaction Design. Journal of Physical Chemistry C - J PHYS CHEM C 2009, 114. [Google Scholar] [CrossRef]
- Hummers, W.S.Jr.; Offeman, R.E. Preparation of Graphitic Oxide. J Am Chem Soc 1958, 80, 1339. [Google Scholar] [CrossRef]
- Marletta, A.; Vega, M.L.; Rodrigues, C.A.; Gobato, Y.G.; Costa, L.F.; Faria, R.M. Photo-Irradiation Effects on the Surface Morphology of Poly(p-Phenylene Vinylene) Films. Appl Surf Sci 2010, 256, 3018–3023. [Google Scholar] [CrossRef]
- Araújo, C.; Bruno Schura, A.; Chagas, E.; Ramos, R.; de Santana, H.; Marletta, A.; Therézio, E. Inter- and Intrachain Transition Analyses by Photoluminescence and Raman Spectroscopy of Electrochemically Synthesized P3OT Films. Journal of Materials Science: Materials in Electronics 2020, 31. [Google Scholar] [CrossRef]
- Therézio, E.M.; Dalkiranis, G.G.; Vieira, A.A.; Gallardo, H.; Bechtold, I.H.; Marletta, P.T.C. and A. Achromatic Ellipsometry: Theory and Applications. In Ellipsometry; Wahaia, F., Ed.; IntechOpen: Rijeka, 2017; p. Ch. 2; ISBN 978-953-51-3624-8. [Google Scholar]
- Schura, A.B.; de Sá, S.S.; Silva, R.A.; de Santana, H.; Marletta, A.; Therézio, E.M. Energy Transfer Processes in Electrochemical P3HT Thin Films. Journal of Materials Science: Materials in Electronics 2019, 30, 4289–4295. [Google Scholar] [CrossRef]
- Alliprandini-Filho, P.; Silva, G.; Neto, N.; Silva, R.; Marletta, A. Induced Secondary Structure in Nanostructured Films of Poly(p-Phenylene Vinylene). J Nanosci Nanotechnol 2009, 9, 5981–5989. [Google Scholar] [CrossRef] [PubMed]
- Basilio, F.C.; Campana, P.T.; Therézio, E.M.; Barbosa Neto, N.M.; Serein-Spirau, F.; Silva, R.A.; Oliveira, O.N.Jr.; Marletta, A. Ellipsometric Raman Spectroscopy. The Journal of Physical Chemistry C 2016, 120, 25101–25109. [Google Scholar] [CrossRef]
- Therézio, E.M.; Franchello, F.; Dias, I.F.L.; Laureto, E.; Foschini, M.; Bottecchia, O.L.; de Santana, H.; Duarte, J.L.; Marletta, A. Emission Ellipsometry as a Tool for Optimizing the Electrosynthesis of Conjugated Polymers Thin Films. Thin Solid Films 2013, 527, 255–260. [Google Scholar] [CrossRef]
- Therézio, E.; Piovesan, E.; Vega, M.L.; Silva, R.; Oliveira, O.; Marletta, A. Thickness and Annealing Temperature Effects on the Optical Properties and Surface Morphology of Layer-by-Layer Poly(p-Phenyline Vinylene) plus Dodecylbenzenesulfonate Films. J Polym Sci B Polym Phys 2011, 49, 206–213. [Google Scholar] [CrossRef]
- Therézio, E.M.; da Silva, S.F.C.; Dalkiranis, G.G.; Alliprandini Filho, P.; Santos, G.C.; Ely, F.; Bechtold, I.H.; Marletta, A. Light Polarization States of a Cholesteric Liquid Crystal Probed with Optical Ellipsometry. Opt Mater (Amst) 2015, 48, 7–11. [Google Scholar] [CrossRef]
- Marchezi, P.E.; Sonai, G.G.; Hirata, M.K.; Schiavon, M.A.; Nogueira, A.F. Understanding the Role of Reduced Graphene Oxide in the Electrolyte of Dye-Sensitized Solar Cells. The Journal of Physical Chemistry C 2016, 120, 23368–23376. [Google Scholar] [CrossRef]
- Abdullahi, S.; Güner, S.; Koseoglu, Y.; Musa, I.; Adamu, B.; Abdulhamid, M. Sımple Method For The Determınatıon of Band Gap of a Nanopowdered Sample Usıng Kubelka Munk Theory. Journal of the Nigerian Association of Mathematical Physics 2016, 35, 241–246. [Google Scholar]
- Stöckert, D.; Kessel, R.; Schultze, J.W. Absorption, Photocurrent and Photoelectron Spectra of Heterocyclic Polymers. Synth Met 1991, 41, 1295–1300. [Google Scholar] [CrossRef]
- Ohmori, Y.; Uchida, M.; Muro, K.M.K.; Yoshino, K.Y.K. Visible-Light Electroluminescent Diodes Utilizing Poly(3-Alkylthiophene). Jpn J Appl Phys 1991, 30, L1938. [Google Scholar] [CrossRef]
- Marrocchi, A.; Lanari, D.; Facchetti, A.; Vaccaro, L. Poly(3-Hexylthiophene): Synthetic Methodologies and Properties in Bulk Heterojunction Solar Cells. Energy Environ. Sci. 2012, 5, 8457–8474. [Google Scholar] [CrossRef]
- Kinoshita, K.; Kobayashi, T.; Nagase, T.; Naito, H. Photoinduced Absorption in P3HT/PCBM Bulk Heterostructures. Materials Science Forum 2010, 658, 503–506. [Google Scholar] [CrossRef]
- Therézio, E.; Duarte, J.L.; Laureto, E.; Di Mauro, E.; Dias, I.; Marletta, A.; de Santana, H. Analysis of the Optical Properties of Poly(3-octylthiophene) Partially Dedoped. J Phys Org Chem 2011, 24, 640–645. [Google Scholar] [CrossRef]
- Janssen, G.; Aguirre, A.; Goovaerts, E.; Vanlaeke, P.; Poortmans, J.; Manca, J. Optimization of morphology of P3HT/PCBM Films for Organic Solar Cells: Effects of Thermal and Spin Coating Solvents*. Eur. Phys. J. Appl. Phys. 2007, 37, 287–290. [Google Scholar] [CrossRef]
- Jiang, Y.C.; Liu, F.Q.; Wang, L.J.; Yin, W.; Wang, Z.G. Blue-Shift Photoluminescence from Porous InAlAs. Semicond Sci Technol 2010, 25, 115006. [Google Scholar] [CrossRef]
- Therézio, E.; Piovesan; Anni, M.; Silva, R.; Oliveira, O.; Marletta, A. Substrate/Semiconductor Interface Effects on the Emission Efficiency of Luminescent Polymers. J Appl Phys 2011, 110, 044504. [CrossRef]
- Cimrová, V.; Remmers, M.; Neher, D.; Wegner, G. Polarized Light Emission from LEDs Prepared by the Langmuir-Blodgett Technique. Advanced Materials 1996, 8, 146–149. [Google Scholar] [CrossRef]
- Ishihara, H.; Kimura, I.; Saito, K.; Ono, H. Infrared Studies on Segmented Polyurethane-Urea Elastomers. Journal of Macromolecular Science, Part B 1974, 10, 591–618. [Google Scholar] [CrossRef]
Figure 1.
Chemical structure of (a) P3HT, (b) PEDOT:PSS, (c) RGO, (d) PCBM.
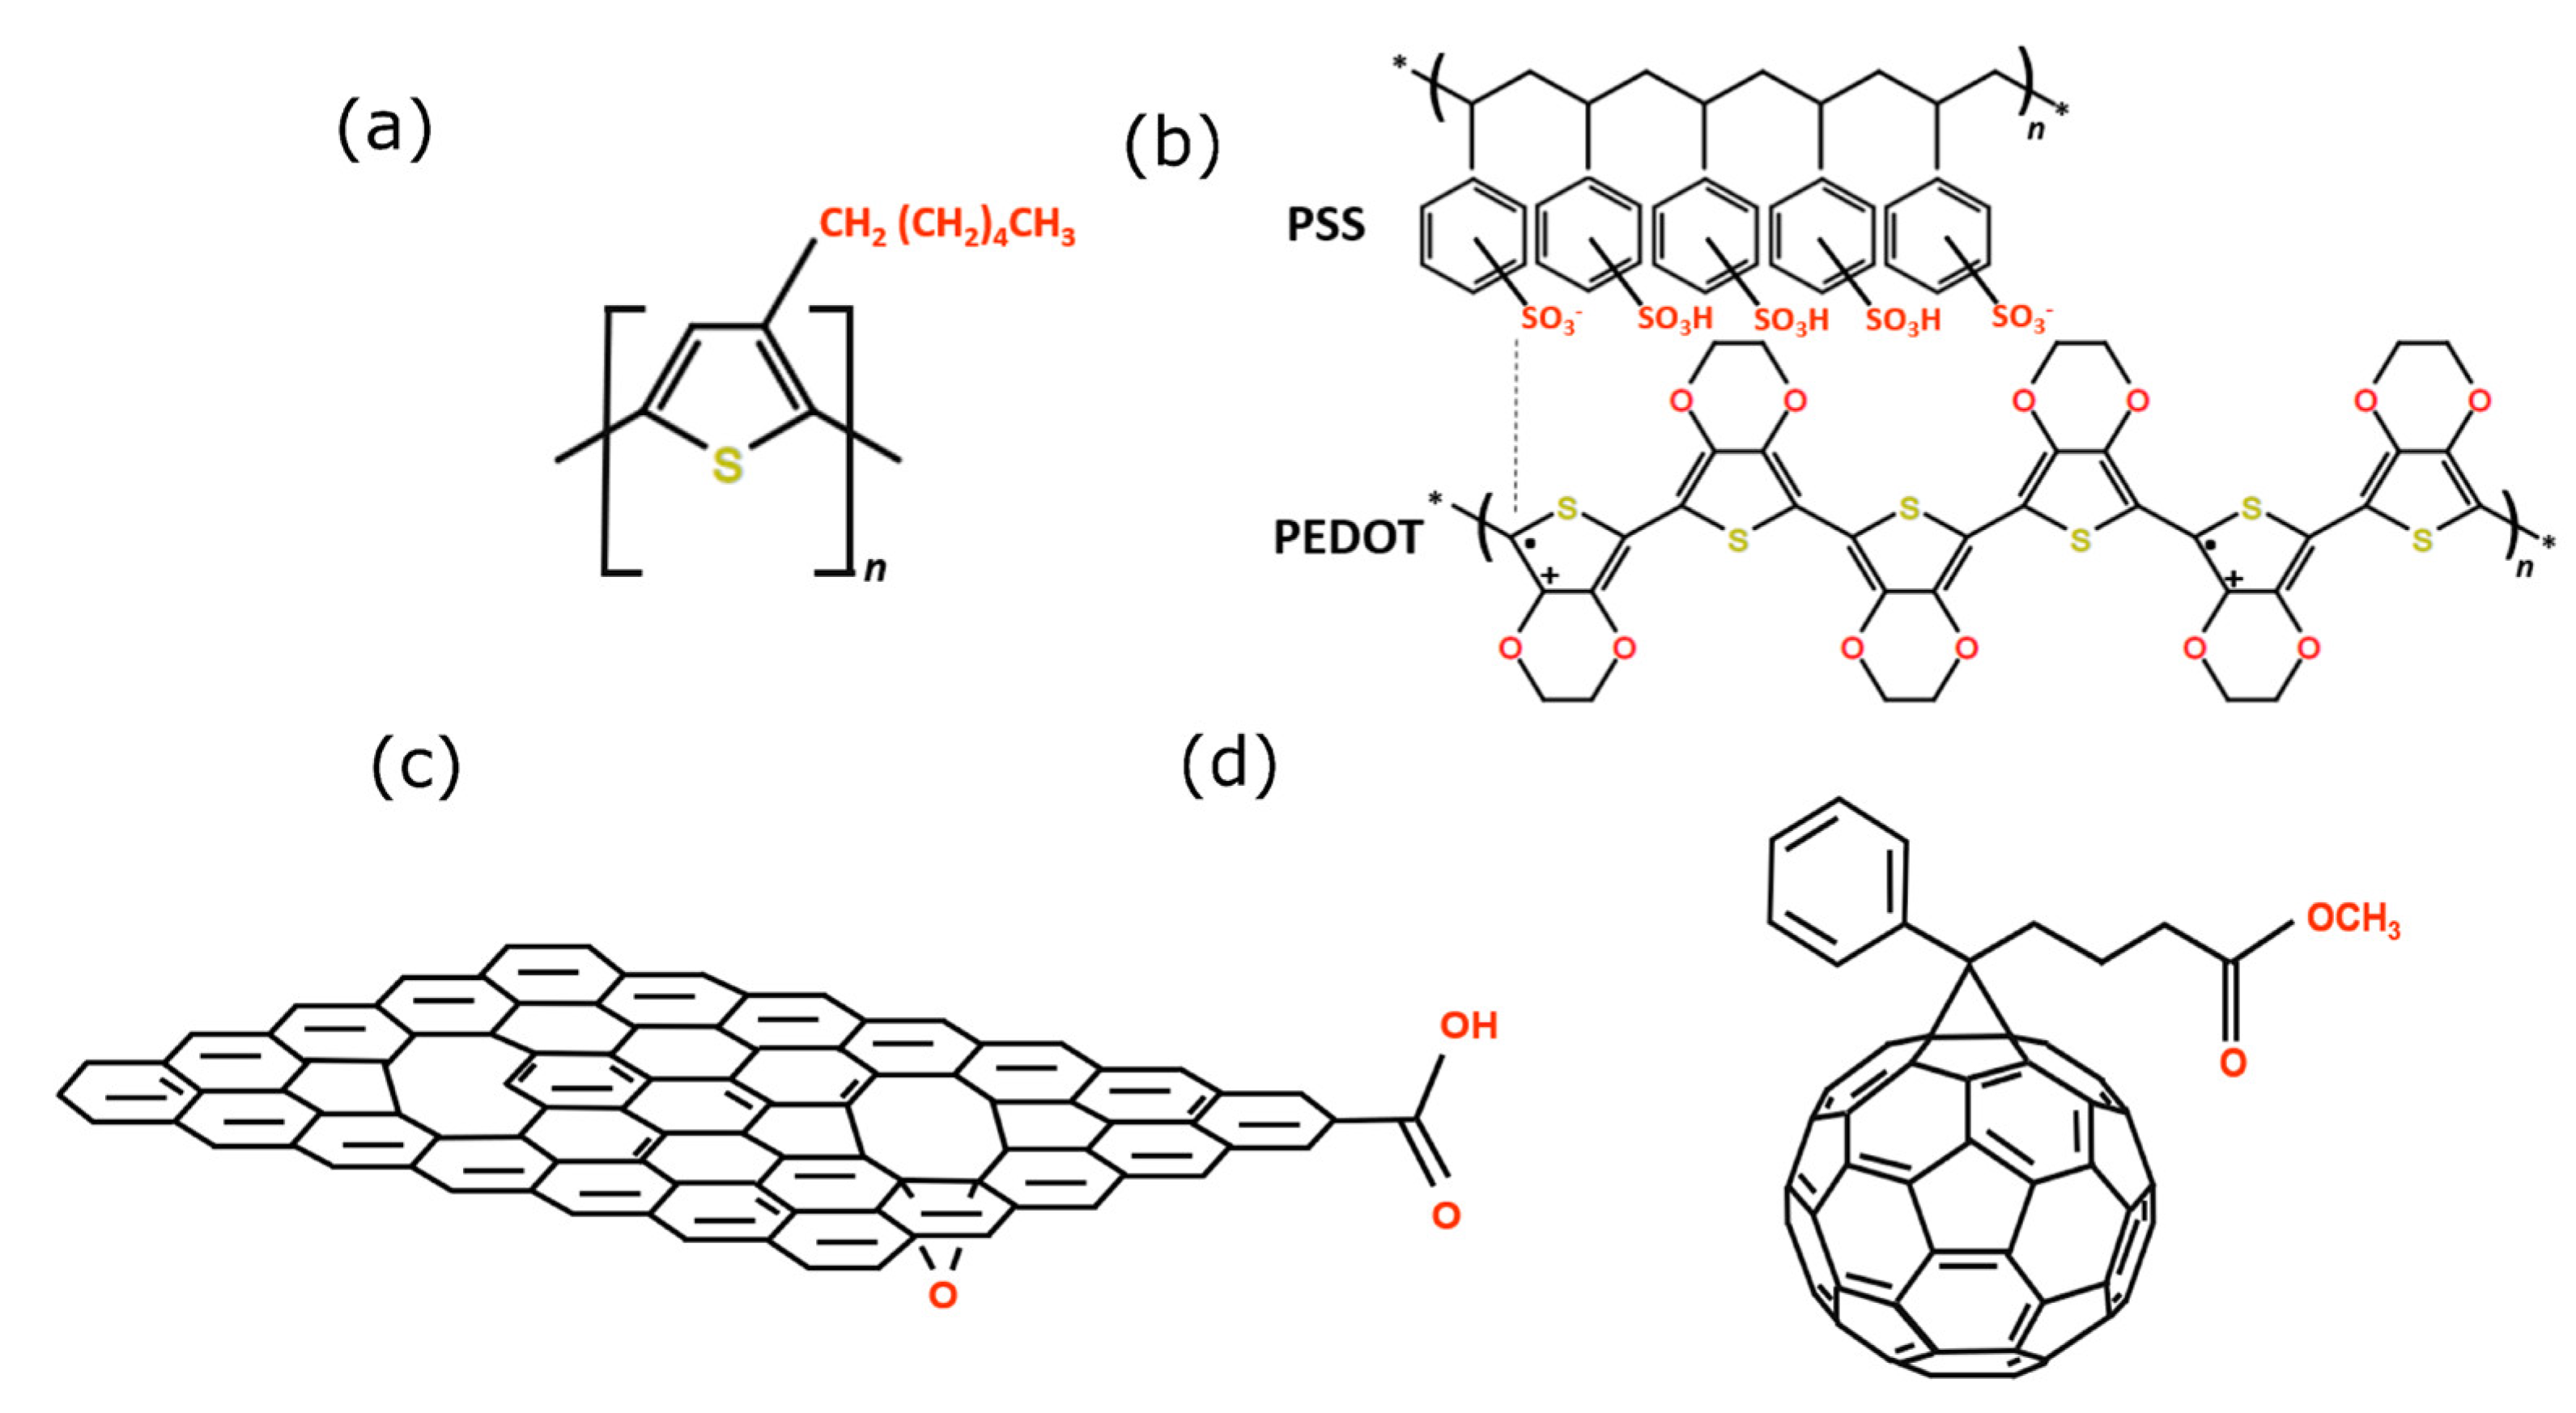
Figure 2.
Scheme showing the architecture of the samples: (a) PEDOT:PSS/P3HT:PCBM:RGO, (b) PEDOT:PSS/P3HT:PCBM and, (c) PEDOT:PSS/P3HT:RGO.
Figure 2.
Scheme showing the architecture of the samples: (a) PEDOT:PSS/P3HT:PCBM:RGO, (b) PEDOT:PSS/P3HT:PCBM and, (c) PEDOT:PSS/P3HT:RGO.
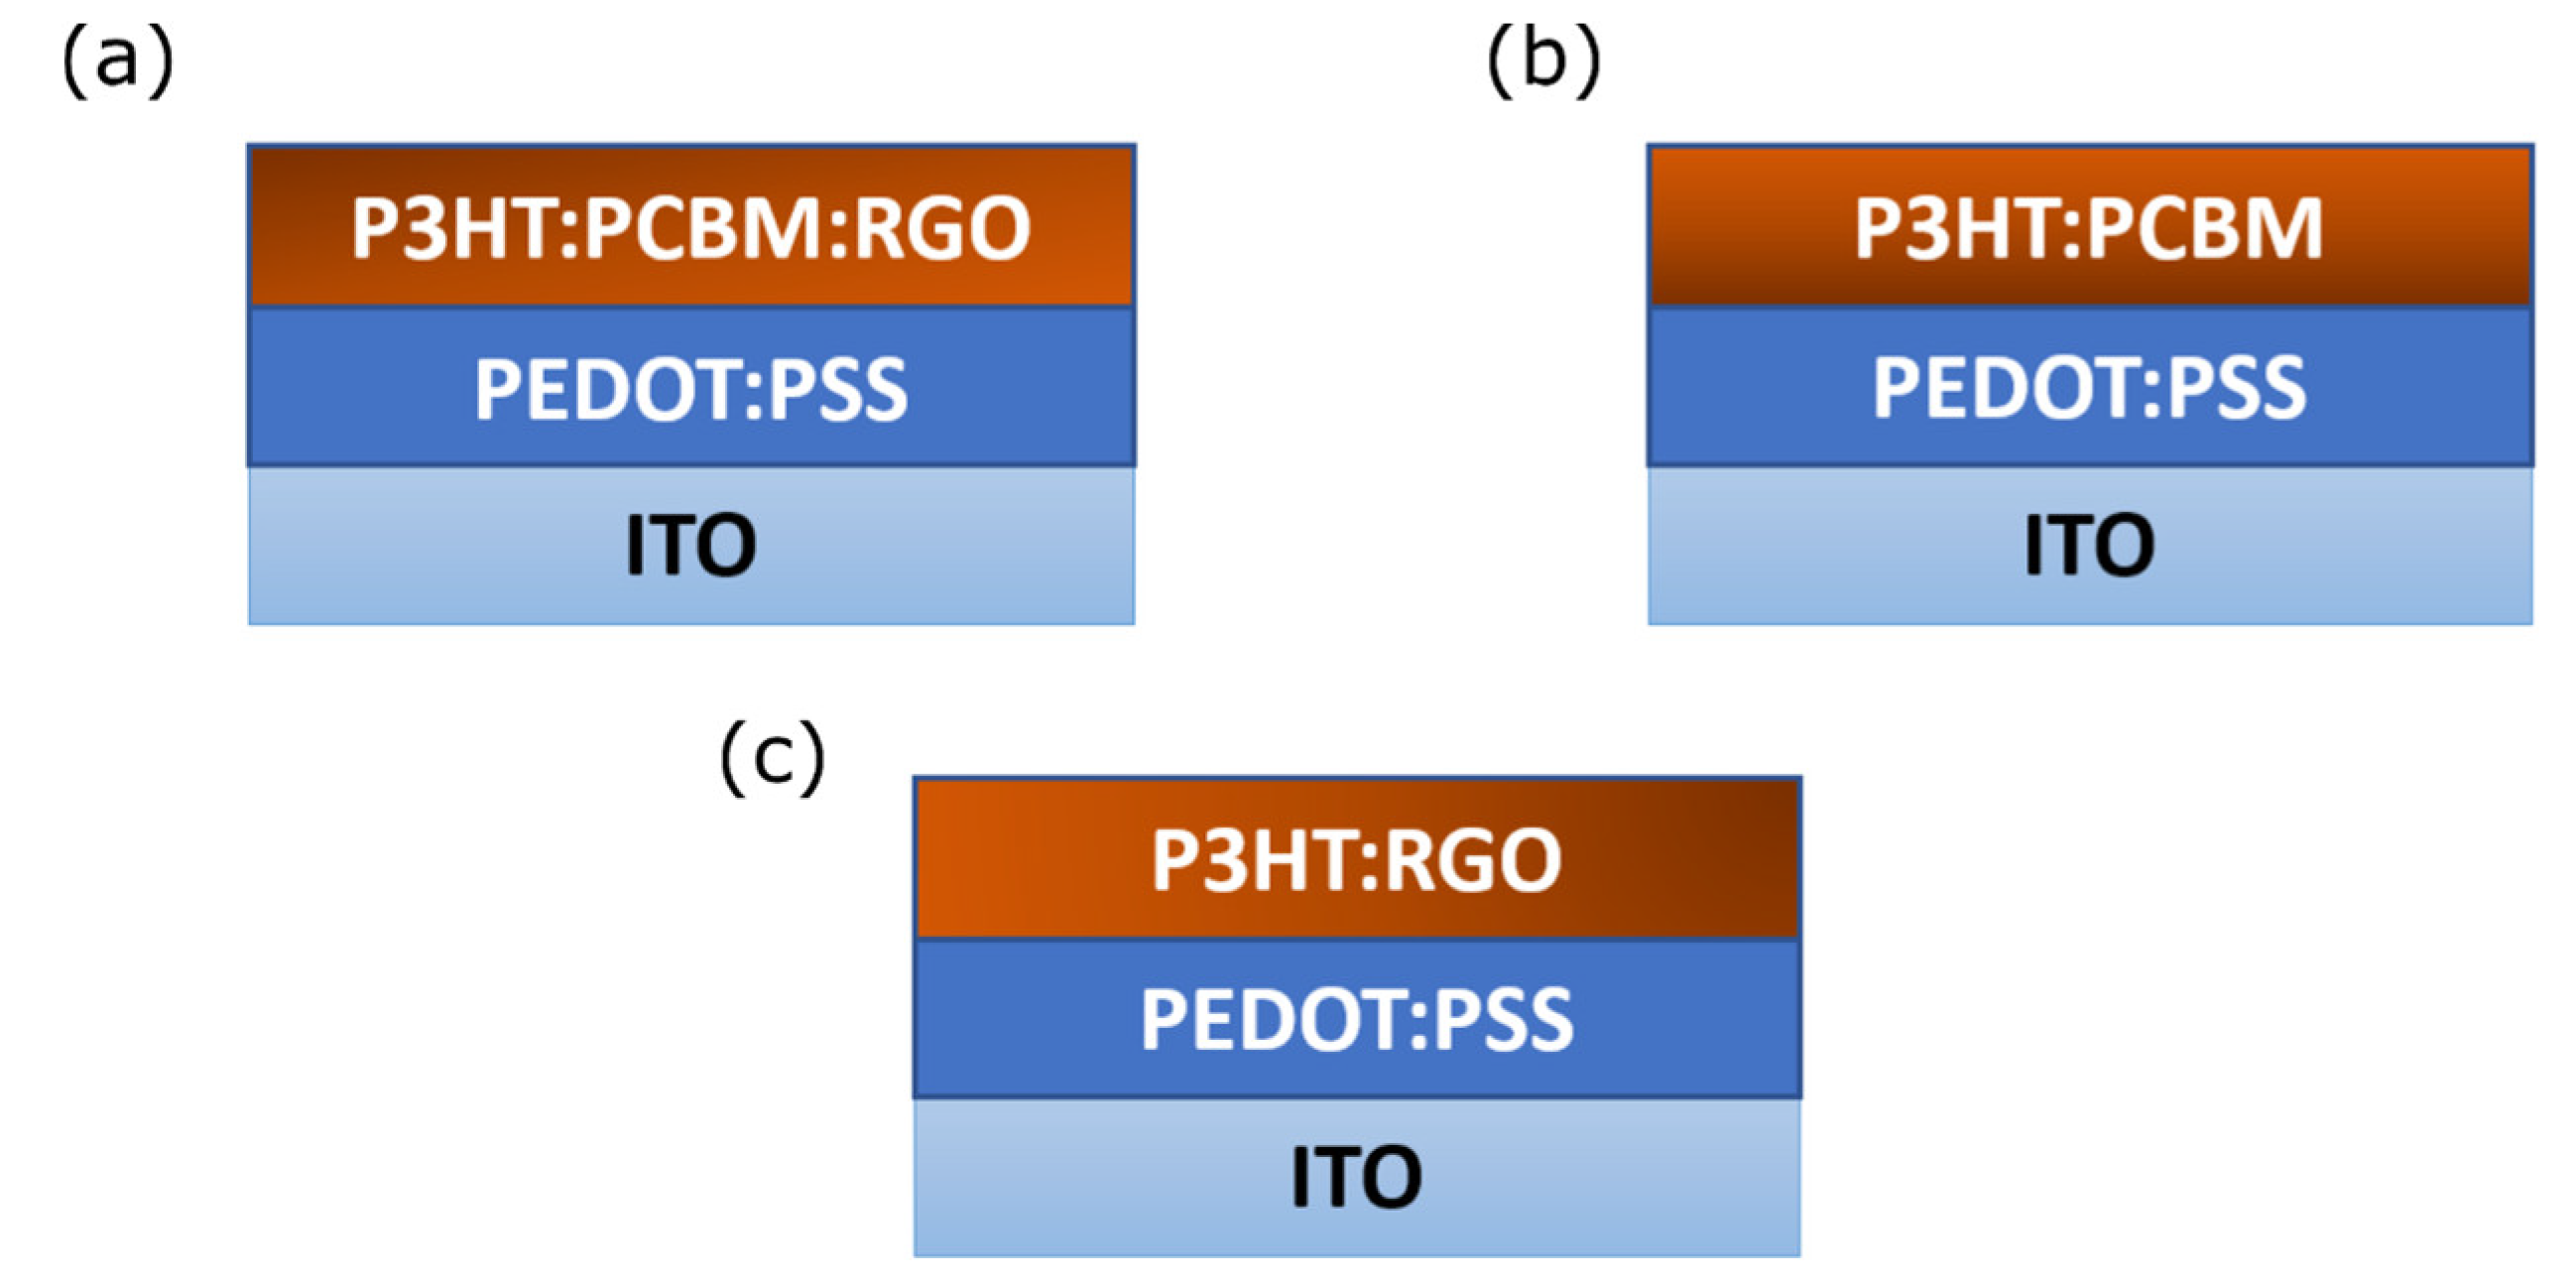
Figure 3.
Absorption spectra for samples PEDOT:PSS/P3HT:PCBM, PEDOT:PSS/P3HT:RGO and PEDOT:PSS/P3HT:PCBM:RGO.
Figure 3.
Absorption spectra for samples PEDOT:PSS/P3HT:PCBM, PEDOT:PSS/P3HT:RGO and PEDOT:PSS/P3HT:PCBM:RGO.
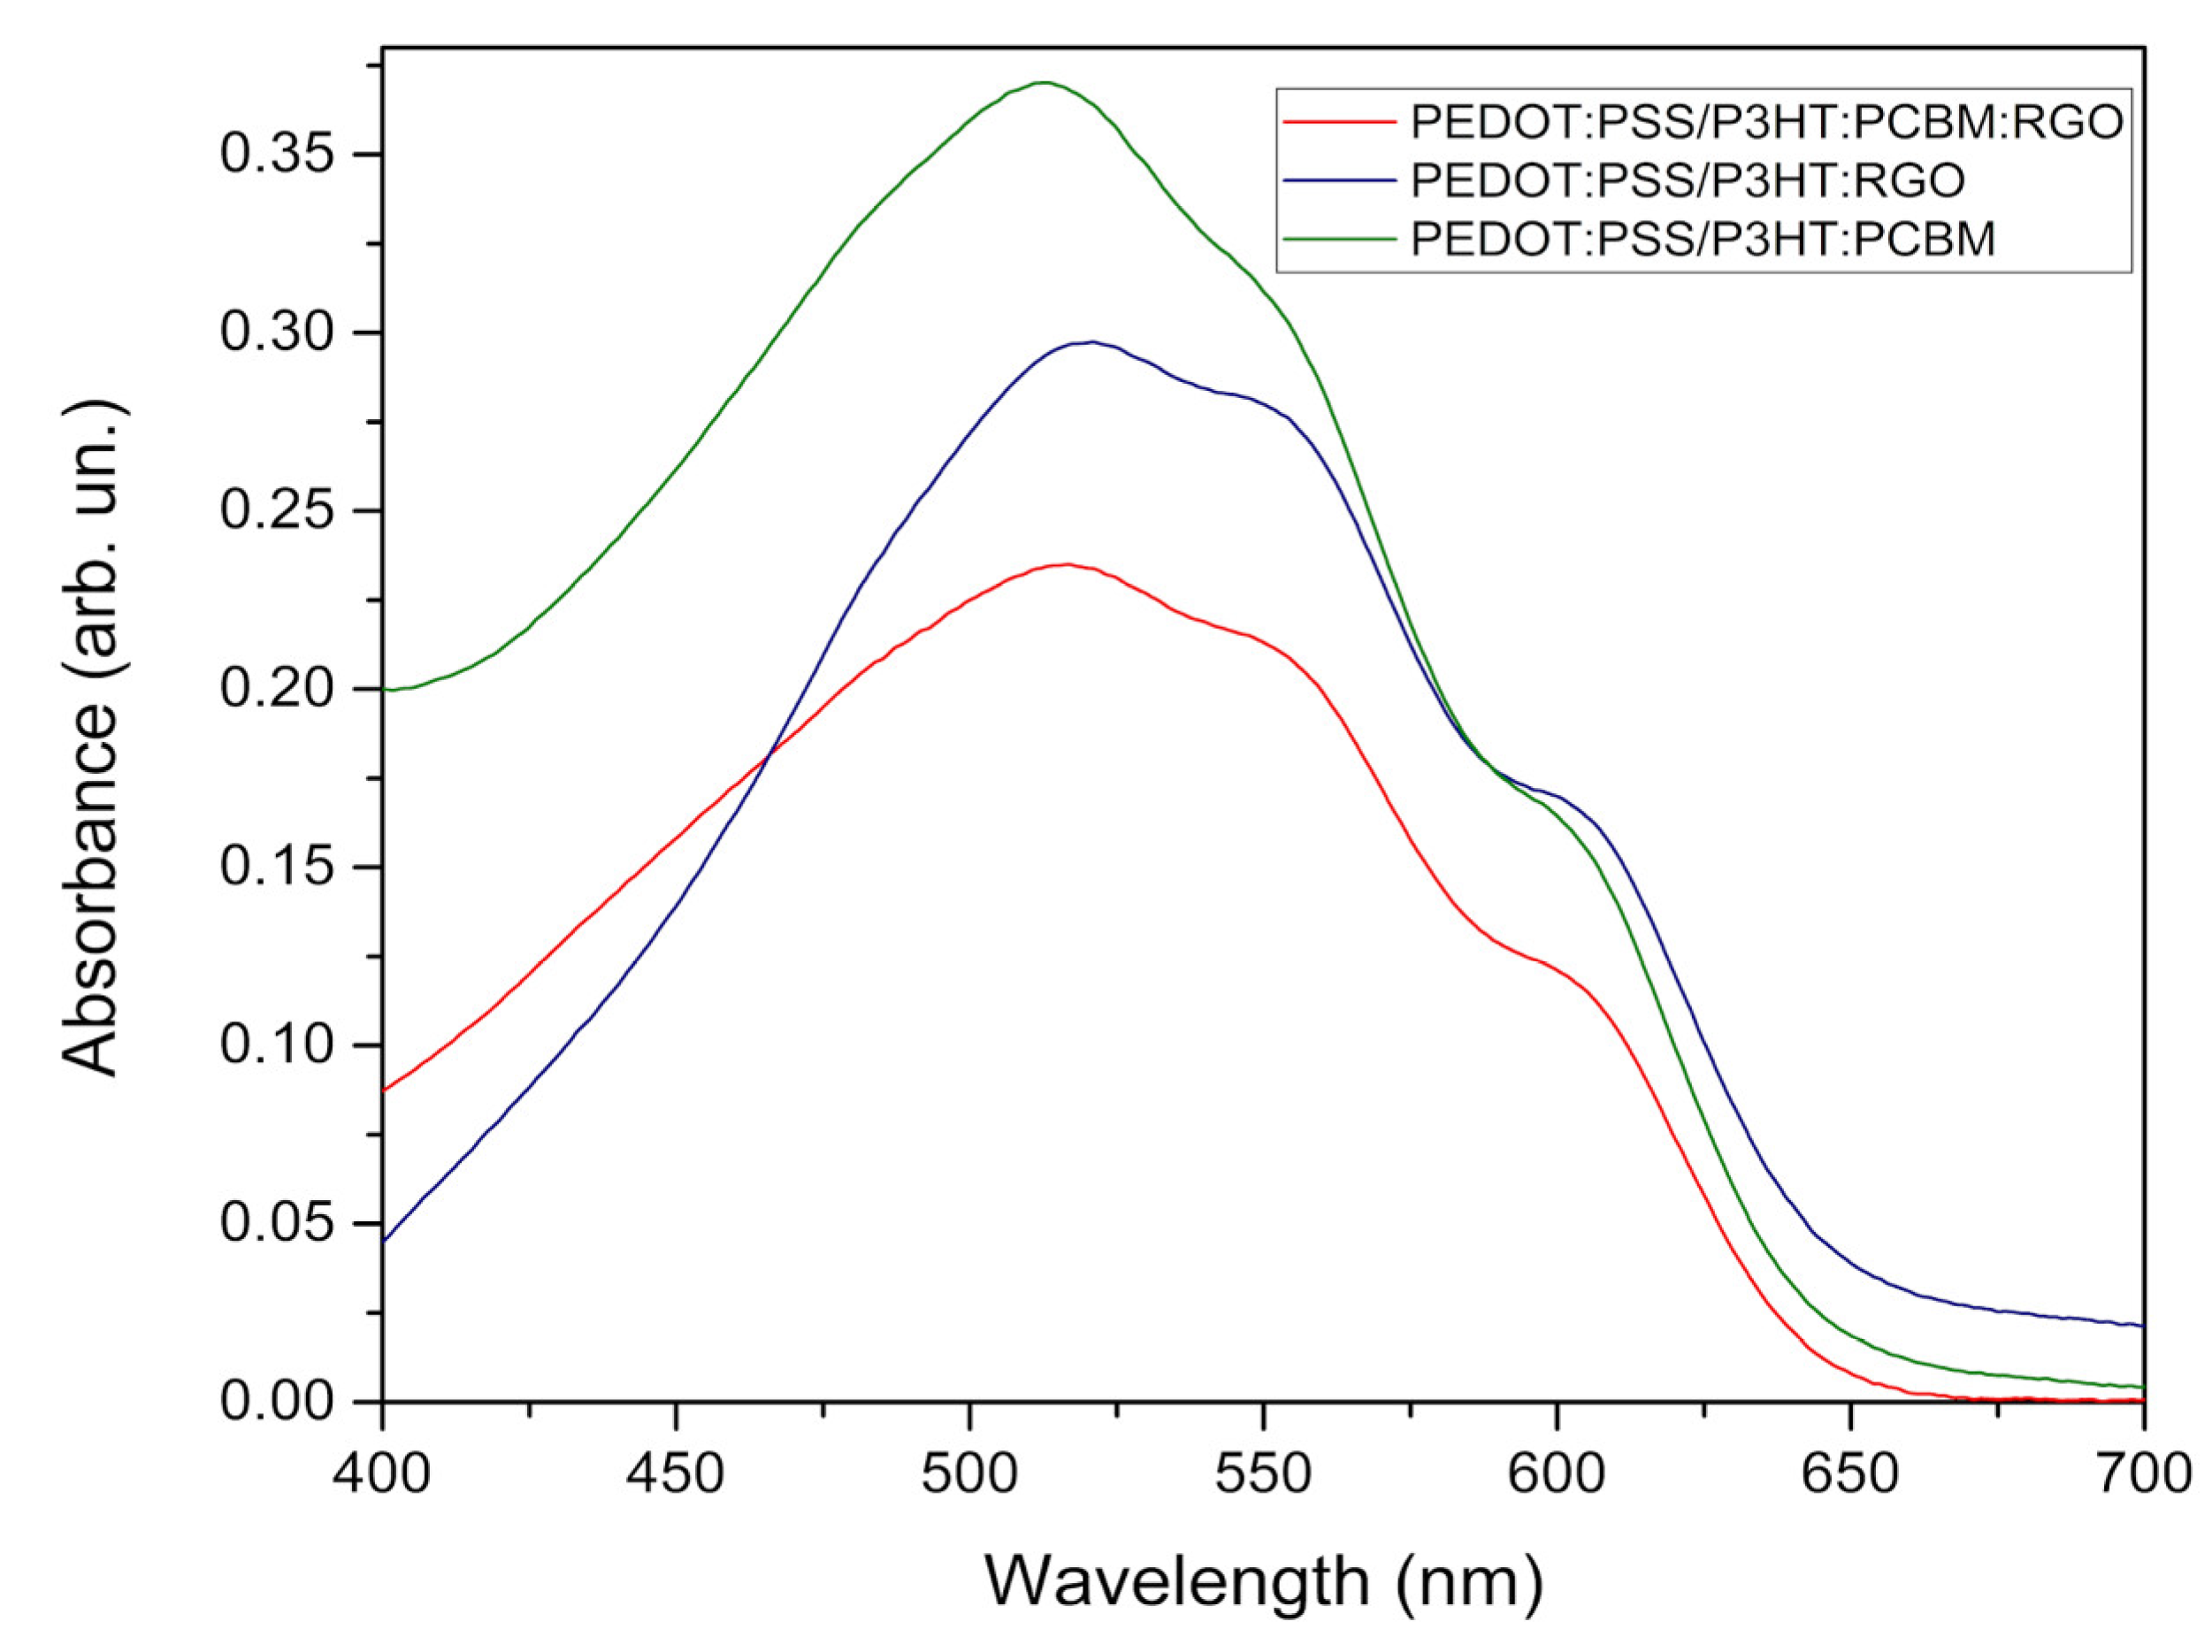
Figure 4.
AFM images for samples (a) PEDOT/P3HT:PCBM, (b) PEDOT/P3HT:PCBM:RGO and (c) PEDOT/P3HT:RGO. (d) Height distribution, (e) mean roughness, (f) Skewness and (g) kurtosis calculated for the samples.
Figure 4.
AFM images for samples (a) PEDOT/P3HT:PCBM, (b) PEDOT/P3HT:PCBM:RGO and (c) PEDOT/P3HT:RGO. (d) Height distribution, (e) mean roughness, (f) Skewness and (g) kurtosis calculated for the samples.
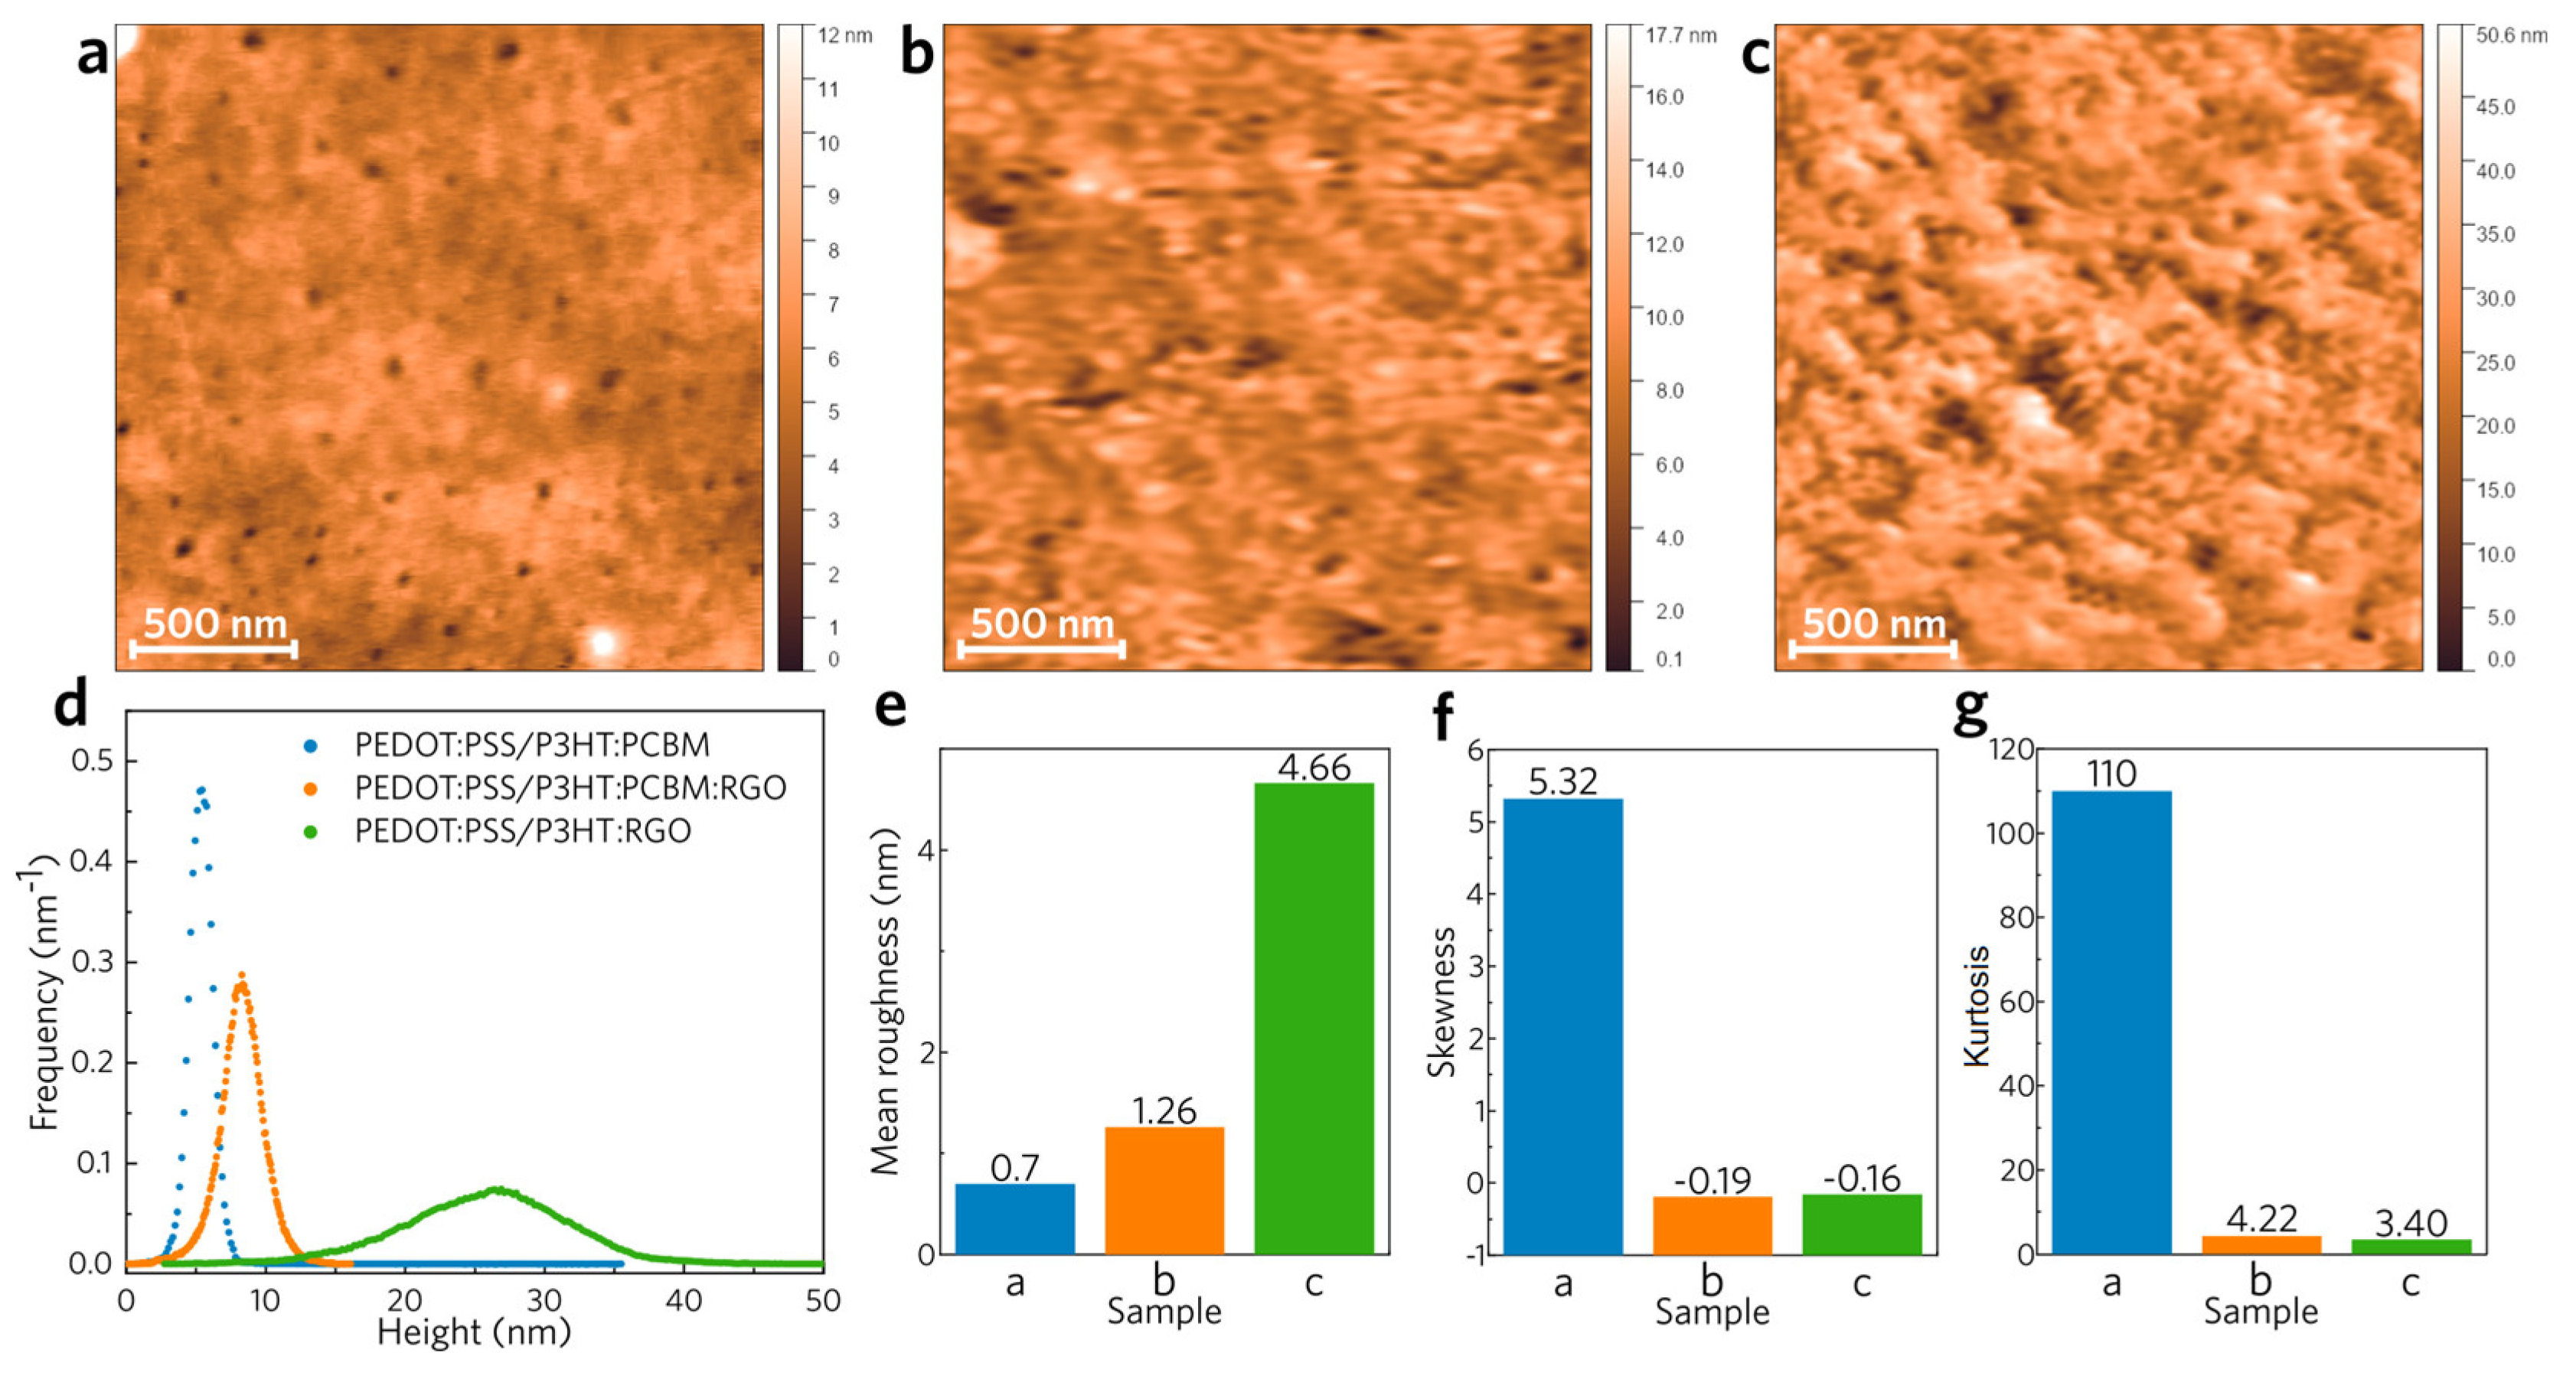
Figure 5.
(a) PL spectra for samples PEDOT:PSS/P3HT:PCBM, (b) PEDOT:PSS/P3HT:PCBM:RGO (c) PEDOT:PSS/P3HT:RGO from 90 K to 300 K.
Figure 5.
(a) PL spectra for samples PEDOT:PSS/P3HT:PCBM, (b) PEDOT:PSS/P3HT:PCBM:RGO (c) PEDOT:PSS/P3HT:RGO from 90 K to 300 K.
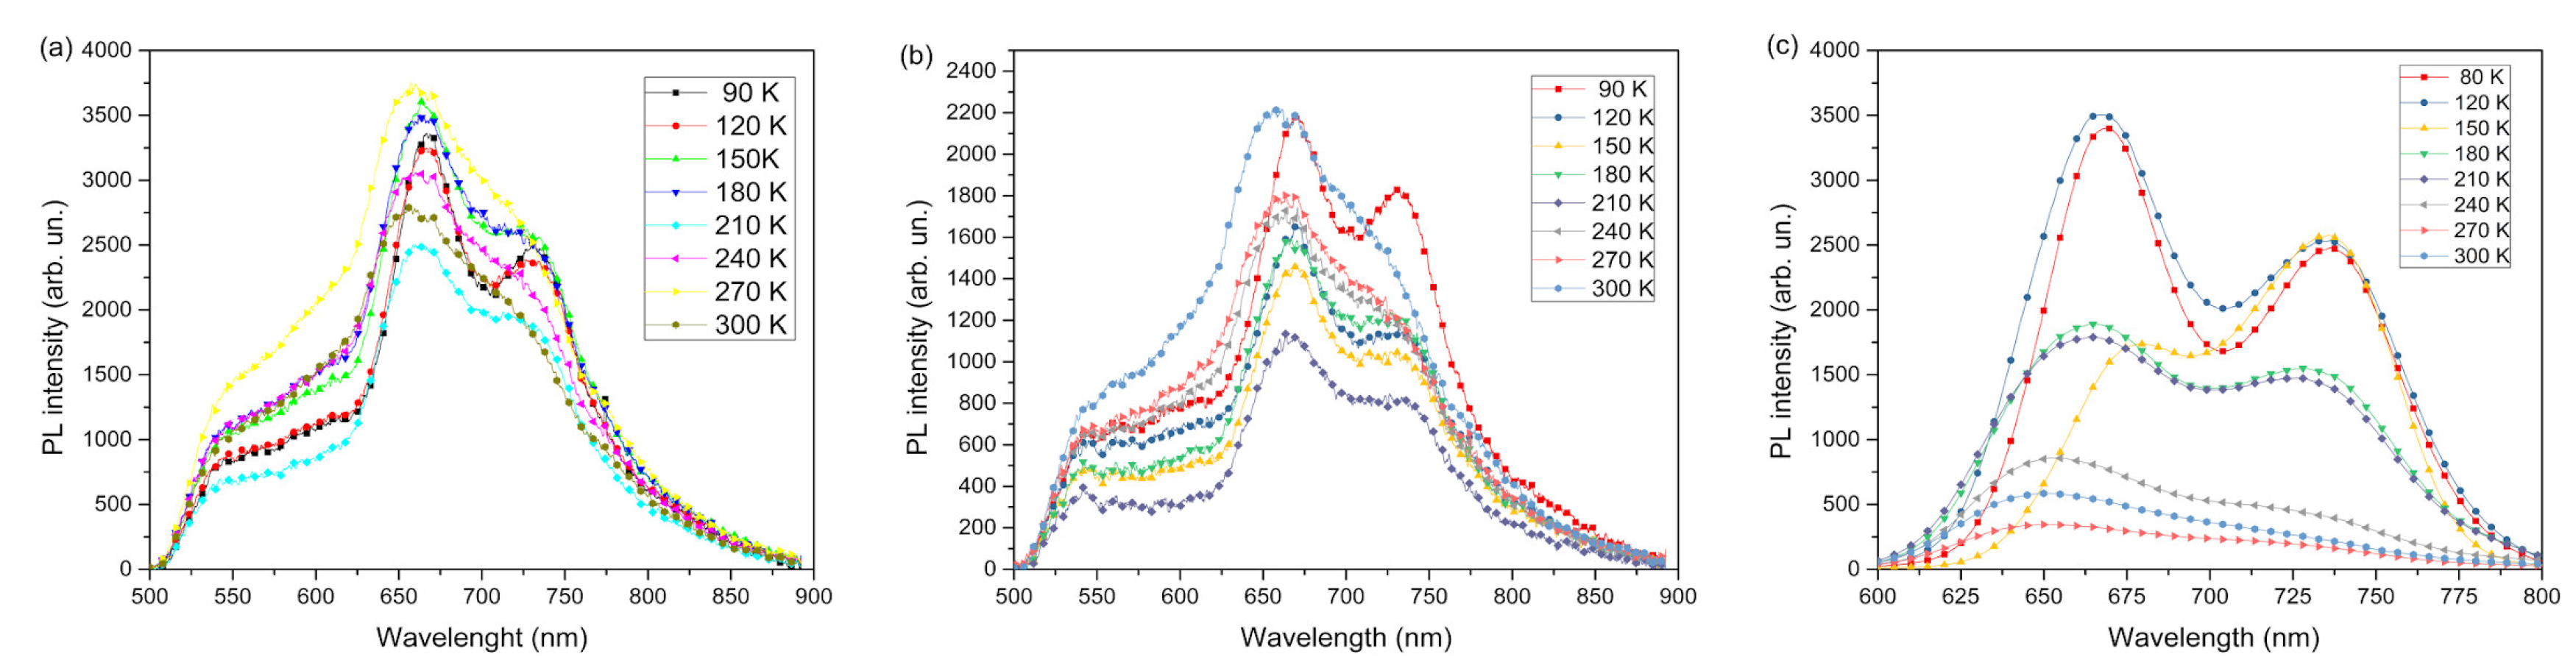
Figure 6.
(a) Normalized PL spectra of samples PEDOT:PSS/P3HT:PCBM, (b) PEDOT:PSS/P3HT:PCBM:RGO (c) PEDOT:PSS/P3HT:RGO in different temperatures.
Figure 6.
(a) Normalized PL spectra of samples PEDOT:PSS/P3HT:PCBM, (b) PEDOT:PSS/P3HT:PCBM:RGO (c) PEDOT:PSS/P3HT:RGO in different temperatures.
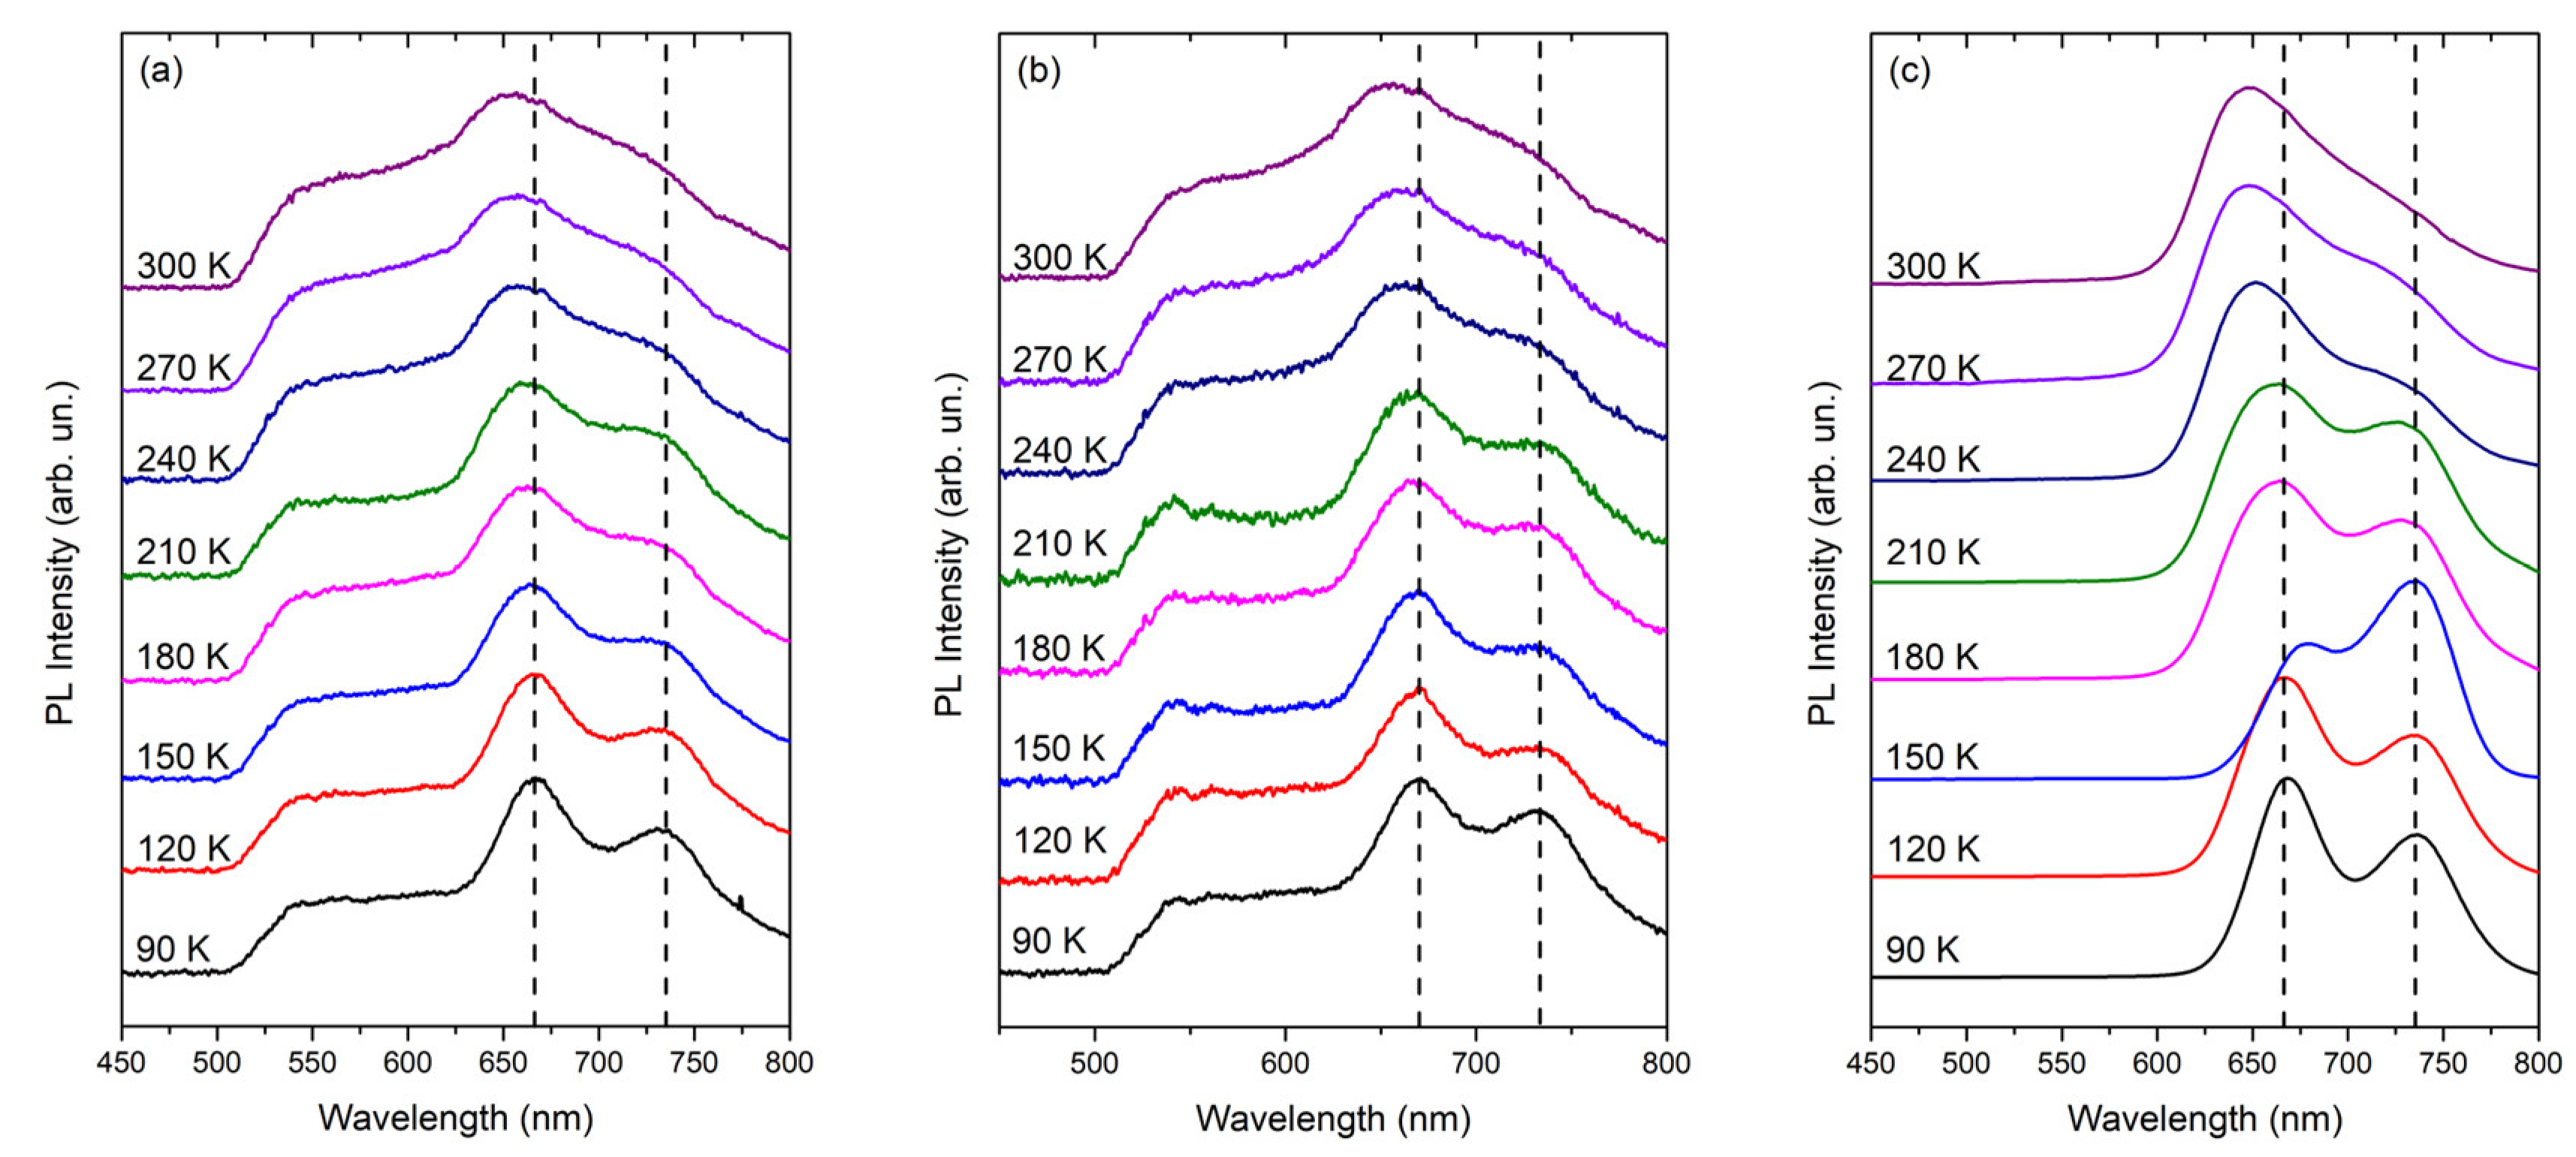
Figure 7.
(a) EE spectra for sample PEDOT:PSS/P3HT:PCBM:RGO at 90 K and (b) at 300 K; (c) Polarization degree, P, anisotropy factors, r, and asymmetry, g, obtained from the Stokes parameters for sample PEDOT:PSS/P3HT:PCBM:RGO at 90 K and (d) at 300 K.
Figure 7.
(a) EE spectra for sample PEDOT:PSS/P3HT:PCBM:RGO at 90 K and (b) at 300 K; (c) Polarization degree, P, anisotropy factors, r, and asymmetry, g, obtained from the Stokes parameters for sample PEDOT:PSS/P3HT:PCBM:RGO at 90 K and (d) at 300 K.
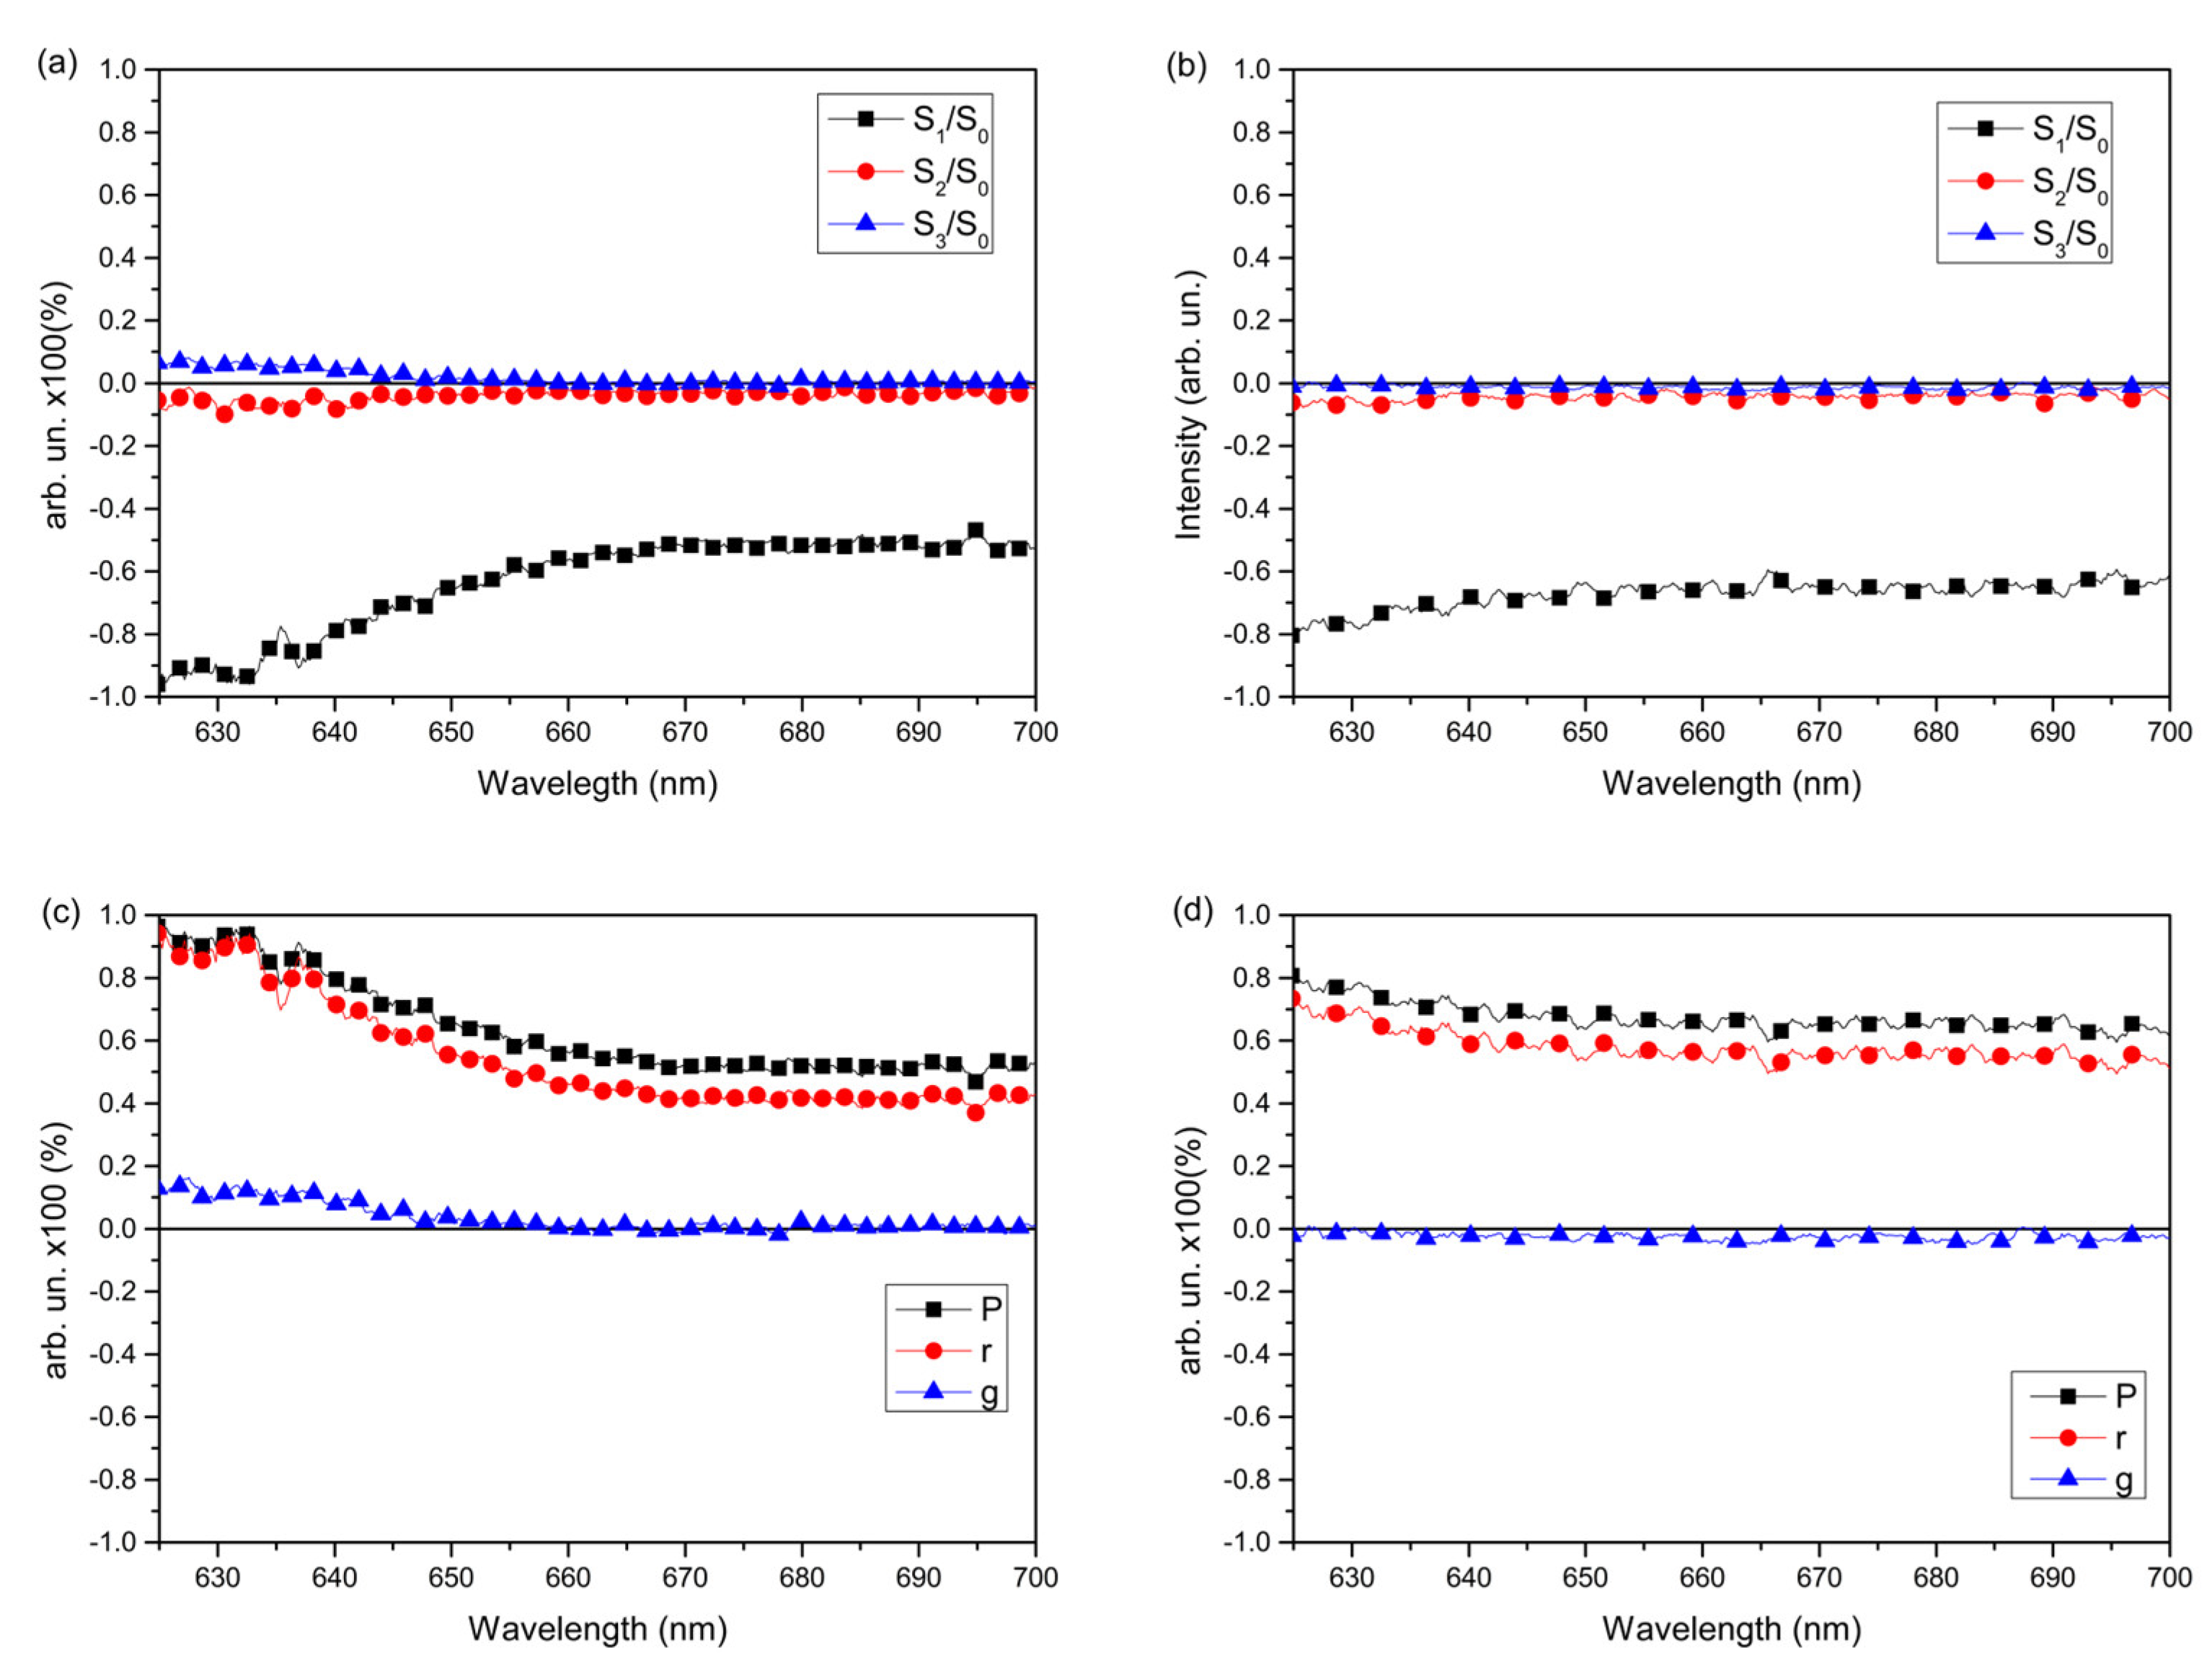
Figure 8.
(a) Polarization degree, P, obtained from the Stokes parameters in different temperatures for samples PEDOT:PSS/P3HT:PCBM:RGO (b) PEDOT:PSS/P3HT:PCBM and (c) PEDOT:PSS/P3HT:RGO; (d) Anisotropy factor, r, for all samples at 300 K.
Figure 8.
(a) Polarization degree, P, obtained from the Stokes parameters in different temperatures for samples PEDOT:PSS/P3HT:PCBM:RGO (b) PEDOT:PSS/P3HT:PCBM and (c) PEDOT:PSS/P3HT:RGO; (d) Anisotropy factor, r, for all samples at 300 K.
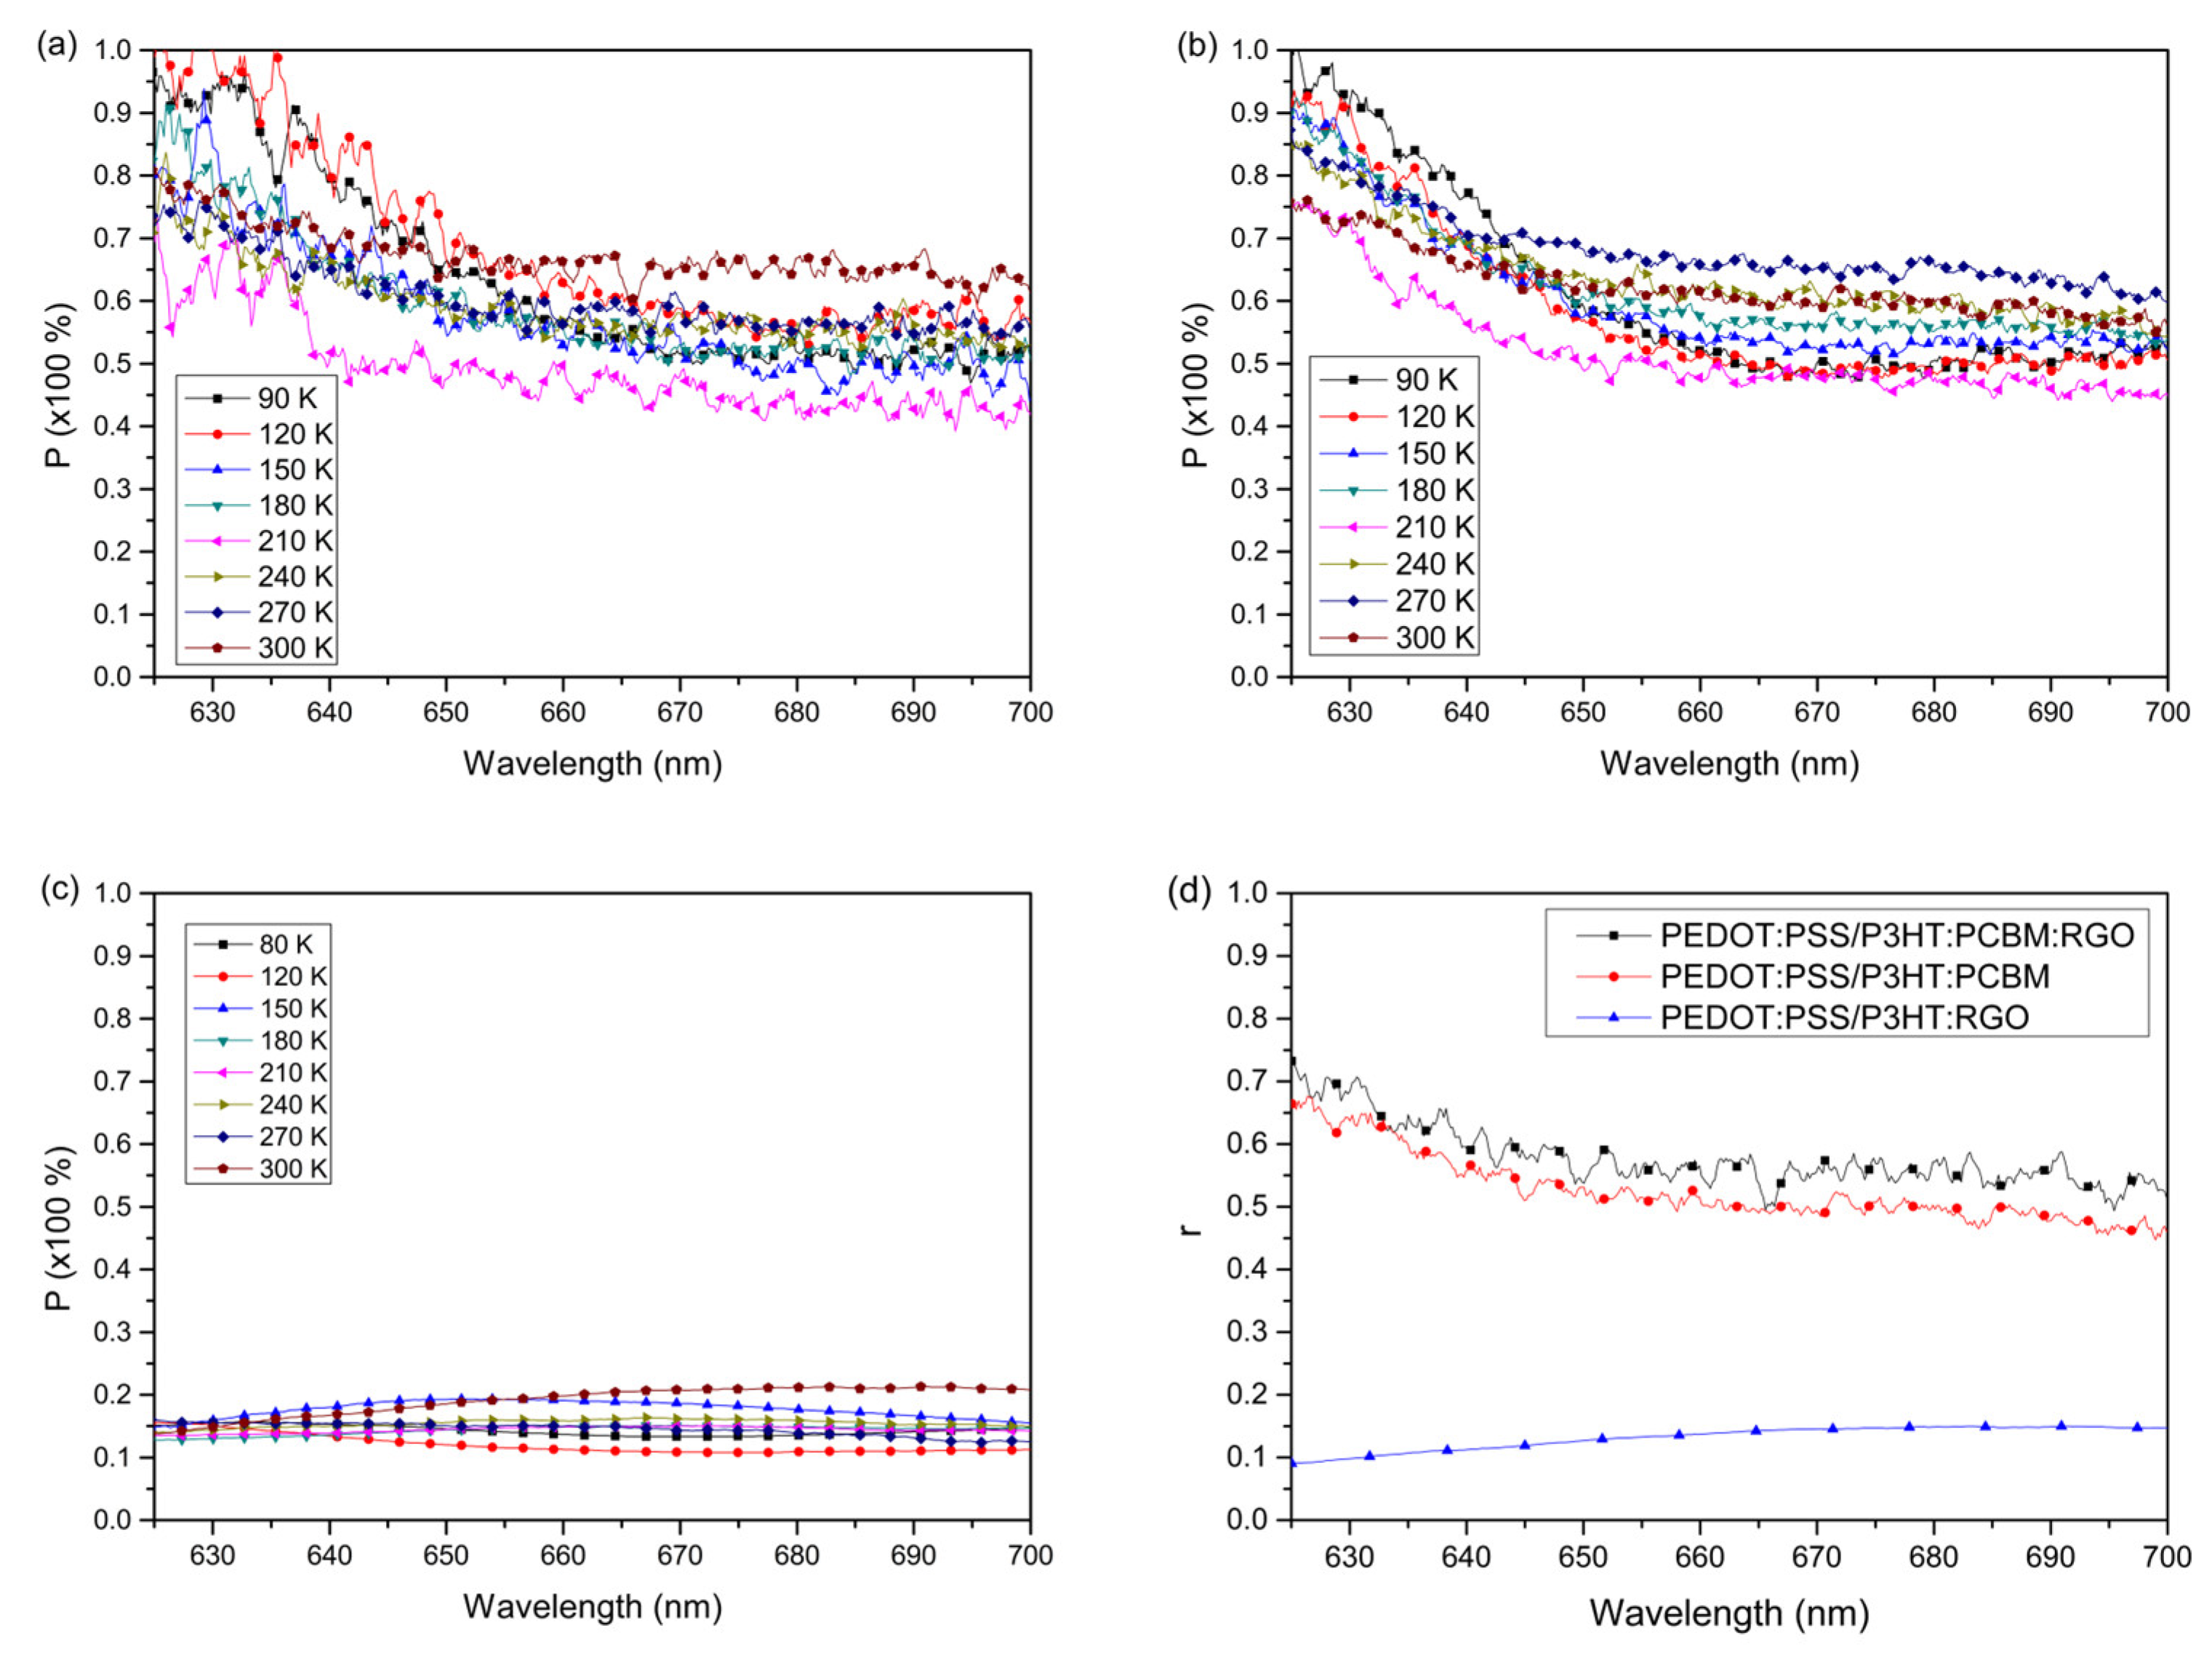

Table 1.
Eonset obtained by UV-Vis spectra.
| Sample | Wavelength (λc) (nm) | Eonset (eV)T |
|---|---|---|
| PEDOT:PSS/P3HT:PCBM | 651 | 1.90 ± 0.09 |
| PEDOT:PSS/P3HT:PCBM:RGO | 660 | 1.88 ± 0.09 |
| PEDOT:PSS/P3HT:RGO | 665 | 1.86 ± 0.07 |
Table 2.
Huang-Rhys parameter (S~I1/I0) for samples PEDOT:PSS/P3HT:PCBM, PEDOT:PSS/P3HT:PCBM:RGO and PEDOT:PSS/P3HT:RGO in different temperatures. I1 and I0 correspond to the PL intensity (Figure 5) for transition II and transition I, respectively.
Table 2.
Huang-Rhys parameter (S~I1/I0) for samples PEDOT:PSS/P3HT:PCBM, PEDOT:PSS/P3HT:PCBM:RGO and PEDOT:PSS/P3HT:RGO in different temperatures. I1 and I0 correspond to the PL intensity (Figure 5) for transition II and transition I, respectively.
| S ~ I1/I0 | |||
|
Temperature (K) |
PEDOT:PSS/ P3HT:PCBM |
PEDOT:PSS/ P3HT:PCBM:RGO |
PEDOT:PSS/ P3HT:RGO |
| 90 | 0.744 | 0.836 | 0.728 |
| 120 | 0.862 | 0.847 | 0.867 |
| 150 | 0.912 | 0.906 | 1.12 |
| 180 | 0.930 | 0.946 | 0.956 |
| 210 | 0.954 | 0.953 | 0.963 |
| 240 | 0.955 | 0.959 | 0.918 |
| 270 | 0.960 | 0.960 | 0.936 |
| 300 | 0.957 | 0.956 | 0.935 |
Table 3.
Difference in energy (eV) between the maximum of Transition I and Transition II of samples PEDOT:PSS/P3HT:PCBM, PEDOT:PSS/P3HT:PCBM:RGO and PEDOT:PSS/P3HT:RGO in different temperatures.
Table 3.
Difference in energy (eV) between the maximum of Transition I and Transition II of samples PEDOT:PSS/P3HT:PCBM, PEDOT:PSS/P3HT:PCBM:RGO and PEDOT:PSS/P3HT:RGO in different temperatures.
| Δν = ν0 - ν1 (eV) | |||
|
Temperature (K) |
PEDOT:PSS/ P3HT:PCBM |
PEDOT:PSS/ P3HT:PCBM:RGO |
PEDOT:PSS/ P3HT:RGO |
| 90 | 0.166 | 0.165 | 0.175 |
| 120 | 0.172 | 0.171 | 0.175 |
| 150 | 0.182 | 0.174 | 0.148 |
| 180 | 0.189 | 0.183 | 0.181 |
| 210 | 0.186 | 0.189 | 0.185 |
| 240 | 0.197 | 0.166 | 0.199 |
| 270 | 0.202 | 0.188 | 0.205 |
| 300 | 0.206 | 0.209 | 0.211 |
Disclaimer/Publisher’s Note: The statements, opinions and data contained in all publications are solely those of the individual author(s) and contributor(s) and not of MDPI and/or the editor(s). MDPI and/or the editor(s) disclaim responsibility for any injury to people or property resulting from any ideas, methods, instructions or products referred to in the content. |
© 2024 by the authors. Licensee MDPI, Basel, Switzerland. This article is an open access article distributed under the terms and conditions of the Creative Commons Attribution (CC BY) license (http://creativecommons.org/licenses/by/4.0/).
Copyright: This open access article is published under a Creative Commons CC BY 4.0 license, which permit the free download, distribution, and reuse, provided that the author and preprint are cited in any reuse.


