1. Introduction
Indium Nitride (InN) is an intriguing and very important although relatively less known, semiconductor. Its importance is related to revolutionary development of InGaN based light sources – Light Emitting Diodes and Laser Diodes [
1], awarded by the Nobel Prize in physics’2014 [
2]. Until 2002 InN has been considered as a wide bandgap (about 2 eV) member of the III-N semiconductor family including GaN, AlN and BN. Due to significant improvements in high purity molecular beam epitaxy (MBE) of InN, it was convincingly demonstrated that the bandgap of high structural quality pure InN is as low 0.64eV [
3,
4]. Therefore the energy spectrum covered by III-N semiconductors: E
g(InN) = 0.64 eV, E
g(GaN) = 3.47 eV [
5,
6], E
g(AlN) = 6.08 eV [
7] and E
g(wBN) = 6.39 eV [
8] became even more interesting extending from far infrared to ultraviolet spectral range. Moreover, the electron effective mass m
*(InN) = 0.07m
0 [
4], corresponding to the “new” energy gap is much smaller than that of the other nitrides: GaN - m
*(GaN) = 0.20m
0 or AlN - m
*(AlN)=0.32m
0 [
4]. It indicates a possibility of hosting very high mobility electron gas in the InN crystal. However, the growth of InN single crystals is still a challenge due to specific thermodynamic properties of this nitride.
InN crystal is relatively soft despite it contains atomic nitrogen. The InN bonding is less covalent and more ionic as well as much weaker than in the other nitrides what is reflected in larger lattice constants and much smaller bandgap in InN [
4]. Therefore, as you would expect, the thermodynamic properties of the In-N system are affected by both strong triple bonding in N
2 molecule lowering the free energy of the In+N
2 system, and relatively weak bonding of the InN crystal [
9,
10]. That leads to very high pressures of nitrogen at relatively low temperatures along the InN(s)-In(l)-N
2(g) triple phase stability line [
11]. In addition, the solubility of nitrogen in liquid indium is extremely low so the growth of InN bulk crystal from indium solution is difficult [
11,
12]. As a consequence, large bulk crystals of InN have not been grown so far and due to the lack of high quality reference material, experimental investigations of exciting physical properties of InN are difficult.
An interesting route facilitating the efforts towards crystallization of InN and also providing valuable insight into the physical properties of the InN(s)-In(l)-N
2(g) system could be obtained from molecular dynamics (MD) ab initio simulations. In this study, we introduce the ab initio MD simulations as a potential tool to evaluate phase behavior of InN in wide pressure and temperature range. It can be useful for further exploration of phase diagram of InN: its experimental verification and its use as a background for crystal growth. An additional, encouraging motivation was a very reasonable agreement of the proposed approach with the experimental data we achieved recently for GaN [
13].
1.1. Phase Diagram of InN
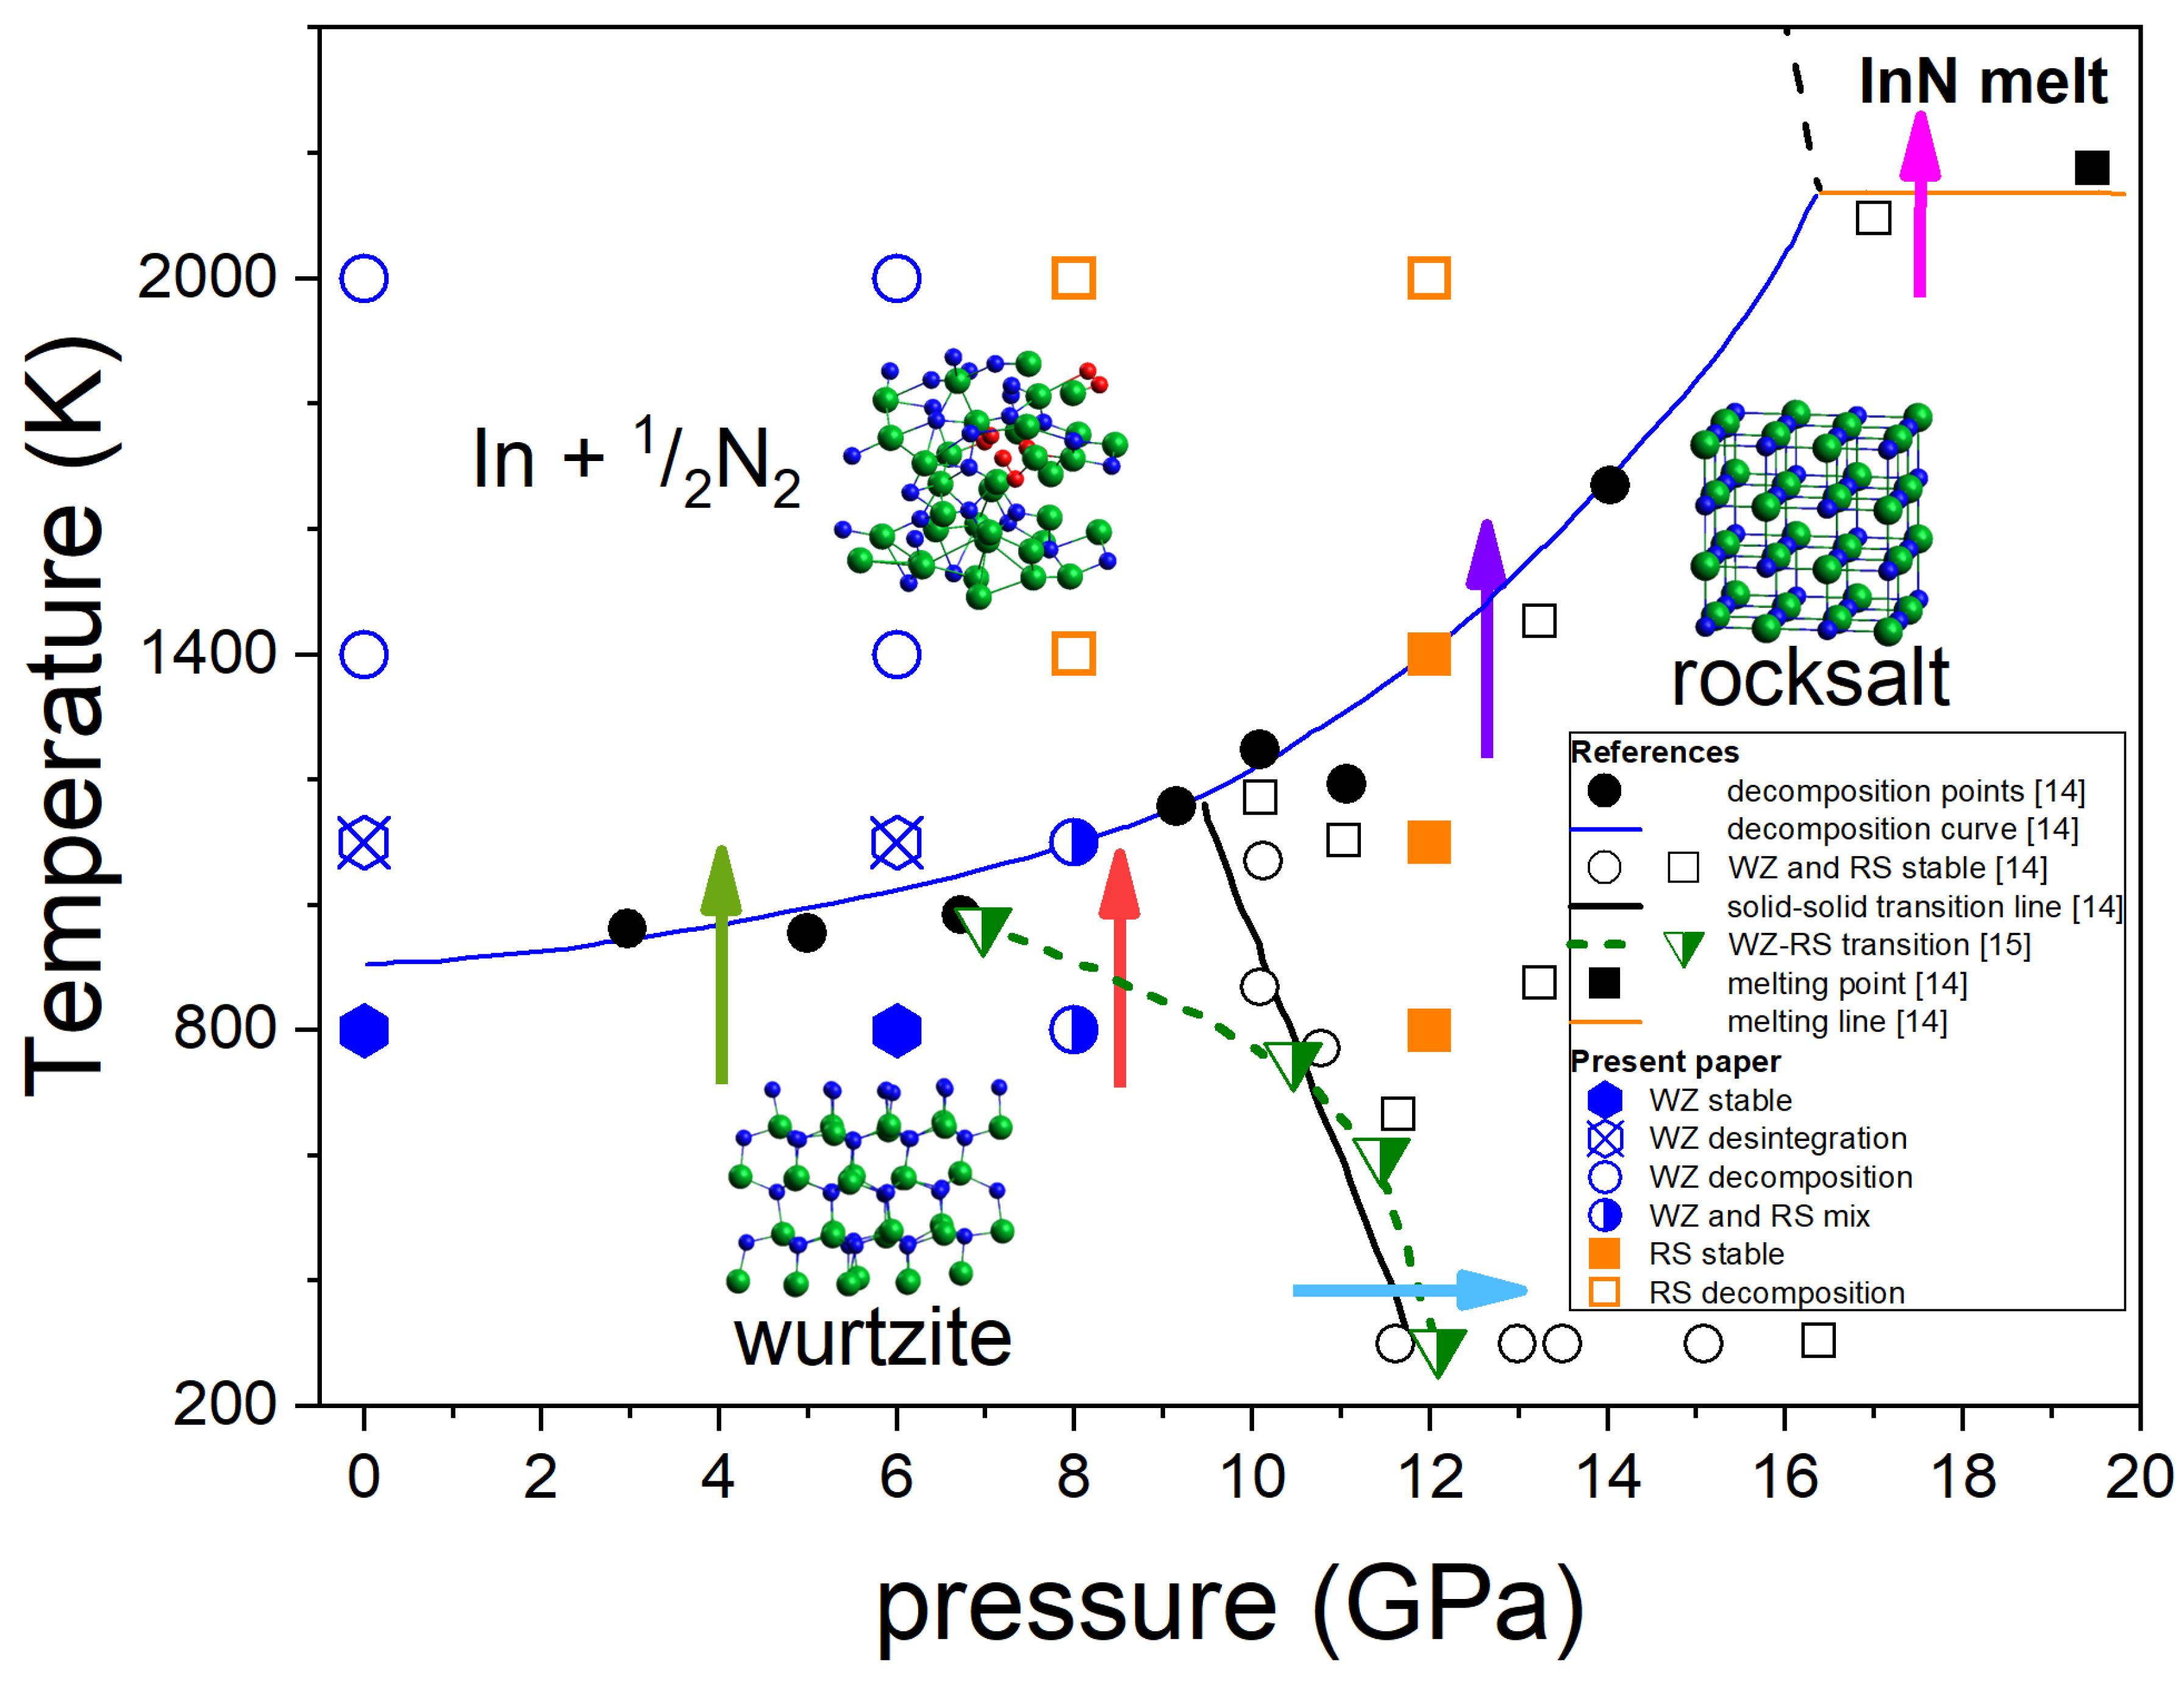
Figure 1 summarizes the most consistent experimental data on the InN p-T phase diagram obtained by Saitoh et al. [
14] and Soignard et al. [
15] based on the
in situ X-ray diffraction (XRD) measurements at high pressure – high temperature conditions.
The diagram shown in
Figure 1 indicates the following behaviour of InN:
At the lower pressure range (up to 7-10 GPa) InN decomposes when heated above approx. 710 °C [
8] - green arrow in
Figure 1. It was also confirmed by our earlier differential thermal analysis (DTA) experiments up to 2 GPa [
12] at high pressure of N
2 gas. The independence of decomposition temperature on pressure suggests that the equilibrium temperatures in the InN-In-N
2 system can be even lower than the measured ones.
At 12 GPa (low T) to 7-10 GPa (high T), a structural phase transition from hexagonal wurtzite to cubic rocksalt phase induced by increasing pressure is observed - blue arrow in
Figure 1. The borderline between the two solid phases is inclined towards lower pressures however different linear or non-linear character of this line follows from XRD experiments reported in [
14] and [
15], respectively. A possible verification could be checking if at i.e. 8 GPa the InN crystal in its wurtzite phase transforms into rocksalt at heating to 800–1000 K – red arrow in
Figure 1.
The InN crystal in its high pressure rocksalt phase also decomposes at high temperatures but the decomposition temperature strongly increases with increasing pressure – violet arrow in
Figure 1.
The decomposition is suppressed only at pressure as high as > 16 GPa and then the congruent melting of InN (without formation of N
2 thus reversible) is possible – magenta arrow in
Figure 1.
In the next sections we explore by the ab initio MD simulations the following phase transitions of InN:
wurtzite-to-rocksalt structural phase transition induced by high pressure (blue arrow);
wurtzite-to-rocksalt structural phase transition induced by high temperature at 8 GPa (red arrow);
Thermal decomposition of InN crystal in both wurtzite and rocksalt phases (green and violet arrow, respectively).
In this paper, special attention is given to the determination of the p-T stability range of InN in its wurtzite modification, which is particularly important for the design of future crystallisation experiments in high-pressure reactors with high volume routinely used for diamond or BN growth. Congruent melting of InN (magenta arrow in
Figure 1) was not considered.
2. The Simulation Method
Temporal evolution by the
ab initio MD simulations requires a huge amount of calculations which is challenging because at each time step, the solutions of full quantum mechanical problem via density functional theory (DFT) Kohn-Sham equations have to be obtained [
16]. The forces acting on each atom in the system, are obtained via Hellmann-Feynman theorem used for time integration of MD time evolution equations [
17]. The standard time step, 0.2 fs long, was employed in this study. Total simulation time lasted 30 000 steps, that was carried out for each p,T set. For the time dependent MD calculations the optimal choice is Verlet integration algorithm [
17] that is precise to fourth order in the time step length. This algorithmically simple method requires a single evaluation of the force acting on each atom at every time step thus it is the most effective numerically. The Verlet algorithm is implemented in the time dependent simulations in SIESTA (Spanish Initiative for Electronic Simulations of Thousands of Atoms) DFT package selected for our simulations [
18]. The solution of nonlinear Kohn-Sham equations is expressed as sum of finite radius pseudo-atomic orbital functions set [
19] that is reduced in number by application of the Troullier-Martins norm-conserving nitrogen and indium pseudopotentials in the Kleinmann-Bylander formulation [
20,
21]. The exchange-correlation energy was approximated by Perdew-Burke-Ernzerhof functional developed for solid and surface calculations (PBEsol) [
22]. The solutions of the Kohn-Sham nonlinear equations were obtained by self-consistent field (SCF) loop, terminated when the maximum difference between two consecutive values of all elements of the density matrix fell below 10
-4.
In the reported simulations, the finite size InN 3×3×2 supercell was used containing total 72 indium and nitrogen atoms, arranged in the hexagonal wurtzite lattice. In some cases intentionally, the initial arrangement of In-N atoms in the ideal cubic rocksalt lattice stable at high pressures [
14,
15], was used. Periodic boundary conditions were imposed for atom motion, pseudopotentials and electric potential. For the considered systems, the Brillouin zone k-integration was replaced by sum over 3×3×3 Monkhorst-Pack k-point mesh. The initial supercells used in our study are presented in
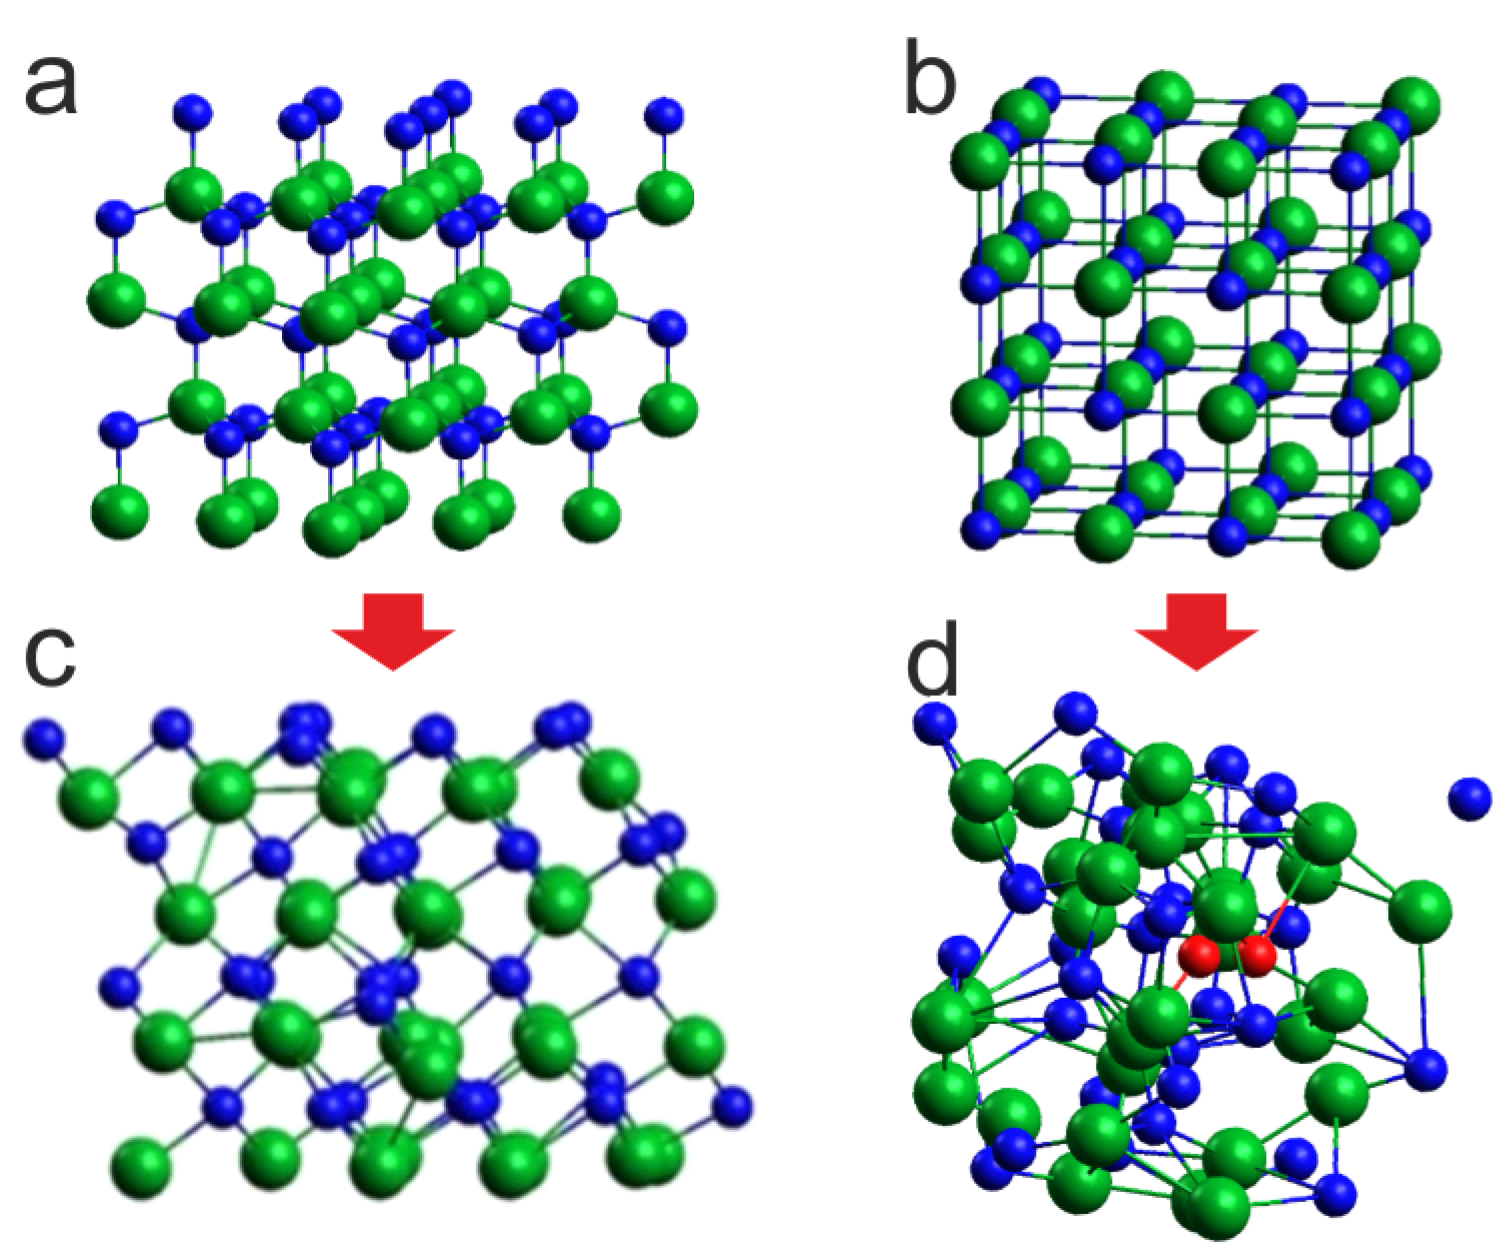
Figure 4a and b.
The parameterization of the equations and solution basis was verified by direct comparison to the experimental data for wurtzite InN, gaseous N
2 and pure In. The
ab initio lattice parameters of wurtzite InN are
Å and
Å that remain in a very good agreement with the x-ray data:
Å and
Å [
23], respectively.
The calculated dissociation energy and bond length of the N
2 molecule were
eV and
Å, in a good agreement with the experimental
eV [
24] and
Å [
25], respectively.
The properties of metallic indium were evaluated including density and cohesive energy. The ab initio energy of In atomization was
(In) = 2.39 eV/atom, close to the experimental value of vaporization enthalpy
= 2.35 eV/atom [
26]. The density of the In liquid at the melting temperature T
m(In) = 156.6 °C, is
(In) = 7.02 g/cm
3 which is comparable with the ab initio simulation result:
(In) = 7.05 g/cm
3.
For the time-integration procedure in the imposed NVT conditions i.e. corresponding to the Canonical Ensemble, the Nose-Hoover thermostat for temperature stabilization [
27,
28] was employed. From the initial setup of atoms in the form of the wurtzite/rocksalt InN lattice (
Figure 1), the target temperature was achieved by rescaling the velocities of all atoms to the kinetic energy obtained from equipartition principle for a selected temperature T. The molecular pressure was determined using Irving-Kirkwood formula [
29]. More details related to the ab initio MD simulations of nitrides may be found in Ref. [
13]. The pressure – temperature conditions used in this study are included into
Figure 1.
3. Result and Discussion
3.1. Pressure Induced Solid-Solid Phase Transition at Low Temperature
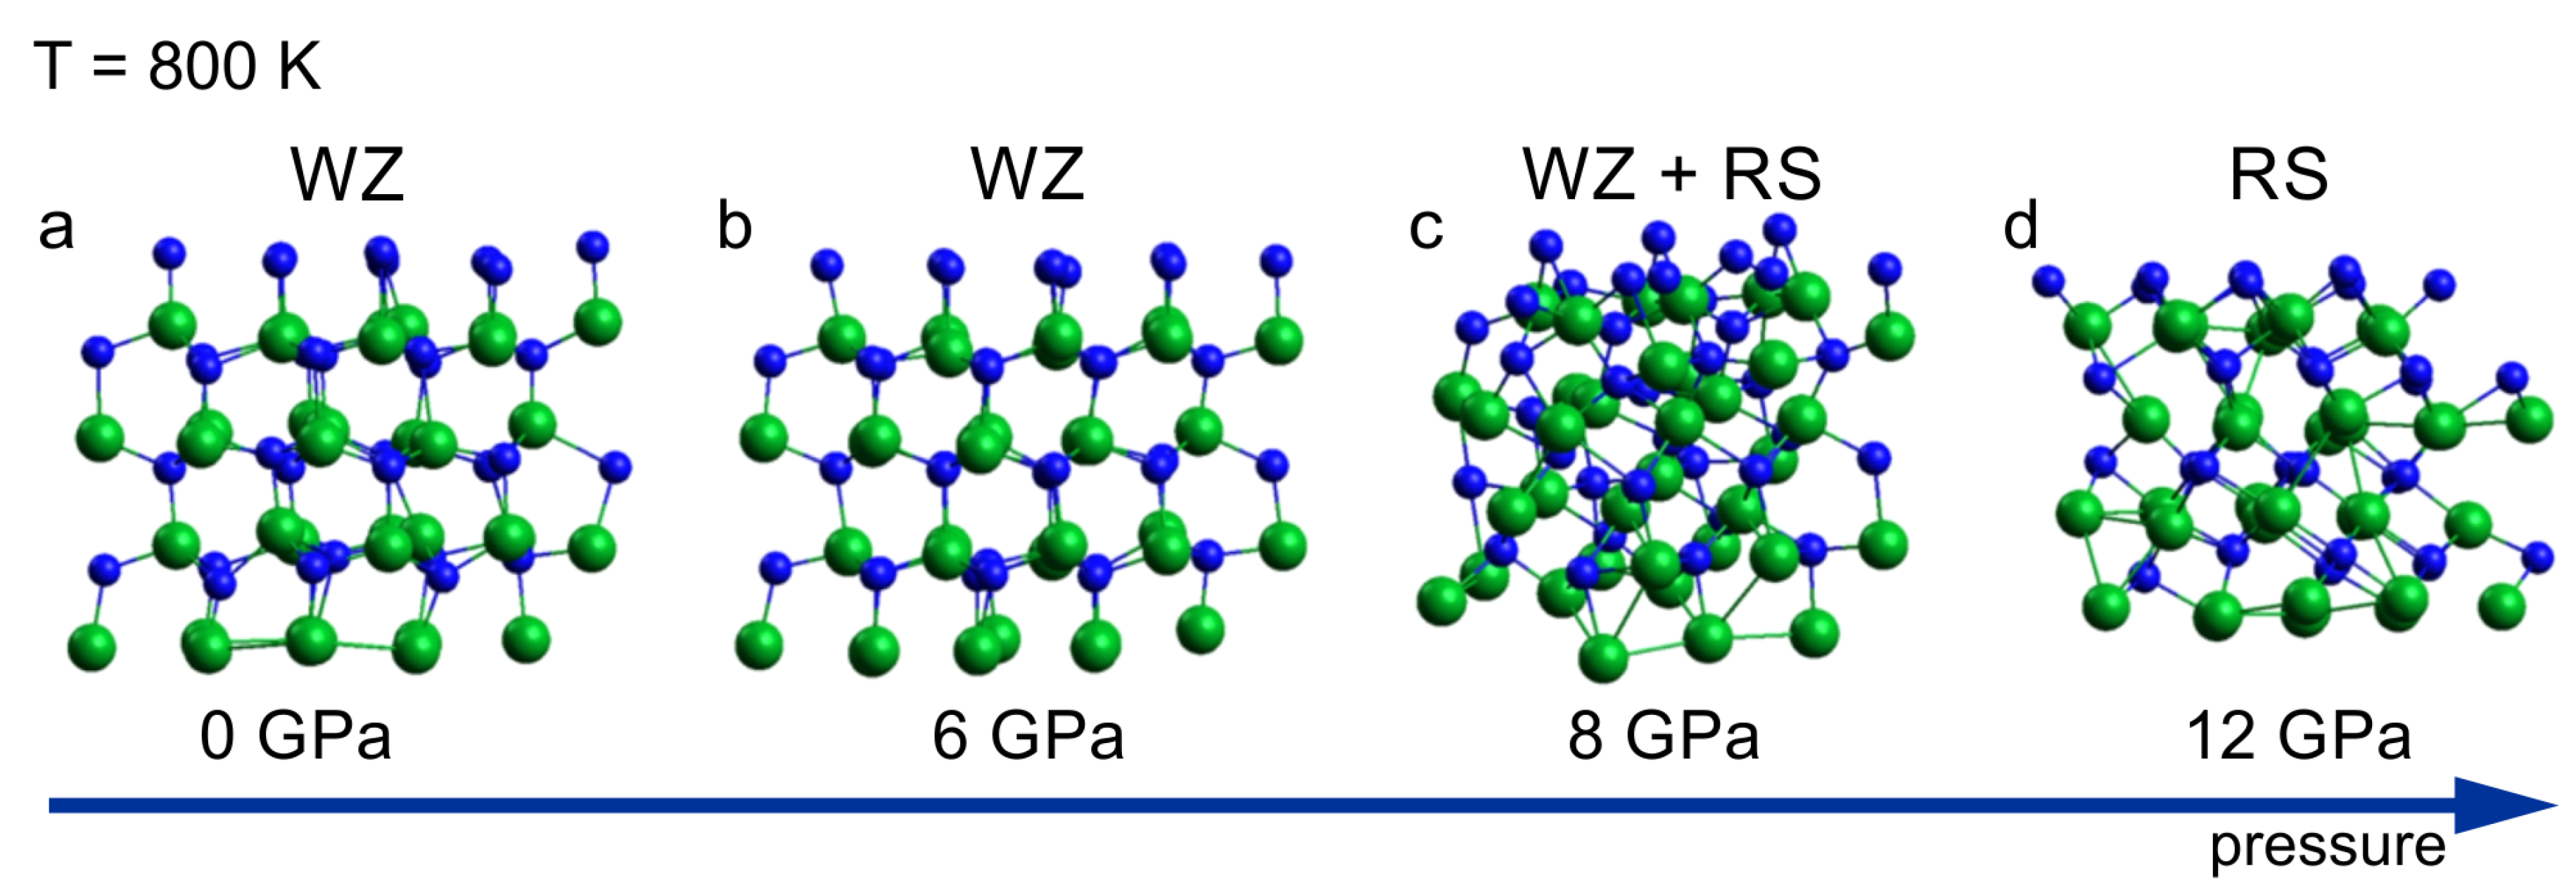
A sequence of the InN clusters annealed at 800 K for a period of 6 ps, at different pressure, is shown in
Figure 2. The sequence illustrates the wurtzite – rocksalt structural phase transition starting at pressure of 8 GPa. The structure identification is based on the analysis of coordination numbers in the cluster presented in
Figure 2c in which both 4 fold (wurtzite) and 6 fold (rocksalt) coordination spheres were found. The transition pressure of 8 GPa is lower than the one following from the high pressure XRD experiments (10-11GPa) [
14,
15]. The possible causes for this disagreement are hidden in both theoretical and experimental approaches. The mixed coordination observed at the transition point (8 GPa, 800 K) suggests a “nucleation – growth” mechanism of the structural transformation. Therefore a hysteresis is expected what is indeed observed in the experiments making the relation between theoretical and experimental transition pressure values, consistent. Moreover, intrinsic errors in both the simulations and the measurements have to be taken into account.
According to the simulation, at 12 GPa the crystal is fully converted into its high-pressure rocksalt phase –
Figure 2d, as confirmed by the coordination analysis, which is in agreement with the experimental data.
Since in the simulation the NVT Canonical Ensemble has been used where pressure was a function of the NVT set, and remembering that the pressure induced wurtzite – rocksalt phase transition includes a significant change of the InN volume [
14], the pressure trajectory during the simulation has to be analyzed. The analysis for the wurtzite – rocksalt transition during 6ps indicated an averaged pressure decrease not bigger than 300MPa at intrinsic pressure value scattering of
500 MPa.
3.2. Temperature Induced Solid-Solid Phase Transition at 8 GPa
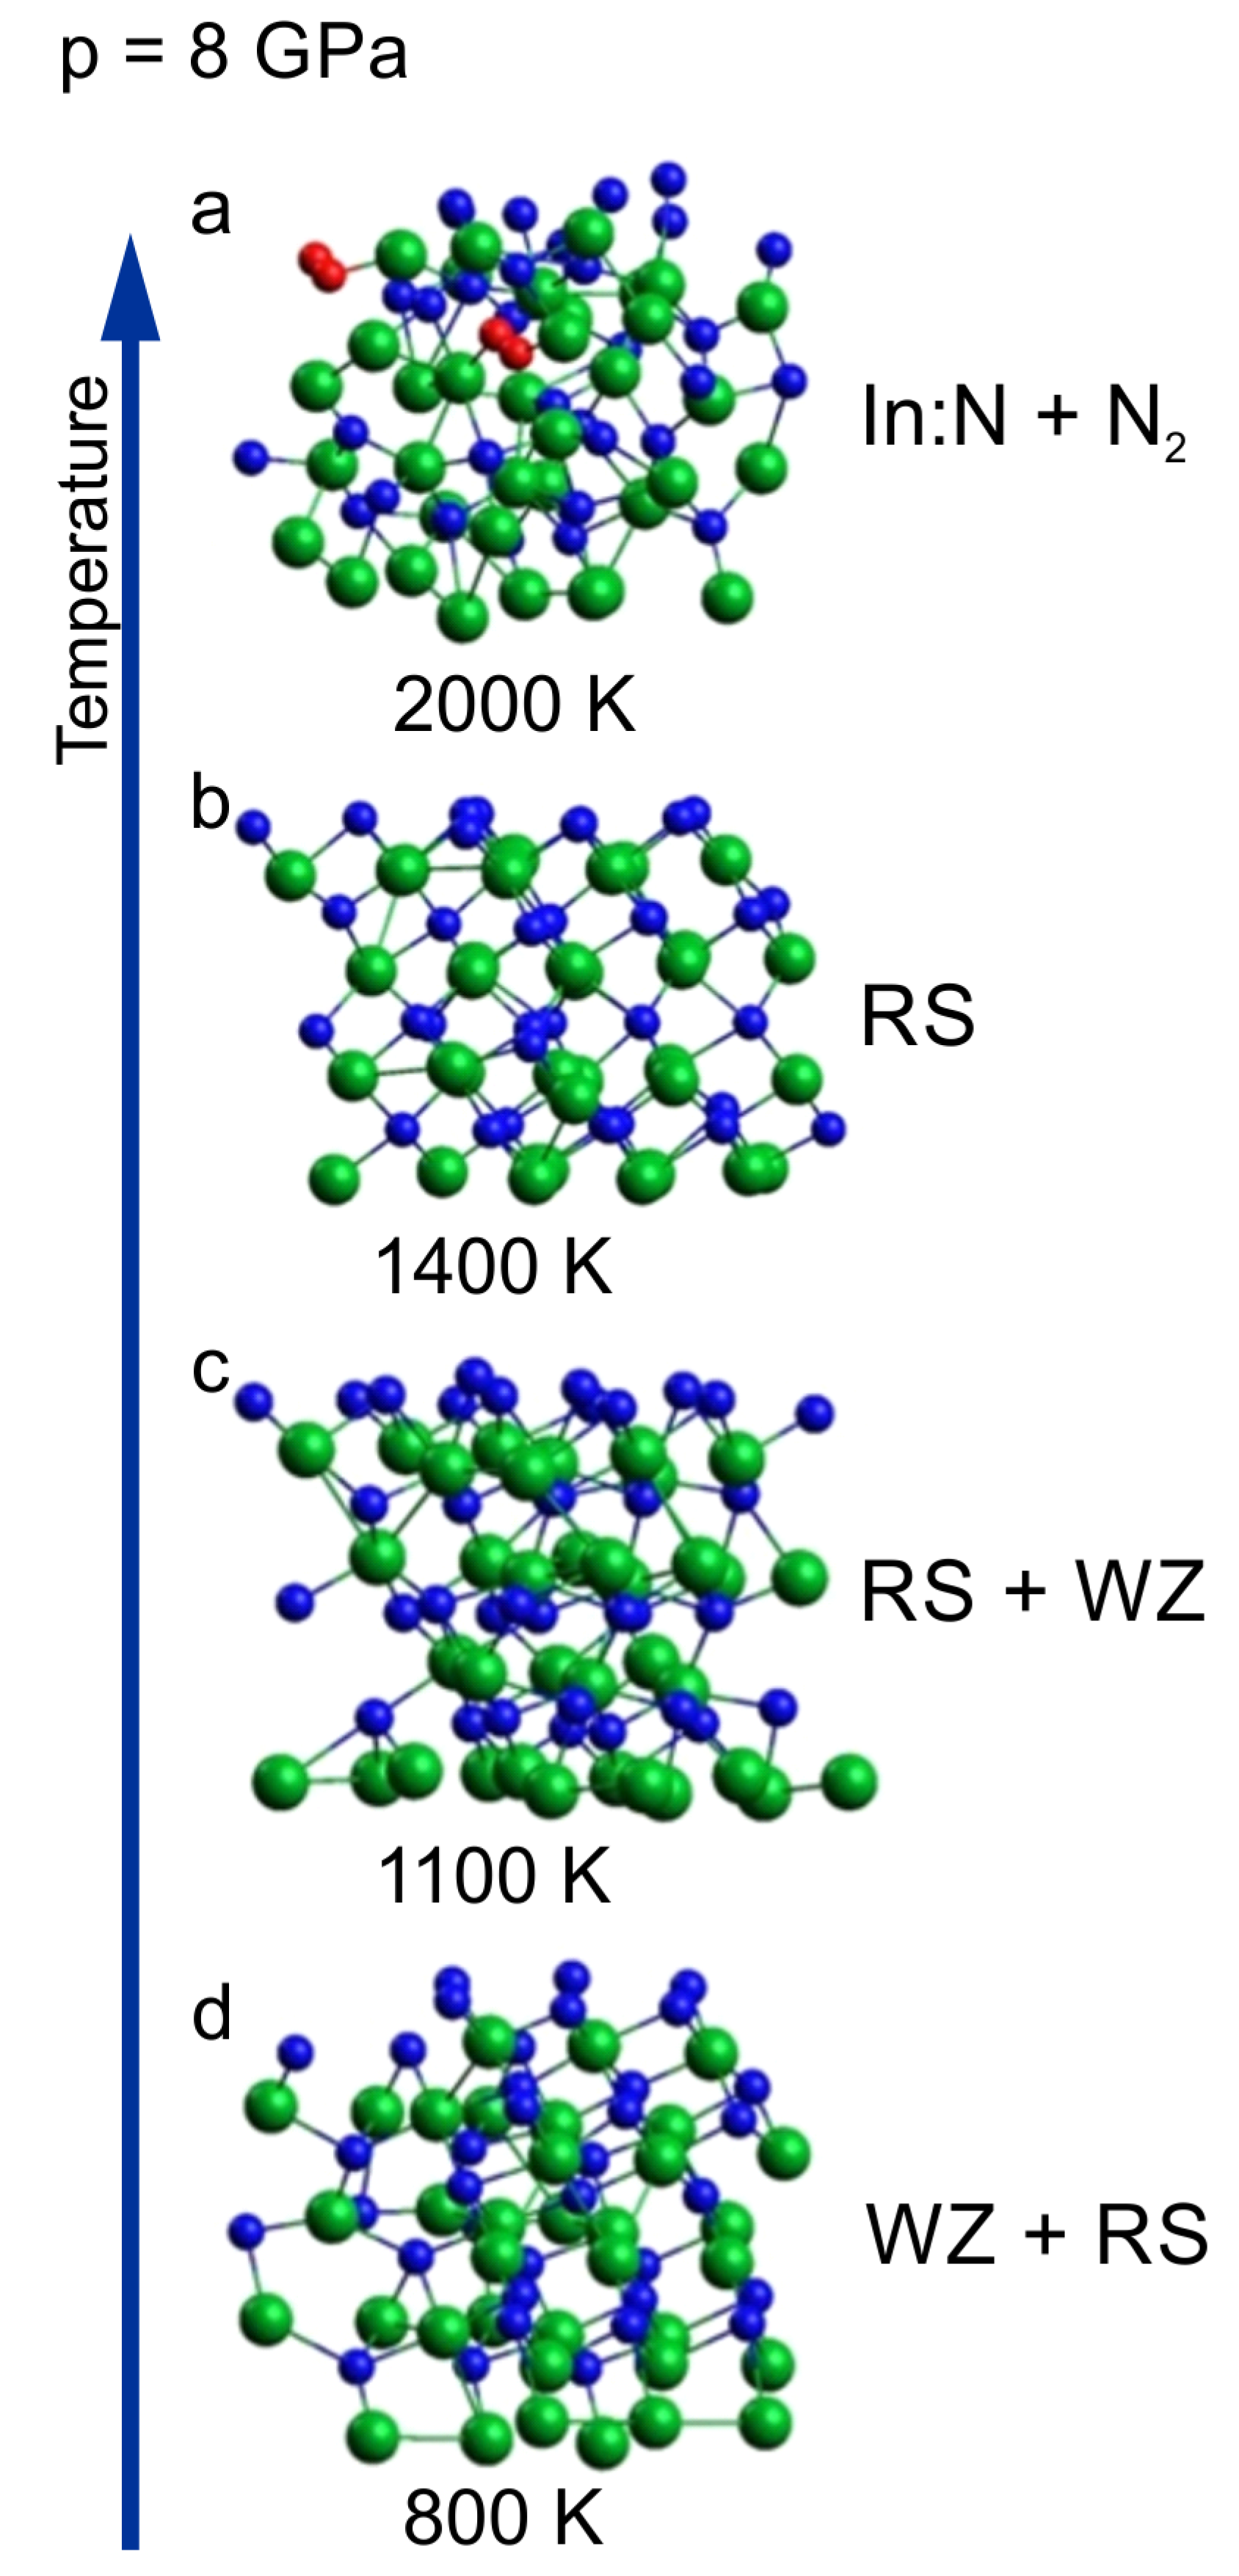
In
Figure 3 we have shown a sequence of clusters corresponding to 8 GPa and different temperatures ranging from 800 to 2000 K. The initial supercell was wurtzite,
Figure 4a.
The sequence starts from the cluster with mixed coordination already presented in
Figure 3c as a border case between wurtzite and rocksalt phases at 800 K. With increasing temperature (1100 K and 1400 K), an ordering towards cubic rocksalt phase is clearly visible which confirms that the borderline between the two solid phases is negatively inclined and rather non-linear like it was suggested in [
15].
For the highest temperature of 2000 K, the crystalline order is lost and the crystal decomposes with the formation of N2 molecules (decomposition process is analyzed in the next sub-section).
Given that at 8 GPa and 1100 K the phase of InN clearly evolves towards rocksalt, we decided it would be more consistent for 1400 K and 2000 K, to start the simulations from the initial supercell in the rocksalt structure,
Figure 4b. The corresponding comparison for 1400 K is shown in
Figure 4.
Figure 4.
Effect of 6 ps virtual annealing at 8 GPa and 1400 K on the InN cluster: c – with initial wurtzite supercell (a), d – with initial rocksalt supercell (b), green balls – indium atoms, blue balls – nitrogen atoms, red balls - nitrogen atoms forming N2 molecules.
Figure 4.
Effect of 6 ps virtual annealing at 8 GPa and 1400 K on the InN cluster: c – with initial wurtzite supercell (a), d – with initial rocksalt supercell (b), green balls – indium atoms, blue balls – nitrogen atoms, red balls - nitrogen atoms forming N2 molecules.
The situations are quite different: for the initial supercell in wurtzite, its conversion to the rocksalt structure with no signs of lattice disintegration is visible whereas for the initial supercell in rocksalt, the lattice is thermally destabilized and moreover, N2 molecules start to emerge what is in agreement with the experimental observations. It indicates that for the applied simulation algorithm and time scale it is reasonable to start the virtual heating of the crystal avoiding structural phase transition during thermal evolution of the system.
3.3. Decomposition of InN
The experimental diagram of InN phase stability (metastability?) shown in
Figure 1, indicates that the crystal should decompose at high temperatures to indium and N
2 at pressure up to approx. 16 GPa. In the XRD experiments [
14] the thermal decomposition was reflected by irreversible disappearance of the XRD spectral features of the InN crystalline phases. In contrast, at pressure of 19.2 GPa the XRD spectrum corresponding to the rocksalt InN crystal lattice also disappeared however at cooling, its recovery has been observed. Therefore it was suggested that there was a sign of congruent melting of InN and that the congruent melting of InN is possible only in for the rocksalt high pressure phase due to the wurtzite InN decomposition before reaching its melting point in whole pressure range of the wurtzite InN stability.
The
ab initio MD simulations reproduced the thermal decomposition of InN in terms of the crystal lattice destruction and formation of N
2 molecules.
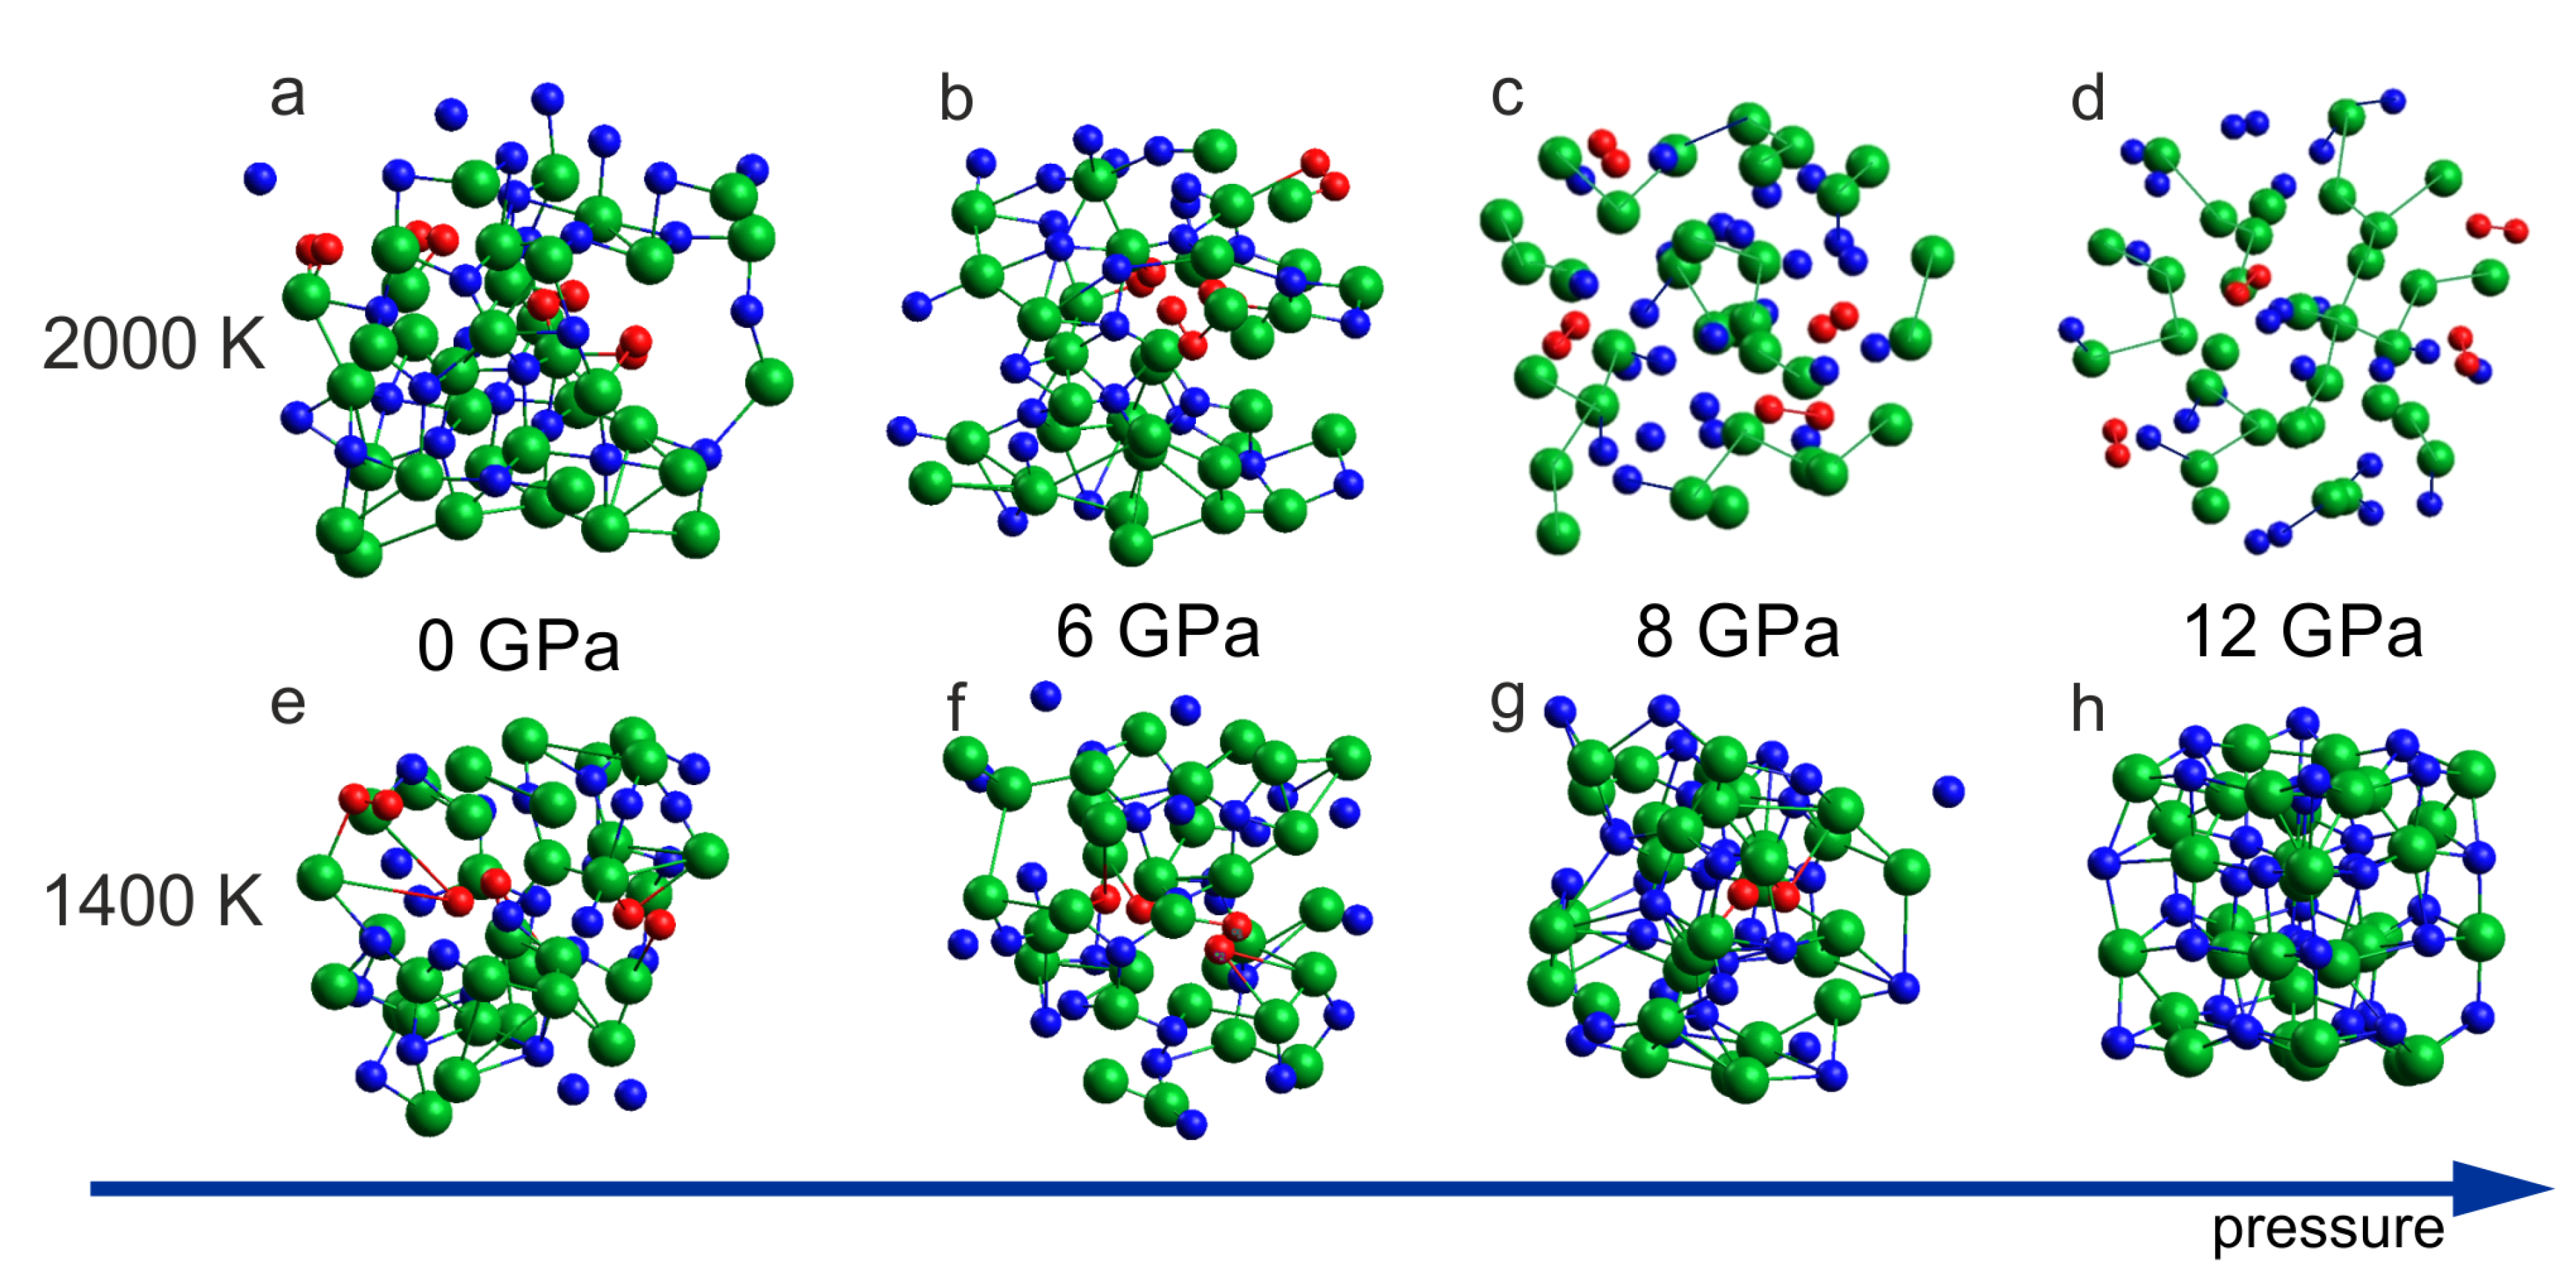
Figure 5abcd including the results for 2000 K demonstrates formation of the N
2 dimers for all considered pressure conditions: 0 GPa, 6 GPa, 8 GPa and 12 GPa. At lower temperature, T = 1400 K, the decomposition with N
2 formation was observed for 0 GPa, 6 GPa and 8 GPa but for 12 GPa, the formation of N
2 molecules was suppressed (
Figure 5h) and the rocksalt structure was preserved. It suggests that at T = 1400 K, the InN crystal (rocksalt) is stable at p = 12 GPa and unstable at p = 8 GPa what is in a very good agreement with experimental suggestions illustrated in
Figure 1.
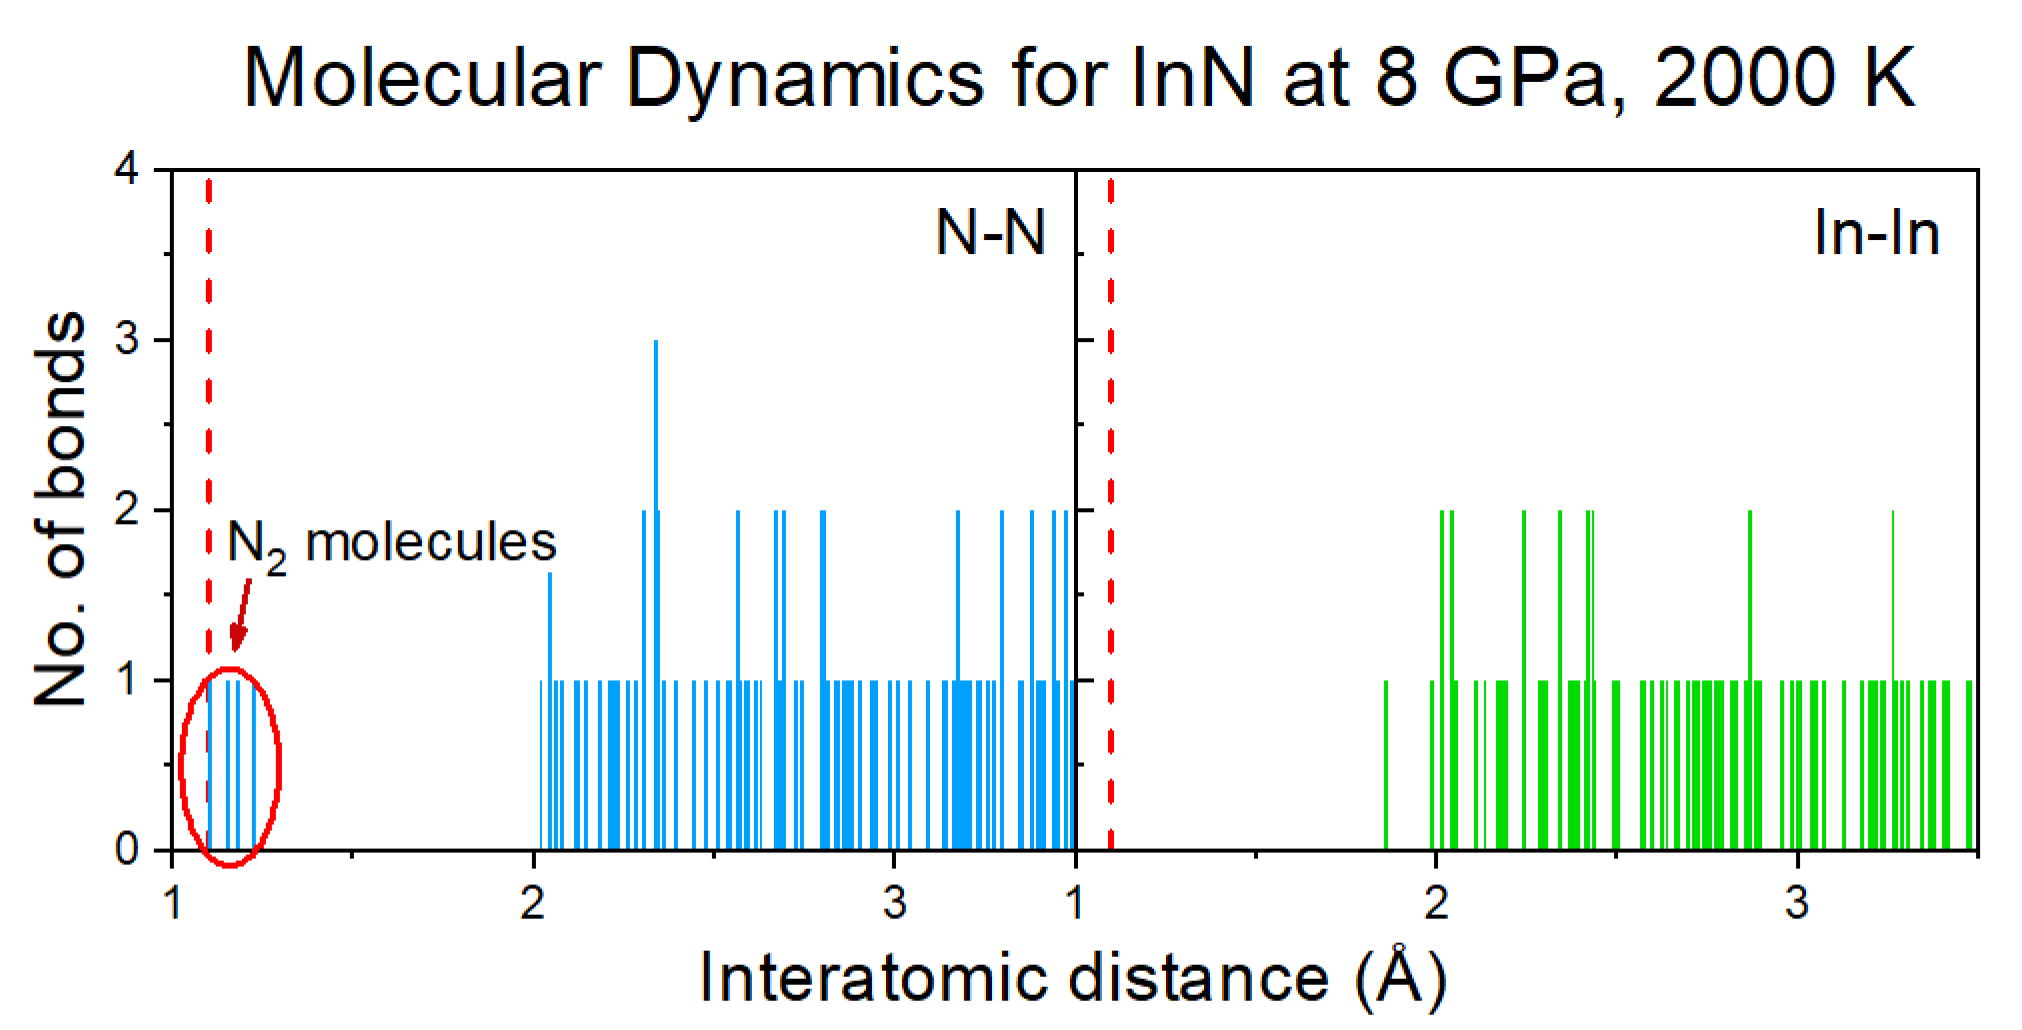
The formation of N
2 molecules was identified by the analysis of distribution of interatomic distances between nitrogen atoms (
Figure 6) and further confirmed by the Crystal Orbital Hamilton Population (COHP) analysis of the selected pairs of nitrogen atoms [
30,
31].
4. Summary and Outlook
The reported
ab initio MD approach simulates both pressure and temperature induced structural phase transitions of InN. The results show that the wurtzite-rocksalt borderline is negatively inclined and nonlinear like it follows from [
15] but is not supported by [
14]. The experimental verification of this controversy is strongly needed for precise evaluation of the wurtzite InN stability range. Then the optimum temperature and corresponding pressure can be found and explored for crystallization of the nitride.
Interestingly, thermal decomposition of InN with formation of N
2 molecules was identified in the simulation what is a great advantage of the ab initio MD. The approach could be especially useful for evaluation of the still unknown melting curve of InN for which suppression of the N
2 formation is expected. For high temperatures (
1400 K) expected for melting, the relatively short simulation time of 6 ps is sufficient to complete the relevant transitions. For the InN melting experiments, the laser heated diamond anvil cell technique coupled with XRD, EXAFS or Raman spectroscopy i.e. [
32] will be used.
J.P.—ab initio calculations; S.K.—thermodynamics modeling, supervising theory, manuscript preparation; B.S.—concept, experiment planning and supervising, manuscript preparation; P.S.—experimental N-in-Fe solubility evaluation; S.P.—data analysis, critical evaluation of the manuscript; I.G.—concept, data analysis, manuscript preparation. All authors have read and agreed to the published version of the manuscript.
Author Contributions
Conceptualization, J.P., S.K., S.P. and IG; methodology, J.P. and S.K.; software, J.P.; validation, S.K., P.S., S.P. and I.G.; formal analysis, S.K, B.S. and I.G.; investigation, J.P., S.K. B.S., P.S., S.P. and I.G.; resources, J.P. and B.S.; data curation, J.P., P.S and B.S.; writing—original draft preparation, J.P., S.K., B.S. and I.G.; writing—review and editing, S.K., P.S., S.P. and I.G.; visualization, J.P., B.S. and I.G.; supervision, S.K. and I.G.; funding acquisition, J.P. All authors have read and agreed to the published version of the manuscript.
Funding
This research has been supported by computational grant no. PLG/2023/016622 (PLGrid - HPC Centers: Academic Computer Centre Cyfronet, AGH University of Science and Technology) and the LUMI consortium through grant no. PLL/2023/04/016456 (EuroHPC Joint Undertaking, hosted by CSC (Finland)).
Data Availability Statement
The raw data supporting the conclusions of this article will be made available by the authors upon reasonable request.
Acknowledgments
In this section you can acknowledge any support given which is not covered by the author contribution or funding sections. This may include administrative and technical support, or donations in kind (e.g., materials used for experiments).
Conflicts of Interest
The authors declare no potential conflicts of interest.
References
- Kour, R.; Arya, S.; Verma, S.; Singh, A.; Mahajan, P.; Khosla, A. Review—Recent Advances and Challenges in Indium Gallium Nitride (InxGa1-xN) Materials for Solid State Lighting. ECS J. Solid Stat. Sci. Technol. 2019, 9, 015011. [Google Scholar]
- Nobelprize.org. The Nobel Prize in Physics 2014, 2014.
- Davydov, V.Y.; Klochikhin, A.A.; Emtsev, V.V.; Kurdyukov, D.A.; Ivanov, S.V.; Vekshin, V.A.; Bechstedt, F.; Furthmuller, J.; Aderhold, J.; Graul, J.; Mudryi, A.V.; Harima, H.; Hashimoto, A.; Yamamoto, A.; Haller, E.E. Band Gap of Hexagonal InN and InGaN Alloys. phys. stat. sol. (b) 2002, 234, 787–795. [Google Scholar] [CrossRef]
- Wu, J. When group-III nitrides go infrared: New properties and perspectives. J. Appl. Phys. 2009, 106, 011101. [Google Scholar] [CrossRef]
- Bougrov, V.; Levinshtein, M.E.; Rumyantsev, S.L.; Zubrilov, A. Gallium Nitride (GaN). In Properties of Advanced Semiconductor Materials GaN, AlN, InN, BN, SiC, SiGe; Levinshtein, M.E., Rumyantsev, S.L., Shur, M.S., Eds.; John Wiley & Sons, Inc.: New York, 2001; book section 1, pp. 1–30. [Google Scholar]
- Zubrilov, A. Indium Nitride (InN). In Properties of Advanced Semiconductor Materials GaN, AlN, InN, BN, SiC, SiGe; Levinshtein, M.E., Rumyantsev, S.L., Shur, M.S., Eds.; John Wiley & Sons, Inc.: New York, 2001; book section 3, pp. 45–66. [Google Scholar]
- Silveira, E.; Freitas, J.A.; Schujman, S.B.; Schowalter, L.J. AlN bandgap temperature dependence from its optical properties. J. Cryst. Growth 2008, 310, 4007–4010. [Google Scholar] [CrossRef]
- Ahmed, R.; e Aleem, F.; Hashemifar, S.J.; Akbarzadeh, H. First principles study of structural and electronic properties of different phases of boron nitride. Phys. B Condens. Matter. 2007, 400, 297–306. [Google Scholar] [CrossRef]
- Krukowski, S.; Witek, A.; Adamczyk, J.; Jun, J.; Bockowski, M.; Grzegory, I.; Lucznik, B.; Nowak, G.; Wroblewski, M.; Presz, A.; Gierlotka, S.; Stelmach, S.; Palosz, B.; Porowski, S.; Zinn, P. Thermal properties of indium nitride. J. Phys. Chem. Solids 1998, 59, 289–295. [Google Scholar] [CrossRef]
- Kumar, V.; Roy, D.R. Structure, bonding, stability, electronic, thermodynamic and thermoelectric properties of six different phases of indium nitride. J. Mater. Sci. 2018, 53, 8302–8313. [Google Scholar] [CrossRef]
- Grzegory, I.; Jun, J.; Bockowski, M.; Krukowski, S.; Wroblewski, M.; Lucznik, B.; Porowski, S. III-V Nitrides – thermodynamics and crystal growth at high N2 pressure. J. Phys. Chem. Solids 1995, 56, 639–647. [Google Scholar] [CrossRef]
- Grzegory, I.; Jun, J.; Krukowski, S.; Perlin, P.; Porowski, S. InN Thermodynamics and Crystal-Growth at High-Pressure of N2. Jpn. J. Appl. Phys. 1993, 32, 343–345. [Google Scholar] [CrossRef]
- Piechota, J.; Krukowski, S.; Sadovyi, B.; Sadovyi, P.; Porowski, S.; Grzegory, I. Melting versus Decomposition of GaN: Ab Initio Molecular Dynamics Study and Comparison to Experimental Data. Chem. Mater. 2023, 35, 7694–7707. [Google Scholar]
- Saitoh, H.; Utsumi, W.; Kaneko, H.; Aoki, K. The phase and crystal-growth study of group-III nitrides in a 2000 °C at 20 GPa region. J. Cryst. Growth 2007, 300, 26–31. [Google Scholar] [CrossRef]
- Soignard, E.; Shen, G.; Sata, N.; McMillan, P.F. Indium Nitride at High Pressures and High Temperatures. Report, The Advanced Photon Source - Argonne National Laboratory, 2000.
- Berendsen, H.J.C.; van Gunsteren, W.F. Practical algorithms for dynamic simulations. In Molecular-Dynamics Simulations of Statistical-Mechanical Systems, Proc. Int. School Phys. "Enrico Rermi", course 97; Giccotti, G., Hoover, W.G., Eds.; North-Holland Physics Publishing: Amsterdam, 1986; pp. 43–65. [Google Scholar]
- Hayes, E.F.; Parr, R.G. Time-Dependent Hellmann-Feynman Theorems. J. Chem. Phys. 1965, 43, 1831–1832. [Google Scholar] [CrossRef]
- Garcia, A.; Papior, N.; Akhtar, A.; Artacho, E.; Blum, V.; Bosoni, E.; Brandimarte, P.; Brandbyge, M.; Cerda, J.I.; Corsetti, F.; Cuadrado, R.; Dikan, V.; Ferrer, J.; Gale, J.; Garcia-Fernandez, P.; Garcia-Suarez, V.M.; Garcia, S.; Huhs, G.; Illera, S.; Korytar, R.; Koval, P.; Lebedeva, I.; Lin, L.; Lopez-Tarifa, P.; Mayo, S.G.; Mohr, S.; Ordejon, P.; Postnikov, A.; Pouillon, Y.; Pruneda, M.; Robles, R.; Sanchez-Portal, D.; Soler, J.M.; Ullah, R.; Yu, V.W.; Junquera, J. Siesta: Recent developments and applications. J. Chem. Phys. 2020, 152, 204108. [Google Scholar] [CrossRef] [PubMed]
- Sankey, O.F.; Niklewski, D.J. Ab initio multicenter tight-binding model for molecular-dynamics simulations and other applications in covalent systems. Phys. Rev. B 1989, 40, 3979–3995, PRB. [Google Scholar] [CrossRef] [PubMed]
- Troullier, N.; Martins, J.L. Efficient Pseudopotentials for Plane-Wave Calculations. Phys. Rev. B 1991, 43, 1993–2006. [Google Scholar] [CrossRef]
- Troullier, N.; Martins, J.L. Efficient pseudopotentials for plane-wave calculations. II. Operators for fast iterative diagonalization. Phys. Rev. B 1991, 43, 8861–8869. [Google Scholar] [CrossRef] [PubMed]
- Perdew, J.P.; Ruzsinszky, A.; Csonka, G.I.; Vydrov, O.A.; Scuseria, G.E.; Constantin, L.A.; Zhou, X.; Burke, K. Restoring the Density-Gradient Expansion for Exchange in Solids and Surfaces. Phys. Rev. Lett. 2008, 100, 136406. [Google Scholar] [CrossRef] [PubMed]
- Paszkowicz, W.; Adamczyk, J.; Krukowski, S.; Leszczynski, M.; Porowski, S.; Sokolowski, J.A.; Michalec, M.; Lasocha, W. Lattice parameters, density and thermal expansion of InN microcrystals grown by the reaction of nitrogen plasma with liquid indium. Philos. Mag. A 1999, 79, 1145–1154. [Google Scholar] [CrossRef]
- Stirling, A.; Papai, I.; Mink, J.; Salahub, D.R. Density functional study of nitrogen oxides. J. Chem. Phys. 1994, 100, 2910–2923. [Google Scholar] [CrossRef]
- Awasthi, N.; Ritschel, T.; Lipowsky, R.; Knecht, V. Standard Gibbs energies of formation and equilibrium constants from ab-initio calculations: Covalent dimerization of NO2 and synthesis of NH3. J. Chem. Thermodyn. 2013, 62, 211–221. [Google Scholar] [CrossRef]
- Barin, I. Thermochemical Data of Pure Substances, Third Edition; VCH: Weinheim, Germany, 1995; p. 1936. [Google Scholar] [CrossRef]
- Nose, S. A unified formulation of the constant temperature molecular dynamics methods. J. Chem. Phys. 1984, 81, 511–519. [Google Scholar] [CrossRef]
- Hoover, W.G. Canonical dynamics: Equilibrium phase-space distributions. Phys. Rev. A 1985, 31, 1695–1697. [Google Scholar] [CrossRef]
- Yang, J.Z.; Wu, X.; Li, X. A generalized Irving-Kirkwood formula for the calculation of stress in molecular dynamics models. J. Chem. Phys. 2012, 137, 134104. [Google Scholar] [CrossRef]
- Dronskowski, R.; Bloechl, P.E. Crystal orbital Hamilton populations (COHP): energy-resolved visualization of chemical bonding in solids based on density-functional calculations. J. Phys. Chem. 1993, 97, 8617–8624. [Google Scholar] [CrossRef]
- Deringer, V.L.; Tchougréeff, A.L.; Dronskowski, R. Crystal Orbital Hamilton Population (COHP) Analysis As Projected from Plane-Wave Basis Sets. J. Phys. Chem. A 2011, 115, 5461–5466. [Google Scholar] [CrossRef]
- Sadovyi, B.; Wierzbowska, M.; Stelmakh, S.; Boccato, S.; Gierlotka, S.; Porowski, S.; Grzegory, I. Experimental and theoretical evidence of the temperature-induced wurtzite to rocksalt phase transition in GaN under high pressure. Phys. Rev. B 2020, 102, 235109. [Google Scholar] [CrossRef]
|
Disclaimer/Publisher’s Note: The statements, opinions and data contained in all publications are solely those of the individual author(s) and contributor(s) and not of MDPI and/or the editor(s). MDPI and/or the editor(s) disclaim responsibility for any injury to people or property resulting from any ideas, methods, instructions or products referred to in the content. |
© 2024 by the authors. Licensee MDPI, Basel, Switzerland. This article is an open access article distributed under the terms and conditions of the Creative Commons Attribution (CC BY) license (http://creativecommons.org/licenses/by/4.0/).
