Introduction
The progressive depletion of fossil fuel reserves, coupled with the environmental issues stemming from their combustion—which has exacerbated global warming [
1,
2]—has driven the pursuit of alternative energy sources. Significantly, natural gas by itself is responsible for about 21% of emissions from the fossil fuels [
3]. To develop a less carbon-intensive alternative to pure natural gas, one potential approach that has gained significant attention recently is to blend hydrogen into existing natural gas streams. [
4,
5,
6,
7,
8,
9]. Since hydrogen combustion does not produce carbon dioxide, this method could substantially reduce carbon emissions. Consequently, household and business emissions will decrease with the integration of hydrogen into the natural gas system. Various projects have assessed the economic aspects of integrating hydrogen into natural gas pipelines, focusing on both the benefits for renewable integration and emission reduction, as well as the costs of upgrading infrastructure [
10], with numerous trials in Europe and fewer in the United States, and ongoing efforts in countries like Australia, Canada, and Germany.
A critical challenge associated with the utilization of natural gas/hydrogen mixtures is Hydrogen Embrittlement (HE), which refers to the degradation of the mechanical properties of materials when exposed to hydrogen [
11]. When hydrogen-blended transmission is implemented in natural gas pipelines, the pipes will be continuously exposed to varying hydrogen concentrations over extended periods. Under pressure and flow, hydrogen molecules will dissociate into H atoms, which will penetrate the steel through adsorption, reacting with the metal's atomic structure and likely causing microcrack propagation. This process deteriorates the macromechanical properties of the pipe steels [
12]. The interaction between hydrogen and the metal microstructure has been extensively studied, leading to the proposal of several mechanisms to explain the phenomenon of HE including hydrogen pressure theory (HPT) [
13], hydrogen-enhanced decohesion mechanism (HEDE) [
14,
15], hydrogen-enhanced localized plasticity (HELP) [
16], adsorption-induced dislocation emission (AIDE) [
17], hydrogen-enhanced strain-induced vacancy formation (HESIVM) [
18], hydrogen-enhanced macroscopic plasticity (HEMP) [
19], hydride formation [
20], hydrogen-induced reduction in surface energy [
21], and hydrogen assisted micro-void coalescence [
22,
23]. No single theory can fully and accurately explain the effects of hydrogen. Often, multiple mechanisms may be at play simultaneously. Hydrogen-enhanced decohesion (HEDE) is predominant in brittle intergranular fractures, hydrogen-enhanced localized plasticity (HELP) in slip-band fractures, and adsorption-induced dislocation emission (AIDE) in cleavage-like and dimpled intergranular fractures [
24].
To understand the impact of hydrogen on pipeline steels, experimental techniques like hydrogen permeation, hydrogen charging, and mechanical testing are essential. These methods determine hydrogen content, and its influence on mechanical properties. Hydrogen permeation tests can be carried out in either aqueous or gaseous environment. [
25]. Hydrogen charging (H-charging) can be accomplished through electrochemical, chemical, or gaseous methods. Among these, gaseous H-charging, achieved using high-pressure gas, is more effective in simulating the actual transportation conditions of pipeline steels [
26]. However, this method requires more equipment and poses significant safety risks. Tensile testing of hydrogen-charged specimens helps determine parameters like reduction in area and elongation, indicating the extent of hydrogen-induced damage [
27,
28,
29]. These tests can be conducted either in-situ, where samples are charged with hydrogen simultaneously as testing is performed, or ex-situ, where pre-charged samples are subsequently tested in the air, with the former more accurately simulating real service conditions. However, the facilities required for in-situ testing are expensive and often not readily available. Conventional Strain Rate Test (CSRT) and Slow Strain Rate Test (SSRT) are commonly used for assessing HE susceptibility. While SSRT, with its controlled and gradual deformation rate, is recognized for closely simulating the actual stress conditions encountered by materials in practical applications and is extensively employed in experiments involving hydrogen-induced phenomena [
30], there are reports [
31,
32] indicating that both SSRT and CSRT have produced nearly identical results when evaluating localized conditions, such as local stress and local hydrogen distribution at the fracture initiation point. Studies indicate that the ductility of pipeline steel, typically measured by reduction in area at fracture (RA) or elongation to fracture, is often significantly diminished in the presence of hydrogen. For smooth specimens, the reduction in RA when exposed to hydrogen gas can range from 20% to as much as 50% compared to tensile test results conducted in air [
32,
33,
34].
Additionally, pipelines endure cyclic loading due to daily pressure fluctuations during regular operation and upset conditions, such as shutdowns, which cause the pipeline to transition from near-atmospheric pressure back up to full operating pressure. So, understanding the fatigue characteristics of steel pipelines within a hydrogen environment is essential for assessing the structural integrity of pipeline infrastructure during the transportation of hydrogen/natural gas blends [
35]. fatigue testing reveals how hydrogen reduces the fatigue life of steels by accelerating crack initiation and propagation, using cyclic loading techniques such as rotating beam or axial fatigue tests to assess hydrogen's influence on fatigue behavior [
25].
Fatigue testing of hydrogen-impacted steels can be categorized into two main approaches: fatigue crack growth rate (FCGR) tests and fatigue life tests. Similar to tensile tests, these tests can also be conducted either in-situ [
36,
37] or ex-situ [
38,
39]. FCGR tests focus on the rate at which existing cracks propagate under cyclic loading in the presence of hydrogen. FCGR testing is typically performed on compact tension (CT) specimens. The recommended dimensions for CT specimens are outlined in the ASTM E647 standard [
40]. Numerous studies have shown that hydrogen significantly accelerates crack growth rates, particularly in high-strength steels [
41,
42,
43,
44]. However, other reports indicate that multiple parameters and conditions can influence this trend. Dmytrakh et al. [
45] studied the impact of hydrogen concentration on FCGR in ferrite-pearlitic low-alloyed steel, identifying a threshold hydrogen concentration below which FCGR decreases with increasing hydrogen concentration, suggesting an increase in crack growth resistance, and above which FCGR increases due to hydrogen-dislocation interactions, involving dislocation pinning or dragging and enhanced plasticity. Yamabe et al. [
46] examined the effects of hydrogen pressure, test frequency, and temperature on the FCGR of annealed low-carbon steel with a ferrite-pearlite microstructure. Their results showed that hydrogen-enhanced FCGR acceleration is accompanied by localized plastic deformations near the crack tip, likely caused by steep hydrogen concentration gradients. An et al. [
47] investigated the effects of hydrogen pressure on the fatigue properties of X80 pipeline steel with a ferrite and bainite microstructure, specifically focusing on the fatigue crack growth rate (FCGR). They concluded that hydrogen-accelerated crack initiation is more significant than crack growth in reducing fatigue life as hydrogen pressure increases.
Fatigue life tests assess the overall lifespan of a material until failure under cyclic loading The literature predominantly focuses on FCGR tests, with relatively few studies performing fatigue life tests and addressing S-N curves. However, predictive models based on fracture mechanics for FCGR in hydrogen environments can be used to estimate the remaining lifespan of pipelines [
48,
49]. Meng et al. [
50] demonstrated that the fatigue properties of X80 pipeline steel are significantly compromised by hydrogen in natural gas/hydrogen mixtures. Using the mentioned method for predicting the fatigue life, their findings indicated a severe reduction in fatigue life, from 24,431 cycles in nitrogen gas to 2,130 cycles in a 5 vol% hydrogen blend at 12 MPa. Among the few studies on hydrogen embrittlement (HE) of pipeline steels that perform fatigue life tests, Faucon et al. [
51] developed an in situ gaseous hydrogen charging fatigue setup to investigate the hydrogen-accelerated fatigue life of API X60 pipeline steel. They tested specimens at hydrogen pressures of 70 and 150 barg. The presence of hydrogen reduced the fatigue life of the by 37%. Additionally, no significant difference in fatigue behavior was observed between the two hydrogen pressures, suggesting that maximum hydrogen saturation in the crack process zone was reached at 70 barg. In contrast, Nahm et al. [
52] investigated the high cycle fatigue behavior of hydrogen-embrittled AISI 304 stainless steel and found that the material exhibited similar S-N curve tendencies and fatigue strength as untreated specimens, despite containing approximately 8.1 times more hydrogen. This indicates a relatively low sensitivity of AISI 304 stainless steel to hydrogen gas. The specimens were precharged in an ultra-high-pressure hydrogen exposure vessel at 10 MPa and 300°C for 120 hours, then stored in liquid nitrogen before being subjected to fatigue testing at room temperature.
While literature generally indicates a reduction in plastic deformation ability and deterioration in fracture and fatigue resistances of pipe steels in hydrogen-containing environments [
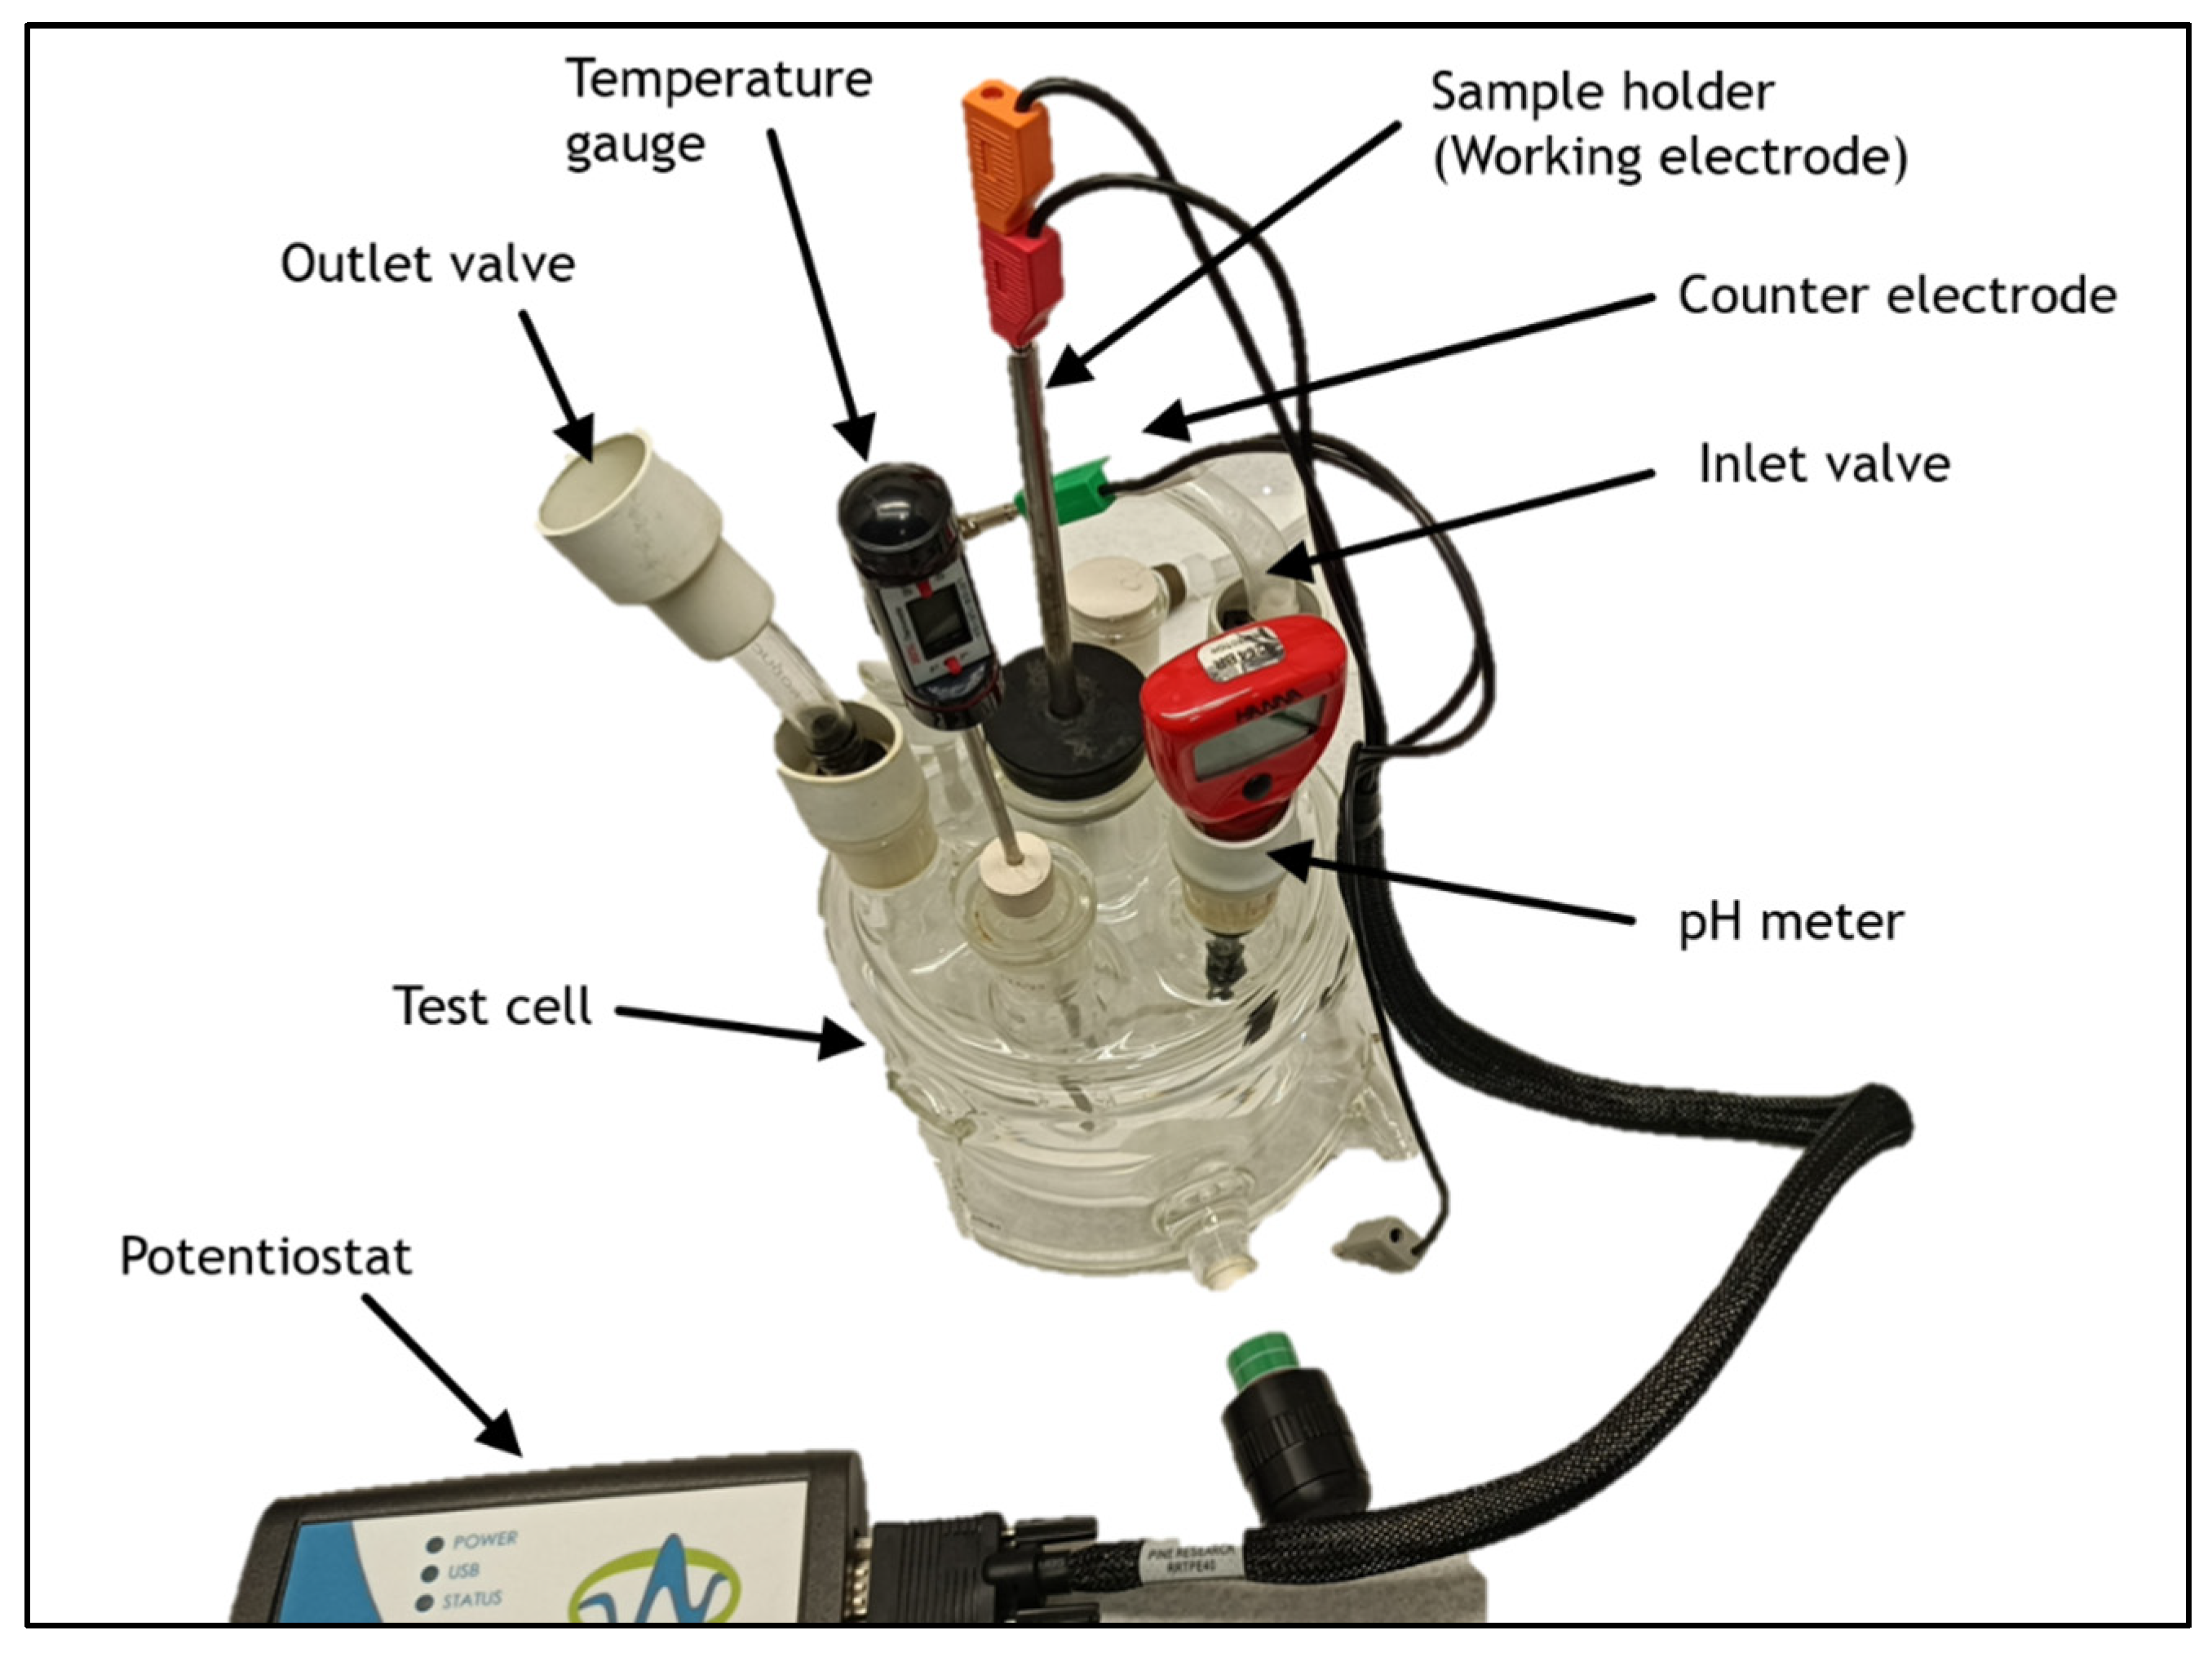
53], the susceptibility and behavior of HE in pipeline steels can vary based on material characteristics (microstructure, grain boundaries, dislocations, and inclusions) and hydrogen exposure conditions. To assess the feasibility of blending hydrogen with natural gas within the current distribution network, a comprehensive examination and testing of pipeline steels appear crucial. This is particularly important considering the potential degradation of fatigue properties in the existing pipeline steels due to prolonged service. This study investigated the mechanical behavior of two distinct pipe steels from the natural gas distribution network using tensile and fatigue tests. Also, a unique method, involving electrochemical hydrogen permeation and charging experiments, was applied to simulate real hydrogen exposure conditions for pipeline steels. It is important to note that while this study strives to replicate real operating conditions as closely as possible, it might not fully capture the exact complexities and variables present in actual field conditions.
Materials
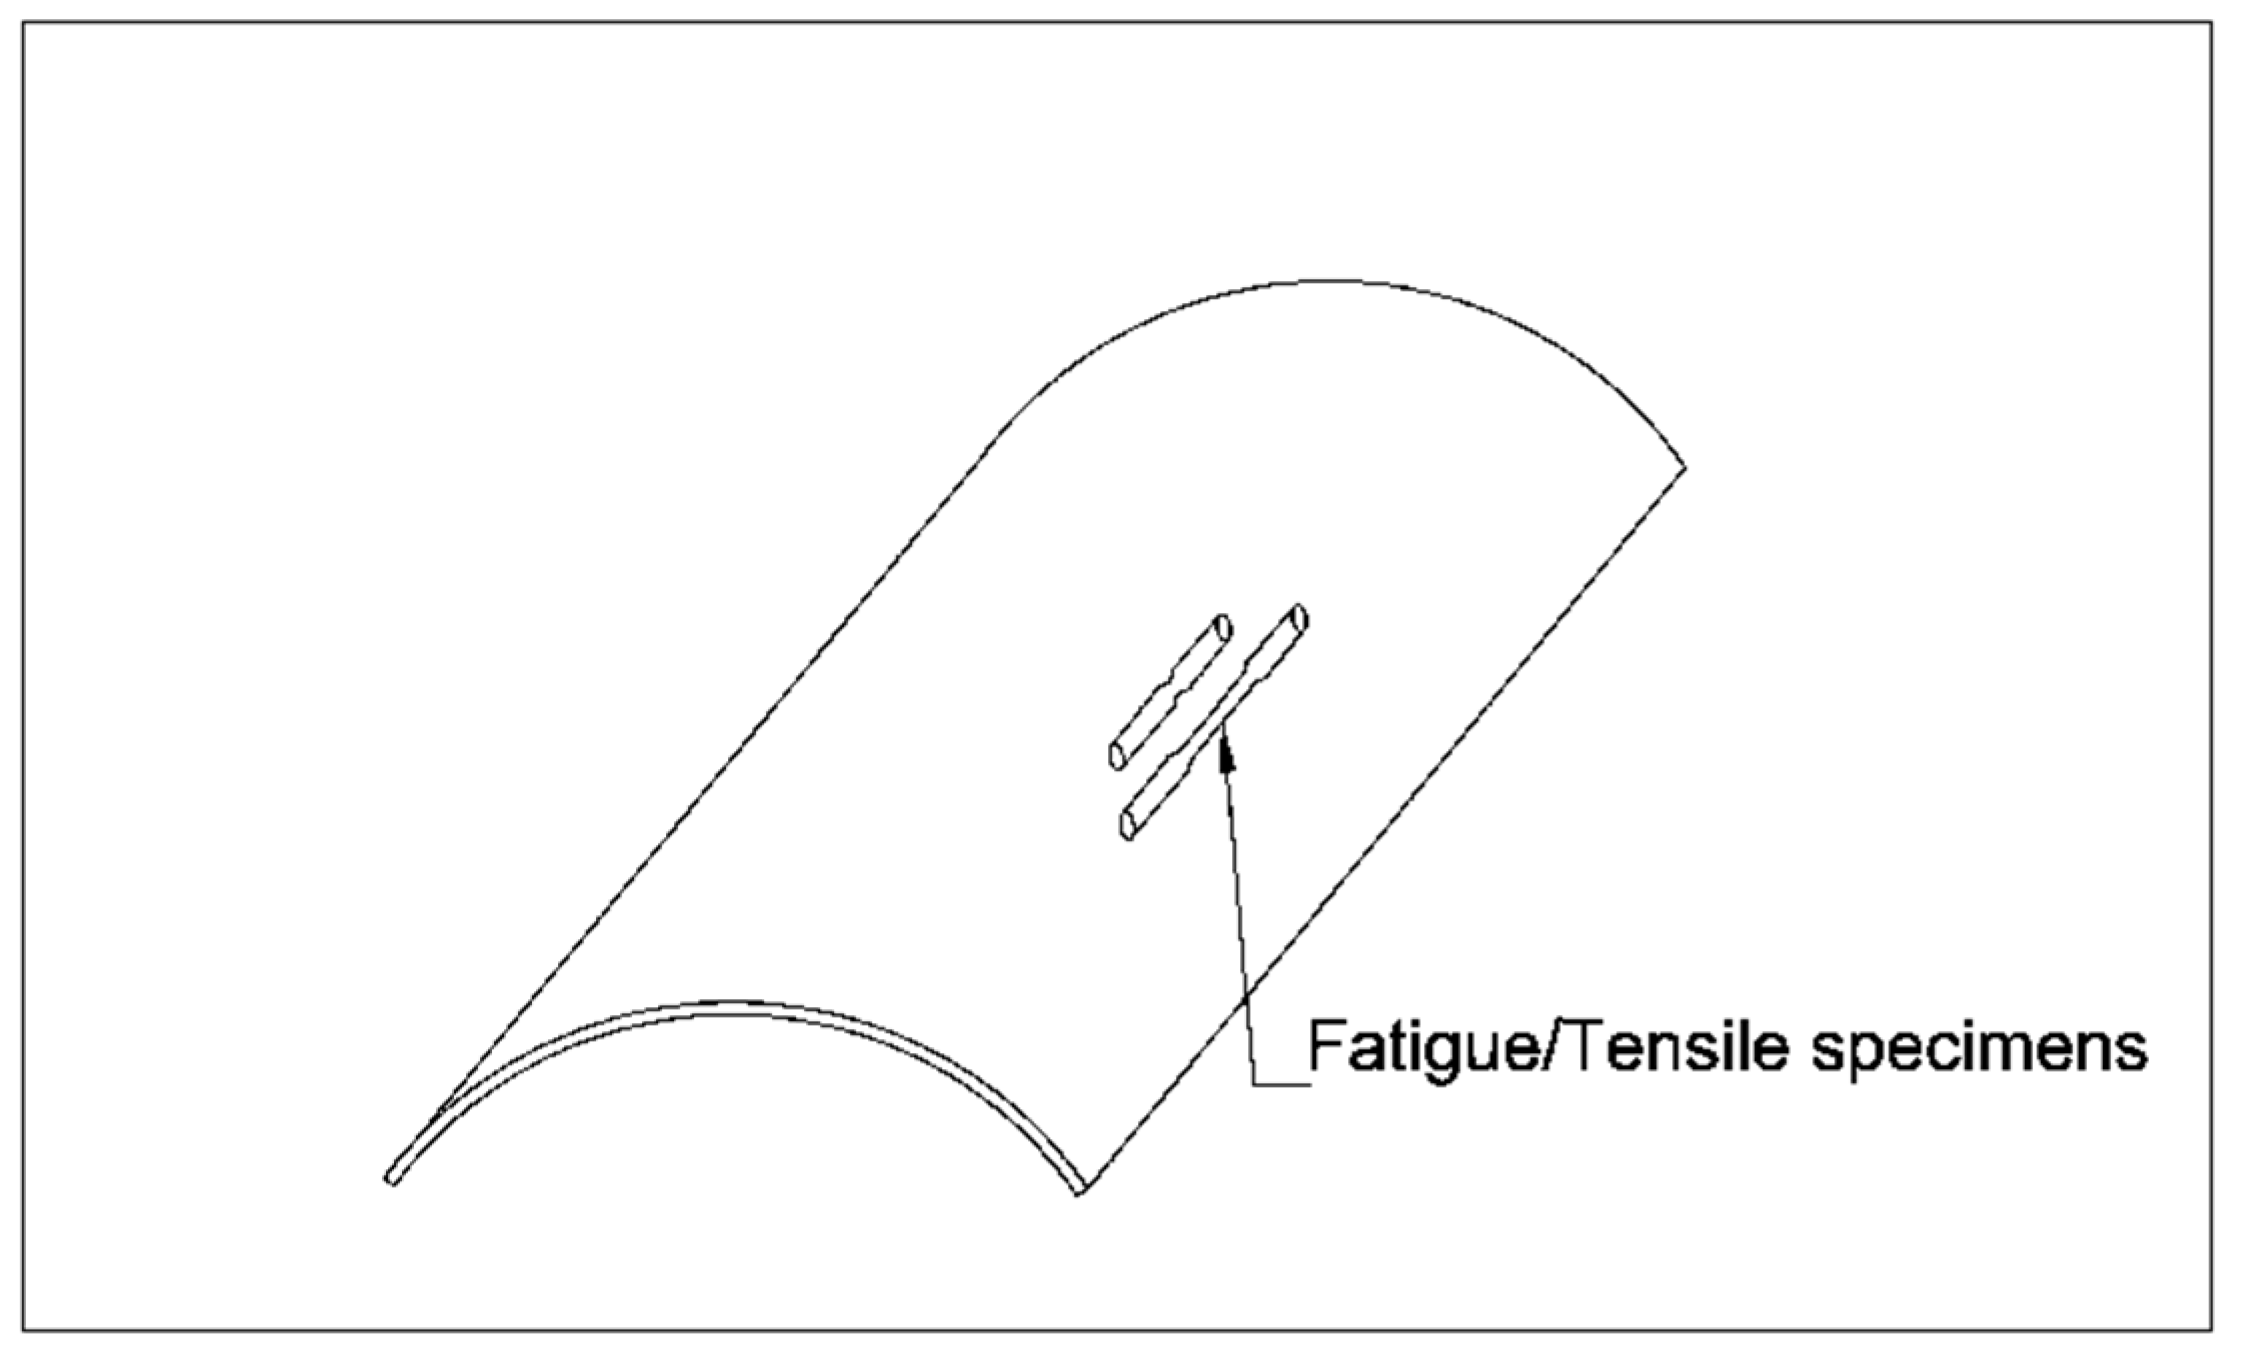
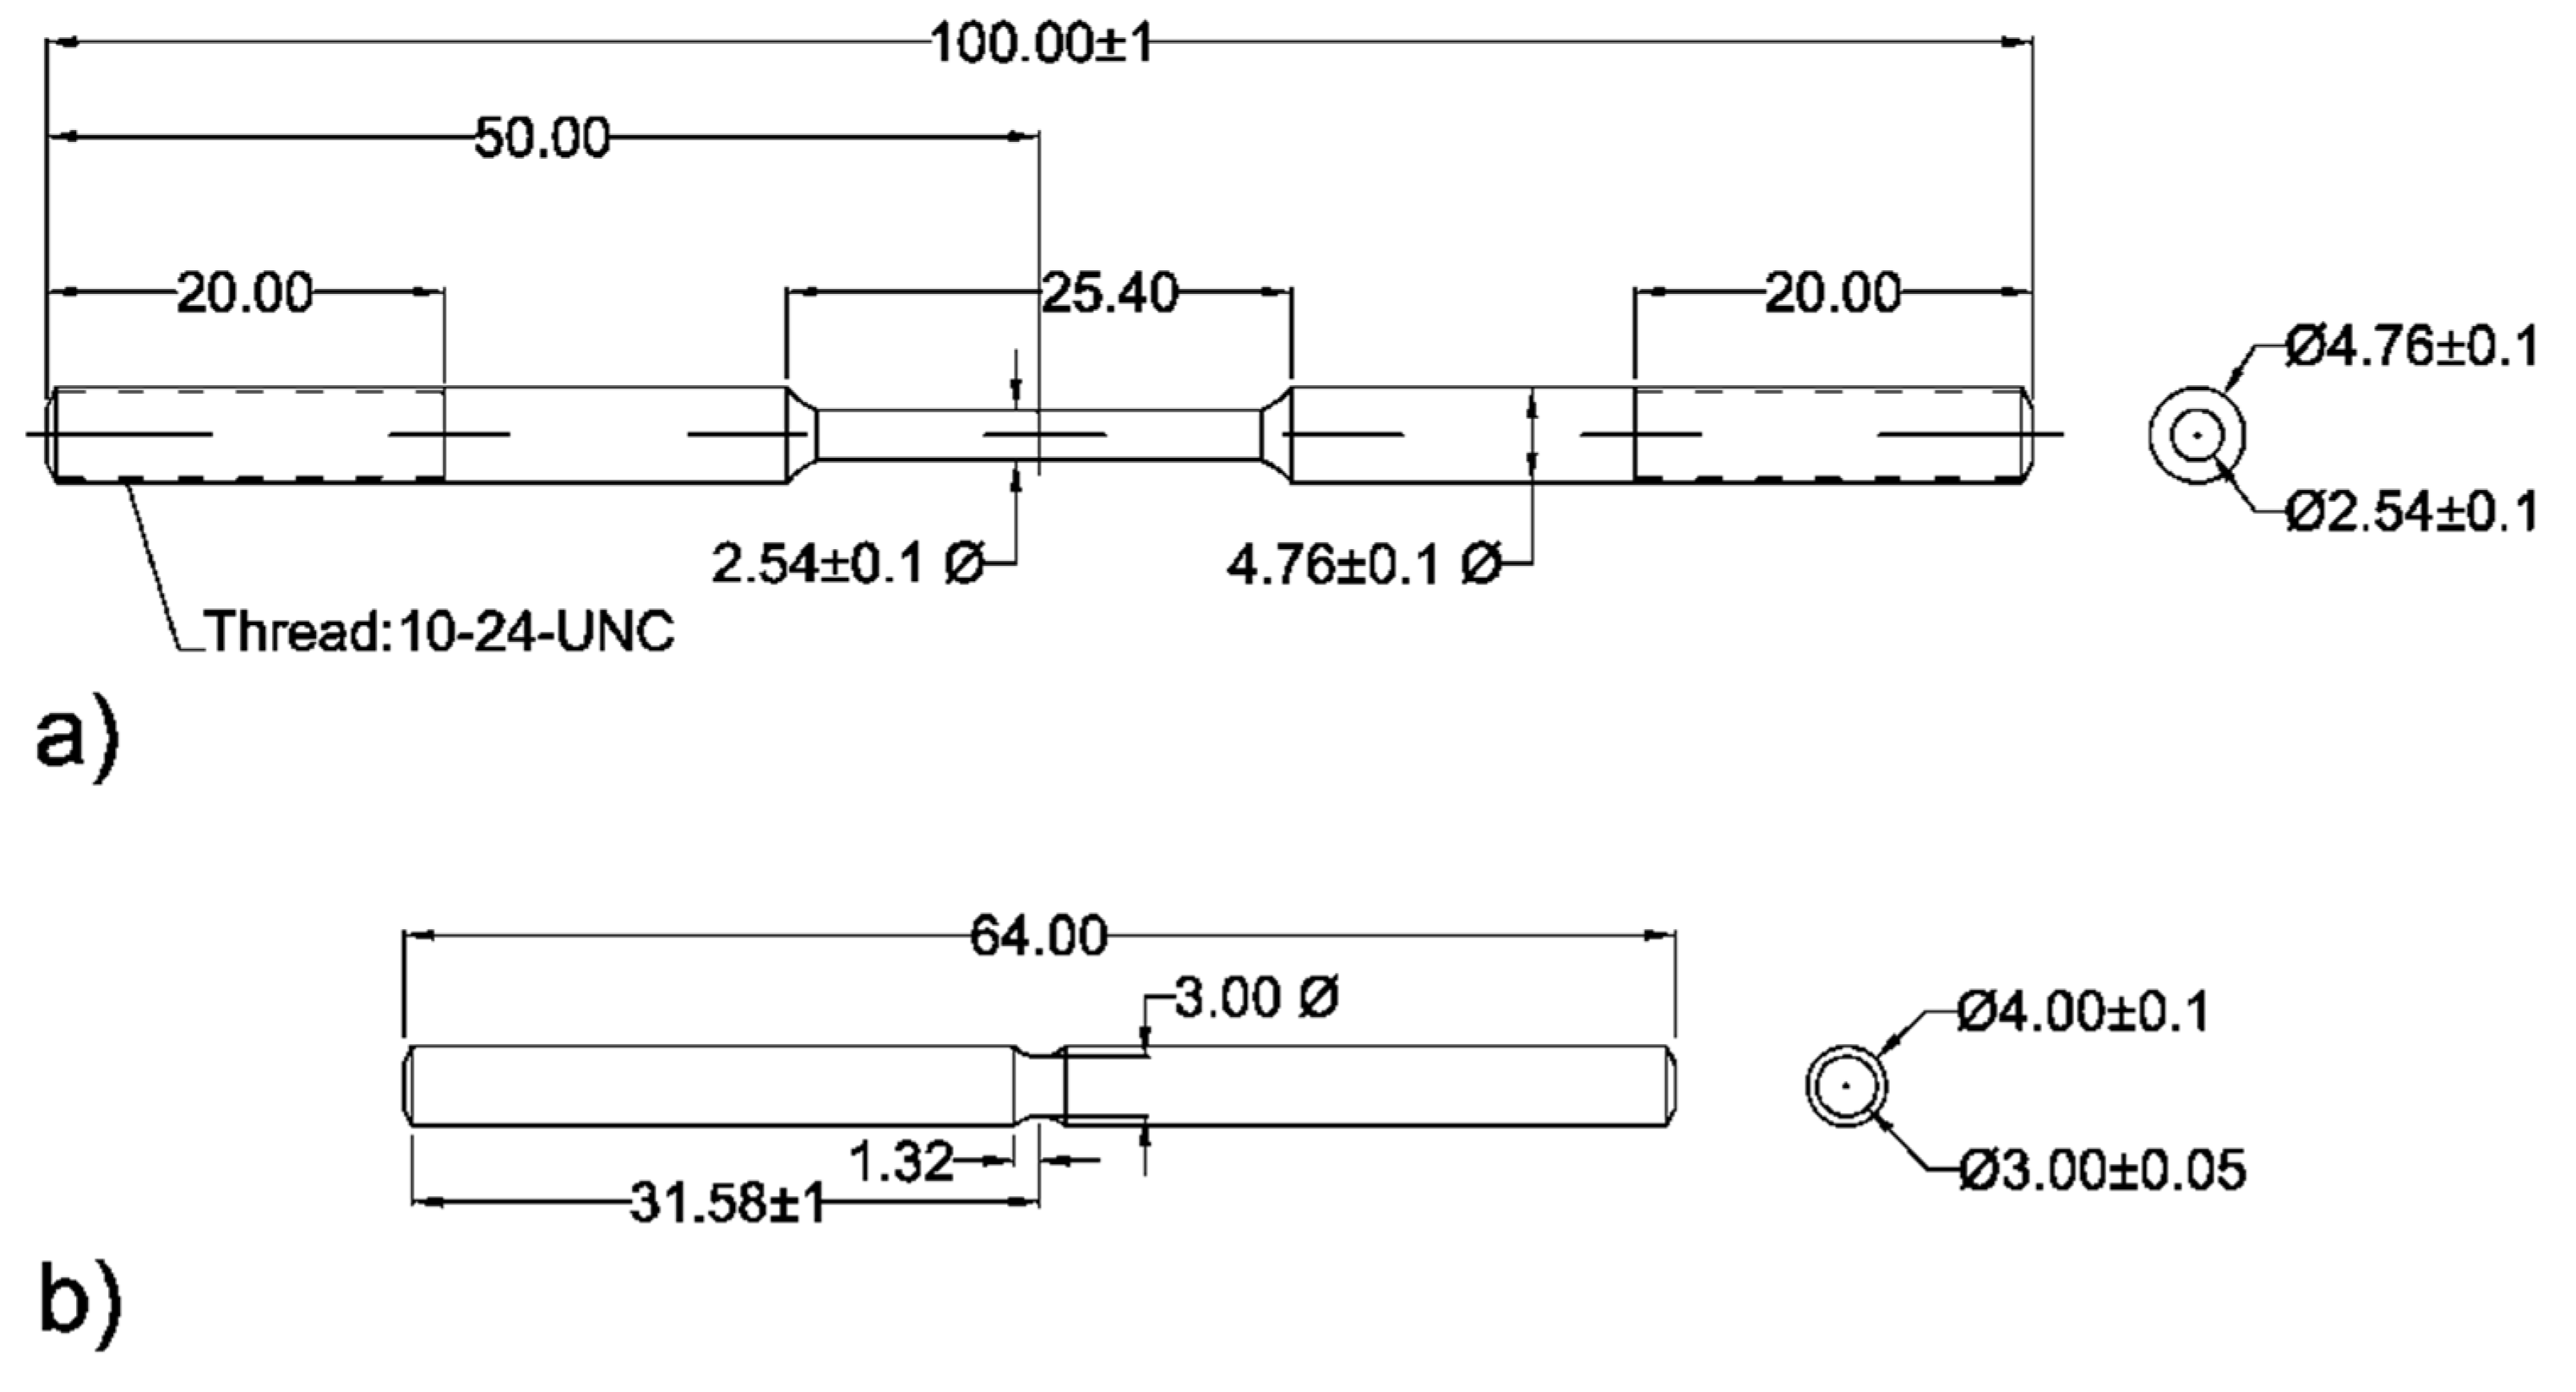
This study examines two different pipeline steels extracted from circumferential sections of pipes within the existing natural gas distribution network. The first sample, designated as AO-C1, is a 26-inch pipe of grade 359 (equivalent to API X52) with a thickness of 7.14 mm. The second sample, referred to as N-C1, is a 24-inch pipe of grade 448 (equivalent to API X65) with a thickness of 12.7 mm. N-C1 pipe is new and has not been in service, however, the AO-C1 pipe had been in service since 1954. The detailed chemical compositions of both steels are given in Error! Reference source not found.. The mean hardness values for AO-C1 and N-C1 were measured as HV1 162 and HV1 222, respectively.
Table 1.
Chemical composition of AO-C1 and N-C1 pipeline steels (wt %).
Table 1.
Chemical composition of AO-C1 and N-C1 pipeline steels (wt %).
| |
C |
Mn |
Al |
Mo |
Cu |
Si |
Ni |
Sn+Nb+V+Ti |
Fe |
| AO-C1 |
0.28 |
1.02 |
0.03 |
<0.01 |
0.16 |
0.04 |
0.06 |
0.07 |
Bal |
| N-C1 |
0.05 |
1.44 |
0.03 |
0.17 |
0.17 |
0.23 |
0.12 |
0.1 |
Bal |
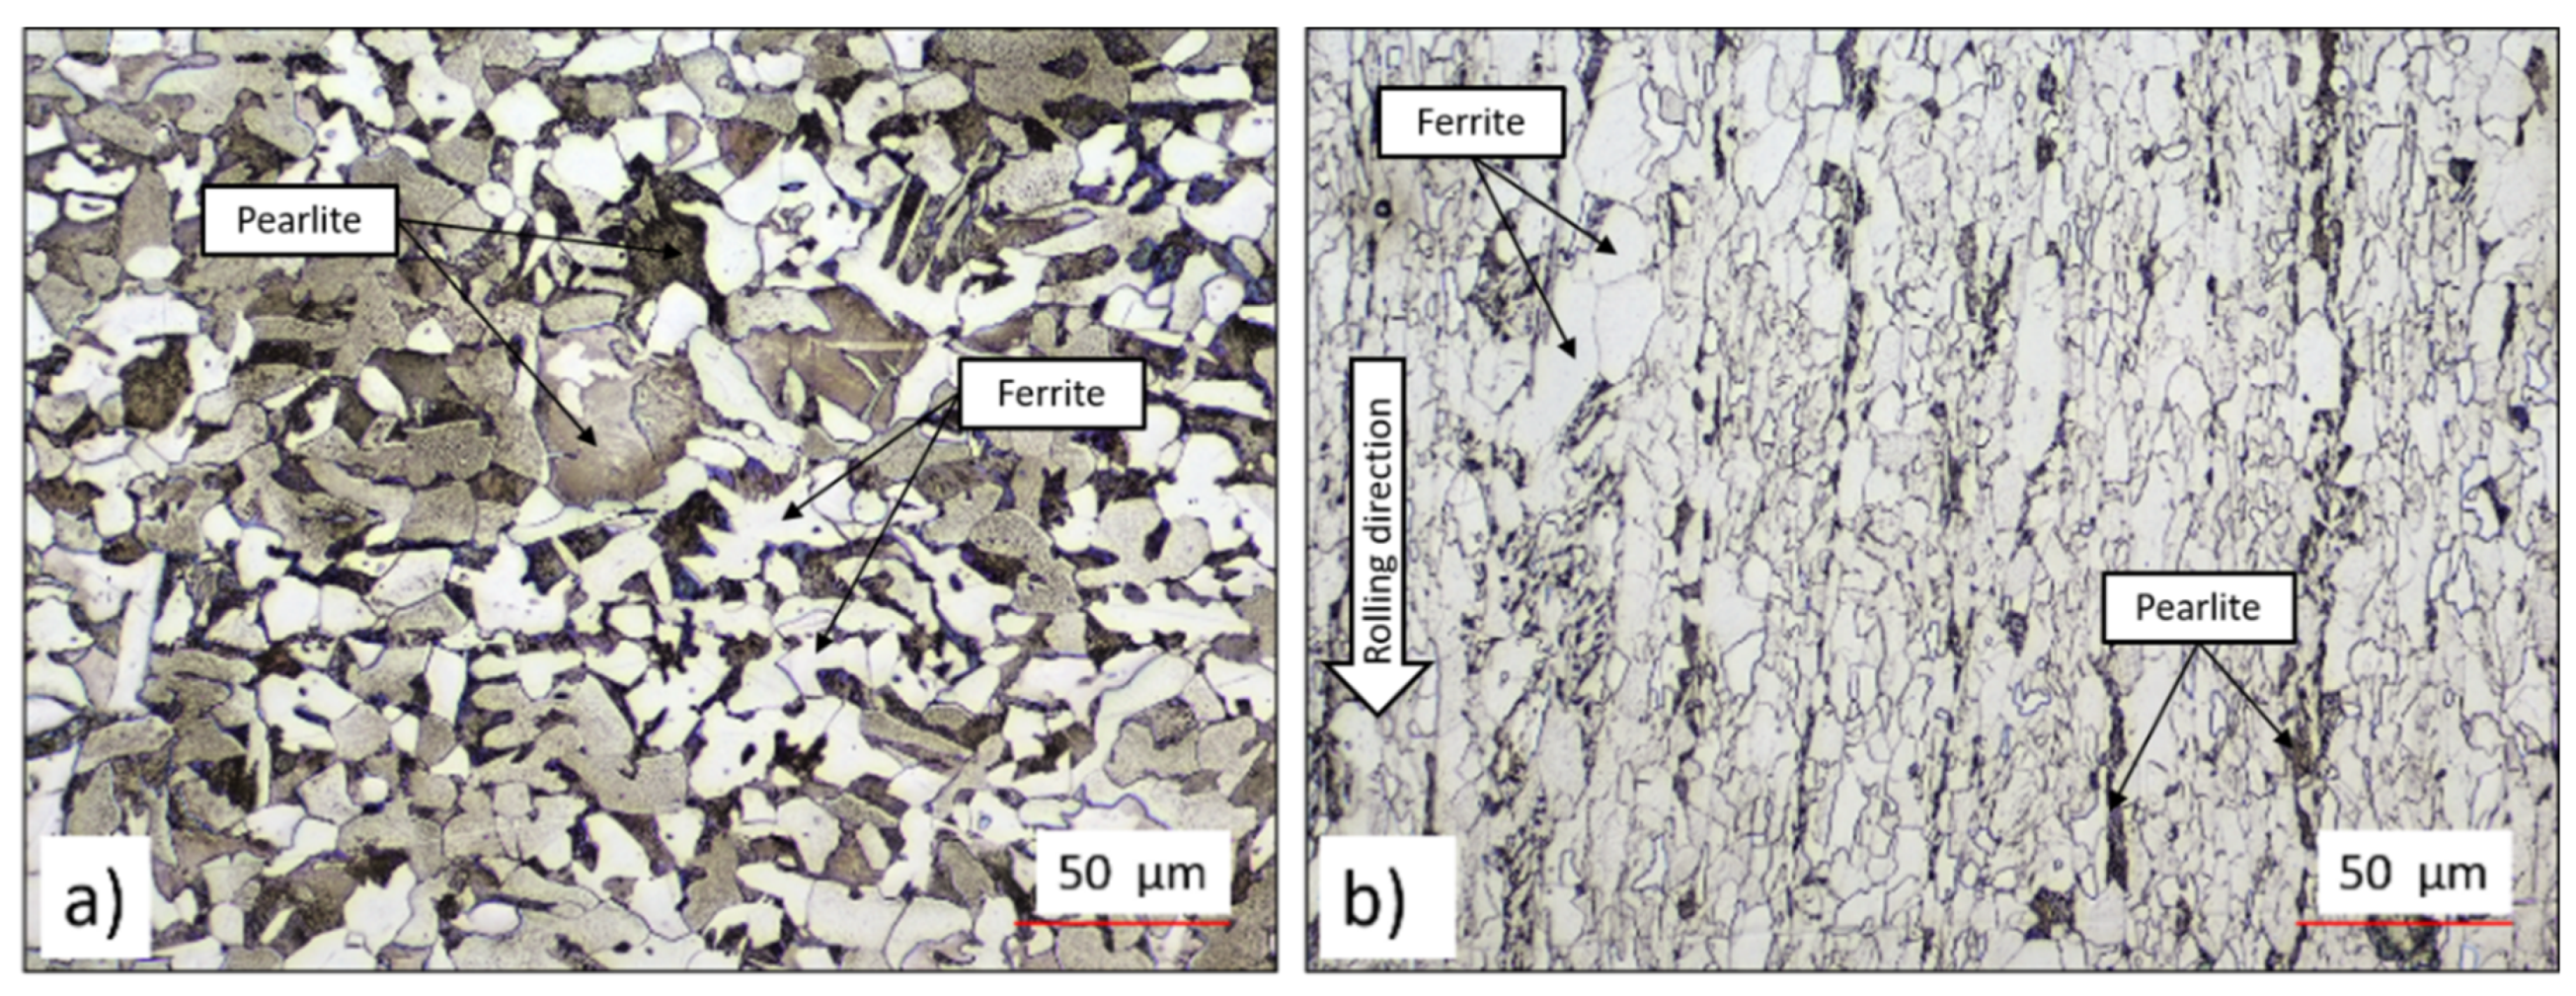
Error! Reference source not found. presents confocal images of the microstructures of the steels. As shown in Error! Reference source not found.a, the AO-C1 steel exhibits a ferritic-pearlitic microstructure with relatively coarse equiaxed grains, where the white phase represents ferrite and the darker phase indicates pearlite. In contrast, Error! Reference source not found.b illustrates the microstructure of the N-C1 steel, which displays polygonal ferrite (white) and elongated colonies of pearlite (dark) extending along the rolling direction (indicated by the white arrow).
Figure 1.
Microstructure of a) AO-C1 steel b) N-C1 steel. Etchant: nital (5%).
Figure 1.
Microstructure of a) AO-C1 steel b) N-C1 steel. Etchant: nital (5%).
Results and Discussion
Tensile Behavior
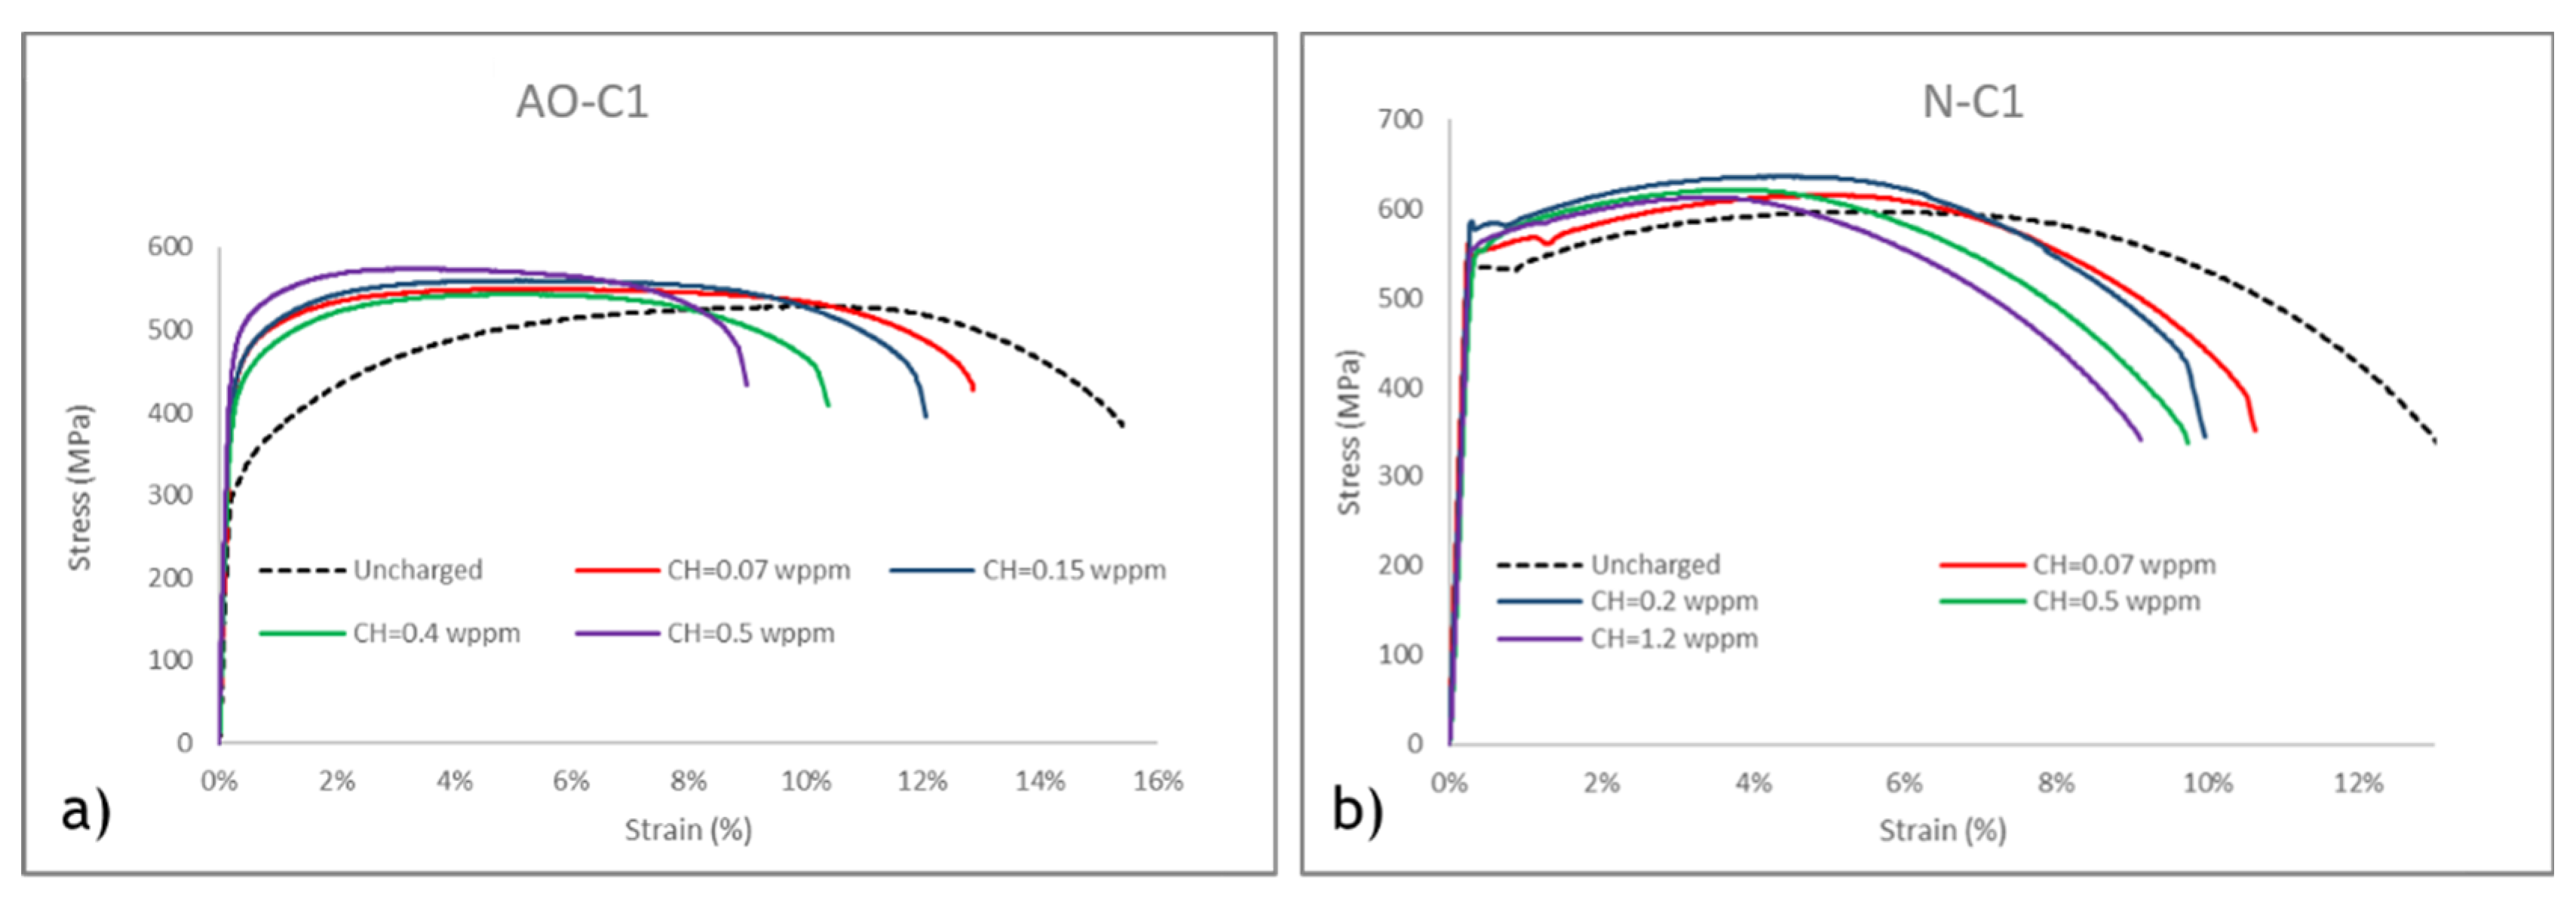
The stress-strain curves for the uncharged and charged tensile specimens from AO-C1 and N-C1 pipeline steels are illustrated in Error! Reference source not found.a-b, with corresponding tensile data presented in Error! Reference source not found.a-d. The results from tensile tests on uncharged samples show that AO-C1 exhibits higher ductility, whereas N-C1 demonstrates greater yield strength (YS) and ultimate tensile strength (UTS). Additionally, it is notable that the difference between YS and UTS is relatively small in N-C1, suggesting that this steel will reach final fracture more quickly when subjected to tensile loads beyond the elastic region, compared to AO-C1. This implies a more abrupt transition to failure under plastic deformation for N-C1.
Figure 5.
CSRT results for Uncharged and charged with varying hydrogen contents for a) AO-C1 steel; b) N-C1 steel.
Figure 5.
CSRT results for Uncharged and charged with varying hydrogen contents for a) AO-C1 steel; b) N-C1 steel.
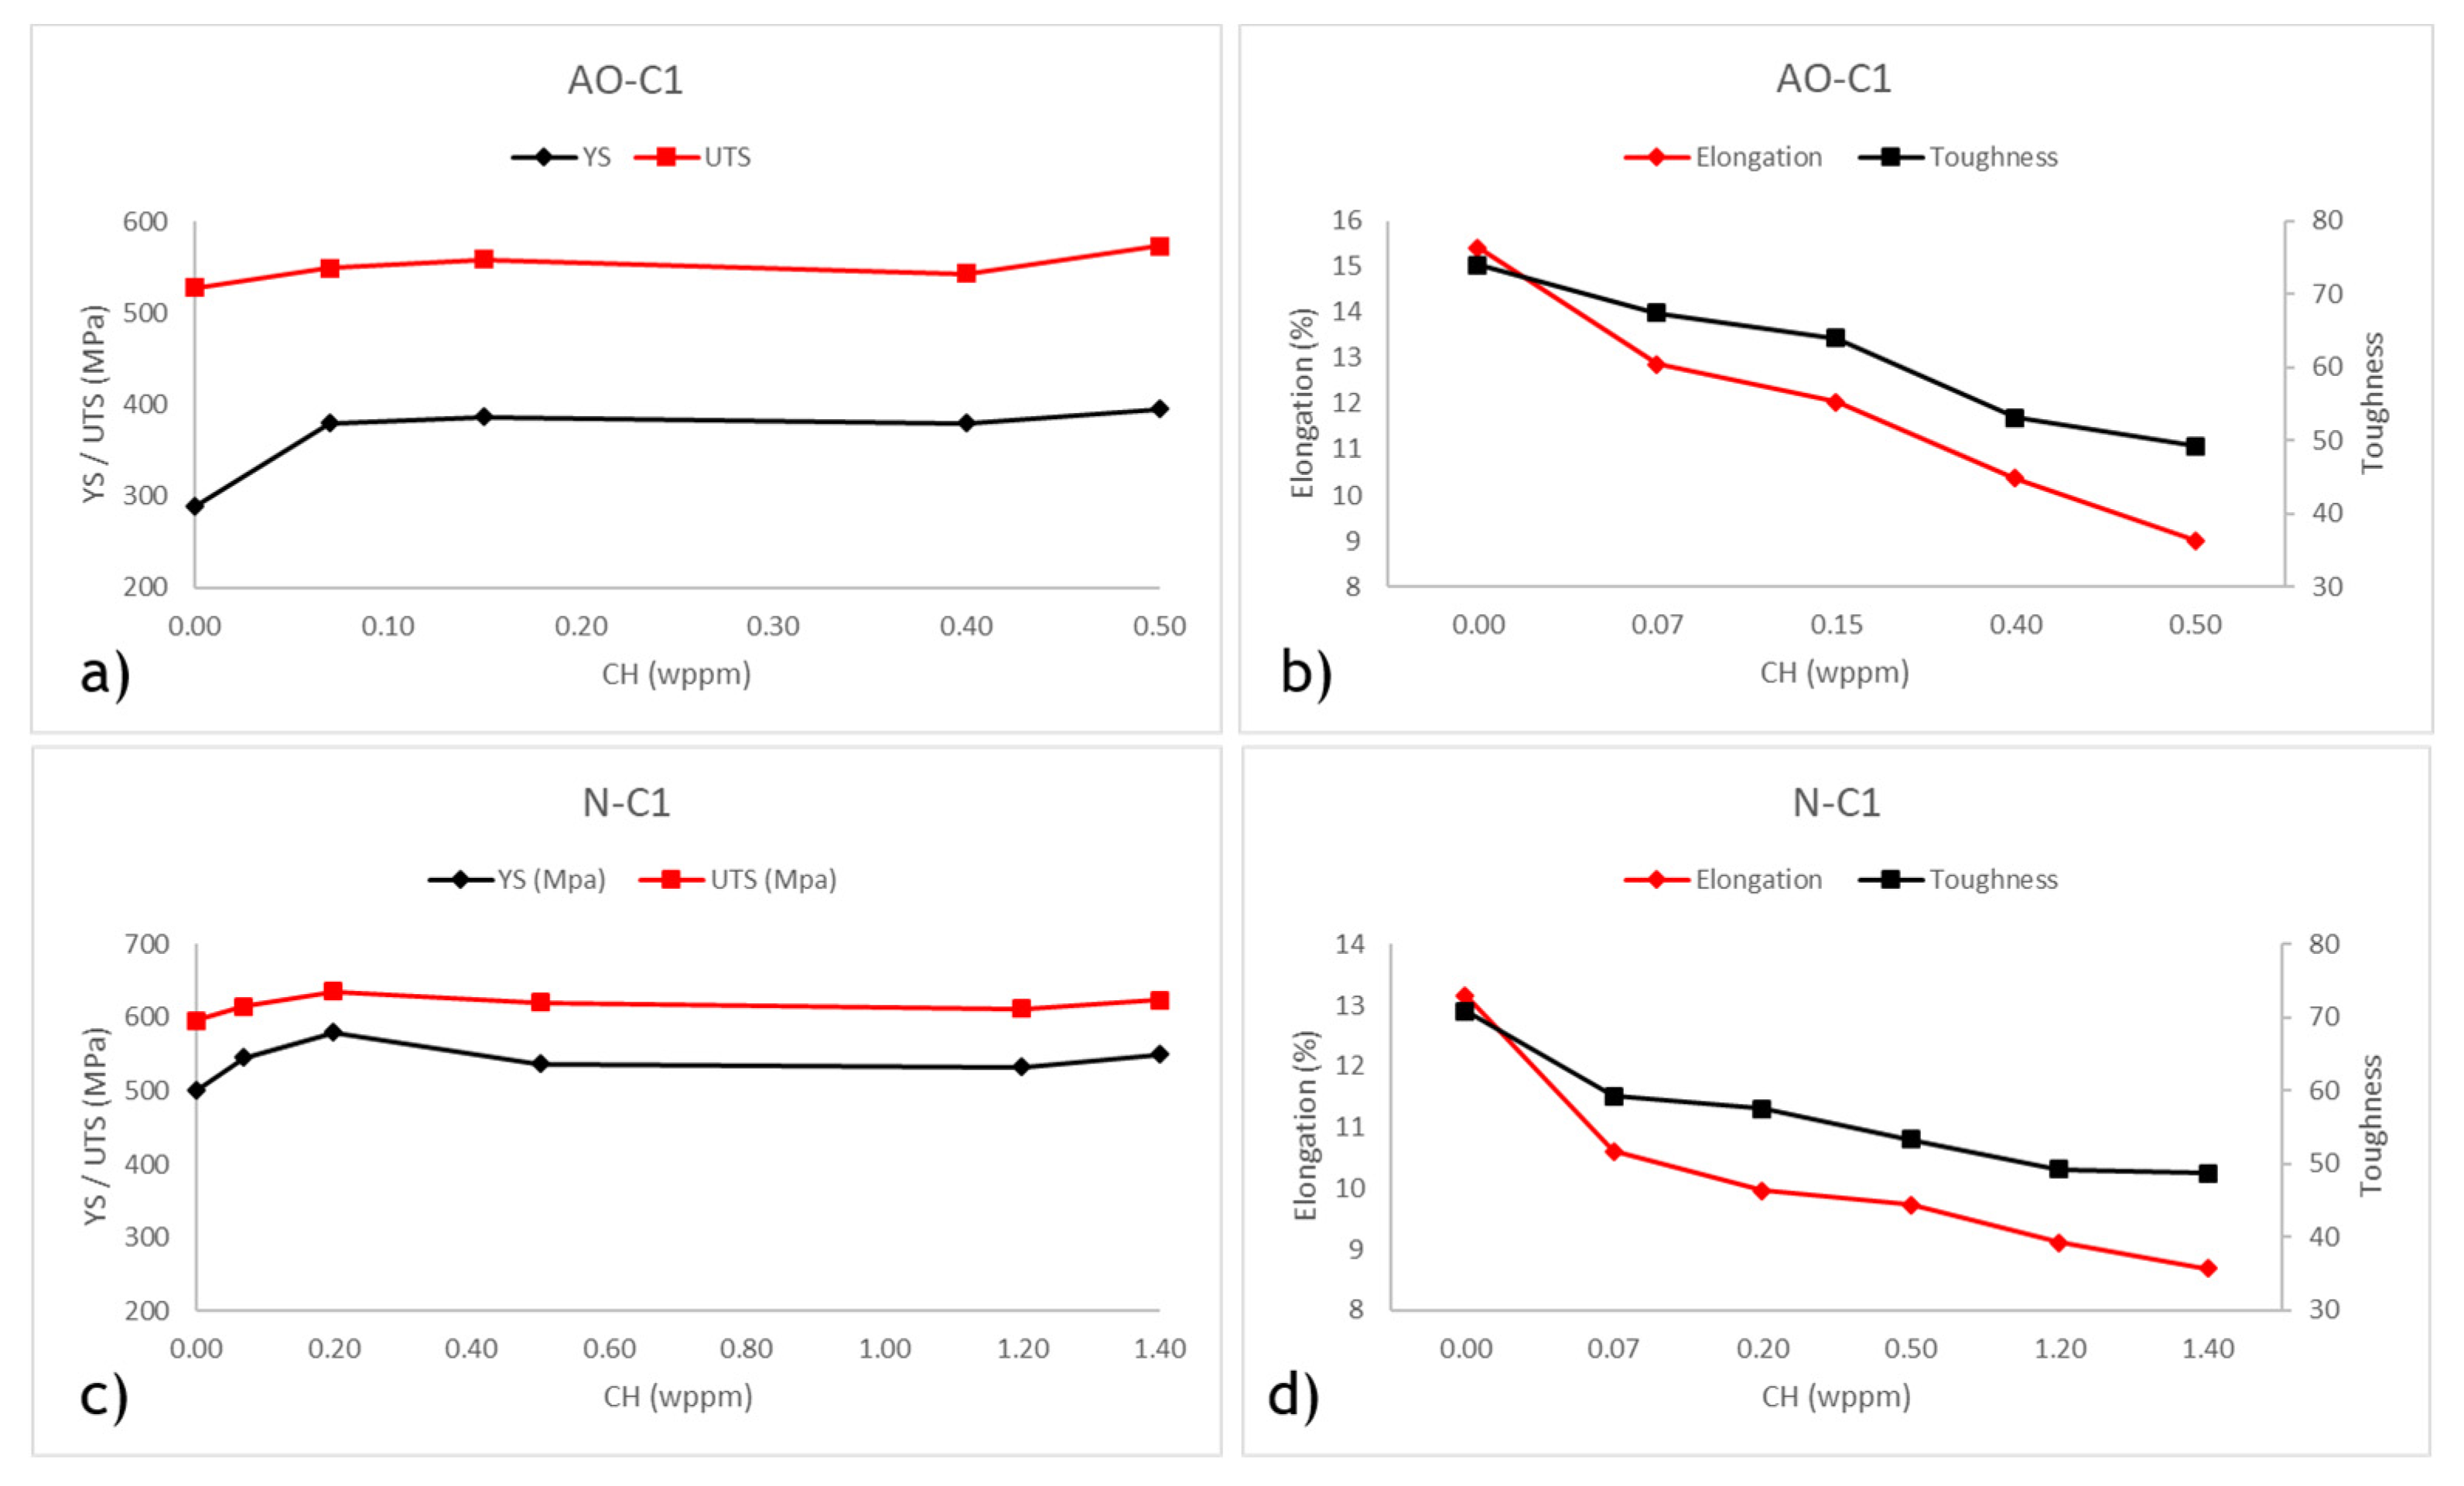
Error! Reference source not found.a,c and illustrate the yield strength (YS) and ultimate tensile strength (UTS) for both uncharged and hydrogen-charged samples with varying hydrogen content. It is evident from the figures that the YS of both materials increases after hydrogen charging compared to their uncharged state. This observation is consistent with findings from previous studies [
59,
60]. The increase in YS is typically attributed to the solid solution strengthening effect of interstitial hydrogen. When hydrogen atoms occupy interstitial sites within the metal lattice, they hinder dislocation movement, thereby enhancing the material's resistance to deformation and increasing its yield strength [
61]. Within the range of hydrogen contents tested in this study, the maximum difference between the tensile strength of precharged and uncharged AO-C1 samples is 36%, and for N-C1 samples, it is 16%. The more substantial increase for AO-C1 steel may be due to degradation over its extended service period, as the yield strength of the uncharged samples (290 MPa) is below the expected grade standard of 359 MPa. The maximum difference in UTS between uncharged and charged samples is 9% for AO-C1 and 6% for N-C1. Thus, while hydrogen charging significantly impacts the yield strength, its effect on the ultimate tensile strength is relatively minor, aligning with findings from aforementioned studies.
Figure 6.
Effect of hydrogen content on tensile properies of specimens: a,b) AO-C1 steel ; c,d) N-C1 steel.
Figure 6.
Effect of hydrogen content on tensile properies of specimens: a,b) AO-C1 steel ; c,d) N-C1 steel.
The elongation and toughness at fracture of the steels are shown in
Error! Reference source not found.b&d. For the AO-C1 sample, the total elongation decreased from 15.5% for the uncharged sample to 9% for the charged sample with 0.5 wppm hydrogen content. In the case of N-C1 steel, the elongation for the uncharged sample and the samples with 0.5 and 1.4 wppm hydrogen content were 13%, 9.7%, and 8.7%, respectively. These findings demonstrate that the total elongation at fracture for both steels is significantly reduced in hydrogen-charged samples compared to those without hydrogen charging, consistent with the phenomenon of HE, where the presence of hydrogen reduces ductility and toughness in steels and is well-documented in previous studies [
29,
31,
34,
61,
62,
63]. A similar trend is observed in the toughness values. For samples charged with 0.5 wppm hydrogen content, the toughness values decreased by 33% for AO-C1 steel and 25% for N-C1 steel.
To summarize the tensile test results, it is evident that both steels experience a significant loss of ductility and toughness due to hydrogen HE. However, at the same hydrogen content (i.e. 0.5 wppm), AO-C1 steel exhibits a more pronounced impact. It is also important to note that similar hydrogen content values are not achieved with similar charging current densities. As shown in
Error! Reference source not found., the equivalent charging current density for achieving 0.5 wppm hydrogen content was 627.8 mA/cm² for AO-C1 steel, compared to 15.6 mA/cm² for N-C1 steel. This is also why AO-C1 steel was tested within a lower range of hydrogen contents due to the potentiostat's maximum current capacity constraints. The difference in charging current densities and the corresponding hydrogen content can be attributed to the deformation states of the steels. N-C1 steel, being heavily deformed (cold rolled), has more defects, allowing for more hydrogen trapping which leads to lower diffusivity and higher hydrogen concentration [
64,
65,
66] as reflected in
Error! Reference source not found.. However, reversible traps do not contribute to the HE phenomenon, which justifies the lower loss of ductility in N-C1 steel compared to AO-C1 steel at the same hydrogen content. Further explanation on this issue is provided in the next section on the results for fatigue tests.
Fractography of Tensile Samples
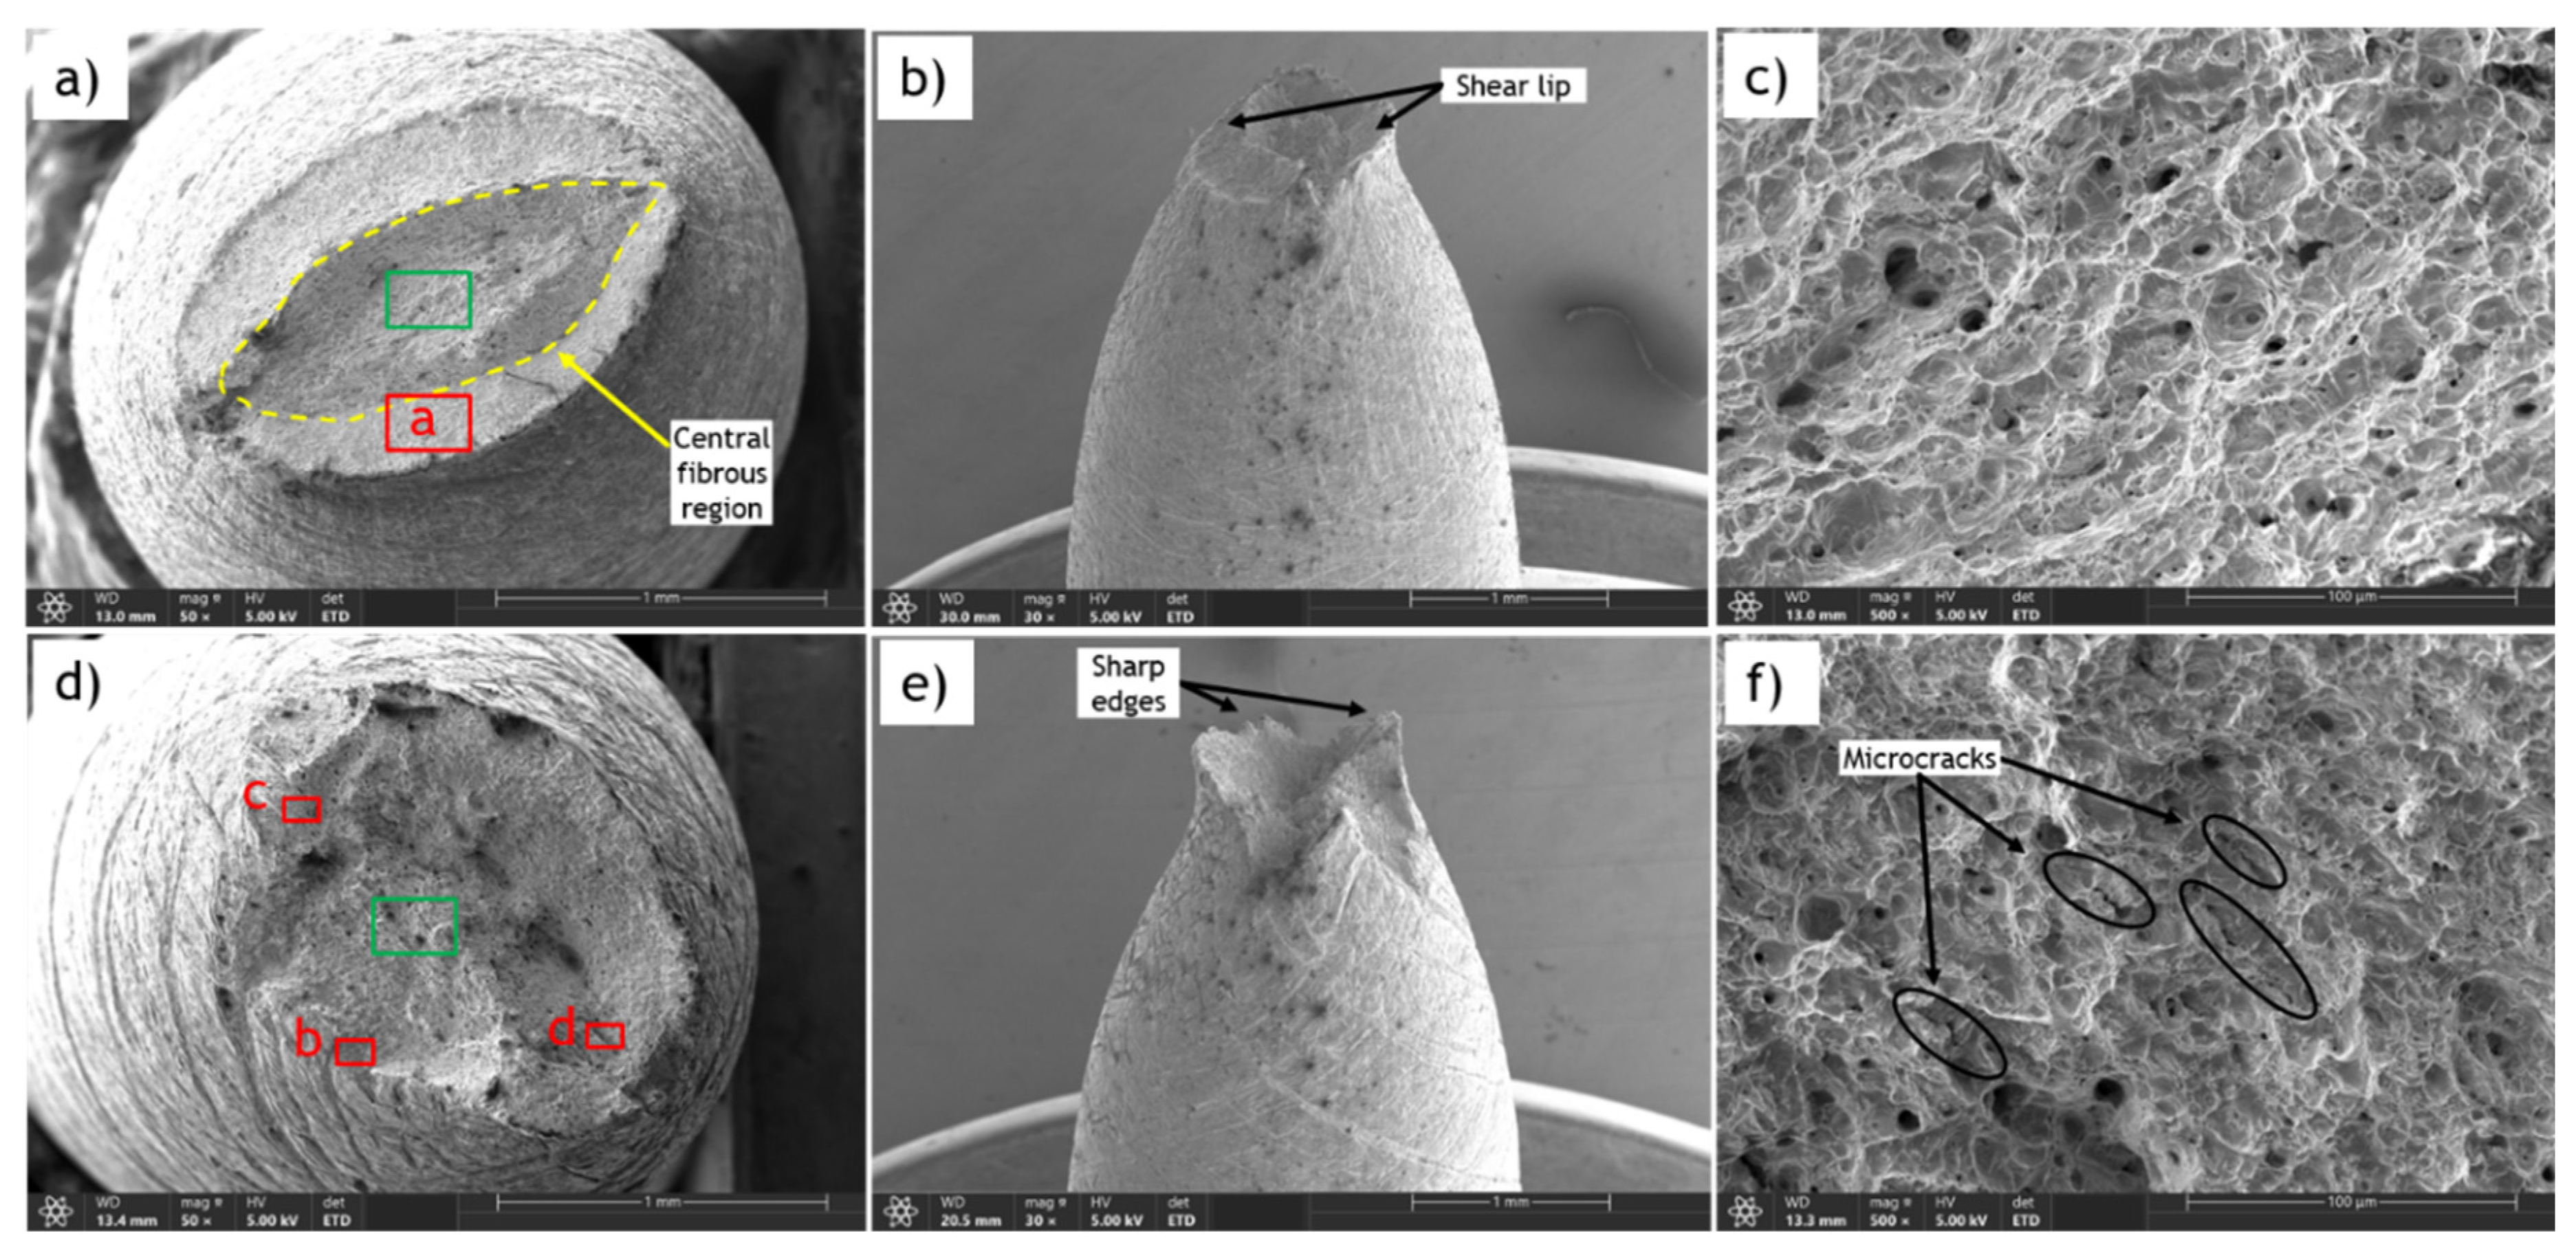
The detailed examination of fracture surfaces provides essential insights into the failure mechanisms of tested materials. Fracture surfaces of tensile specimens, both uncharged and hydrogen-charged, were analyzed using scanning electron microscopy (SEM). Error! Reference source not found.a,d show the fracture surfaces of uncharged and hydrogen-charged (1.2 wppm hydrogen content) N-C1 steel, respectively. Side views of the samples are presented in Error! Reference source not found.b,e.
The ductile fracture of the uncharged sample is effortlessly characterized by a reduced fracture area and a distinctive cup-and-cone appearance, as seen in Error! Reference source not found.a,b. Ductile fracture typically occurs in two stages: initial necking and void formation, followed by void coalescence and eventual shear lip formation. The cup-and-cone morphology features a central fibrous region surrounded by a shear lip at an angle, indicative of significant plastic deformation and energy absorption prior to fracture. In the central regions, the fracture surface is characterized by dimple fracture features (Error! Reference source not found.c). These dimples result from the nucleation, growth, and coalescence of micro-voids, reflecting the material's ability to undergo substantial plastic strain before failure. The morphology of the shear lip region in the uncharged sample is dominated by shear dimples that are elongated and oriented along the direction of shear (Error! Reference source not found.a). Compared to the central fibrous region, the shear lip region tends to have a smoother and more streamlined appearance.
Figure 7.
SEM fracture surfaces of N-C1 tensile samples; a) CH=0 (Uncharged) b) Side view of “a” c) Magnification of green area in “a” d) CH=1.2 wppm e) Side view of “d” f) Magnification of green area in “d” .
Figure 7.
SEM fracture surfaces of N-C1 tensile samples; a) CH=0 (Uncharged) b) Side view of “a” c) Magnification of green area in “a” d) CH=1.2 wppm e) Side view of “d” f) Magnification of green area in “d” .
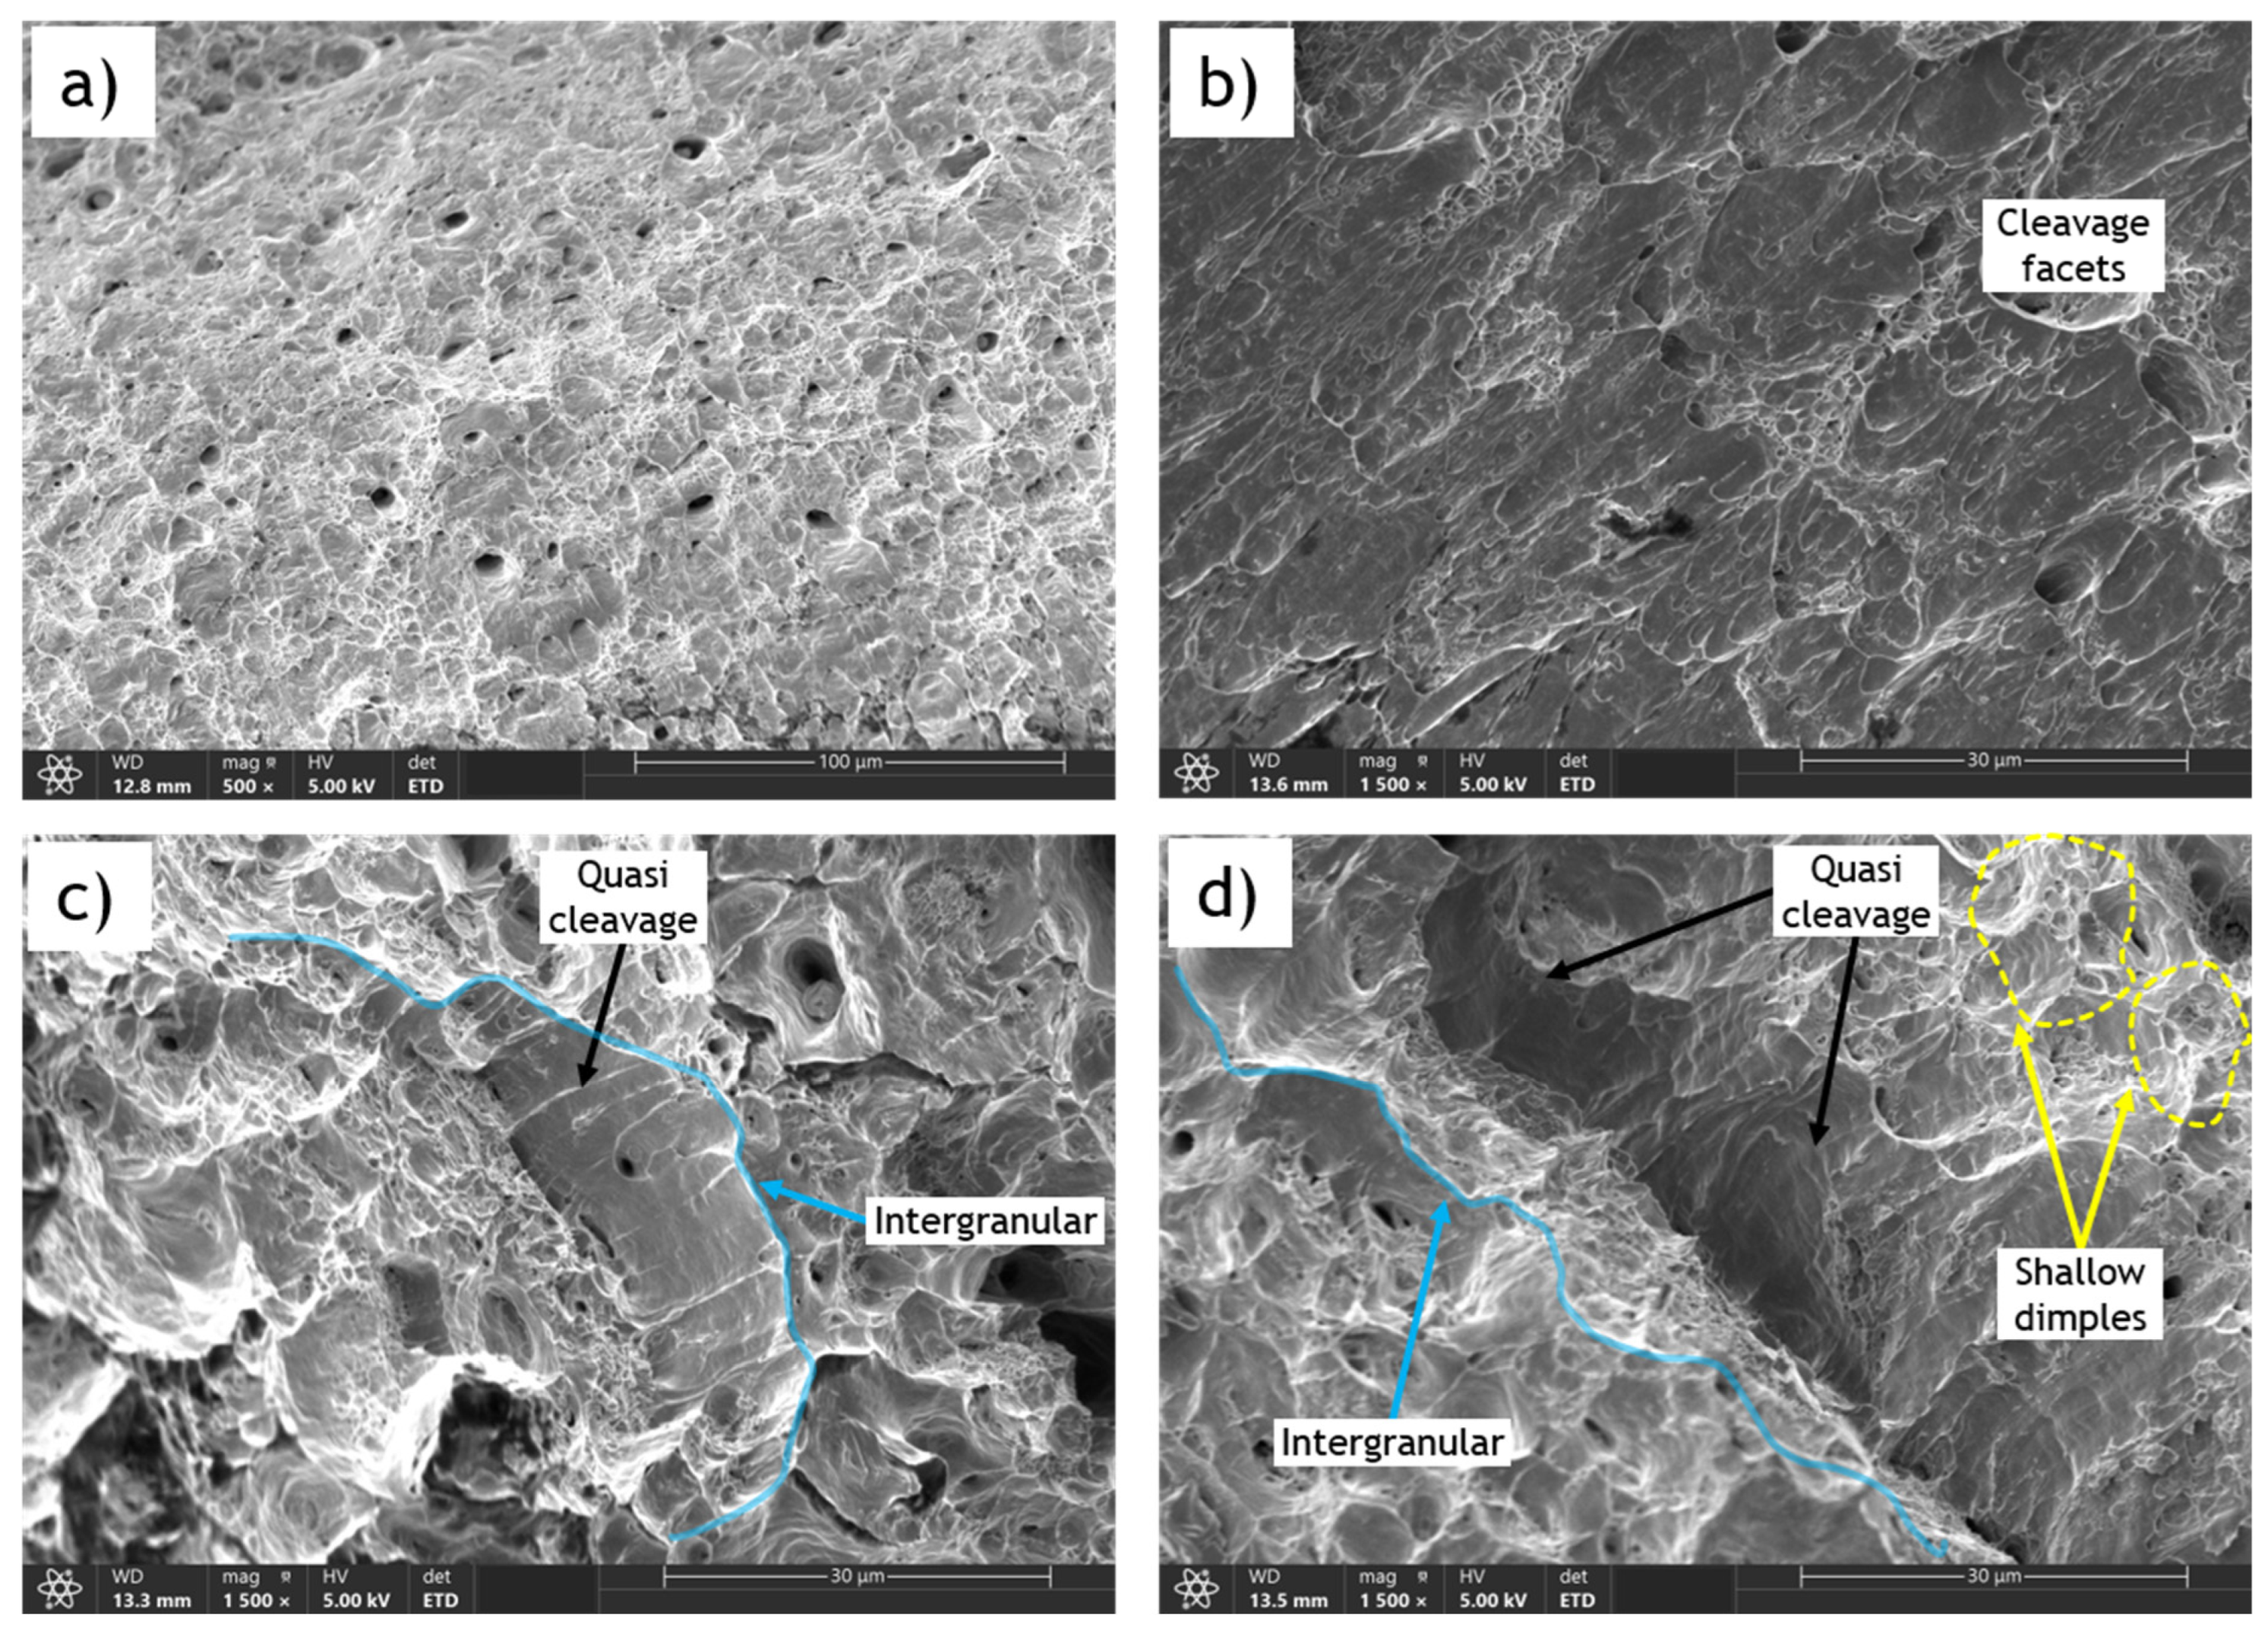
In contrast, the fracture surface of the sample charged with 1.2 wppm hydrogen content shows two distinctive regions: the central and marginal (or edge) zones, with remarkably different characteristics. The cup-and-cone appearance with a shear lip is not observed; instead, the edges of the fracture surface are sharp (Error! Reference source not found.e), highlighting the complexity of the fracture process. The central region (Error! Reference source not found.f) is characterized by dimple fracture features similar to those of the uncharged sample, but the dimples are shallower and some microcracks are present, indicating brittleness imposed by hydrogen diffusion. Additionally, the size of the central zone is considerably smaller compared to the uncharged sample. The most apparent difference in the fracture surface of the hydrogen embrittled sample can be observed in the marginal or edge zone. During charging, hydrogen forms on the surface of the material and gradually permeates from the exterior to the interior, resulting in higher hydrogen concentrations at the exterior zones. In the marginal zones, brittle fracture characteristics are distinctly observed, including cleavage facets (Error! Reference source not found.b), quasi-cleavage facets, and intergranular fracture (Error! Reference source not found.c,d).
Cleavage facets form in steel due to hydrogen embrittlement from the highly localized and rapid propagation of cracks along specific crystallographic planes. Hydrogen atoms diffuse into the steel lattice, weakening atomic bonds and causing embrittlement. When stressed, these weakened regions are more prone to fracture, and cracks propagate along crystallographic planes, creating cleavage facets. Stress concentrations or material defects can initiate cracks along these preferred planes, which then propagate rapidly through the material along the path of least resistance. Consequently, the fracture surface exhibits flat, shiny facets perpendicular to the applied stress direction. Quasi-cleavage facets resemble cleavage facets but are less well-defined and may appear slightly curved. Intergranular fracture occurs along grain boundaries, indicating a failure mode where hydrogen-induced embrittlement weakens these boundaries, making them preferential paths for fracture propagation.
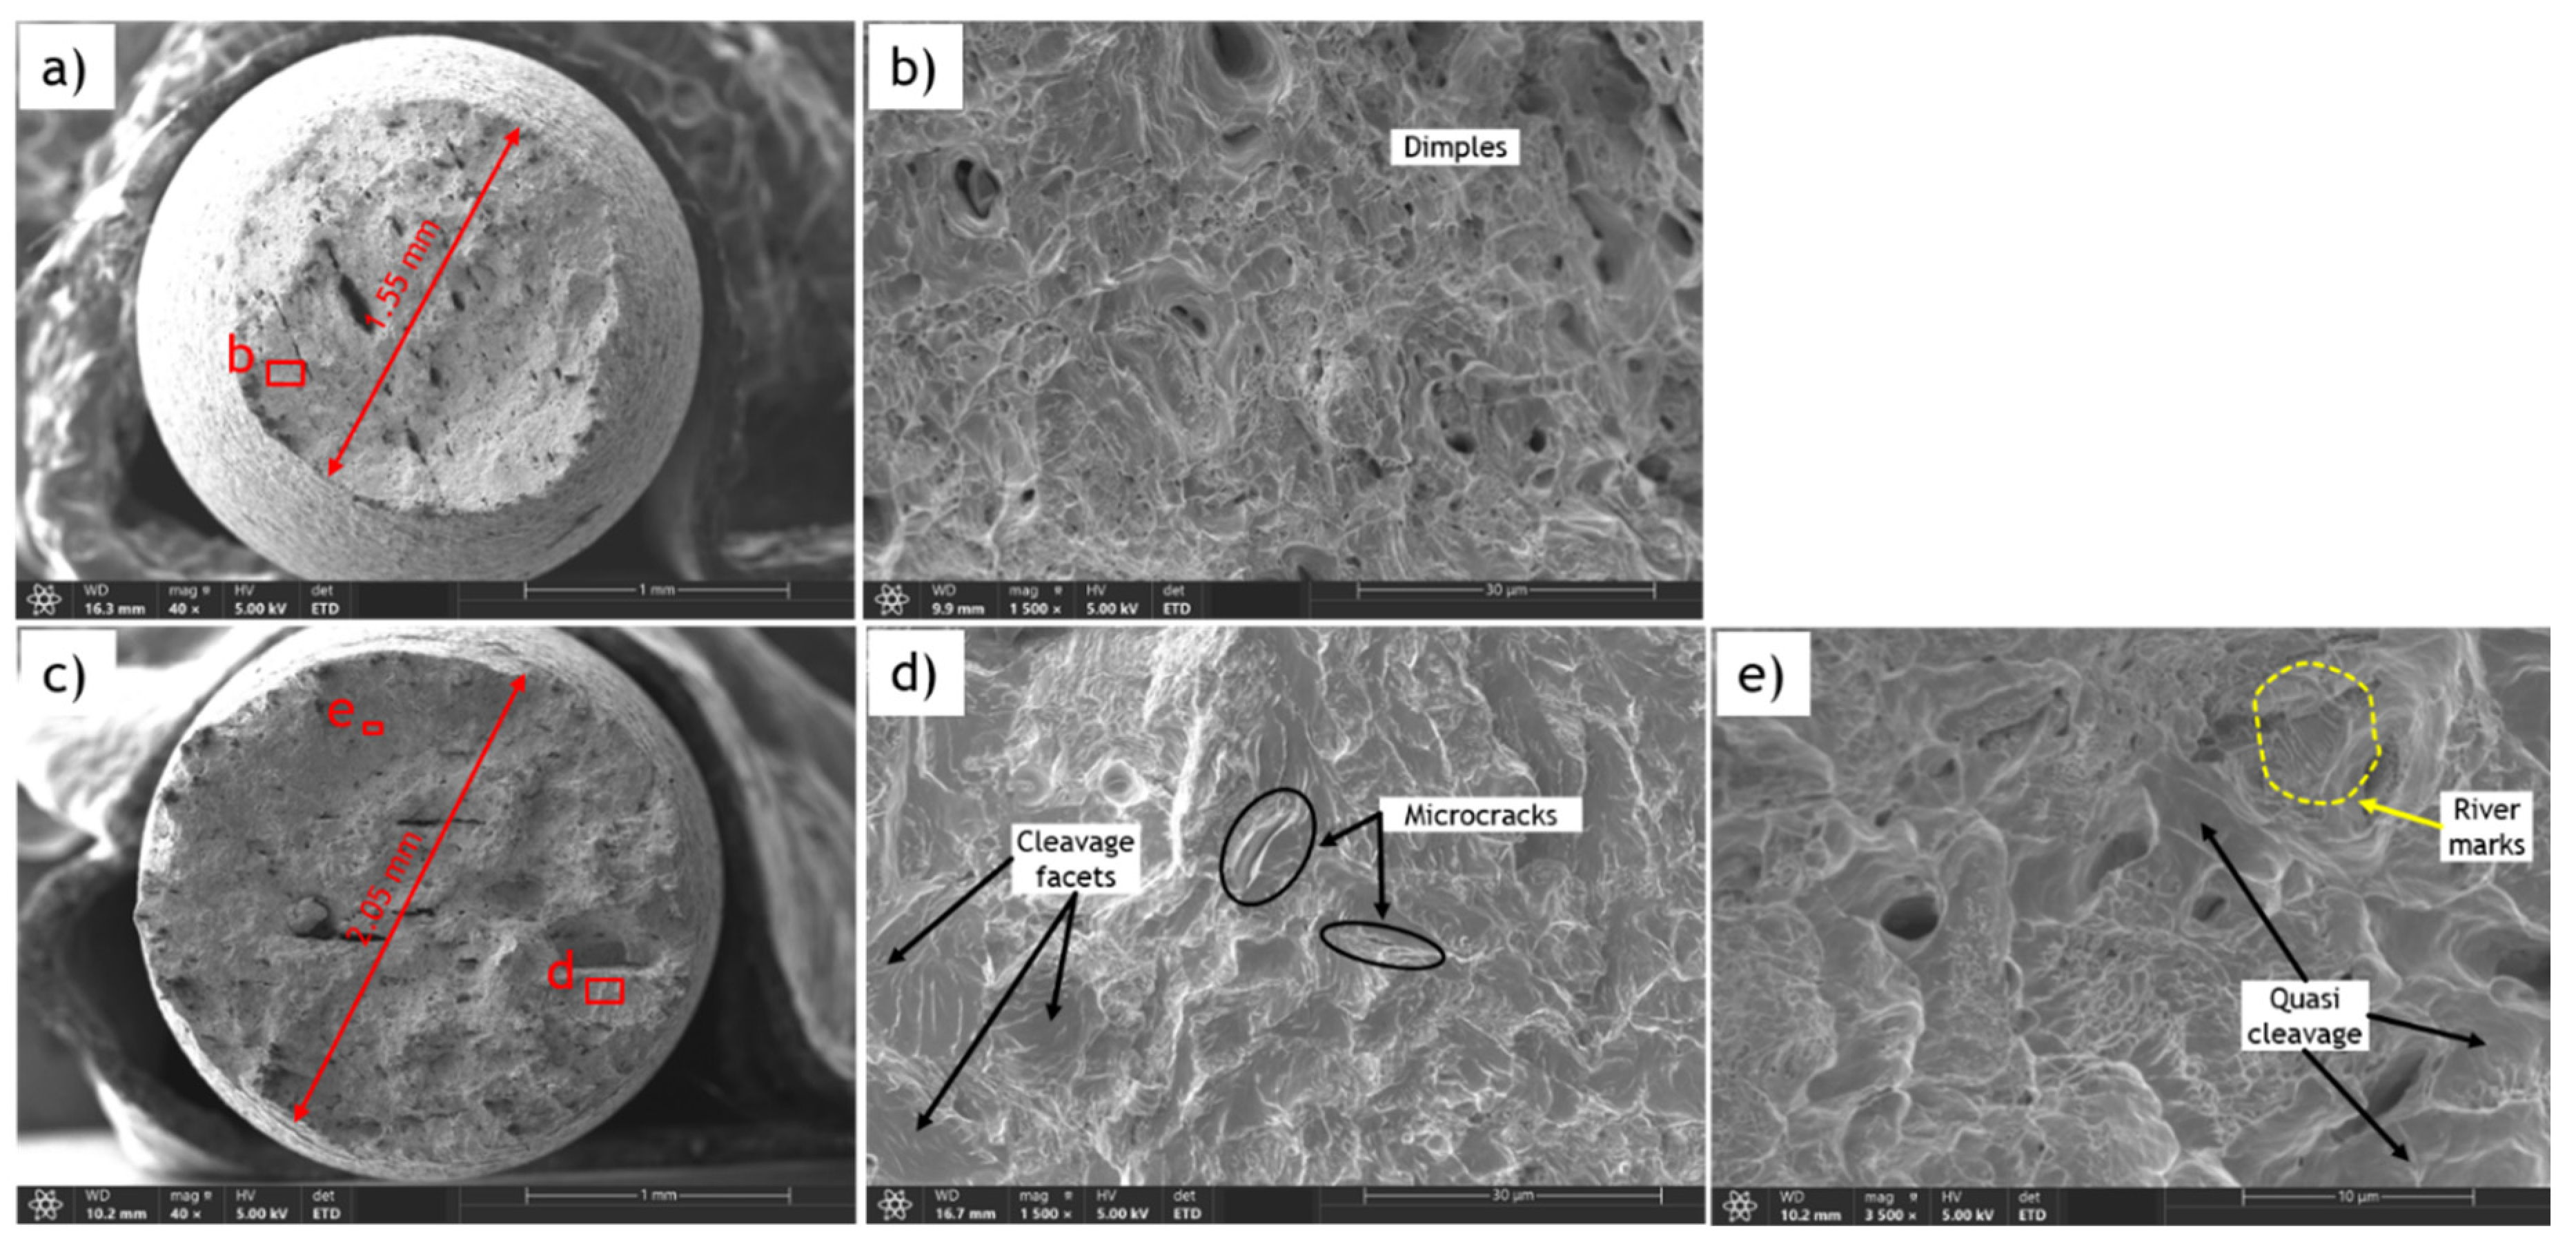
Error! Reference source not found.a-e show the fracture surfaces of an uncharged sample and a sample charged with 0.5 wppm hydrogen content of AO-C1 steel. The reduced fracture area can be observed by comparing Error! Reference source not found.a and Error! Reference source not found.e. While the reduction in area for the uncharged sample is approximately 63%, it is only 35% for the charged sample. Furthermore, the fracture surface of the uncharged sample exhibits ductile dimple features, as shown in Error! Reference source not found.b. In contrast, the fracture surface of the hydrogen-charged sample displays features indicative of brittle fracture induced by HE, such as cleavage facets, microcracks (Error! Reference source not found.d), quasi-cleavage facets, and river marks (Error! Reference source not found.e).
Figure 8.
SEM fracture surfaces of N-C1 tensile samples; a) Magnification of red area marked by “a” in
Figure 7a b) Magnification of red area marked by “b” in
Figure 7d c) Magnification of red area marked by “c” in
Figure 7d d) Magnification of red area marked by “d” in
Figure 7d.
Figure 8.
SEM fracture surfaces of N-C1 tensile samples; a) Magnification of red area marked by “a” in
Figure 7a b) Magnification of red area marked by “b” in
Figure 7d c) Magnification of red area marked by “c” in
Figure 7d d) Magnification of red area marked by “d” in
Figure 7d.
Figure 9.
SEM fracture surfaces of AO-C1 tensile samples; a) CH=0 (Uncharged) b) Magnification of red area marked by “b” c) CH=1.2 wppm d) Magnification of red area marked by “d” e) Magnification of red area marked by “e”.
Figure 9.
SEM fracture surfaces of AO-C1 tensile samples; a) CH=0 (Uncharged) b) Magnification of red area marked by “b” c) CH=1.2 wppm d) Magnification of red area marked by “d” e) Magnification of red area marked by “e”.
Fatigue Behavior
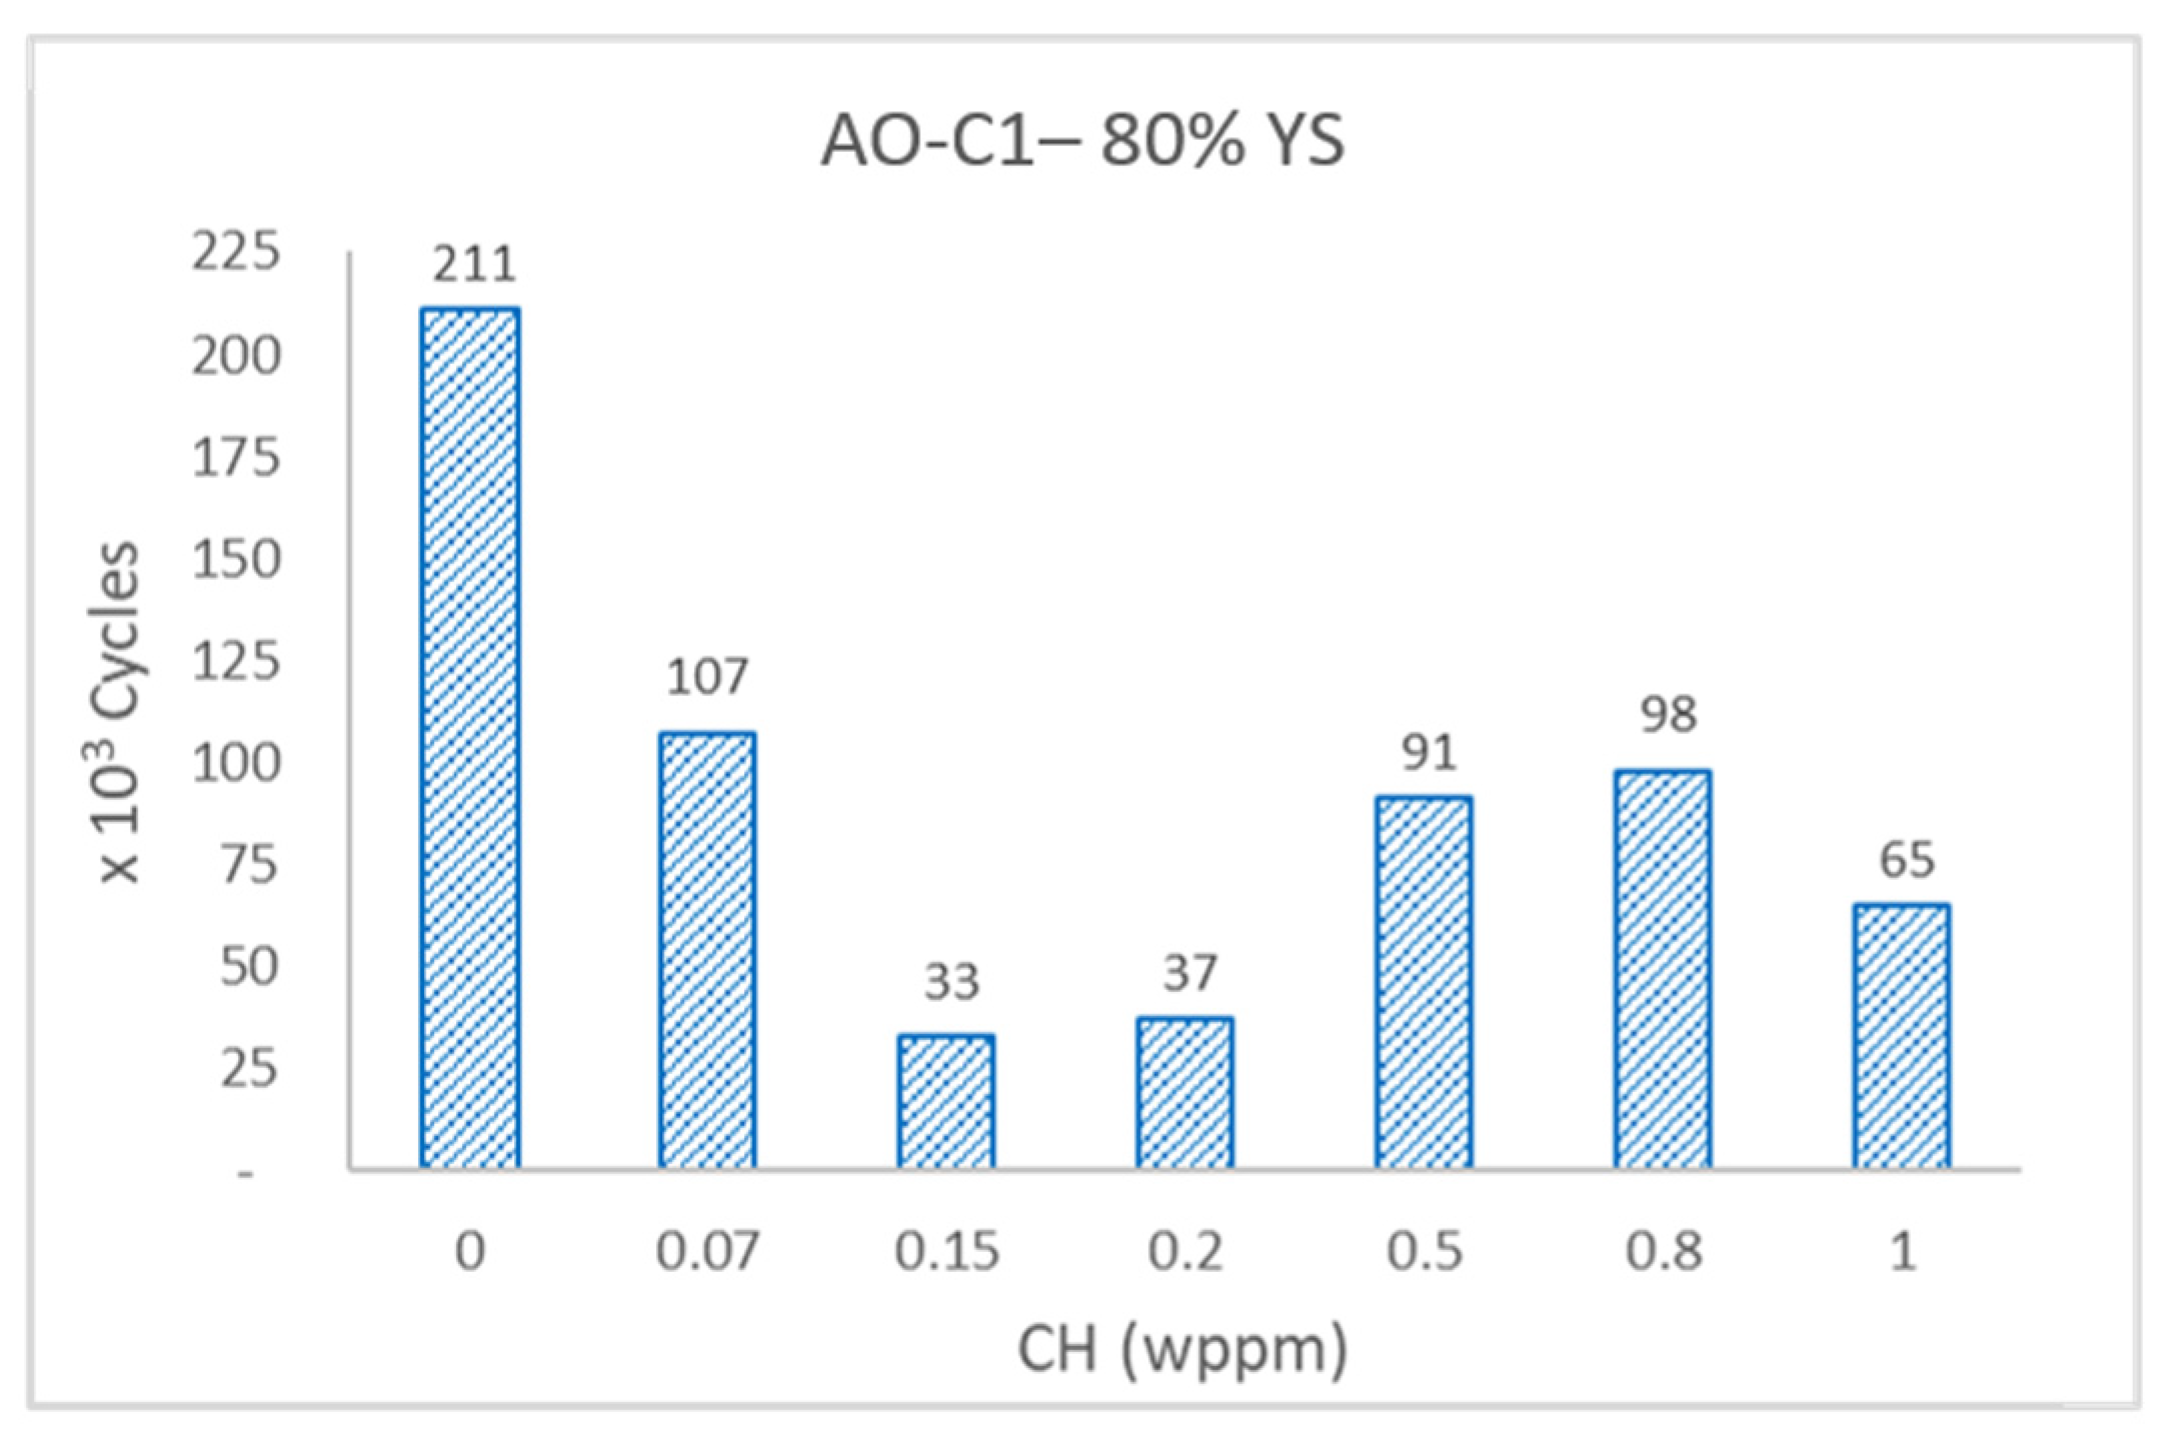
Error! Reference source not found.a,b shows the fatigue results of AO-C1 samples in bar graph format. It is important to note that the specimens were machined from a section of pipe with a prolonged service history. Thus, the relatively low number of fatigue cycles reflects the remaining fatigue life of the specimens and cannot be directly compared to steels of a similar grade with no service history. Despite the inherent scatter typically seen in fatigue test results, it is evident that specimens have experienced a substantial decrease in fatigue life with increasing hydrogen content. Specifically, the specimen exhibited approximately a 70% reduction in fatigue life at 1 wppm hydrogen content. This significant decline in fatigue life due to HE aligns with the findings of Meng et al. [
50] and Faucon et al. [
51], however they employed different methodologies. Both studies utilized in-situ gaseous hydrogen charging, contrasting with the electrochemical hydrogen charging method employed in this study, and while Meng estimated fatigue life using fatigue crack growth rate models, Faucon conducted actual fatigue life tests.
Figure 10.
Effect of hydrogen content on fatigue life of AO-C1 specimens tested at 80% YS.
Figure 10.
Effect of hydrogen content on fatigue life of AO-C1 specimens tested at 80% YS.
Fatigue test results for N-C1 specimens are shown in Error! Reference source not found.a,b. Error! Reference source not found.a presents the results for specimens tested at 80% of YS of the material, while Error! Reference source not found.b shows the results for specimens tested at 50% of YS. At 50% YS, the maximum stress at the specimen's neck center is equivalent to the imposed stress on AO-C1 specimens (278 MPa). This means that when tested at the same stress levels, N-C1 specimens demonstrated a higher fatigue life compared to AO-C1 samples, with uncharged N-C1 samples showing approximately 1.5 times more fatigue cycles. However, it should be noted that AO-C1 specimens have a considerably prolonged service history.
Figure 11.
Effect of hydrogen content on fatigue life of N-C1 specimens tested at; a) 50% YS b) 80% YS.
Figure 11.
Effect of hydrogen content on fatigue life of N-C1 specimens tested at; a) 50% YS b) 80% YS.
When tested at 80% YS, N-C1 specimens exhibited significantly fewer fatigue cycles compared to AO-C1 samples tested at 80% YS. Based on tensile tests, the ductility of AO-C1 is higher than N-C1, and it is generally believed that ductile materials exhibit better fatigue resistance, though fracture toughness is a more accurate indicator of this property [
67]. Moreover, the poor fatigue resistance of N-C1 steels at higher values of stresses can be attributed to their microstructure, which includes numerous pores as shown in
Error! Reference source not found.. In uncharged samples, these pores can act as stress concentration points, reducing the fatigue life of the specimens.
Similar to AO-C1 samples, the fatigue life of N-C1 samples decreased after hydrogen charging. However, the impact of hydrogen content on fatigue life reduction is not as severe in N-C1 samples. For instance, at 1 wppm hydrogen content, the fatigue life decreased by approximately 23%, significantly lower than the 70% reduction observed in AO-C1 samples at the same hydrogen content when both were tested at 80% of their respective yield strengths. This difference can be attributed to the presence of pores in the microstructure of N-C1 steel. Generally, pores can act as either reversible or irreversible trapping sites for hydrogen, depending on their specific characteristics. Yaktiti et al. [
68] investigated the role of porosities in hydrogen diffusion in steel, demonstrating that pores act as reversible trap sites. These pores delay hydrogen diffusion, and the trapped hydrogen can be desorbed from these sites at room temperature. Therefore, the higher hydrogen content in N-C1 steel can be attributed to reversible hydrogen trapped in porosities that desorb during testing, not contributing to the hydrogen embrittlement of the specimens.
Figure 12.
Observed porosities in N-C1 microstructure; a) As polished (not etched) specimen to avoid impact from etchant b) Magnification of the yellow square in “a” c) 3d profile of the pores in “b”.
Figure 12.
Observed porosities in N-C1 microstructure; a) As polished (not etched) specimen to avoid impact from etchant b) Magnification of the yellow square in “a” c) 3d profile of the pores in “b”.
Fractography of Fatigue Samples
Fracture surfaces of fatigue specimens, both uncharged and hydrogen-charged with varying hydrogen content, were analyzed using SEM. In the study of fatigue failure surfaces, three primary features are consistently observed: the origin, the fatigue zone, and the overload zone. The origin is the point where the crack initiates. A single crack origin typically suggests a failure under low overstress conditions, whereas multiple origins might indicate high stress or significant stress concentrations. The crack then propagates slowly through the fatigue zone, where progression marks (or beach marks) are usually observed. Eventually, the crack reaches a critical size, and the remaining material can no longer sustain the applied stress, leading to the overload zone. In this zone, most cracks exhibit macroscopically brittle fracture characteristics.
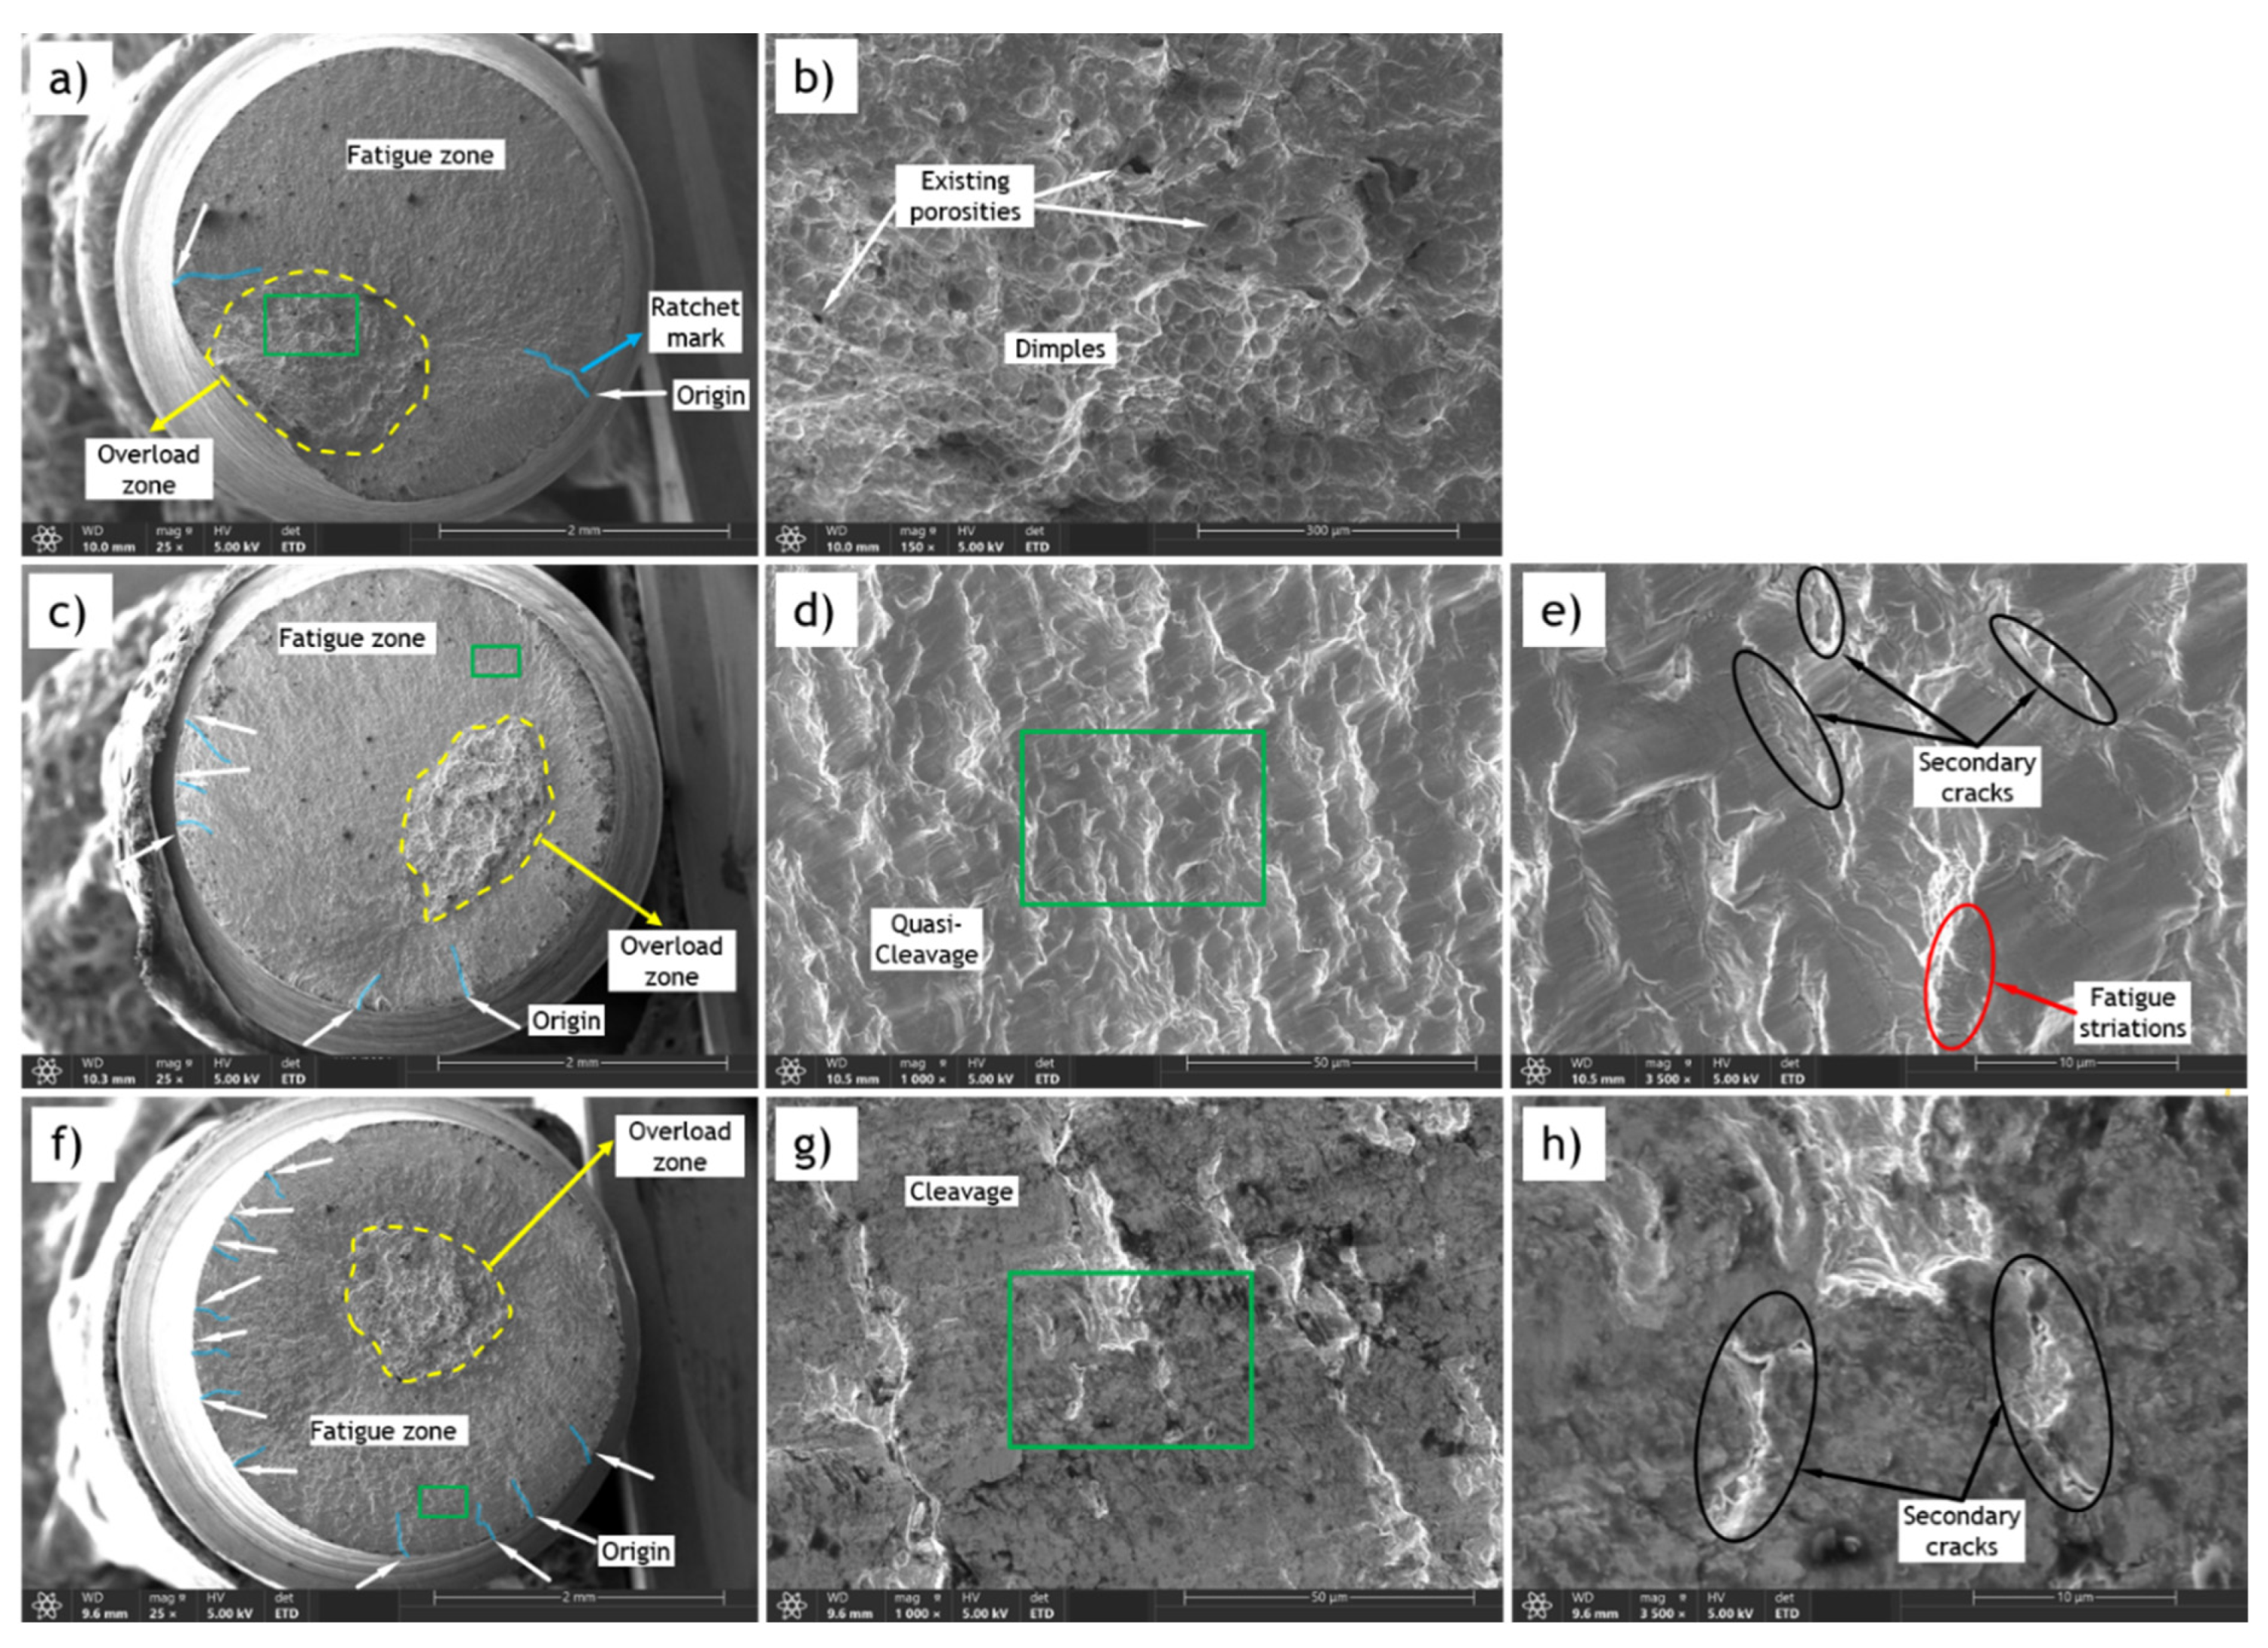
The fractography of N-C1 fatigue samples tested at 50% of YS is provided in Error! Reference source not found.a-h. In these figures, the overload zone is marked with a dashed yellow line, crack origins are marked with white arrows, and ratchet marks are highlighted with transparent blue lines. The green square indicates the area for which the magnified image is provided in the adjacent figure.
Figure 13.
SEM fracture surfaces of N-C1 fatigue samples tested at 50% of YS; a) CH=0 (Uncharged) b) Magnification of green area in “a” c) CH=0.8 wppm d) Magnification of green area in “c” e) Magnification of green area in “d” f) CH=2.0 wppm g) Magnification of green area in “f” h) Magnification of green area in “g”.
Error! Reference source not found.b shows the overload zone for the uncharged (CH=0) sample, featuring dimples characteristic of ductile fracture. The morphology of this zone is similar in the two hydrogen-charged samples. However, its location shifts to the center of the fracture surface in charged samples, indicative of higher stresses [
68]. As similar bending stress is applied to all samples during the test, this increase in stress can be explained by the HELP mechanism. According to this theory, hydrogen presence around dislocations leads to a local decrease in yield stress, facilitating local dislocation movement [
25]. This effectively increases the ratio of imposed stress to local yield stress.
Additionally, Error! Reference source not found.c&f show an increase in the number of crack origins and ratchet marks with higher hydrogen content. The sample with 2 wppm hydrogen content exhibits a significantly higher number of origins. This increase in crack initiation sites is attributed to hydrogen-induced defects and microcracks, indicative of HE.
The fatigue zone also shows a quasi-cleavage surface in the sample with 0.8 wppm hydrogen content, which transitions to a cleavage surface in the sample with 2 wppm hydrogen content, reflecting the reduced ductility caused by HE, as illustrated in Error! Reference source not found.d and Error! Reference source not found.g. Moreover, there is an increase in the number and density of secondary cracks, as hydrogen promotes crack branching and secondary crack formation. This is evident from Error! Reference source not found.e and Error! Reference source not found.h, where higher hydrogen content correlates with larger secondary cracks.
Figure 14.
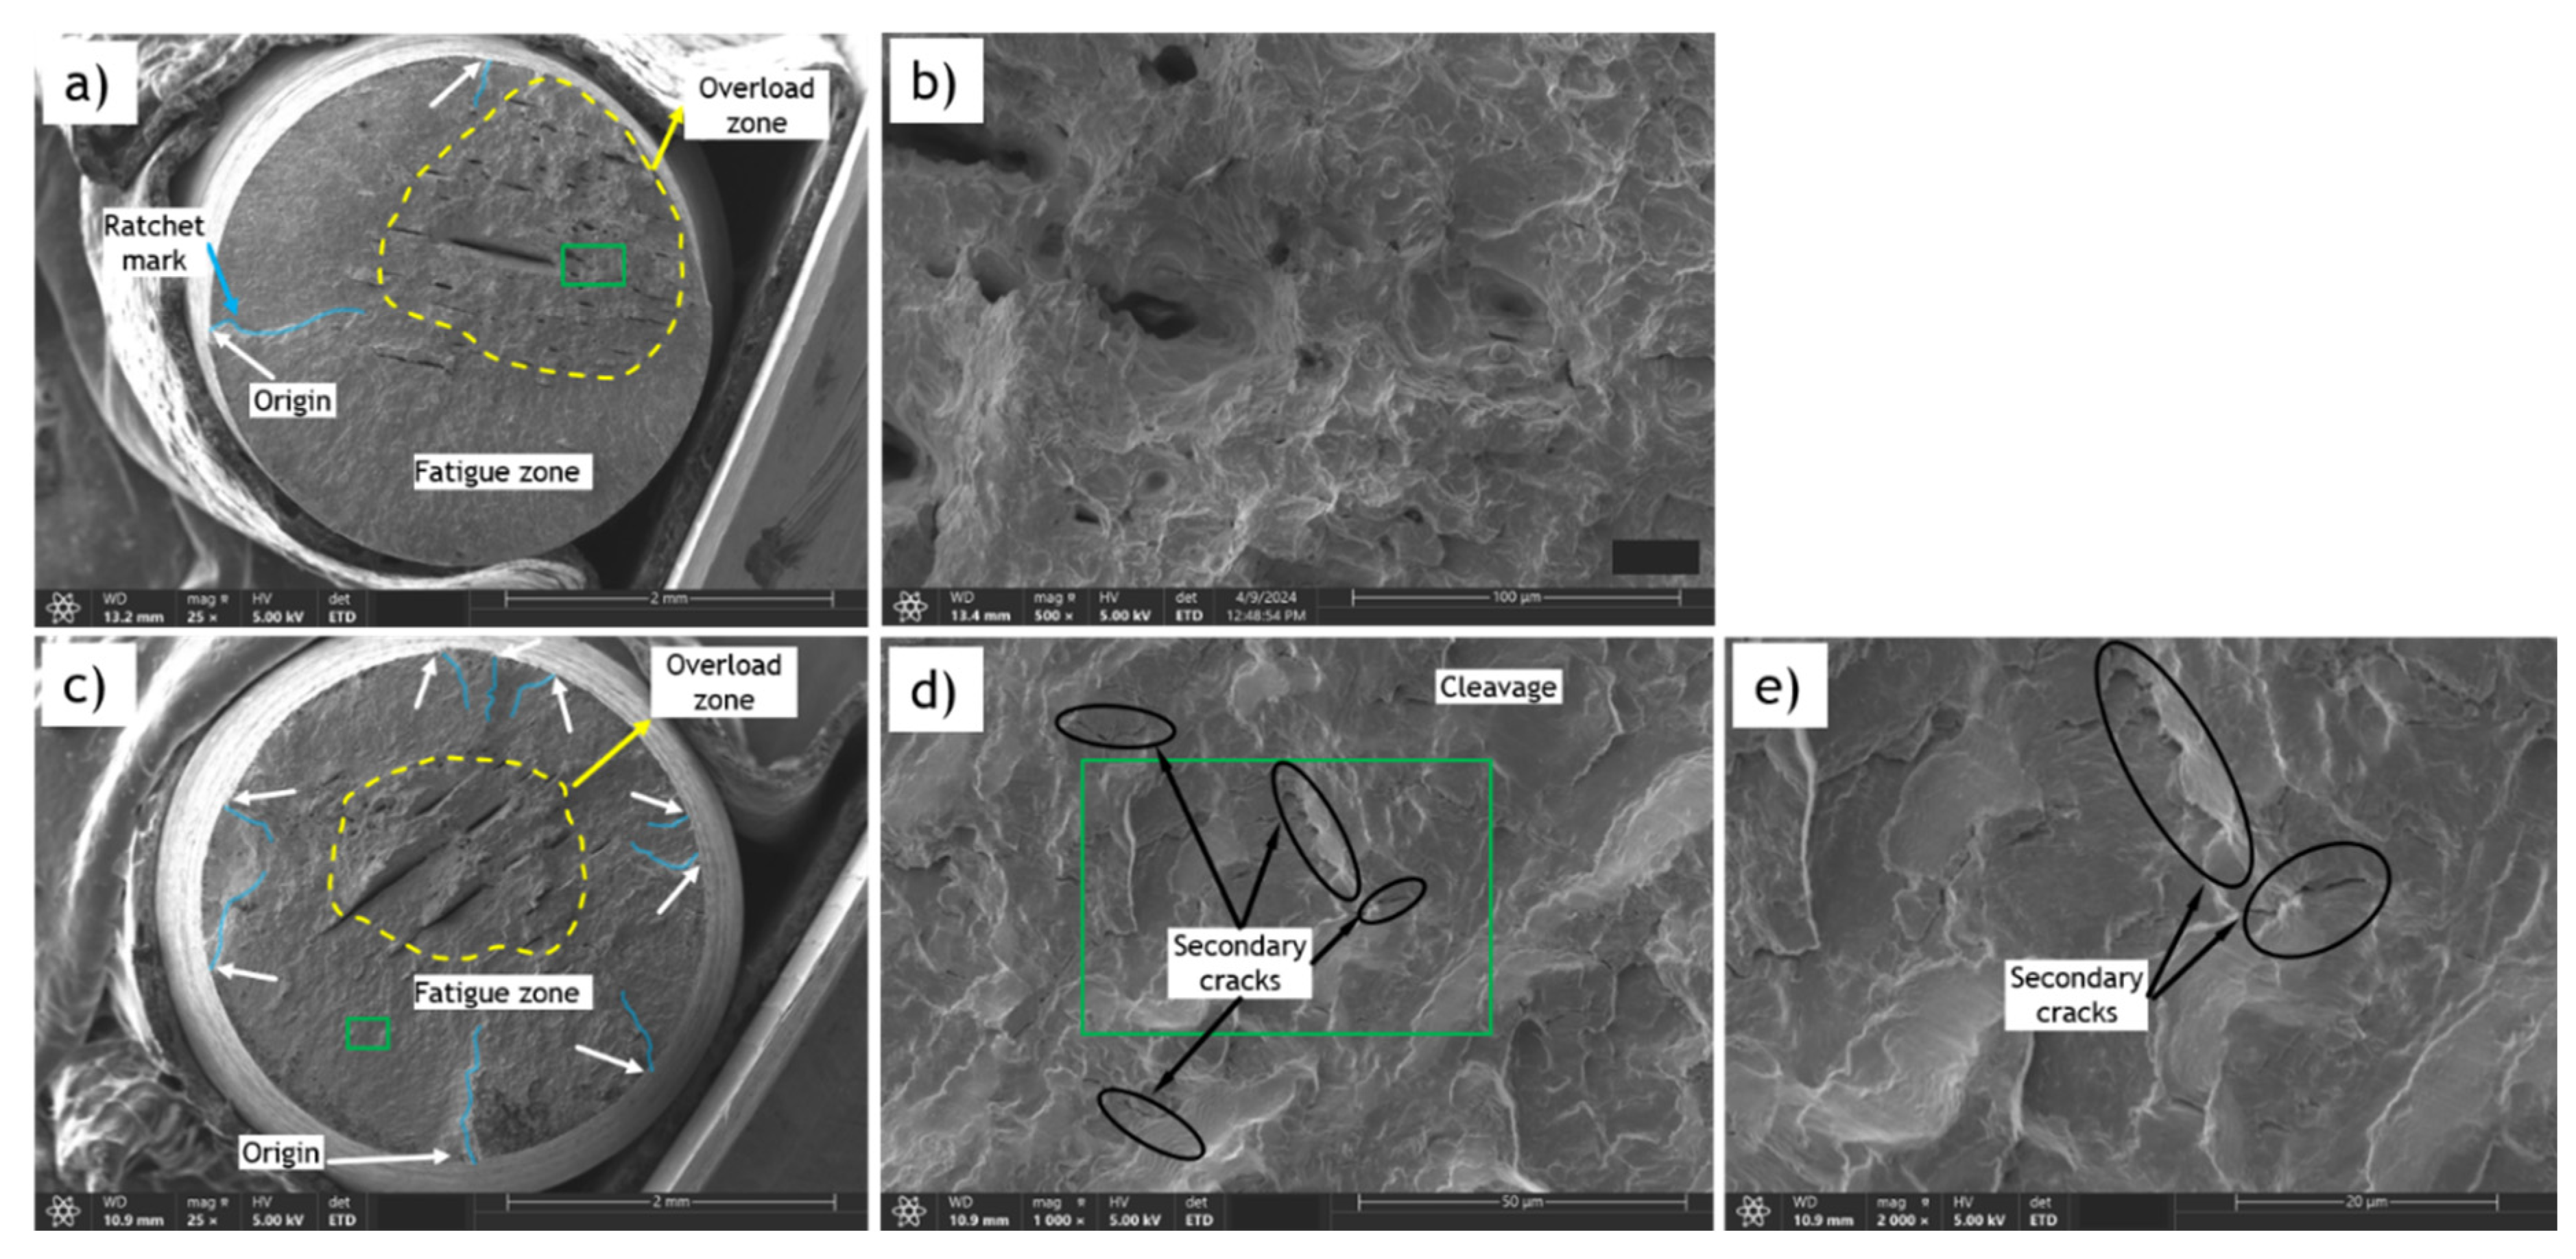
SEM fracture surfaces of AO-C1 fatigue samples (base metal) tested at 80% of YS; a) CH=0 (Uncharged) b) Magnification of green area in “a” c) CH=1.0 wppm d) Magnification of green area in “c” e) Magnification of green area in “d”.
Figure 14.
SEM fracture surfaces of AO-C1 fatigue samples (base metal) tested at 80% of YS; a) CH=0 (Uncharged) b) Magnification of green area in “a” c) CH=1.0 wppm d) Magnification of green area in “c” e) Magnification of green area in “d”.
Similar features were observed in the fracture surfaces of AO-C1 fatigue samples and N-C1 fatigue samples tested at 80% YS. Error! Reference source not found.a-h shows the SEM images for uncharged and charged samples (with 1.0 wppm hydrogen content) from AO-C1 steel. The primary difference between these images with those of N-C1 steel lies in the morphology of the overload zone, which exhibits more ductile features in AO-C1 samples. This is attributed to the fact that AO-C1 steel is inherently more ductile than N-C1 steel.
