Submitted:
14 June 2024
Posted:
20 June 2024
You are already at the latest version
Abstract
Keywords:
MSC: 60E05; 62H30
1. Introduction
2. Material and Methods
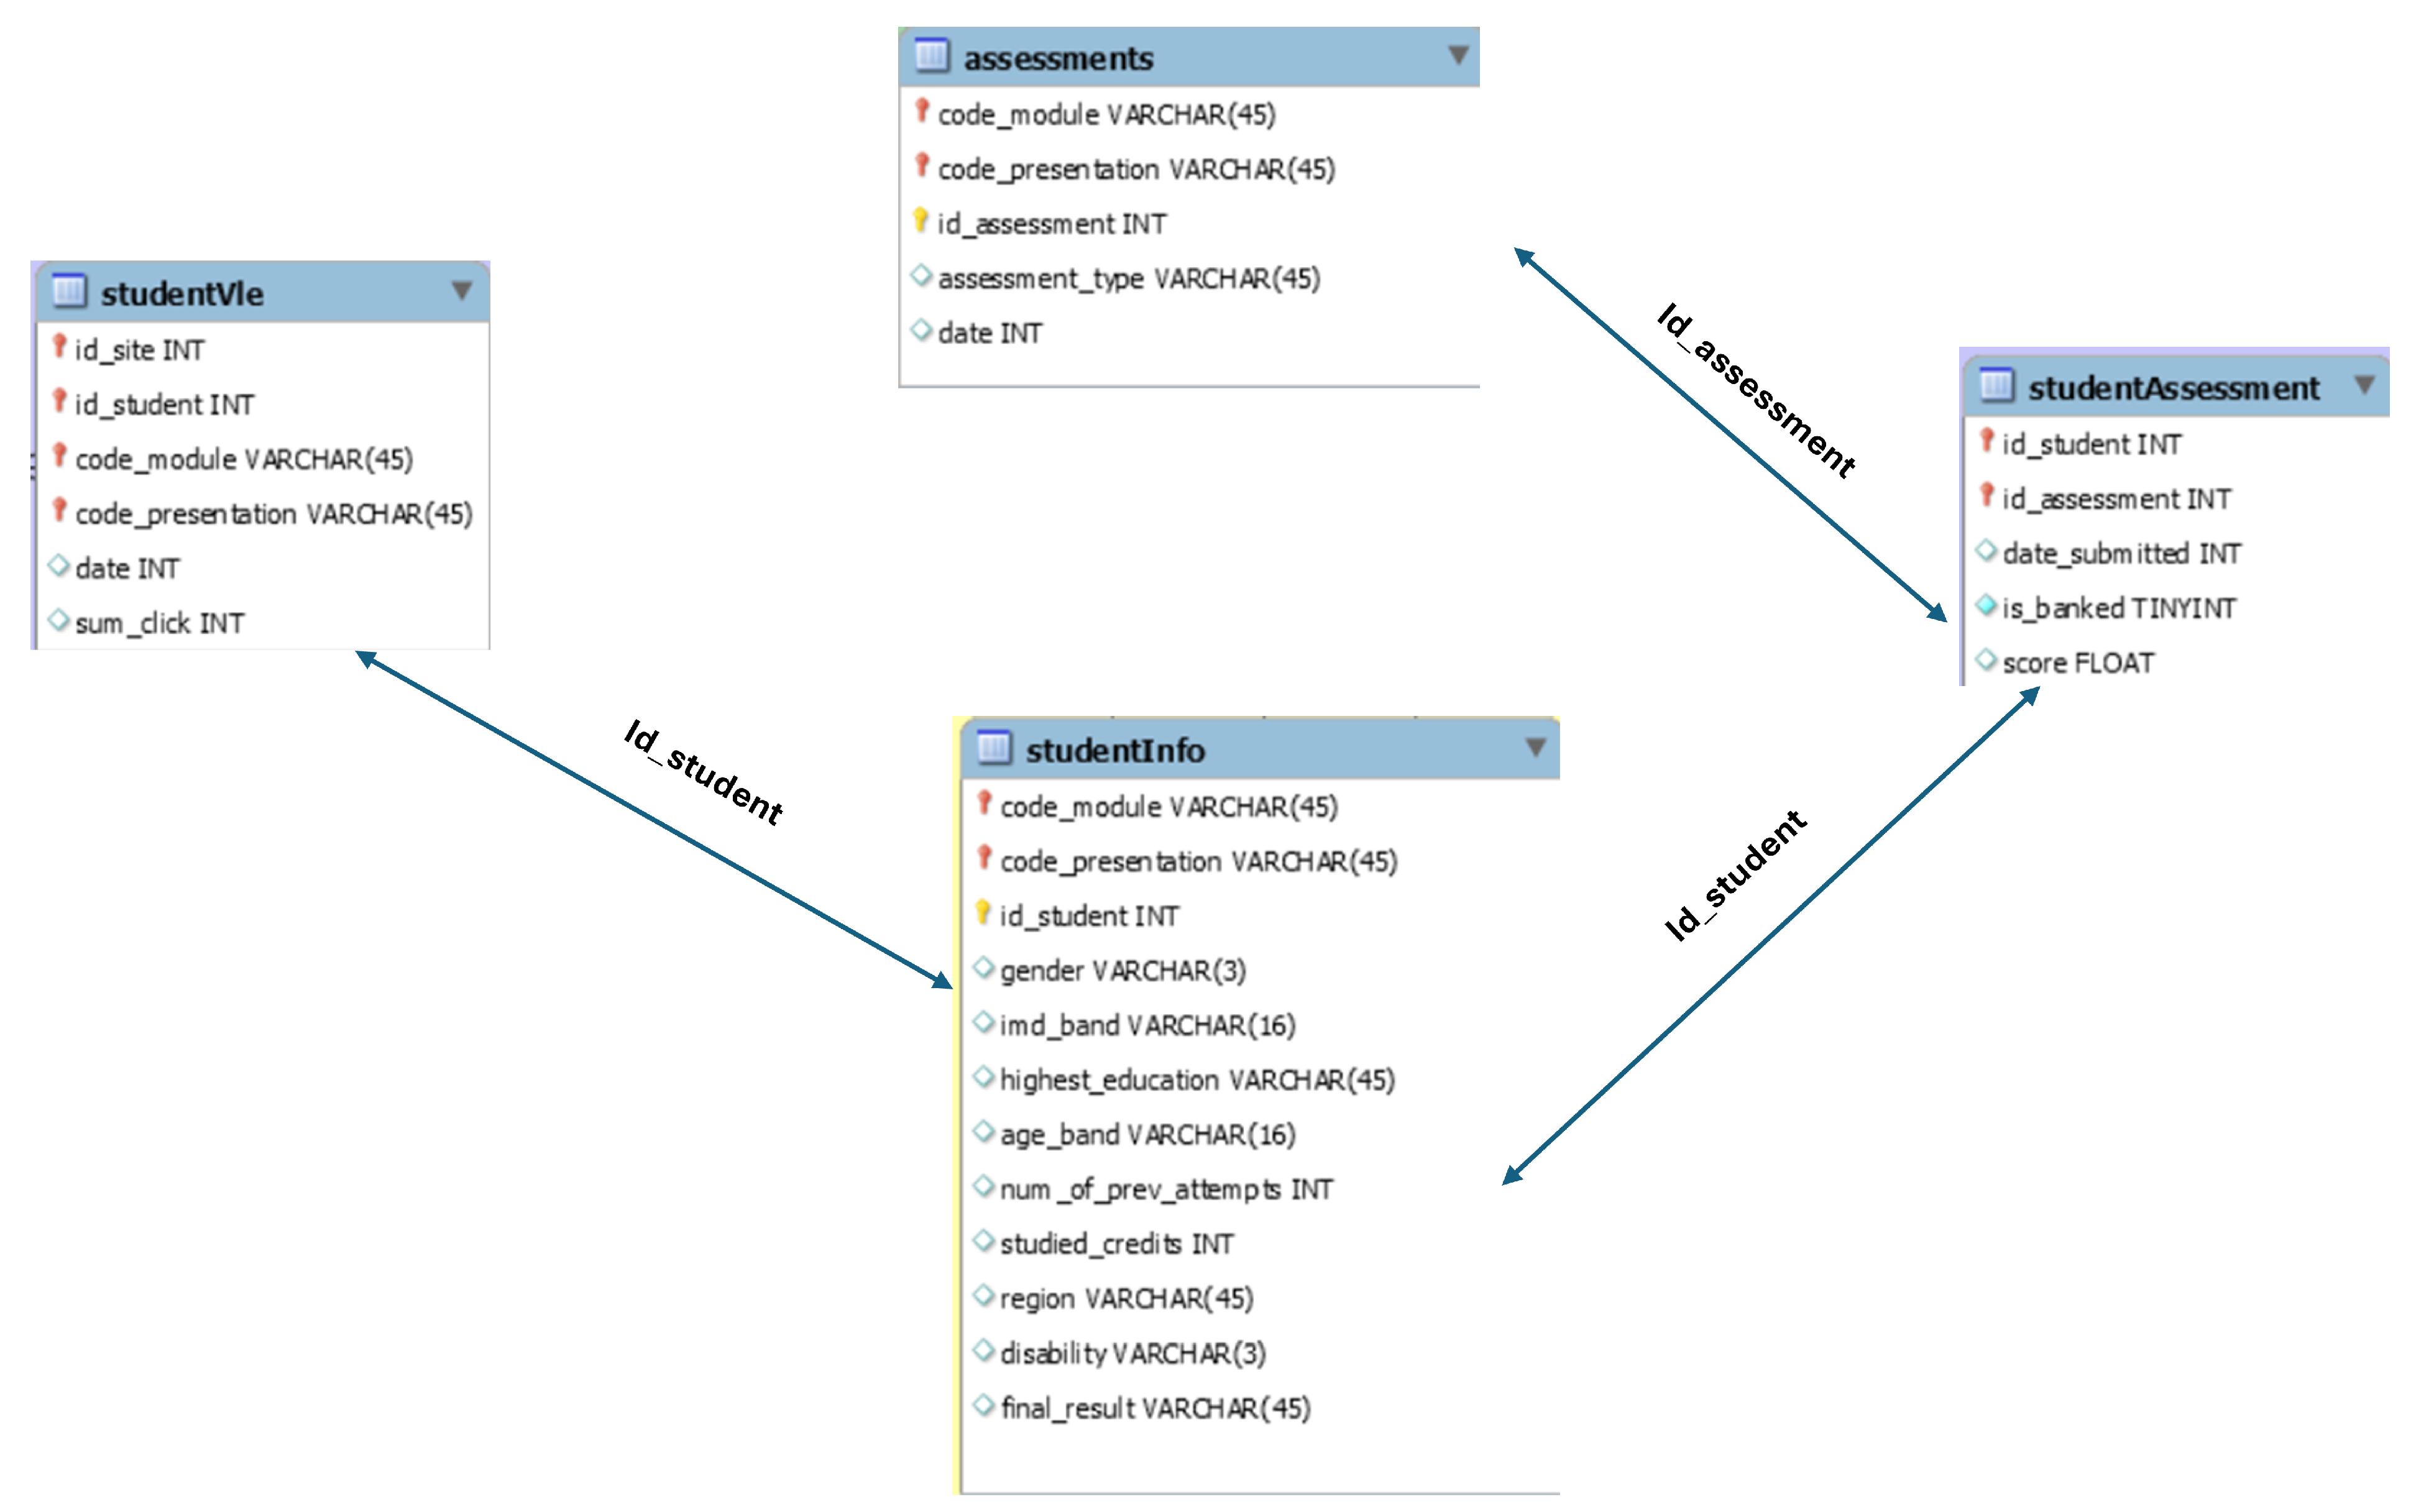
2.1. Dataset
2.2. Data Pre-Processing
2.2.1. Data Partitioning
2.2.2. Over-Sampling of the Unbalanced Data
2.3. Ensemble Models
2.3.1. Random Forest
- Data Preparation: Split the dataset into training and testing sets.
- Model Training: Train multiple decision trees on different subsets of the data.
- Aggregation: Aggregate the predictions from all trees to form the final prediction.
2.3.2. Gradient Boosting
- Initialization: Start with an initial model, typically a simple decision tree.
- Sequential Training: Train subsequent models to predict the residuals (errors) of the previous models.
- Combination: Combine the predictions of all models to produce the final output.
2.3.3. ExtraTrees
- Data Preparation: Split the dataset into training and testing sets.
- Model Training: Train multiple extremely randomized trees on different subsets of the data.
- Aggregate the predictions from all trees to form the final prediction.
2.3.4. AdaBoost
- Initialization: Assign equal weights to all training instances.
- Sequential Training: Train a weak learner and adjust weights based on classification errors.
- Combination: Combine the weak learners’ predictions through weighted voting.
2.3.5. Bagging
- Data Preparation: Create multiple bootstrap samples from the training set.
- Model Training: Train a base model on each bootstrap sample.
- Aggregation: Average the predictions of all base models to form the final output.
2.3.6. Proposed Model: Stacking
-
First-Level Training:
- (a)
- Each of the four base models (Random Forest, Gradient Boosting, ExtraTrees, and AdaBoost) is trained on the training dataset.
- (b)
- The trained base models make predictions on the training dataset, and these predictions are used as input features for the meta-learner (Random Forest).
-
Meta-Learner Training:
- (a)
- The meta-learner is typically a simple model, such as logistic regression, which takes the predictions of the base models as input and learns to combine them optimally.
- (b)
- The meta-learner is trained on the predictions made by the base models on the training dataset.
-
Final Predictions:
- (a)
- The trained base models make predictions on the testing dataset.
- (b)
- These predictions are then fed into the trained meta-learner to produce the final predictions.
2.4. Evaluation Criteria
2.4.1. Accuracy
- True Positives (TP): Cases that are correctly predicted as positive.
- True Negatives (TN): Cases that are correctly predicted as negative.
- False Positives (FP): Cases that are incorrectly predicted as positive.
- False Negatives (FN): Cases that are incorrectly predicted as negative.
2.4.2. Precision
2.4.3. Recall
2.4.4. F-Measure
2.4.5. Area Under the Curve (AUC)
- and are consecutive points on the FP axis.
- and are consecutive points on the TP axis.
3. Results and Discussions
4. Conclusions
Author Contributions
Funding
Data Availability Statement
Conflicts of Interest
References
- Romero, C.; Ventura, S. Educational data mining: a review of the state of the art. IEEE Transactions on Systems, Man, and Cybernetics, Part C (applications and reviews) 2010, 40, 601–618. [Google Scholar] [CrossRef]
- Baker, R.S.; Yacef, K.; others. The state of educational data mining in 2009: A review and future visions. Journal of educational data mining 2009, 1, 3–17.
- Jie, H. Assessing Students’ Digital Reading Performance: An Educational Data Mining Approach; Routledge, 2022.
- Dietterich, T.G. Ensemble methods in machine learning. International workshop on multiple classifier systems. Springer, 2000, pp. 1–15.
- Zhou, Z.H. Ensemble methods: foundations and algorithms; CRC press, 2012.
- Rokach, L. Ensemble-based classifiers. Artificial intelligence review 2010, 33, 1–39. [Google Scholar] [CrossRef]
- Breiman, L. Random forests. Machine learning 2001, 45, 5–32. [Google Scholar] [CrossRef]
- Popoola, J.; Yahya, W.B.; Popoola, O.; Olaniran, O.R. Generalized self-similar first order autoregressive generator (gsfo-arg) for internet traffic. Statistics, Optimization & Information Computing 2020, 8, 810–821. [Google Scholar]
- Friedman, J.H. Greedy function approximation: a gradient boosting machine. Annals of statistics, 2001; 1189–1232. [Google Scholar] [CrossRef]
- Liaw, A.; Wiener, M.; others. Classification and regression by randomForest. R news 2002, 2, 18–22.
- Wolpert, D.H. Stacked generalization. Neural networks 1992, 5, 241–259. [Google Scholar] [CrossRef]
- Olaniran, O.R.; Abdullah, M.A.A. Bayesian weighted random forest for classification of high-dimensional genomics data. Kuwait Journal of Science 2023, 50, 477–484. [Google Scholar] [CrossRef]
- Olaniran, O.R.; Alzahrani, A.R.R. On the Oracle Properties of Bayesian Random Forest for Sparse High-Dimensional Gaussian Regression. Mathematics 2023, 11, 4957. [Google Scholar] [CrossRef]
- Mduma, N. Data balancing techniques for predicting student dropout using machine learning. Data 2023, 8, 49. [Google Scholar] [CrossRef]
- Gray, G.; McGuinness, C.; Owende, P.; Hofmann, M. Learning factor models of students at risk of failing in the early stage of tertiary education. Journal of learning analytics 2016, 3, 330–372. [Google Scholar] [CrossRef]
- Siemens, G. Learning analytics: The emergence of a discipline. American Behavioral Scientist 2013, 57, 1380–1400. [Google Scholar] [CrossRef]
- Chatti, M.A.; Dyckhoff, A.L.; Schroeder, U.; Thüs, H. A reference model for learning analytics. International journal of Technology Enhanced learning 2012, 4, 318–331. [Google Scholar] [CrossRef]
- Long, P.; Siemens, G. Penetrating the fog: analytics in learning and education. Italian Journal of Educational Technology 2014, 22, 132–137. [Google Scholar]
- Agudo-Peregrina, Á.F.; Iglesias-Pradas, S.; Conde-González, M.Á.; Hernández-García, Á. Can we predict success from log data in VLEs? Classification of interactions for learning analytics and their relation with performance in VLE-supported F2F and online learning. Computers in human behavior 2014, 31, 542–550. [Google Scholar] [CrossRef]
- Tempelaar, D.T.; Rienties, B.; Giesbers, B.; Gijselaers, W.H. The pivotal role of effort beliefs in mediating implicit theories of intelligence and achievement goals and academic motivations. Social Psychology of Education 2015, 18, 101–120. [Google Scholar] [CrossRef]
- Arnold, K.E.; Pistilli, M.D. Course signals at Purdue: Using learning analytics to increase student success. Proceedings of the 2nd international conference on learning analytics and knowledge, 2012, pp. 267–270.
- Ferguson, R. Learning Analytics: drivers, developments and challenges. Italian Journal of Educational Technology 2014, 22, 138–147. [Google Scholar] [CrossRef]
- Kizilcec, R.F.; Piech, C.; Schneider, E. Deconstructing disengagement: analyzing learner subpopulations in massive open online courses. Proceedings of the third international conference on learning analytics and knowledge, 2013, pp. 170–179.
- Siemens, G.; Long, P. Penetrating the fog: Analytics in learning and education. EDUCAUSE review 2011, 46, 30. [Google Scholar]
- Pal, S. Mining educational data to reduce dropout rates of engineering students. International Journal of Information Engineering and Electronic Business 2012, 4, 1. [Google Scholar] [CrossRef]
- Gupta, A.; Garg, D.; Kumar, P. An ensembling model for early identification of at-risk students in higher education. Computer Applications in Engineering Education 2022, 30, 589–608. [Google Scholar] [CrossRef]
- Hew, K.F.; Hu, X.; Qiao, C.; Tang, Y. What predicts student satisfaction with MOOCs: A gradient boosting trees supervised machine learning and sentiment analysis approach. Computers & Education 2020, 145, 103724. [Google Scholar]
- Kuzilek, J.; Hlosta, M.; Zdrahal, Z. Open university learning analytics dataset. Scientific data 2017, 4, 1–8. [Google Scholar] [CrossRef] [PubMed]
- Olaniran, O.; Abdullah, M. Subset selection in high-dimensional genomic data using hybrid variational Bayes and bootstrap priors. Journal of Physics: Conference Series. IOP Publishing, 2020, Vol. 1489, p. 012030.
- Zheng, Z.; Cai, Y.; Li, Y. Oversampling method for imbalanced classification. Computing and Informatics 2015, 34, 1017–1037. [Google Scholar]
- Geurts, P.; Ernst, D.; Wehenkel, L. Extremely randomized trees. Machine learning 2006, 63, 3–42. [Google Scholar] [CrossRef]
- Freund, Y.; Schapire, R.E. A decision-theoretic generalization of on-line learning and an application to boosting. Journal of computer and system sciences 1997, 55, 119–139. [Google Scholar] [CrossRef]
- Breiman, L. Bagging predictors. Machine learning 1996, 24, 123–140. [Google Scholar] [CrossRef]
- Powers, D.M. Evaluation: from precision, recall and F-measure to ROC, informedness, markedness and correlation. arXiv preprint 2020, arXiv:2010.16061. [Google Scholar]
- Olaniran, O.R.; Alzahrani, A.R.R.; Alzahrani, M.R. Eigenvalue Distributions in Random Confusion Matrices: Applications to Machine Learning Evaluation. Mathematics 2024, 12, 1425. [Google Scholar] [CrossRef]
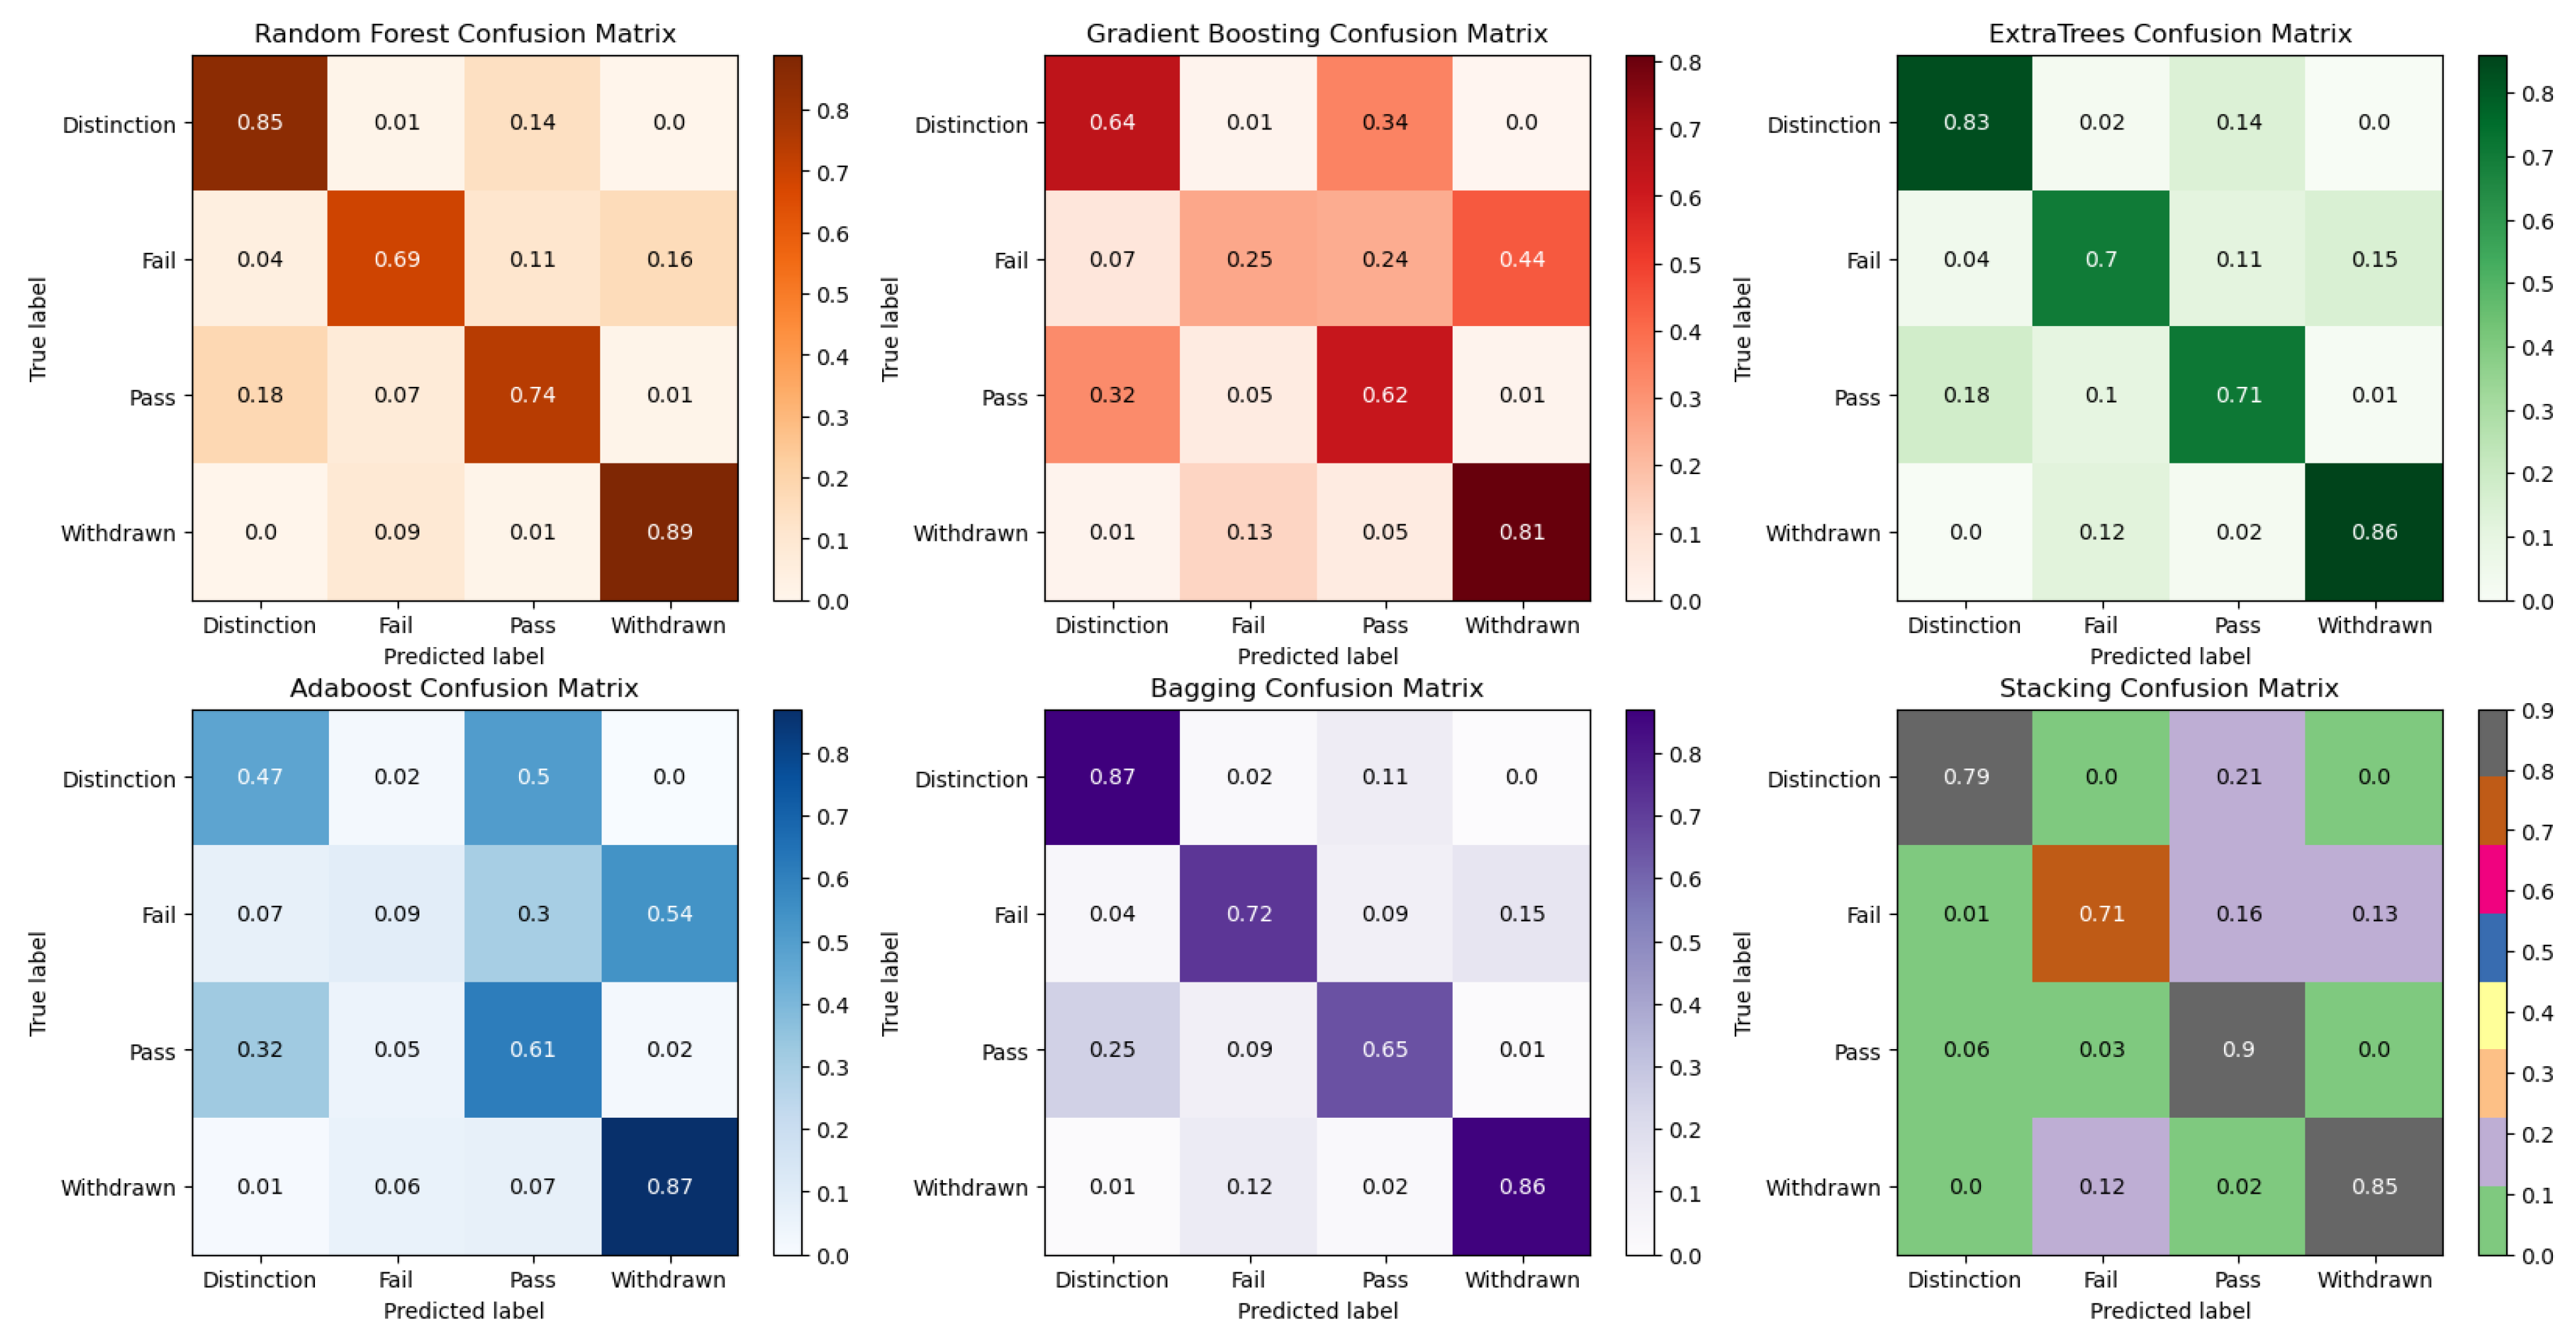
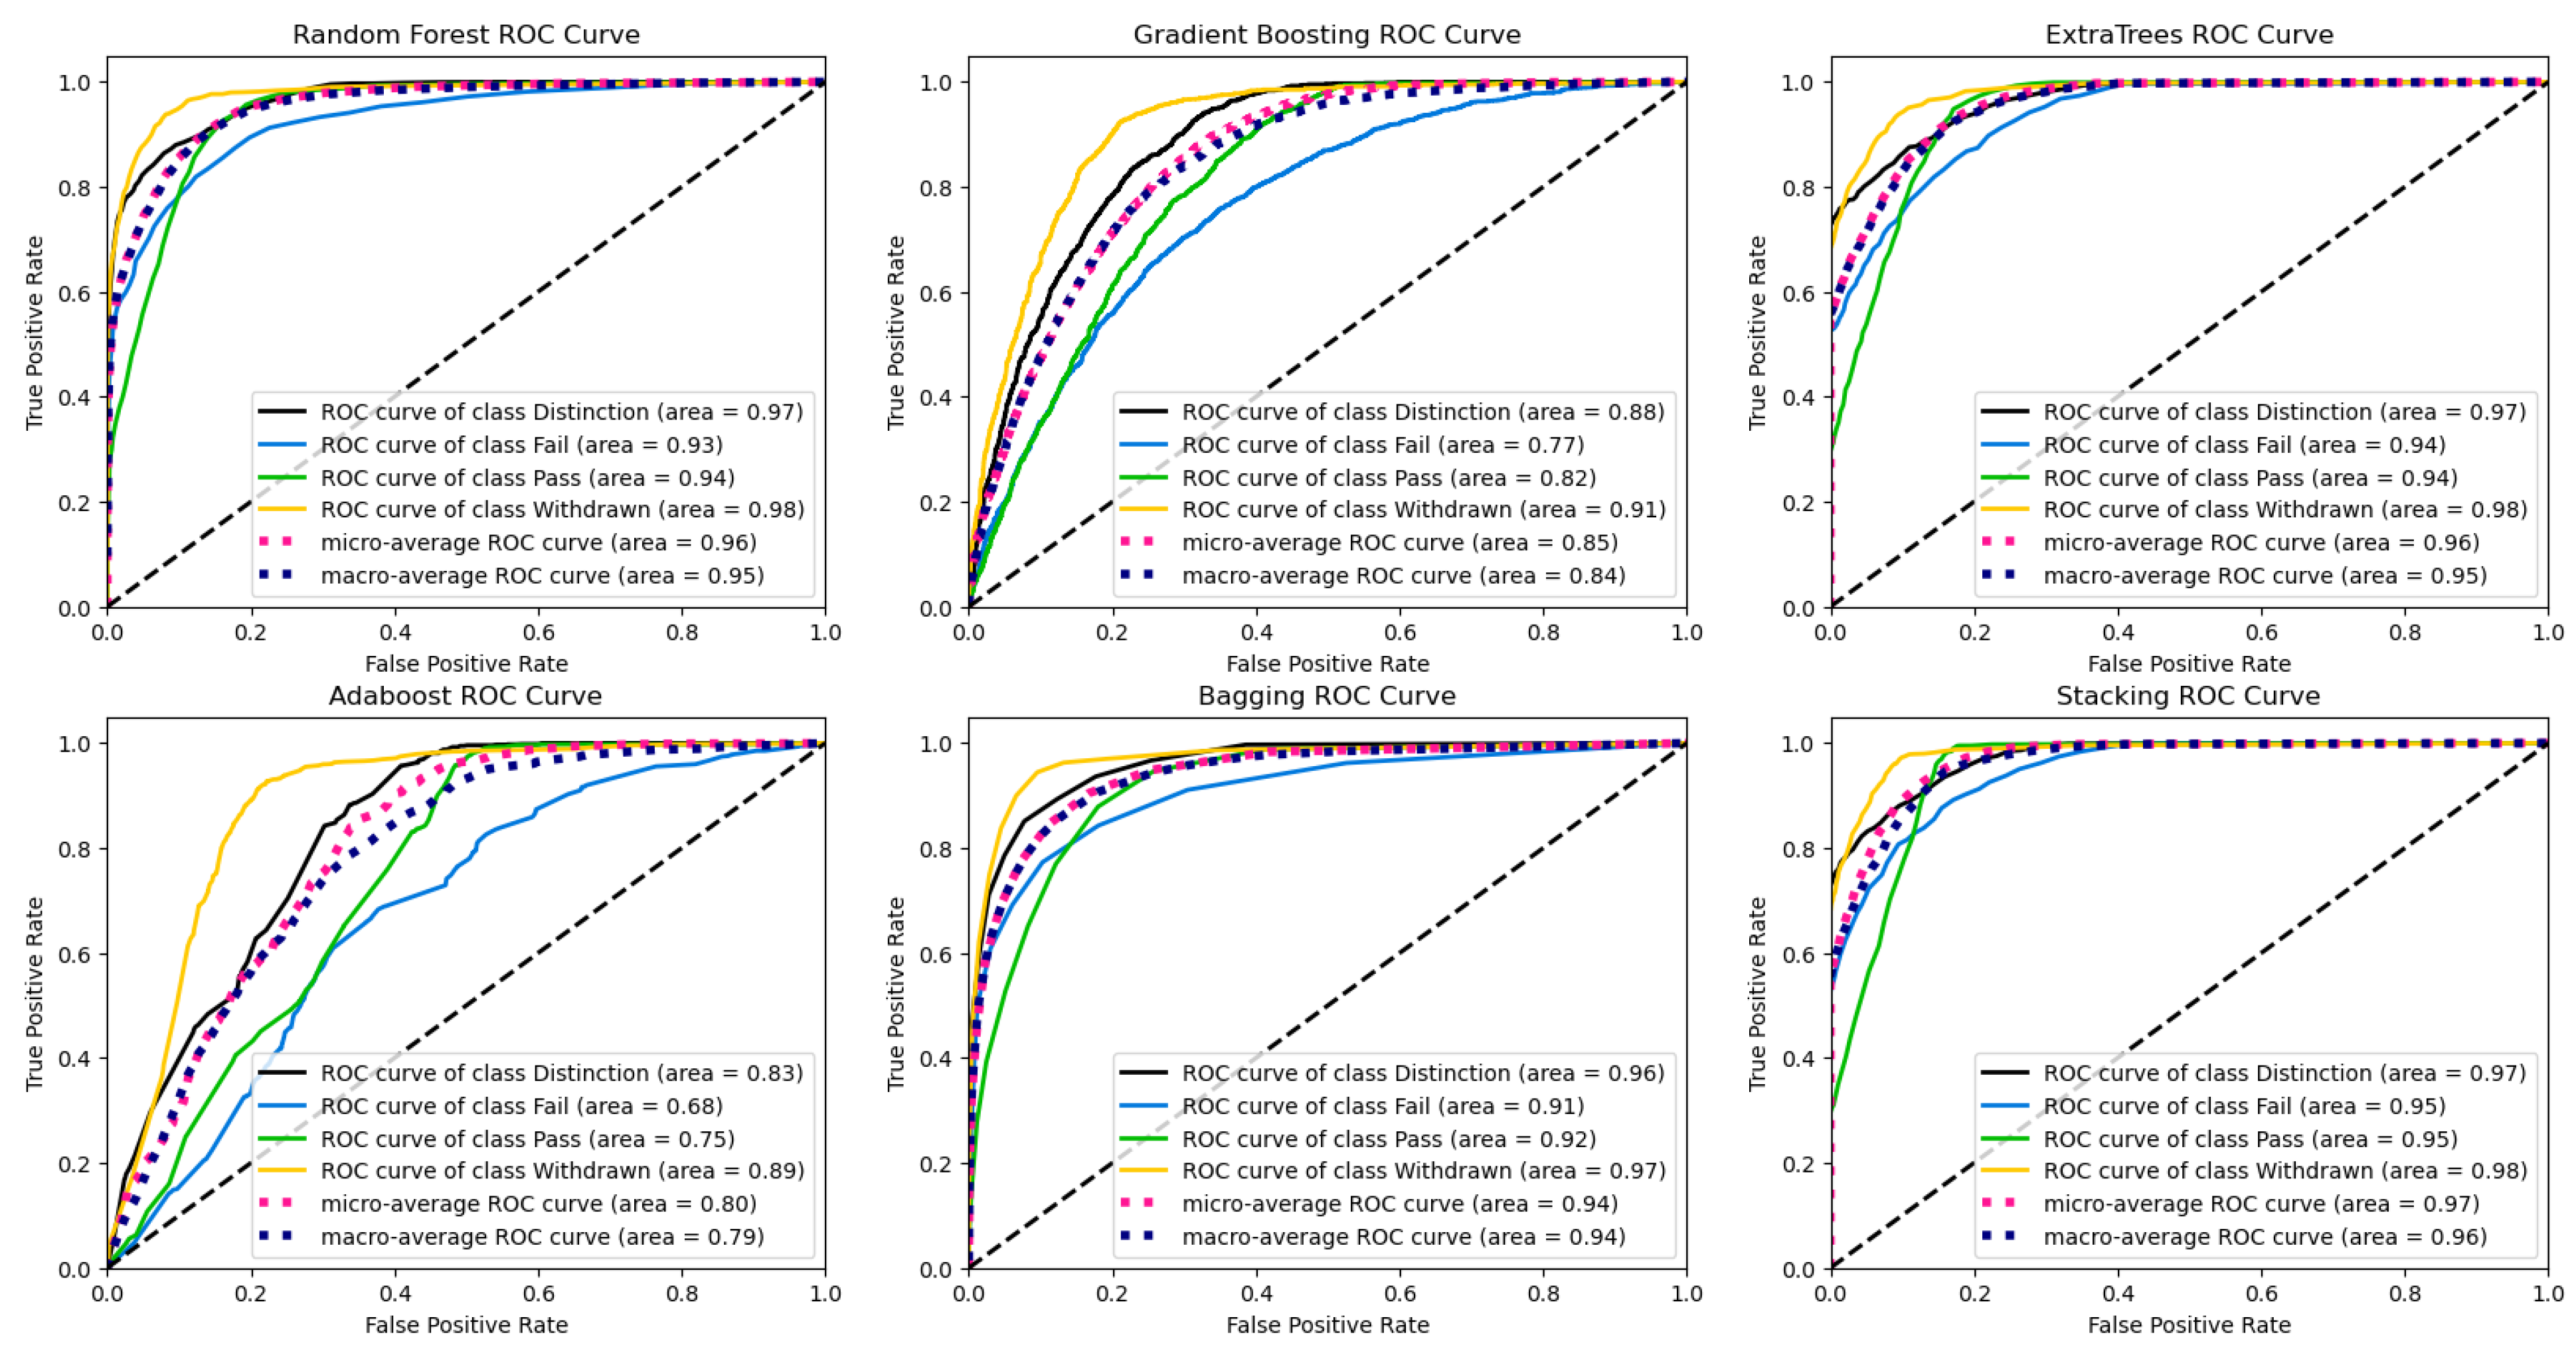
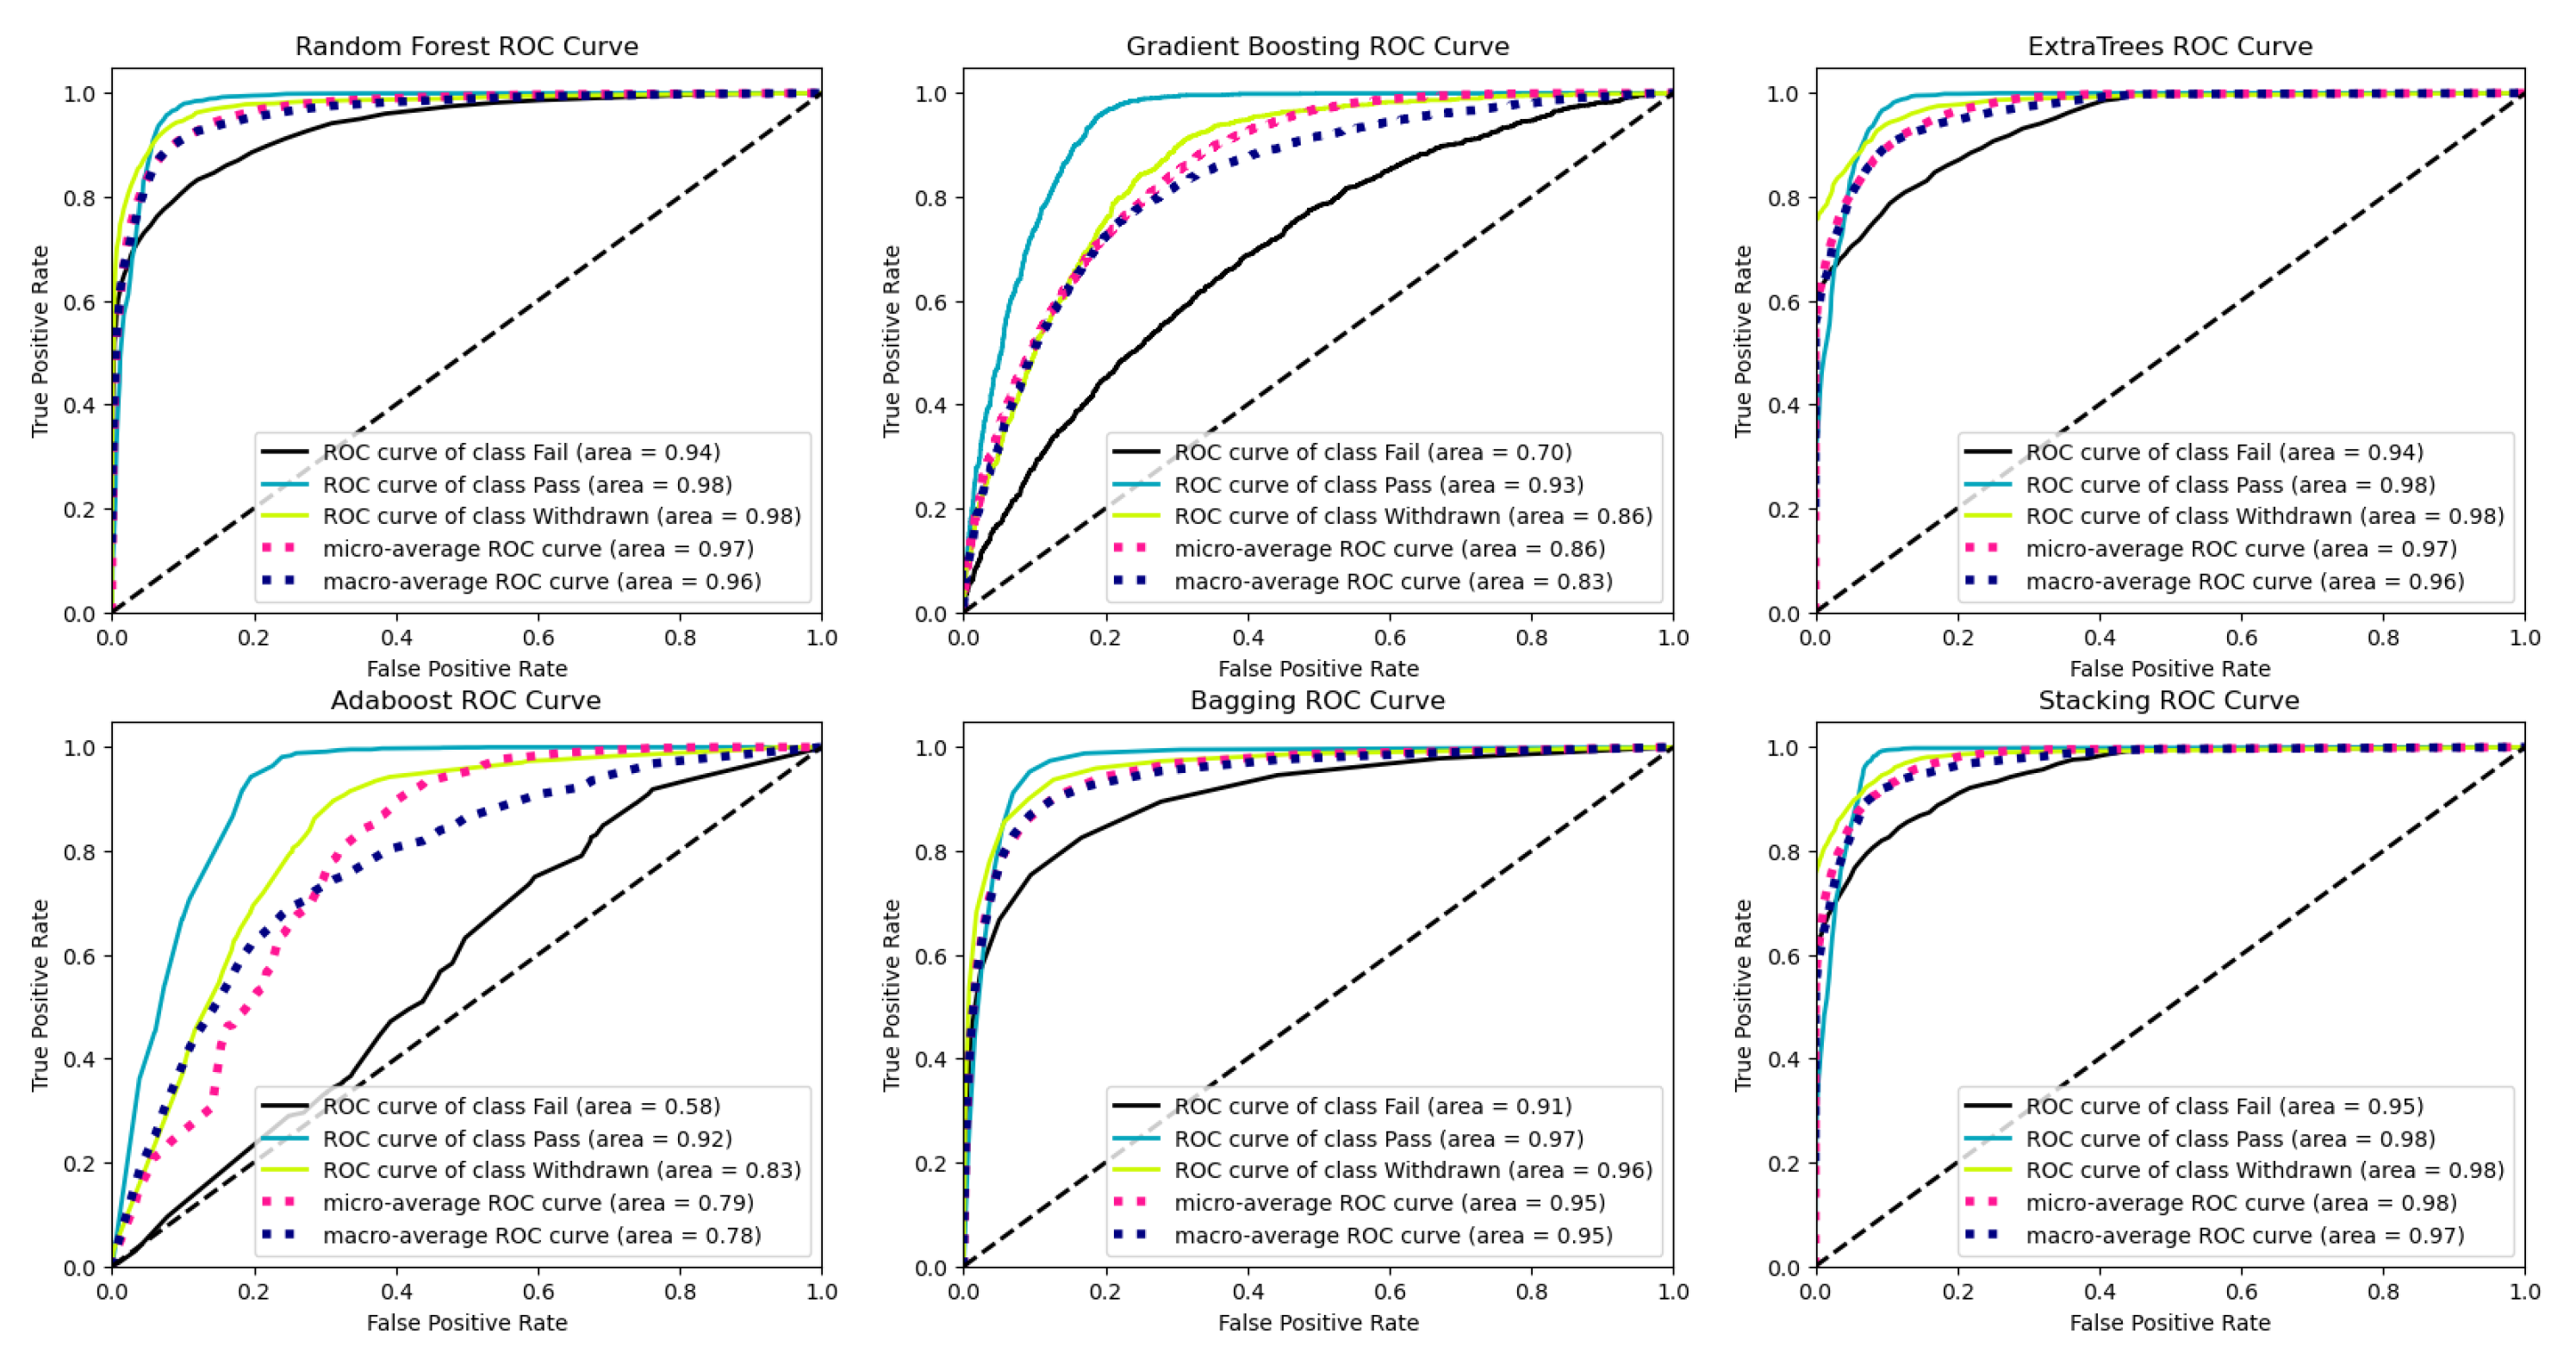
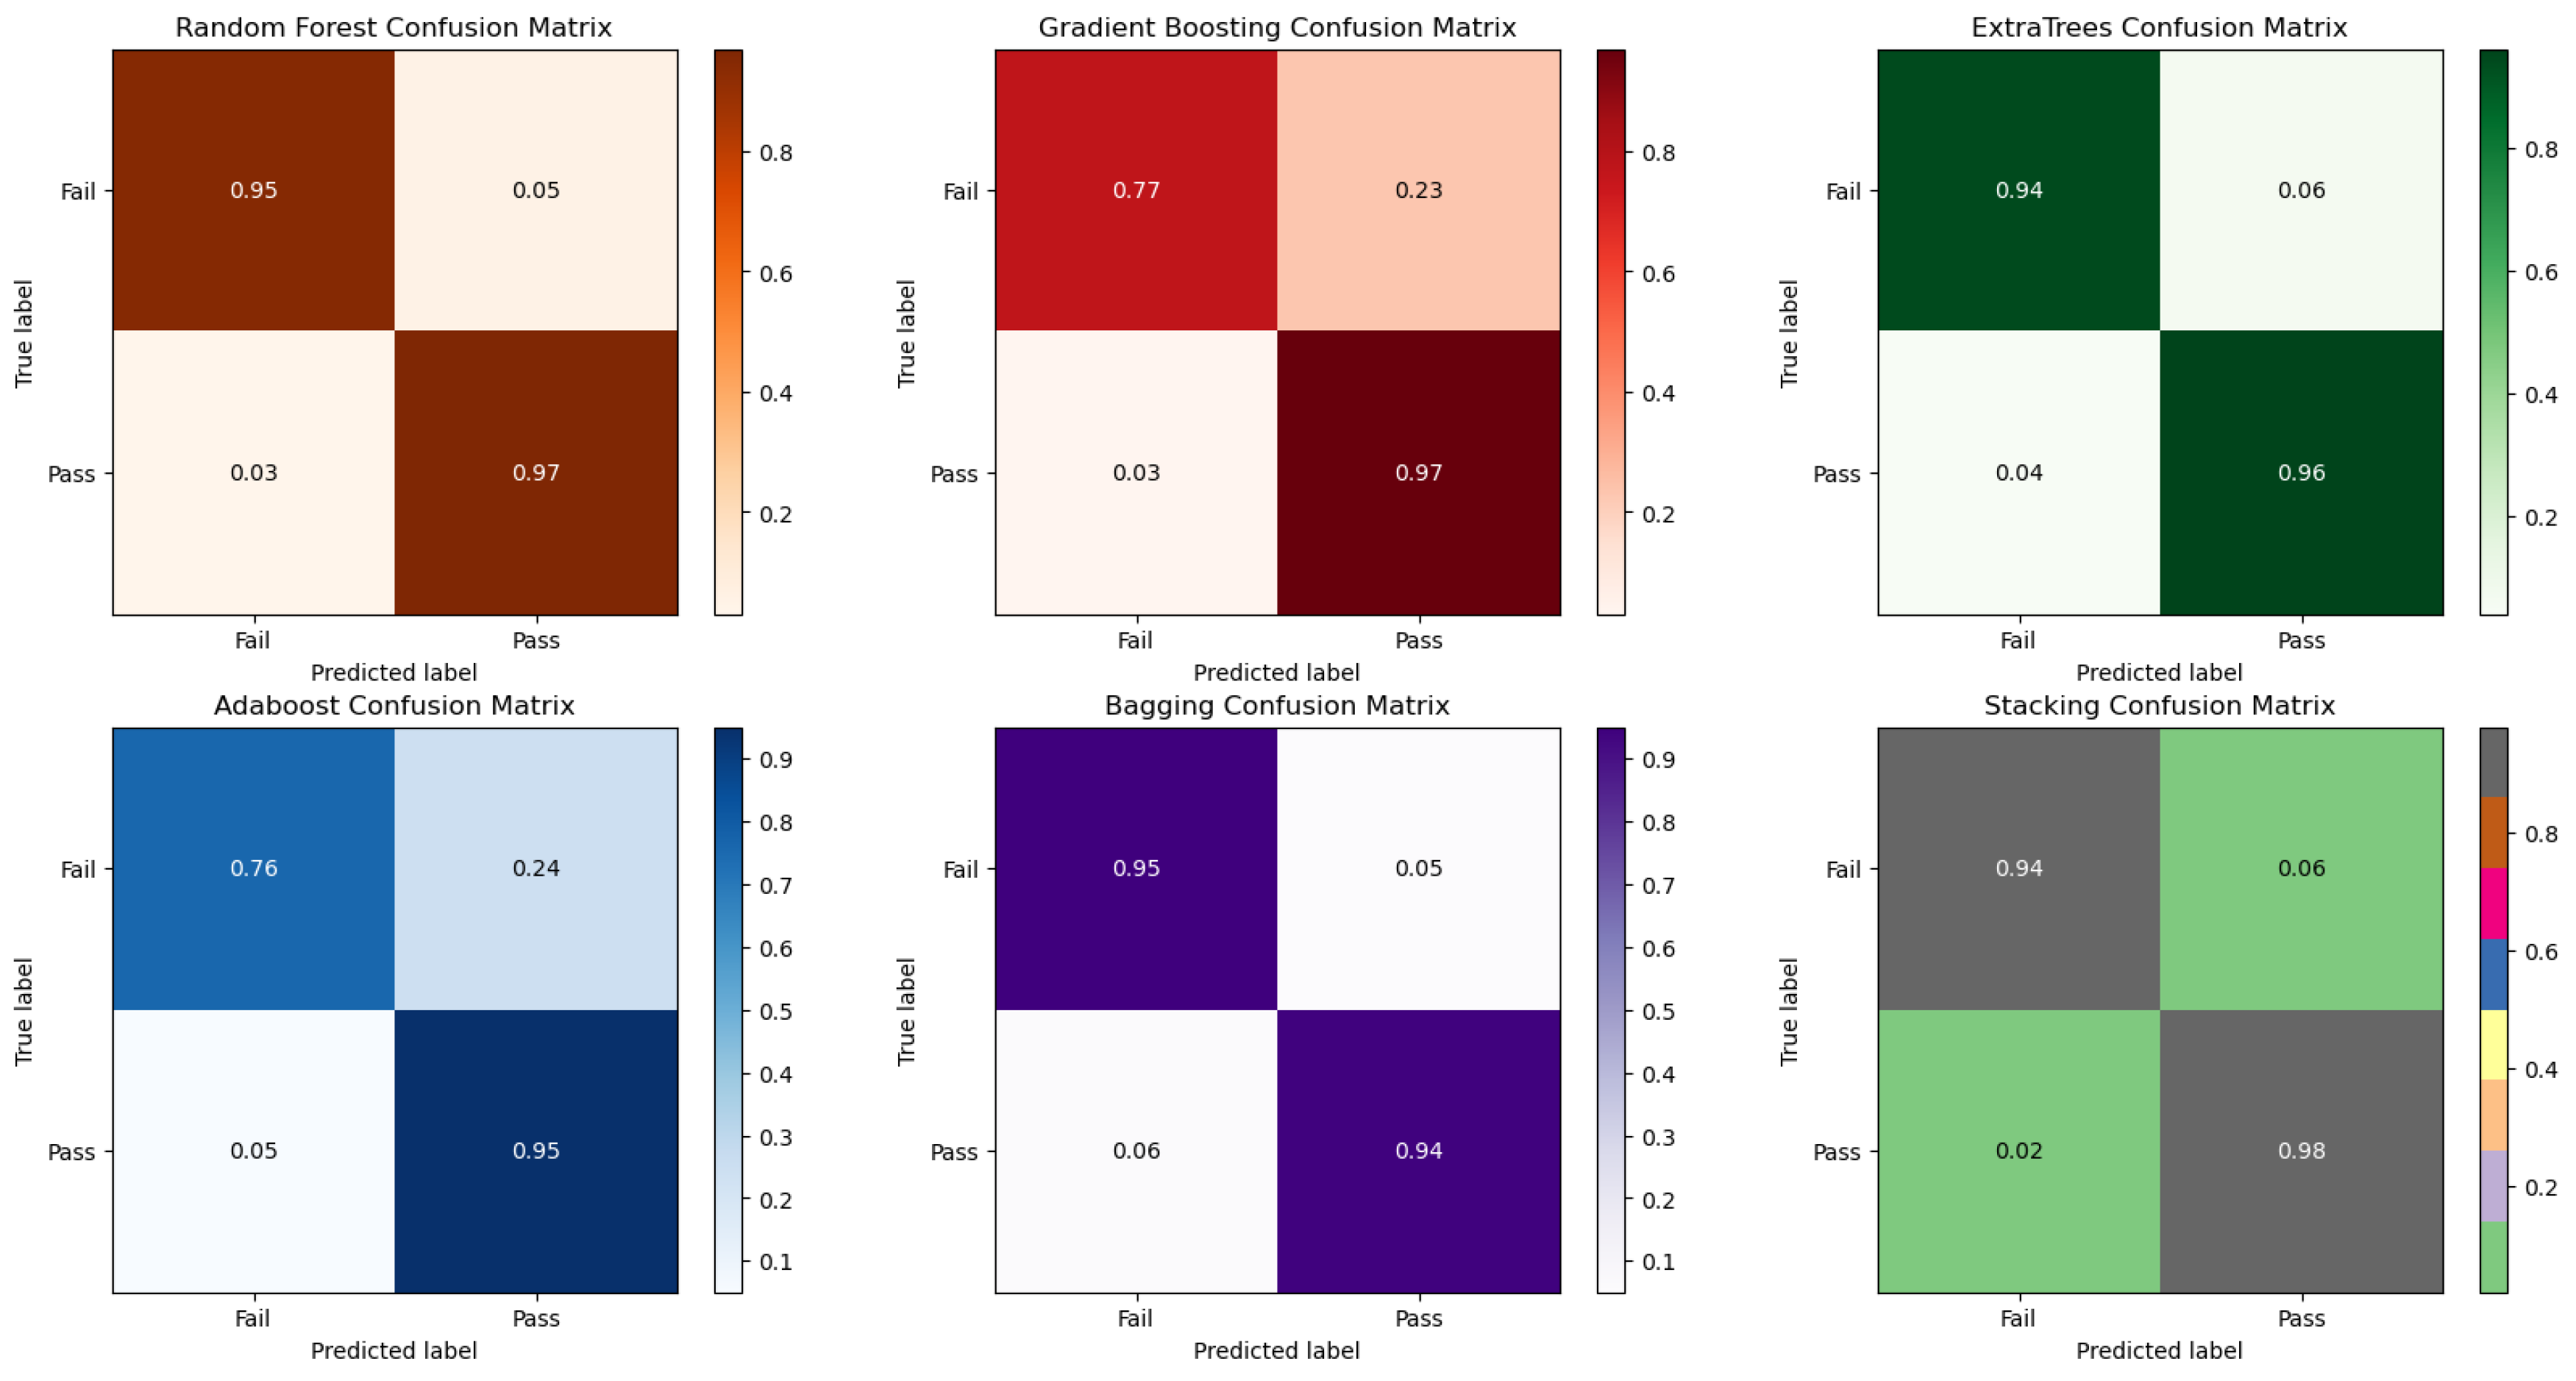
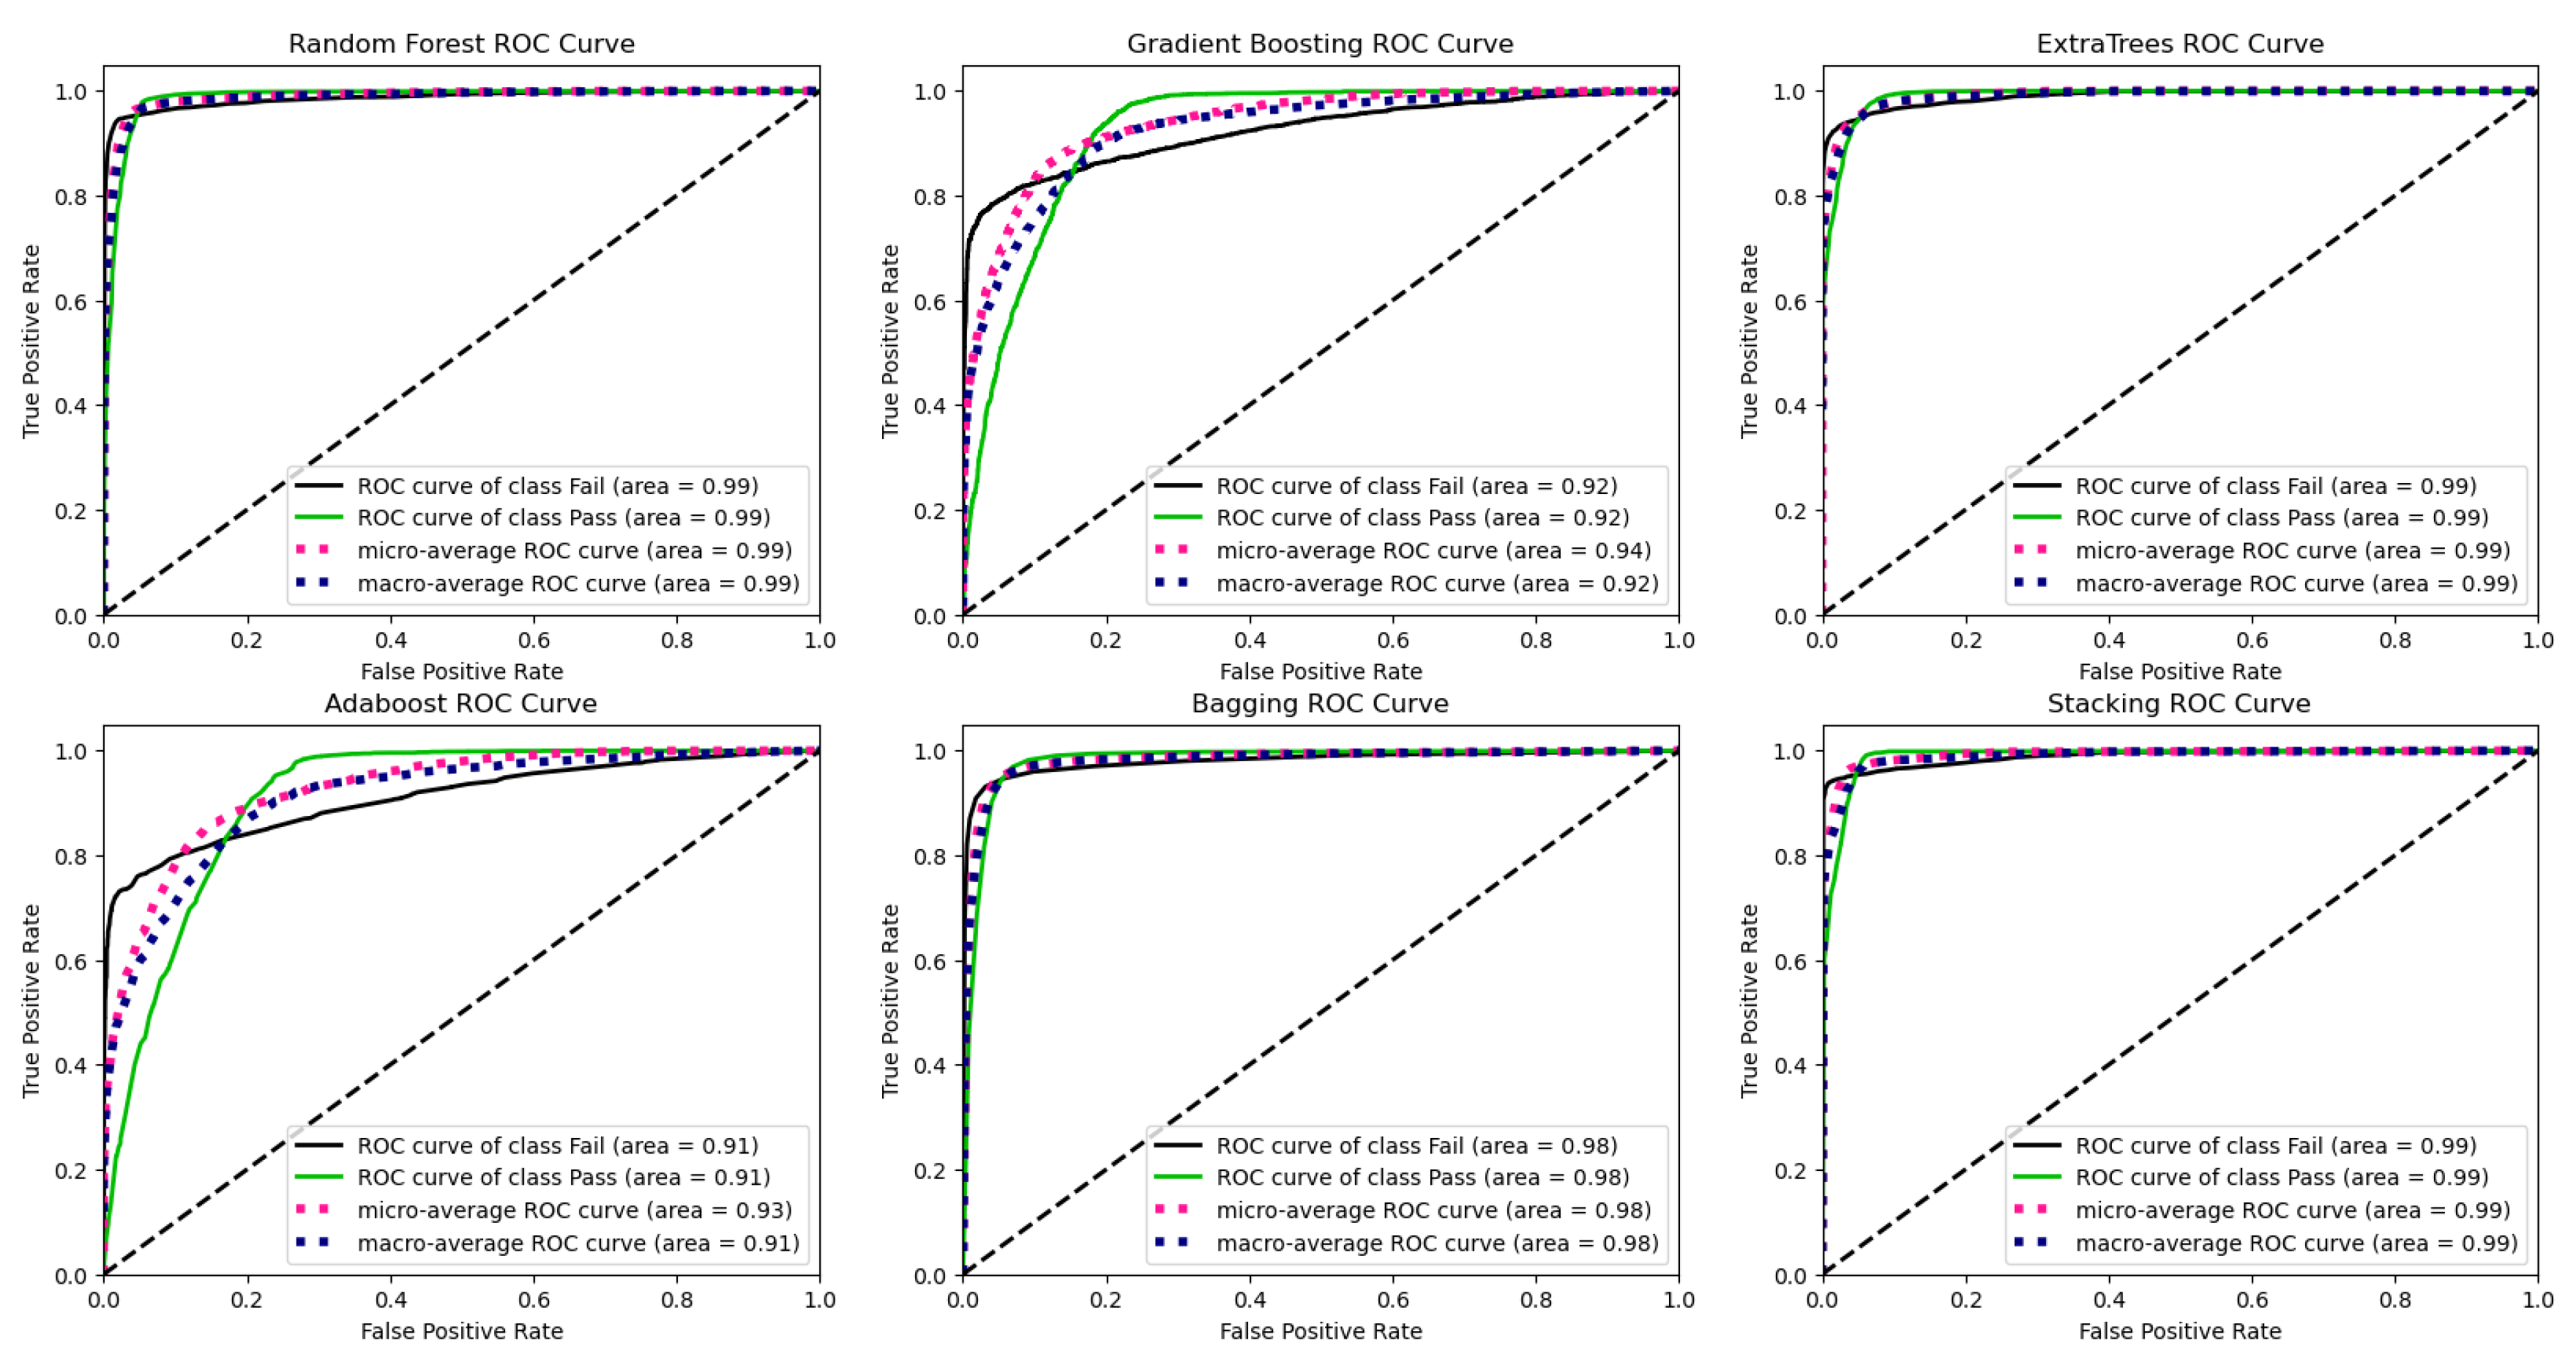
| Evaluation Metrics | |||||
|---|---|---|---|---|---|
| Models | Precision | Recall | F1 | Accuracy | AUC |
| Random Forest | 79% | 79% | 79% | 79% | 95% |
| Gradient Boosting | 58% | 58% | 56% | 58% | 84% |
| ExtraTrees | 78% | 78% | 78% | 78% | 95% |
| AdaBoost | 49% | 51% | 46% | 50% | 79% |
| Bagging | 77% | 77% | 77% | 77% | 94% |
| Stacking | 83% | 81% | 81% | 81% | 96% |
| Evaluation Metrics | |||||
|---|---|---|---|---|---|
| Models | Precision | Recall | F1 | Accuracy | AUC |
| Random Forest | 87% | 87% | 87% | 87% | 96% |
| Gradient Boosting | 65% | 67% | 63% | 66% | 83% |
| ExtraTrees | 85% | 85% | 85% | 85% | 96% |
| AdaBoost | 59% | 63% | 57% | 63% | 78% |
| Bagging | 84% | 84% | 84% | 84% | 95% |
| Stacking | 88% | 88% | 88% | 88% | 97% |
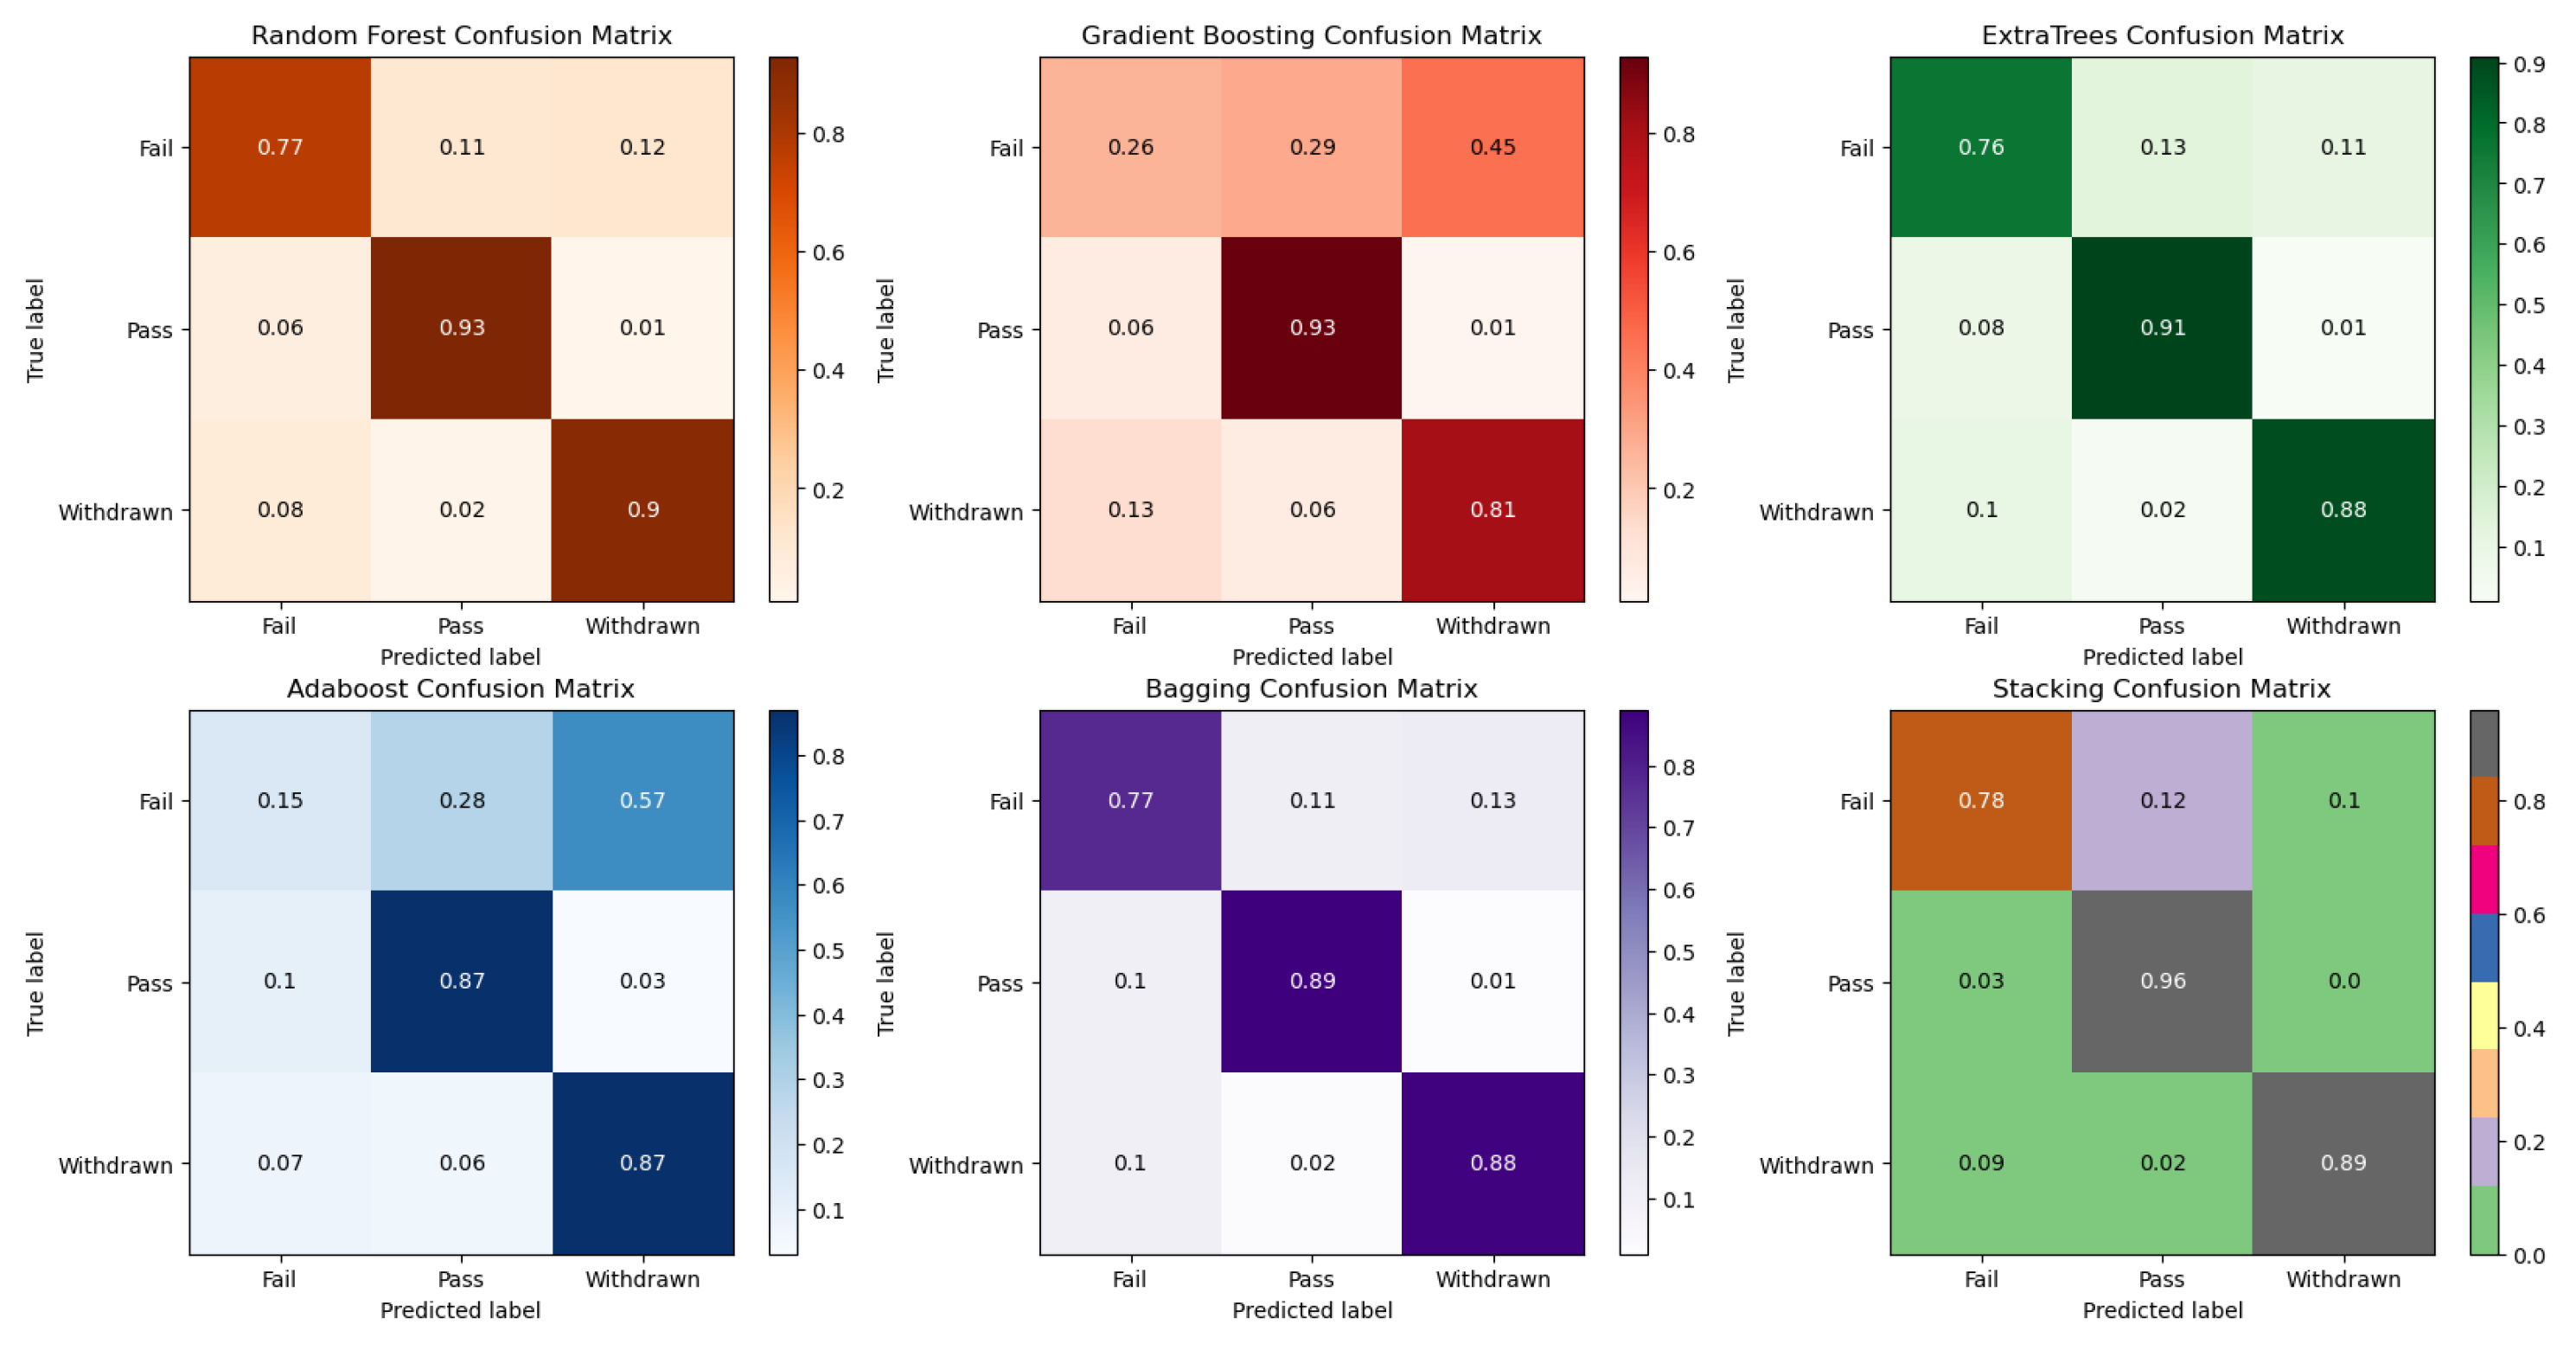
| Evaluation Metrics | |||||
|---|---|---|---|---|---|
| Models | Precision | Recall | F1 | Accuracy | AUC |
| Random Forest | 96% | 96% | 96% | 96% | 99% |
| Gradient Boosting | 88% | 87% | 87% | 87% | 92% |
| ExtraTrees | 95% | 95% | 95% | 95% | 99% |
| AdaBoost | 87% | 86% | 85% | 86% | 91% |
| Bagging | 94% | 94% | 94% | 94% | 98% |
| Stacking | 96% | 96% | 96% | 96% | 99% |
Disclaimer/Publisher’s Note: The statements, opinions and data contained in all publications are solely those of the individual author(s) and contributor(s) and not of MDPI and/or the editor(s). MDPI and/or the editor(s) disclaim responsibility for any injury to people or property resulting from any ideas, methods, instructions or products referred to in the content. |
© 2024 by the authors. Licensee MDPI, Basel, Switzerland. This article is an open access article distributed under the terms and conditions of the Creative Commons Attribution (CC BY) license (http://creativecommons.org/licenses/by/4.0/).


