1. Introduction
One of the greatest challenges of the modern Human-Computer Interface (HCI) practitioner is ensuring inclusivity consistently throughout their work. While accessibility in HCI is a growing field, a specific subset of the discipline, software interface design change, and its impacts on accessibility, is a much lesser-studied area. Autism Spectrum Disorder (ASD), or ‘
autism’, is a neurodevelopmental disorder characterised by numerous symptoms, one of which is experiencing distress around small changes [
1].
Generally, software design change is viewed as positive by HCI practitioners: a chance to improve a design. However, as autistic users may experience difficulty dealing with small changes, this will include interface design changes, especially where the software is part of an autistic person’s regular routine.
This research intends to measure the level of discomfort experienced by autistic users in comparison to ‘neurotypical’ (non-autistic) users in reaction to various software interface design changes, to identify specific difficulty points. A bespoke-developed framework for administering design change tests will also be described and justified alongside the change tests themselves and methods chosen, and statistical analyses of the obtained data will be evaluated to identify significant difficulty points in the autistic test group. From these results, formal research hypotheses will be asserted, from which design heuristics for reducing the impacts of change on autistic users will be derived.
The motivation of this cross-disciplinary study is foremost to improve the accessibility of software interface design changes, being one of the first in its area to improve the lives of autistic users through making HCI practitioners more aware of the difficulties faced and how they can be accounted for in the design change process. Further avenues of study in the field of accessible change impact studies will also be highlighted to promote further growth in this under-explored area.
2. Background
2.1. Autism Spectrum Disorder
Autism spectrum disorder (‘
ASD’ or ‘
autism’), a neurodevelopmental disorder, is defined thoroughly in the ‘
DSM-5’ [
1] – a highly-referenced psychology industry “gold standard” definition source for “psychiatric illnesses” [
2]. As a spectrum disorder, the severity of symptoms may differ between individuals. There are five required diagnostic criteria, one of which is relevant to this study: “restricted, repetitive patterns of behaviour”, which can manifest through “insistence on same-ness, routine and inflexibility presenting in resistance to change (e.g. distress at apparently small changes)” [
1].
User interfaces may become a part of an autistic individual’s daily routine, and user interfaces are susceptible to change through software updates, thus presenting a challenge to autistic users. As around 1% of the global population (as of November 2021) is autistic [
3], autistic users are a relevant user group to accessibility in HCI, and this aversion to change must be accounted for when changing software interface design.
2.2. Change in HCI
The impact of change in interfaces on users appears to be an understudied topic, especially on specific conditions such as autism. The work by [
4] explores users’ opinions of updates in `
hedonic’ software (entertainment software, specifically video games) based on prior experiences. The study measures how the updates affect continuance intentions (CI) – a measure of how much the user will want to use the system, following a change, through qualitative interviews. A negative reaction to a change may reduce CI, however, the quoted participants see change in video games as positive, increasing enjoyment and CI. While this may be the case in hedonic software, information systems (IS) like productivity software may contrast this due to their differing nature.
This qualitative approach will not be used here as it does not allow for the statistical analysis of reactions to changes, but it is noted that there is value in collecting additional qualitative data. Further touched on are the measures “perceived ease of use” and “perceived enjoyment” [
4], examples of metrics that could be used to quantify discomfort around change, and will be considered when formulating methods.
Contrasting this, [
5] looks at information systems and attempt to quantify software updates’ effect on CI. The authors focus on how updates are introduced (frequent vs. less frequent and their magnitude), and not on the impacts that individual changes can have on users. Our study will differ in that we are looking at the impacts caused by individual changes, not the timings or magnitude of their introduction, nor will CI be measured, due to its specialism.
The interface used in [
5] was a basic word processing application, justified through stating that to measure the impact of change more reliably, the user must have some pre-existing familiarity with the design, and due to its similarity with other word processors, this could be utilised [
5]. Another justification was for simplicity in testing, as the program’s features were modular, allowing for easy modification [
5]. Seeing this example and its design justifications is valuable to this study, and will influence the process of devising an IS-style interface to use as a change test delivery framework.
Several limitations and future research opportunities were given in [
5]. The first suggestion is that introducing multiple updates with measurements made at several points may help in understanding users’ reaction to updates more [
5]. We plan to take that route here in these experiments: exposing the user to an individual change, taking measurements, and repeating.
Distinguishing between reactions to different types of update [
5] was another further research suggestion that our current research will address. It is worth noting that no consideration of research towards the accessibility of updates was given.
Both studies [
4,
5] attribute this under-explored research area (effects of software updates) recently becoming popular to the rise of high-speed IT communications infrastructure. High-speed internet facilitates the rapid distribution of software updates, in turn facilitating Software-as-a-Service and other software subscription models, where updates are distributed frequently and silently. The choice around updating software is reducing and this presents a challenge to autistic users, as there is no option to resist the change. By contrast, in the past, distributing software updates through physical media presented less of an issue to autistic users due to the choice involved in accepting the change (and the ability to avoid it).
2.3. Autism in HCI
Autism-HCI studies are rare. The authors in [
6] give a review of existing literature. They explore ASD-oriented HCI usability studies, stating that the lack of research is due to both a “sensitive user base” and researchers lacking experience working with ASD [
6].
It was established that this shortage of research has led to [
6]:
Hyper-specialised technology-led ASD studies with no generic application,
A large number of ASD studies that focus on children (due to the rising use of technology to support autistic children’s needs), and
The adoption of low-literacy accessibility guidelines for ASD to account for the comprehension difficulties that some autistic users suffer from;
all of which lead to no theoretical or empirical findings for formulating ASD-HCI accessibility guidelines due to their specialised nature.
Outside of scientific literature, the above authors refer critically to a prior version of the Web Content Accessibility Guidelines [
7], stating that they do not consider users with cognitive impairments including ASD, instead focusing on traditional physical disabilities. Whilst correct in the referenced version, this has since changed [
8]. However, there is no reference to design change.
The study by authors in [
6] only found two relevant papers. Despite being focused on website usage, both set out to measure difference in reaction between autistic and neurotypical subjects:
a Masters thesis [
9] focused on the manner in which autistic children process website information, concluding that there is no difference in autistic vs. neurotypical results, however the study involved only four participants;
an article [
10] focused on the eye scan paths of autistic vs. neurotypical users when reading a webpage, which were found to be longer amongst autistic participants, but the test group was restricted to “high-functioning” autistic participants.
Both of these papers lack statistical reliability due to these factors, from which lessons can be learned to avoid a repetition of these shortfalls in our current study.
Finally, a future work is suggested, and advice is given to future researchers working with autistic subjects [
6]:
“the study must be co-designed with autistic researchers”;
“it is important to investigate whether user interface use amongst persons diagnosed with autism is similar to that of unaffected individuals”.
These core principles have been brought into our study here, both through the use of an autistic researcher, and the comparative nature of using an autistic test group vs. neurotypical control group.
The review by authors in [
11] provides further insight into formulating research methods. The authors set out to provide guidance to HCI researchers when working with autistic users. Through the analysis of past studies, potential problems were identified [
11]:
“User sampling”: issues where repeated attendance is required;
“Actors”: caregivers may influence the results given;
“Environment”: unfamiliar environments can cause distress;
“Instructions”: autistic users may interpret tasks too literally and fail to perform the expected task or tasks may fail to engage the subject;
“Analysis”: researchers have struggled to analyse autistic user data, or data has been anomalous due to limited cognitive skills.
From these points, the following guidelines were produced [
11]:
“Know your users”: understand their difficulties and make them feel comfortable;
“Train the actors”: if caregivers are involved, ensure they understand the study and are able to support;
“Familiarise the users”: introduce users to unfamiliar environments and allow them to adjust;.
“Have a Plan B”: consider what can be done if the data is not as expected.
Failure to account for these difficulties and guidelines is expected to lead to both “irritated and uncomfortable” participants, and “measurement error and data loss” [
11], which to conduct an ethical and valid usability study, must be avoided. While some of the guidelines refer to in-person studies and this study will be conducted online, they will be carried into this research study to ensure that the least irritation and discomfort is caused to participants, leading to stronger results.
One criticism of this review is that it included studies where the participants are children, and where the technology used is hyper-specialised, results which another study [
6] advises against using. It also focuses on the ‘severe’ end of the autistic spectrum, with the research environment considered more than the questions and interfaces used, but the guidance is still helpful.
From a design perspective, another study [
12] collates content accessibility guidelines for autistic users from existing sources and puts these into practice through creating a sample text editor interface (the second source to use a word processor). The focus of the study is on the reading comprehension difficulties that autistic users can face, and gives lesser consideration toward other issues that autistic users may encounter.
In short, the scarcity of autism-HCI studies is a result of their cross-disciplinary nature, as there is a lack of specialists in both fields, and their complexity. Some studies have produced guidelines to make interfaces more accessible to autistic users, and for working with autistic subjects, however no explored autism-HCI research considered the impacts of change in interface design on autistic users, or provided any mitigations for these.
Hence, the aim of this study is to measure the impact of individual design changes on autistic and neurotypical users, to identify changes causing difficulty in autistic users, in order to form statistically proven research hypotheses, from which heuristics will be derived that HCI practitioners can follow when implementing software design changes to mitigate adverse effects in autistic individuals.
3. Methods
3.1. Measuring Discomfort Around Change
An online questionnaire was created to measure user reaction to interface design changes. Subjects were asked to complete the same task in an initial interface and seven consecutive design changes, answering a set of questions after each exposure.
Statistically analysing autistic and neurotypical results is expected to identify specific changes that adversely impact autistic users to a significant degree, allowing for hypothesis testing per-change.
3.2. Quantitative Measured Used
To quantify ‘discomfort around change’, two metrics were deployed: perceived system usability and user comfortability.
3.2.1. Perceived System Usability
This metric was selected as an adverse reaction to change may result in lower perceived usability scores due to the discomfort encountered by the participant. However, selecting a measurement scale for perceived system usability proved difficult, as there are an overwhelming range of usability measures with different purposes.
The need for repetitive, simplistic testing resulted in the selection of the Software Usability Scale (`
SUS’) [
13]. Multiple usability scales were evaluated through prior literature [
14,
15]. Most explored were deemed unsuitable due to their length, including the SUMI questionnaire (50 questions) [
16], to minimise the risk of abandonment. The ease-of-use and size (10 questions) of the SUS and the aspects it measures made it the most suitable usability scale for this study. The SUS is described as “quick and dirty” by the author [
13] and is well referenced and reviewed, cited in over 1,200 publications [
17].
3.2.2. User Comfortability
It was determined that, to gain a quantitative, subjective view of how comfortable the user is feeling (something that the SUS does not measure) and assess how a change impacts this, a bespoke metric must be introduced: the ‘
comfortability score’ (`
CMF’) – a Likert scale from 0 to 10, with descriptors at 0 indicating “
Extremely distressed”, 5 indicating “
Neutral”, and 10 indicating “
Fully comfortable”. This measure was inspired by the Net Promoter Score [
18], a research metric that measures customer satisfaction.
Not all CMF points were given labels to allow participants to indicate their subjective comfort level without likening it to a specific word, a behaviour which autistic users can find challenging (see
alexithymia – the inability to put feelings into words, a trait that some autistic people possess [
19]).
User comfortability is not usually recorded in HCI studies. The use of this measure will act as a pilot for future studies as to prove this measure’s statistical accuracy and relevance.
3.3. Qualitative Measures Used
The quantitative measures may not allow participants to accurately record their emotions, due to their scalar nature. To facilitate a greater depth of response, for each SUS point, and for each interface overall, an optional comment can be provided.
The overall interface comment question phrasing was focused on emotion: “
Are there any other comments you would like to share about this change, or how it made you feel?”, with slightly different wording for the initial interface. Allowing for qualitative responses will provide a deeper insight into the subjective feelings of the individual, as noted from a prior study [
4].
3.4. The Testing Framework
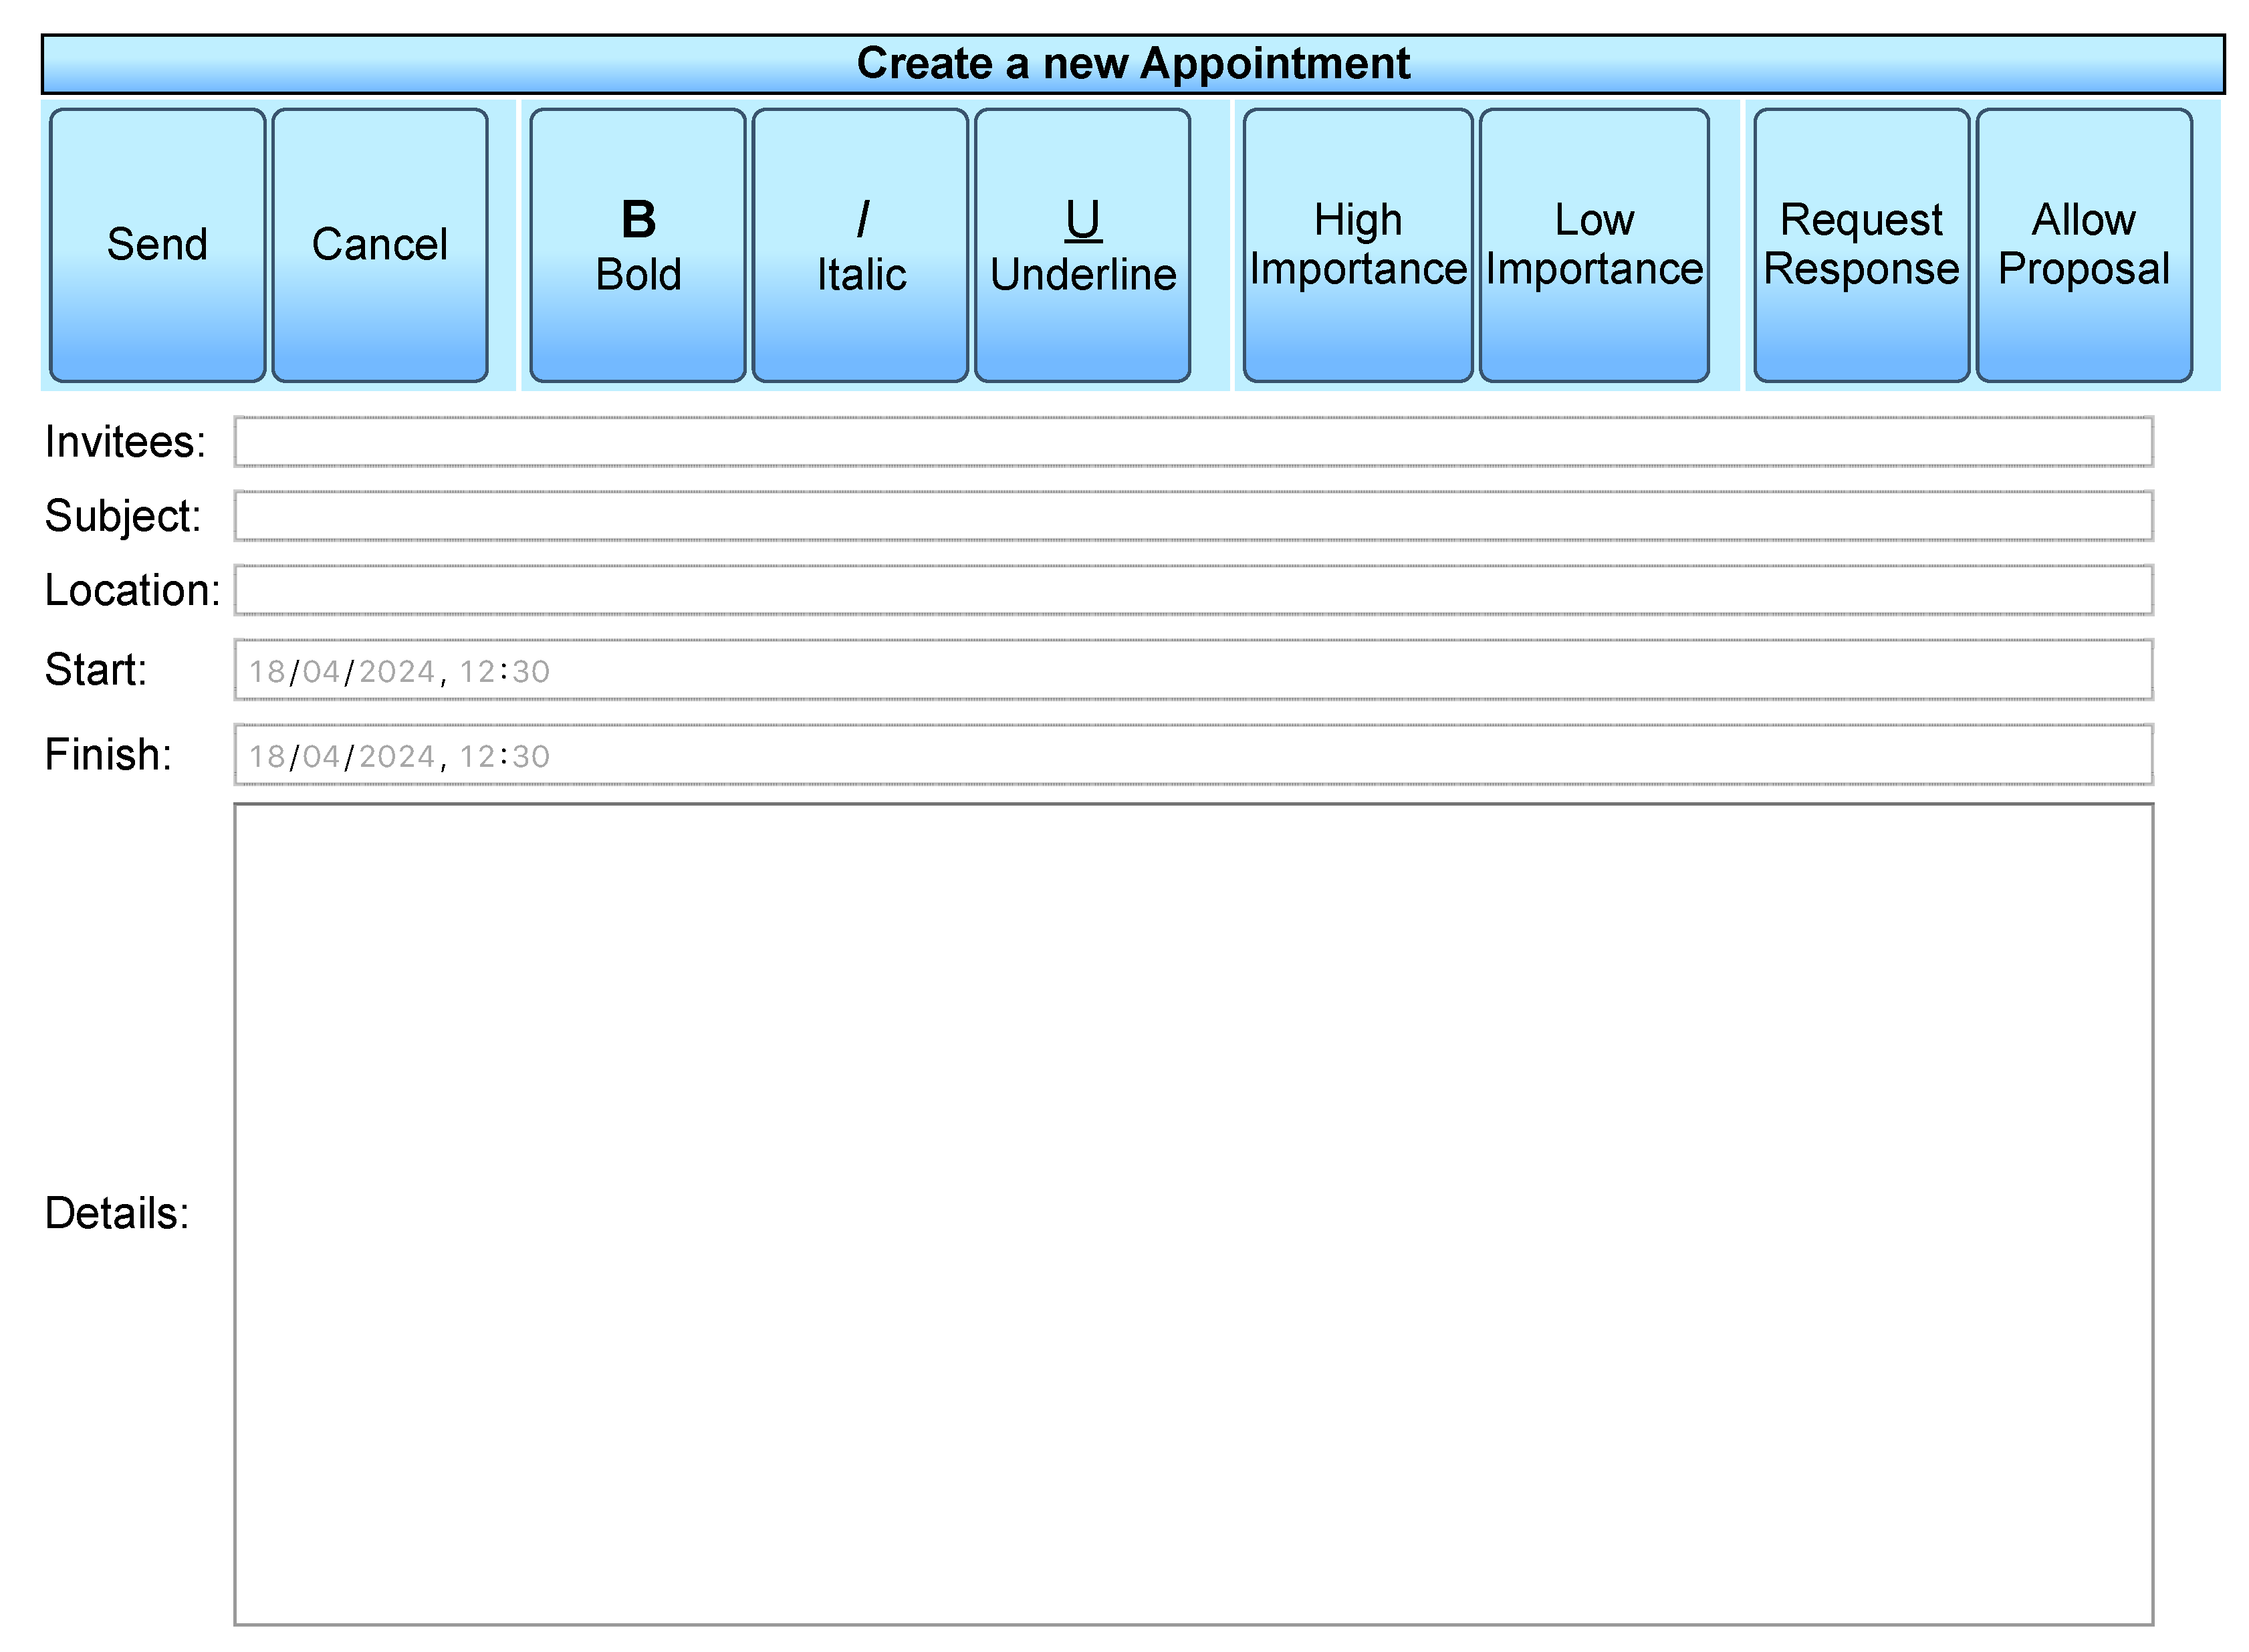
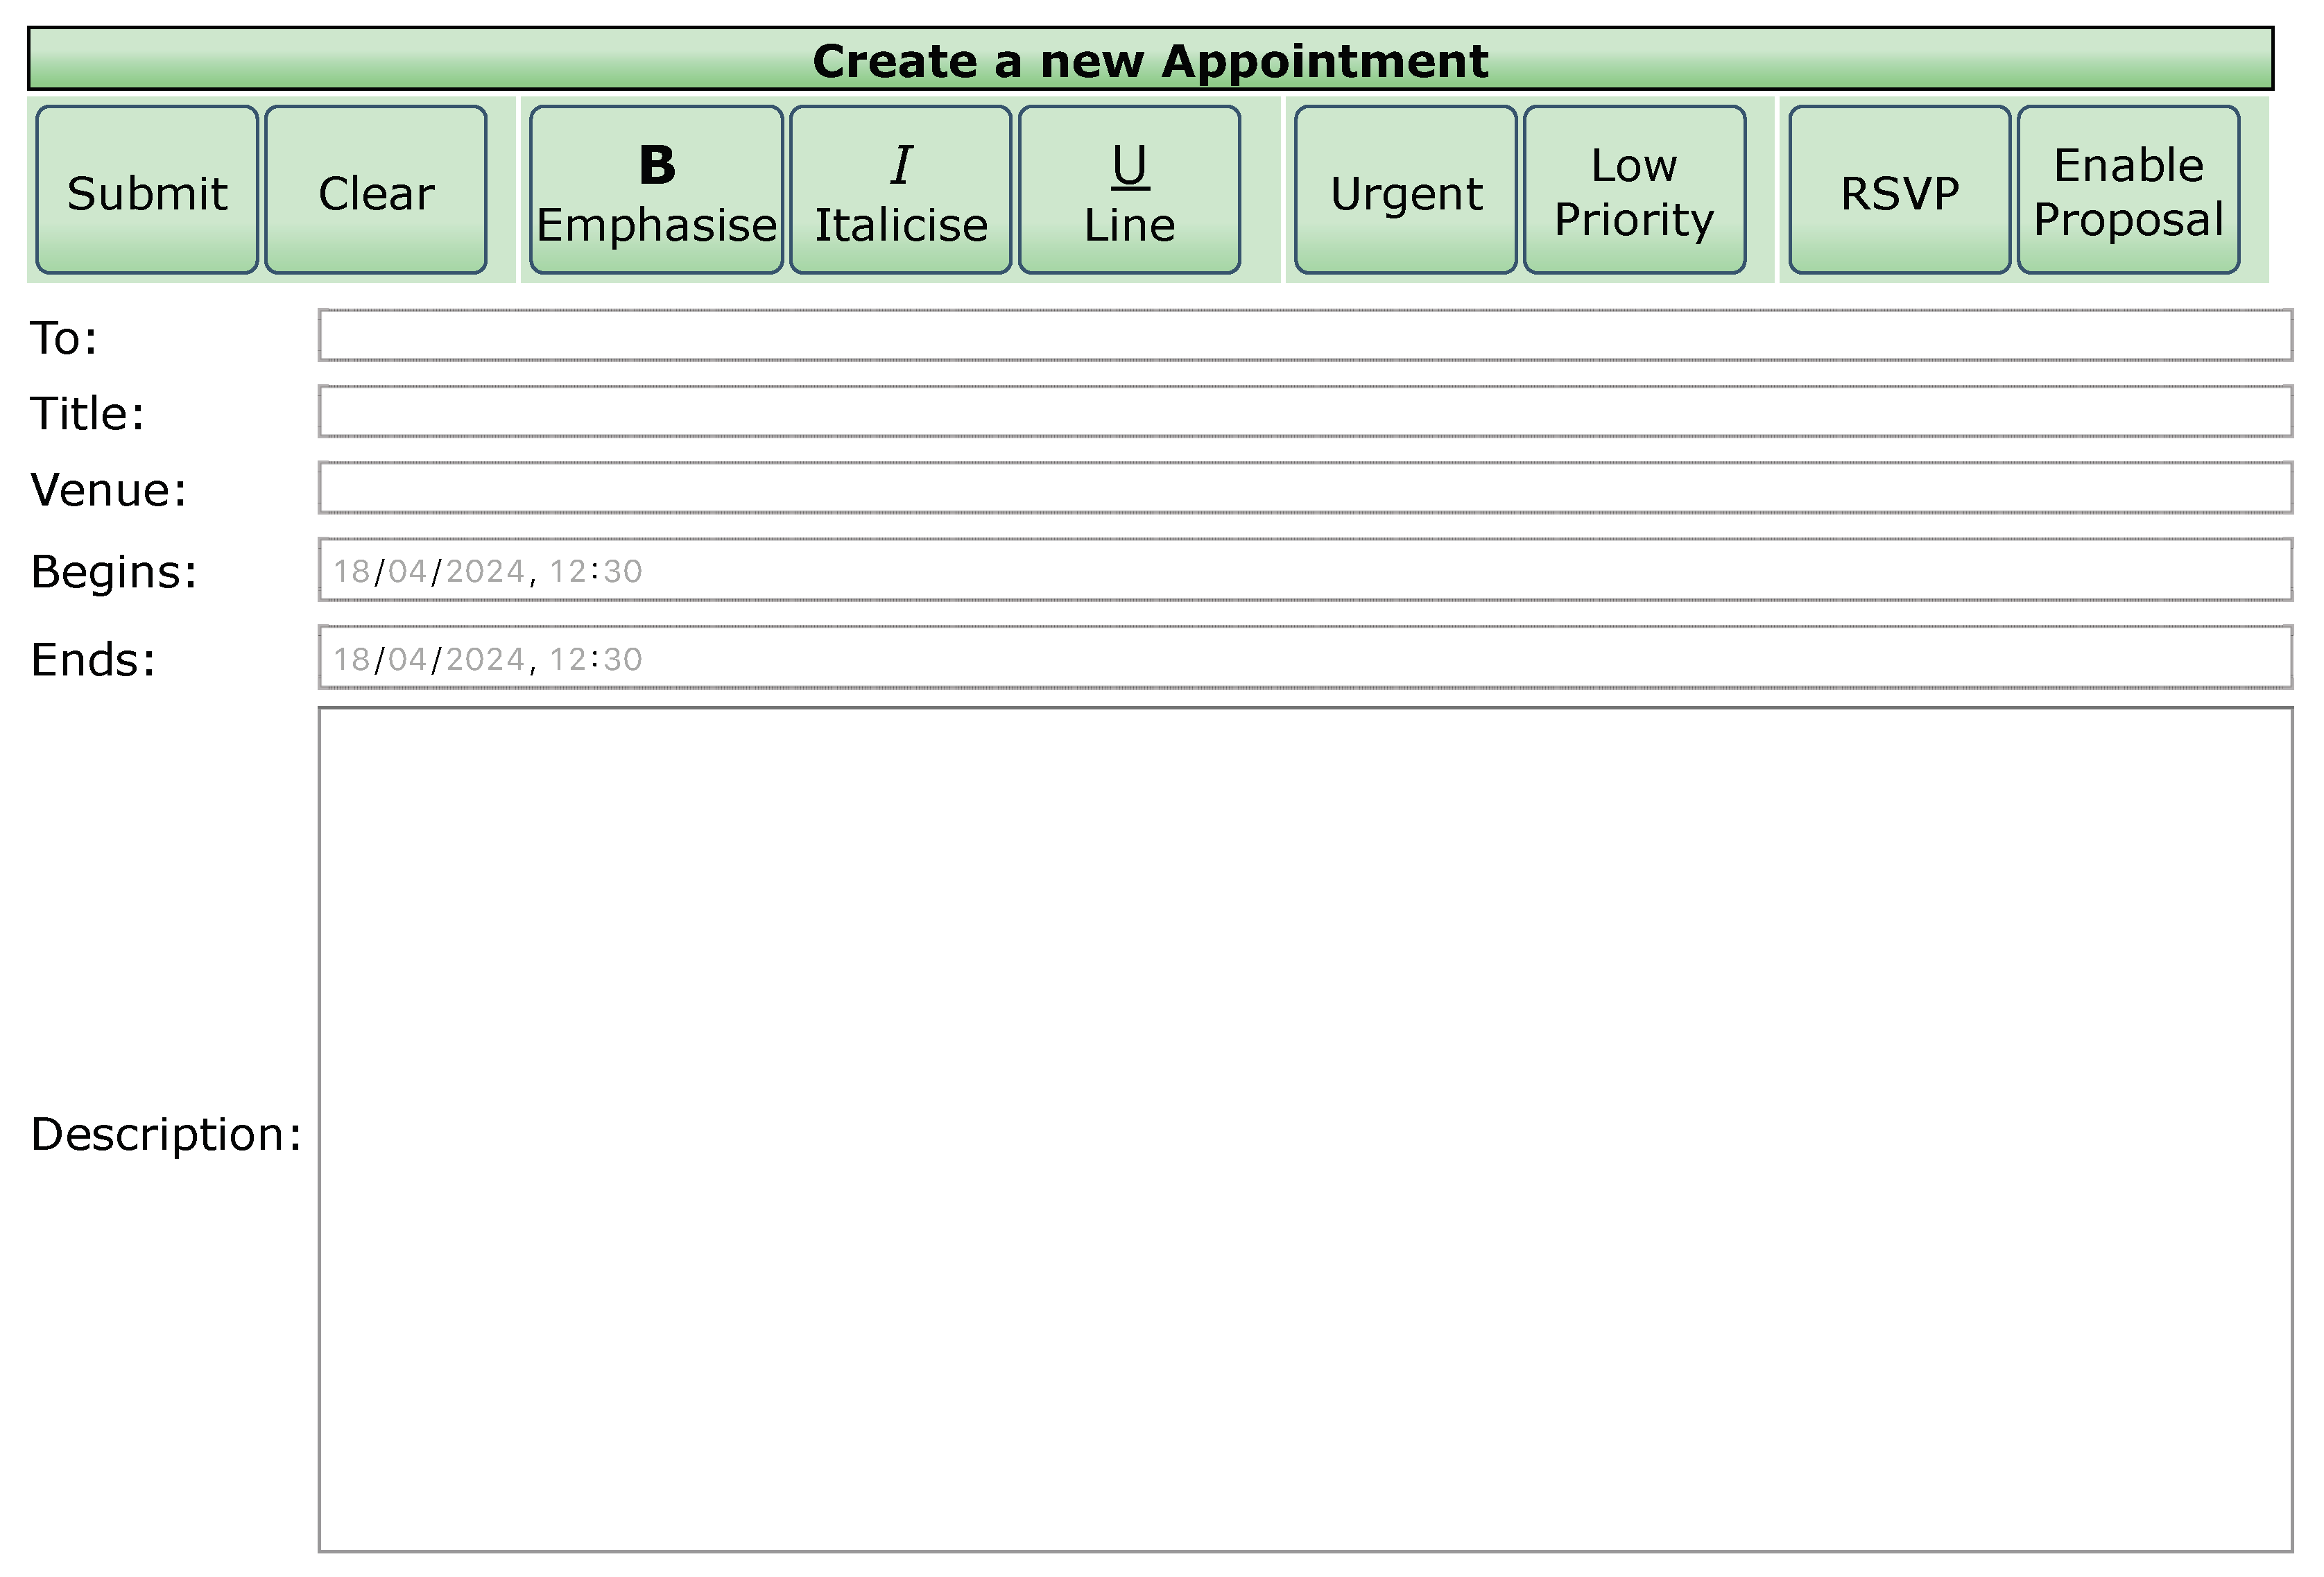
The interfaces are a collection of HTML pages utilising jQuery, with linked CSS, embedded into the online questionnaire through a HTML
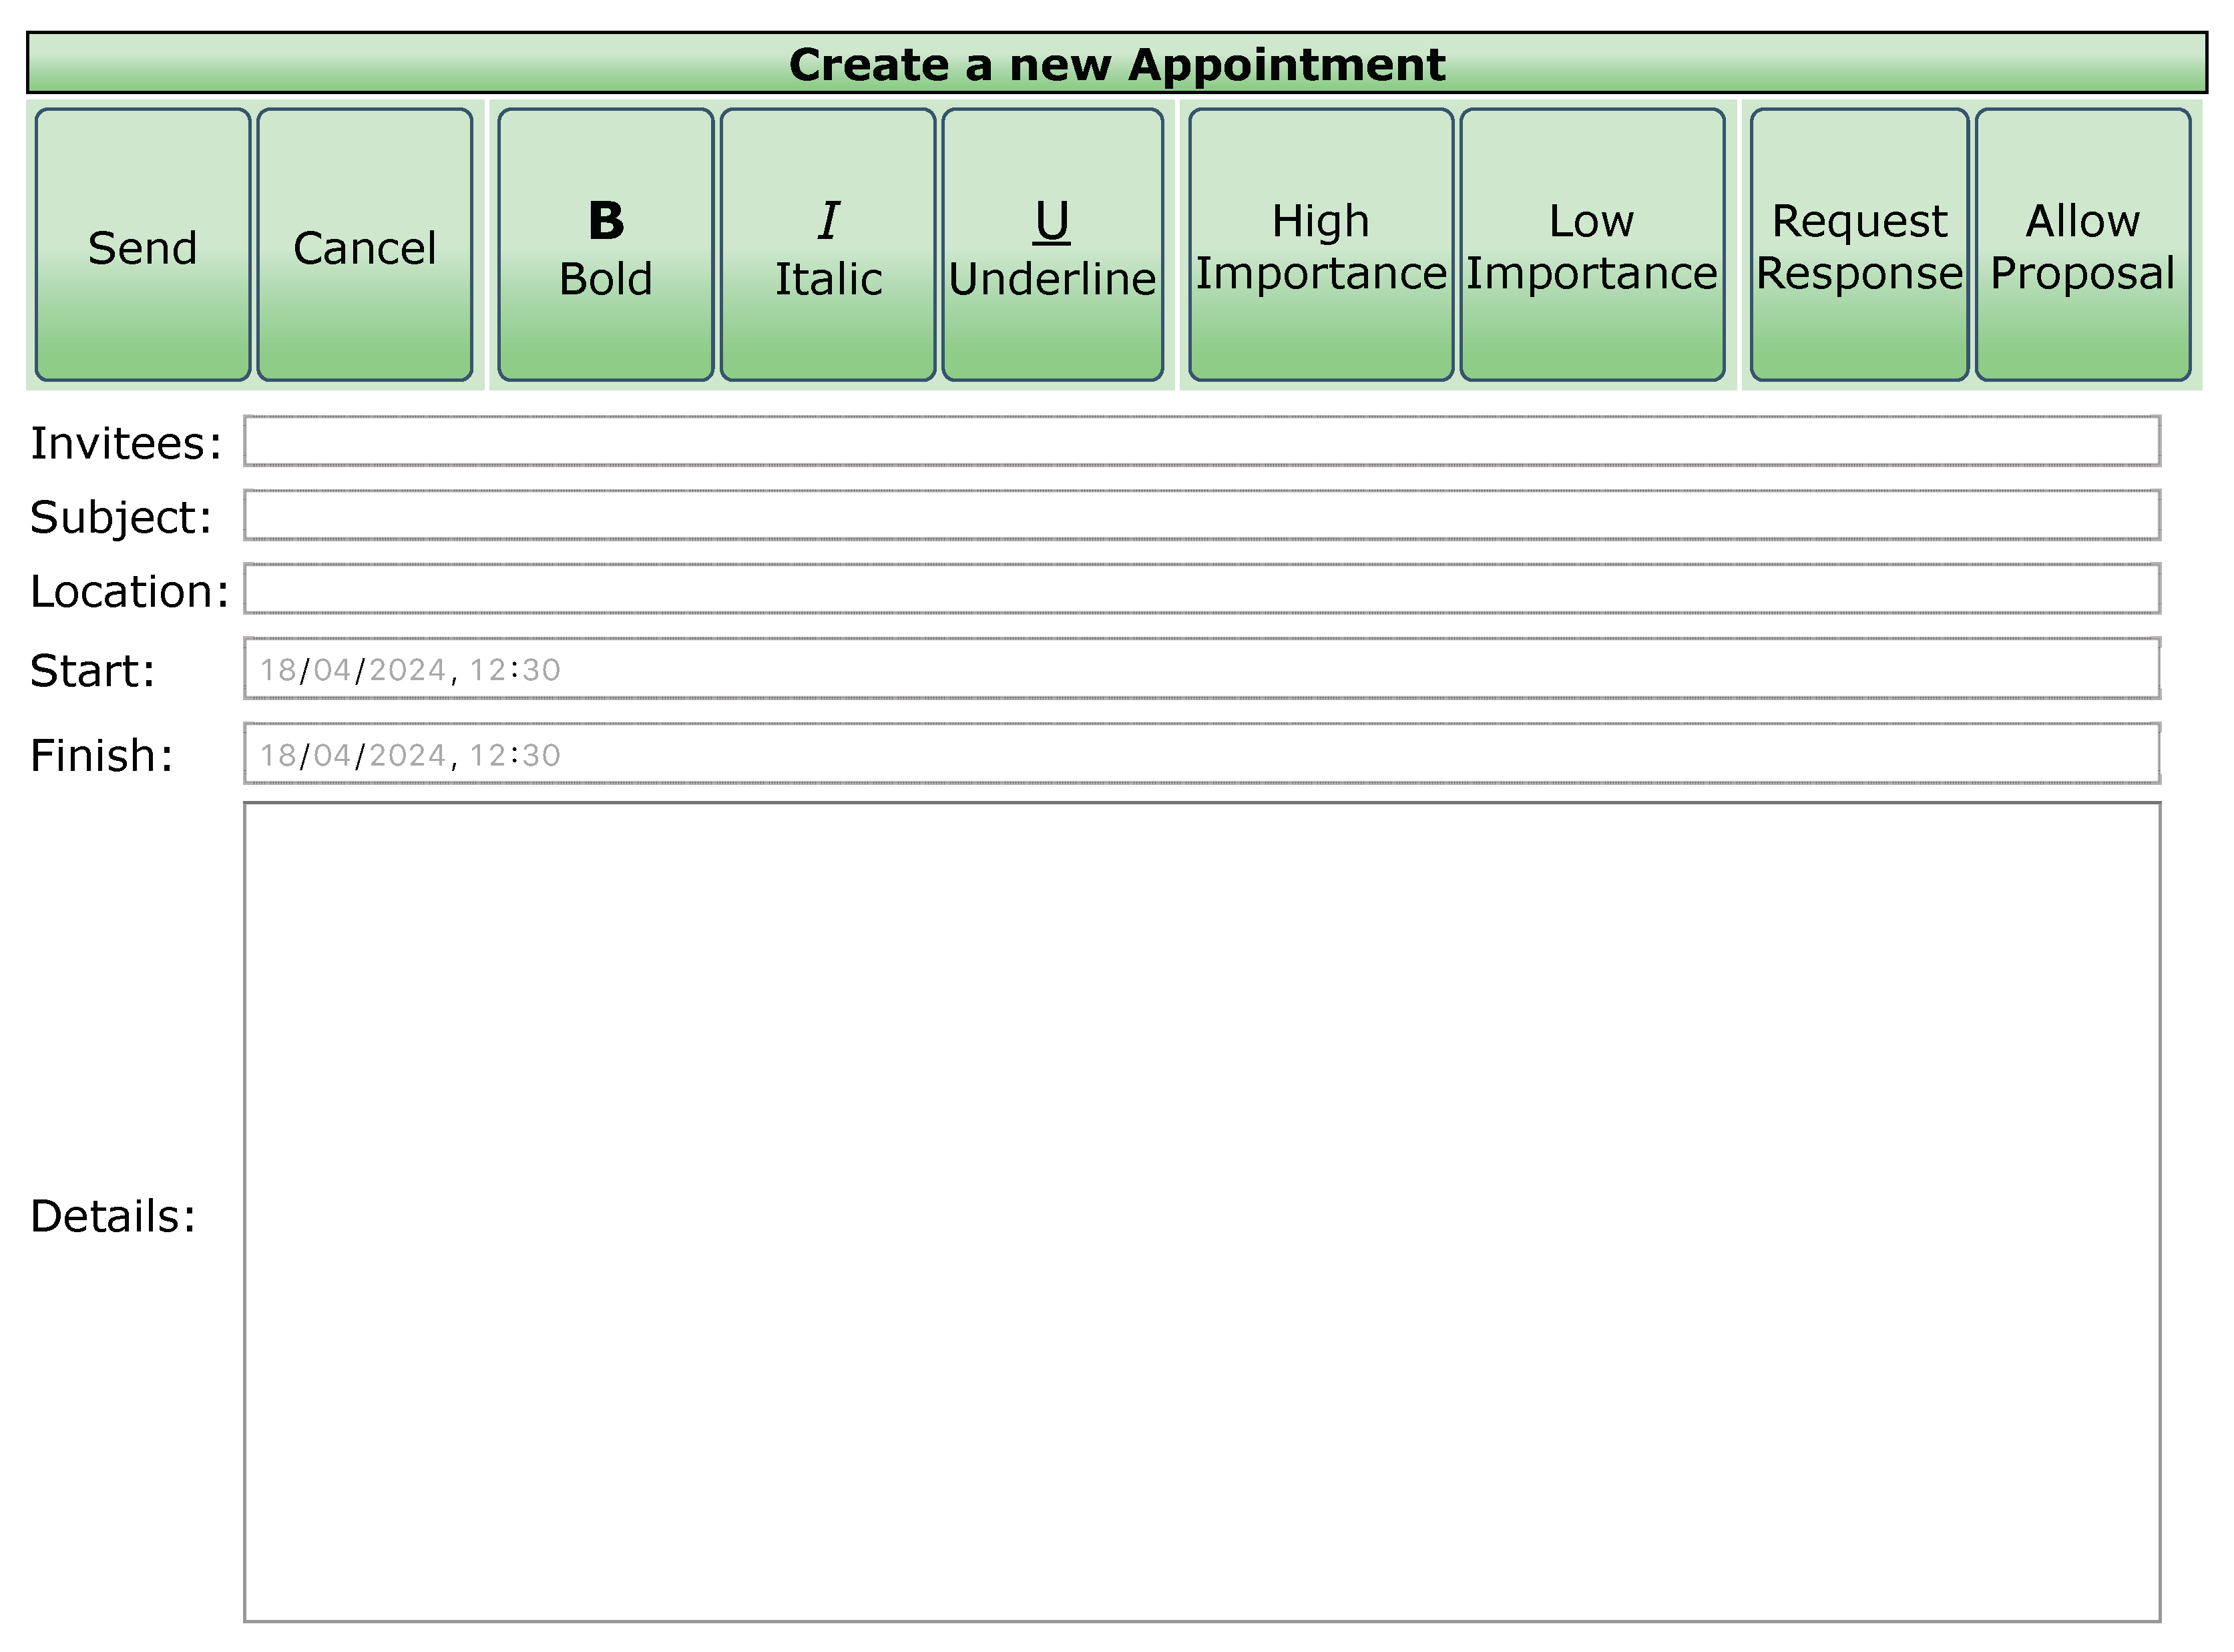
iframe. They represent a “create calendar appointment” page, utilising a ribbon-style button system, as is commonplace in similar software. The reasons for this design choice were twofold: for simplicity, removing elements of complexity that could cloud responses, and to leverage a pre-existing schema of use within the user’s memory, allowing for a more realistic reaction to change, as recommended by [
5].
The interface does not create a real appointment, and this was explained to participants in the briefing. To the right of the interface was a simple task for the participant to complete in each interface, the wording of which remained consistent throughout the questionnaire. The aim of this was to introduce consistency and routine to the tests.
The SUS and comfortability questions were below the interface with a prompt reminding of the nature of the study. See
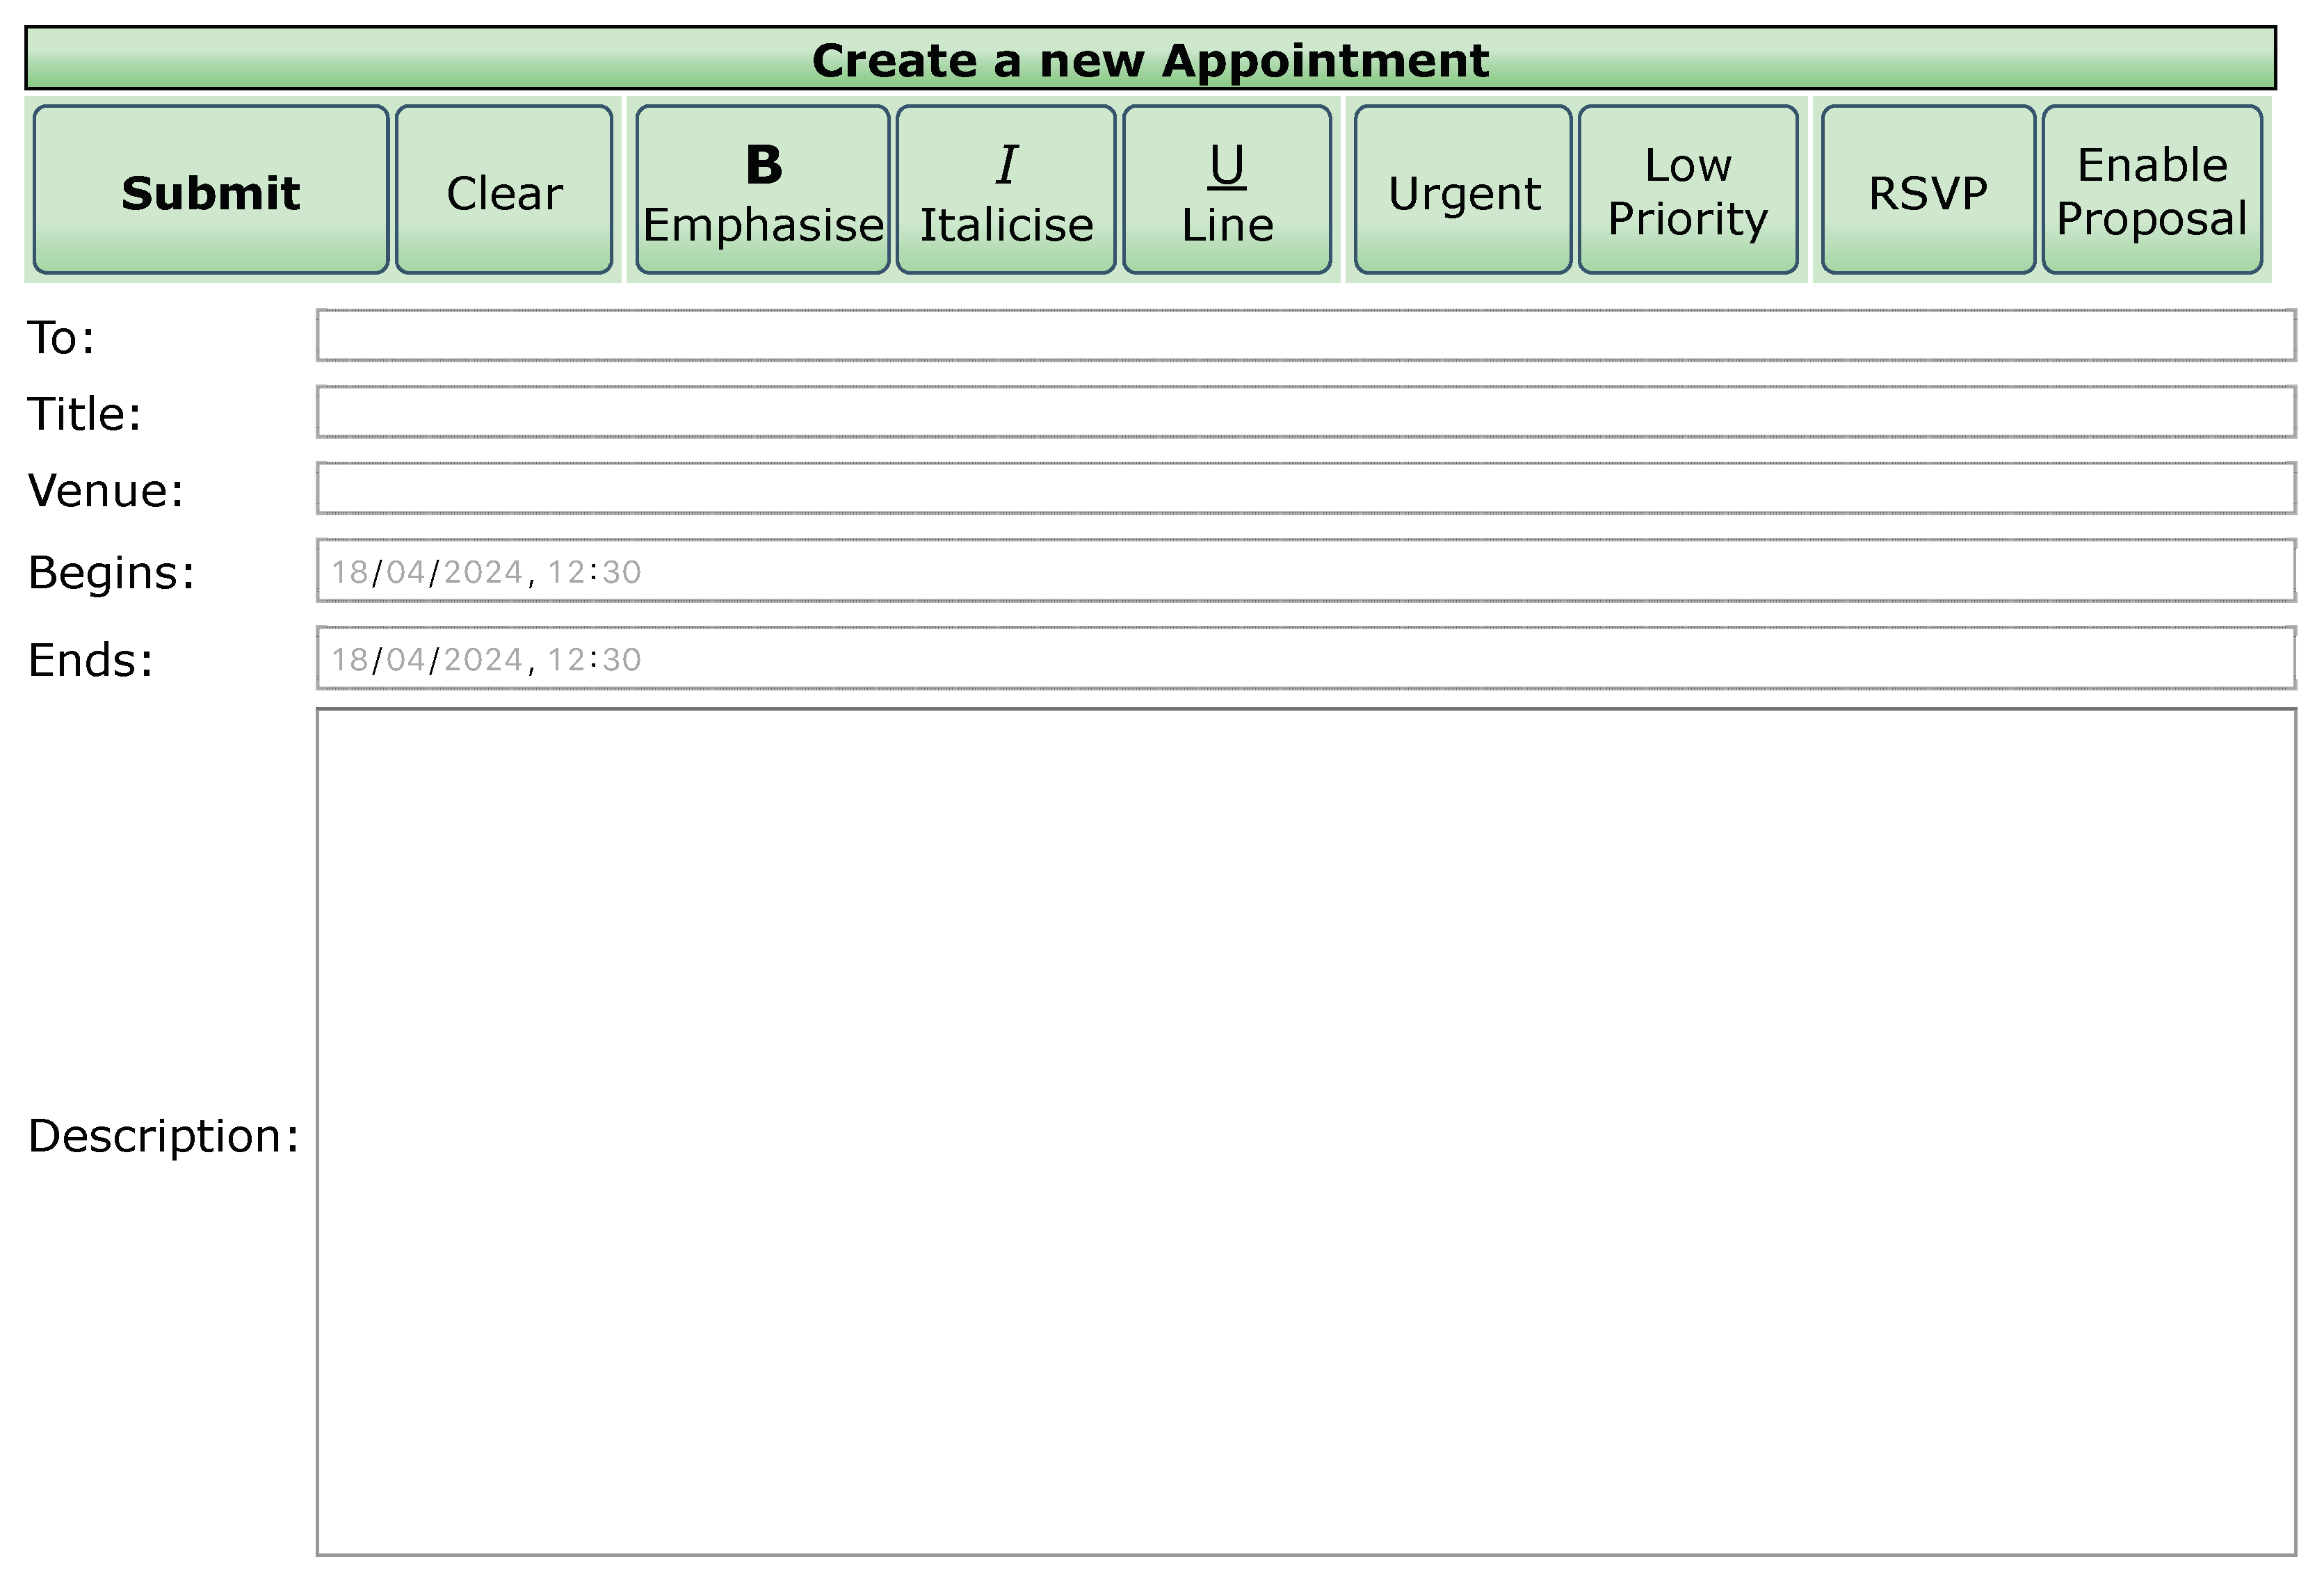
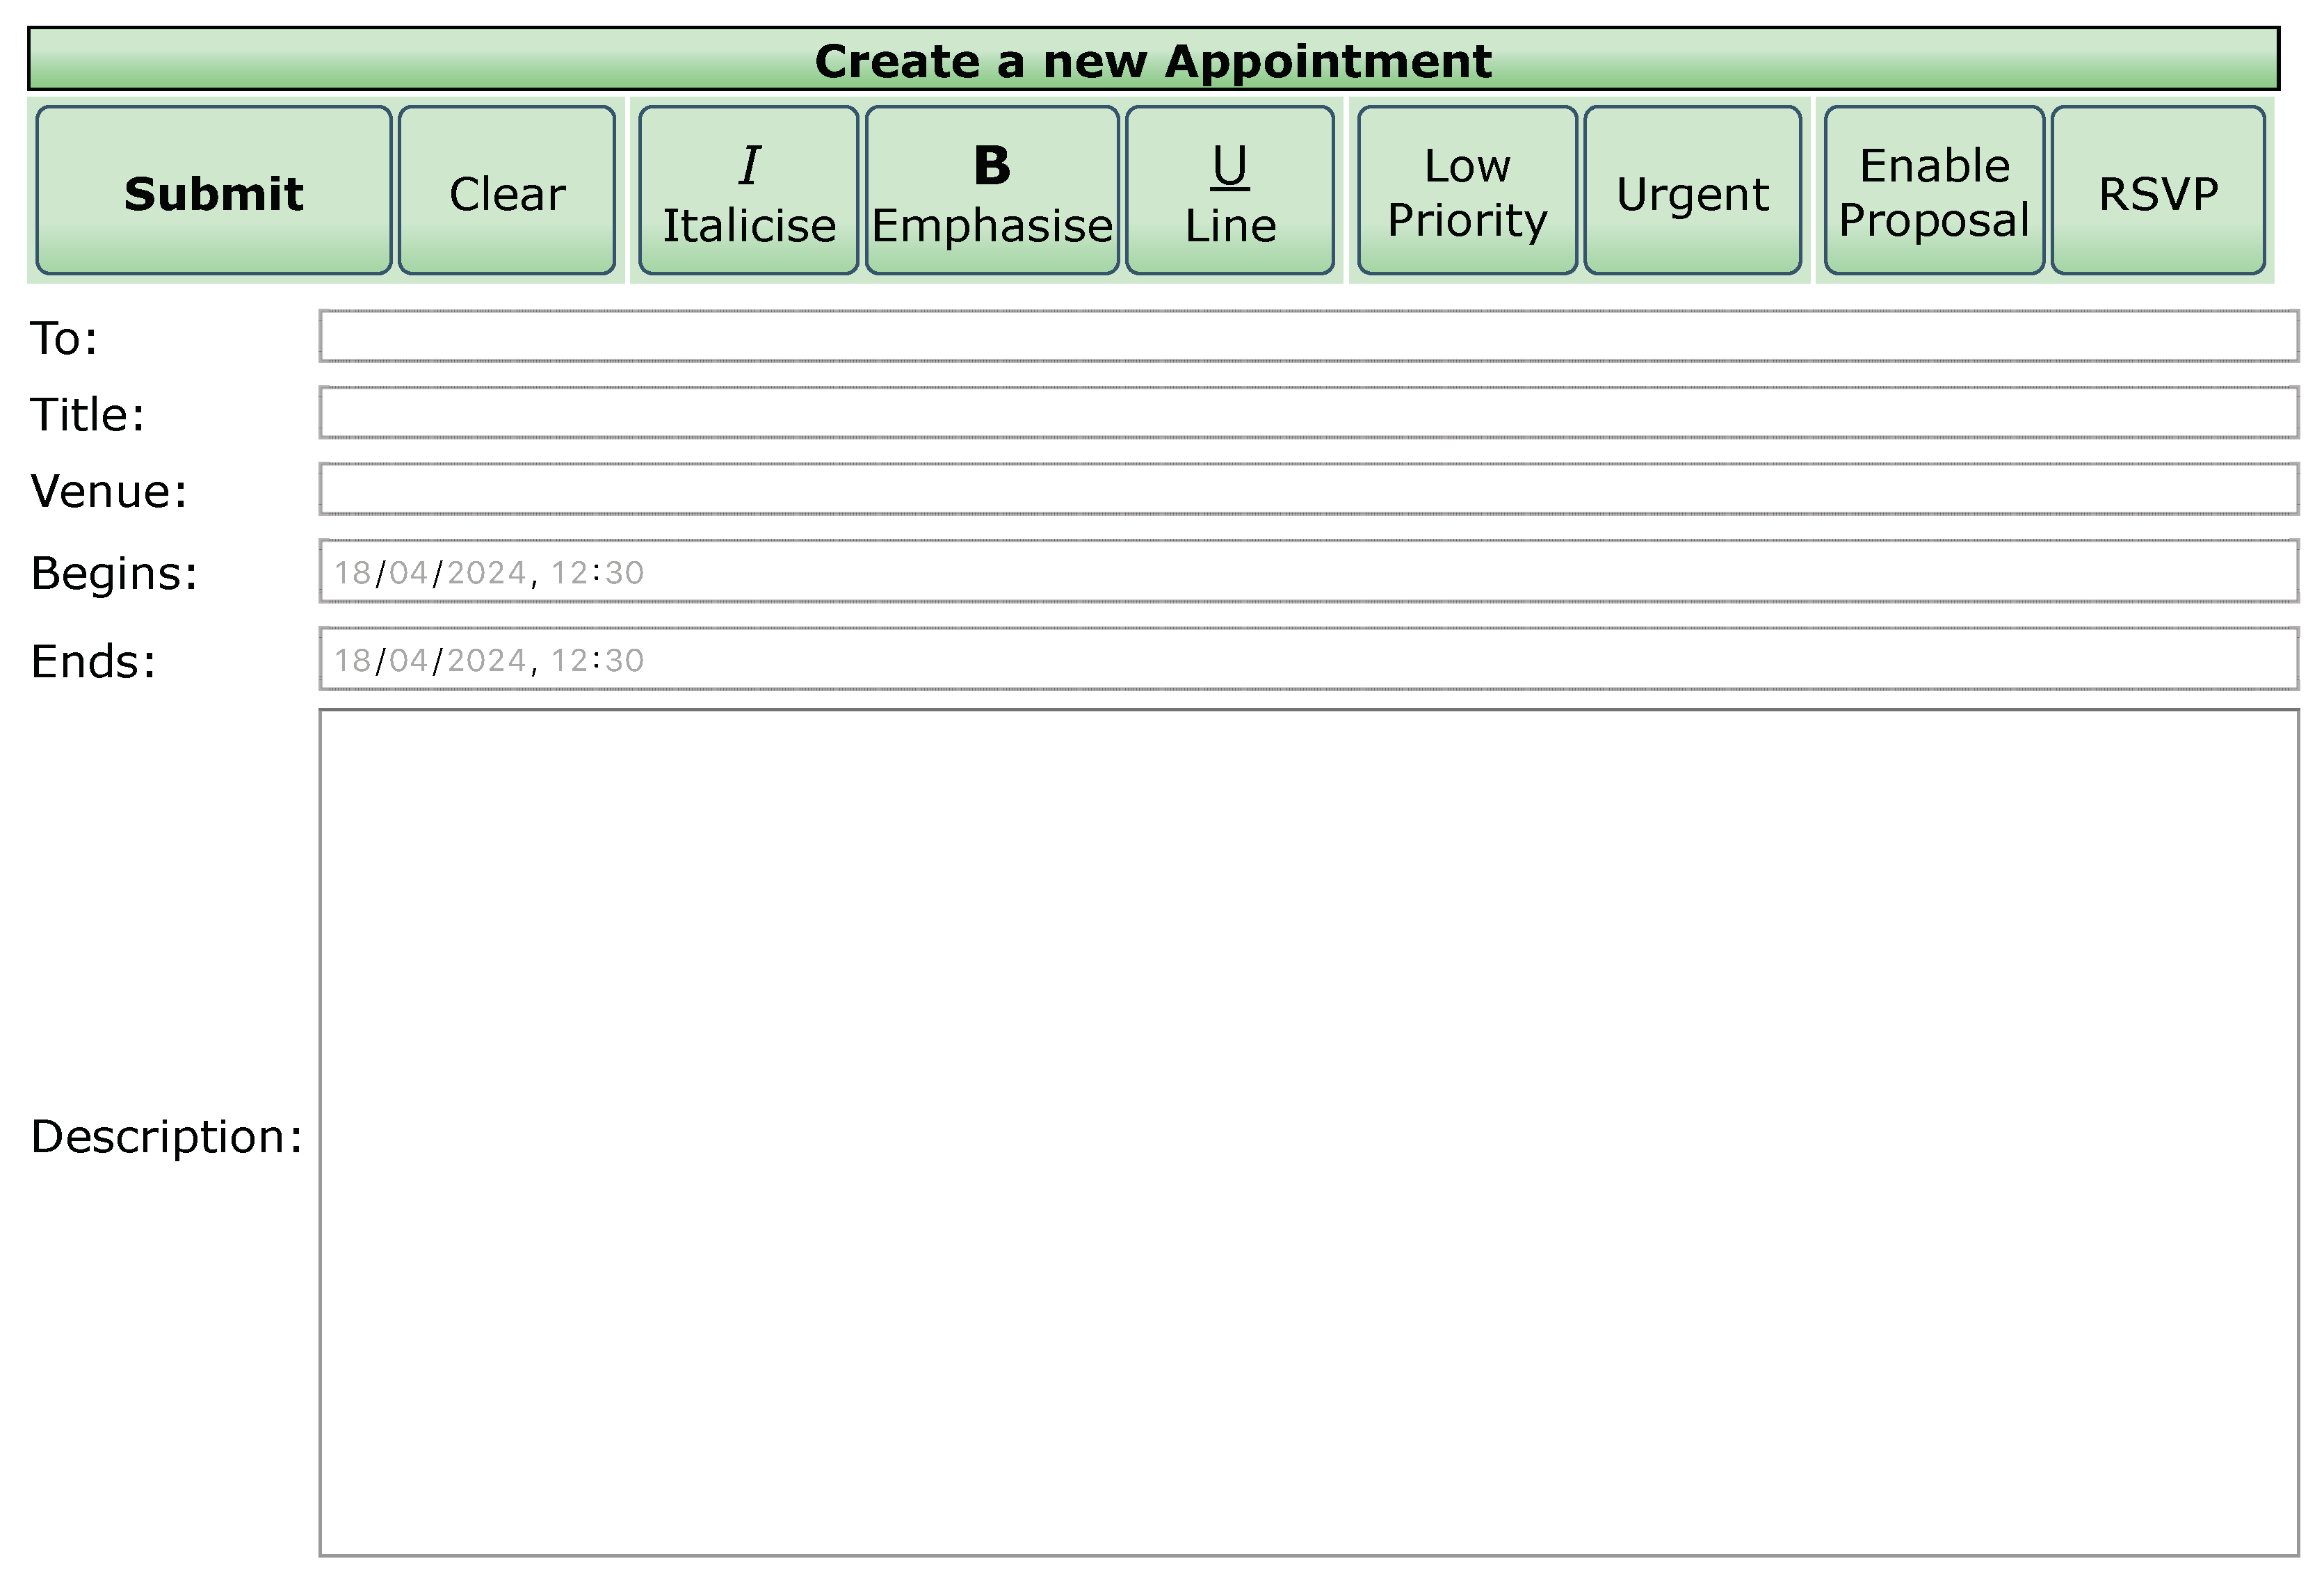
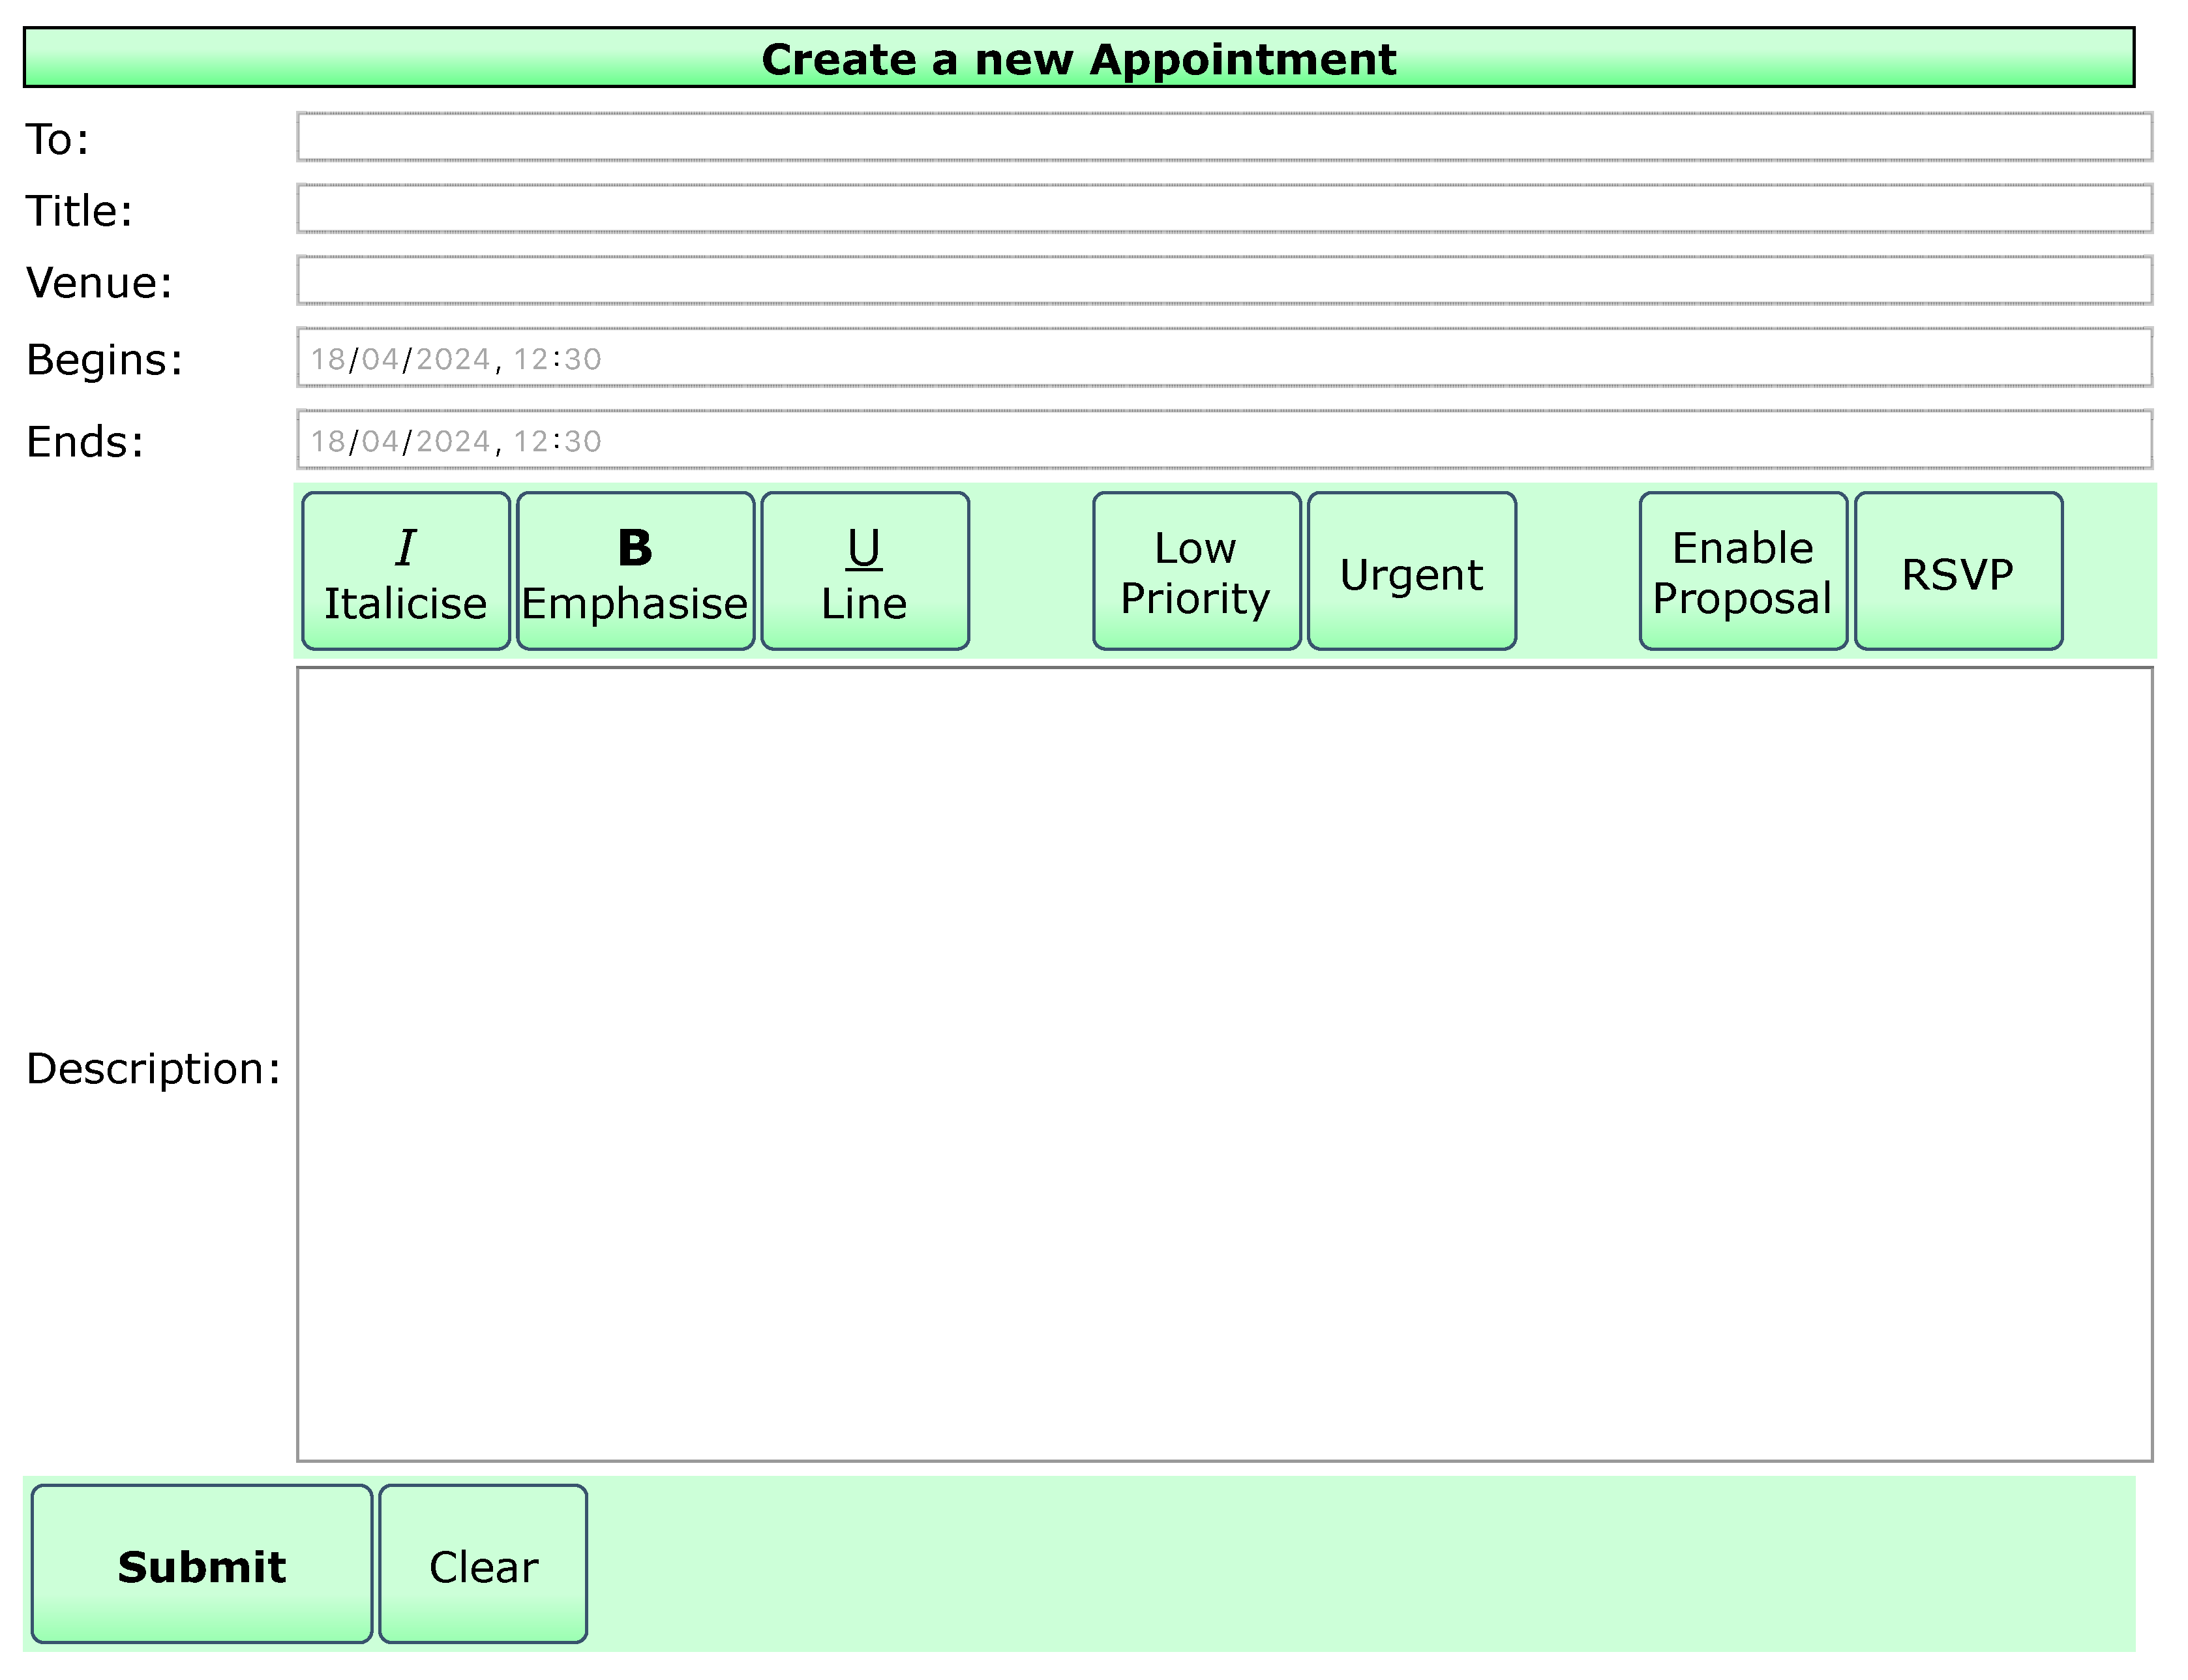
Appendix A for detailed depictions of the eight interfaces and the given task to complete.
The designs were created with industry-standard design heuristics in mind. They were evaluated against Nielsen’s Usability Heuristics [
20] for suitability before proceeding, and were found to be majorly compliant, despite some of the inconsistencies that the simulated updates introduce.
The seven design changes were decided based on individual design components within the initial design. The design was modular to allow for easy introduction of changes, also as recommended by [
5]. Changes were applied cumulatively, with each building on the prior, as opposed to reverting to the initial interface each time, as this would not occur in real-life, and introduces another variable not being measured. For each design change, there is an underlying hypothesis, justification, and expectation (
Table 1).
3.5. Test and Control Groups
The test group for this study is human participants aged 18 or above that have a clinical diagnosis of autism spectrum disorder (or one of its former variants, for example Asperger’s Syndrome [
1]). The control group is human participants aged 18 or above that do not have a clinical diagnosis of autism spectrum disorder (or one of its former variants).
An exclusion criteria was applied to both groups: participants must not have a diagnosis of a disability other than ASD that can affect cognitive or visual perception (or take medication that can cause such symptoms), as this would introduce another difficulty factor that is not being accounted for in this study. This includes:
A “specific learning disorder with impairment in reading” (such as dyslexia), where the participant’s reading function is impaired [
1];
Visual impairments that are not corrected by glasses, including colour vision deficiency, as one of the change tests is colour-based, which tritanopia-diagnosed participants would not detect [
22];
A neurocognitive disorder affecting memory retention and cognitive function, for example Alzheimer’s disease, dementia or Huntington’s disease, as the testing mechanism relies on a reaction to a previously memorised change, which may not be retained reliably [
1].
Consideration was given to the side effects of medication as some medication for otherwise unrelated conditions (like arthritis) can impair ocular function [
23]. Participants were presented with the exclusion criteria at the beginning of the study, and were required to self-declare:
Ineligible participants could not proceed with the questionnaire. The ASD indicator was stored as a per-respondent classifier to distinguish test and control data.
3.6. Distribution
A problem experienced by previous researchers when working with autistic subjects was “a lack of collaboration opportunities with autism schools or centres” [
11] leading to difficulty recruiting autistic participants. To address this, the University of Kent’s `
Student Support and Wellbeing’ department distributed the questionnaire by e-mail on the researcher’s behalf to students diagnosed with autism spectrum disorder and no other disability (to filter ineligible participants). Control participants were recruited via recruitment posters affixed around strategic points at the University of Kent’s Canterbury campus, including the Computing and Psychology schools.
4. Results
4.1. Participant Turnout
A total of 11 responses from autistic subjects (2 of which were incomplete) and 10 control responses were collected. All participants self-declared eligibility.
4.2. Quantitative Data Statistical Analysis
Non-parametric statistical methods were employed (due to the small sample size) to find significance in the calculated SUS and comfortability (`CMF’) scores and facilitate hypothesis testing. Two incomplete entries were excluded from analysis. Three unreliable responses were excluded to adjust the response multiplicity to to allow for fairer assumptions in non-parametric testing:
an anomalous test response with consistently high scores,
an anomalous control response with consistently low scores, and
an unreliable control response where a comment described “scrolling” to see the interface and instructions, meaning the browser window was too small.
The basic rule of hypothesis testing used is that if the probability of observing the sampled result (p) is less than the significance level (), the null hypothesis is rejected and the alternative hypothesis is asserted with certainty, which is used to form research hypotheses ().
A right-tail Mann-Whitney U Test (also known as the Wilcoxon rank-sum test) was used with a significance on test vs. control (two independent samples) SUS and CMF scores on a per-interface basis to disprove the null hypothesis : `there is no significant difficulty caused in the test group’ by checking whether the control score will always be higher than the test score. If then can be disproven at accuracy for that change, showing a significant impact on test group scores as compared to the control group.
However, this test only measures the probability of difficulty in the test group in relation to the control group. Hence, to catch cases where both groups’ scores suffered, it is necessary to measure each group’s SUS and CMF scores of a change in relation to its prior score (to detect a significant drop).
The Wilcoxon signed rank test was used to measure the p-value of each score in relation to the previous related variable (a matched-pair sample from the same group), with a right-tailed test to detect the probability that the prior interface’s scores are larger than the current, again using significance , to disprove the null hypothesis : there is no significant difficulty caused in the test group.
In the Wilcoxon signed rank test, indicates is disproven, and is invoked. However, if in a right-tailed test, then the inverse of is asserted – in this case, showing that the current interface has received consistently higher scores than the prior, implying that prior interface was more difficult than the current.
This occurred across two changes, showing that change 4 had consistently higher scores than change 3 for the control group (SUS and CMF), and that change 5 scored higher than change 4 in the same manner for the test group. While these findings will not be hypothesis tested, as this implication is not explicitly measured as part of this study, the presence of these values is noted. Qualitative data supports these findings in the test group for change 5.
A unique case has been considered: where the current interface’s scores are similar to the prior’s, and both groups’ scores are similar (potentially indicating consistently low scores), so that it is not possible to disprove in either test (indicated by ). In this case, the group’s mean and median scores will be assessed. If they are found to be consistently low (within the lower quartile of the question measurement scale), it will be regarded as a point of difficulty. However, no such cases exist in this data.
Using the
p-values calculated through these tests, we can disprove
and assert
in some cases, forming research hypotheses (
) indicating changes that caused difficulty, be it through usability or discomfort, within each group. See
Table 2 for
and their corresponding statistical test and result. These results hold when manually cross-checked with the raw questionnaire data.
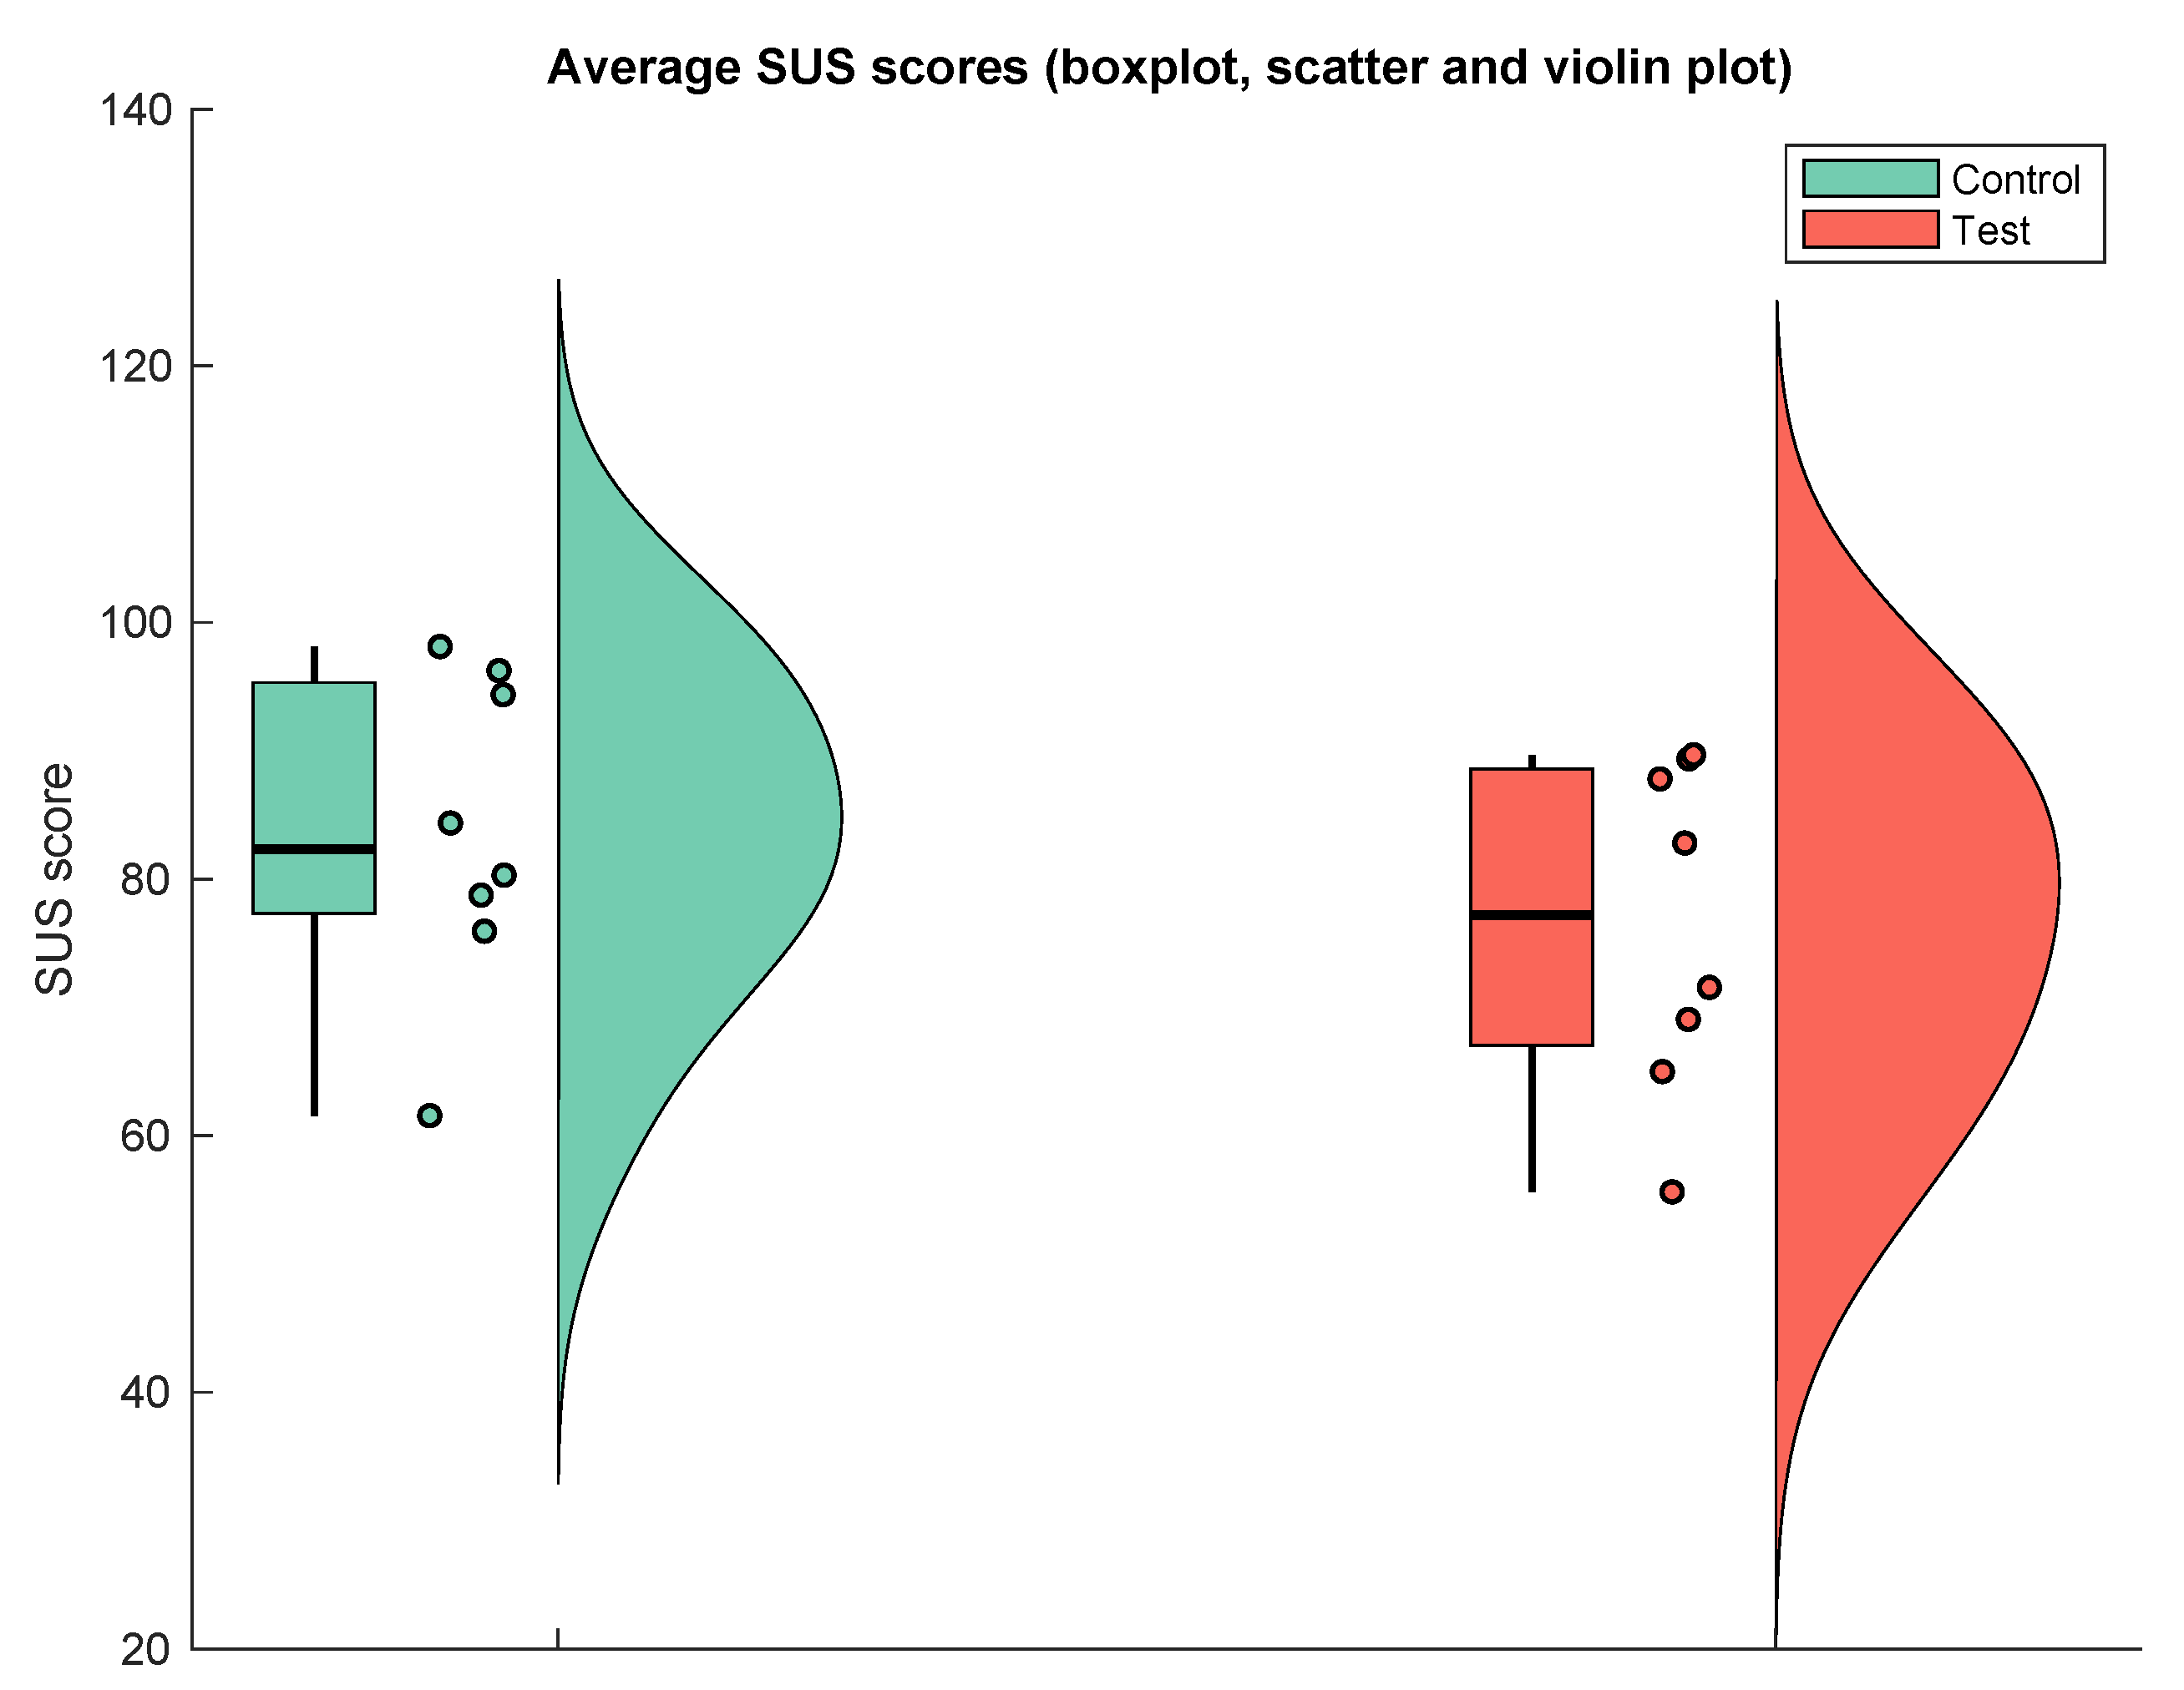
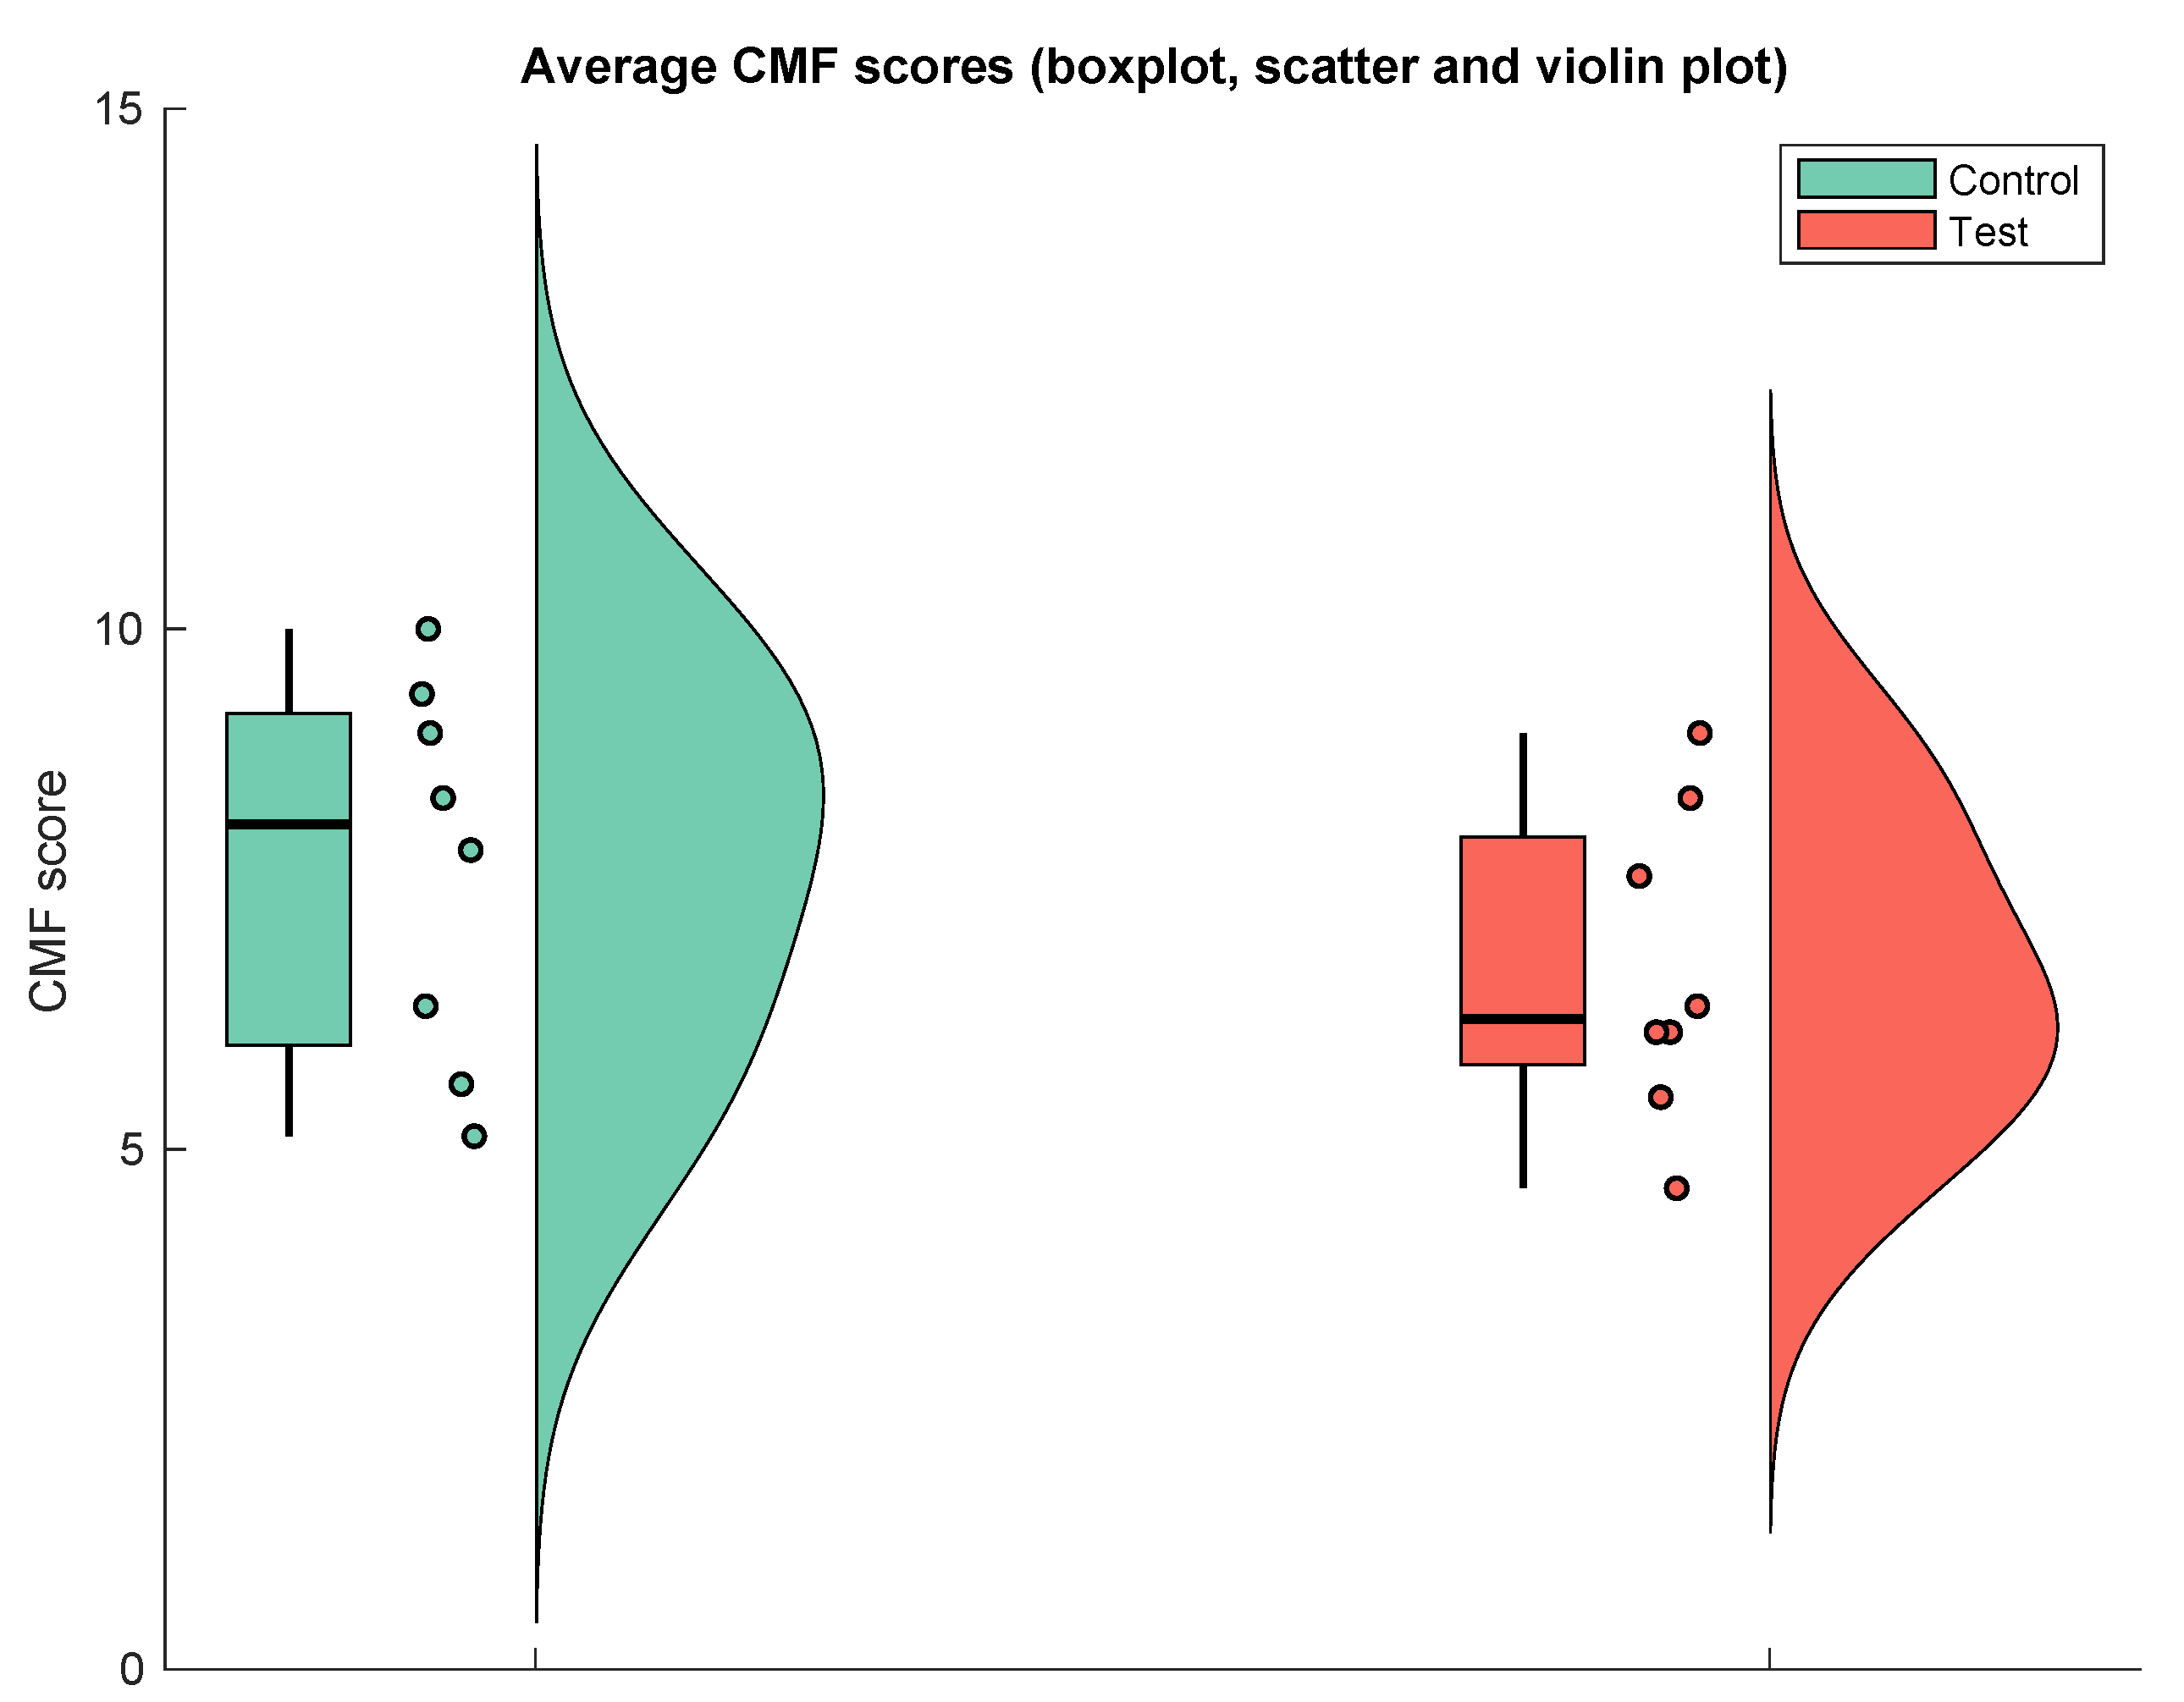
Averaged data for SUS and CMF scores per participant has been presented in boxplot, scatter and violin plots in
Figure 1 and
Figure 2. The autistic SUS scores showed greater variability than control scores, and the autistic CMF median is significantly lower than the control median. The autistic CMF score distribution is slightly skewed towards the lower half of the scale whereas the control CMF scores are evenly distributed.
4.3. Qualitative Data Analysis
A total of 103 (45 test vs. 58 control) overall interface comments (question ‘COM
x’ for each interface) were categorised based on either a positive, negative, or neutral sentiment regarding the change introduced. Comments containing both a positive and negative point were regarded as neutral as the sentiment balanced. Responses excluded from the quantitative analysis were re-introduced, with all comments being assessed and irrelevant comments omitted on an individual basis. A resultant ‘sentiment score’ was then calculated through totalling the weightings per-change, per-group (
Appendix B).
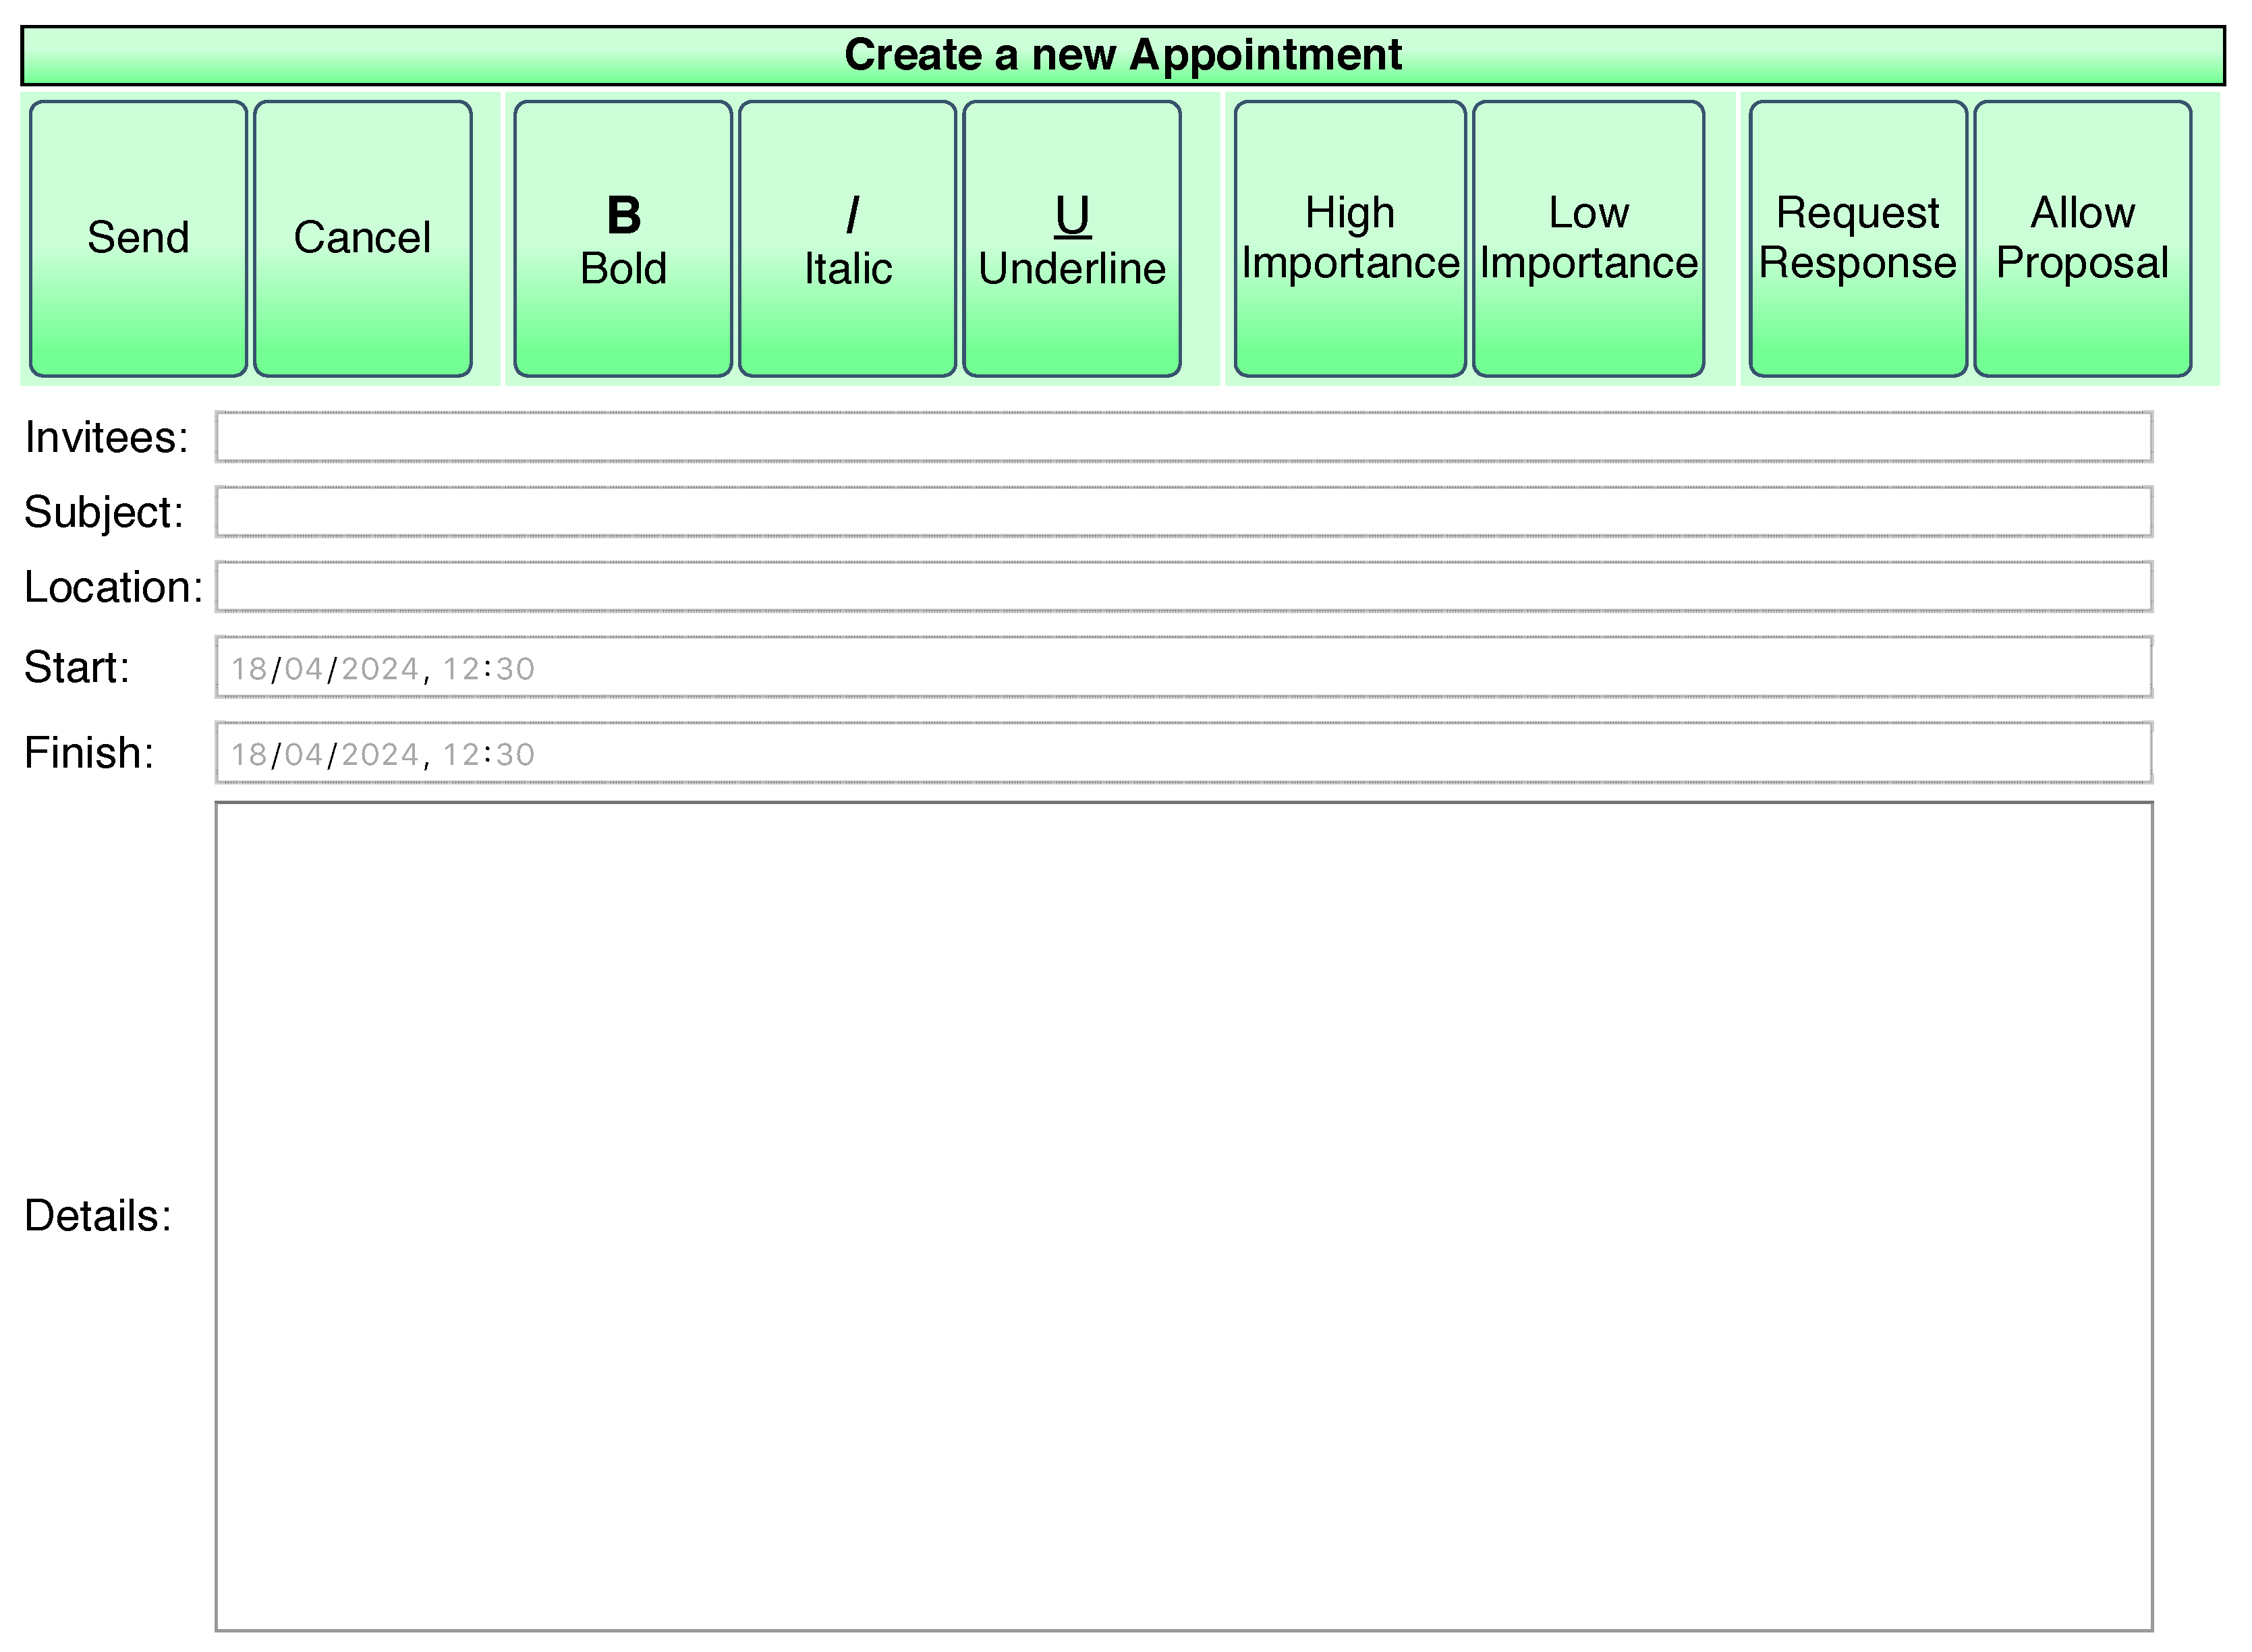
Sentiment towards the change of colour varied. Control responses were mostly based on emotion and colour preference, whereas most autistic responses were based on usability with specific reasons provided: “I preferred this to the last one … the colour difference between a selected and unselected toggle was clearer” and “the green was too bright and garish, I liked the blue better because it looked more relaxing”. This leads to conclude that the reaction to colour change may be dependent on the colour that the interface changes to, and may be exacerbated by the “hyper- or hyporeactivity to sensory input” symptom that may present in autistic individuals [
1], where the new colour triggers an adverse sensory hyperreactivity. This change was intended to trigger the greatest reaction to colour change by stimulating different visual receptors (green instead of blue) in the eye, as per trichromatic theory [
21]. A Masters thesis [
24] touches on the number of colours used impacting accessibility, but there is room for research around the impacts of different colour changes in ASD.
Comments regarding the font face change revealed that, despite some test and control subjects not being able to identify what had changed, they still experienced discomfort. One autistic participant stated “I did not notice a change but something doesn’t feel right. I feel quite strange”. Another followed suit: “I cannot immediately identify what the change is”. Alongside the consistent SUS drop in autistic participants, these findings support the research hypothesis “changing the font face of an interface causes difficulty in autistic users”.
The vocabulary used around the text wording change was significantly more severe and emotional amongst the test group, such as “stressed”, “do not like”, “not in love with”, “quite uncomfortable”, “irritating” and “confusing”, whereas control group comments contained less severe and emotional wording (only “difficult”, “weird” and “confusing”). Despite both groups leaving 8 comments for this change, the test group displayed greater distress within these, which is reflected in the quantitative analysis, and supports the research hypothesis “changing the text wording of an interface causes difficulty in autistic users”.
The autistic group unexpectedly showed a consistently positive reaction to the inconsistent sizing change:
“the bigger ‘submit’ button made it stand out more so it was easier to find”,
“I like the send button getting more importance (via size)”,
“I actually liked the ‘submit’ being in bold”,
“… this is a good thing”, and
“I liked how the submit button was larger”.
In addition, one SUS point (“I think there is too much inconsistency in this system” [
13]) received a comment: “The bigger send button, although inconsistent, makes itself stand out in a good way”. Furthermore, there was no negative impact on any of the autistic CMF scores. This supports the prior implication made: that the test group found change 5 easier than change 4, as
.
We can also explore individual cases to identify problems that an autistic user may encounter when dealing with change. An autistic participant stated in COM4 (consistent sizing change) that “this was the biggest visual change aside from the colour change so I had to re-visualise what I was meant to be doing”. This response was unexpected as the task flow remained the same and the change was minor and uniform, but presented a clear challenge to this user. It also shows that the participant had been navigating the interface through a mental visualisation which they felt had to be re-built. This is likely a result of the ASD symptom of creating “rigid thinking patterns” [
1].
Whether a user would be able to adapt their current mental schema of an interface or create a new one based on the severity of a change and the extent to which autism impacts this is unclear, leaving room for further work around the understanding of interpretation and processing of interfaces and change in autistic users.
One autistic user left a detailed account of their experience with the change of button order, stating their frustration around “pointless change” (
Appendix C). Due to the sensitivity to change in ASD, it is recommendable to any HCI practitioner to avoid ‘change for the sake of change’ as it may cause unnecessary distress in autistic users, as seen here.
While it has not been possible to derive research hypotheses from the qualitative data due to its optional and subjective nature, it has been used to support the hypotheses proven through statistical analysis, to provide deeper insight into autistic users’ reactions, and to identify further areas of research.
5. Discussion, Limitations, Future Work
The results achieved have met the aim of this research: to identify design element changes that cause difficulty in autistic users. Before formulating design heuristics from our research hypotheses, there are some limitations and opportunities for future works that are important to explore for the benefit of future researchers.
5.1. Participant Demographic
The questionnaire was open for completion through the 21
st February 2022 08:00 to the 21
st March 20:00. The closing sample size was 11 autistic subjects and 10 control subjects, including two incomplete autistic responses. While this was enough to perform non-parametric statistical hypothesis testing and numerous high-quality responses were received, a larger sample size would have been more ideal. This is a difficulty that prior researchers have described when working with autistic users [
6].
Despite achieving more than double the amount of autistic subjects in a previously criticised paper [
9], it is arguable that the minimum bounds for a similar study should be adjusted from an overall 20 participant minimum used here, to a 20 autistic and 20 control subject minimum, to allow for a greater breadth of data to be analysed, as not all ASD symptoms may present in all individuals [
1], and to allow for a greater degree of accuracy of assumptions in statistical testing.
An aspect of autism that was not explored fully was the severity of the user’s symptoms. As a `spectrum disorder’, autistic individuals’ symptoms can vary in nature and severity. The DSM-5 [
1] provides three severity levels of ASD. “Inflexibility of behaviour” is cited across all three levels, however as the questionnaire was distributed via a university’s disability support services, it is likely that it reached only severity level 1 (“requiring support”) autistic individuals, as individuals with level 2 (“requiring substantial support”) or level 3 (“requiring very substantial support”) symptoms are less likely to partake in university education due to the functional deficits experienced at those levels. [
1] It is recommended that a range of autism severity levels be targeted in future studies, which is likely only possible if distributed through a clinical or specialised autism research centre channel, and not through university support services.
5.2. Questionnaire Abandonment
Two questionnaire responses were left incomplete. Both abandoned responses were from the test group. In one case, the user was exposed to change 3 (text wording) and gave a SUS score of : the second lowest SUS score given across the study. The comment given was “the change of names on the interface stressed me as it didn’t follow the instructions”. The wording of instructions deliberately did not change to simulate the user re-learning the new terminology. Upon completing the next change test, the participant stated “one change of words can often throw me” and closed the questionnaire. This is an extreme case of the formed research hypothesis “changing the text wording of an interface causes difficulty in autistic users”. Future researchers are reminded that, due to the potentially stressful nature of exposure to change to autistic participants, they may be more likely to abandon the questionnaire than their control counterparts. Despite this, some of the abandoned responses may hold qualitative value, as is the case here.
5.3. Effectiveness of the `Comfortability Score’
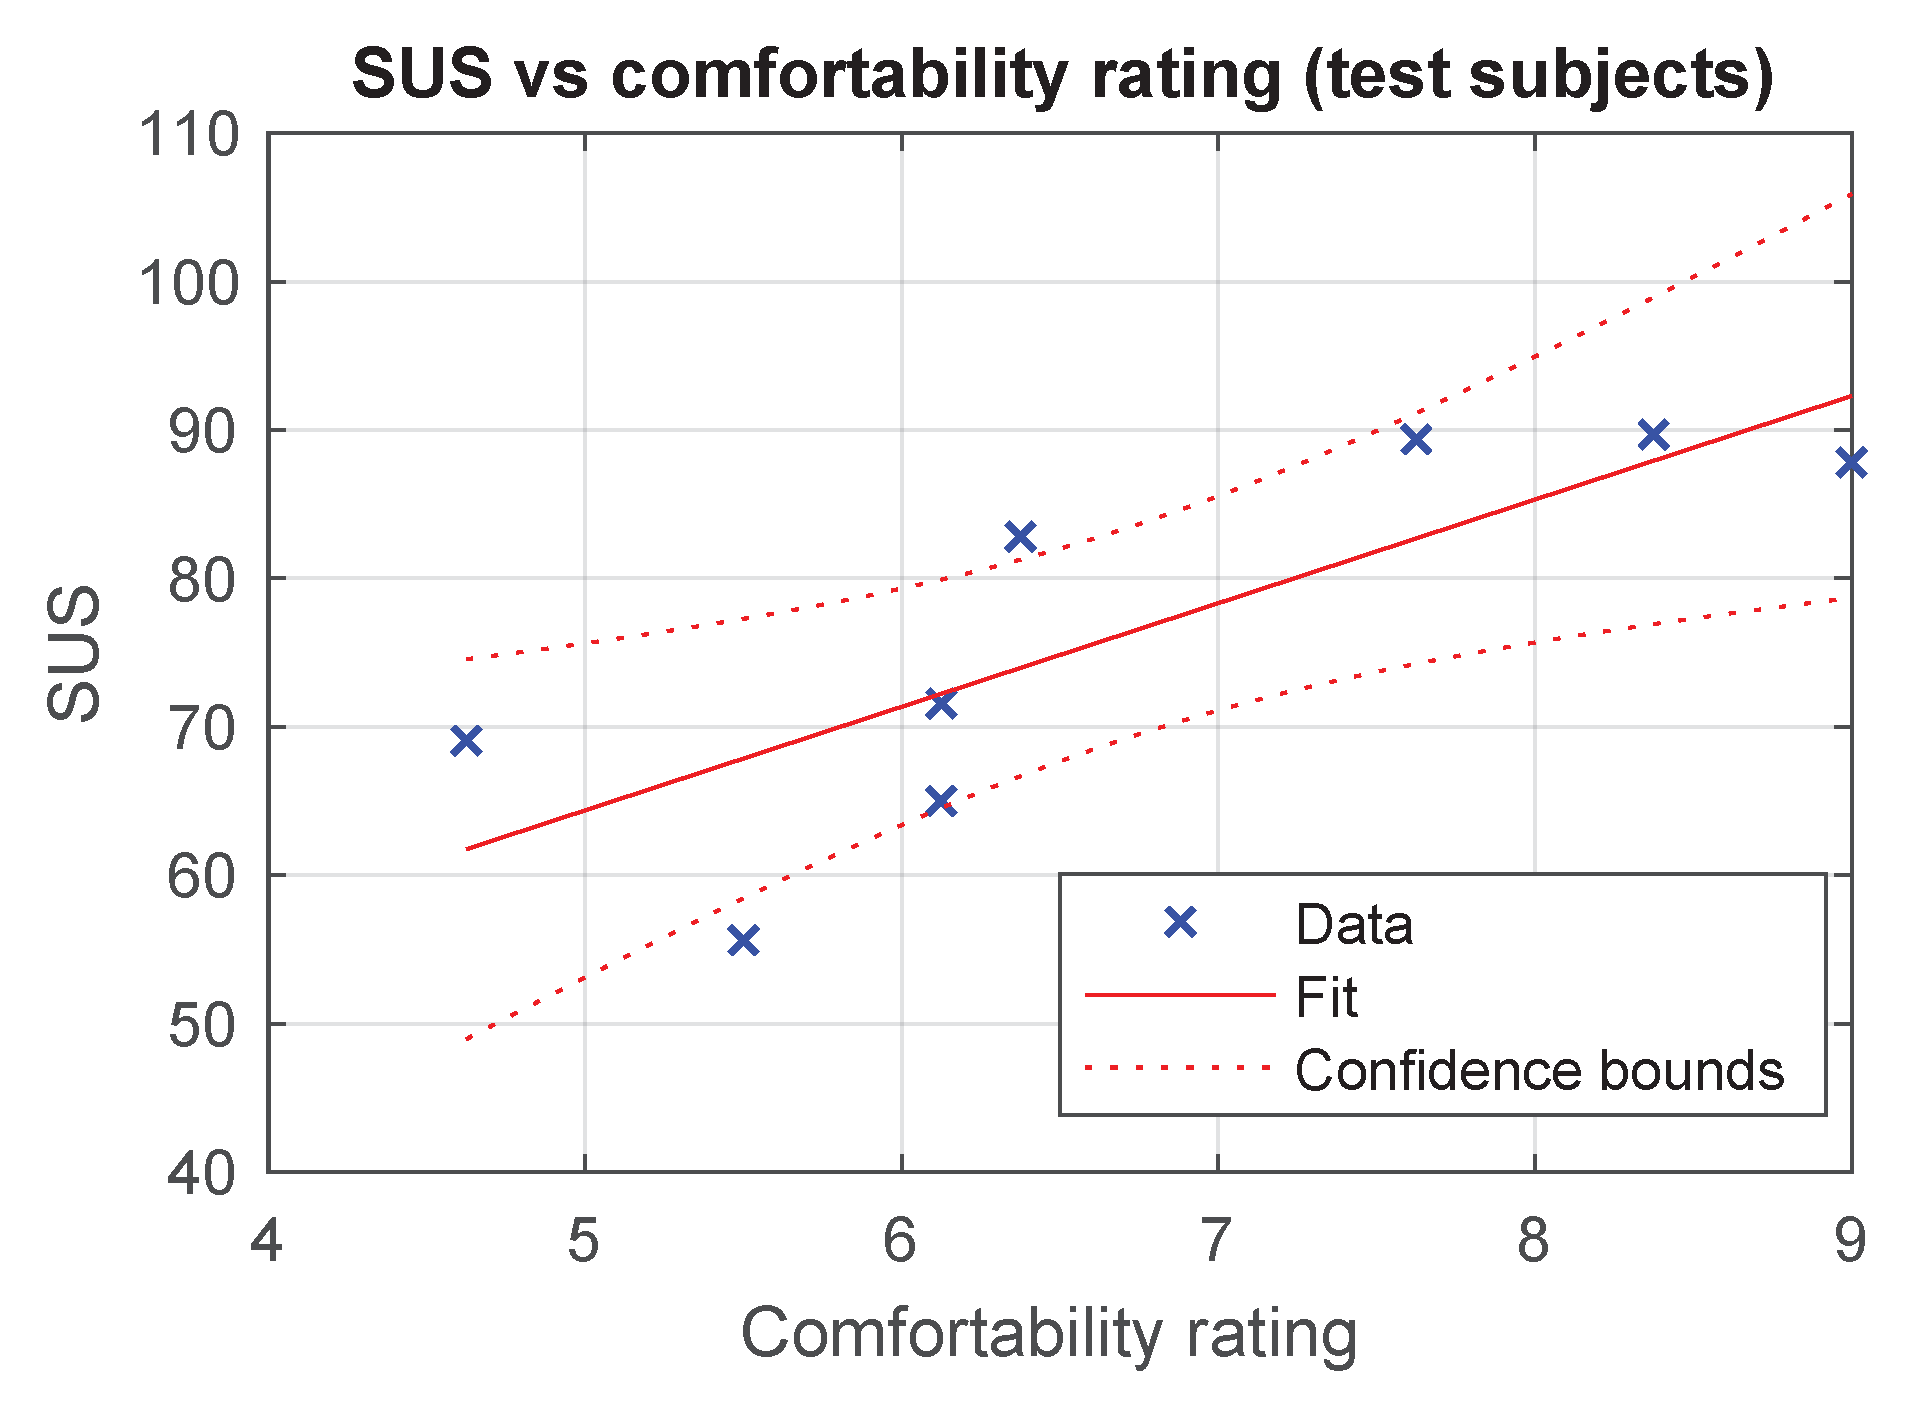
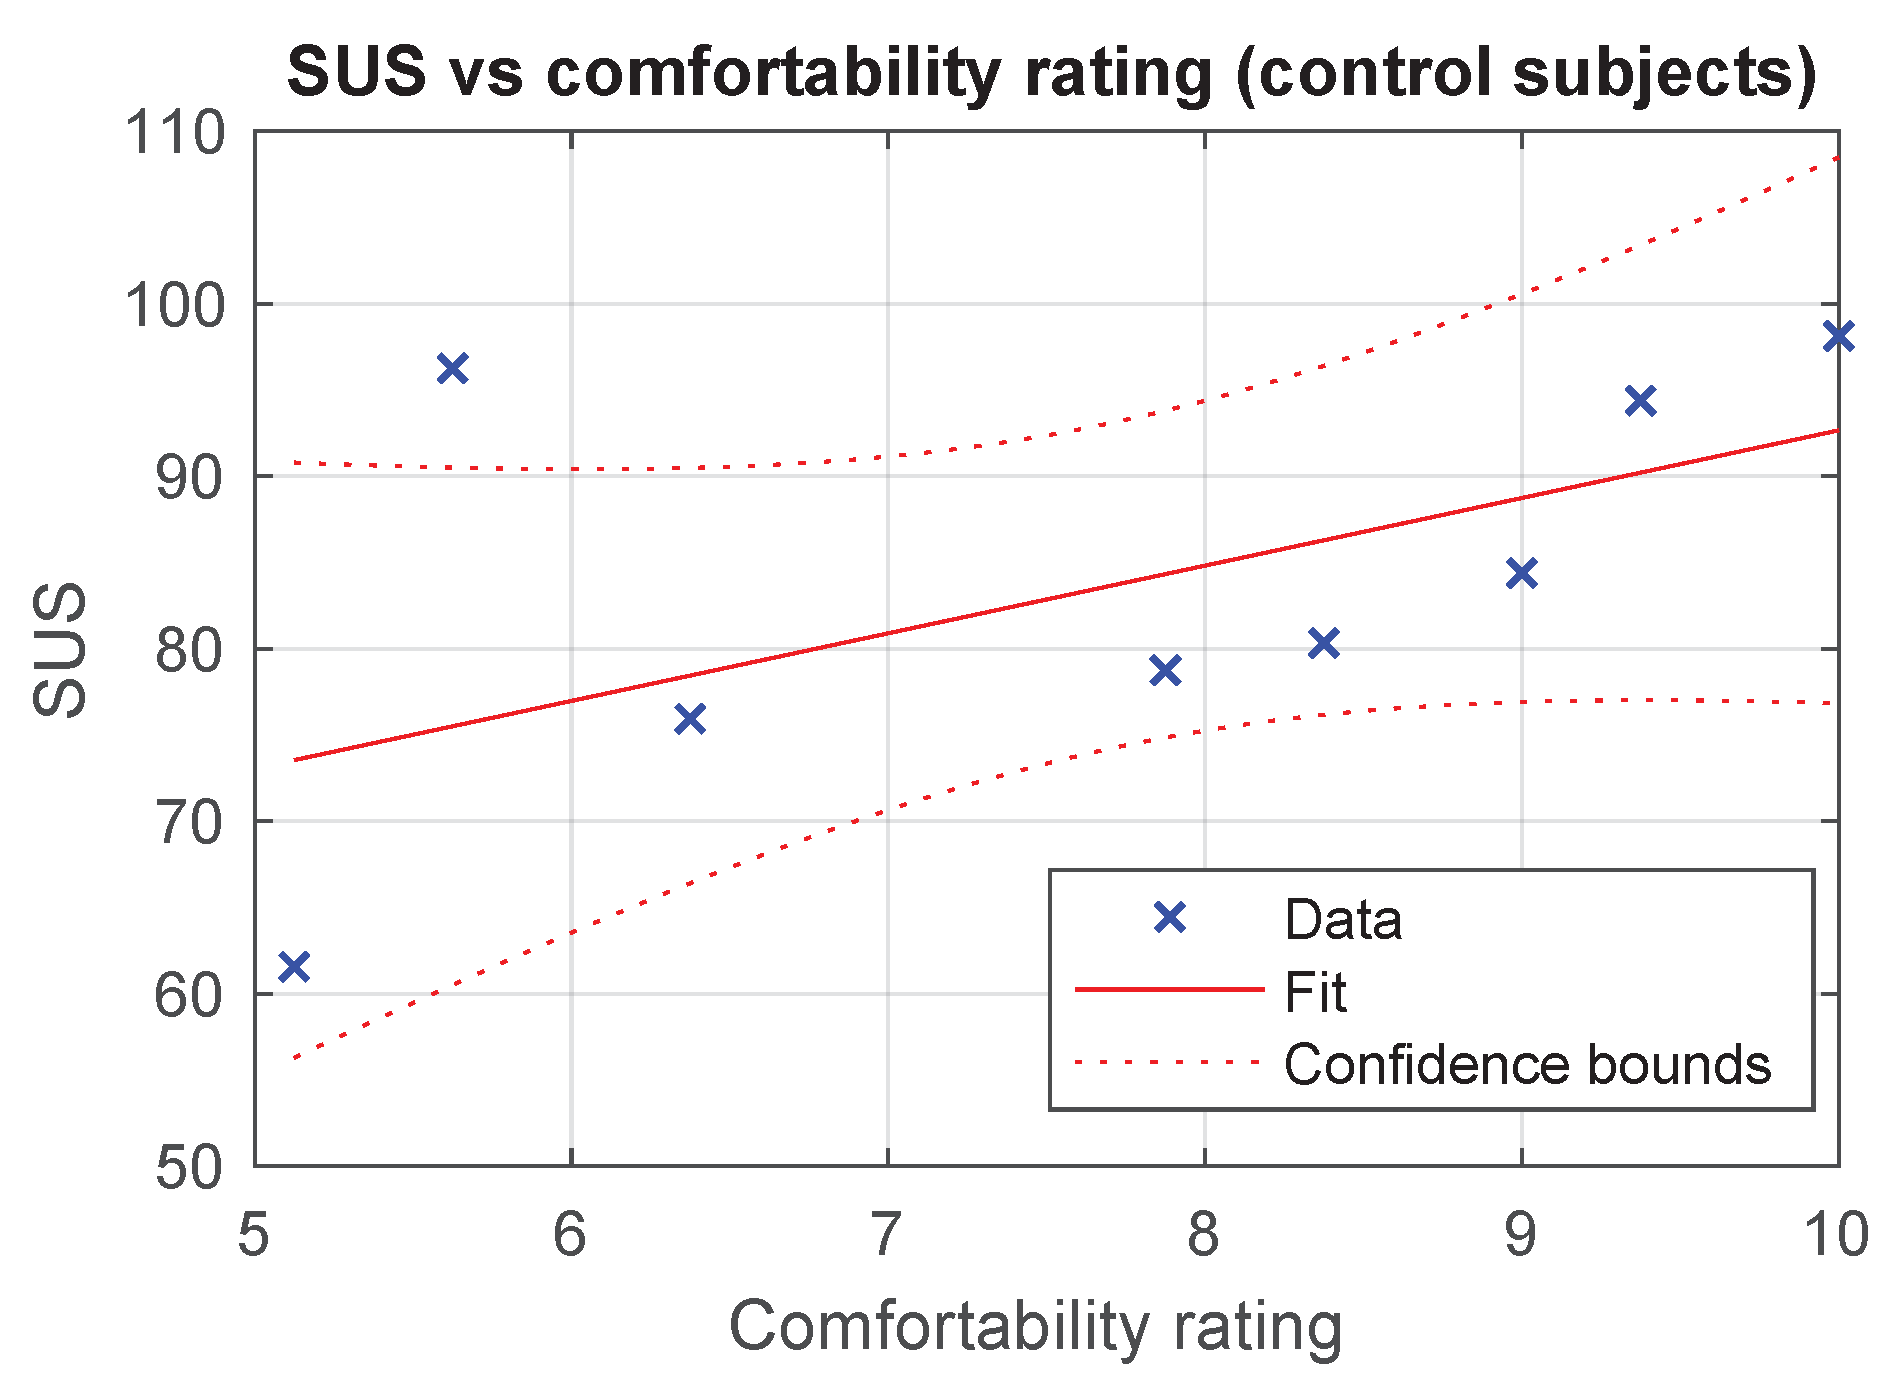
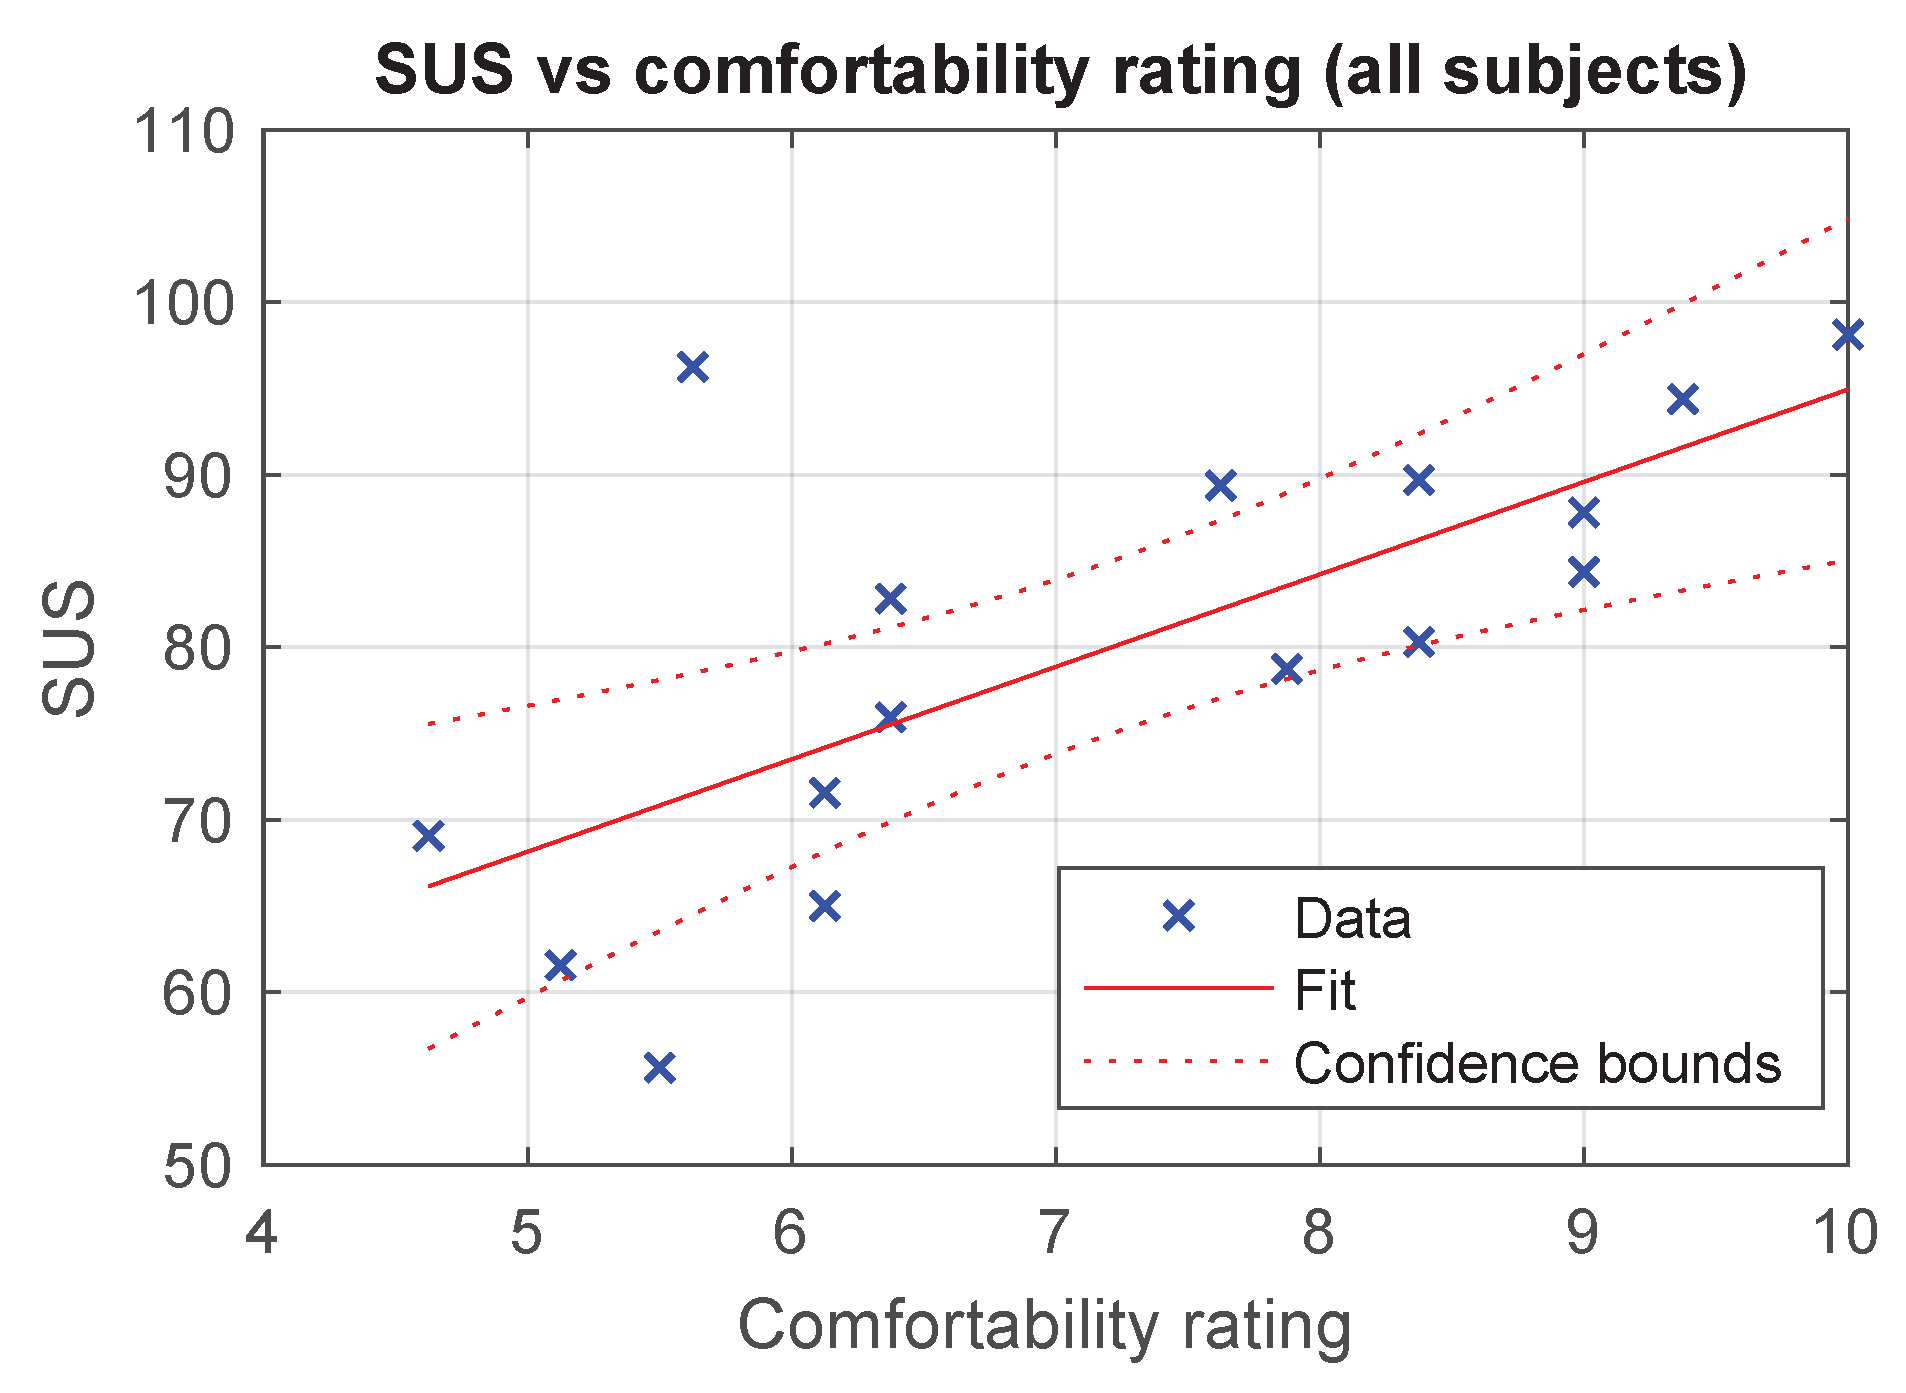
This paper introduced the comfortability score (`CMF’) and presented usability and comfortability as measures of change impact. Using the dataset prepared for statistical analysis, by transforming the dataset to average-response-per-participant pairs, we can perform non-parametric correlation checking through calculating the Spearman rank correlation coefficient () and the corresponding p-value to perform hypothesis testing.
The Spearman rho (
) indicates the directional ‘
correlation’ – the extent to which CMF can represent SUS scores. A value of 1 indicates a perfect positive linear correlation, 0 indicates no correlation and
indicates a perfect negative linear correlation. [
25] The value
p represents the probability that the null hypothesis
holds (that
, indicating no correlation). The
p significance used is
as before.
To be regarded as significantly positively correlated, in this study we have used:
indicating a positive correlation, and
indicating that can be rejected with certainty.
Based on the results in
Table 3, it has been statistically proven that there is a correlation between SUS and CMF scores within the autistic group and when the groups are combined. As
in both cases, the correlation is positive.
Figure 3,
Figure 4 and
Figure 5 show the obtained data with linear fitting and confidence bounds.
5.4. Effectiveness of the Software Usability Scale
The usability of each introduced change was measured successfully through the Software Usability Scale [
13]. The SUS was chosen for its conciseness, and this was the correct choice to make. Due to the iterative nature of the questionnaire, any more questions per-interface may have risked a higher abandonment rate. It is advisable to future design change impact researchers that concise usability measures such as the SUS are used for this reason.
However, the nature of the SUS questions saw a tendency for some uses to comment more on the functionality of the design rather than the introduced change, despite the prompt given. A slight re-wording of the SUS question points to clearly refer the change introduced is recommended to future researchers, especially where autistic subjects are used, as this problem was revealed through comments left by some autistic participants.
5.5. Effectiveness Of Qualitative Measures
The collection of qualitative data allowed for further insight into the impact of change on the participants and provided feedback as to the methods used, and it is recommendable that further change impact studies include at least one comment field to obtain this depth that is otherwise unobtainable through quantitative measures. However, due to the volume of qualitative data provided, its analysis proved challenging. In total, 103 COM comments were provided, alongside 22 SUS point comments.
In future usability-based studies, it is advisable not to provide a comment field for each measurement scale point, instead providing only one comment opportunity per-interface, to allow for ease-of-analysis and to eliminate a source of data duplication. It is noted that the qualitative responses in this study were optional; their results are not representative of all participants in a group, but of individual cases. As such, no research hypotheses can be derived from them.
5.6. Discovering Positive Change
Through our search for changes that adversely impact autistic users, we have discovered a change that caused the test group’s scores to consistently increase in comparison to the prior interface, indicated by in the Wilcoxon signed rank test, asserting the inverse of the alternative hypothesis (as a right-tailed test was used) for change 5 (inconsistent sizing change).
We can derive a serendipitous hypothesis for further investigation from this: `introducing sizing inconsistency based on importance increases usability in autistic users’. This hypothesis is yet to be verified, as producing general usability heuristics for autism is not within the scope of this paper. Verifying this and deriving further positive design improvement heuristics for ASD provides opportunity for a future work.
5.7. Effectiveness of Testing Framework
While some participants complained that the initial interface was “simple”, “dated” and “basic”, it has served its purpose: providing a framework to deliver componentised design changes to users.
It is arguable that the initial design is indeed primitive in that only basic design element changes can be tested. While fit for purpose for this short-term introductory study, researchers embarking on a longer-term, deeper design change impact study may wish to develop a more complex and lifelike interface.
It is important to note that this study has looked only at minor to moderate isolated design element changes. The introduction of multiple changes in one iteration and assessing the impacts of this in terms of `change magnitude’ is an area for further work, however it is predicted here that ‘stacking’ multiple changes into one iteration will cause additional discomfort within autistic users, due to the greater magnitude of the change, and could introduce an increased element of ‘overwhelmingness’ not seen here.
5.8. Forming Heuristics from Hypotheses
From the previously established research hypotheses, we can now derive heuristics for reducing the impact of design change on autistic users (
Table 4). We can also form a heuristic based on a serendipitous research hypothesis from the control group, as guidance to ensure general usability when introducing design change (without the specialisation of autism) (
Table 5).
6. Conclusions
Through measuring reactions to design changes in autistic and neurotypical subjects, applying statistical methods and asserting hypotheses, we have successfully produced heuristics that HCI practitioners can use to reduce the impact of change in software interface design on autistic users, making software updates more accessible for this user group.
These heuristics, alongside the presented method for design change impact testing, including the introduction of the statistically-verified comfortability score, and suggested scopes for future works, are the contributions of this research to the HCI discipline.
Author Contributions
Conceptualization, L.S.; methodology, L.S.; software, L.S.; validation, L.S., R.P.; formal analysis, L.S., R.P.; investigation, L.S.; resources, L.S., R.P.; data curation, L.S., R.P.; writing—original draft preparation, L.S.; writing—review and editing, L.S., R.P.; visualization, L.S., R.P.; supervision, R.P.; project administration, L.S.; funding acquisition, R.P. All authors have read and agreed to the published version of the manuscript.
Funding
This research received no external funding.
Institutional Review Board Statement
The study was conducted in accordance with the Declaration of Helsinki, and was approved by the Central Research Ethics Advisory Group of the University of Kent (Ref: CREAG018-11-23).
Informed Consent Statement
Informed consent was obtained from all subjects involved in the study.
Data Availability Statement
The data presented in this study are available on request from the corresponding author due to both its medically sensitive nature and magnitude.
Acknowledgments
Authors are grateful to Dr. Kemi Ademoye for providing HCI-related support and advice in programming the test delivery framework. Support from the University of Kent’s Student Support and Wellbeing department is also acknowledged for distributing the research questionnaire to the targeted group.
Conflicts of Interest
The authors declare no conflicts of interest.
Abbreviations
The following abbreviations are used in this manuscript:
| ASD |
Autism Spectrum Disorder |
| CI |
Continuance Intentions |
| CMF |
`Comfortability’ score |
| COM |
Overall per-interface comment |
| CSS |
Cascading Style Sheet |
| DSM-5 |
Diagnostic and Statistical Manual of Mental Disorders, 5 ed. [1] |
| HCI |
Human-computer Interaction |
| HTML |
Hyper Text Markup Language |
| IS |
Information Systems |
| IT |
Information Technology |
| px |
pixels |
| SUMI |
Software Usability Measurement Inventory [16] |
| SUS |
Software Usability Scale [13] |
|
U-test |
Mann-Whitney U-test |
| WSR |
Wilcoxon signed-rank test |
Appendix A. Given task, initial interface and subsequent changes presented to participants
The participants completed the following task in each interface before answering the related questions:
Send an appointment to ‘ls752@kent.ac.uk’ with:
Subject: “Test Subject”
Location: “Library”
Start: 7th June 2024 at 15:00
End: 7th June 2024 at 16:00
Details can be left blank.
Set the meeting as high importance
Send the meeting request
The wording of this task remained consistent throughout each test.
Figure A1.
Initial interface
Figure A1.
Initial interface
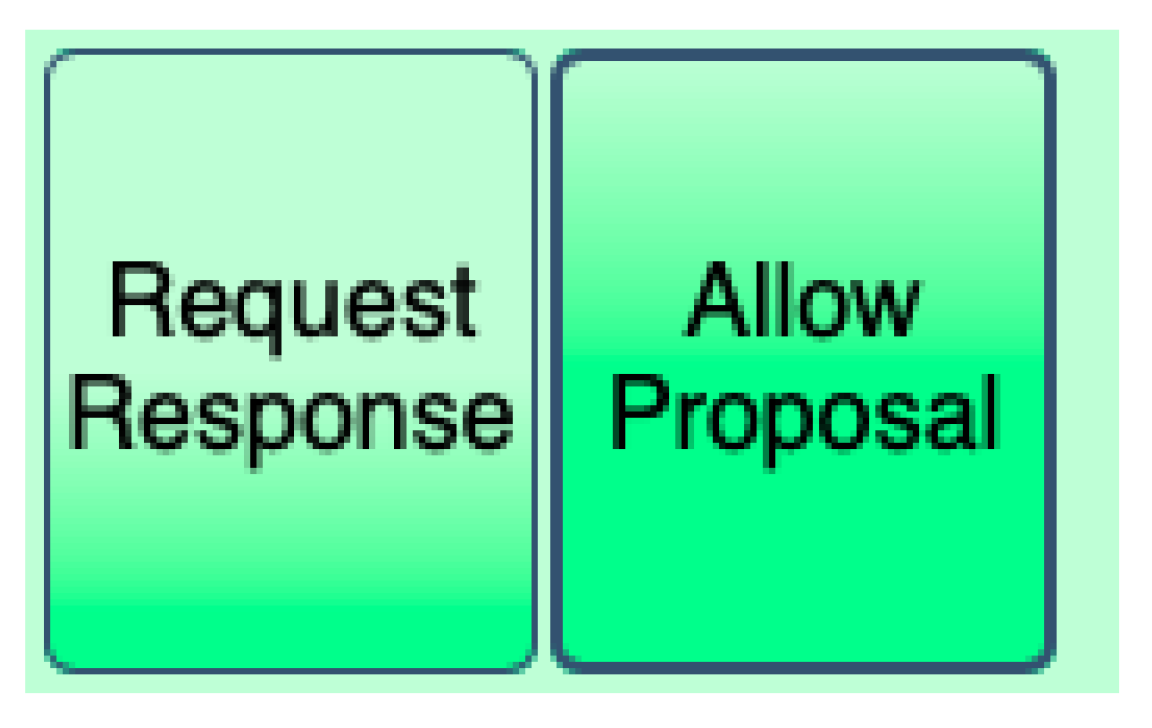
Figure A2.
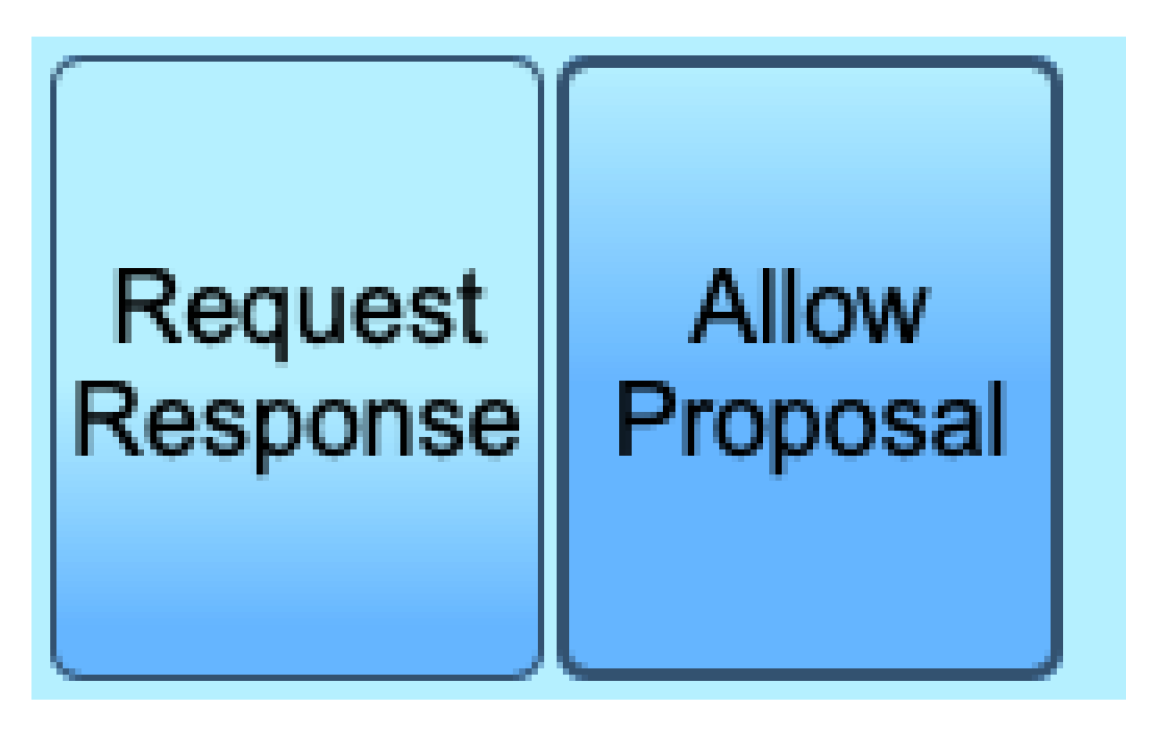
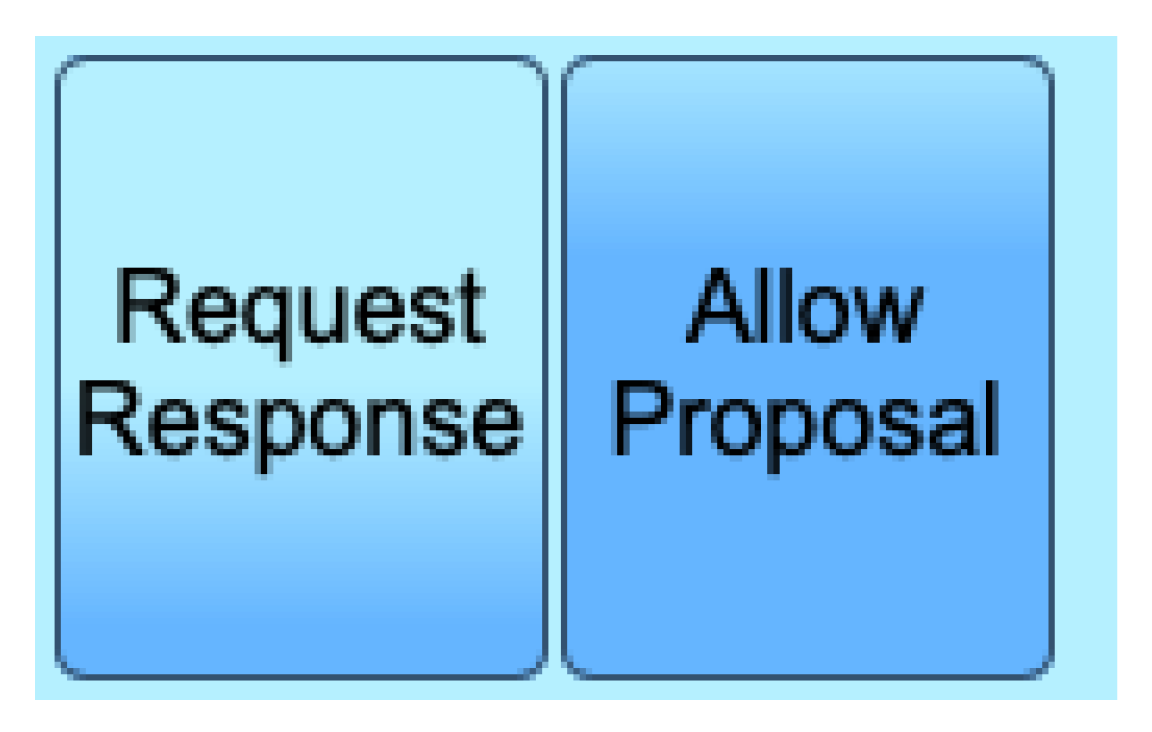
Initial interface: button colour on mouse over
Figure A2.
Initial interface: button colour on mouse over
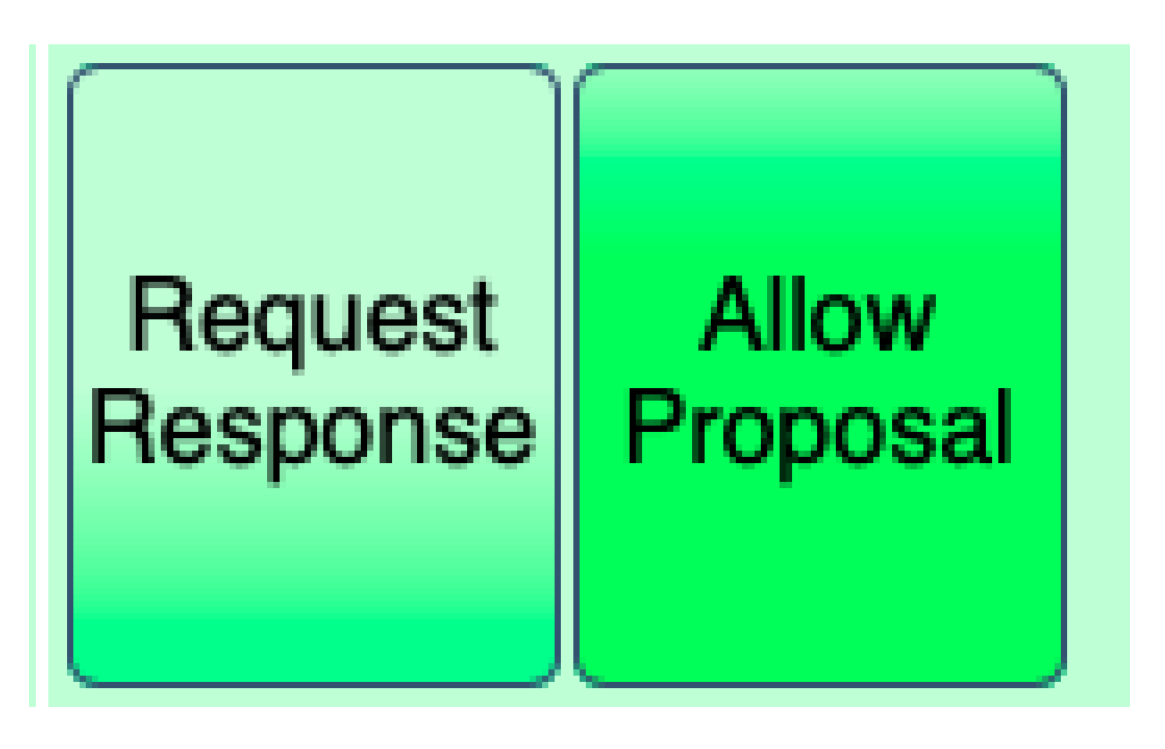
Figure A3.
Initial interface: button colour on click, selected toggle button colour
Figure A3.
Initial interface: button colour on click, selected toggle button colour
Figure A4.
Change 1: colour scheme
Figure A4.
Change 1: colour scheme
Figure A5.
Change 1: button colour on mouse over
Figure A5.
Change 1: button colour on mouse over
Figure A6.
Change 1: button colour on click, selected toggle button colour
Figure A6.
Change 1: button colour on click, selected toggle button colour
Figure A7.
Change 2: font face
Figure A7.
Change 2: font face
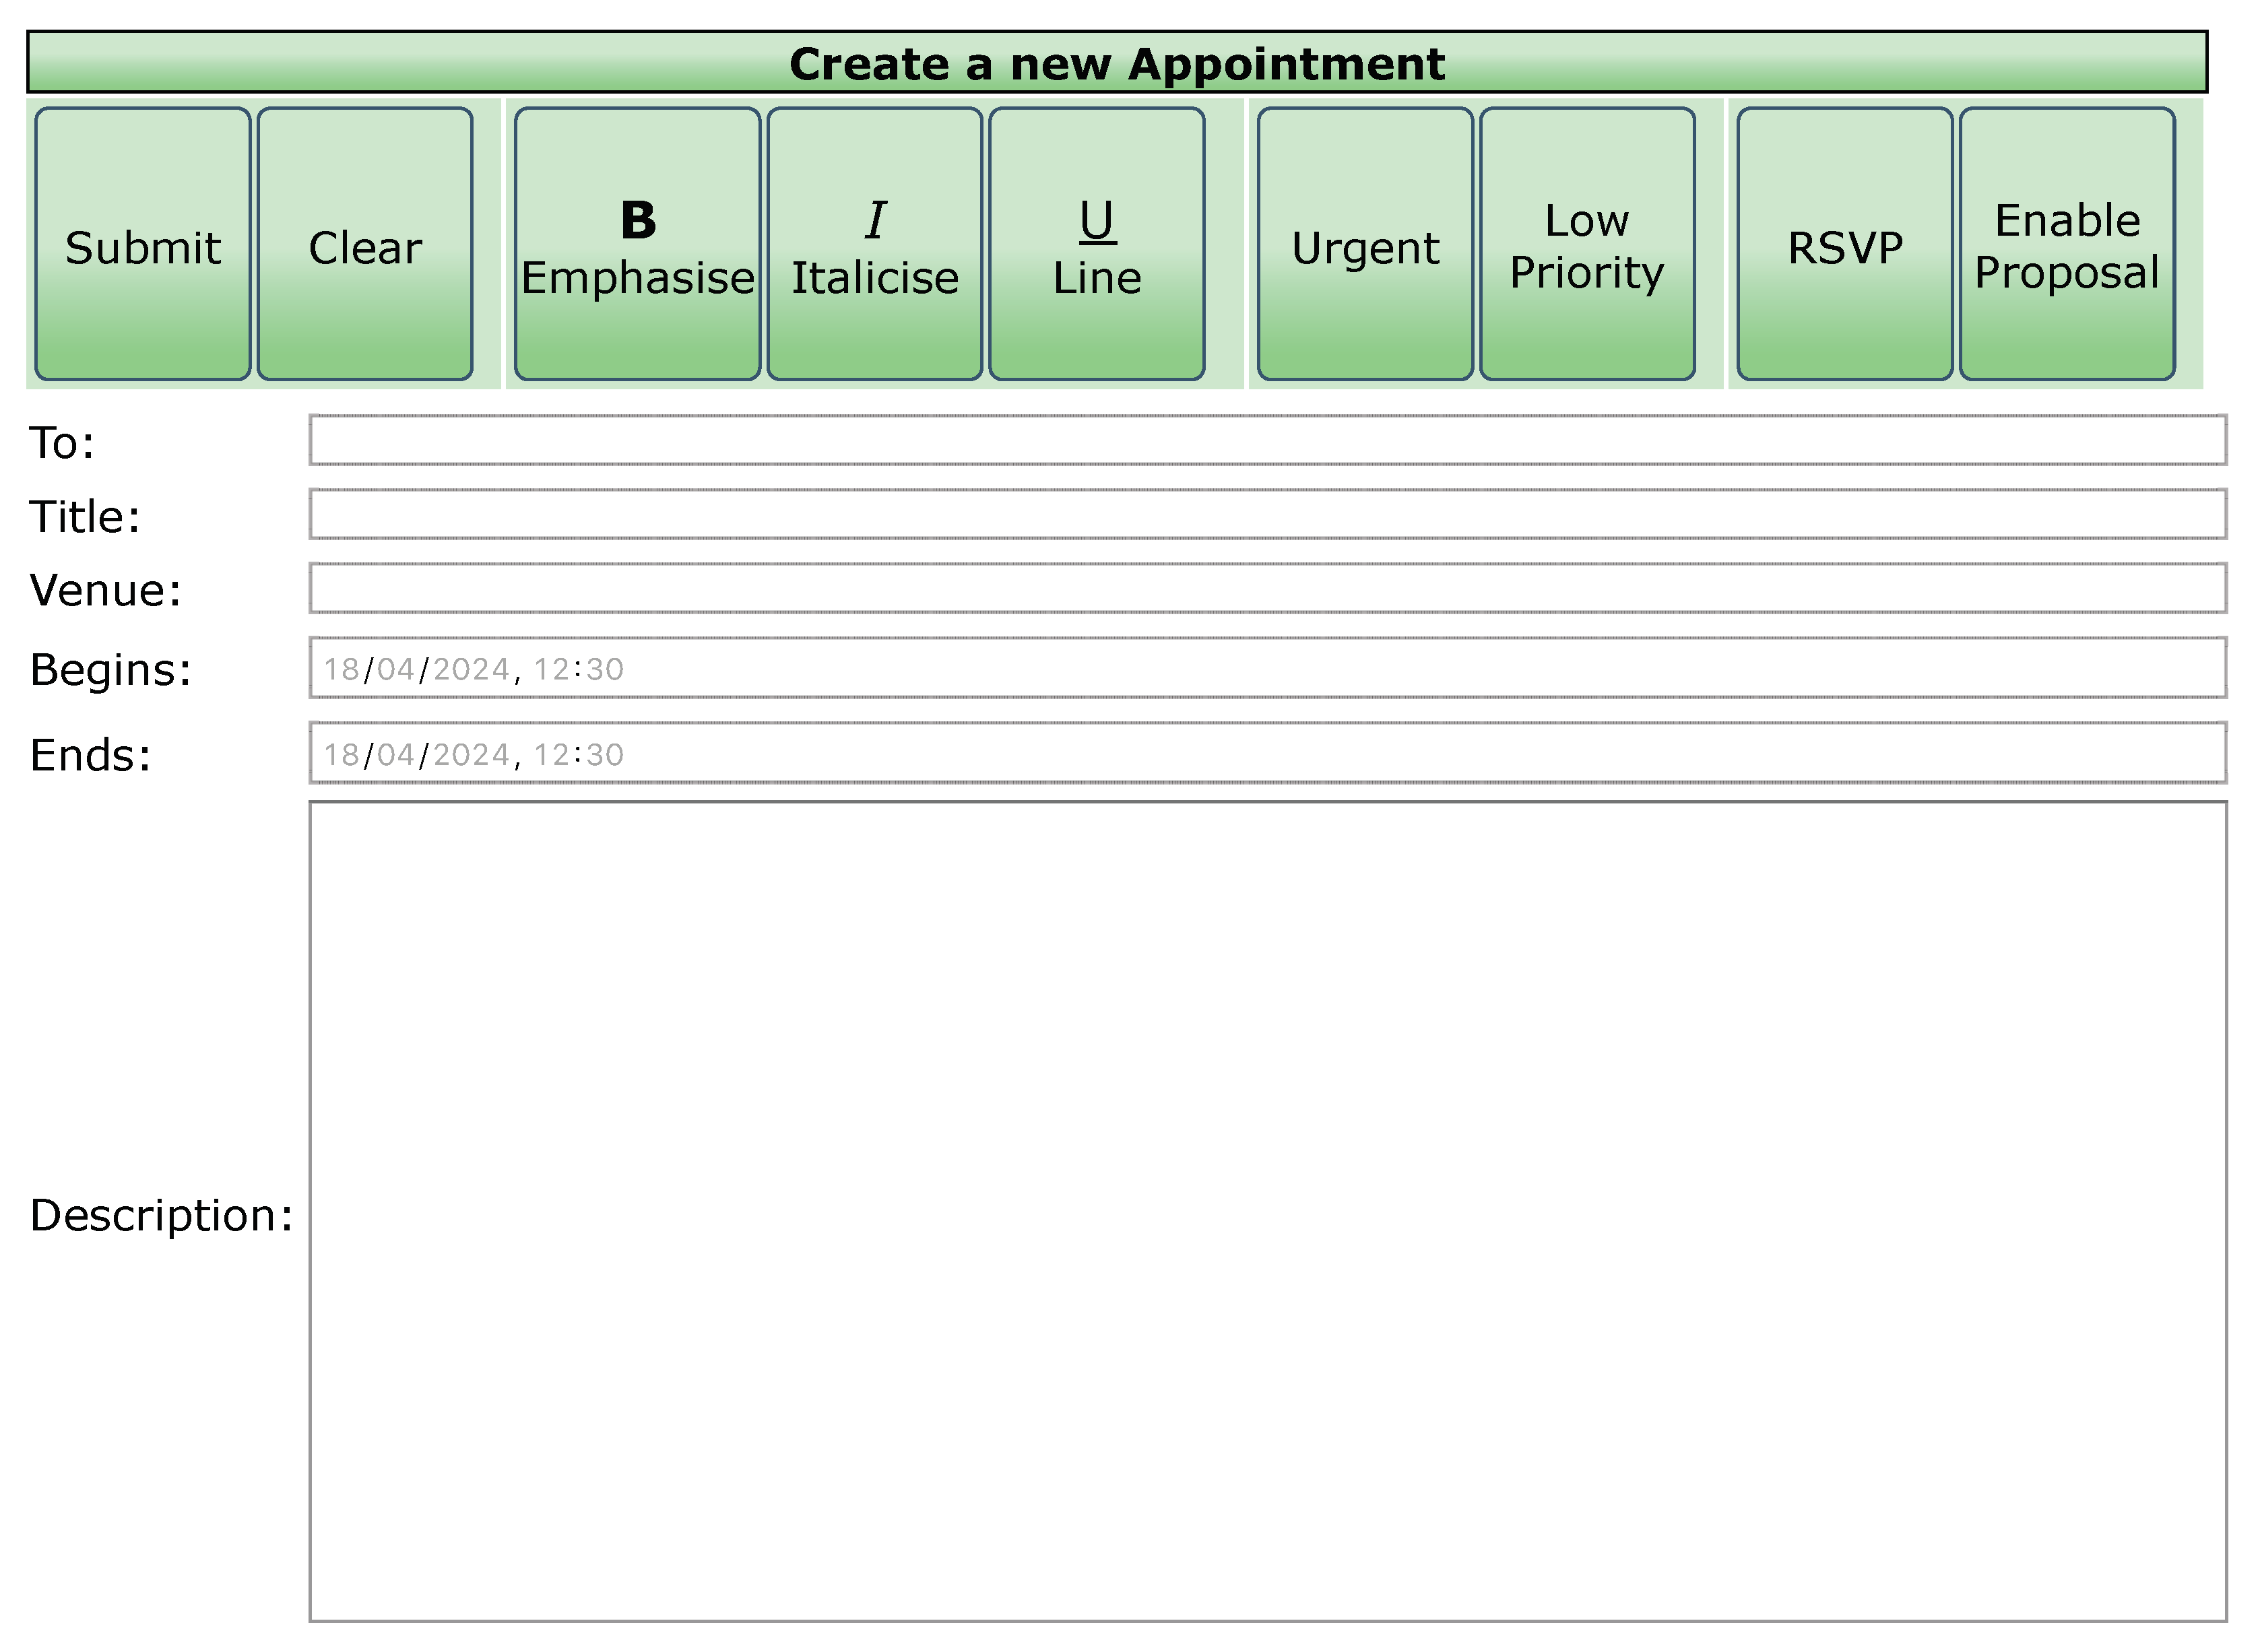
Figure A8.
Change 3: text wording
Figure A8.
Change 3: text wording
Figure A9.
Change 4: button ribbon height (consistent sizing change)
Figure A9.
Change 4: button ribbon height (consistent sizing change)
Figure A10.
Change 5: submit button width (inconsistent sizing change)
Figure A10.
Change 5: submit button width (inconsistent sizing change)
Figure A11.
Change 6: button order
Figure A11.
Change 6: button order
Figure A12.
Change 7: ribbon minor conceptual re-design
Figure A12.
Change 7: ribbon minor conceptual re-design
Appendix B. ‘COM’ comment sentiment scores per-interface, per-group
| Sentiment |
Points |
| Positive |
|
| Neutral |
0 |
| Negative |
|
| Questiona |
Test group |
Control group |
| COM0 |
Positive: 0 |
Positive: 3 |
| |
Neutral: 3 |
Neutral: 1 |
| |
Negative: 1 |
Negative: 1 |
| |
Resultant: |
Resultant: 2 |
| COM1 |
Positive: 3 |
Positive: 1 |
| |
Neutral: 0 |
Neutral: 3 |
| |
Negative: 3 |
Negative: 1 |
| |
Resultant: 0 |
Resultant: 0 |
| COM2 |
Positive: 2 |
Positive: 2 |
| |
Neutral: 2 |
Neutral: 2 |
| |
Negative: 1 |
Negative: 2 |
| |
Resultant: 1 |
Resultant: 0 |
| COM3 |
Positive: 0 |
Positive: 0 |
| |
Neutral: 1 |
Neutral: 1 |
| |
Negative: 6 |
Negative: 7 |
| |
Resultant: |
Resultant: |
| COM4 |
Positive: 4 |
Positive: 3 |
| |
Neutral: 0 |
Neutral: 2 |
| |
Negative: 0 |
Negative: 0 |
| |
Resultant: 4 |
Resultant: 3 |
| COM5 |
Positive: 4 |
Positive: 2 |
| |
Neutral: 1 |
Neutral: 4 |
| |
Negative: 0 |
Negative: 0 |
| |
Resultant: 4 |
Resultant: 2 |
| COM6 |
Positive: 1 |
Positive: 1 |
| |
Neutral: 0 |
Neutral: 2 |
| |
Negative: 3 |
Negative: 2 |
| |
Resultant: |
Resultant: |
| COM7 |
Positive: 0 |
Positive: 3 |
| |
Neutral: 3 |
Neutral: 0 |
| |
Negative: 1 |
Negative: 2 |
| |
Resultant: |
Resultant: 1 |
|
a‘COMx’ refers to the overall comment given for the interface tested, starting at $0$ (initial interface). |
Appendix C. Case study: ‘COM’ and ‘SUS’ comments for a specific participant for change test 6 (button order)
| Questiona |
Comment |
| SUS6.6 - “I think there is too much inconsistency in this system” [13] |
“The order changing from last time made me feel quite uncomfortable” |
| SUS6.7 - “I would imagine that most people would learn to use this system very quickly” [13] |
“It took me a while to look and find the old button as I had gotten used to its old position” |
| SUS6.10 - “I would need to learn a lot of things before I could get going with this system” [13] |
“I need to re-learn where the buttons are” |
| COM6 - “Are there any other comments you would like to share about this change, or how it made you feel?” |
“I did not notice the change until focusing on finding the Urgent button, which made me feel quite confused until I had found it. It also seems like a pointless change which makes it slightly annoying” |
|
a‘SUS6.x’ refers to the SUS point for change test 6 (button order). |
References
- American Psychiatric Association. Diagnostic and Statistical Manual of Mental Disorders, 5th ed.; American Psychiatric Association: Arlington, VA, USA, 2013. [Google Scholar]
- Riba, M.; Sharfstein, S.; Tasman, A. The American Psychiatric Association. International Psychiatry 2005, 2, 18–20. [Google Scholar] [CrossRef] [PubMed]
- Zeidan, J.; Fombonne, E.; Scorah, J.; Ibrahim, A.; Durkin, M.S.; Saxena, S.; Yusuf, A.; Shih, A.; Elsabbagh, M. Global prevalence of autism: A systematic review update. Autism Res 2022, 15, 778–790. [Google Scholar] [CrossRef] [PubMed]
- Franzmann, D. User Expectations of Hedonic Software Updates. In Proceedings of the Pacific Asia Conference on Information Systems; 2017. [Google Scholar]
- Fleischmann, M.; Amirpur, M.; Grupp, T.; Benlian, A.; Hess, T. The role of software updates in information systems continuance — An experimental study from a user perspective. Decision Support Systems 2016, 83, 83–96. [Google Scholar] [CrossRef]
- Alzahrani, M.; Uitdenbogerd, A.L.; Spichkova, M. Human-Computer Interaction: Influences on Autistic Users. Procedia Computer Science 2021, 192, 4691–4700. [Google Scholar] [CrossRef]
- World Wide Web Consortium. Web Content Accessibility Guidelines 2.1. https://www.w3.org/TR/2018/REC-WCAG21-20180605/, 2018. Accessed: 2024-04-16.
- World Wide Web Consortium. Cognitive Accessibility at W3C. https://www.w3.org/WAI/cognitive/, 2022. Accessed: 2024-04-16.
- Deering, H. Opportunity for success: Website evaluation and scanning by students with Autism Spectrum Disorders. Master’s thesis, Iowa State University, 2013.
- Sukru Eraslan, Victoria Yaneva, Y.Y.; Harper, S. Web users with autism: eye tracking evidence for differences. Behaviour & Information Technology 2019, 38, 678–700. [CrossRef]
- Çorlu, D.; Taşel, c.; Turan, S.G.; Gatos, A.; Yantaç, A.E. Involving Autistics in User Experience Studies: A Critical Review. In Proceedings of the 2017 Conference on Designing Interactive Systems; DIS ’17; Association for Computing Machinery: New York, NY, USA, 2017; pp. 43–55. [Google Scholar] [CrossRef]
- Pavlov, N. User Interface for People with Autism Spectrum Disorders. Journal of Software Engineering and Applications 2014, 07, 128–134. [Google Scholar] [CrossRef]
- Brooke, J. SUS: A quick and dirty usability scale. Usability Eval. Ind. 1995, 189. [Google Scholar]
- Holyer, A. Methods for evaluating user interfaces. WorkingPaper 301, University of Sussex, 1993.
- Sauro, J.; Lewis, J.R. Chapter 8 - Standardized usability questionnaires. In Quantifying the User Experience, 2 ed.; Sauro, J., Lewis, J.R., Eds.; Morgan Kaufmann: Boston, 2016; pp. 185–248. [Google Scholar] [CrossRef]
- Kirakowski, J.; Corbett, M. SUMI: the Software Usability Measurement Inventory. British Journal of Educational Technology 2006, 24, 210–212. [Google Scholar] [CrossRef]
- Brooke, J. SUS: a retrospective. Journal of Usability Studies 2013, 8, 29–40. [Google Scholar]
- Reichheld, F. The One Number you Need to Grow. Harvard business review 2004, 81, 46–54. [Google Scholar]
- Poquérusse, J.; Pastore, L.; Dellantonio, S.; Esposito, G. Alexithymia and Autism Spectrum Disorder: A Complex Relationship. Front Psychol 2018, 9, 1196. [Google Scholar] [CrossRef]
- Nielsen, J. Enhancing the explanatory power of usability heuristics. In Proceedings of the SIGCHI Conference on Human Factors in Computing Systems; CHI ’94; Association for Computing Machinery: New York, NY, USA, 1994; pp. 152–158. [Google Scholar] [CrossRef]
- Young, T.; Helmholtz, H. Trichromatic theory of color vision; 19th century.
- Wright, W.D. The Characteristics of Tritanopia. J. Opt. Soc. Am. 1952, 42, 509–521. [Google Scholar] [CrossRef] [PubMed]
- M Castillejo Becerra, C.; Ding, Y.; Kenol, B.; Hendershot, A.; Meara, A.S. Ocular side effects of antirheumatic medications: a qualitative review. BMJ Open Ophthalmol 2020, 5, e000331. [Google Scholar] [CrossRef] [PubMed]
- Yu, B.E.; Murrietta, M.; Horacek, A.; Drew, J. A Survey of Autism Spectrum Disorder Friendly Websites. In Proceedings of the SMU Data Science Review, Vol. 1. 2018. [Google Scholar]
- Banks, D.L.; Johnson, N.L.; Kotz, S.; Read, C.B. Encyclopedia of statistical sciences; Vol. 8, Wiley, 1982.
Short Biography of Authors
 |
Lewis D. Sawyer At the time of writing, Lewis was an undergraduate student at the University of Kent, reading `Computer Science (Networks) with a Year in Industry’. His research interests span multiple disciplines, including human-computer interface for neurodivergence, datacentre and network infrastructure and management, and environmentally-sustainable computing solutions. Since writing, he is a PhD candidate for Computer Science at the University of Kent, continuing his research in the field of autism and HCI, and has received a full scholarship to support his studies. |
 |
Ramaswamy Palaniappan Ramaswamy Palaniappan is currently a Reader in the School of Computing, University of Kent and Heads the Artificial Intelligence and Data Analytics (AIDA) Research Group. His current research interests include signal processing and machine learning for electrophysiological applications. To date, he has written two text books in engineering and published over 200 papers (with over 5000 citations) in peer-reviewed journals, book chapters, and conference proceedings. He has been consistently ranked in the top 2% of AI researchers in the world. |
|
Disclaimer/Publisher’s Note: The statements, opinions and data contained in all publications are solely those of the individual author(s) and contributor(s) and not of MDPI and/or the editor(s). MDPI and/or the editor(s) disclaim responsibility for any injury to people or property resulting from any ideas, methods, instructions or products referred to in the content. |
© 2024 by the authors. Licensee MDPI, Basel, Switzerland. This article is an open access article distributed under the terms and conditions of the Creative Commons Attribution (CC BY) license (http://creativecommons.org/licenses/by/4.0/).
