Submitted:
17 June 2024
Posted:
17 June 2024
You are already at the latest version
Abstract

Keywords:
1. Introduction
2. Materials and Methods
2.1. Site Description
2.2. Experimental Design
2.3. Measurement and Methods
2.3.1. Soil Moisture Content
2.3.2. Soil Nitrogen Content
2.3.3. Photosynthetic Index
2.3.4. Dry Matter Accumulation
2.3.5. Yied (Y)
2.3.6. Crop Water Consumption (ETa)
2.3.7. Water Use Efficiency (WUE)
2.4. TOPSIS Entropy Weight Model
2.5. Data Analysis
3. Results
3.1. Soil Nitrogen Content
3.2. Dry Matter Accumulation
3.3. Photosynthetic Characteristics
3.4. Yield and WUE
3.5. Interaction Relationship between Different Indicators
3.6. Multi-Objective Decision and Evaluation Based on the TOPSIS Method
4. Discussion
4.1. Effect of Water and Nitrogen Coupling on Dry Matter Quality and Photosynthetic Index of Spring Maize
4.2. Effect of Water and Nitrogen Coupling on Y and WUE of Spring Maize
4.3. Effect of Water Nitrogen Coupling on Soil Nitrogen Content
4.4. Water Fertilizer Coupling Effect of Drip Irrigation on Y Increase
5. Conclusions
Author Contributions
Funding
Data Availability Statement
Conflicts of Interest
References
- Wang, Y.; Lv, J.; Wang, Y.; Sun, H.; Hannaford, J.; Su, Z.; Barker, L.; Qu, Y. Drought risk assessment of spring maize based on APSIM crop model in Liaoning province, China. Int. J. Disaster Risk Reduct. 2020, 45, 101483. [Google Scholar] [CrossRef]
- Dong, Q.; Dang, T.; Guo, S.; Hao, M. Effect of different mulching measures on nitrate nitrogen leaching in spring maize planting system in south of Loess Plateau. Agric. Water Manage. 2019, 213, 654–658. [Google Scholar] [CrossRef]
- Wu, D.; Xu, X.; Chen, Y.; Shao, H.; Sokolowski, E.; Mi, G. Effect of different drip fertigation methods on maize yield, nutrient and water productivity in two-soils in Northeast China. Agric. Water Manage. 2019, 213, 200–211. [Google Scholar] [CrossRef]
- Payero, J.; Tarkalson, D.; Irmak, S.; Davison, D.; Petersen, J. Effect of timing of a deficit-irrigation allocation on corn evapotranspiration, yield, water use efficiency and dry mass. Agric. Water Manage. 2009, 96, 1387–1397. [Google Scholar] [CrossRef]
- Aydinsakir, K.; Erdal, S.; Buyuktas, D.; Bastug, R.; Toker, R. The influence of regular deficit irrigation applications on water use, yield, and quality components of two corn (Zea mays L.) genotypes. Agric. Water Manage. 2013, 128, 65–71. [Google Scholar] [CrossRef]
- Yan, F.; Zhang, F.; Fan, X.; Fan, J.; Wang, Y.; Zou, H.; Wang, H.; Li, G. Determining irrigation amount and fertilization rate to simultaneously optimize grain yield, grain nitrogen accumulation and economic benefit of drip-fertigated spring maize in northwest China. Agric. Water Manage. 2021, 243, 106440. [Google Scholar] [CrossRef]
- Sampathkumar, T.; Pandian, B.; Rangaswamy, M.; Manickasundaram, P.; Jeyakumar, P. Influence of deficit irrigation on growth, yield and yield parameters of cotton–maize cropping sequence. Agric. Water Manage. 2013, 130, 90–102. [Google Scholar] [CrossRef]
- Pablo, R.; O’Neill, M.; Mccaslin, B.; Remmenga, M.; Keenan, J.; Onken, B. Evaluation of corn grain yield and water use efficiency using subsurface drip irrigation. J. Sustain. Agric. 2007, 30, 153–172. [Google Scholar] [CrossRef]
- Li, M.; Du, Y.; Zhang, F.; Bai, Y.; Fan, J.; Zhang, J.; Chen, S. Simulation of cotton growth and soil water content under film-mulched drip irrigation using modified CSM-CROPGRO-cotton model. Agric. Water Manage. 2019, 218, 124–138. [Google Scholar] [CrossRef]
- Guo, J.; Fan, J.; Zhang, F.; Yan, S.; Zheng, J.; Wu, Y.; Li, J.; Wang, Y.; Sun, X.; Liu, X.; Xiang, Y.; Li, Z. Blending urea and slow-release nitrogen fertilizer increases dryland maize yield and nitrogen use efficiency while mitigating ammonia volatilization. Sci. Total Environ. 2021, 790, 148058. [Google Scholar] [CrossRef]
- Sinclair, T.; Rufty, T.; Lewis, R. Increasing Photosynthesis: Unlikely Solution For World Food Problem. Trends Plant Sci. 2019, 24, 1019–1053. [Google Scholar] [CrossRef]
- Sadras, V.O.; Hayman, P.T.; Rodriguez, D.; Monjardino, M.; Bielich, M.; Unkovich, M.; Mudge, B.; Wang, E. Interactions between water and nitrogen in Australian cropping systems: Physiological, agronomic, economic, breeding and modelling perspectives. Crop Pasture Sci. 2016, 67, 1019–1053. [Google Scholar] [CrossRef]
- Ciampitti, I.A.; Vyn, T.J. Physiological perspectives of changes over time in maize yield dependency on nitrogen uptake and associated nitrogen efficiencies: A review. Field Crops Res. 2012, 133, 48–67. [Google Scholar] [CrossRef]
- Lemaire, G.; Tang, L.; B’elanger, G.; Zhu, Y.; Jeuffroy, M.-H. . Forward new paradigms for crop mineral nutrition and fertilization towards sustainable agriculture. Eur. J. Agron. 2021, 125, 126248. [Google Scholar] [CrossRef]
- Zheng, W.; Wang, Y.; Li, Y.; Liu, Z.; Chen, J.; Zhou, H.; Gao, Y.; Chen, B.; Zhang, M. Developing water and nitrogen budgets of a wheat-maize rotation system using auto-weighing lysimeters: Effects of blended application of controlled- release and un-coated urea. Environ. Pollut. 2020, 263, 114383. [Google Scholar] [CrossRef]
- Feng, W.; He, L.; Zhang, H.Y.; Guo, B.; Zhu, Y.; Wang, C.; Guo, T. Assessment of plant nitrogen status using chlorophyll fluorescence parameters of the upper leaves in winter wheat. Eur. J. Agron. 2015, 64, 78–87. [Google Scholar] [CrossRef]
- Yang, S.; Peng, S.; Xu, J.; He, Y.; Wang, Y. Effects of water saving irrigation and controlled release nitrogen fertilizer managements on nitrogen losses from paddy fields. Paddy Water Environ. 2015, 13, 71–80. [Google Scholar] [CrossRef]
- Liu, W.; Zhang, X. Optimizing water and fertilizer input using an elasticity index: A case study with maize in the loess plateau of china. Field Crops Res. 2007, 100, 302–310. [Google Scholar] [CrossRef]
- Wang, X.; Dai, K.; Zhang, D.; Zhang, X.; Wang, Y.; Zhao, Q.; Cai, D.; Hoogmoed, W.B.; Oenema, O. Dryland maize yields and water use efficiency in response to tillage/crop stubble and nutrient management practices in China. Field Crops Res. 2011, 120, 47–57. [Google Scholar] [CrossRef]
- Yin, G.; Gu, J.; Zhang, F.; Hao, L.; Cong, P.; Liu, Z. Maize Yield Response to Water Supply and Fertilizer Input in a Semi-Arid Environment of Northeast China. PLoS ONE 2014, 9, e86099. [Google Scholar] [CrossRef]
- Reyes-Cabrera, J.; Zotarelli, L, Dukes, M. D.; Rowland, D.L.; Sargent, S.A. soil moisture distribution under drip irrigation and seepage for potato production. Agric. Water Manage. 2016, 169, 183–192. [Google Scholar] [CrossRef]
- Bozkurt, S.; Mansuroglu, G.S. Responses of unheated greenhouse grown green bean to buried drip tape placement depth and watering levels. Agric. Water Manage.
- Tawfik, A.M.; Bazaraa, A.S.; El-Ayoty, S.A. Performance of subsurface drip irrigation under different conditions. J. Eng. Appl. Sci. 2012, 59, 23–37. [Google Scholar]
- Fernandez, J.; DeBruin, J.; Messina, C.D.; Ciampitti, I.A. Late-season nitrogen fertilization on maize yield: A meta-analysis. Field Crops Res. 2020, 247, 107586. [Google Scholar] [CrossRef]
- Xu, Q.; Ma, X.; Lv, T.; Bai, M.; Wang, Z.; & Niu, J.; & Niu, J. Effects of water stress on fluorescence parameters and photosynthetic characteristics of drip irrigation in rice. Water 2020, 12, 289. [Google Scholar] [CrossRef]
- Wang, Z.; Yin, G.; Gu, J.; Wang, S.; Ma, N.; Zhou, X.; Liu, Y.; Zhao, W. Effect of water, nitrogen and potassium interaction on water use effciency of spring maize under shallow-buried drip irrigation. J. Soil Water Conserv. 2022, 36, 316–324. [Google Scholar]
- Yang, H.; Zhang, Y.; Ge, X.; Li, W.; Guo, Z.; Guo, N. Effect of different amount of drip irrigation on carbon metabolism and photosynthetic nitrogen utilization efficiency of maize after anthesis under shallow burried drip irrigation. Acta Agron. Sinica 2022, 48, 2614–2624. [Google Scholar]
- Guo, Z.; Yang, H.; Zhao, P.; Liu, J.; Bao, E.; Zhang, R.; Li, Y.; Li, D.; Qin, J. Effects of irrigation quota on morphological characteristics of maize root under shallow-buried drip irrigation. Chin. Agric. Sci. Bull. 2022, 38, 12–19. [Google Scholar]
- Desclaux, D.; Huynh, T.T.; Roumet, P. Identification of soybean plant characteristics that indicate the timing of drought stress. Crop sci. 2000, 40, 716–722. [Google Scholar] [CrossRef]
- Sharma, L.K.; Bali, S.K. A review of methods to improve nitrogen use efficiency in agriculture. Sustainability 2017, 10, 51. [Google Scholar] [CrossRef]
- Jing, L.; Zhao, F.; Liu, P.; Yuan, J.; Lu, D.; Lu, W. Effects of nitrogen treatments on dry matter production and photosynthetic characteristics of summer maize (Zea mays L.) under super-high yield conditions. Acta Agric. Nucleatae Sin. 2014, 28, 317–326. [Google Scholar]
- Tai, J.; Han, M.; Yang, H.; Zhang, Y.; Ma, J.; Guo, X. Effects of urea reduction with UAN on dry matter accumulation and nitrogen efficiency of spring maize under shallow buried drip irrigation. Acta Agric. Boreali Sin. 2022, 37, 136–144. [Google Scholar]
- Wang, Y.; Liu, T.; Tan, J.; Zhang, X.; Li, C. Effect of N fertilization on yield, N absorption and utilization of two species of super high-yielding summer maize. Hunan Agric. Sci. Technol. 2012, 13, 339–374. [Google Scholar]
- Abd El-Wahed, M.H.; Ali, E.A. Effect of irrigation systems, amounts of irrigation water and mulching on corn yield, water use efficiency and net profit. Agric. Water Manage. 2013, 120, 64–71. [Google Scholar] [CrossRef]
- Barton, L.; Colmer, T.D. Irrigation and fertiliser strategies for minimising nitrogen leaching from turfgrass. Agric. Water Manage. 2006, 80, 160–175. [Google Scholar] [CrossRef]
- Fu, Q.; Wang, Q.; Shen, X.; Fan, J. Optimizing water and nitrogen inputs for winter wheat cropping system on the Loess Plateau, China. J. Arid Land 2014, 6, 230–242. [Google Scholar] [CrossRef]
- Howarth, R.W. Coastal nitrogen pollution: A review of sources and trends globally and regionally. Harmful Algae 2008, 8, 14–20. [Google Scholar] [CrossRef]
- Kirnak, H.; Higgs, D.; Kaya, C.; Tas, I. Effects of irrigation and nitrogen rates on growth, yield, and quality of muskmelon in semiarid regions. J. Plant Nutr. 2005, 28, 621–638. [Google Scholar] [CrossRef]
- Fan, X.; Zhang, J.; Ren, B.; Li, X.; Zhao, B.; Liu, P.; Dong, S. Nitrogen uptake and utilization of summer maize hybrids with different plant heights. Acta Agron. Sin. 2014, 40, 1830–1838. [Google Scholar] [CrossRef]
- Nyiraneza, J.; N’Dayegamiye, A.; Chantigny, M. H.; Laverdière, M. R. Variations in corn yield and nitrogen uptake in relation to soil attributes and nitrogen availability indices. Soil Sci. Soc. Am. J.; 2009, 73, 317–327. [Google Scholar] [CrossRef]
- Abedi, T.; Alemzadeh, A.; Kazemeini, S.A. Wheat yield and grain protein response to nitrogen amount and timing. Aust. J. Crop Sci. 2011, 5, 330–336. [Google Scholar]
- Fang, Q.; Qiang, Y.; Wang, E.; Chen, Y.; Zhang, G.; Wang, J.; Li, L. Soil nitrate accumulation,leaching and crop nitrogen use as influenced by fertilization and irrigation in an intensive wheat-maize double cropping system in the North China Plain. Plant Soil 2006, 70, 461–472. [Google Scholar] [CrossRef]
- Couto, A.; Padín, A. R.; Reinoso, B. Comparative yield and water use efficiency of two maize hybrids differing in maturity under solid set sprinkler and two different lateral spacing drip irrigation systems in León, Spain. Agric. Water Manage. 2013, 124, 77–84. [Google Scholar] [CrossRef]
- Davies, B.; Coulter, J.A.; Pagliari, P.H. Timing and rate of nitrogen fertilization influence maize yield and nitrogen use efficiency. PLoS ONE 2020, 15, e0233674. [Google Scholar] [CrossRef] [PubMed]
- Singandhupe, R.B.; Rao, G.G.S.N.; Patil, N.G.; Brahmanand, P.S. Fertigation studies and irrigation scheduling in drip irrigation system in tomato crop (Lycopersicon esculentum L.). Eur. J. Agron. 2003, 19, 327–340. [Google Scholar] [CrossRef]
- Ma, L.; Zhang, X.; Lei, Q.; Liu, F. Effects of drip irrigation nitrogen coupling on dry matter accumulation and yield of summer maize in arid areas of China. Field Crops Res. 2021, 274, 108321. [Google Scholar] [CrossRef]
- Patel, N.; Rajput, T. Effect of fertigation frequency on onion (Allium cepa) yield and soil nitrate-nitrogen. Indian J. Agric. Sci. 2005, 75, 725–730. [Google Scholar]
- Wang, Y.; Zhang, X.; Chen, J.; Chen, A.; Wang, L.; Guo, X.; Niu, Y.; Liu, S.; Mi, G.; Gao, Q. Reducing basal nitrogen rate to improve maize seedling growth, water and nitrogen use efficiencies under drought stress by optimizing root morphology and distribution. Agric. Water Manage. 2019, 212, 328–337. [Google Scholar] [CrossRef]
- Chilundo, M.; Joel, A.; Wesström, I.; Brito, R.; Messing, I. Effects of reduced irrigation dose and slow release fertiliser on nitrogen use efficiency and crop yield in a semi-arid loamy sand. Agric. Water Manage. 2016, 168, 68–77. [Google Scholar] [CrossRef]
- Van Hoorn, J.W.; Katerji, N.; Hamdy, A.; Mastrorilli, M. Effect of salinity on yield and nitrogen uptake of four grain legumes and on biological nitrogen contribution from the soil. Agric. Water Manage. 2001, 51, 87–98. [Google Scholar] [CrossRef]
- Katupitiya, A.; Eisenhauer, D.E.; Ferguson, R.B.; Spalding, R.F.; Roeth, F.W.; Bobier, M.W. Long-term tillage and crop rotation effects on residual nitrate in the crop root zone and nitrate accumulation in the intermediate vadose zone. Trans. ASAE 1997, 40, 1321–1327. [Google Scholar] [CrossRef]
- Dou, Z.; Fox, R. H.; Toth, J.D. Seasonal soil nitrate dynamics in corn as affected by tillage and nitrogen source. Soil Sci. Soc. Am. J. 1995, 59, 858–864. [Google Scholar] [CrossRef]
- Jia, X.; Shao, L.; Liu, P.; Zhao, B.; Gu, L.; Dong, S.; Bing, S.; Zhang, J.; Zhao, B. Effect of different nitrogen and irrigation treatments on yield and nitrate leaching of summer maize (Zea mays L.) under lysimeter conditions. Agric. Water Manage. 2014, 137, 92–103. [Google Scholar] [CrossRef]
- Chen, X.; Zhang, F.; Romheld, V.; Horlacher, D.; Schulz, R.; Boning-Zilkens, M.; Wang, P.; Claupein, W. Synchronizing N supply from soil and fertilizer and N demand of winter wheat by an improved Nmin method. Nutr. Cycl. Agroecosyst. 2006, 74, 91–98. [Google Scholar] [CrossRef]
- Nie, J.; Harrison, M.T.; Zhou, J.; Yang, L.; Zhao, J.; Wang, X.; Liu, K.; Wang, S.; Zang, H.; Yang, Y.; Zeng, Z. Productivity and water use efficiency of summer soybean-winter wheat rotation system under limited water supply in the North China Plain. Eur. J. Agron. 2023, 151, 126959. [Google Scholar] [CrossRef]
- Guo, J.; Fan, J.; Xiang, Y.; Zhang, F.; Yan, S.; Zhang, X.; Zheng, J.; Li, Y.; Tang, Z.; Li, Z. Coupling effects of irrigation amount and nitrogen fertilizer type on grain yield, water productivity and nitrogen use efficiency of drip-irrigated maize. Agric. Water Manage. 2022, 261, 107389. [Google Scholar] [CrossRef]
- Hu, H.; Ning, T.; Li, Z.; Han, H.; Zhang, Z.; Qin, S.; Zheng, Y. Coupling effects of urea types and subsoiling on nitrogen-water use and yield of differentvarieties of maize in northern China. Field Crops Res. 2013, 142, 85–94. [Google Scholar] [CrossRef]
- Irmak, S.; Mohammed, A.T.; Kukal, M.S. Maize response to coupled irrigation and nitrogen fertilization under center pivot, subsurface drip and surface (furrow) irrigation: Growth, development and productivity. Agric. Water Manage. 2022, 263, 107457. [Google Scholar] [CrossRef]
- Irmak, S.; Mohammed, A.T.; Kukal, M.S. Maize response to coupled irrigation and nitrogen fertilization under center pivot, subsurface drip and surface (furrow) irrigation: Growth, development and productivity. Agric. Water Manage. 2022, 263, 107457. [Google Scholar] [CrossRef]
- Oweis, T.Y.; Farahani, H.J.; Hachum, A.Y. Evapotranspiration and water use of full and deficit irrigated cotton in the Mediterranean environment in northern Syria. Agric. Water Manage. 2011, 98, 1239–1248. [Google Scholar] [CrossRef]
- Deng, Z.; Bai, D.; Zhai, G.; Zong, J.; Li, Y.; Cai, J. Effects of water and nitrogen regulation on the yield and water and nitrogen use efficiency of cotton in south Xinjiang, northwest China under plastic mulched drip irrigation. Chin. J. Appl. Ecol. 2013, 24, 2525–2532. [Google Scholar]
- Wang, H.; Wang, X.; Bi, L.; Wang, Y.; Fan, J.; Zhang, F.; Hou, X.; Cheng, M.; Hu, W.; Wu, L.; Xiang, Y. Multi-objective optimization of water and fertilizer management for potato production in sandy areas of Northern China based on TOPSIS. Field Crops Res. 2019, 240, 55–68. [Google Scholar] [CrossRef]
- Seyedmohammadi, J.; Sarmadian, F.; Jafarzadeh, A. A.; Ghorbani, M. A.; Shahbazi, F. Application of SAW, TOPSIS and fuzzy TOPSIS models in cultivation priority planning for maize, rapeseed and soybean crops. Geoderma, 2018, 310, 178–190. [Google Scholar] [CrossRef]
- Liu, X.; Peng, Y.; Yang, Q.; Wang, X.; Cui, N. Determining optimal deficit irrigation and fertilization to increase mango yield, quality, and WUE in a dry hot environment based on TOPSIS. Agric. Water Manage 2020, 245, 106650. [Google Scholar] [CrossRef]

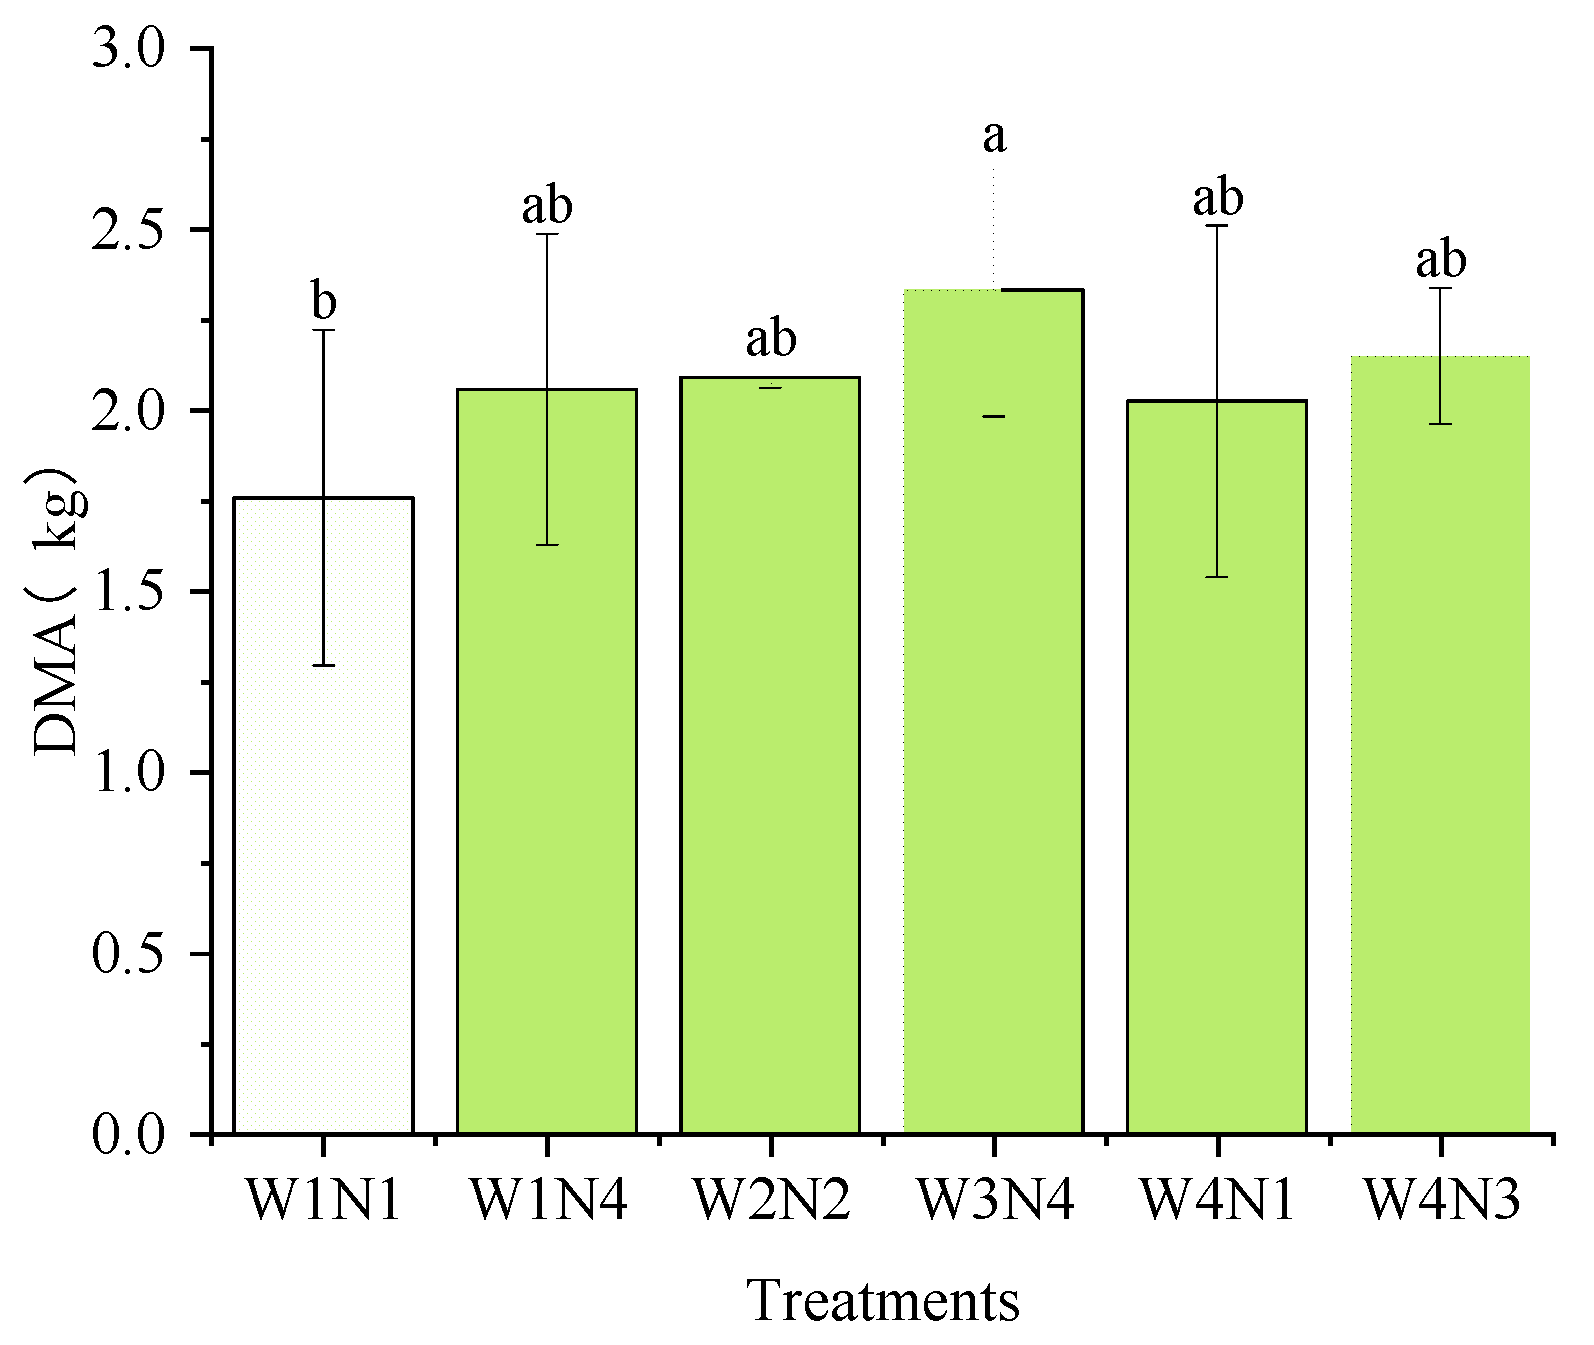
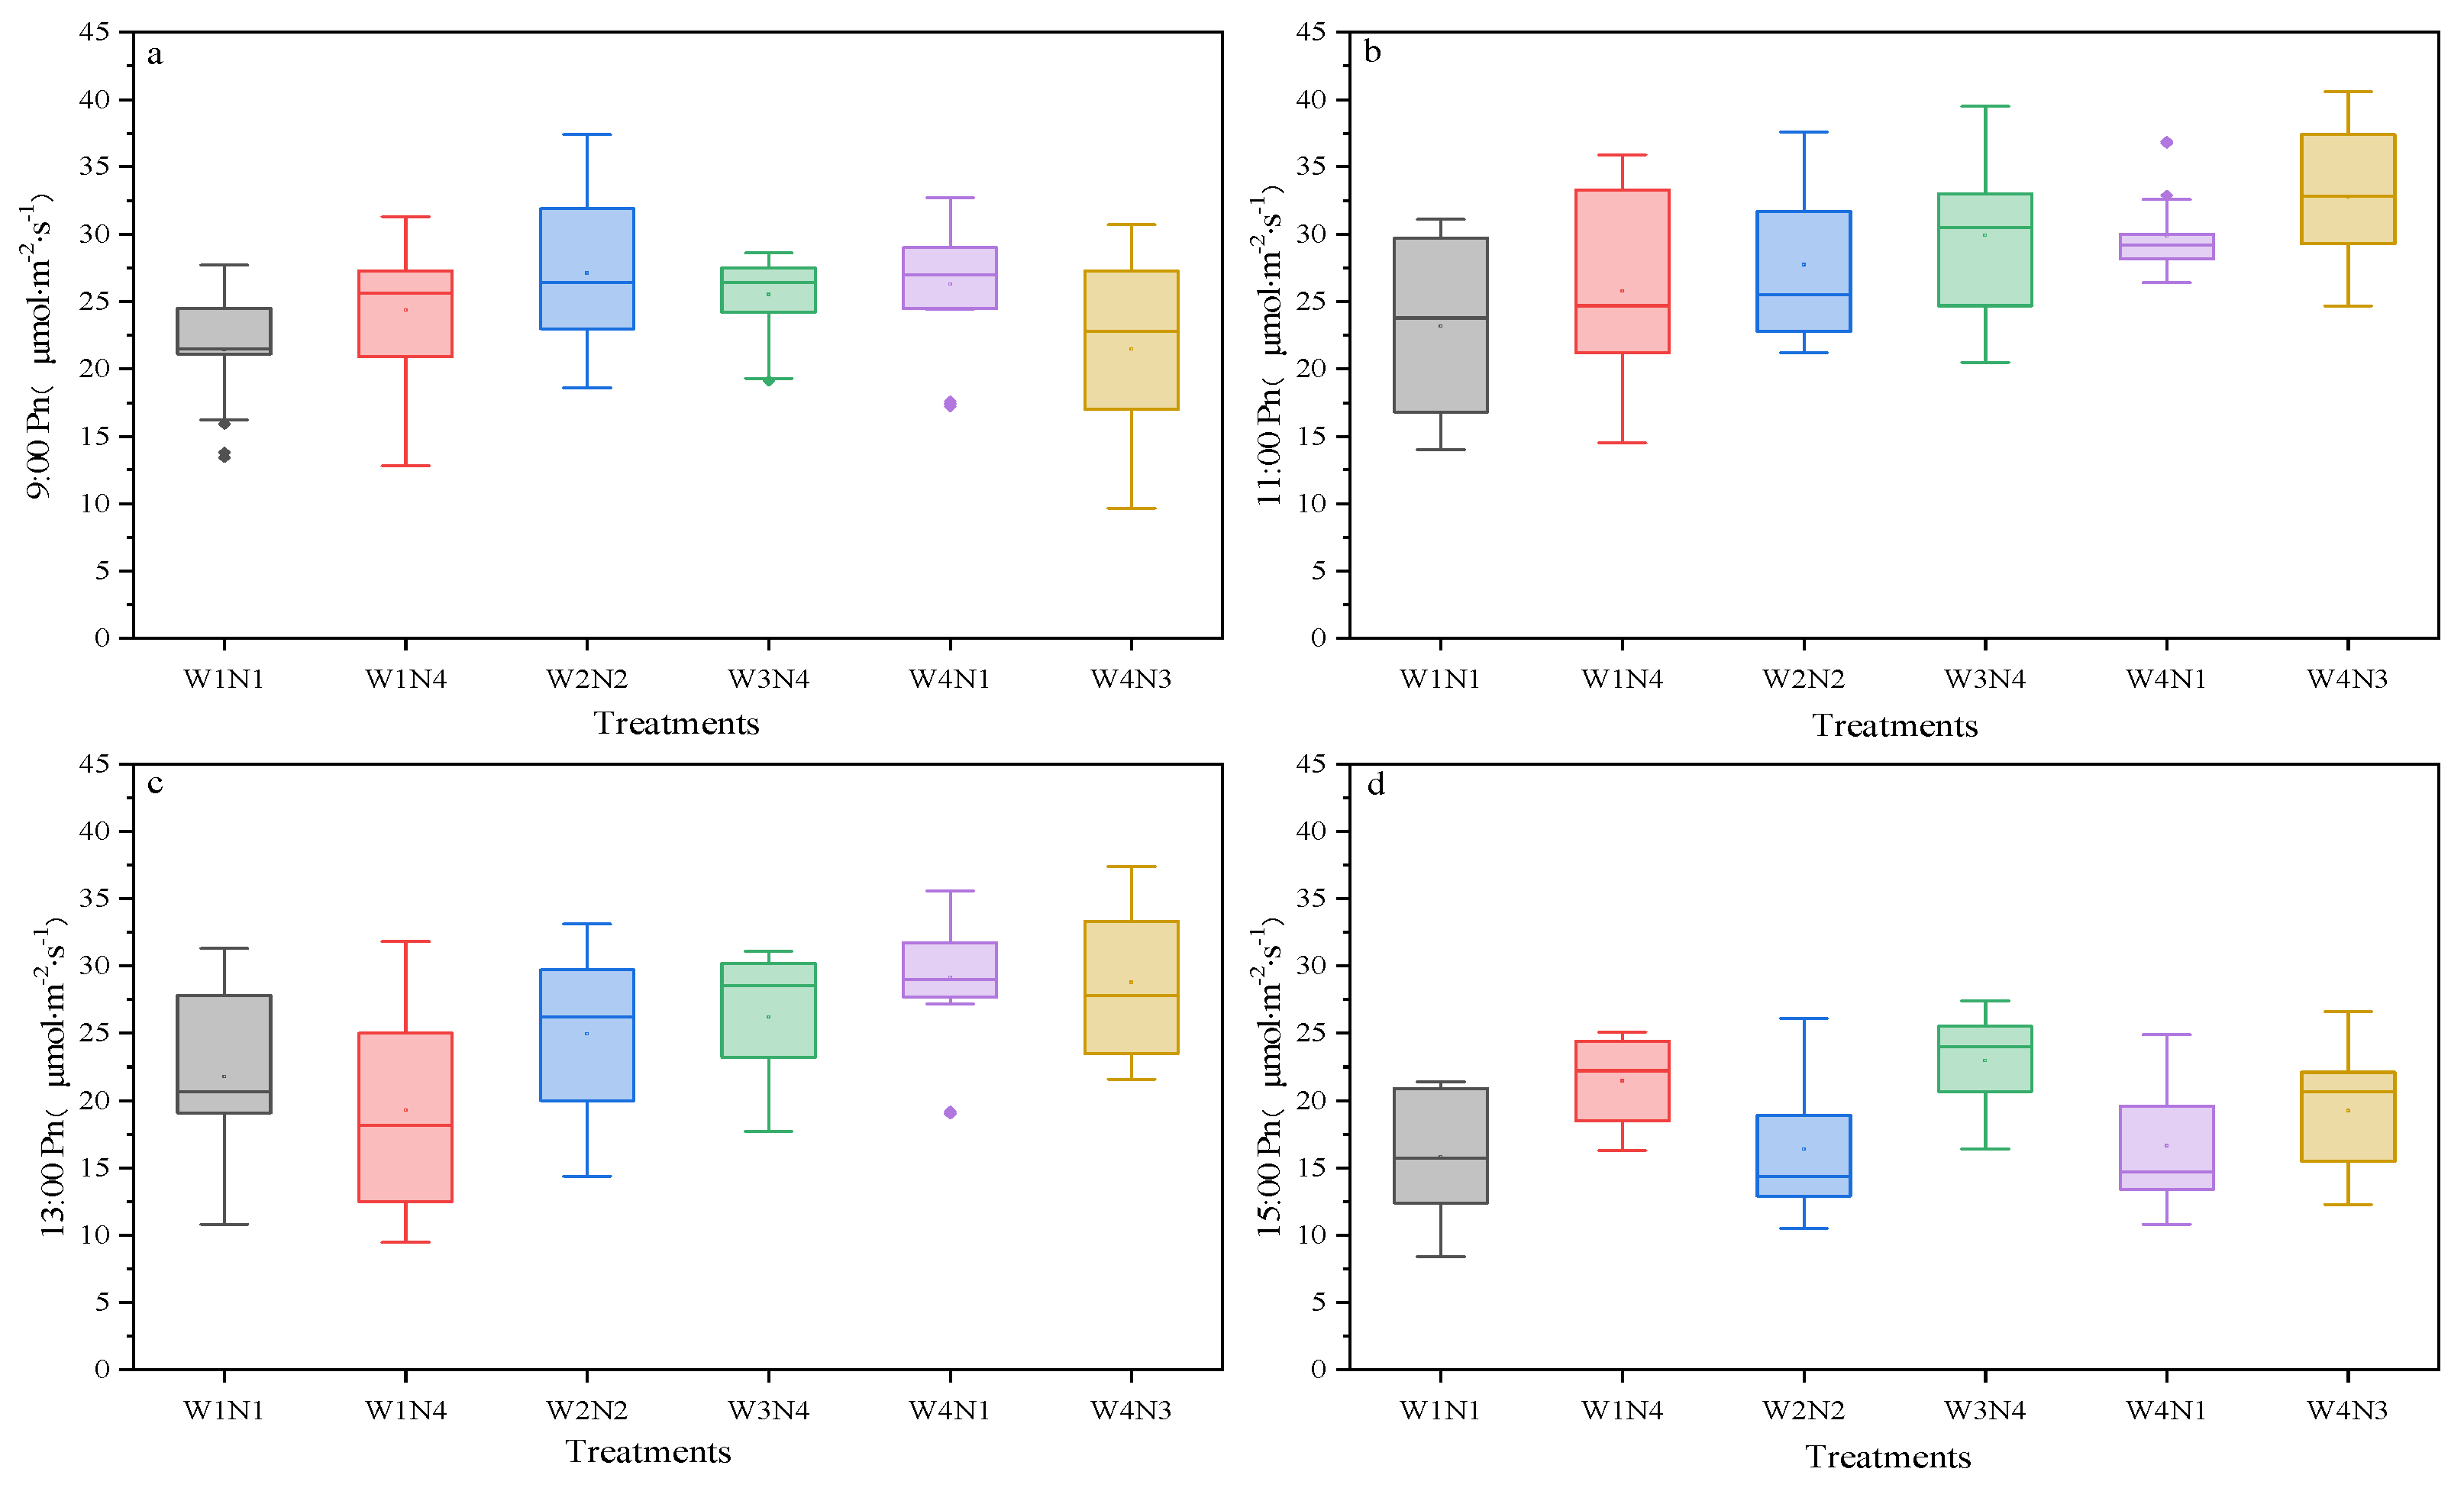
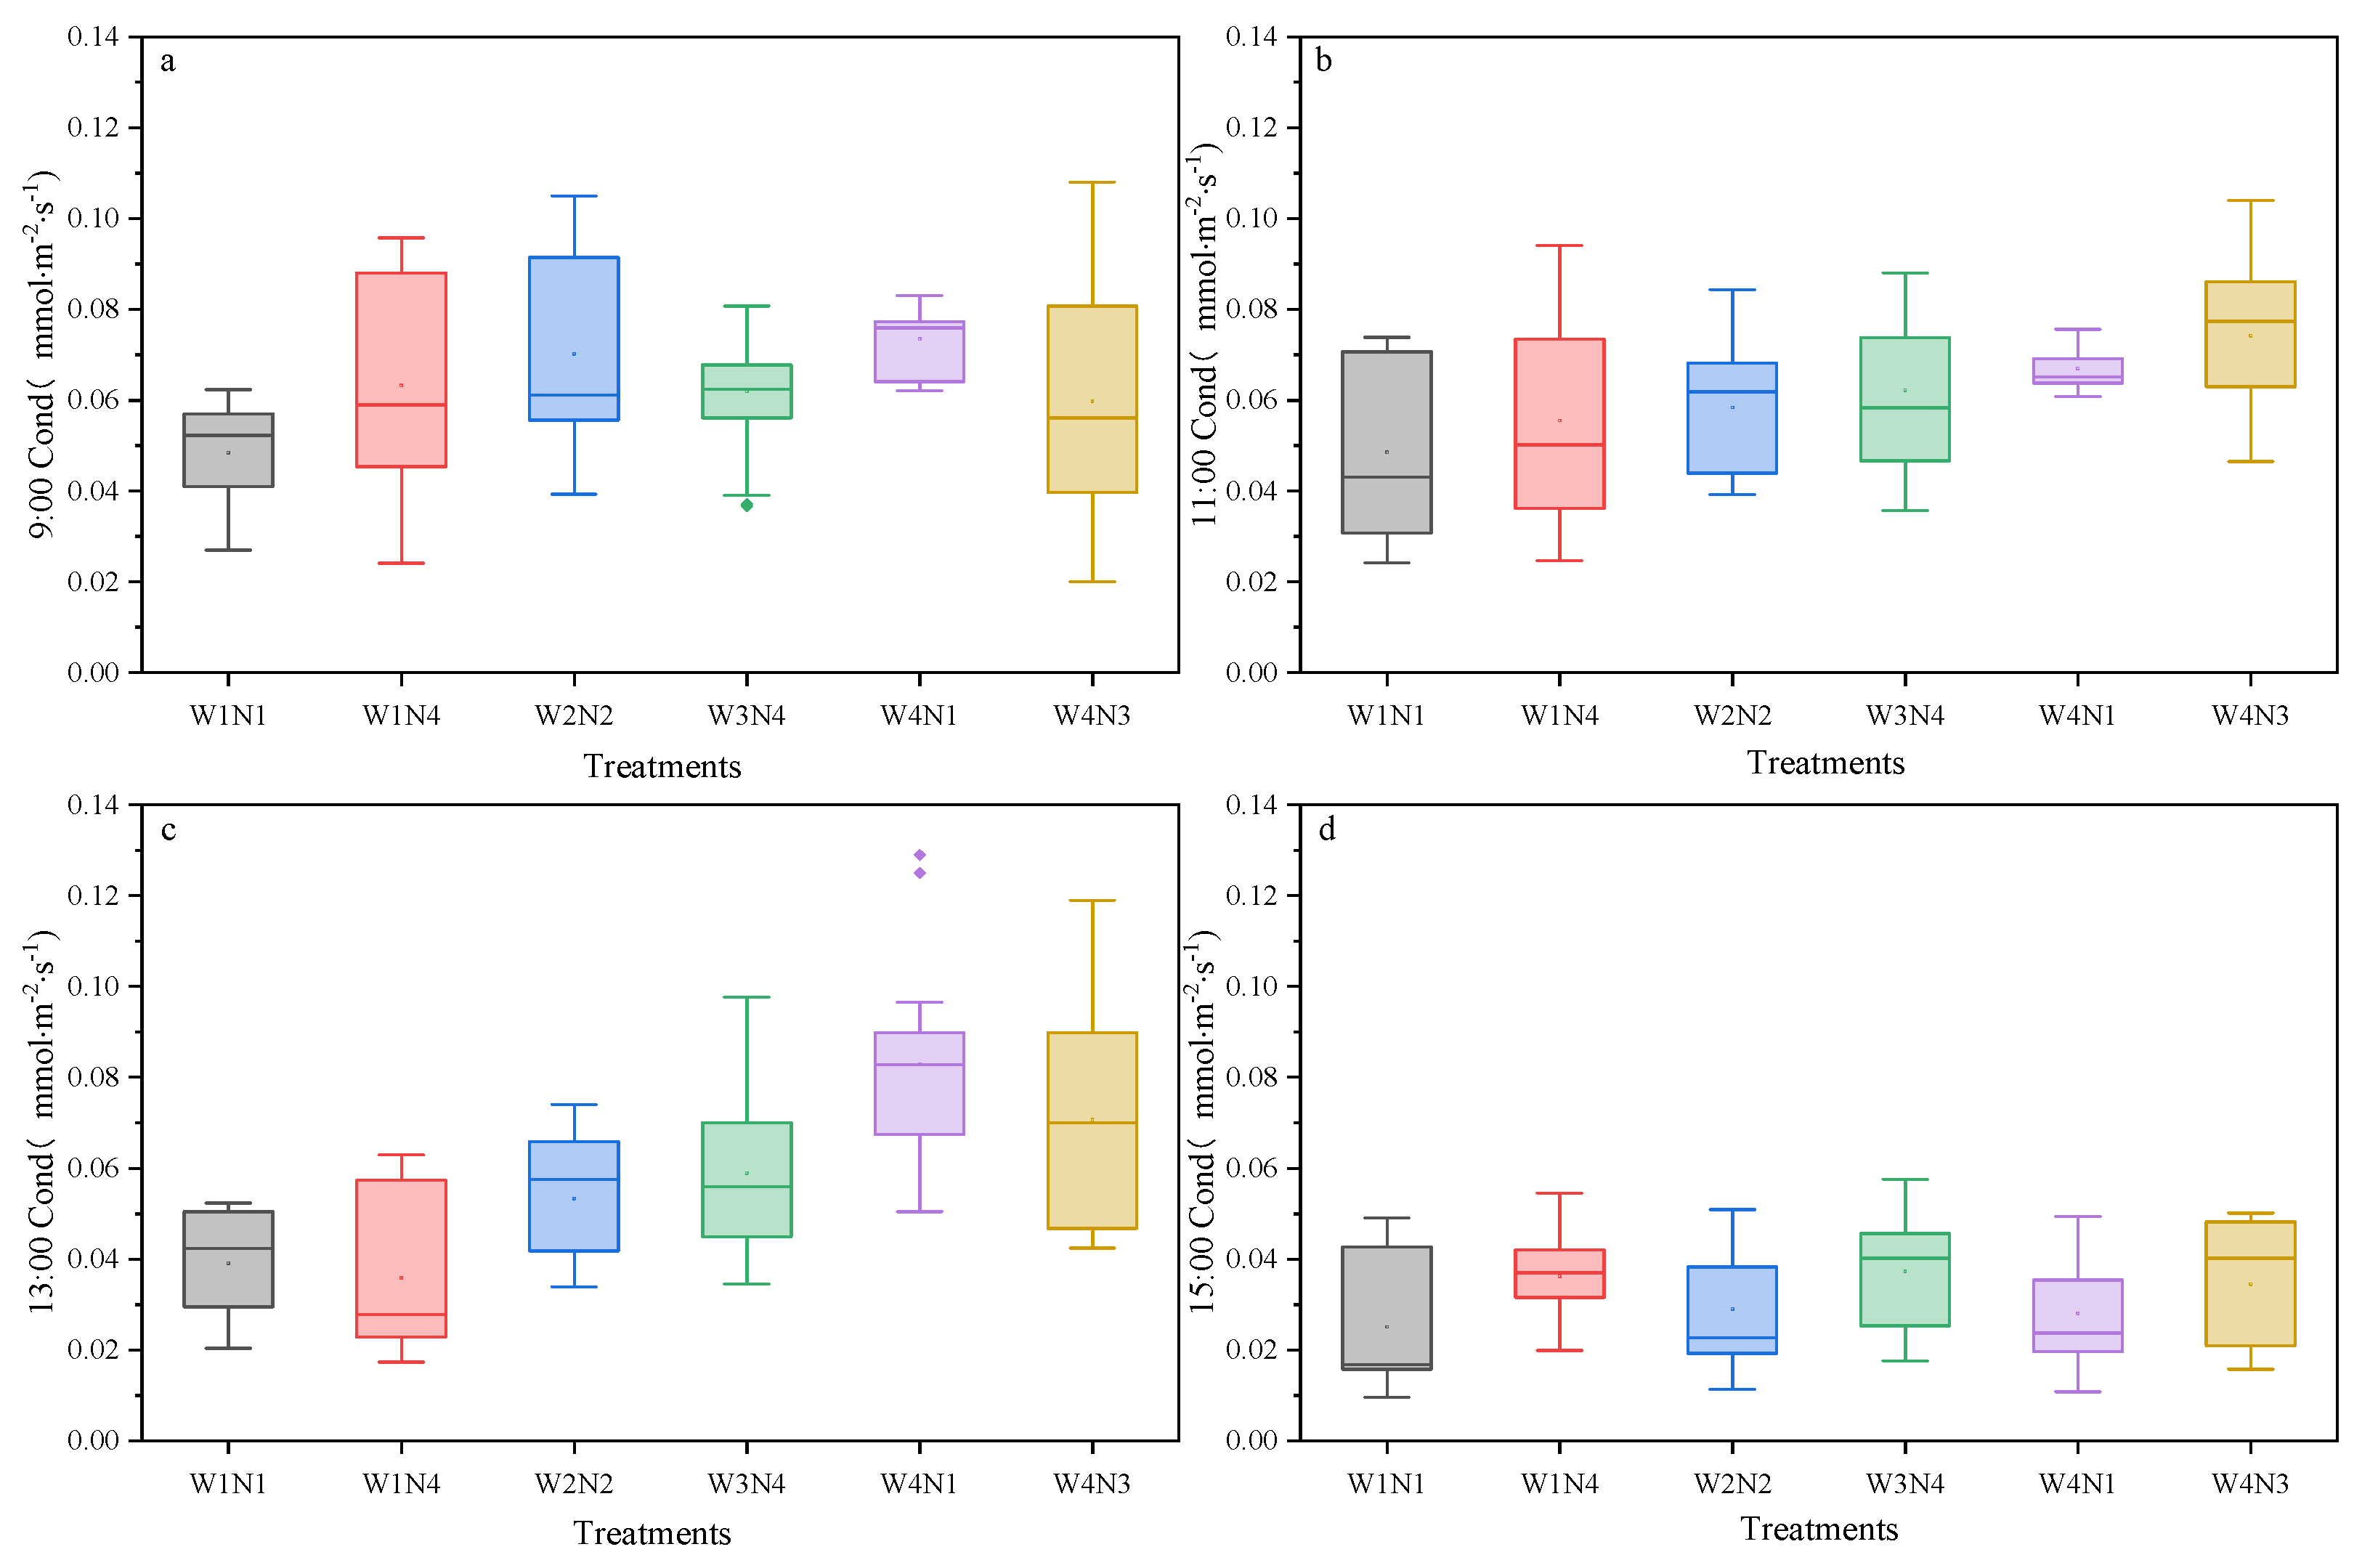
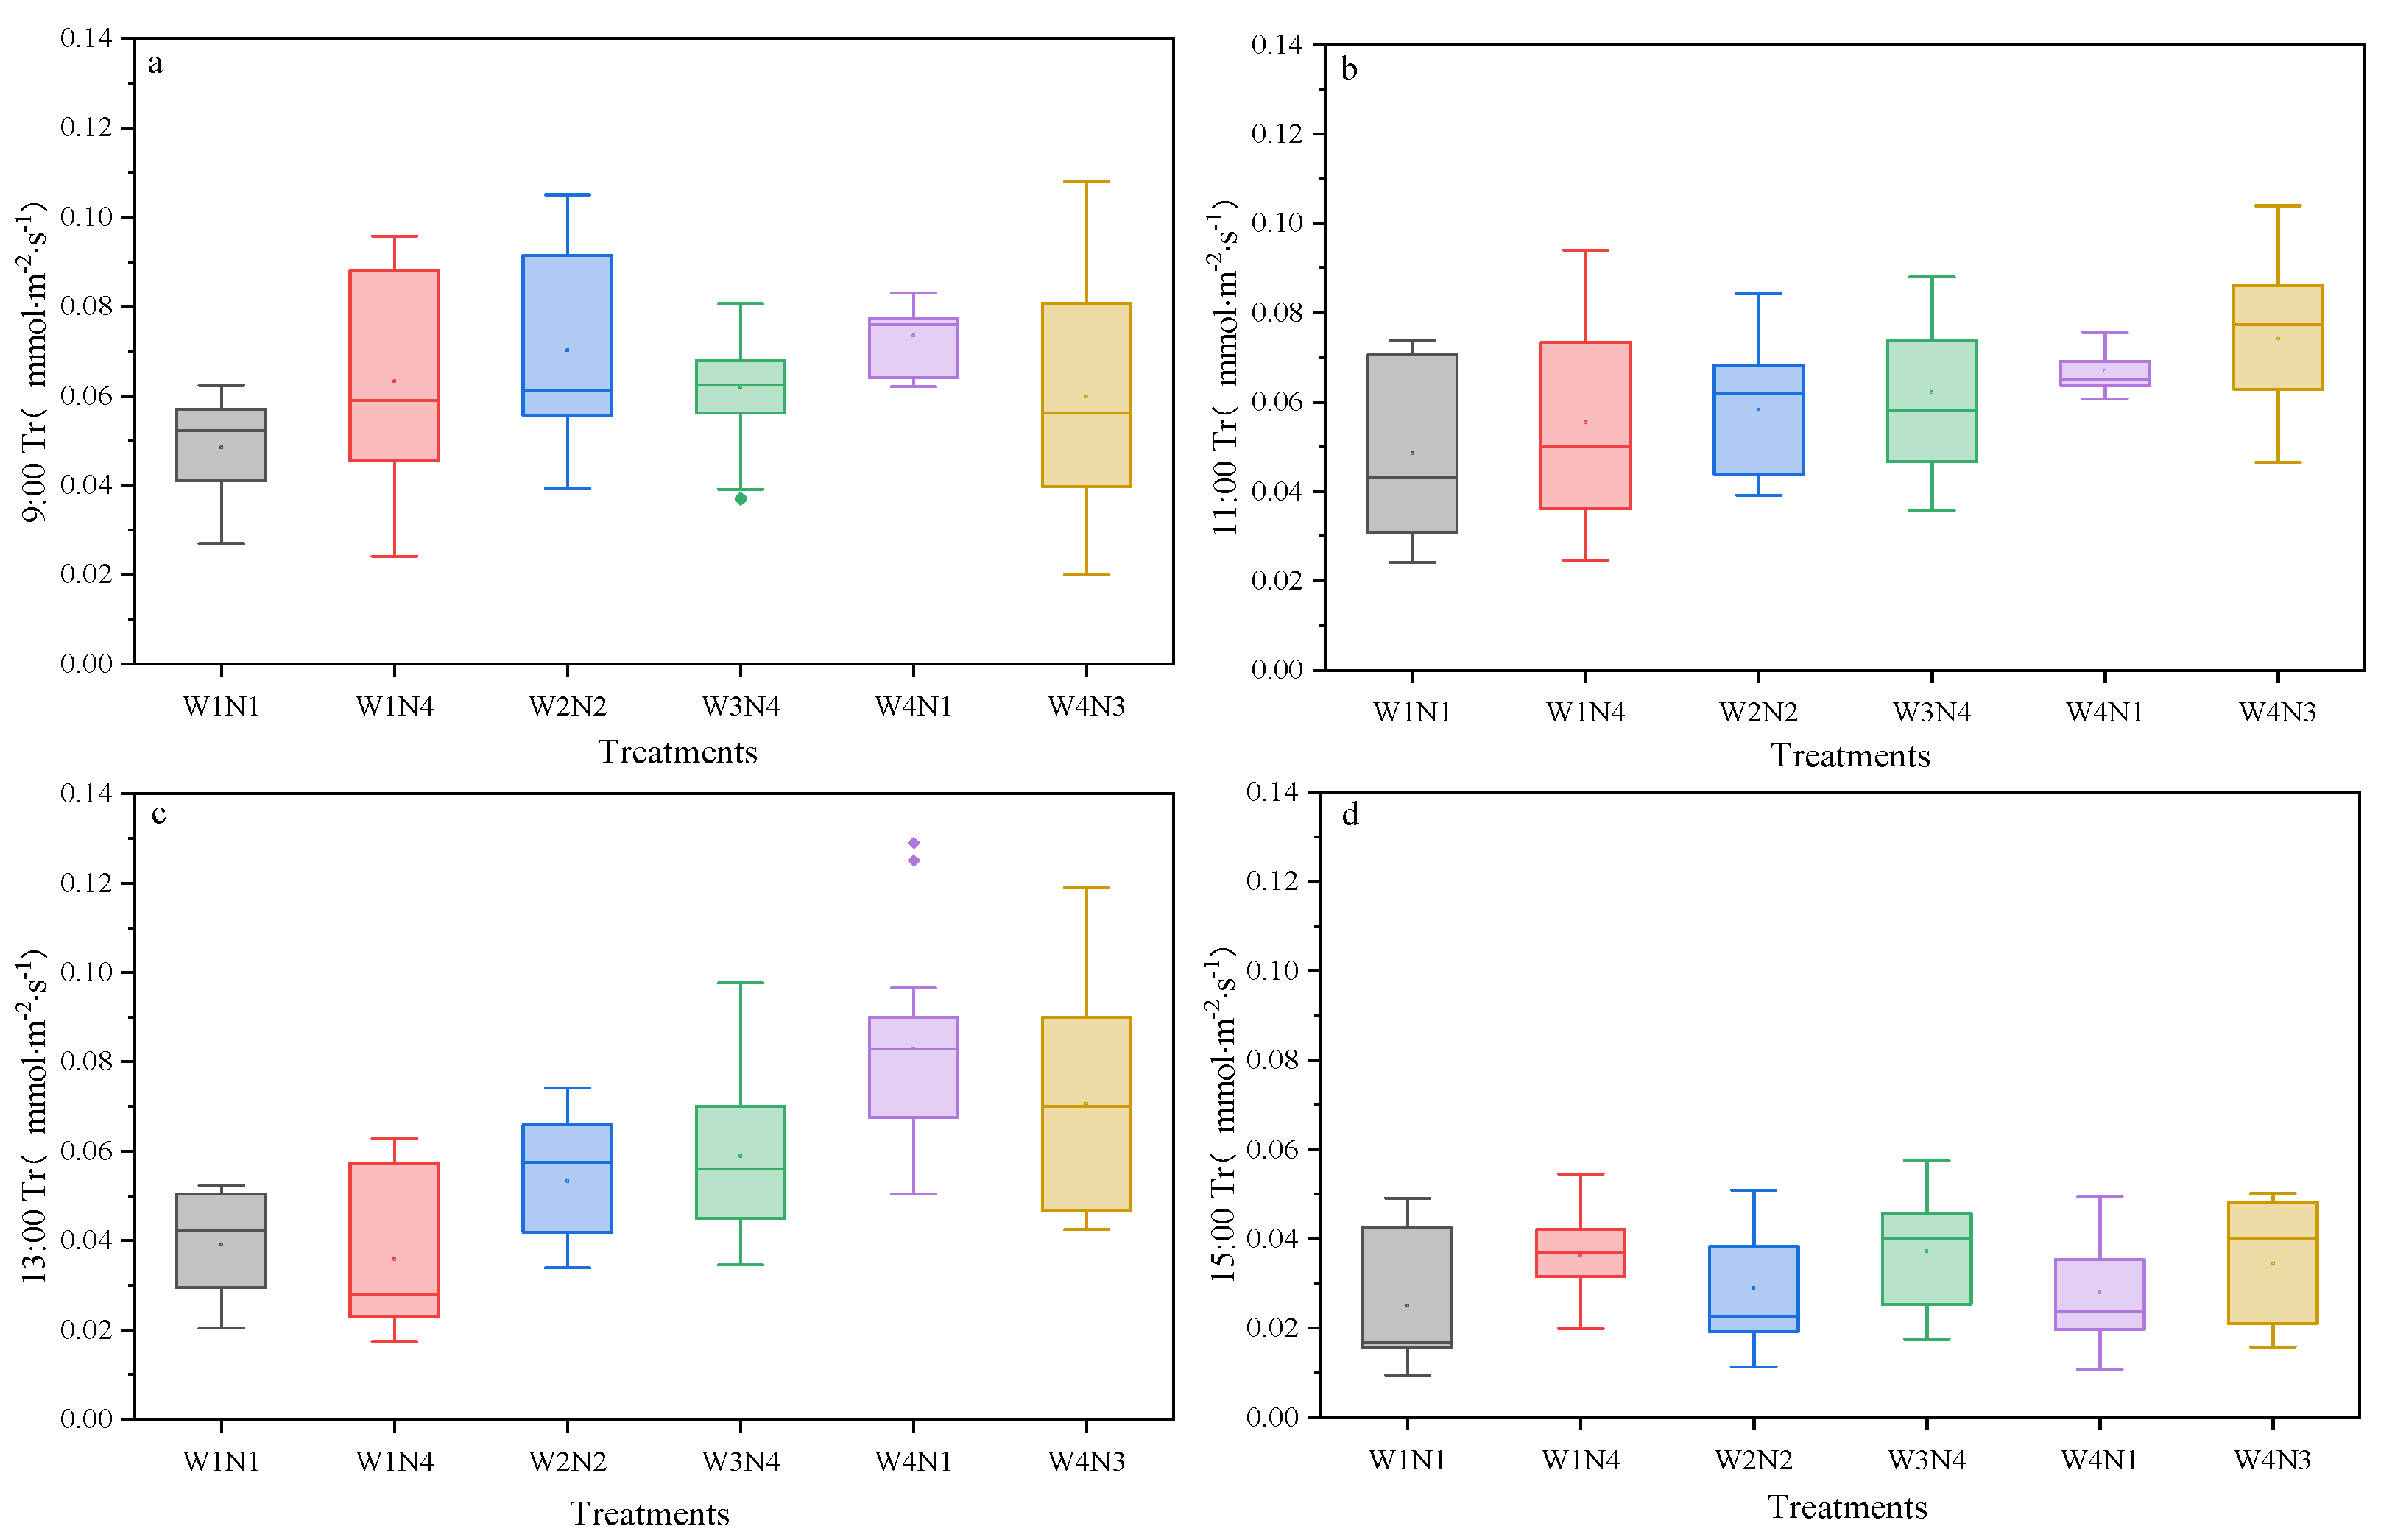
| Treatments | Code | Application rate | |||
|---|---|---|---|---|---|
| X1 (Irrigation) |
X2 (Nitrogen) |
Irrigation (mm) |
Nitrogen (kg·hm-2) |
||
| W1N1 | -1 | -1 | 145.40 | 34.80 | |
| W4N1 | 1 | -1 | 436.20 | 34.80 | |
| W1N4 | -1 | 1 | 145.40 | 382.80 | |
| W2N2 | -0.1315 | -0.1315 | 271.70 | 185.90 | |
| W4N3 | 1 | 0.3945 | 436.20 | 277.40 | |
| W3N4 | 0.3945 | 1 | 348.20 | 382.80 | |
| Treatments | Seeding stage- Jointing stage |
Jointing stage- Heading stage |
Heading stage- Filling stage |
Filling stage - Maturation stage |
||||
|---|---|---|---|---|---|---|---|---|
| Times | Irrigation (mm) | Times | Irrigation (mm) | Times | Irrigation (mm) | Times | Irrigation (mm) | |
| W1N1 | 1 | 27.60 | 2 | 39.80 | 1 | 32.00 | 2 | 46.00 |
| W4N1 | 2 | 82.90 | 3 | 119.50 | 2 | 96.00 | 3 | 137.80 |
| W1N4 | 1 | 27.60 | 2 | 39.80 | 1 | 32.00 | 2 | 46.00 |
| W2N2 | 2 | 51.60 | 2 | 74.40 | 2 | 59.80 | 2 | 85.90 |
| W4N3 | 2 | 82.90 | 3 | 119.50 | 2 | 96.00 | 3 | 137.80 |
| W3N4 | 2 | 66.20 | 3 | 95.40 | 2 | 76.60 | 3 | 110.00 |
| Treatments | Y (kg·hm-2) |
WUE (kg·hm-2·mm-1) |
|---|---|---|
| W1N1 | 7042.20±92.30d | 36.30±5.80ab |
| W4N1 | 8554.00±342.30b | 17.30±2.00d |
| W1N4 | 7893.90±81.20c | 41.60±3.80a |
| W2N2 | 9029.40±118.60b | 28.60±1.50bc |
| W4N3 | 9109.50±14.90b | 20.80±0.50cd |
| W3N4 | 10204.20±214.60a | 25.60±0.40cd |
| Treatments | D+ | D- | Si | ranking |
|---|---|---|---|---|
| W1N1 | 0.9566 | 0.2765 | 0.2242 | 6 |
| W4N1 | 0.8165 | 0.5229 | 0.3904 | 2 |
| W1N4 | 0.8697 | 0.4358 | 0.3338 | 3 |
| W2N2 | 0.8045 | 0.3535 | 0.3053 | 5 |
| W4N3 | 0.3835 | 0.8866 | 0.6980 | 1 |
| W3N4 | 0.8254 | 0.4057 | 0.3295 | 4 |
Disclaimer/Publisher’s Note: The statements, opinions and data contained in all publications are solely those of the individual author(s) and contributor(s) and not of MDPI and/or the editor(s). MDPI and/or the editor(s) disclaim responsibility for any injury to people or property resulting from any ideas, methods, instructions or products referred to in the content. |
© 2024 by the authors. Licensee MDPI, Basel, Switzerland. This article is an open access article distributed under the terms and conditions of the Creative Commons Attribution (CC BY) license (http://creativecommons.org/licenses/by/4.0/).


