Preprint
Article

Monitoring Earthquake Risks in Nador, Northeast Morocco

Altmetrics

Downloads

122

Views

79

Comments

0

A peer-reviewed article of this preprint also exists.

Submitted:

14 June 2024

Posted:

17 June 2024

You are already at the latest version

Alerts
Abstract
Earthquake events present a high risk in urban areas. Nador City is a Mediterranean city located in a dynamic zone with seismologic movement and a frequency of earthquake events per year. This worrying rate shows that earthquake risks can hinder the urban area and damage citizens and goods if urban risk management is not taken. This study defines the areas most threatened by seismic events to protect them as a priority. Using Geographic Information System, Corine Land Cover, seismic intensity, and socioeconomic vulnerability index, we mapped the urban vulnerability index. The adopted model determines urban vulnerability levels from urban land cover, topography, geologic factors, and geomorphologic factors. These approaches reveal that $70\%$ of Nador is under the damage of a seismic disaster. In addition, the main objective is to apply a new set of guidelines to map the intensity of risks and explain the distinct risk exposure level in Nador’s urban context.
Keywords: 
Subject: Environmental and Earth Sciences  -   Geography

1. Introduction

Coastal cities in the Mediterranean region experience natural disasters, and out of all these, seismic risks have remained paramount. Nador indeed could be regarded as an example of sensitivity to geological events because it is in the area where active movements of African and Eurasian tectonic plates are observed. Therefore, the identification of the seismological risks involved when constructing a city like Nador is critical for the public good as well as in developing a sustainable city for future growth and urban longevity. Before advancing to the results of the paper, it is pertinent to highlight that the paper relies on prior research carried out on seismic risks in Nador [1]. Geological surveys documented the location of active faults in the area and estimated urban vulnerability [2]. Historical seismography studies revealed that previous earthquakes tend to be repeated concerning the local seismicity [3]. Social scientists simultaneously analyzed building systems for earthquake resistance and edge of social vulnerabilities in sensitive cities. A holistic approach that focuses on individual aspects of Nador Earth-quake risk [4].
Earthquake risk assessment is a matter for another area. Geology identifies active faults, seismology examines old earthquakes, and social science examines resilience and social vulnerability levels. Although valuable, these factors have operated in isolation, hindering the development of comprehensive mitigation strategies [4].
Risk analysis entails the identification of potential risks, the judgment of the consequences, and the probability of their occurrence [5]. The concept is mostly used in the healthcare, industrial, and insurance industries, which rely heavily on accurate forecasting of natural disasters [6]. However, the concept of risk has different definitions in different sectors, such as business, finance, and infrastructure [7]. Despite these variations, one thread is clear: uncertainty (probability) and loss (likelihood of outcome) are the determinants of risk. The equation Risk = (Hazard) x (Vulnerability) x (Exposure to Hazard) reflects this concept [8,9].
This is a holistic view of the seismic theory that integrates the risk assessment approaches. Therefore, it will become our analytic framework [10]. United Nations Office for Disaster Risk Reduction indicates that the risk refers to the possibility of a hazardous event at specific times and places [11]. Pursuing the opinion of Cohen A. V. (1984), the risk could be considered one of the outcomes that are not good as a damage [12].
The commonly used term risk has a deeper meaning, especially when it comes to such activities as risk evaluation and management [13]. To answer the question of what counts, it is necessary to use the definitions stated in literature and embrace such distinctions of understanding that imply both quantitative and qualitative dimensions [14].
Gibbs, M. T. et al. (2015) concluded that the risk is the probability of growth occurring at a particular time and place [13]. Hantz D. et al. (2021) and Smith K. (1993) have demonstrated a risk definition for the possibility of something bad happening. Risk involves uncertainty about the effects/implications of an activity with respect to something that humans value (such as health, well-being, wealth, property, or the environment), often focusing on negative, undesirable consequences [15,16].
These conceptualizations provide an understanding of how historical information, the use of statistics, and modeling for assessing the likelihood of potential risks are important. These quantitative assessments serve as the basis of various approaches that are used in calculating risks by which we can predict certain events which are likely to happen with a certain degree of certainty.
While the quantitative aspect is crucial, relying solely on probability can provide an in-complete picture. Recognizing this limitation, Varnes DJ. (1984) suggests a complementary perspective, defining hazard as “a condition with the potential for causing an undesirable consequence” [14].
This qualitative angle aligns with the definitions proposed by Alexander D. (1993) and Blaikie P. et al. (2004), who showed that the threat is a “hazard with the potential to cause damage” and a “chance with the ability to result in poor effects” respectively [17,18].
Embracing the qualitative size fosters a deeper knowledge of the inherent damage associated with diverse phenomena, no matter their likelihood of occurrence. This broader know-how is important for successfully preparing for and mitigating the potential effects of diverse unsafe occasions, even those with a low possibility.
Vulnerability, a term often used colloquially to describe the potential for harm or susceptibility to adverse events, carries significant weight in scientific discourse across various fields, including climate change, poverty alleviation, and natural hazard management [18]. In these disciplines, scientist have sought to refine and define vulnerability more precisely, emphasizing its multifaceted nature and the dynamic interplay of factors that contribute to it.
In the realm of theoretical understanding, vulnerability remains somewhat abstract, with definitions often lacking specificity. However, operational definitions methodologies developed to assess vulnerability provide tangible frameworks for analysis. These methodologies typically fall into three categories: evaluating the potential harm under projected future scenarios, assessing the current capacity to mitigate harm, or combining both approaches to provide a comprehensive understanding of vulnerability dynamics.
One focal observation is the disparity amongst theoretical and operational definitions, highlighting a need for greater coherence and alignment in conceptualizations of vulnerability throughout disciplines.
According to Aksha S.K.et al (2019), vulnerability may be understood as the manifestation of inherent states inside a machine that render it liable to extreme risks or exploitation, resulting in detrimental effects [19].
Aven T. (2011) and Wolf S.et al (2013) offer a nuanced view, defining vulnerability as the set of characteristics that determine a person or group’s ability to anticipate, cope with, resist, and recover from the impacts of a hazard. This definition underscores the dynamic nature of the vulnerability, fashioned with the aid of a complex interaction of external elements which includes environmental modifications and financial shocks, in addition to internal factors like social inequalities and useful resource availability [20,21].
From an environmental perspective, Kreimer A.et al (2003) expands the idea of vulnerability to encompass the degradation and next loss of environmental goods and services. This broader perspective recognizes the inter-connectedness of human societies and their environment, highlighting how environmental degradation can exacerbate vulnerabilities and increase susceptibility to adverse impacts [22].
Overall, these various perspectives on vulnerability underscore its complexity and dynamic nature, urging researchers and policymakers to adopt holistic approaches that consider a wide range of factors when assessing and addressing vulnerability in different contexts. Earthquakes pose massive risks to people, property, and structures. This risk may be divided into three main classes: human stakes, property stakes, and gadget stakes. Human stakes check with the direct and indirect influences on individuals at some stage in natural disasters [23]. During those occasions, huge numbers of human beings can suffer accidents, displacement, or homelessness. The loss of lifestyles and bodily injuries are devastating consequences that require on-the-spot emergency response and lengthy-time period restoration efforts [24]. Property stakes involve the potential harm and destruction of buildings, infrastructure, and belongings all through extreme disasters [25]. The latest surge in natural has demonstrated the widespread cost perspective of those activities, with widespread environmental and structural damage leading to massive asset losses [26]. Losses because of herbal disasters are typically measured in greenbacks for contrast functions [27]. System stakes encompass the potential disruption or damage to critical infrastructure, essential services, and economic systems. These systems include transportation networks, power grids, communication systems, and supply chains. The stakes associated with natural phenomena are not static, but rather influenced by various factors [28,29]. The danger tolerance of individuals varies depending on their situations, and the threat of demise from natural disasters can be quite small in comparison to different life-style-associated activities and domestic accidents [30]. However, the effect on assets and infrastructure can be tremendous. This has mainly been the case with the populace and economic boom in catastrophe-prone regions. As highlighted in current studies [31,32,33], destiny natural disaster losses are expected to increase due to a continued upward push in monetary publicity and the outcomes of weather trade (See Figure 1 below).
Drawing on data from earthquake risk monitoring in Nador city, our investigation can begin by exploring four potential hypotheses:
  • Nador is at a high risk of earthquakes due to its location on the Mediterranean coast and proximity to fault lines;
  • Existing earthquake monitoring systems in Nador are inadequate to effectively
  • assess and mitigate earthquake risks;
  • The vulnerabilities of Nador, as a coastal city, are exacerbated by potential earthquake risks, leading to a greater threat of damage and casualties;
  • Lessons learned from monitoring earthquake risks in Nador can be applied to improve preparedness in other vulnerable urban area.
This study proposes a novel approach that transcends past limitations. We will integrate data from various disciplines, fostering a holistic perspective on earthquake risk assessment. This synergy will enable the development of more effective mitigation strategies that address the multifaceted nature of seismic vulnerability.
Our research takes a comprehensive method that integrates geographic, seismic and socioeconomic data to develop a thorough understanding of urban vulnerability. However, we focus on proposing strategies that can be used to reduce future earthquake impacts. This paper evaluates deeply the specific seismic hazards in Nador and is a case study that sheds light on the complex challenges faced by vulnerable coastal communities in the Mediterranean region.
In this manuscript, we develop a methodology that uses available seismic data, topography, geomorphology, and urban data to analyze the profile of the relative urban vulnerability of seismic risk production across Nador City. To do this, we examine the relative risks of earthquake hazards for eight factors: urban land cover, slope index, geomorphology, seismic frequency, and urban building quality. Additionally, we develop spatial distribution functions for seismic hazards for each crop based on historical earth-quakes from 1901–2024. We believe that illustrating how the risks to communities and the urban context they rely on are likely to change as cropping patterns change will facilitate the development of sustainable policies and practices.

2. Materials and Methods

2.1. Study Area

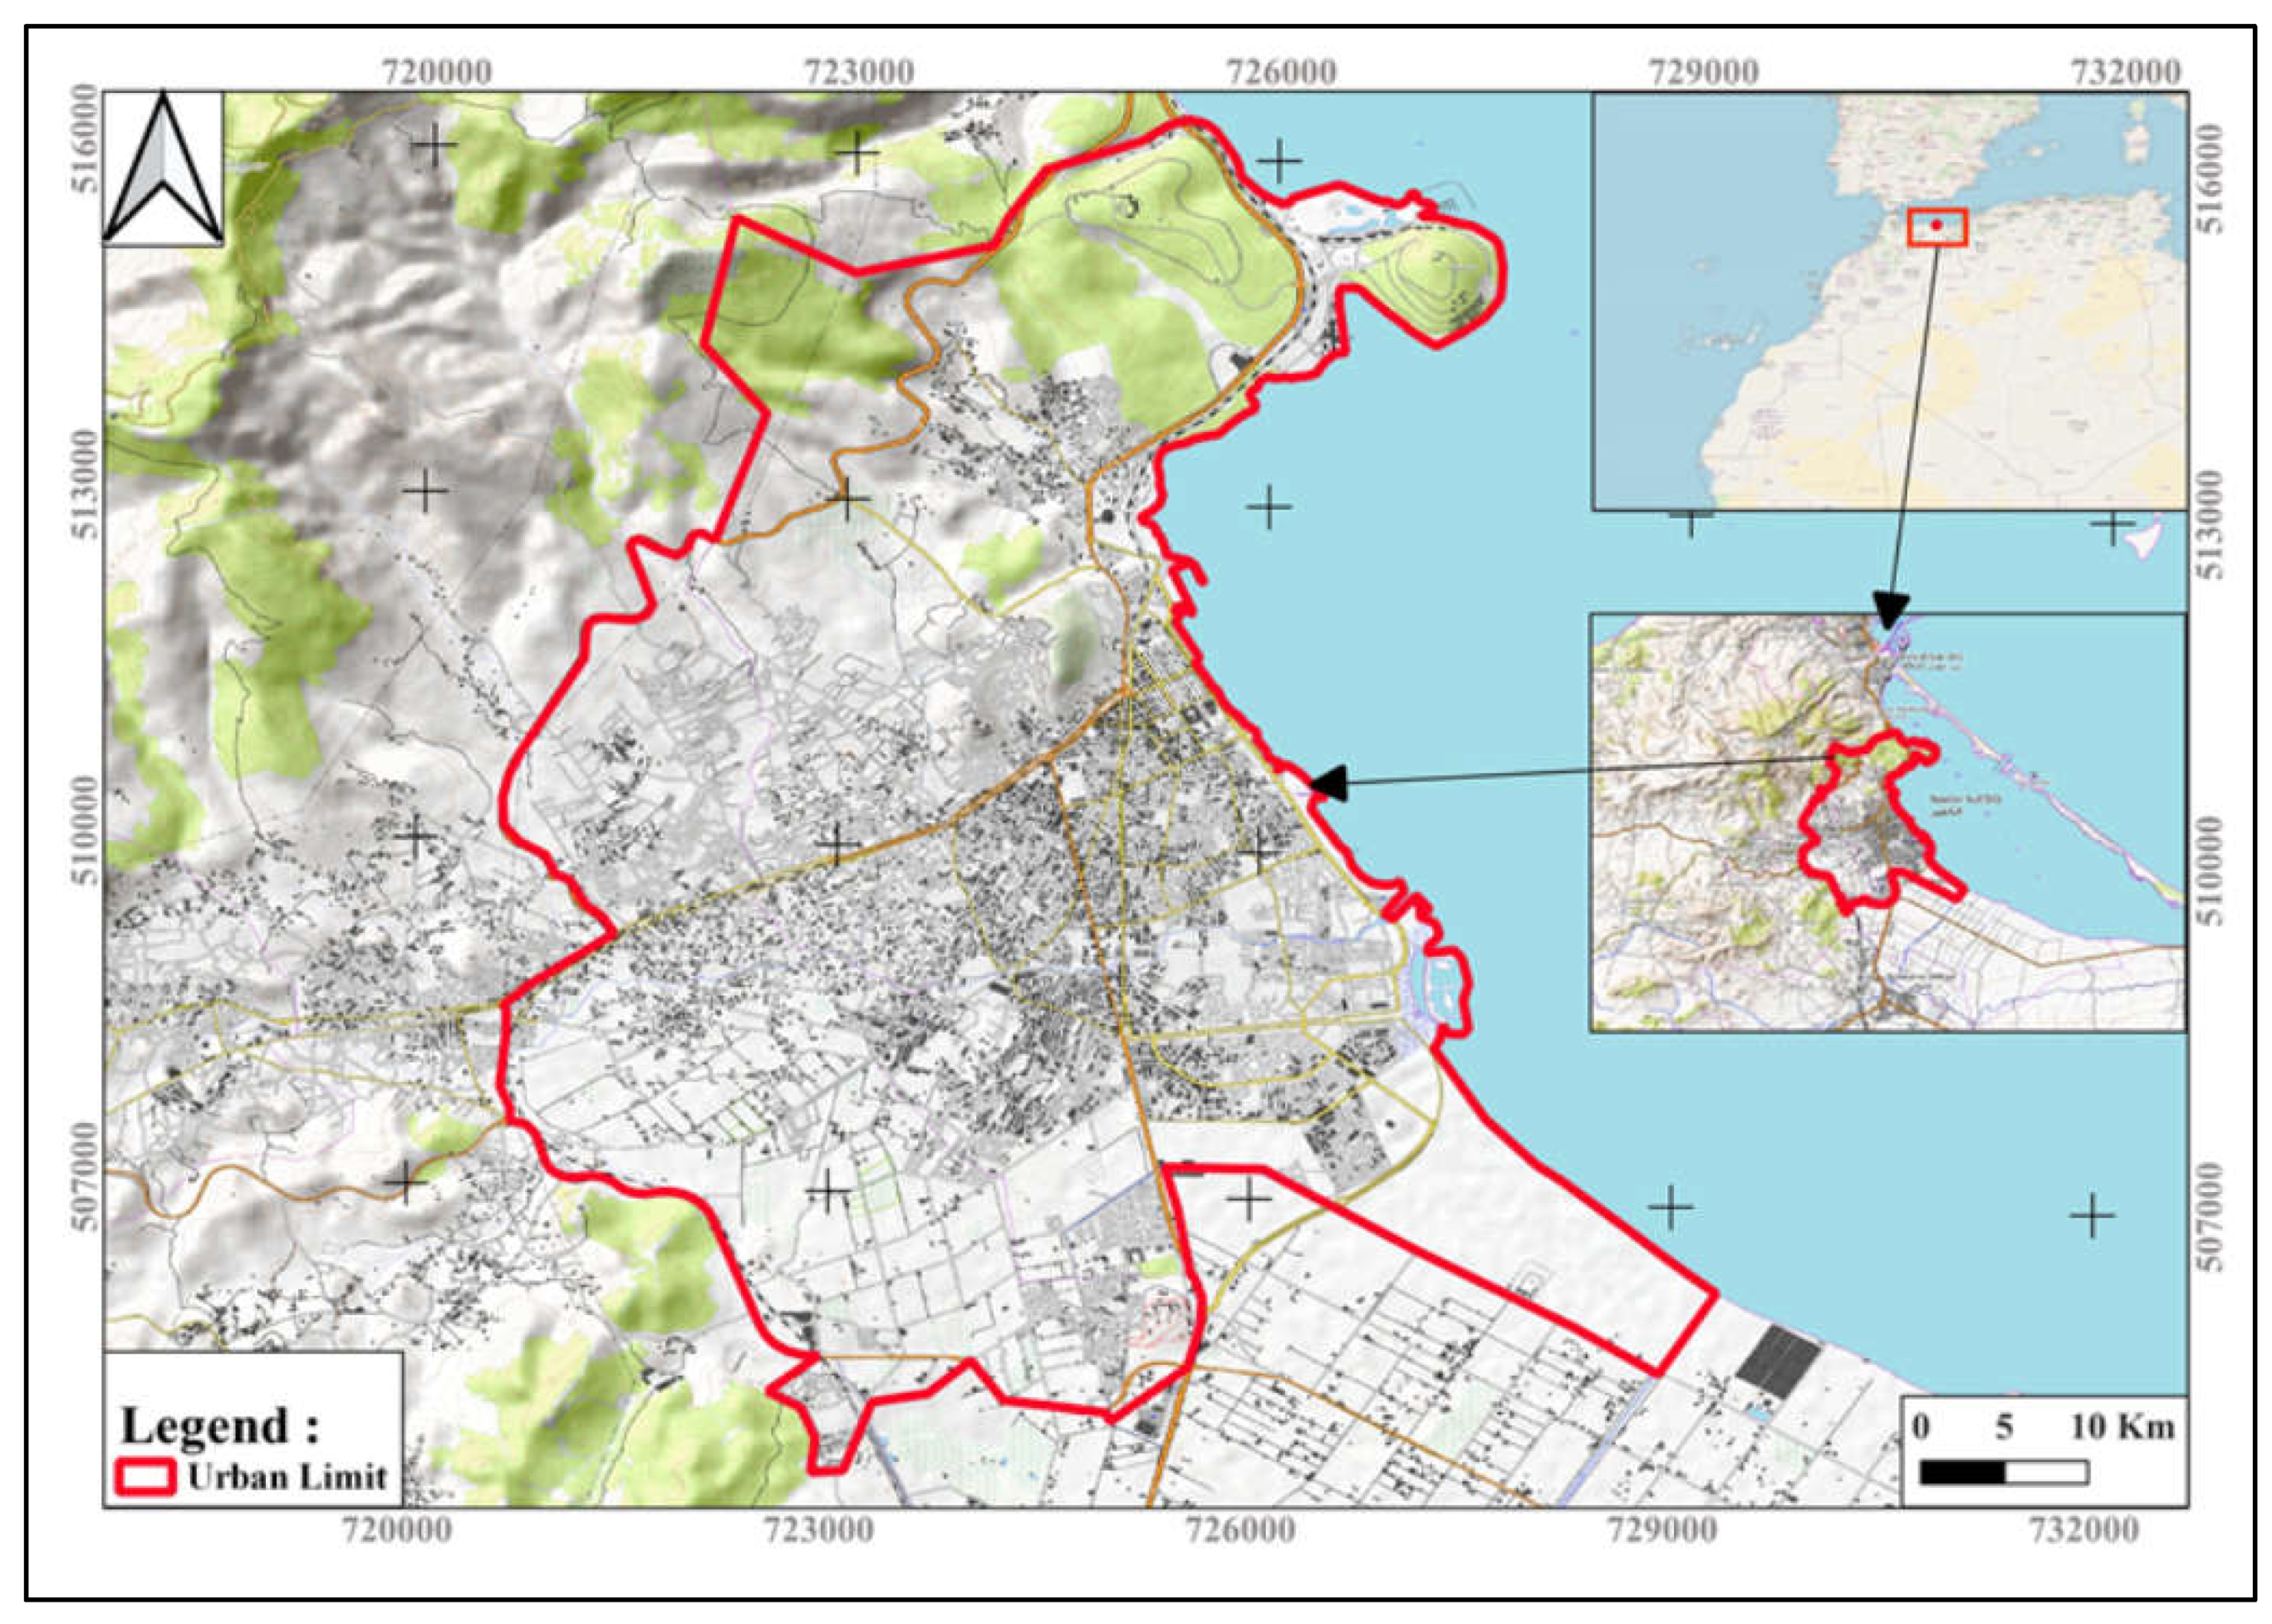
Nador, a Mediterranean city in north-eastern Morocco, is nestled between the Gourogou mountain to the west and north and the port of Beni Ensar to the west. Stretch-ing approximately 75 kilometers in a generally east-northeast to west-southwest direction, it encompasses the urban areas of Nador city, Arekmane, the Marchica dune lido and Beni N’sar city (See Figure 2 below).

2.2. Seismic Data

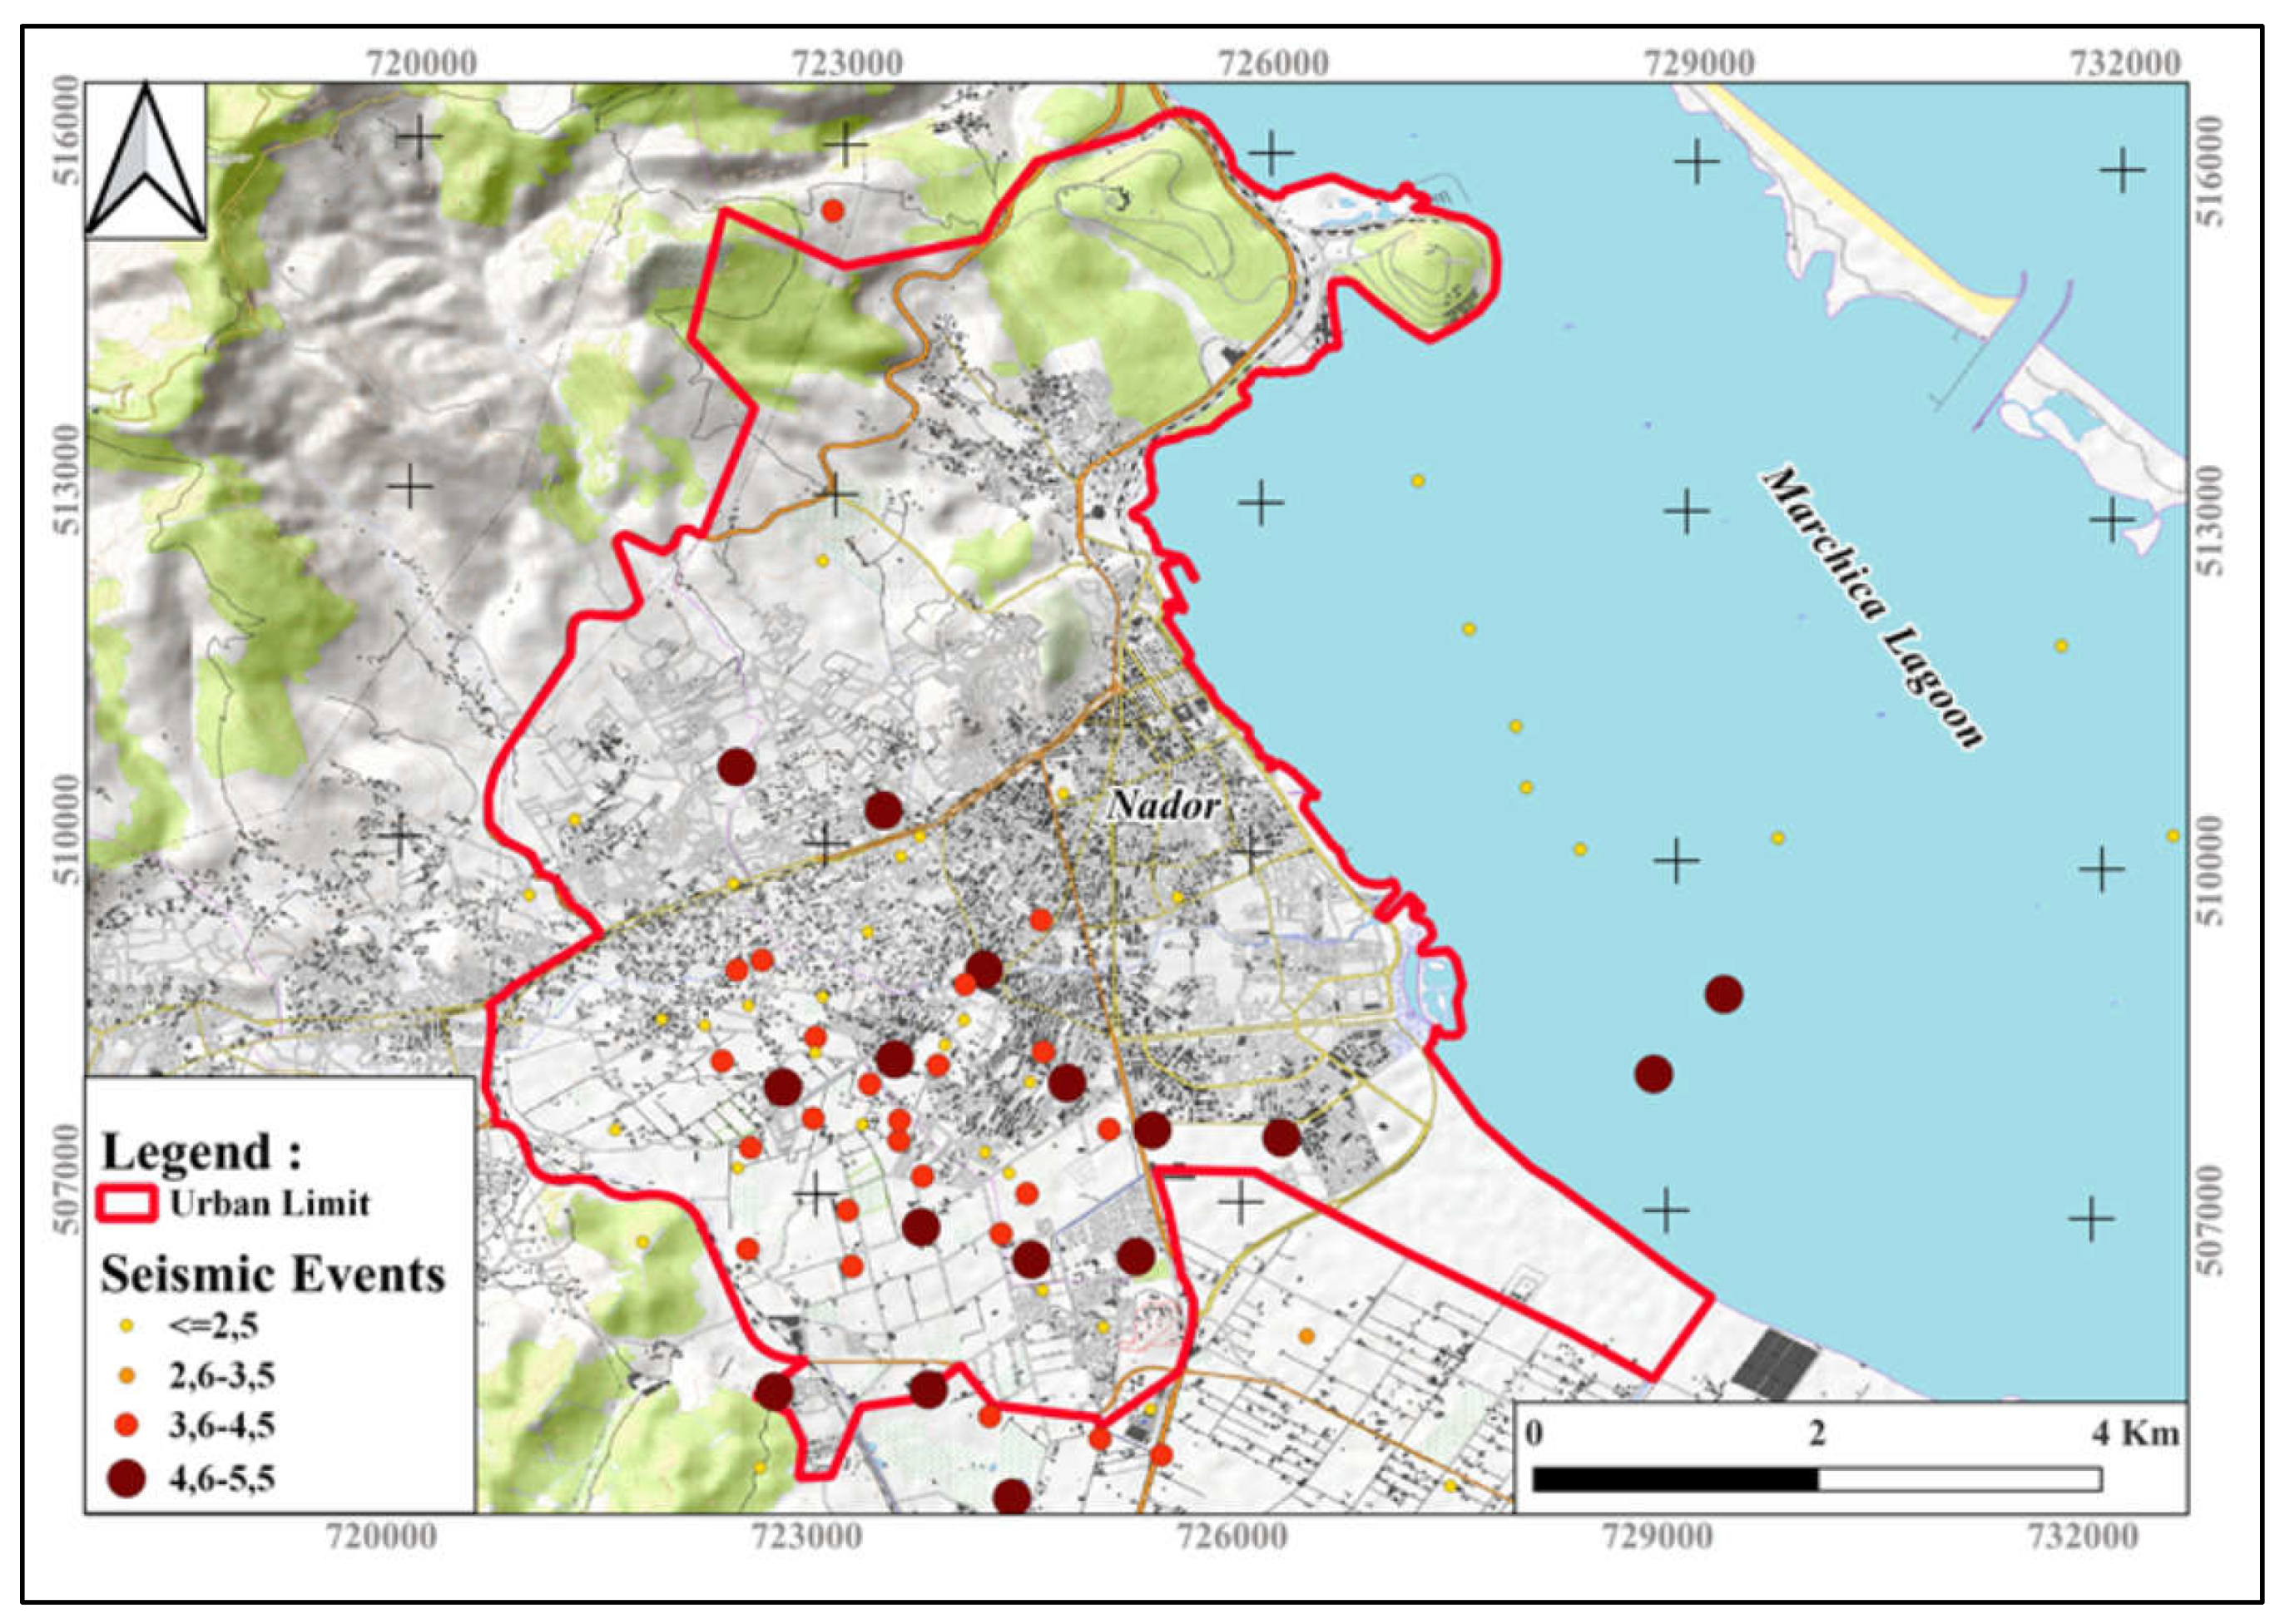
The coastal area of the Oriental region is a point of inter-plate shaking of the African continent where the Alboran plate and the continental plate of Europe interact. Indeed, several seismic activities are active on the different sites of the Saïdia-Nador coasline.
The domains of Southern Spain (Betic Cordillera) and Northern Morocco (Rif) are geodynamically linked to the Alboran domain, located between Iberia and Africa [34]. The Betico-Rifain domain, structured during the Alpine cycle [35], is divided into numerous highly fractured tectonic scales, with a great geological contrast between these units. The Rif nappes overlap the African margin itself to the South [34]. In this situation, the Betics and the Rif undergo stresses related to the north-west and the south-east oblique convergence between Africa and Eurasia, at the level of the Alboran domain [36]. The average rate of this convergence has been estimated between 3 and 5 mm/year [37,38]. The distribution of earthquakes at depth allows us to locate potentially active crustal faults (See Figure 3 below).

2.3. Geomorphologic, Stratigraphic and Geologic Data

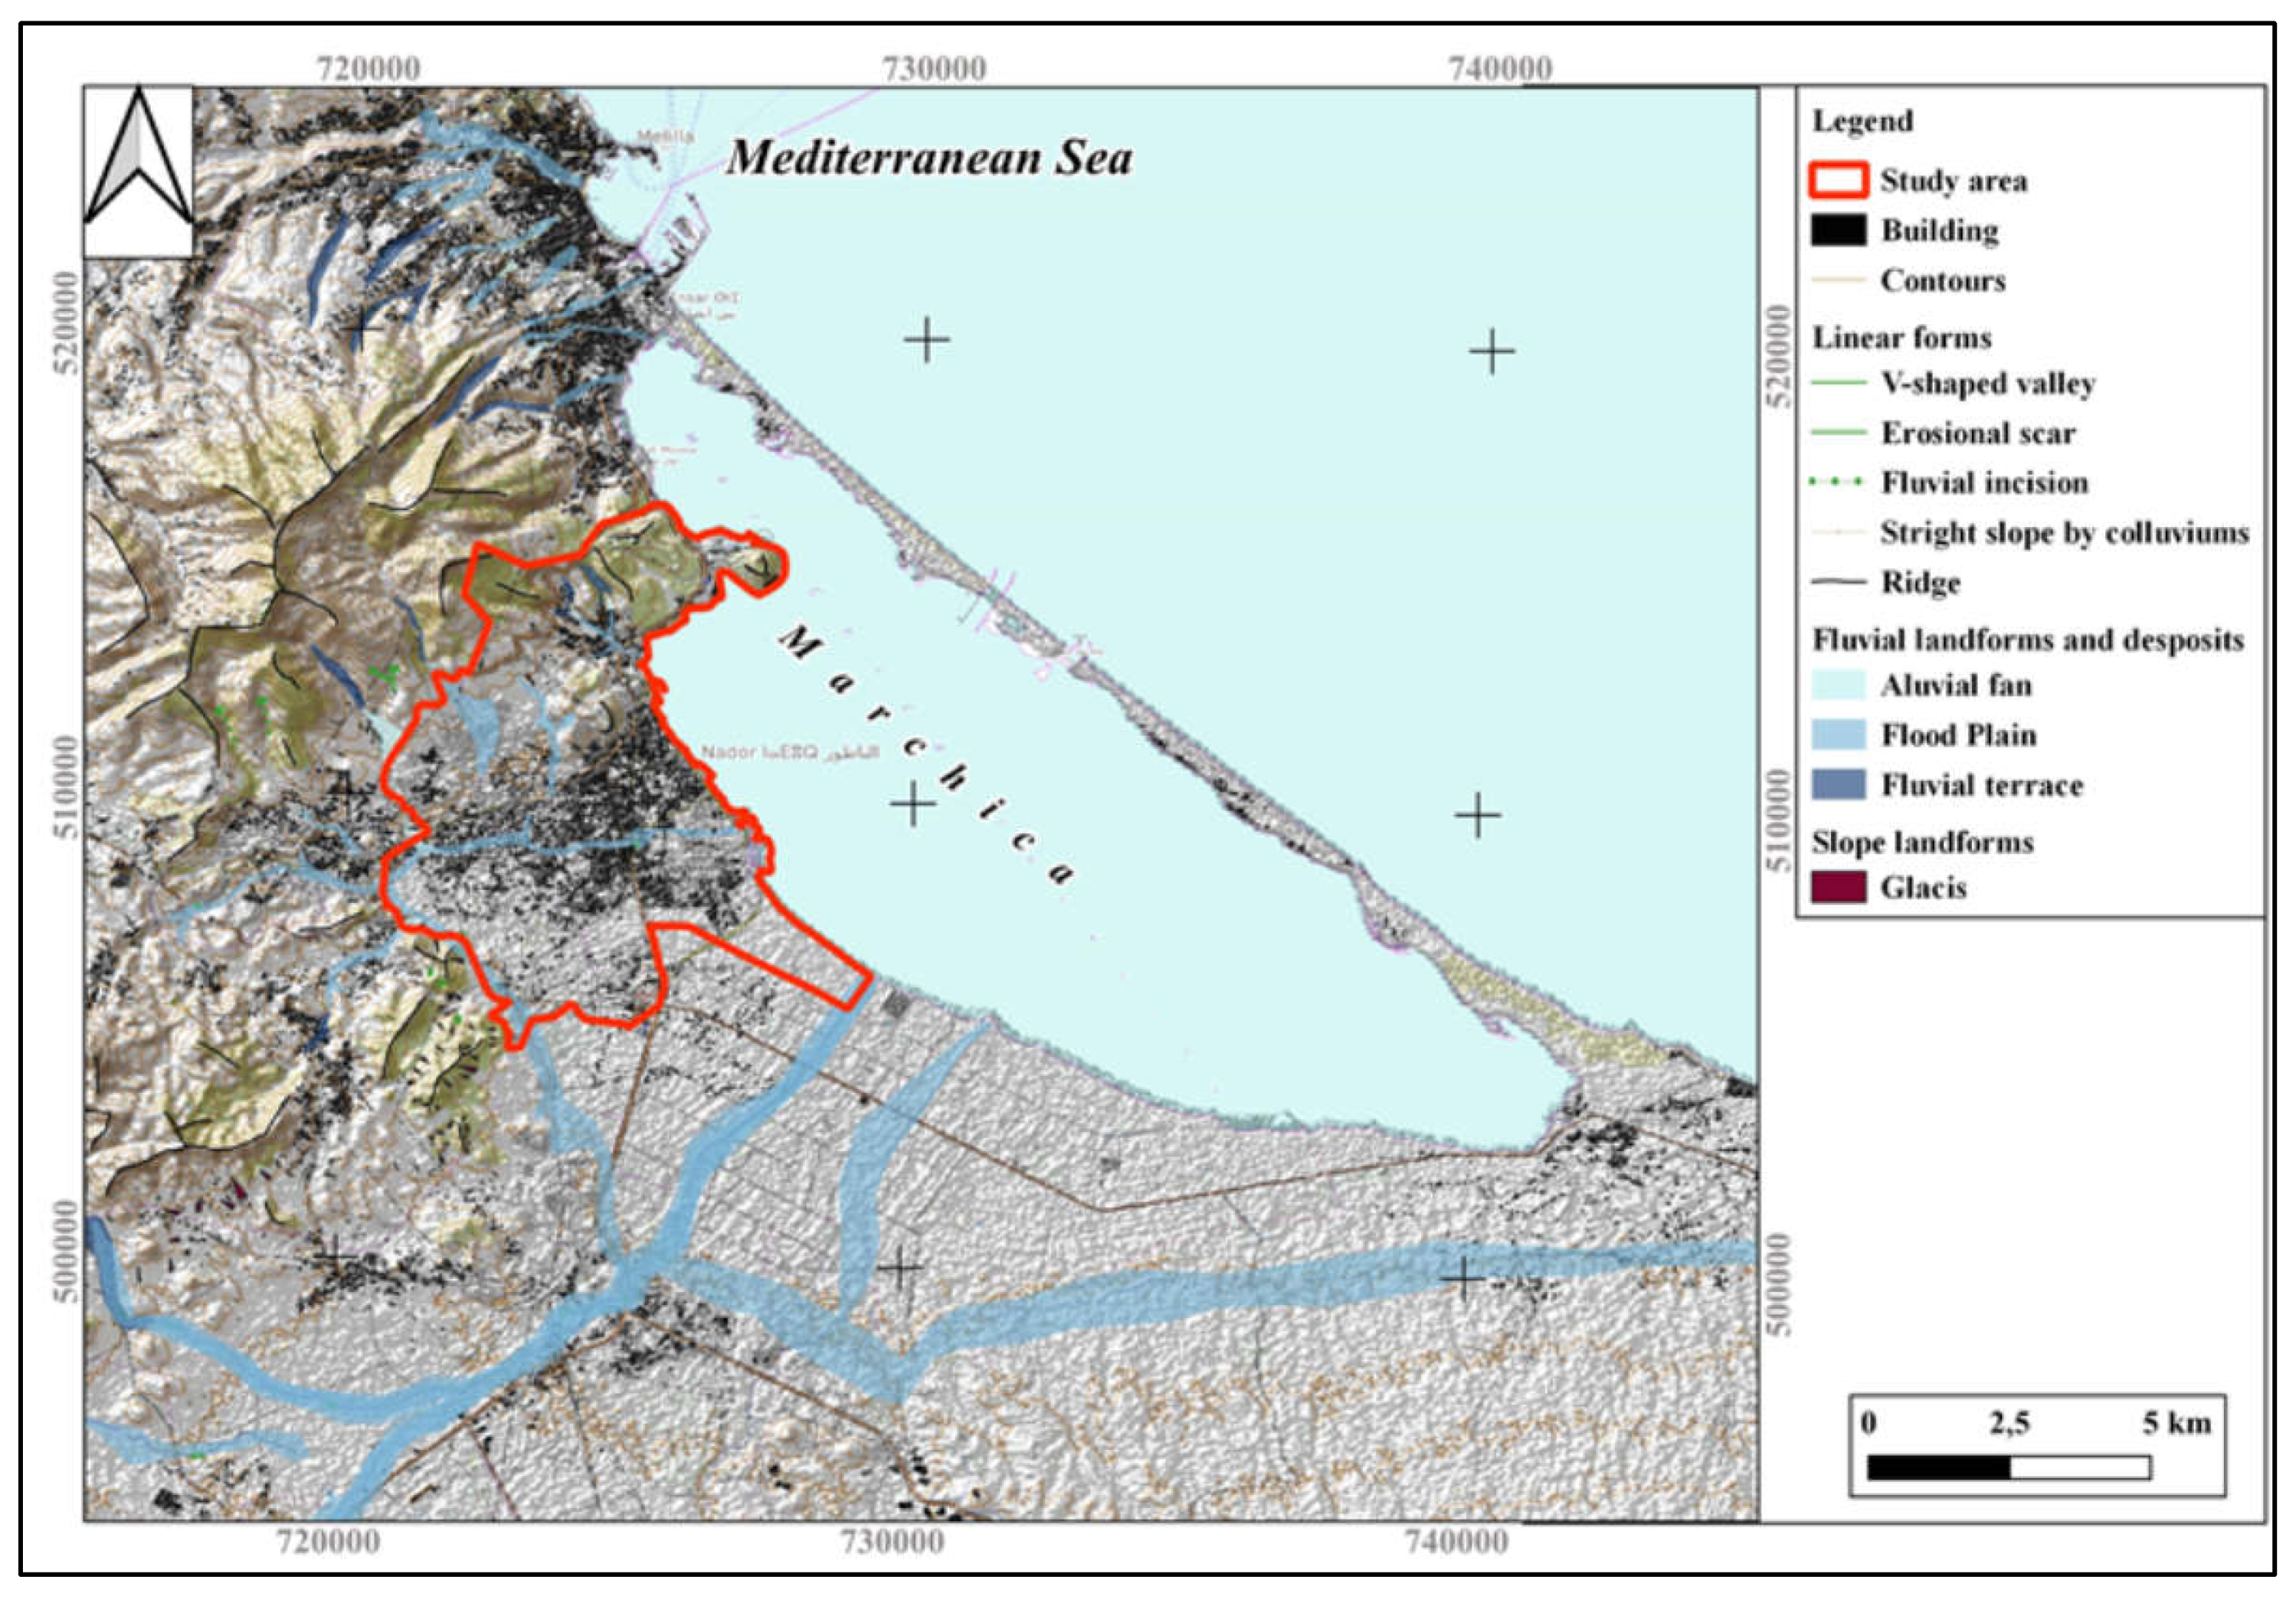
Analyzing geomorphological data in a study helps us understand past environmental shifts [39]. By examining evidence like stream networks, terraces, ancient shorelines, and slope land forms [40], we can gather clues about the tectonic activity and seismic hazards that sculpted Nador’s landscape. This analysis also allows us to evaluate slope stability, erosion patterns, and susceptibility to landslides, aiding in predicting future landscape changes and mitigating potential hazards within Nador city (See Figure 4 below).
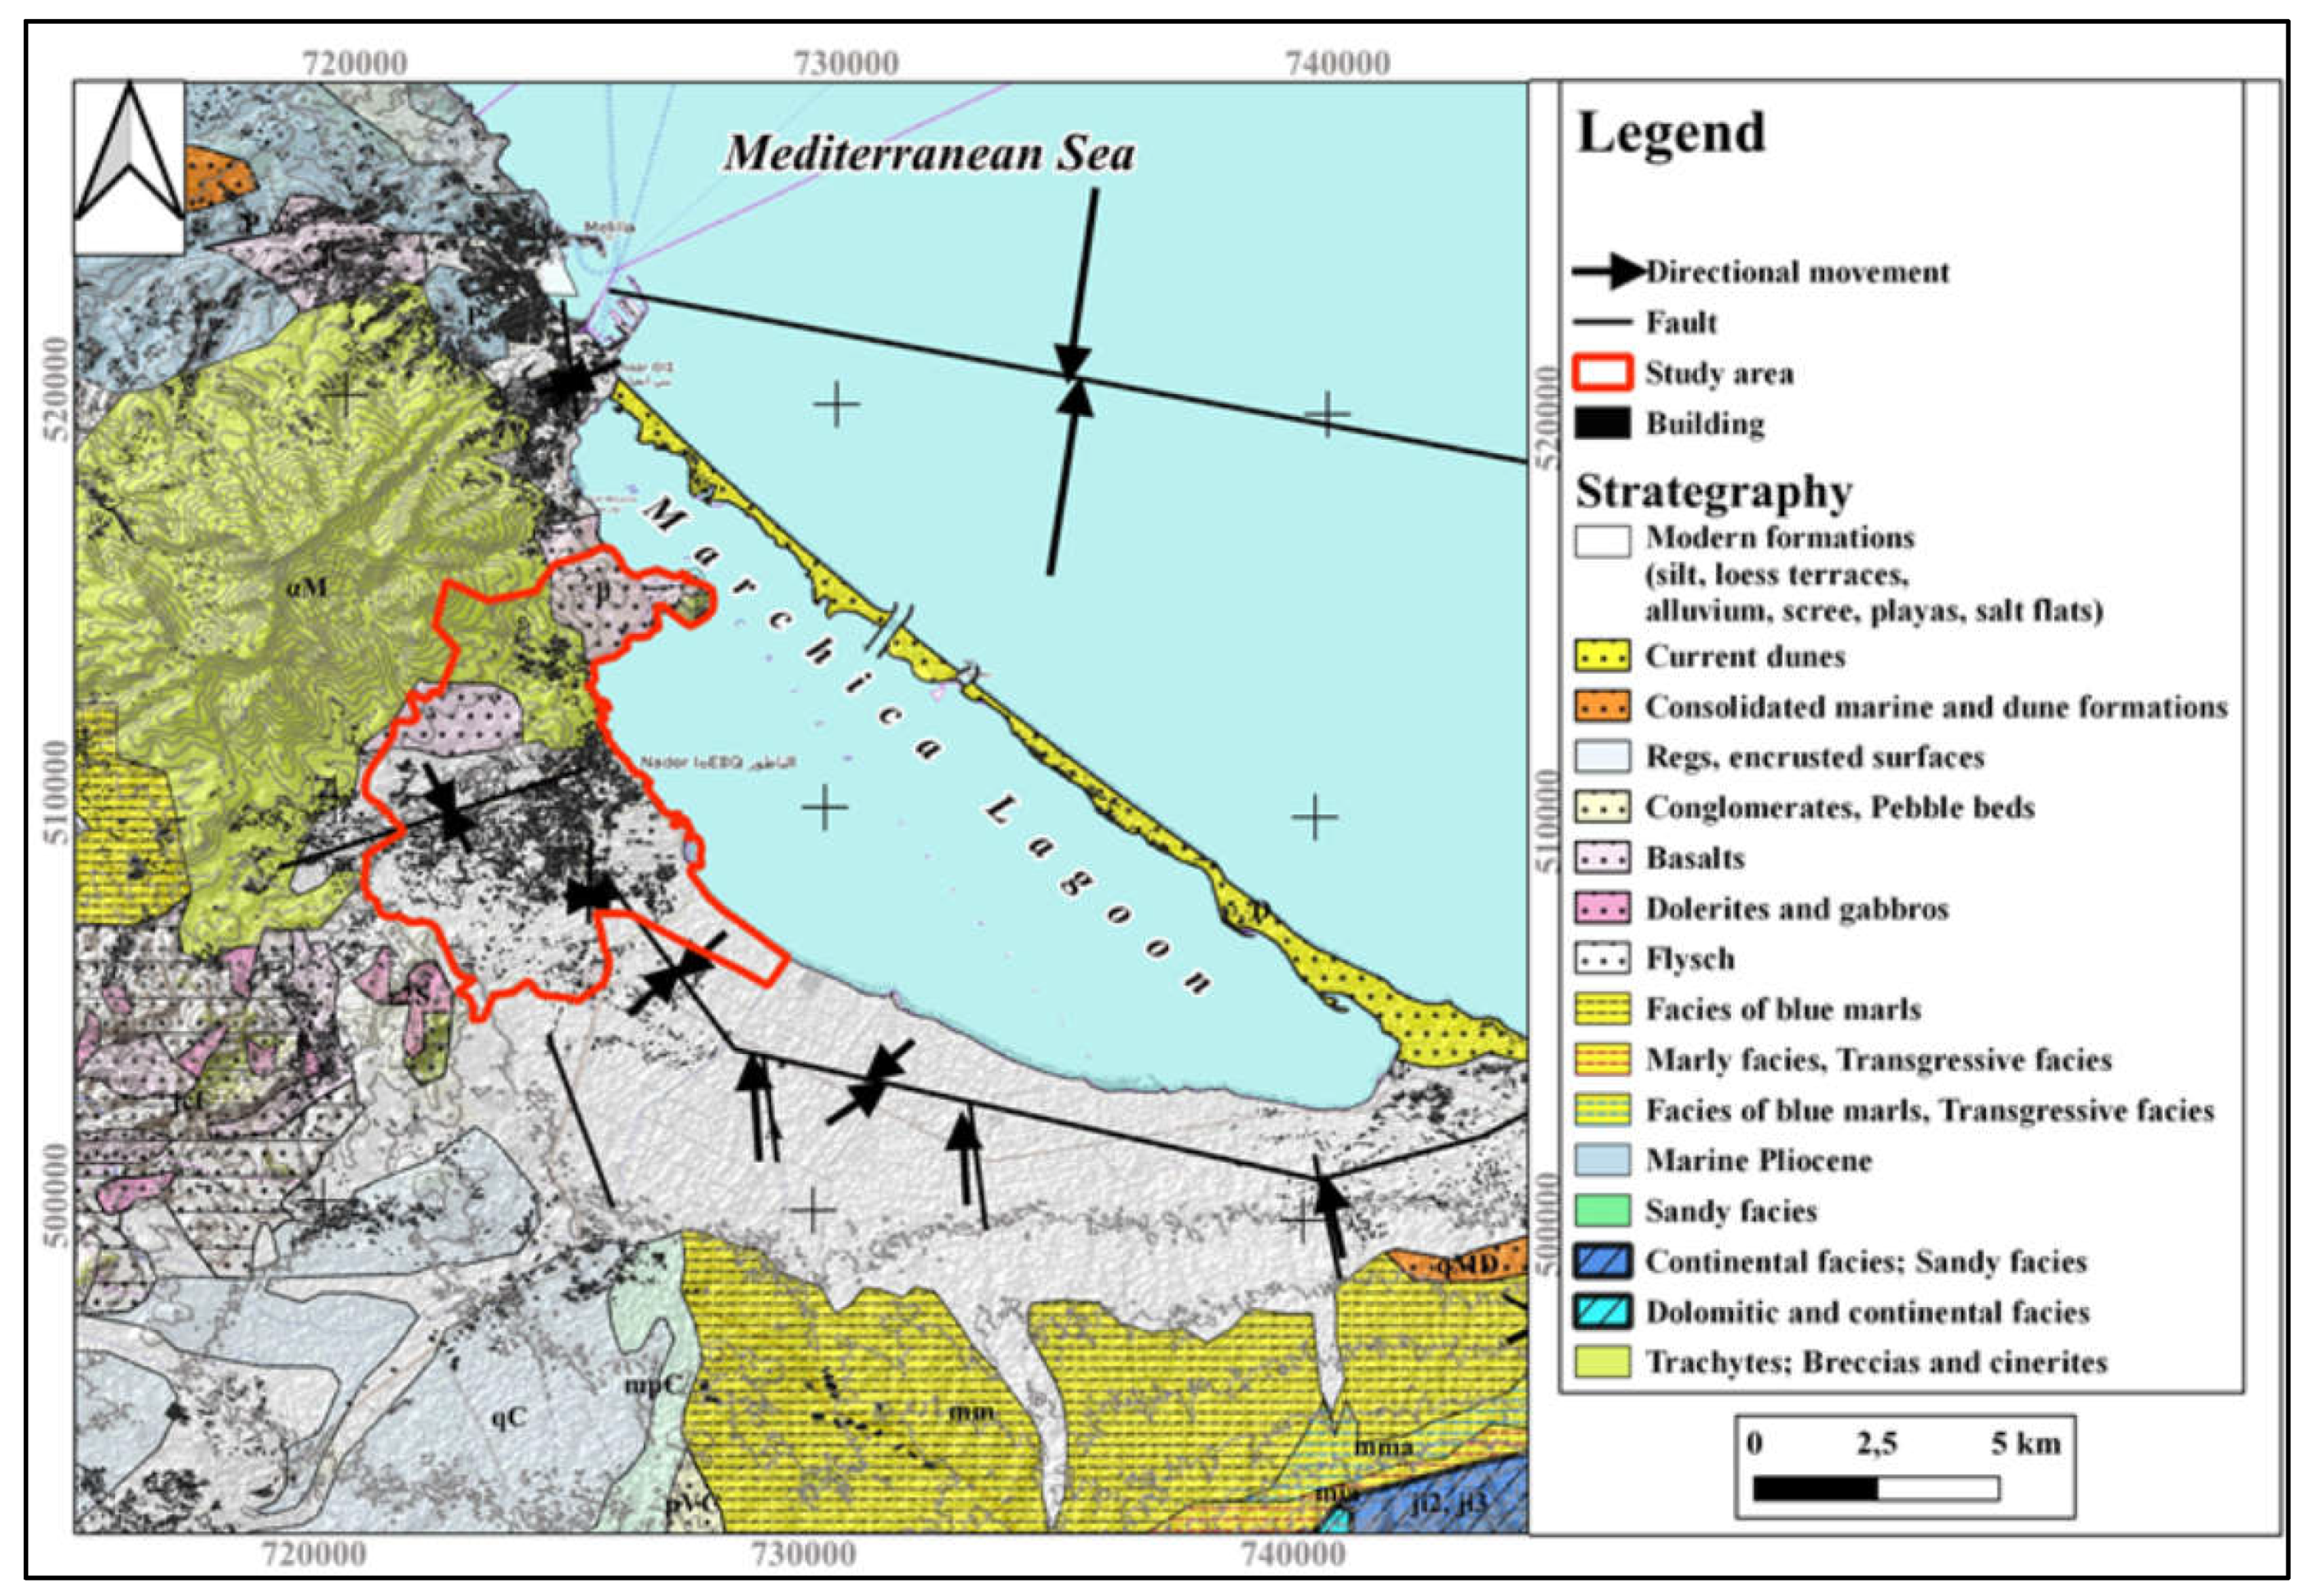
Stratigraphic data, on the other hand, enriches our understanding of ground stability and helps identify areas suitable for urban planning based on building engineering regulations. By studying the sequence of layered rocks, stratigraphy offers a window into the history of the underground rock formations [41] (See Figure 5 below).
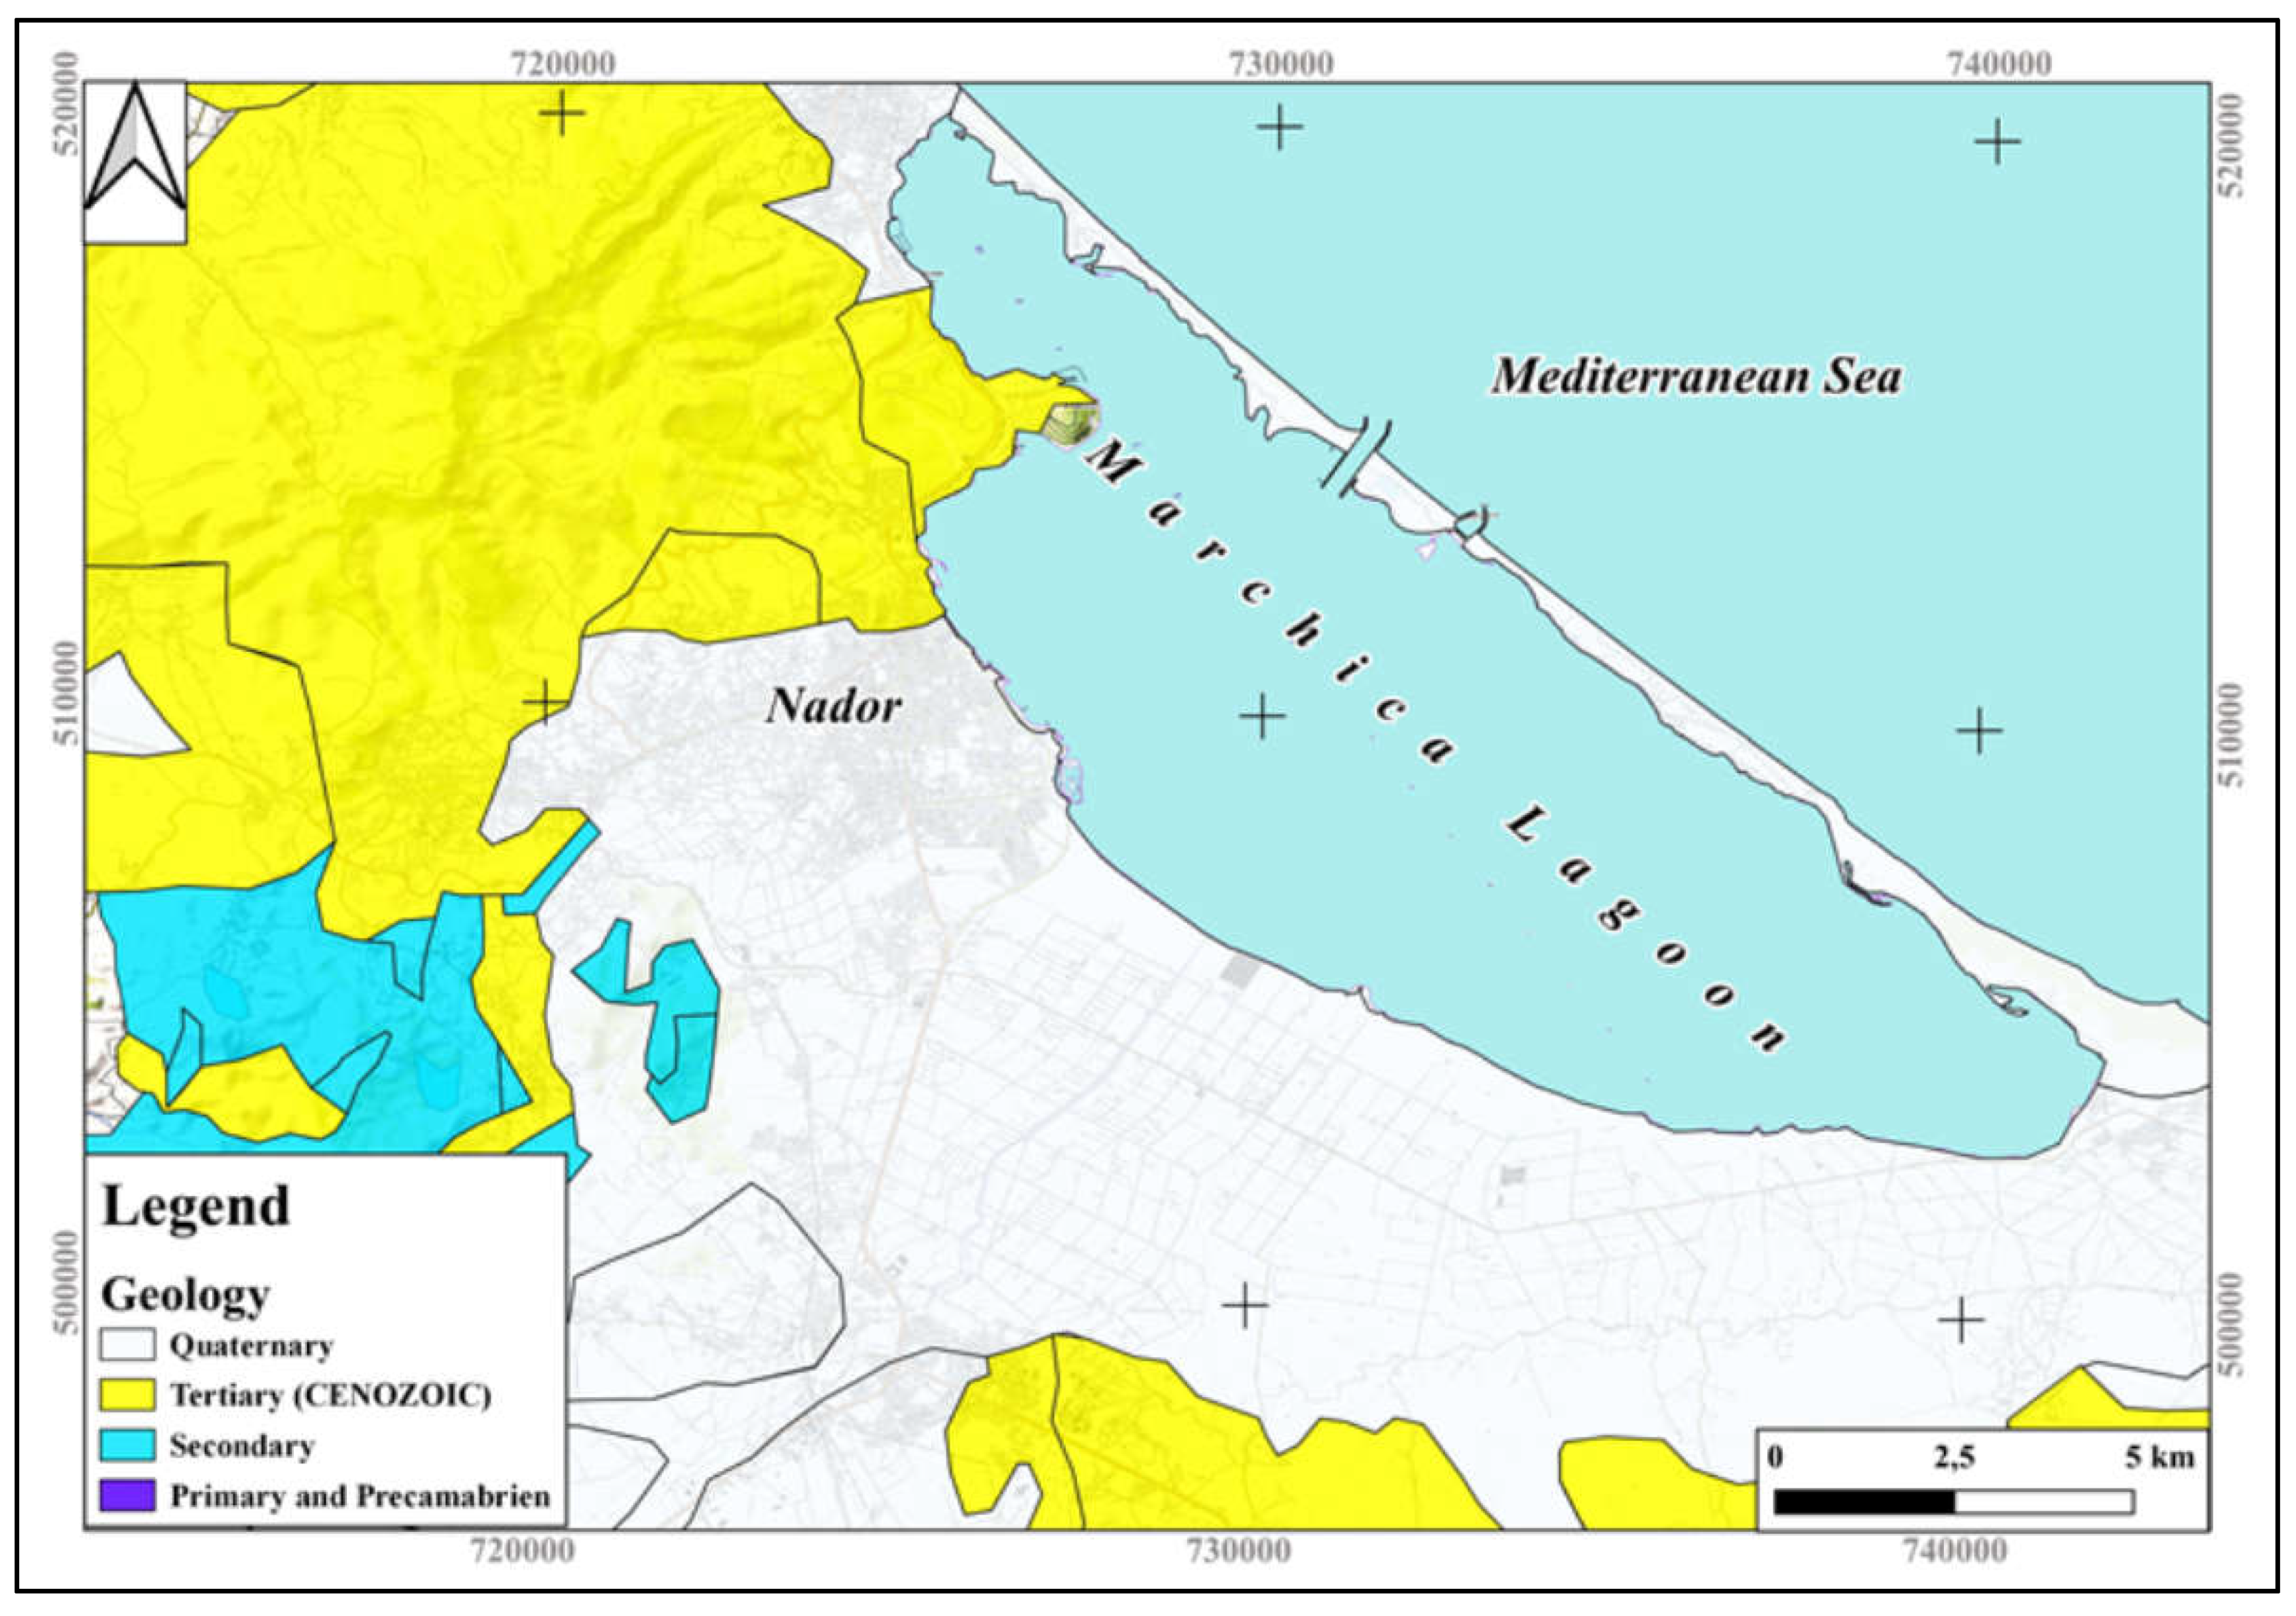
Geological data, encompassing a broader range of information, provides details about the Earth’s features, structures, and processes within Nador. Identifying the types of rocks and minerals, along with seismic activity and gravitational measurements, reveals valuable information about the region’s geotechnical history and past seismic events [42] (See Figure 6 below).

2.4. Topography Data

The topographic Map of Nador (1/50,000 Scale) provides detailed information about the elevation and terrain features within the Nador study area. Topographic maps are essential tools for understanding landscape variations and serve as a valuable baseline for further analysis [43].
Shuttle Radar Topography Mission (SRTM) Data, acquired during the joint mission between the National Geo-spatial Intelligence Agency (NGA) and the National Aeronautics and Space Administration (NASA) provided comprehensive digital elevation model (DEM) coverage for the entire study area. SRTM data is particularly valuable for its near-global coverage and high-resolution elevation information, making it a crucial resource for various topographic studies.
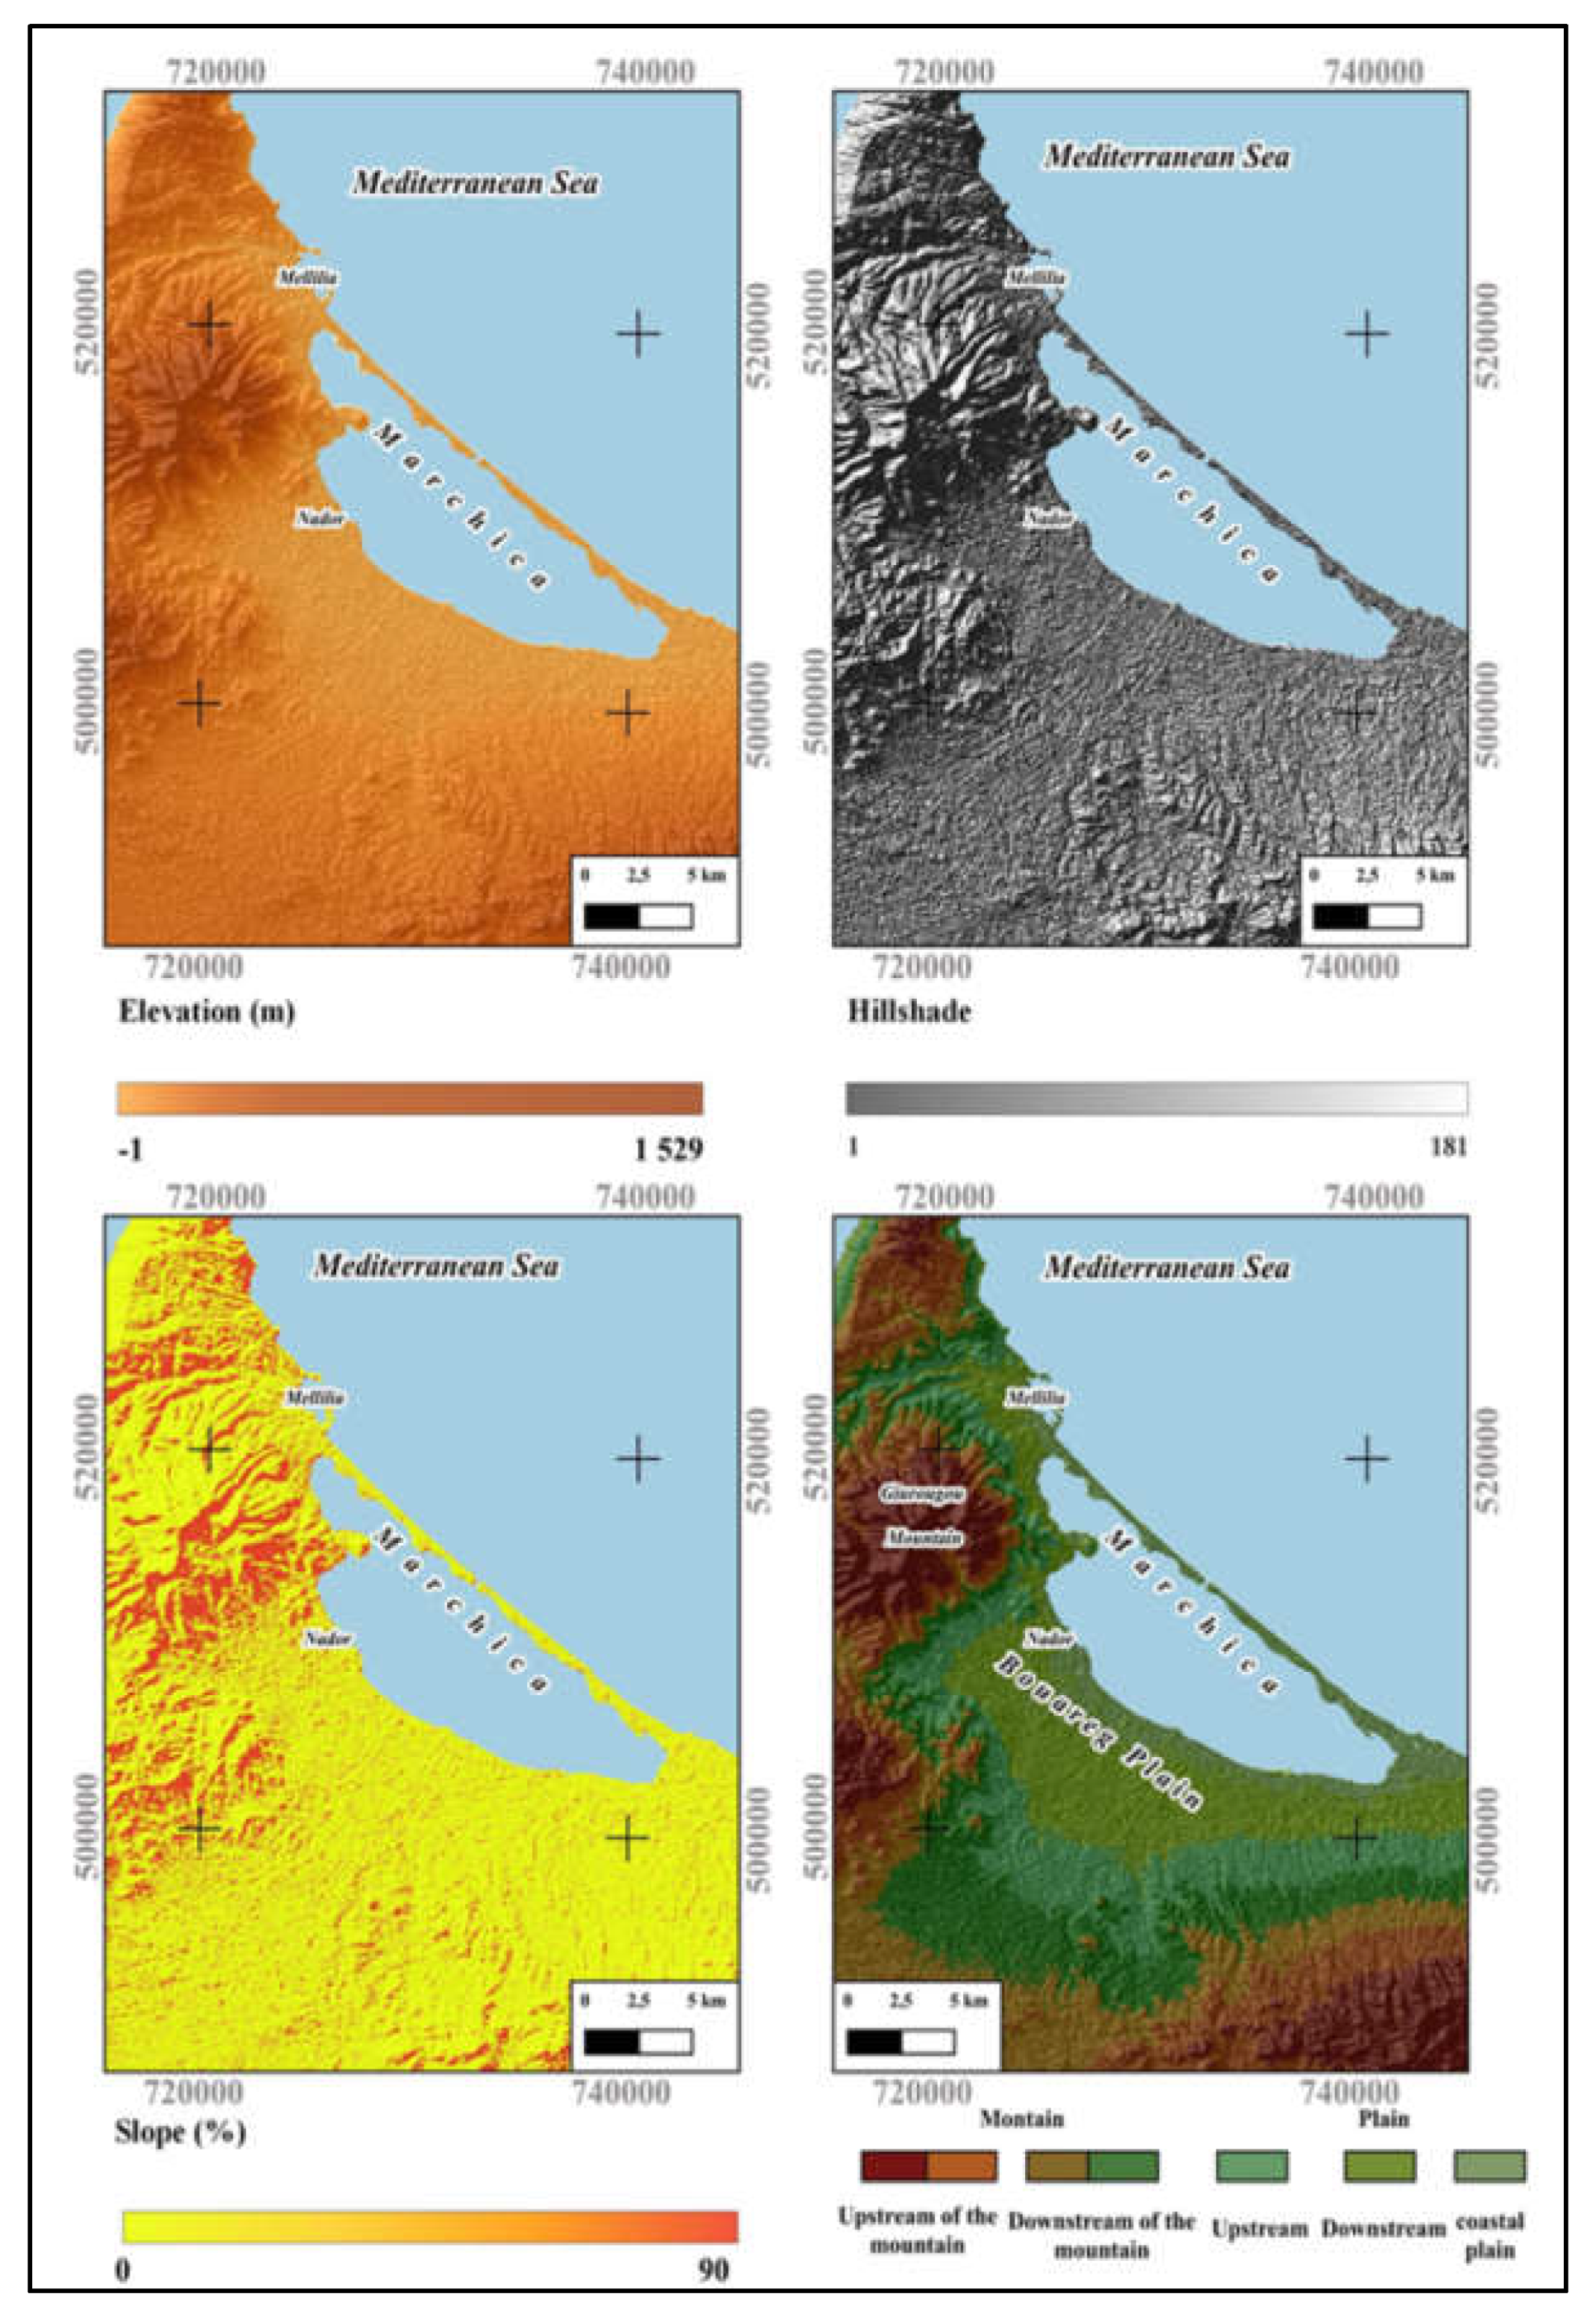
This data helps us understand the topographic landscape, including factors like elevation, slope and hillshade. These topographic factors play a crucial role in identifying areas susceptible to landslide risks during earthquake events (See Figure 7 below).
Figure 7 presents a comprehensive visualization of the Nador region’s topography, incorporating several key elements. Elevation variations are depicted using a color gradient, with higher areas shown in darker browns and lower plains in lighter yellows transitioning to white, allowing for quick visual identification of mountainous regions and plains. Hillshade adds a three-dimensional texture, highlighting slopes and ridges, revealing subtle variations in topography beyond elevation data. Additionally, explicit slope percentages provide a precise understanding of steepness, crucial for land-use planning, infrastructure development, and hazard assessments like landslide risks. While the specific details of “topographic unity” are not directly evident, it likely refers to the overall uniformity of land forms within a region, such as consistent slope angles, prevalence of specific features (mesas, buttes), or repetitive ridge and valley patterns.
Key observations from the figure include the mountainous region’s steep slopes exceeding 20% (darker tones and steeper labels), suggesting rugged terrain. In contrast, the Bouareg plain exhibits a significantly flatter slope ranging from 0 to 15% (lighter tones and gentler slopes), indicating a more level area potentially suitable for development or agriculture.

2.5. Land Cover Data

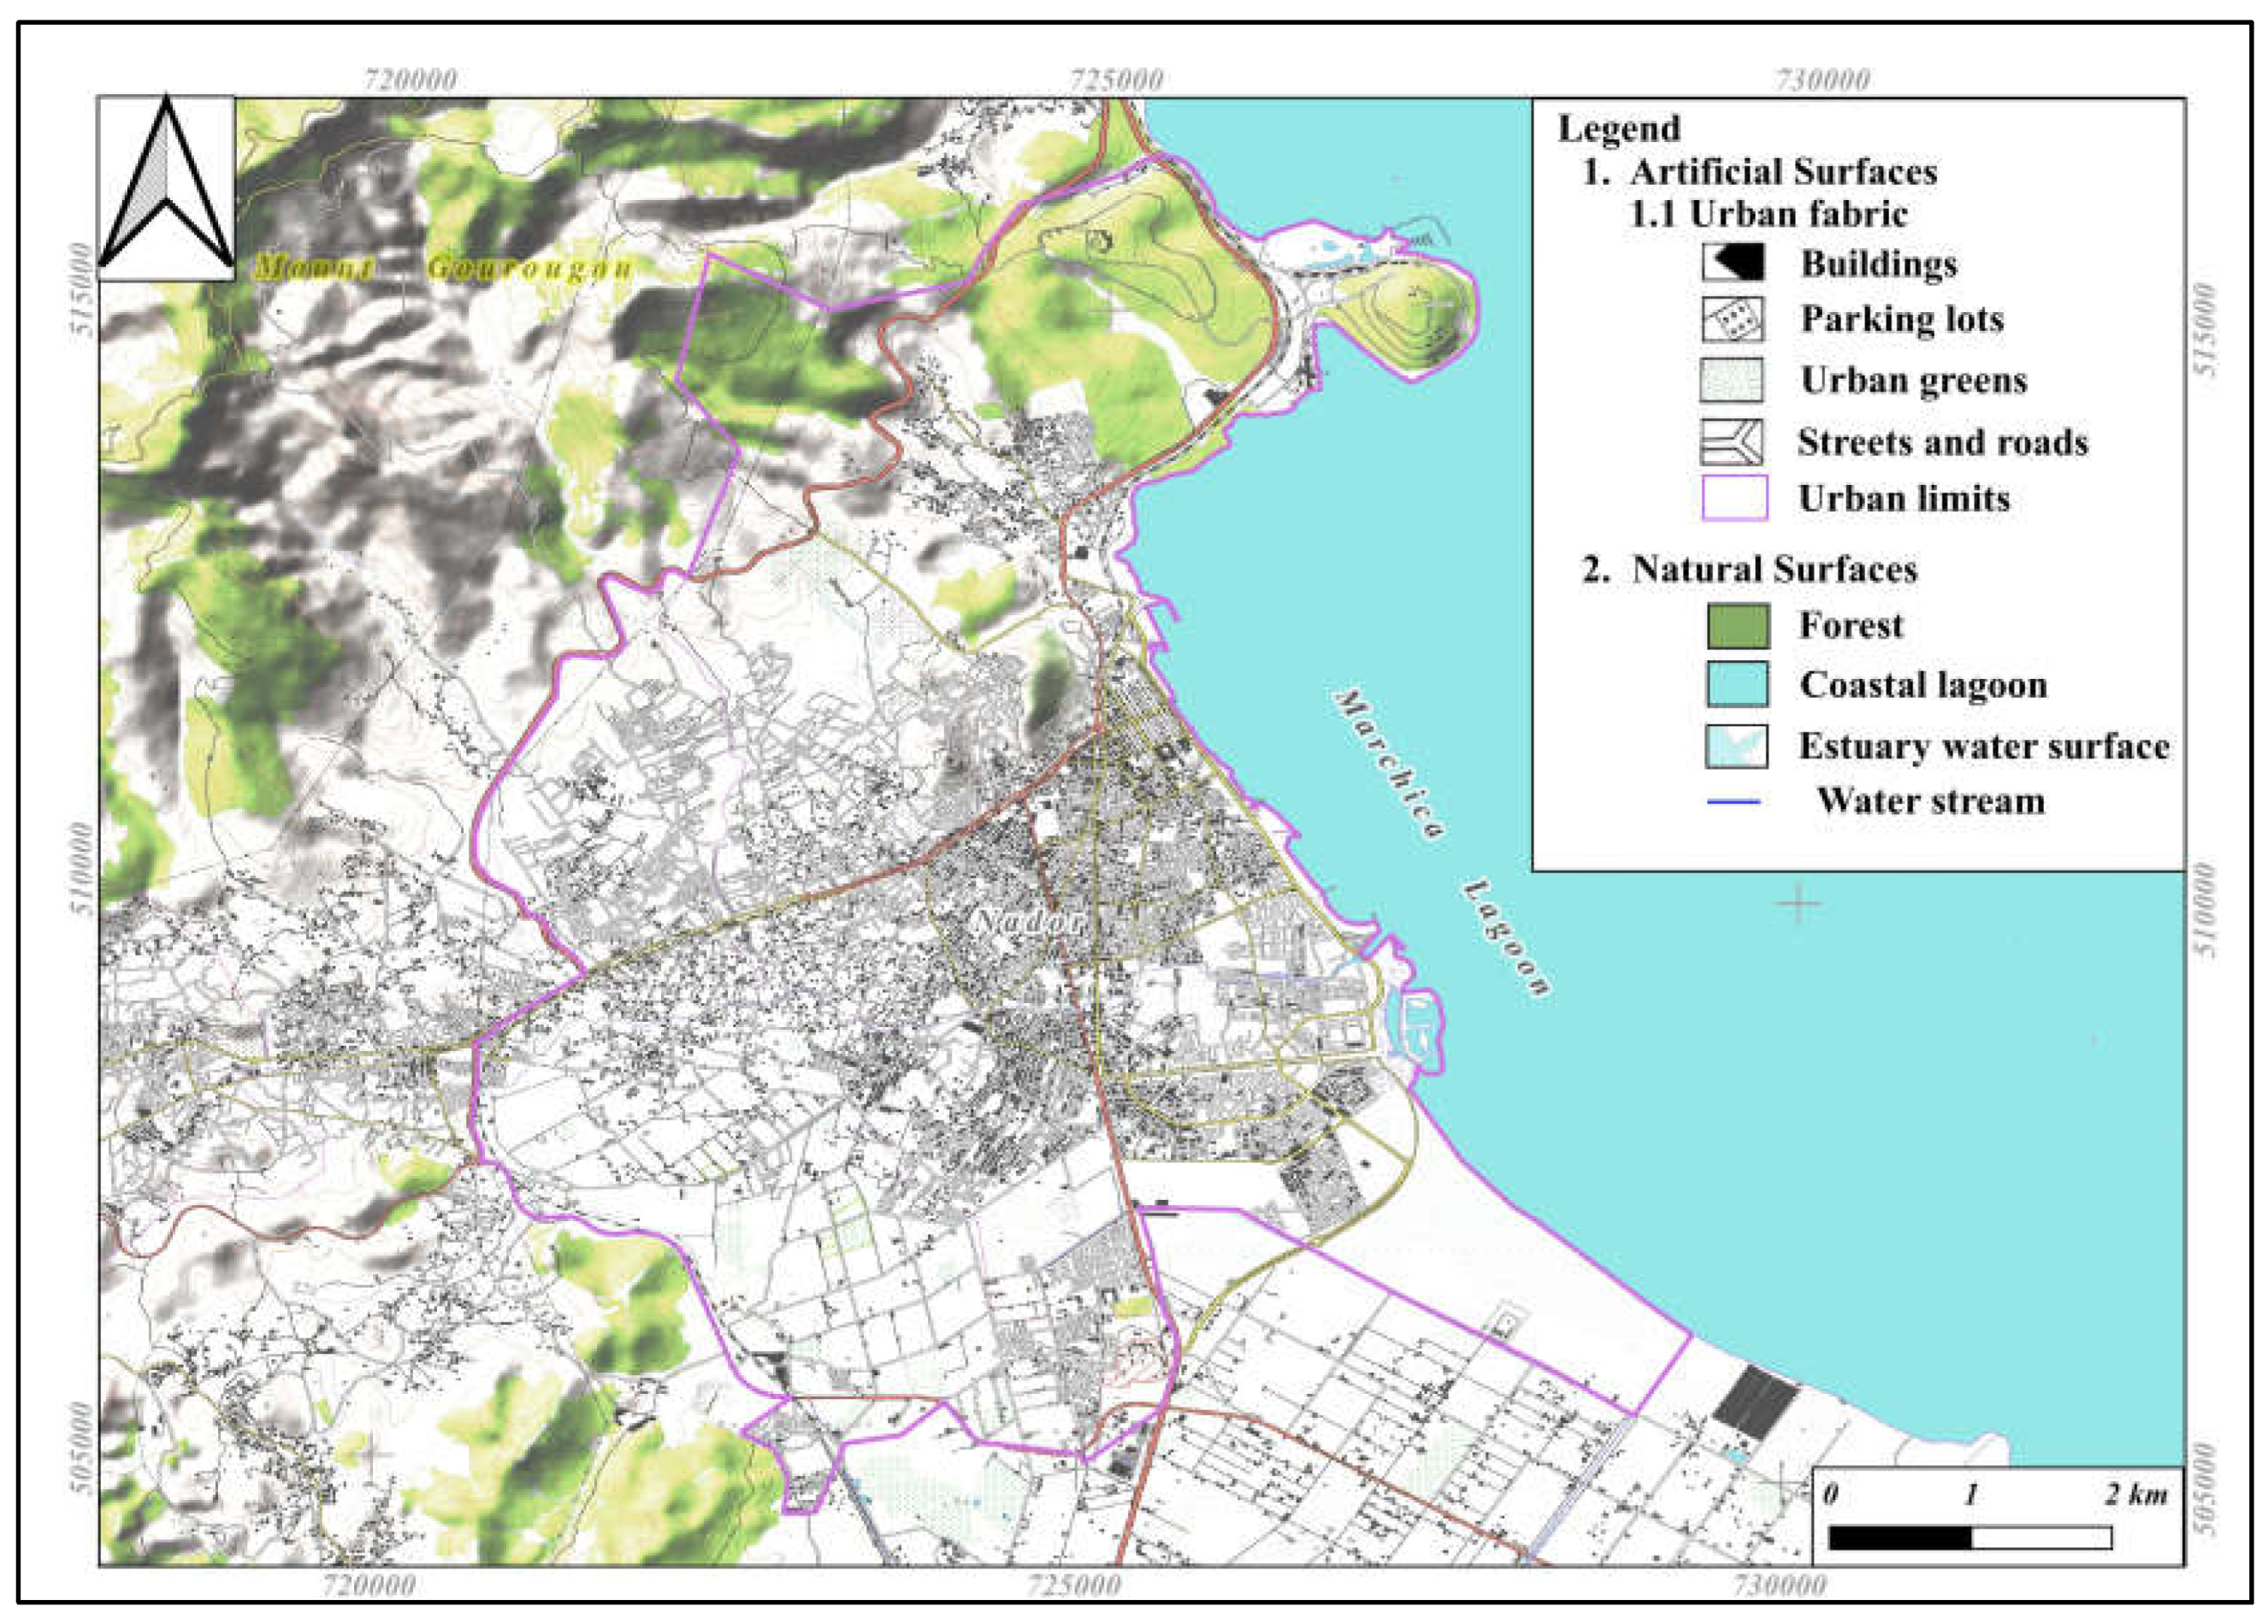
The data from Marchica planning plots with a spatial scale of 1:5000 cm was obtained and used as a reliable source to accurately assess and analyze the land cover with-in the study area. The planning plots data provided the possibility of time highest detailed information about urban area around Marchica Lagoon. Additionally, Participatory Learning and Action techniques were applied to gain a deeper understanding of the land cover conditions and constraints, specifically related to urban and environmental awareness. A geophysical survey was also conducted in Nador city to examine the use of open spaces and the boundaries of anthropogenic activity. The Figure 8 provided below is established based on land cover plots, satellite imagery, topographic map and urban planning document.
The Figure 8 is created based on Corine land cover rules. The Corine Land Cover (CLC) methodology establishes a standardized set of rules for symbolizing and mapping land cover changes across various detection and interpretation activities [44]. This data set serves as a crucial reference for decision-makers, providing insights into spatial dynamics at multiple scales [45].
This mapping approach, encompassing forests, urban areas, wetlands, and more, is valuable for assessing seismic risk. By identifying vulnerable areas with land cover data, it can pinpoint locations susceptible to earthquake damage. For instance, buildings on loose soil are more prone to shaking compared to those on bedrock. Furthermore, Corine Land Cover data is primordial for emergency planning, allowing for assessments of potential infrastructure damage and prioritization of areas requiring emergency response after an earthquake. So, incorporating land cover data into risk modeling helps scientists create more accurate models to predict potential earthquake impacts (See Figure 8 below).

2.6. Method for Estimating Seismic Risks Intensity

Seismic risk intensity estimation involves a comprehensive approach integrating seismic hazard analysis, vulnerability assessment, and exposure analysis. Generally, seismic intensity measures are divided into continuous (seismic acceleration, velocity, and response spectrum) and discrete (macroscopic seismic intensity) types [46]. Initially, seismic hazard is evaluated, considering historical data and geological studies to determine earthquake probabilities and potential ground shaking. Concurrently, vulnerability assessment examines the susceptibility of structures and populations to seismic hazards, analyzing the construction quality and fragility of various elements. Exposure analysis identifies elements at risk, such as buildings and critical infrastructure, accounting for population density and economic assets. Integrating these assessments yields an overall seismic risk intensity estimation. Visualization through risk maps aids in the communication of results to decision-makers and the public, facilitating informed mitigation strategies including infrastructure strengthening, land use planning, and emergency preparedness. This holistic approach aims to reduce the impact of earthquakes on communities and infrastructure.
Many scientists have developed a statistical model of seismic intensity measures. Li SQ. (2024) considered the impact of multiple seismic risk factors on structural seismic risk, and vulnerability and proposed a ground motion prediction equation considering site conditions for large-scale seismic risk assessment [47], as expressed in equation (1) below:
log I M a , b = E [ log I M a , b μ r , m ,   θ i ,   ]   +   η b   + ε
This equation represents the seismic intensity ( I M a , b ) measured under the influence of earthquake hazard (b) and site feature (a). The term E [ log I M a , b μ r , m , θ i , ] represents the mean of the logarithm of the intensity measure (IMa,b) considering the distance (r) between the source and the site and the characteristic site parameter (θ). The terms θi, ηb and ε represent the internal event residual values and zero mean Gaussian residual coefficients affected by earthquake hazard (b), respectively.

2.7. Method to Evaluate Vulnerability Index

The Socioeconomic Vulnerability Index (SVI) is a tool that can be used to measure the vulnerability of a coastal area in terms of its socioeconomic development [47,48]. It is considered an index that reflects the intensity of each parameter on the territory and population of the coastal zone of the northern part of the Oriental region.
Vulnerability index method helps evaluate the impact of earthquake hazards on humans and goods. This indicator assesses the impact levels. his indicator assesses the impact levels. Understanding vulnerability help to analyze spatial extension and how can urban areas be managed to enhance their resilience and ensure the safety of citizens and their property. The evaluation of vulnerability index is based on equation (2). As proposed by Iervolino I. et al. (2023), a higher value of score signifies higher vulnerability. After normalization of all variables between 0 (least vulnerable building) and 1 (highly vulnerable building), the vulnerability index was calculated for the urban sector in Nador city by integrating the score of seismic intensity variable ( V I C l a s s ) [49].
V I B u i l d i n g = V I C l a s s + M R + j = 1 n V m j
The vulnerability index ( V I B u i l d i n g ) corresponding to the class of built-up area considers a regional modifier based on building age and land characteristics (topography, soil, slope, geomorphology, and geology) that influence the seismic performance of the area.
In the case of Nador city, the regional modifier was determined based on historical earthquake data and set to zero. Applying the vulnerability index method helps identify the main urban areas susceptible to seismic hazards.
Our model, based on building type, age, and building position within its environment, was used to map the urban vulnerability index in Nador (See Table 1 below). We conducted a deep analysis of building characteristics and their positions within the environment.

3. Results

The results reveals that the frequency of the interactions between continental features and the Mediterranean drive the release of energy as seismic events [50]. Nador’s foundation rests upon a precarious amalgamation of sedimentary and alluvial rocks, including silt, alluvium, and salt flats. These loose and unconsolidated materials lack the robustness of harder rocks, rendering them more prone to ground shaking during seismic activity. Furthermore, their susceptibility to liquefaction exacerbates the risk, as saturated sediments can transition into a fluid-like state during earthquakes, causing structural damage and ground instability.

3.1. Seismic Intensity

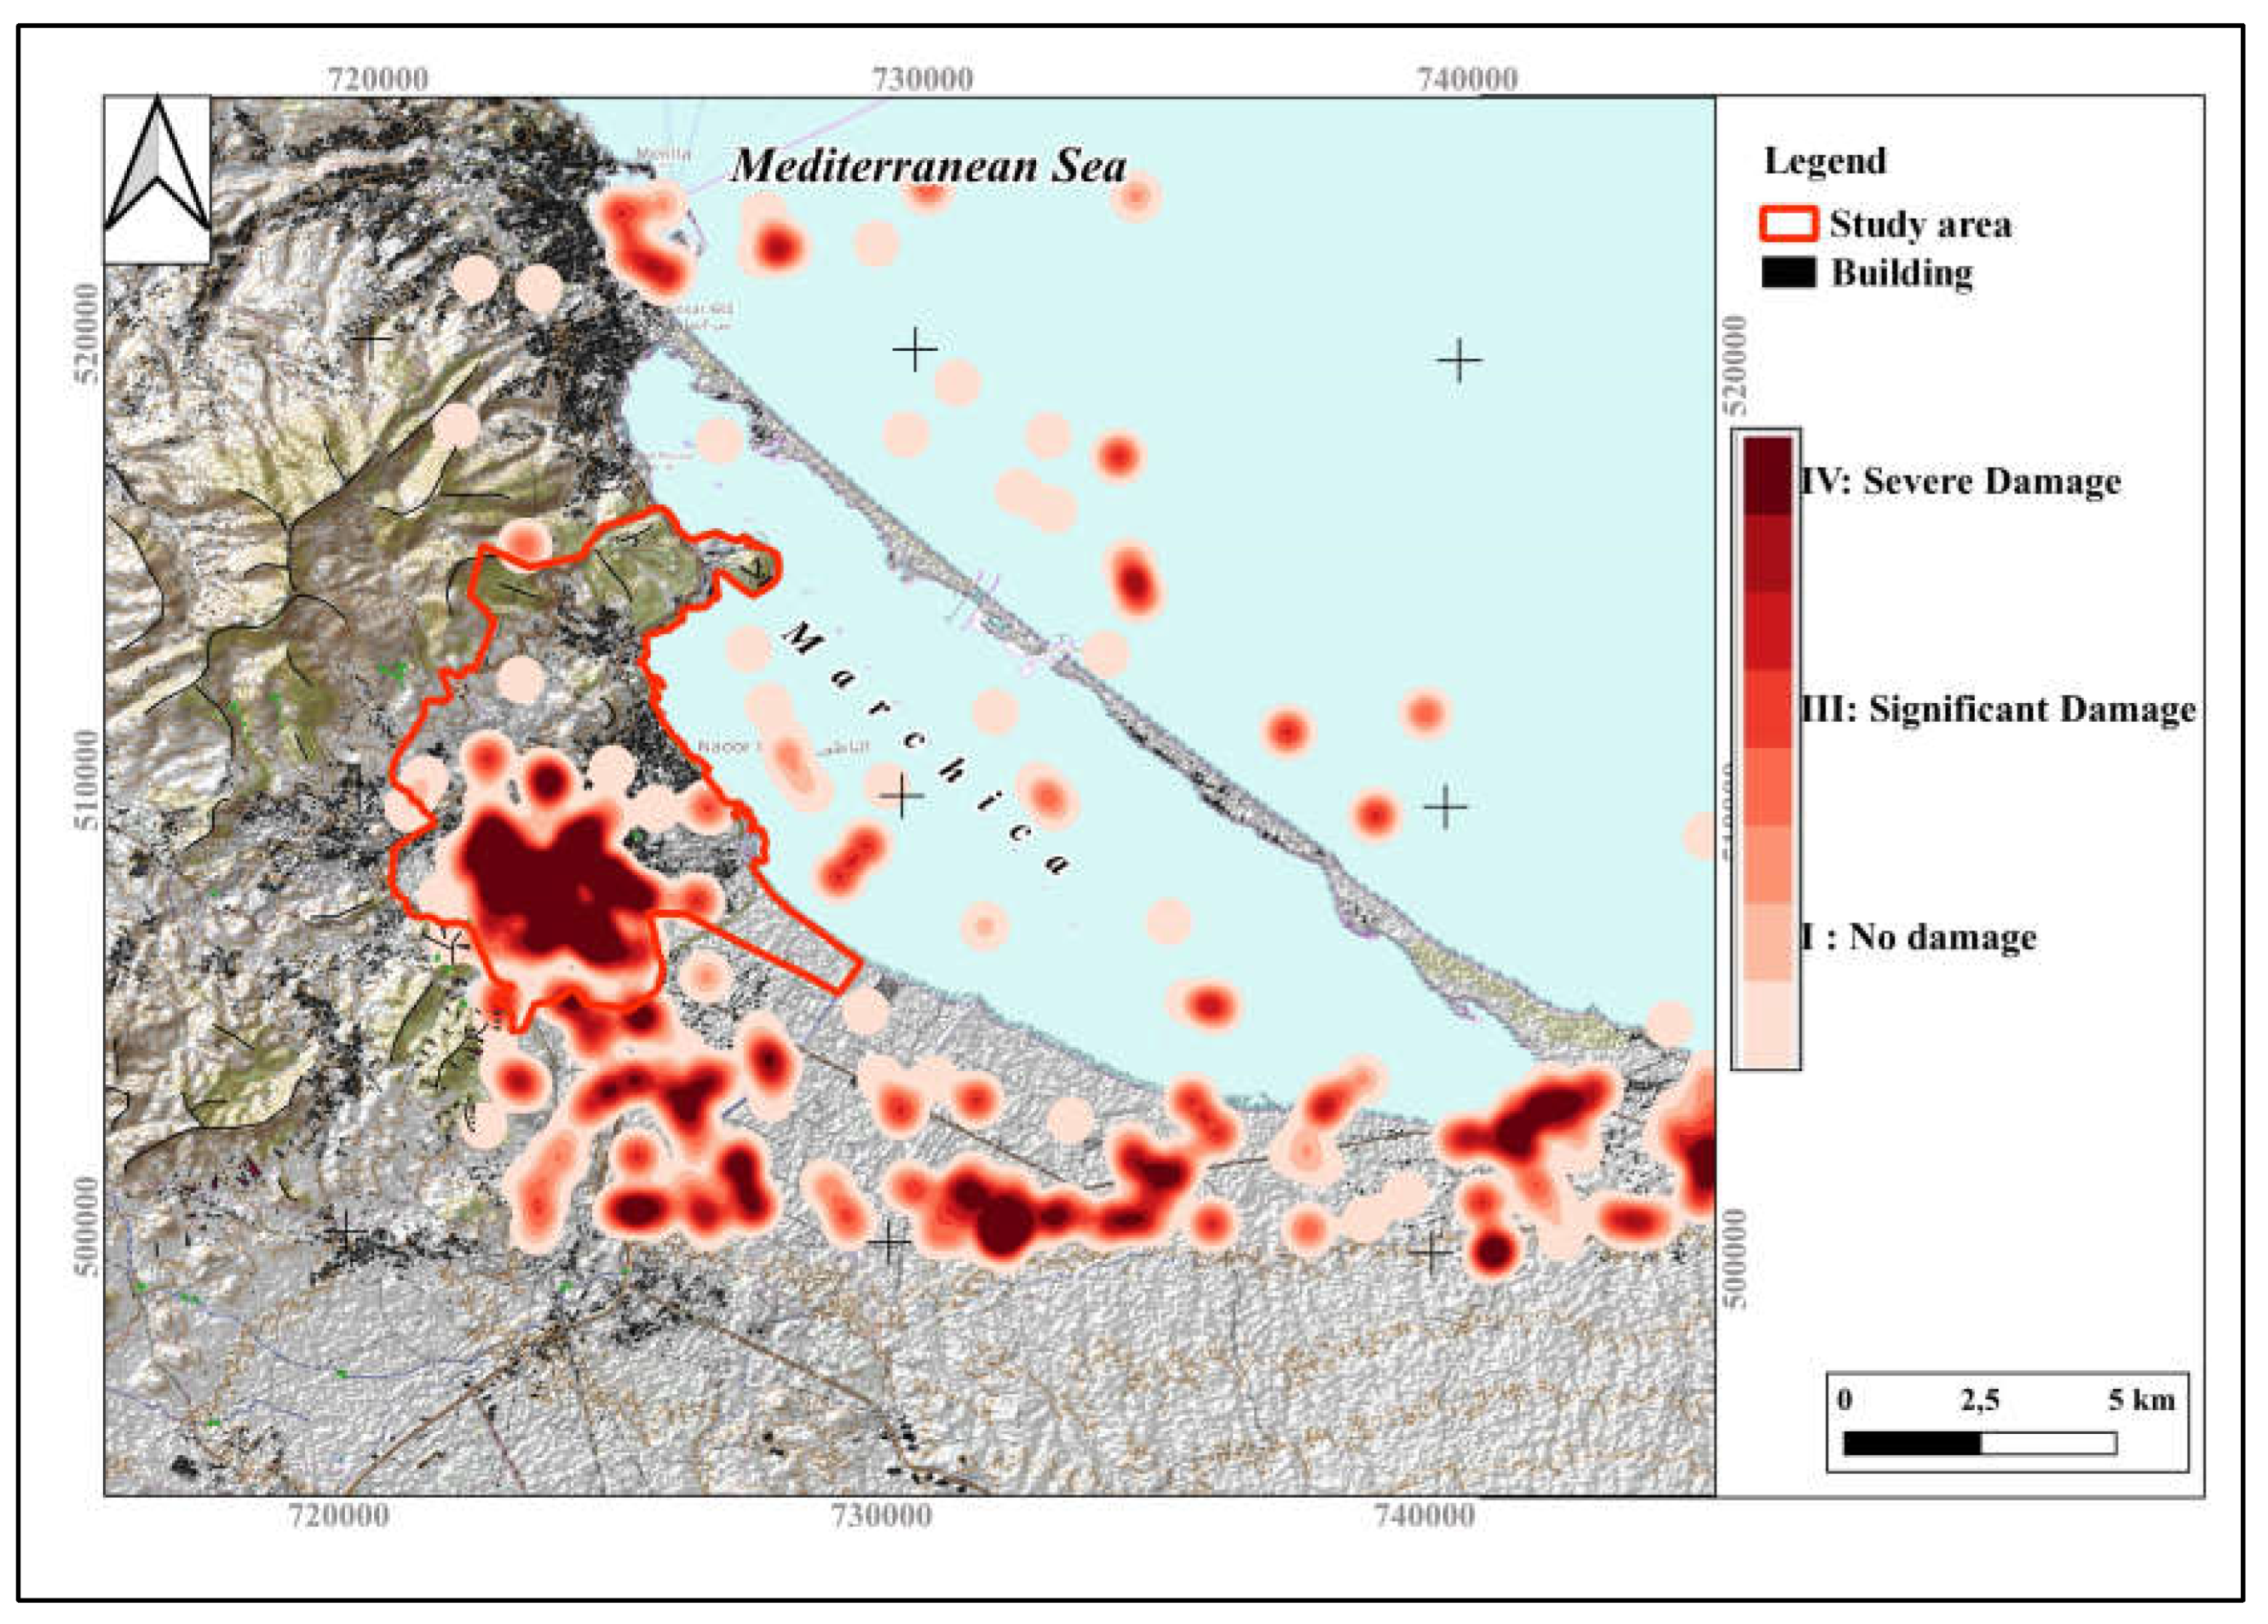
The proximity of Nador to the plate boundary between the African and Eurasian plates increases the likelihood of seismic activity in the region, as evidenced by the frequent occurrence of earthquakes. Damage areas are divided into three levels (No damage, significant damage, and severe damage). The modelling of seismic intensity shows that the susceptible impact area is located in the southern part of Nador city, where 50% of the urban surface “1780.5 hectares” is at risk of earthquake disaster (See Figure 9 below).
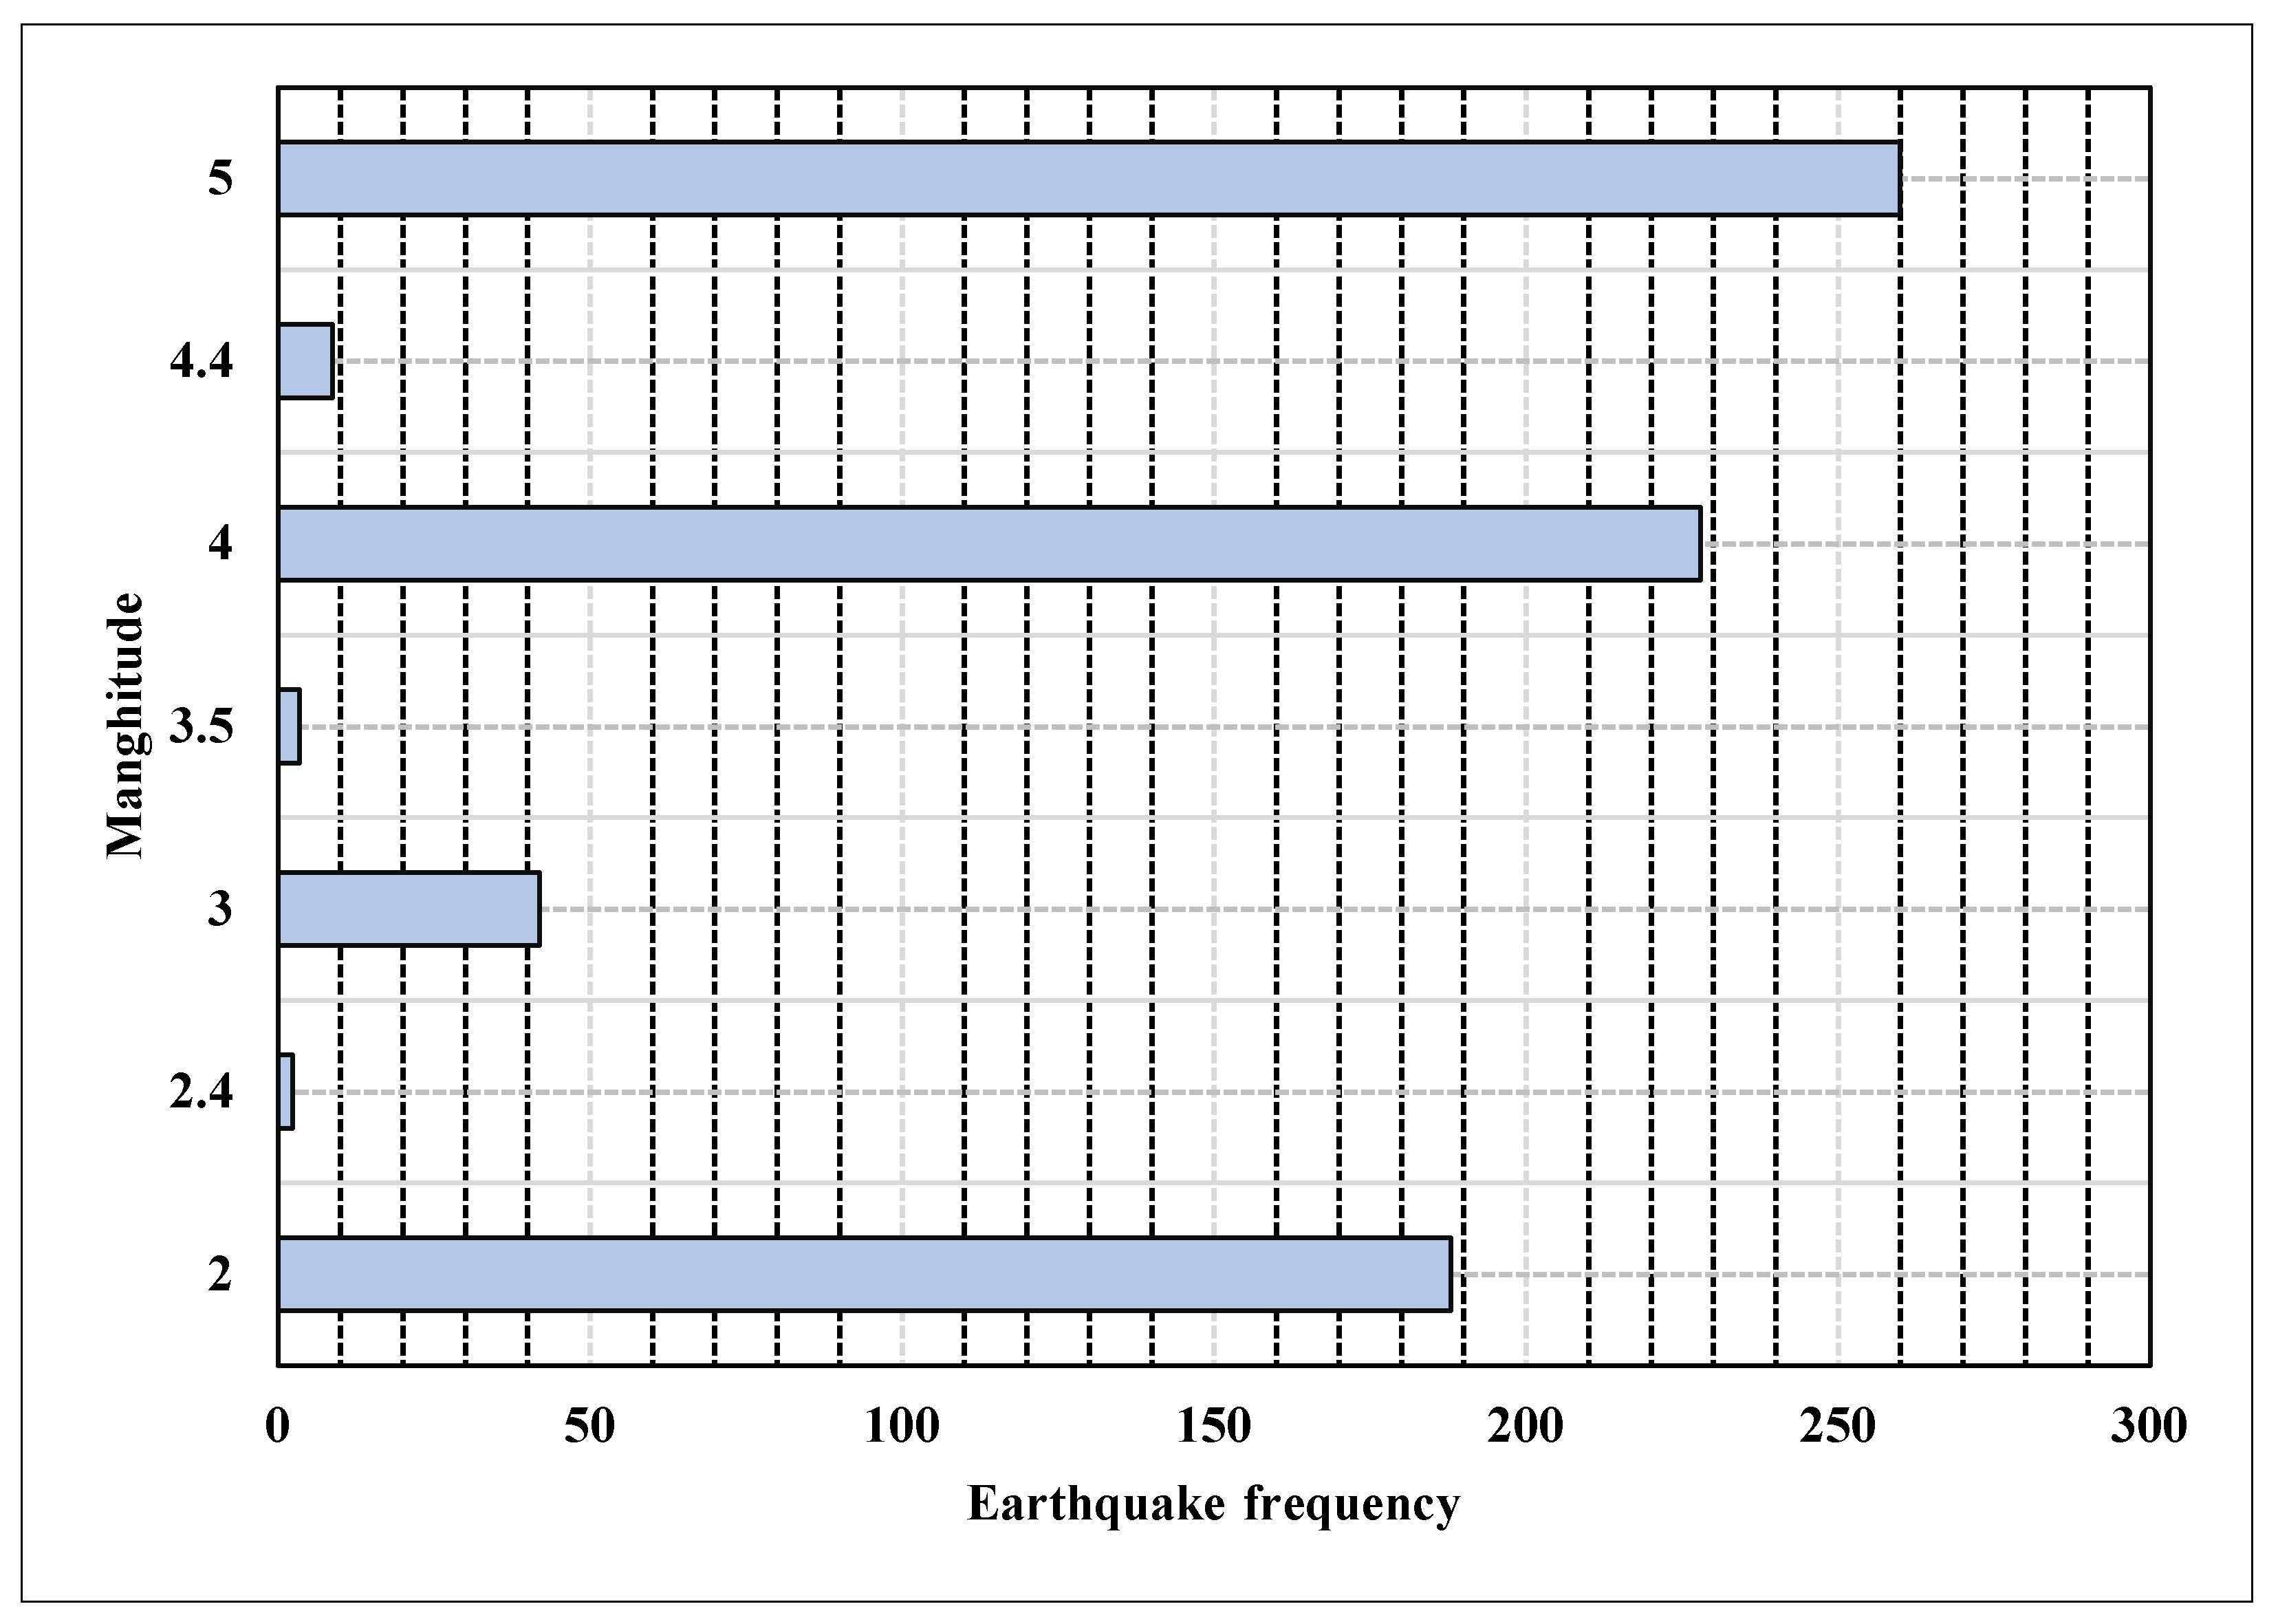
An analysis of seismic event frequency in the Nador region reveals that over 260 events have registered magnitudes exceeding 5 on the Richter scale. Additionally, 200 tremors have been recorded with magnitudes exceeding 4 on the Richter scale. This high frequency of seismic activity suggests that Nador, a Mediterranean city, is situated within an active geotectonic zone hazard (See Figure 10 below).

3.2. Landslides Risks

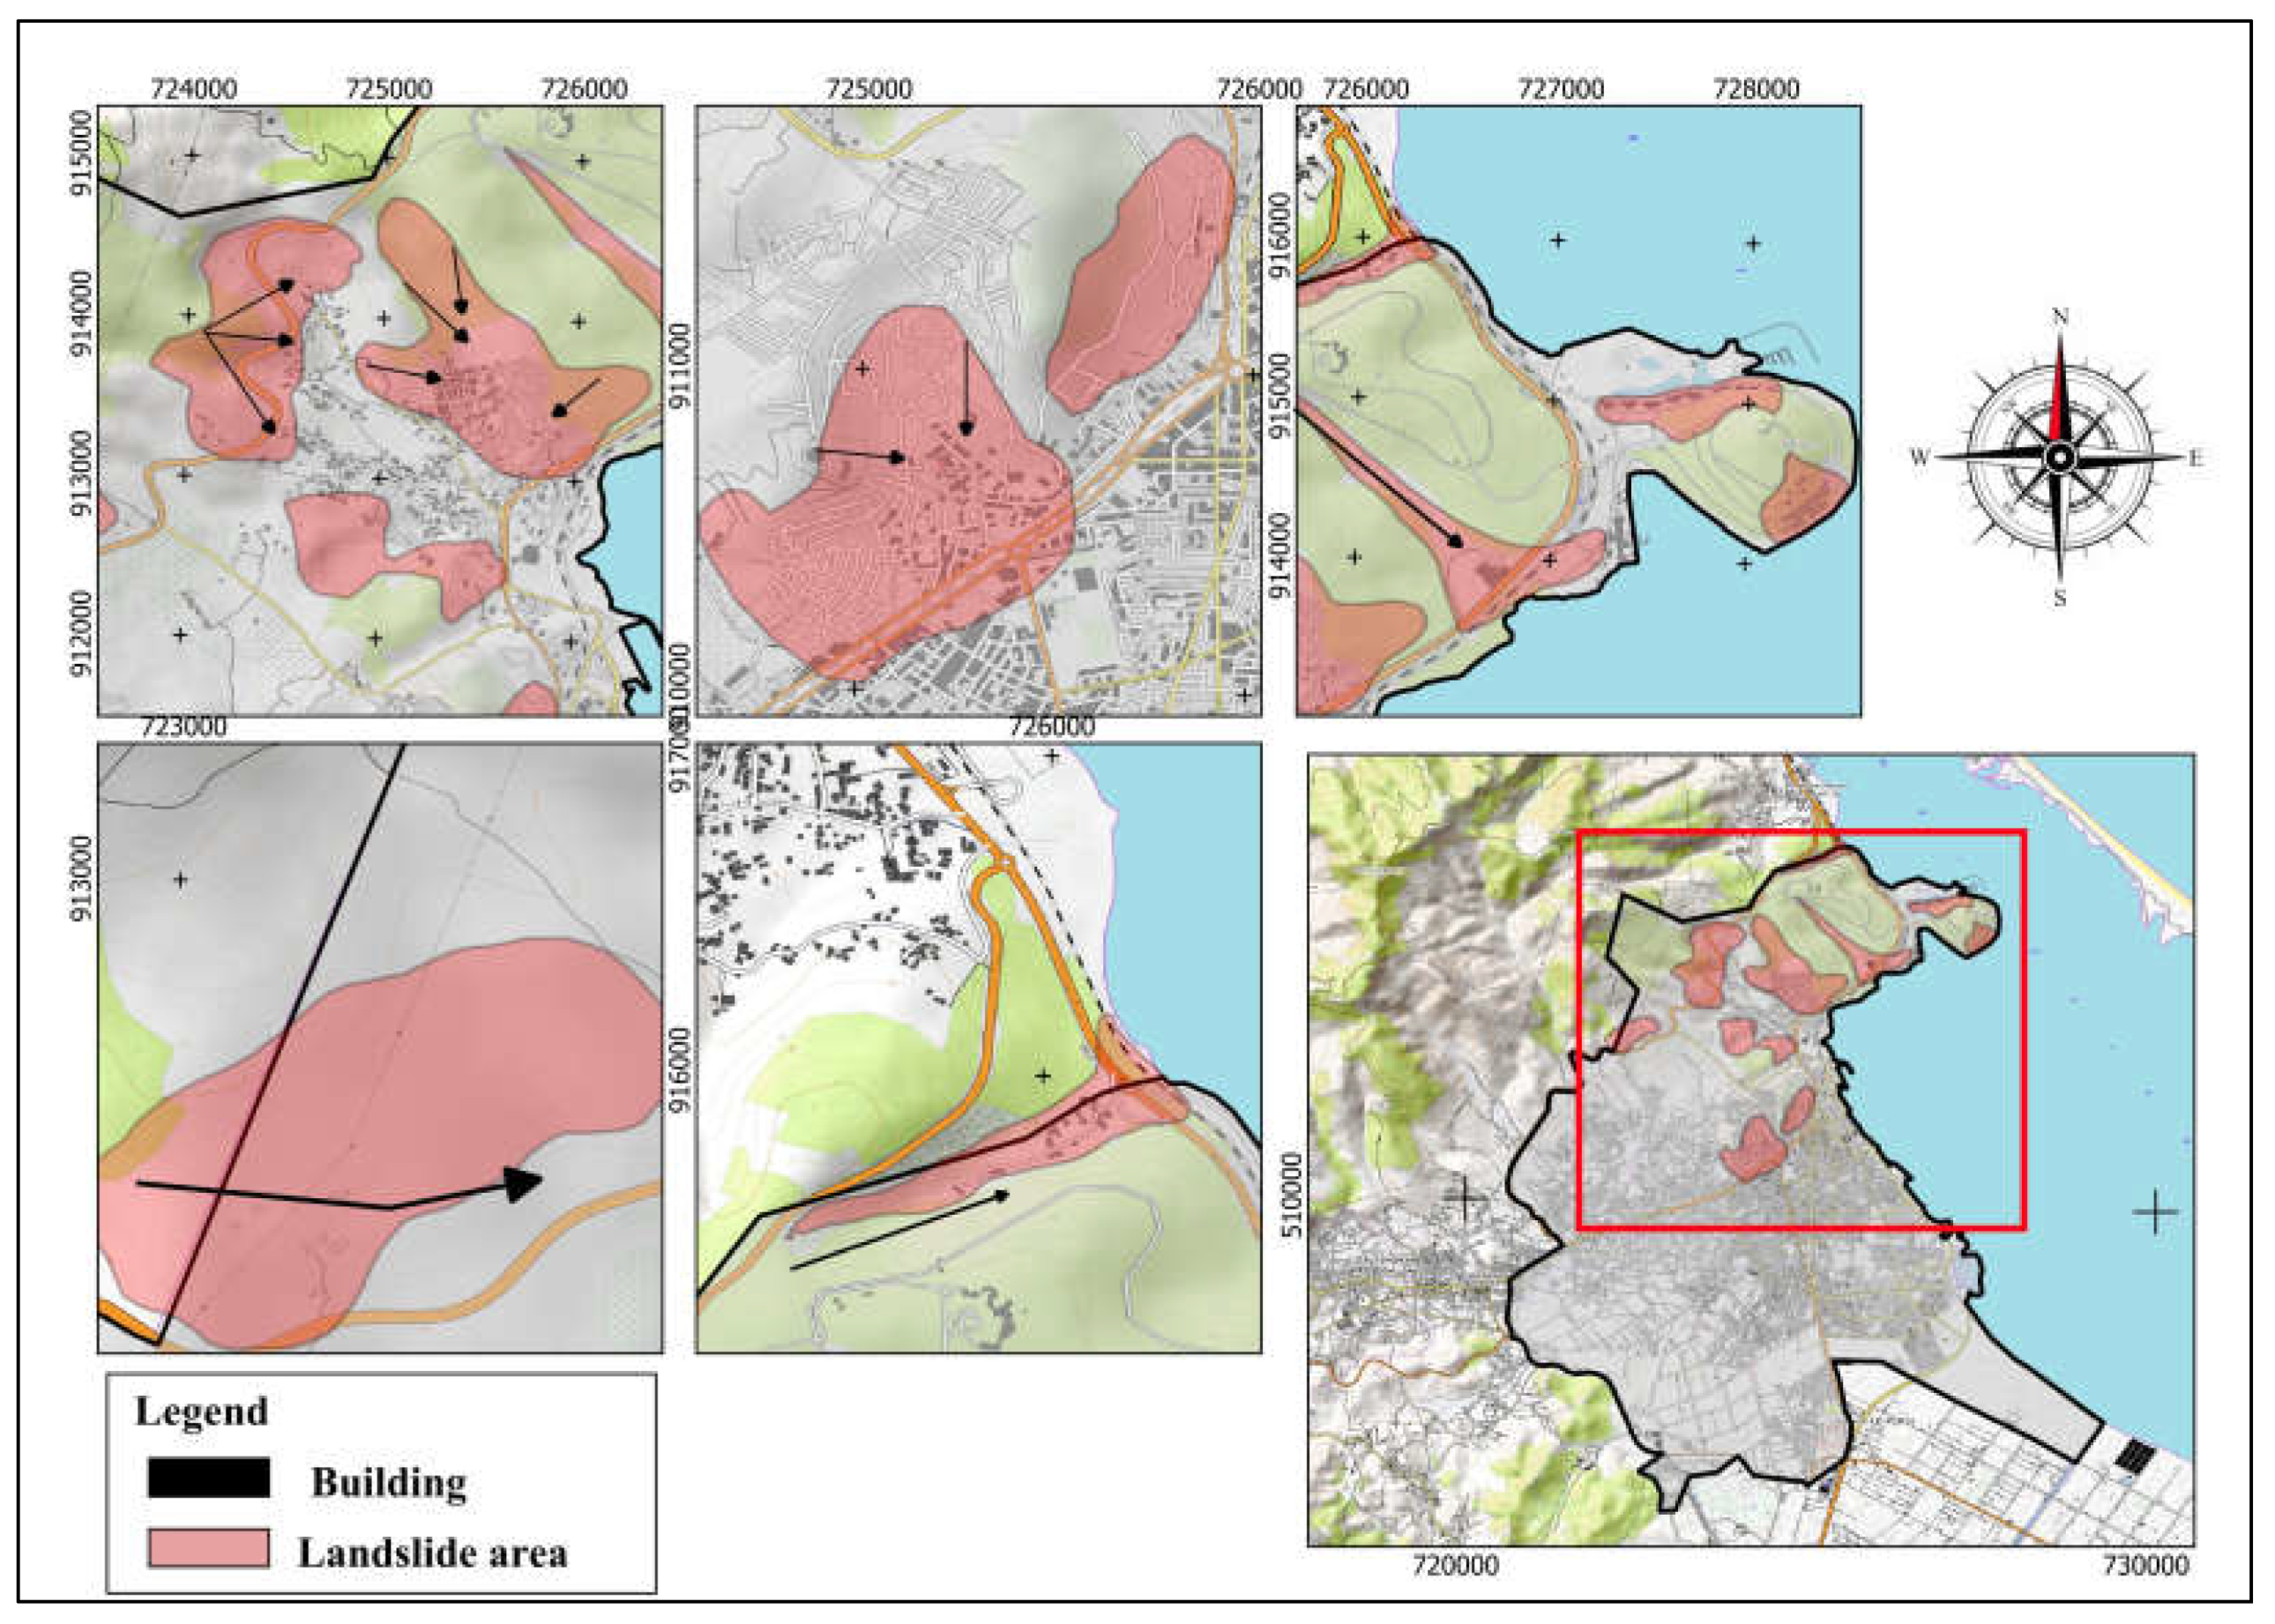
Earthquakes, soil structure, and aggressive slopes are the primary factors contributing to active ground sliding. Spatial analysis reveals that several areas in the north part of Nador city are susceptible to landslide hazards. Construction on hard, uneven topography leads to the accumulation of damage in these areas. Our observations identified 10 areas susceptible to landslides, encompassing over 459.6 hectares situated on steep slopes (See Figure 11 below).

3.3. Spatial Vulnerability Index

An analysis of building materials and locations in Nador, Morocco, revealed that approximately 70% of recent constructions utilize reinforced concrete. Residential buildings typically have ground floor areas ranging from 80 m² to 140 m². Land surveys indicate that all buildings are constructed with reinforced concrete structures, categorized as reinforced concrete moment frame (RC1), regular reinforced concrete structures with masonry infill walls (RC3.1), and irregular moment frame structures (RC3.2), aligning with the building typology matrix proposed by [51,52] (See Table 1).
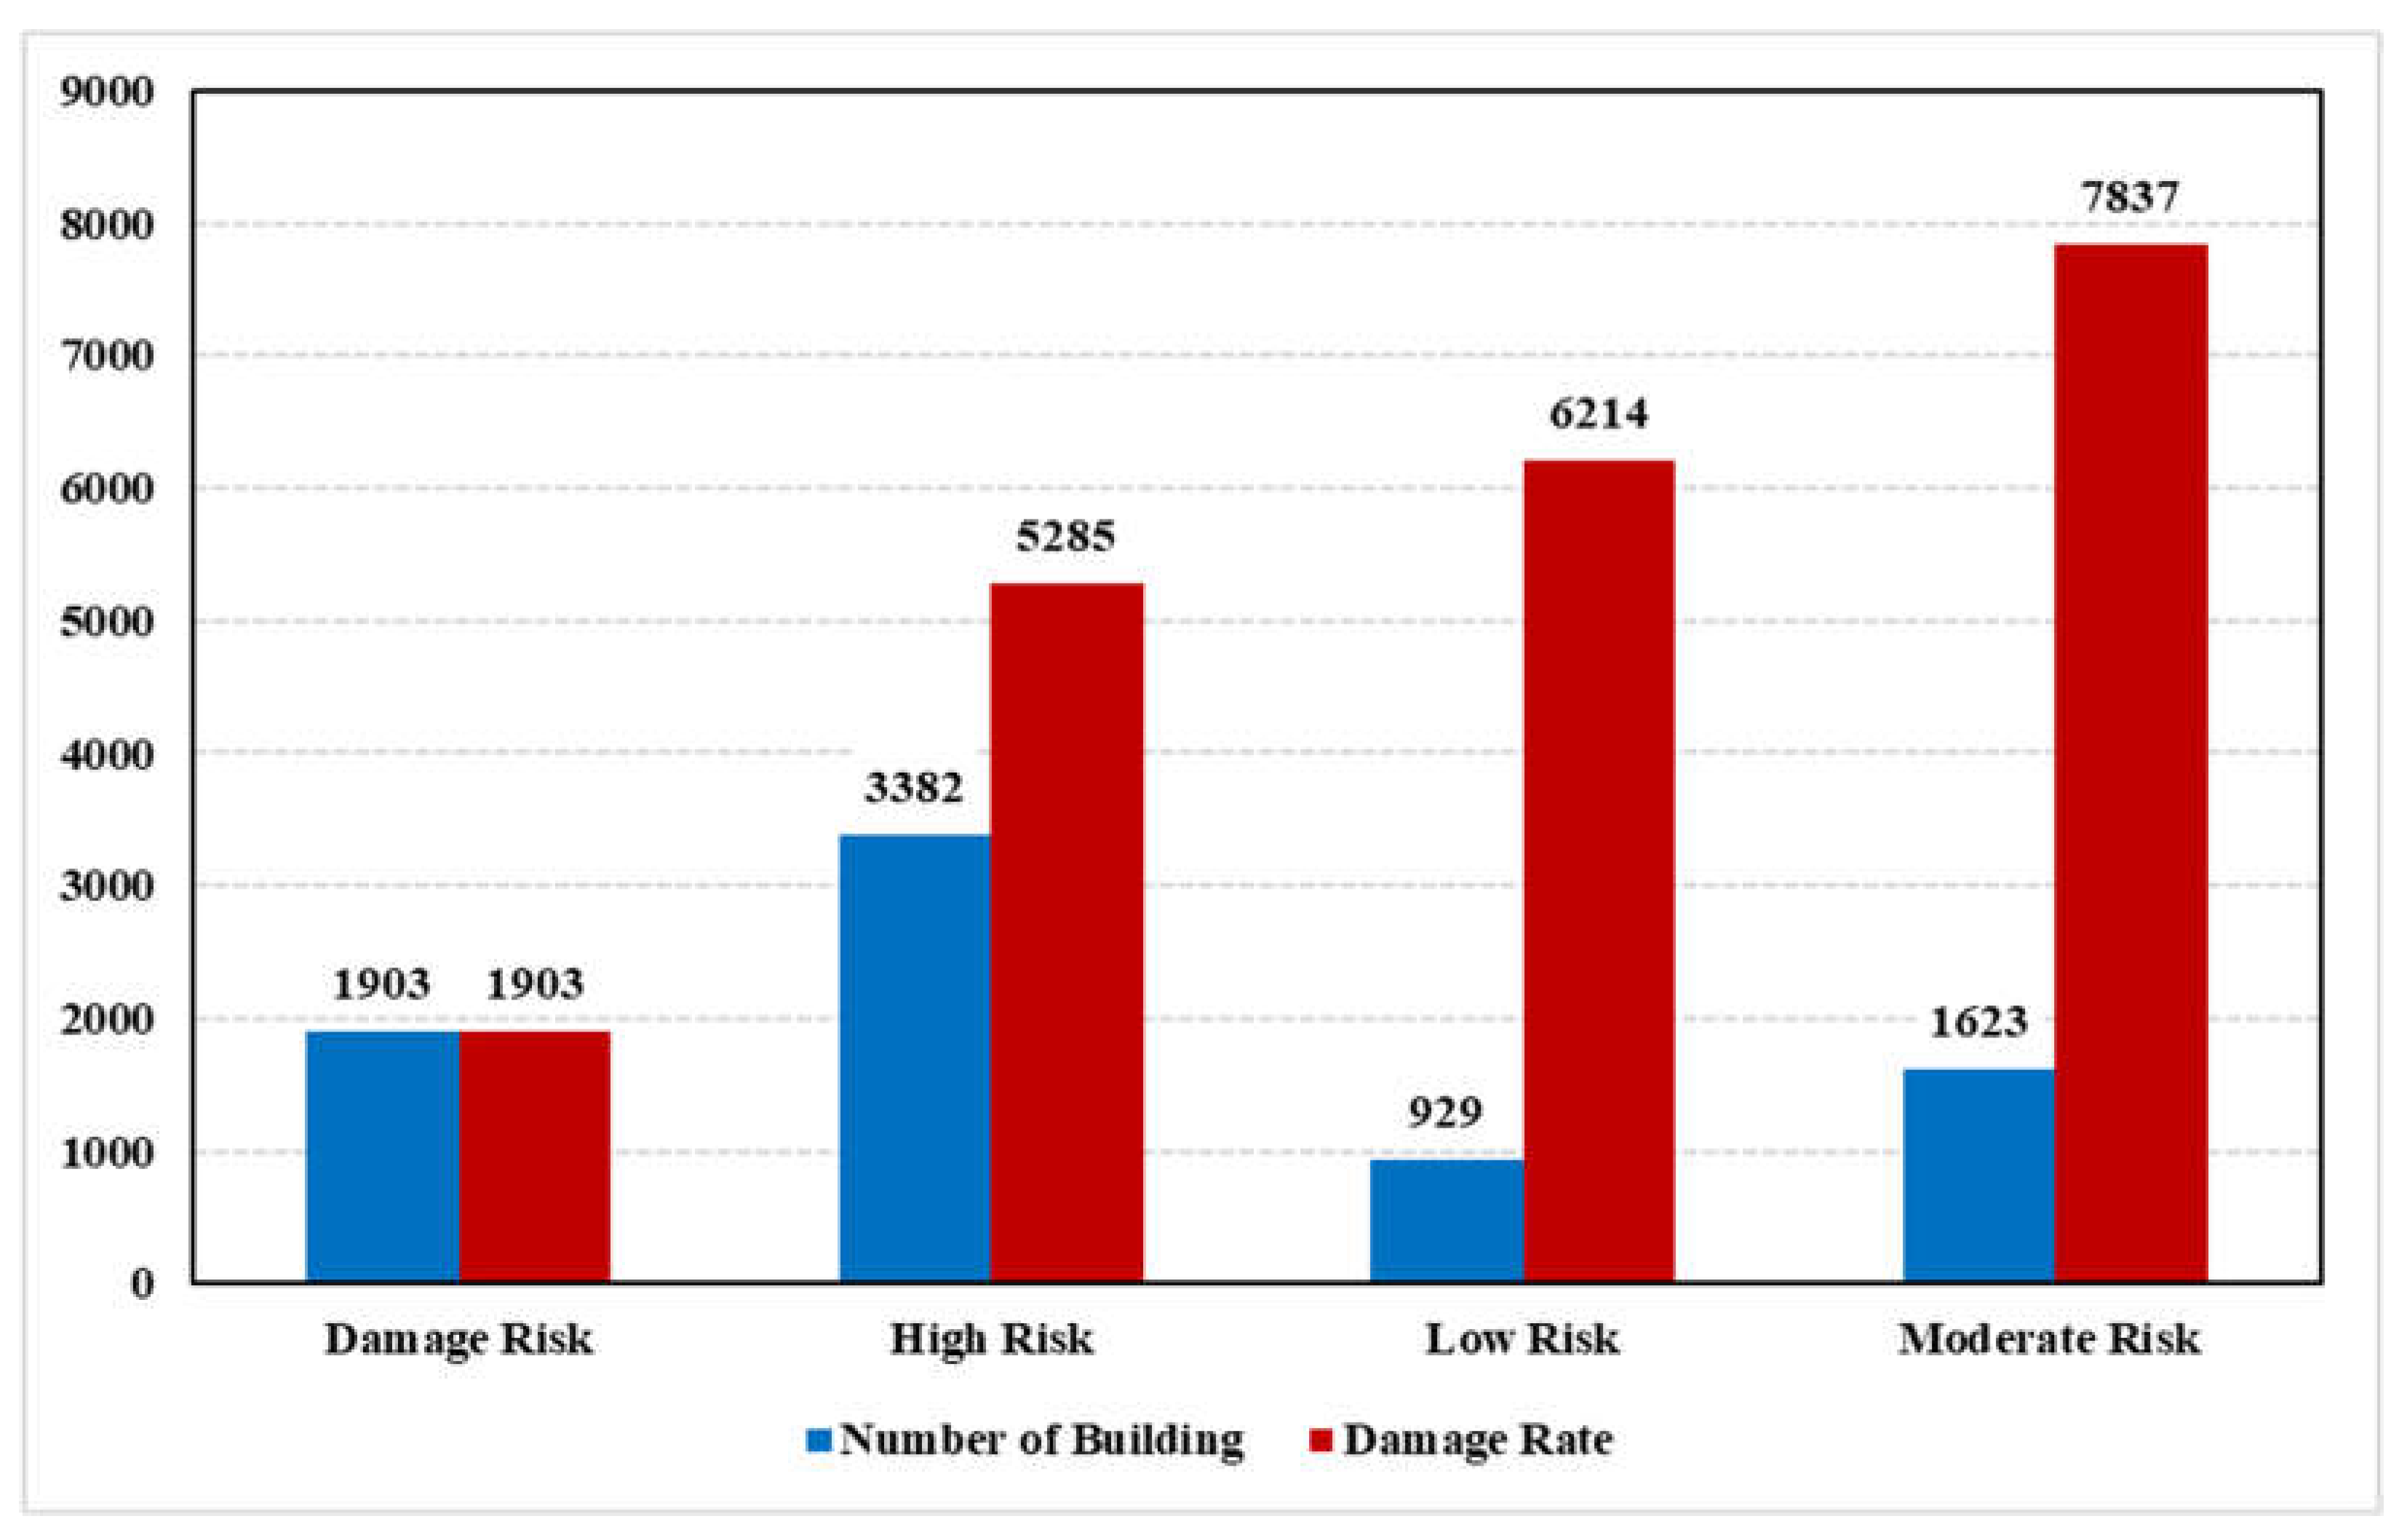
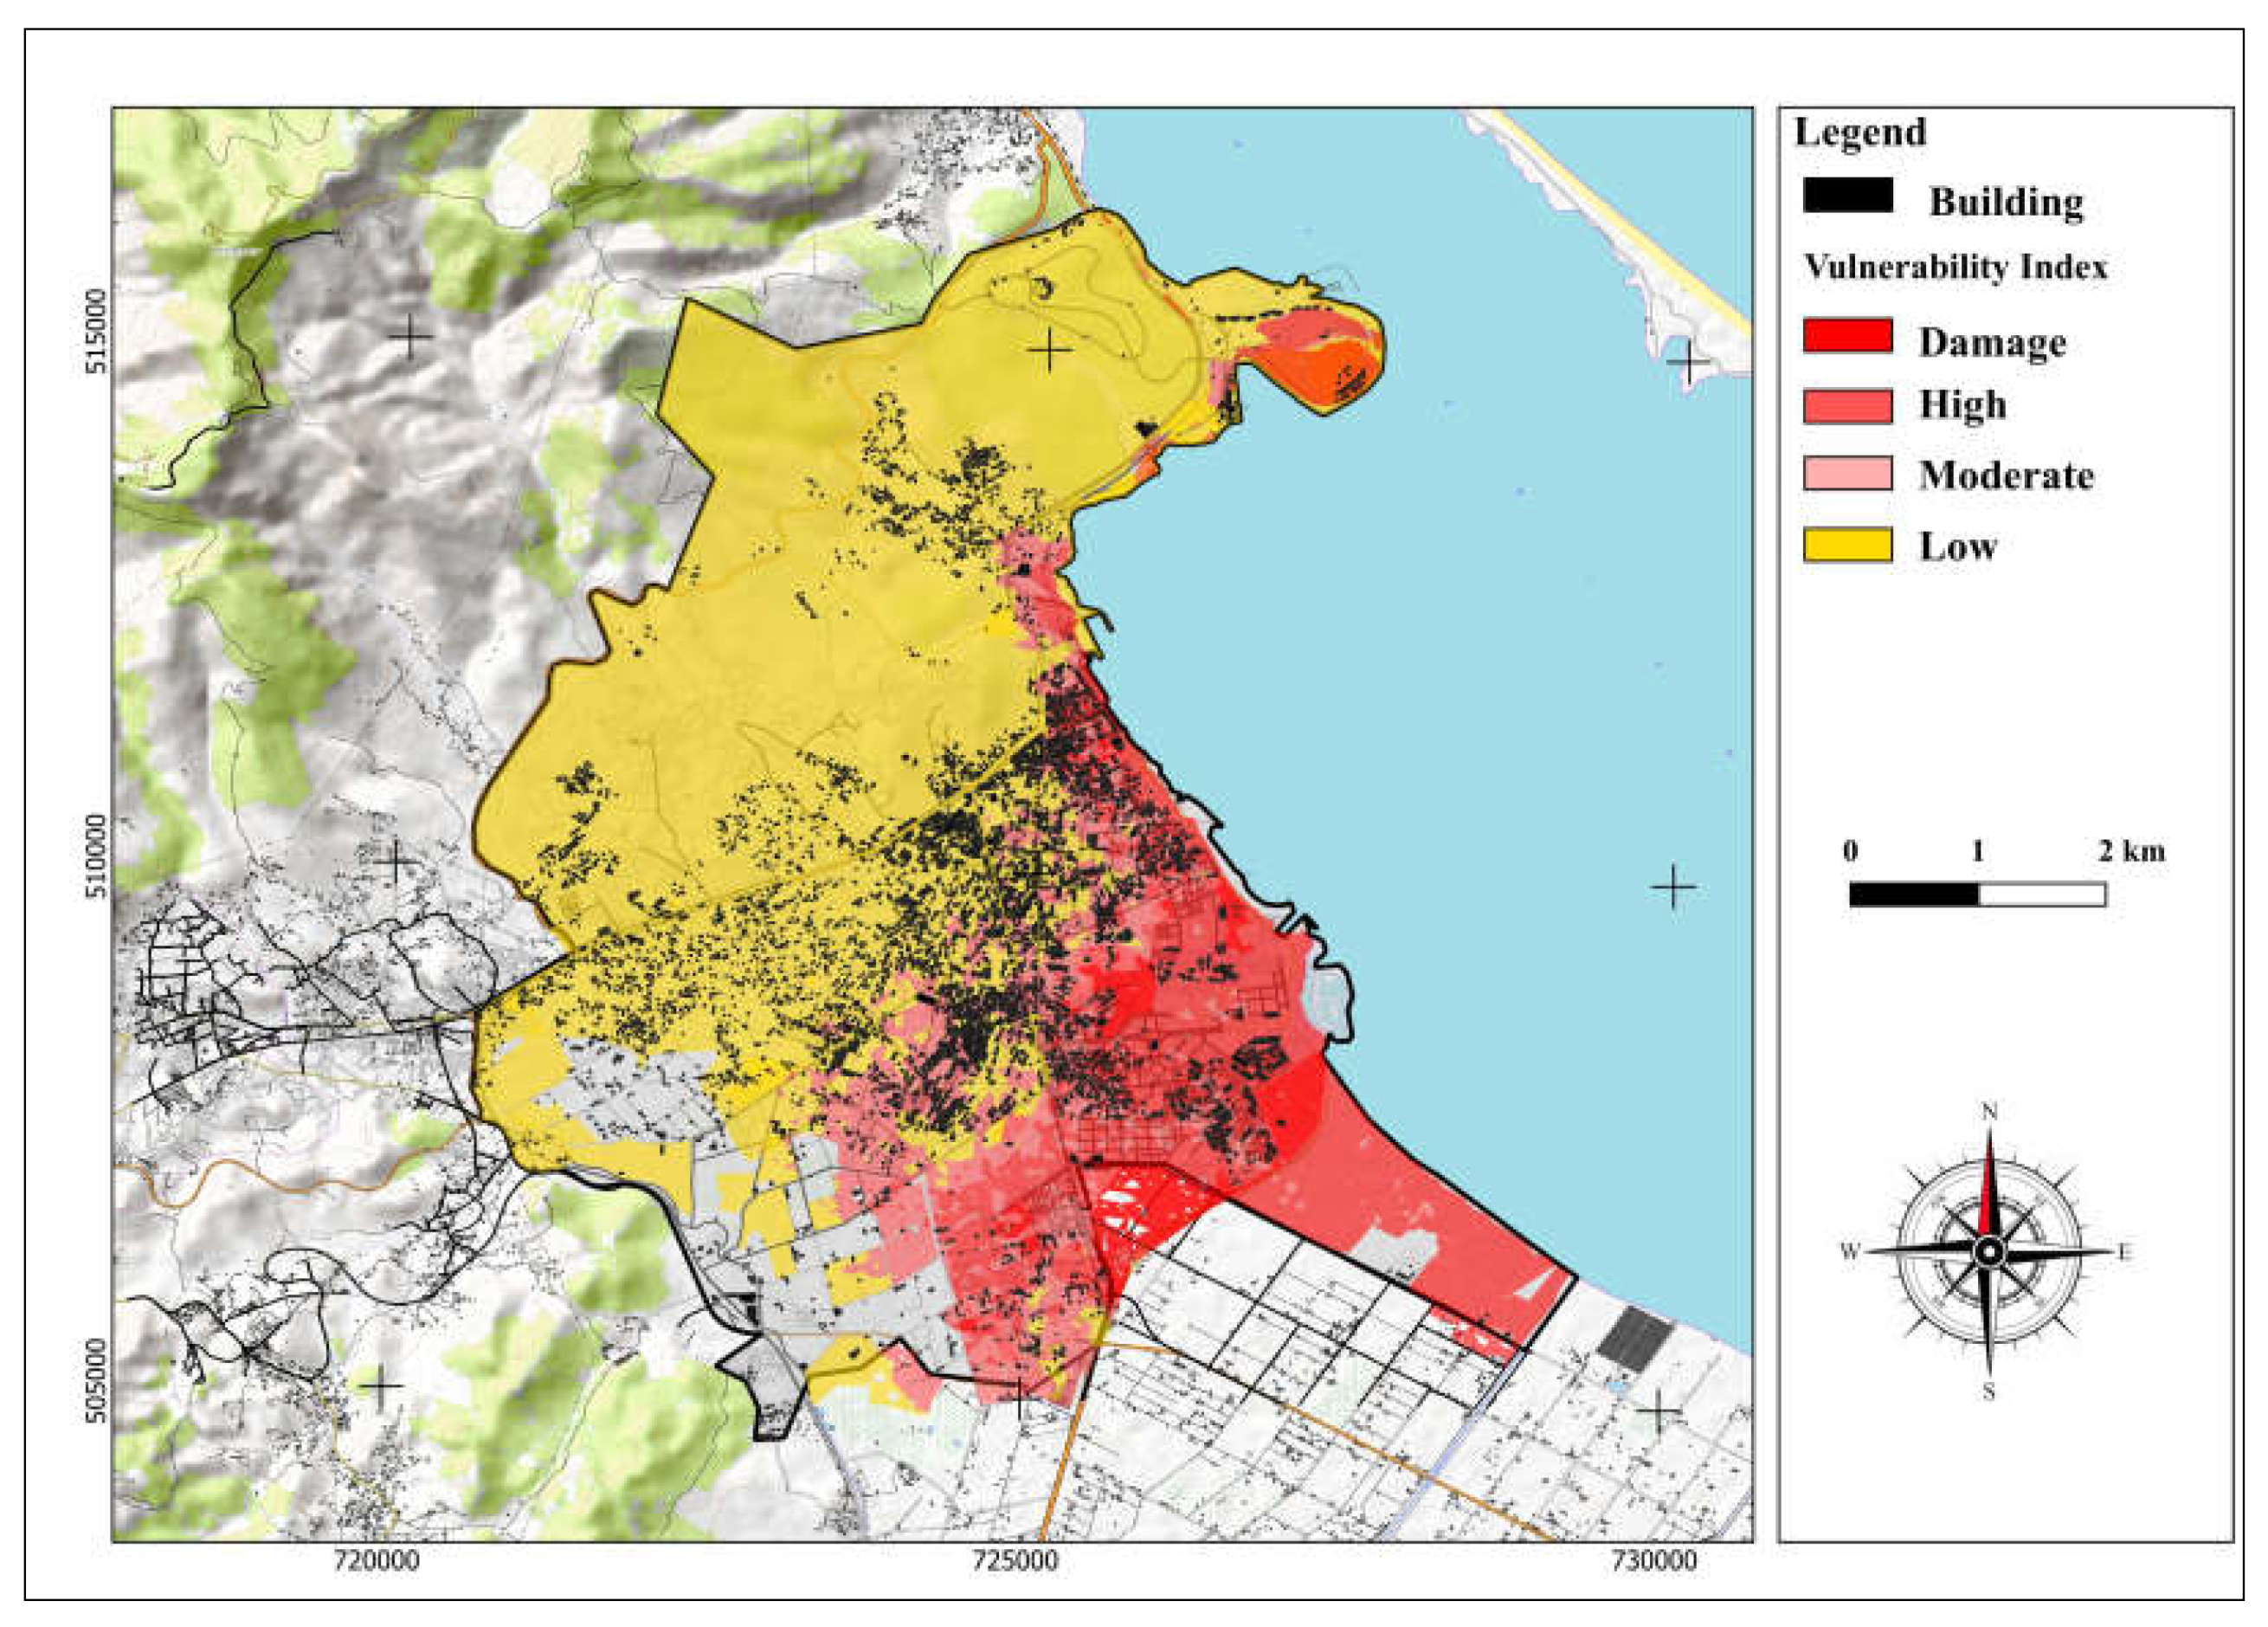
Vulnerability index methods suggest that buildings located on active ground are highly susceptible to severe seismic events (See Figure 12 below). Spatial vulnerability analysis shows that 5,285 buildings are located in high vulnerability zones, while 1,623 residential buildings fall within moderate vulnerability areas. Additionally, 929 buildings are considered outside of high vulnerability zones (See Figure 12 below). This statistical analysis reveals that Nador city can be divided into four vulnerability zones, as depicted in Figure 13.
Nador’s vulnerability stems from its unfortunate location at the convergence of the African and Eurasian tectonic plates. Plate tectonics, a cornerstone of modern geology, explains how the Earth’s surface is broken into giant, constantly moving plates. The grinding and interaction of these plates generate immense pressure, which can trigger earthquakes. Nador’s proximity to this plate boundary significantly increases its chances of experiencing seismic activity.
The city’s situation is further amplified by the underlying foundation of unconsolidated sedimentary and alluvial rocks, such as silt, alluvium, and salt flats. Unlike the sturdier bedrock found in other regions, these loose materials act like a bowl of jelly during an earthquake. They are more prone to violent shaking and a phenomenon known as liquefaction. Liquefaction occurs when saturated soil loses its strength and transforms into a liquid state, causing buildings to tilt, sink, or even collapse entirely, leading to catastrophic consequences.
The historical record serves as a stark reminder of this threat. Earthquakes exceeding magnitudes of 5 and 4 on the Richter scale have already rattled Nador, solidifying its position within an active seismic zone. The frequent tremors paint a worrying picture of a city teetering on the edge of a potentially devastating earthquake.
The seismic threat isn’t the only concern plaguing Nador. Earthquakes, coupled with the city’s specific soil composition and steep slopes, create a perfect recipe for landslides. Scientific studies have repeatedly shown that seismic activity, soil characteristics, and topography are the primary triggers for landslides. Nador exemplifies this precarious situation.
The study highlights the northern part of the city as particularly susceptible. Construction on uneven and steep slopes has exacerbated the existing vulnerability. This underlines the critical importance of incorporating geomorphological considerations, the study of landforms and their processes, into urban development plans. Uncontrolled construction on risky slopes is akin to building houses on a ticking time bomb.
The resilience for Nador could be constructed through several components, such as improving infrastructure, developing adaptive capacities to face social, economic, and environmental upheavals, enhancing community engagement, and fostering a culture of preparedness and innovation. Implementing resilience-building measures in Nador, it’s critical to focus on aspects of ‘hardiness’, ‘resourcefulness’, and ‘optimism’ to ensure business survival and prosperity.
This approach would recognize the potential disruptions from natural or malicious actors and would aim to prepare and protect the city’s functions to ensure the safety and security of its inhabitants and national assets.
The study presents a compelling scientific case for Nador’s high vulnerability to seismic events, landslides, and their associated consequences. The findings emphasize the need for:
  • Earthquake Preparedness: Implementing robust earthquake preparedness measures, including building codes designed for seismic zones, public awareness campaigns, and emergency response plans;
  • Landslide Mitigation: Identifying and addressing areas prone to landslides through slope stabilization techniques, land-use planning that avoids high-risk zones, and early warning systems;
  • Vulnerability Assessment: Continuously evaluating the vulnerability of buildings and infrastructure based on their materials, construction types, and location within the identified vulnerability zones.
By acknowledging and addressing these vulnerabilities, Nador can take proactive steps towards mitigating the risks associated with seismic activity and landslides, ultimately enhancing the city’s resilience and protecting its urban population.

5. Conclusions

This study employs a multifaceted approach, merging interdisciplinary methods such as geospatial analysis, urban geography, statistical analysis, and geophysical geography. This approach allows for a comprehensive examination of the impact of earthquake hazards and other contributing factors like topography, soil structure, geology, and urbanization on vulnerability levels. By understanding the intricate dynamics of the urban environment, this study aims to inform the adaptation of urban management strategies to the specific coastal context.
The results indicate that the vulnerability index is significantly influenced by the number of parameters included in the risk assessment. This study delves deeper into how each aspect contributes to potential damage and how urban areas can be managed to adapt to local constraints and enhance their resilience.
The vulnerability analysis performed in this study, is considering nowadays as an important approach for interpreting and understanding the contribution of various seismic sources to the seismic hazard values estimated at a specific location, as well as providing suitable solutions for earthquake design required by urban engineers for city purposes. Based on the current analysis, it appears, for both the selected return periods, that nearby seismicity is frequently a major contributor to the hazard in Nador city. Seismic amplification in Nador is assessed in this study using several steps to generate urban vulnerability index for different urban area in the city. For this purpose, after analyzing seismic intensity, we have used topography, geology and geomorphology factors to derive vulnerability assessment and to classify vulnerability level on urban scale
The performed study achieves important results, which constitute reliable approach for urban planners and decision-makers, enabling them to derive the representative scenario earthquakes during their management and planning. Our results could improve future seismic risk assessments in Nador city, and eventually the urban resilient planning and risk management.

Author Contributions

M.H. conceived and designed the study, he conducted the experiments, collected and analyzed the data, and drafted the manuscript. H. M.; A.R.; D.E.B.; Ch.J.; M.A.; S.A.E.A.; S.I. and B.M.; provided critical guidance and expertise in scientific orientation and suggestions. M.H. contributed to data collection and experimental support. All authors contributed to the manuscript revision and approved the final version for submission.

Funding

This research received no external funding.

Institutional Review Board Statement

Not applicable.

Informed Consent Statement

Not applicable.

Data Availability Statement

Data will be made available on request.

Acknowledgments

This paper’s structural damage sample data were derived from the United States Geological Survey (USGS) and the website www.lastquakers.eu, which help us collect daily seismic events in northern Morocco.

Conflicts of Interest

The authors declare no conflicts of interest.

Abbreviations

The following abbreviations are used in this manuscript:
CLC Corine Land Cover
SVI Socioeconomic Vulnerability Index
Vi Vulnerability Index

References

  1. Chaaraoui, A.; Chourak, M.; Hamdache, M.; Peláez, J. A.; Henares, J. Amplification analysis at Nador city and surrounding area (NE of Morocco). Journal of African Earth Sciences. 2022, 196, 3–13. [CrossRef]
  2. Marsh, M. L. Application of accelerated bridge construction connections in moderate-to-high seismic regions. Transportation 415 Research Board: Washington, USA. 2011, 698, 3–13.
  3. Tsushima, H.; Ohta, Y. Review on near-field tsunami forecasting from offshore tsunami data and onshore GNSS data for tsunami early warning. Journal of Disaster Research. 2014, 9, 339–357. [CrossRef]
  4. Nicholls, RJ.; Hanson, SE.; Lowe, JA.; Slangen, AB.; Wahl. T.; Hinkel, J.; Long, AJ. Integrating new sea-level scenarios into coastal risk and adaptation assessments: An ongoing process. Wiley Interdisciplinary Reviews: Climate Change. 2021, 12, 1–27. [CrossRef]
  5. Yariyan, P.; Zabihi, H.; Wolf, ID.; Karami, M.; Amiriyan, S. Earthquake risk assessment using an integrated Fuzzy Analytic Hierarchy Process with Artificial Neural Networks based on GIS: A case study of Sanandaj in Iran. International Journal of Disaster Risk Reduction. 2020, 50, 1–17. [CrossRef]
  6. Mao, Y.; Li, Y.; Teng, F.; Sabonchi, A.K.S.; Azarafza, M.; Zhang, M. Utilizing Hybrid Machine Learning and Soft Computing Techniques for Landslide Susceptibility Mapping in a Drainage Basin. Water. 2024, 16, 1–28. [CrossRef]
  7. Brückl, E.; Peter, C.; Stefan, M.; Rita, M. Seismological Data Acquisition and Analysis within the Scope of Citizen Science. In Earthquakes - From Tectonics to Buildings, 2nd ed.; Walter S.; IntechOpen: Catholic University of El Salvador, El Salvador. 2021, 2—21. [CrossRef]
  8. Haldon, J.; Rosen, A. Society and environment in the East Mediterranean ca 300–1800 CE. Problems of resilience, adaptation and transformation. Introductory essay. Human Ecology 2018, 46, 275–290. [CrossRef]
  9. Bankoff, G.; Frerks, G.; Hilhorst, T.; Hilhorst, D. Mapping vulnerability: disasters, development, and people. Earthscan: Sterling, USA 2004, 128—183.
  10. Fekete, A.; Asadzadeh, A.; Ghafory-Ashtiany, M.; Amini-Hosseini, K.; Hetkämper, C.; Moghadas, M.; Ostadtaghizadeh, A.; Rohr, A.; and Kötter, T. Pathways for advancing integrative disaster risk and resilience management in Iran: Needs, challenges and opportunities. International Journal of Disaster Risk Reduction. 2020, 49, 1–12. [CrossRef]
  11. Breaking the cycle of risk. Available online: https://www.undrr.org/building-risk-knowledge/ (accessed on 4h: 41 min pm, 4th, March 2024).
  12. Cohen, A.V. Overview and definition of risk: Its assessment and management. Environment International. 1984, 10, 359–366. [CrossRef]
  13. Gibbs, M. T.; Browman, H. I. Risk assessment and risk management: a primer for marine scientists. Journal of Marine Science. 2015, 72, 992—996. [CrossRef]
  14. Varnes, DJ. Landslide hazard zonation: a review of principles and practice. UNESCO: Paris, French. 1984, 63 p.
  15. Hantz, D.; Corominas, J.; Crosta, G. B.; Jaboyedoff, M. Definitions and concepts for quantitative rockfall hazard and risk analysis. Geosciences. 2021, 11, 2–16. [CrossRef]
  16. Smith, K. Environmental hazards: assessing risk and reducing disaster. Routledge: London, UK. 2013, 504 p. [CrossRef]
  17. Alexander, D. Natural Disasters. Routledge: London, UK. 1993, 654 p.
  18. Blaikie, P.; Cannon, T.; Davis, I.; Wisner, B. At Risk: Natural Hazards, People’s Vulnerability and Disasters. Routledge: London, UK. 2004, 496 p.
  19. Aksha, S.K.; Juran, L.; Resler, L.M.; Zhang, Y. An Analysis of Social Vulnerability to Natural Hazards in Nepal Using a Modified Social Vulnerability Index. International Journal of Disaster Risk 2019, 10, 103–116. [CrossRef]
  20. Aven, T. On some recent definitions and analysis frameworks for risk, vulnerability, and resilience. Risk Analysis: An International Journal 2011, 31, 515–522. [CrossRef]
  21. Wolf, S.; Hinkel, J.; Hallier, M.; Bisaro, A.; Lincke, D.; Ionescu, C.; Klein, R.J.T. Clarifying vulnerability definitions and assessments using formalisation. International Journal of Climate Change Strategies and Management 2013, 5, 54–70. [CrossRef]
  22. Kreimer, A.; Arnold, M.; Carlin, A. Building safer cities: the future of disaster risk. World Bank: Washington, USA. 2003, 293 p.
  23. Pelling, M. The Vulnerability of Cities: Natural Disasters and Social Resilience. Routledge: London, UK. 2003, 224 p.
  24. Kelman, I. Lost for words amongst disaster risk science vocabulary? International Journal of Climate Change Strategies and Management 2018, 9, 281–291. [CrossRef]
  25. Maskrey, A. Disaster mitigation: a community-based approach. Oxfam: Oxford, GB. 1989, 100 p.
  26. Neria, Y.; Nandi, A.; Galea, S. Post-traumatic stress disorder following disasters: a systematic review. Psychological medicine 2008, 38, 467—480. [CrossRef]
  27. Norris, F. H.; Stevens, S. P.; Pfefferbaum, B.; Wyche, K. F.; Pfefferbaum, R. L. Community resilience as a metaphor, theory, set of capacities, and strategy for disaster readiness. American journal of community psychology 2008, 41, 127—150. [CrossRef]
  28. Kellenberg, D.; Mobarak, A. M. The economics of natural disasters. Annual Review of Resource Economics 2011, 3, 297–312. [CrossRef]
  29. World Bank. World Bank Annual Report 2020. The World Bank: Paris, French 2020, 80 p.
  30. Sharma, B.; and Sandhu, M. Earthquake Response and Its Implications Towards the Structural Design Codes for Himalayan Range and Adjoining Regions of India. Geohazards: Analysis, Modelling and Forecasting. 2023, 53, 89–101.
  31. Green, H. K.; Lysaght, O.; Saulnier, D. D.; Blanchard, K.; Humphrey, A.; Fakhruddin, B.; and Murray, V. Challenges with disaster mortality data and measuring progress towards the implementation of the Sendai framework. International Journal of Disaster Risk Science. 2019, 10, 449–461. [CrossRef]
  32. Meerow, S.; Newell, J. P.; and Stults, M. Defining urban resilience: A review. Landscape and Urban Planning. 2016, 147, 38–49. [CrossRef]
  33. Kreibich, H.; Van Loon, A. F.; Schröter, K.; et al. The challenge of unprecedented floods and droughts in risk management. Nature. 2022, 608, 80–86. [CrossRef]
  34. Scheidel, A.; Del Bene, D.; Liu, J.; Navas, G.; Mingorría, S.; Demaria, F.; et al. Environmental conflicts and defenders: A global overview. Global Environmental Change. 2020, 63, 1–12. [CrossRef]
  35. Poujol, A.; Ritz, JF.; Tahayt, A.; Vernant, P.; Condomines, M.; Blard, PH.; Billant, J.; Vacher, L.; Tibari B.; Hni L.; Idrissi, AK. Active tectonics of the Northern Rif (Morocco) from geomorphic and geochronological data. Journal of Geodynamics. 2014, 77, 70–88. [CrossRef]
  36. Reilinger, R.; McClusky, S.; Vernant, P.; Lawrence, S.; Ergintav, S.; Cakmak, R.; Ozener, H.; Kadirov, F.; Guliev, I.; Stepanyan, R.; et al. GPS constraints on continental deformation in the Africa-Arabia-Eurasia continental collision zone and implications for the dynamics of plate interactions. Journal of Geophysical Research: Solid Earth. 2006, 111, 163–205. [CrossRef]
  37. Benzaggagh, M.; Mokhtari, A.; Rossi, P.; Michard, A.; Maz, A.E.; Chalouan, A.; Saddiqi, O.; Rjimati, E.C. Oceanic units in the core of the External Rif (Morocco): Intramargin hiatus or South-Tethyan remnants? Journal of Geodynamics. 2014, 77, 4–21. [CrossRef]
  38. Nocquet, JM.; Calais, E. Geodetic measurements of crustal deformation in the Western Mediterranean and Europe. Pure and applied geophysics. 2004, 161, 661—681. [CrossRef]
  39. Nocquet, JM. Present-day kinematics of the Mediterranean: A comprehensive overview of GPS results. Tectonophysics. 2012, 579, 220–242. [CrossRef]
  40. Benamrane, M.; Németh, K.; Jadid, M.; Talbi, E.H. Geomorphological Classification of Monogenetic Volcanoes and Its Implication to Tectonic Stress Orientation in the Middle Atlas Volcanic Field (Morocco). Land. 2022, 11, 1–35. [CrossRef]
  41. Huggett, R.; Shuttleworth, E.; Fundamentals of geomorphology. Routledge: London, UK 682 p.
  42. Naimi, M.N.; Cherif, A. Sedimentology and ichnology of the mid-Cretaceous succession of the Ouled Nail Mounts (Eastern Saharan Atlas, Algeria). Geologia Croatica. 2021, 74, 209–223. [CrossRef]
  43. Raji, O.; Dezileau, L.; Tessier, B.; Niazi, S.; Snoussi, M.; Von Grafenstein, U.; Poujol, A. Climate and tectonic-driven sedimentary infill of a lagoon as revealed by high resolution seismic and core data (the Nador lagoon, NE Morocco). Marine Geology. 2018, 398, 99–111. [CrossRef]
  44. Egenhofer, M.J. Reasoning about binary topological relations. Marine Geology. 1991, 525, 141–160. [CrossRef]
  45. Guo, Y.; Liu, S.; Qiu, L.; Zhang, C.; Shan, W. Spatial stratified heterogeneity analysis of field scale permafrost in Northeast China based on optimal parameters-based geographical detector. PLOS ONE. 2024, 19, 1–22. [CrossRef]
  46. Petrişor, A.I.; Sirodoev, I.; Ianoş; I. Trends in the national and regional transitional dynamics of land cover and use changes in Romania. Remote Sensing. 2020, 12, 1–23. [CrossRef]
  47. Li, SQ. Comparison of RC girder bridge and building vulnerability considering empirical seismic damage. Ain Shams engineering journal. 2024, 15, 1–13. [CrossRef]
  48. Flanagan, B. E.; Gregory, E. W.; Hallisey, E. J.; Heitgerd, J. L.; and Lewis, B. A social vulnerability index for disaster management. Journal of homeland security and emergency management. 2011, 8, 1–22. [CrossRef]
  49. Iervolino, I.; Baraschino, R.; Belleri, A.; Cardone, D.; Corte, GD.; Franchin, P.; Lagomarsino, S.; Magliulo, G.; Marchi, A.; Penna, A.; Viggiani, LR. Seismic fragility of Italian code-conforming buildings by multi-stripe dynamic analysis of three-dimensional structural models. Journal of Earthquake Engineering. 2023, 27, 4415–4448. [CrossRef]
  50. Milutinovic, Z.V.; Trendafiloski, G.S. Risk-UE An advanced approach to earthquake risk scenarios with applications to different European towns. Contract: EVK4-CT-2000-00014, WP4: Vulnerability of current buildings. 2003, 1–111.
  51. Romero-Andrade, R.; Trejo-Soto, ME.; Nayak, K.; Hernández-Andrade, D.; Bojorquez-Pacheco N. Lineament analysis as a seismic precursor: the El Mayor Cucapah earthquake of April 4, 2010 (MW7.2), Baja California, Mexico. Geodesy and Geodynamics. 2023, 14, 121–129. [CrossRef]
  52. Lungu, E.; ksendal, B. Optimal harvesting from interacting populations in a stochastic environment. Geodesy and Geodynamics. 2001, 7, 527–539. [CrossRef]
  53. Meng, Q.; Smith, SA.; Rodgers, J. Geospatial Analysis and Mapping of Regional Landslide Susceptibility: A Case Study of Eastern Tennessee, USA. GeoHazards. 2024, 5, 364–373. [CrossRef]

Figure 1. Types of Stakes.
Preprints 109294 g001
Figure 2. Study area Nador, Northern Morocco.
Preprints 109294 g002
Figure 3. Seismic event Nador City from 1901 to 2024.
Preprints 109294 g003
Figure 4. Geomorphological map.
Preprints 109294 g004
Figure 5. Stratigraphical map.
Preprints 109294 g005
Figure 6. Geological map.
Preprints 109294 g006
Figure 7. Topography characteristic in the Nador area.
Preprints 109294 g007
Figure 8. Land cover map of Nador city.
Preprints 109294 g008
Figure 9. Seismic intensity map.
Preprints 109294 g009
Figure 10. Seismic frequency event.
Preprints 109294 g010
Figure 11. Landslides hazards distribution.
Preprints 109294 g011
Figure 12. Building’s vulnerability rate.
Preprints 109294 g012
Figure 13. Vulnerability index for urban build-up area.The provided result about urban vulnerability of Nador paints a concerning picture of a city precariously balanced on the edge of seismic and landslide hazards. Understanding the intricate interplay between Nador’s geographic location, geological makeup, and historical seismic activity is crucial for mitigating these risks and ensuring the safety of its residents.
Preprints 109294 g013
Table 1. Vulnerability indices for buildings typology.
Typology Description min VI, BTM VI-, BTM VI*, BTM VI+, BTM VImax, BTM
M1.1 Rubble stone, fieldstone 0.62 0.81 0.873 0.98 1.02
M1.2 Simple stone 0.46 0.65 0.74 0.83 1.02
M1.3 Massive stone 0.3 0.49 0.616 0.793 0.86
M2 Adobe 0.62 0.687 0.84 0.98 1.02
M3.1 Wooden slabs 0.46 0.65 0.74 0.83 1.02
M3.2 Masonry vaults 0.46 0.65 0.776 0.953 1.02
M3.3 Composite steel and masonry slabs 0.46 0.527 0.704 0.83 1.02
M3.4 Reinforced concrete slabs 0.3 0.49 0.616 0.793 0.86
M4 Reinforced or confined masonry walls 0.14 0.33 0.451 0.633 0.7
M5 Overall strengthened 0.3 0.49 0.694 0.953 1.02
RC1 Concrete Moment Frames -0.02 0.047 0.442 0.8 1.02
RC2 Concrete shear walls -0.02 0.047 0.386 0.67 0.86
RC3.1 Regularly infilled walls -0.02 0.007 0.402 0.76 0.98
RC3.2 Irregular frames 0.06 0.127 0.522 0.88 1.02
RC4 RC Dual systems (RC frame and wall) -0.02 0.047 0.386 0.67 0.86
RC5 Precast Concrete Tilt-Up Walls 0.14 0.207 0.384 0.51 0.7
RC6 Precast C. Frames, C. shear walls 0.3 0.367 0.544 0.67 0.86
S1 Steel Moment Frames -0.02 0.467 0.363 0.64 0.86
S2 Steel braced Frames -0.02 0.467 0.287 0.48 0.7
S3 Steel frame+unreinf. mas. infill walls 0.14 0.33 0.484 0.64 0.86
S4 Steel frame+cast-in-place shear walls -0.02 0.047 0.224 0.35 0.54
S5 Steel and RC composite system -0.02 0.257 0.402 0.72 1.02
W Wood structures 0.14 0.207 0.447 0.64 0.86
Disclaimer/Publisher’s Note: The statements, opinions and data contained in all publications are solely those of the individual author(s) and contributor(s) and not of MDPI and/or the editor(s). MDPI and/or the editor(s) disclaim responsibility for any injury to people or property resulting from any ideas, methods, instructions or products referred to in the content.
Copyright: This open access article is published under a Creative Commons CC BY 4.0 license, which permit the free download, distribution, and reuse, provided that the author and preprint are cited in any reuse.
Prerpints.org logo

Preprints.org is a free preprint server supported by MDPI in Basel, Switzerland.

Subscribe

© 2024 MDPI (Basel, Switzerland) unless otherwise stated